analysis of hot spots in crystalline silicon modules and ... · pdf fileanalysis of hot spots...
TRANSCRIPT
Analysis of Hot Spots in Crystalline Silicon Modules and their Impact on Roof Structures
Daniel W. Cunningham, BP SolarFebruary 17th
2011 The information contained in this presentation is for informational purposes only. BP Solar specifically disclaims any implied or express warranty as to the accuracy or completeness of the information contained in the presentation. No third party may rely on such information.
BP Solar Proprietary
Acknowledgements
−
W. Anderson, G. Kelly, W. Nasse, BP Solar, Germany and USA
−
M. Köhl, D. Philipp; Fraunhofer ISE, Germany
−
A. Roth; VDE Institut, Germany
BP Solar Proprietary
Introduction
•
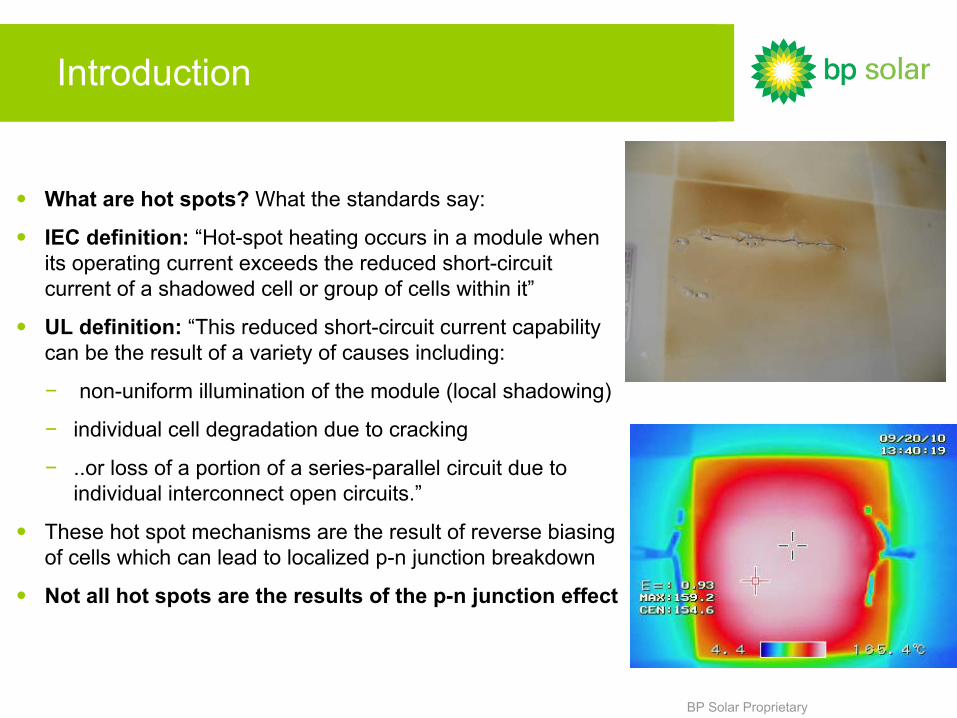
What are hot spots? What the standards say:
•
IEC definition: “Hot-spot heating occurs in a module when its operating current exceeds the reduced short-circuit current of a shadowed cell or group of cells within it”
•
UL definition: “This reduced short-circuit current capability can be the result of a variety of causes including:
−
non-uniform illumination of the module (local shadowing)
−
individual cell degradation due to cracking
−
..or loss of a portion of a series-parallel circuit due to individual interconnect open circuits.”
•
These hot spot mechanisms are the result of reverse biasing of cells which can lead to localized p-n
junction breakdown
•
Not all hot spots are the results of the p-n junction effect
BP Solar Proprietary
Example: By pass diode failure
•
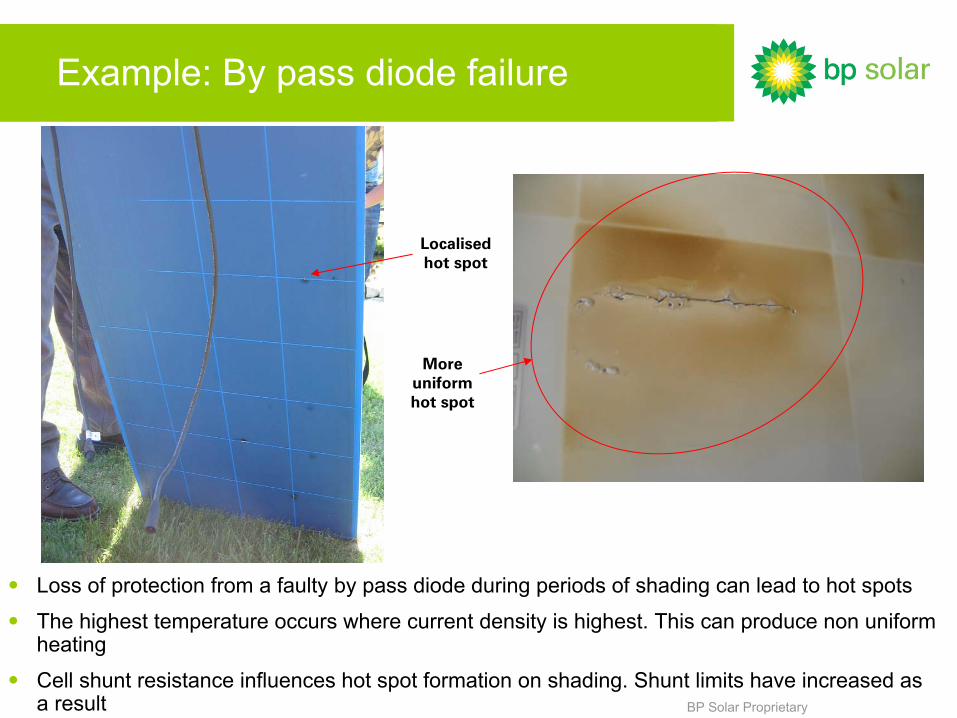
Loss of protection from a faulty by pass diode during periods of
shading can lead to hot spots
•
The highest temperature occurs where current density is highest.
This can produce non uniform heating
•
Cell shunt resistance influences hot spot formation on shading. Shunt limits have increased as a result
Localised
hot spot
More uniform hot spot
BP Solar Proprietary
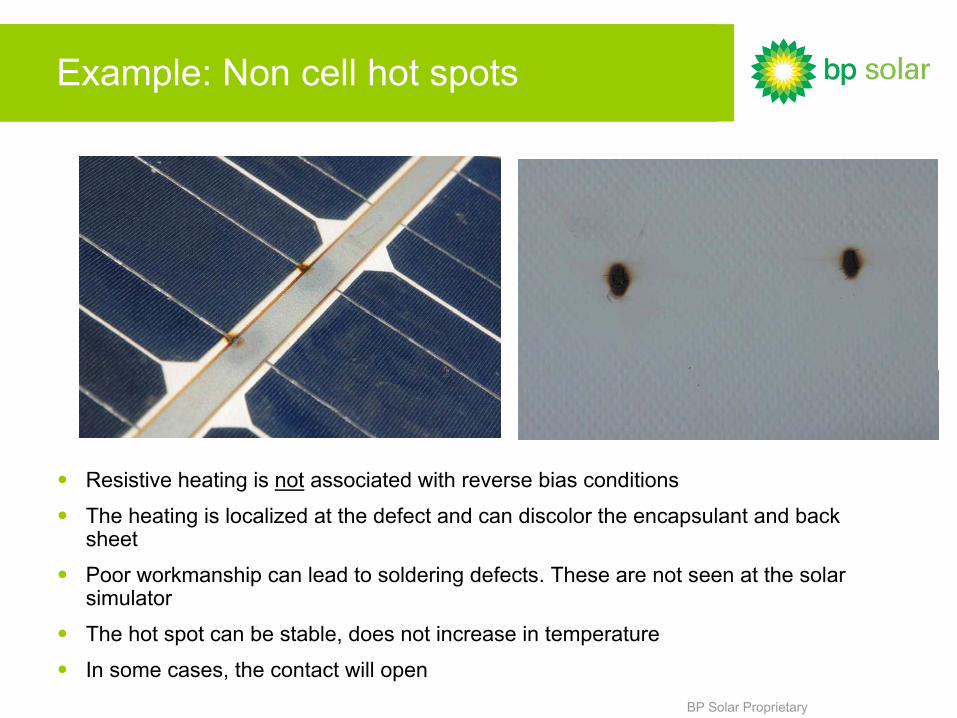
Example: Non cell hot spots
•
Resistive heating is not
associated with reverse bias conditions
•
The heating is localized at the defect and can discolor the encapsulant
and back sheet
•
Poor workmanship can lead to soldering defects. These are not seen at the solar simulator
•
The hot spot can be stable, does not increase in temperature
•
In some cases, the contact will open
BP Solar Proprietary
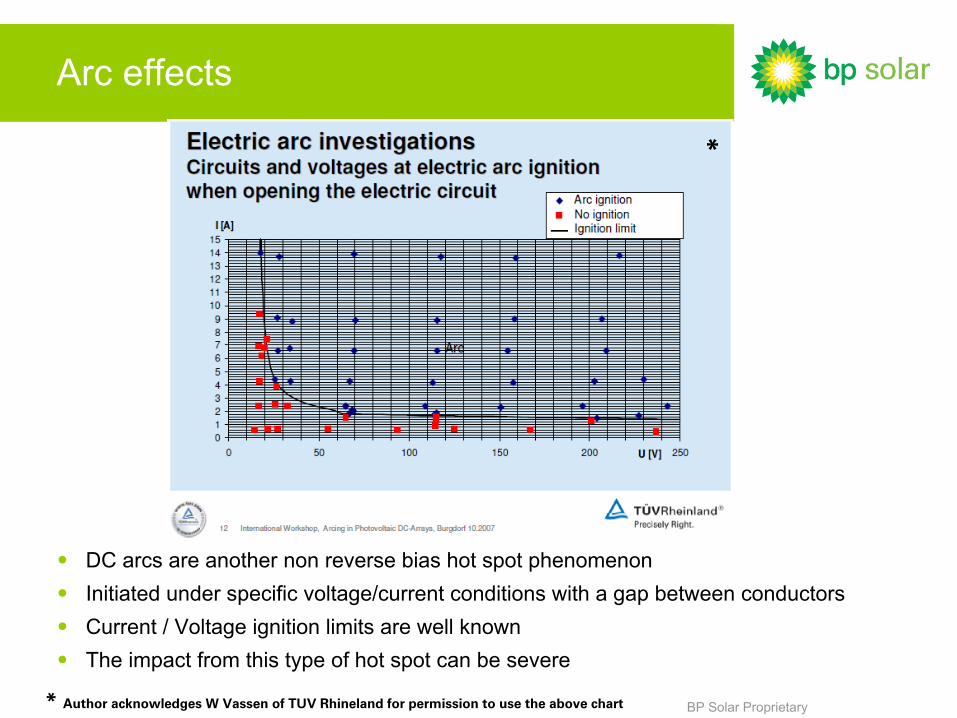
Arc effects
* Author acknowledges W Vassen
of TUV Rhineland for permission to use the above chart
*
•
DC arcs are another non reverse bias hot spot phenomenon•
Initiated under specific voltage/current conditions with a gap between conductors•
Current / Voltage ignition limits are well known•
The impact from this type of hot spot can be severe
BP Solar Proprietary
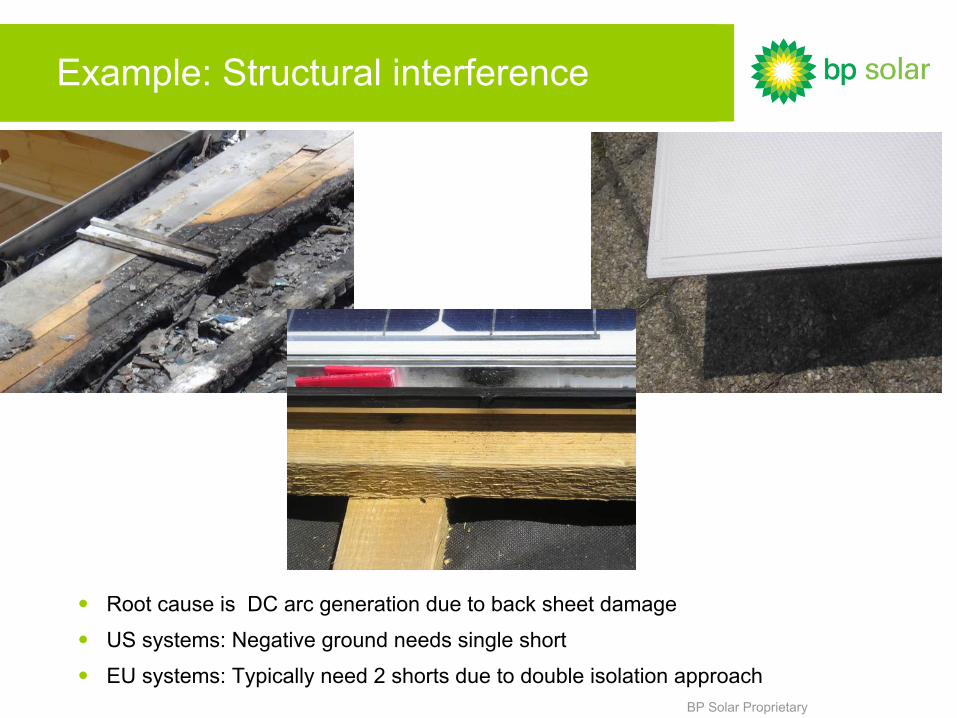
Example: Structural interference
•
Root cause is DC arc generation due to back sheet damage
•
US systems: Negative ground needs single short
•
EU systems: Typically need 2 shorts due to double isolation approach
BP Solar Proprietary
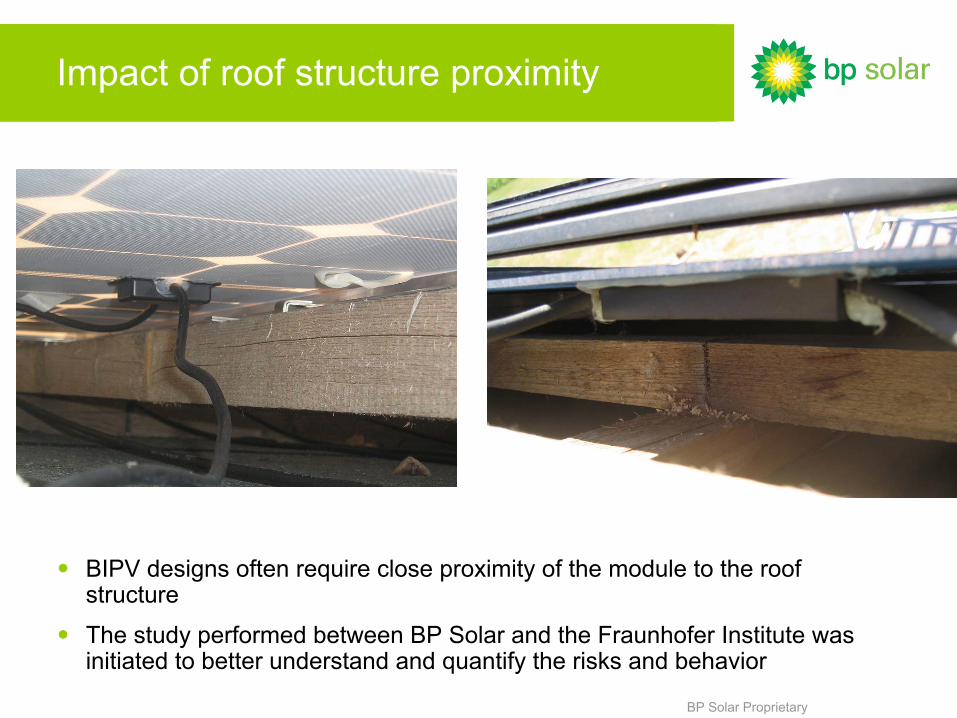
Impact of roof structure proximity
•
BIPV designs often require close proximity of the module to the roof structure
•
The study performed between BP Solar and the Fraunhofer
Institute was initiated to better understand and quantify the risks and behavior
BP Solar Proprietary
2010 F-ISE/BP Solar hot spot study
•
Scope of the study:
−
Perform a statistical evaluation on a sample of modules exhibiting hot spots.
−
Quantify the occurrence and temperature range/severity of hot spots
•
Characterization included
−
Categorise the hot spots into specific root cause; cell contact,
cell mis-
match, cracked cell, etc
−
Determine highest temperature for hot spots
−
Perform electroluminescence and infra-red thermography
−
Effect of thermal cycling & mechanical load on hot spots
−
Heating influence on adjacent/close proximity structures with limited ventilation
−
Evaluate effect of rear side module damage at high voltages
BP Solar Proprietary
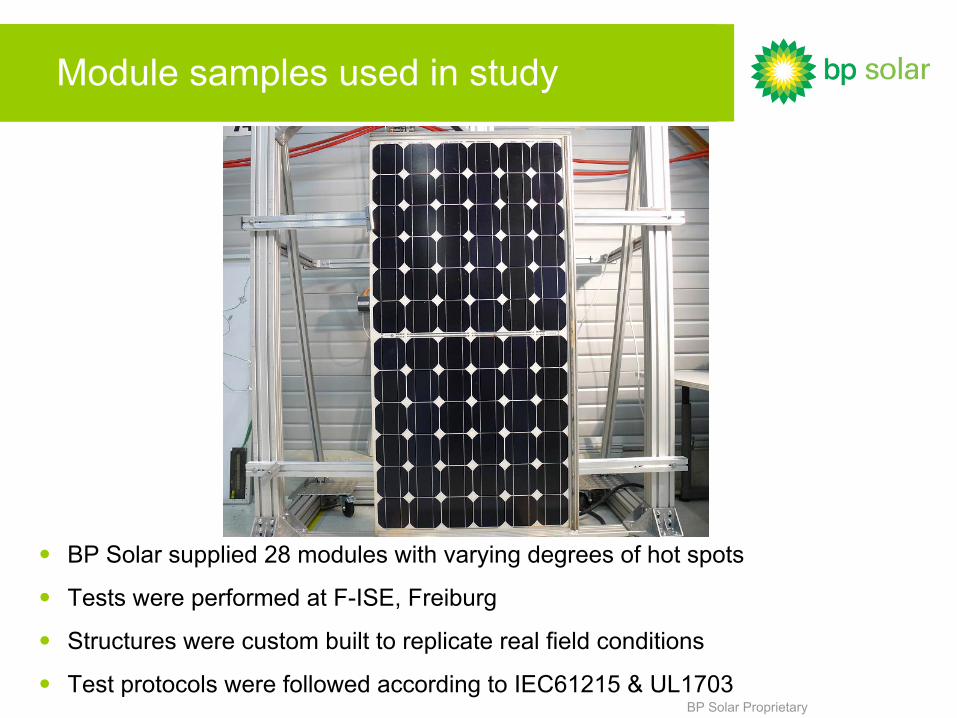
Module samples used in study
•
BP Solar supplied 28 modules with varying degrees of hot spots
•
Tests were performed at F-ISE, Freiburg
•
Structures were custom built to replicate real field conditions
•
Test protocols were followed according to IEC61215 & UL1703
BP Solar Proprietary
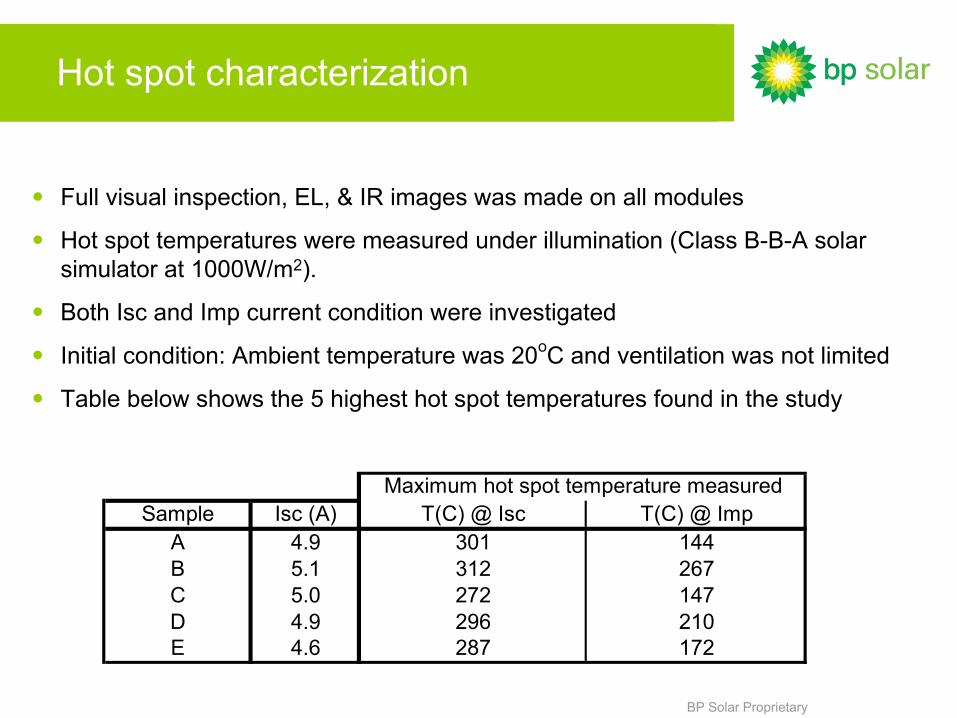
Hot spot characterization
•
Full visual inspection, EL, & IR images was made on all modules
•
Hot spot temperatures were measured under illumination (Class B-B-A solar simulator at 1000W/m2).
•
Both Isc and Imp current condition were investigated
•
Initial condition: Ambient temperature was 20oC and ventilation was not limited
•
Table below shows the 5 highest hot spot temperatures found in the study
Sample Isc (A) T(C) @ Isc T(C) @ ImpA 4.9 301 144B 5.1 312 267C 5.0 272 147D 4.9 296 210E 4.6 287 172
Maximum hot spot temperature measured
BP Solar Proprietary
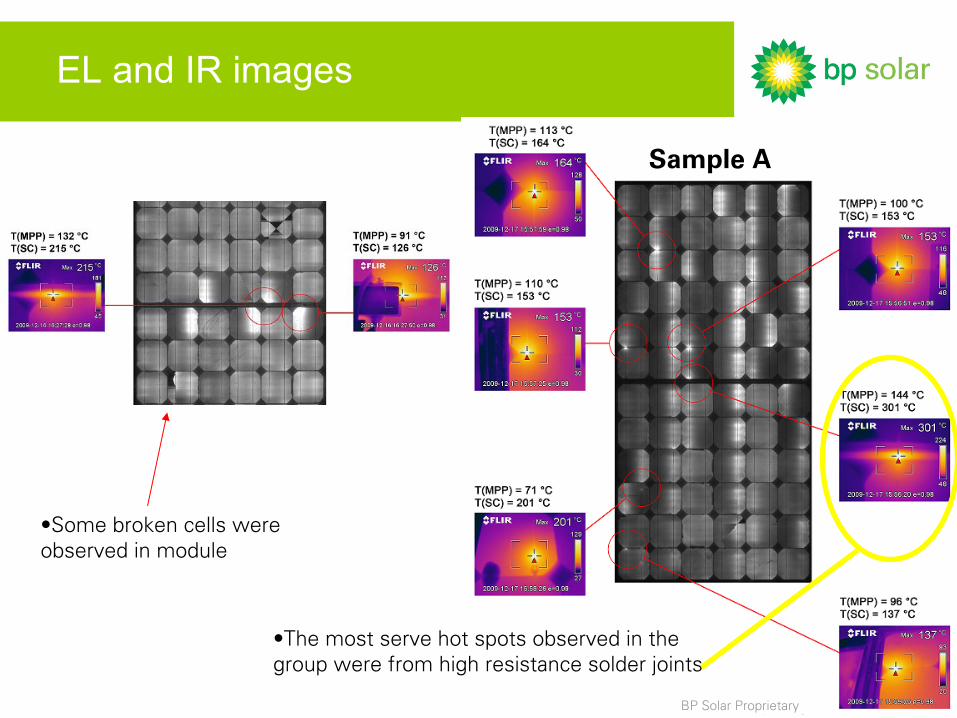
EL and IR images
•Some broken cells were observed in module
Sample A
BP Solar Proprietary
•The most serve hot spots observed in the group were from high resistance solder joints
BP Solar Proprietary
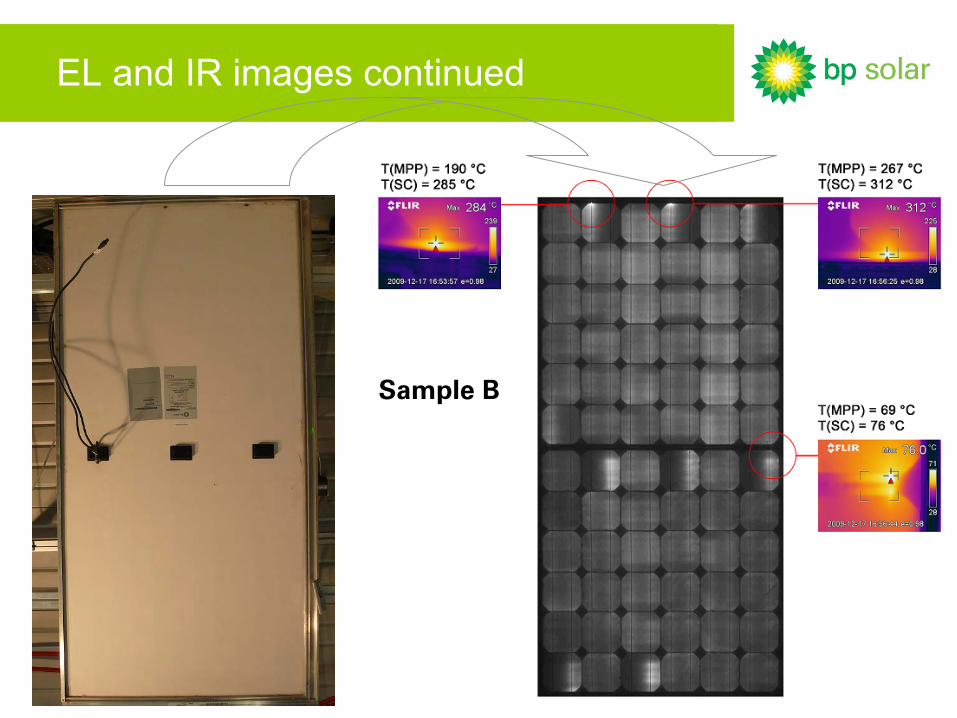
EL and IR images continued
Sample B
BP Solar Proprietary
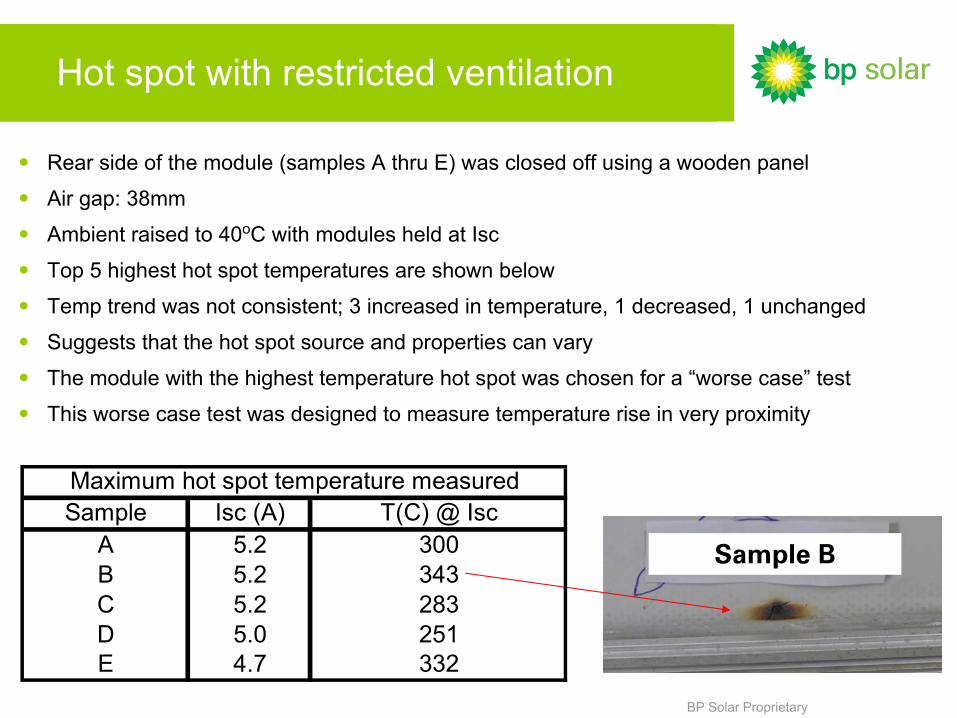
Hot spot with restricted ventilation
•
Rear side of the module (samples A thru E) was closed off using a wooden panel
•
Air gap: 38mm
•
Ambient raised to 40oC with modules held at Isc
•
Top 5 highest hot spot temperatures are shown below
•
Temp trend was not consistent; 3 increased in temperature, 1 decreased, 1 unchanged
•
Suggests that the hot spot source and properties can vary
•
The module with the highest temperature hot spot was chosen for a “worse case”
test
•
This worse case test was designed to measure temperature rise in
very proximity
Sample B
Sample Isc (A) T(C) @ IscA 5.2 300B 5.2 343C 5.2 283D 5.0 251E 4.7 332
Maximum hot spot temperature measured
BP Solar Proprietary
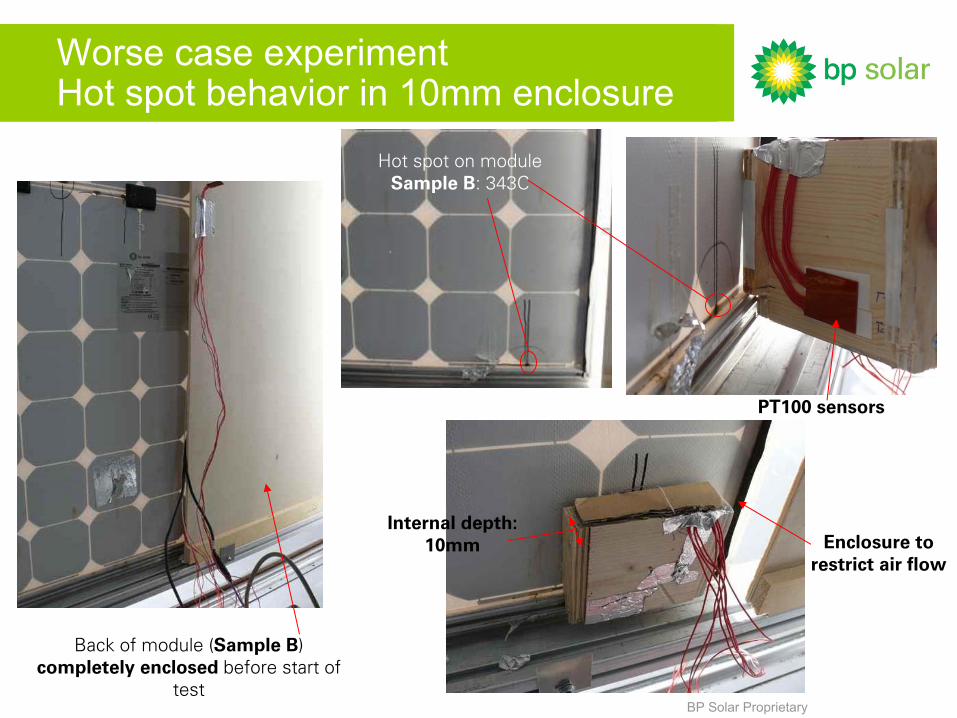
Worse case experiment Hot spot behavior in 10mm enclosure
Hot spot on module Sample B: 343C
PT100 sensors
Enclosure to restrict air flow
Internal depth: 10mm
Back of module (Sample B) completely enclosed
before start of test
BP Solar Proprietary
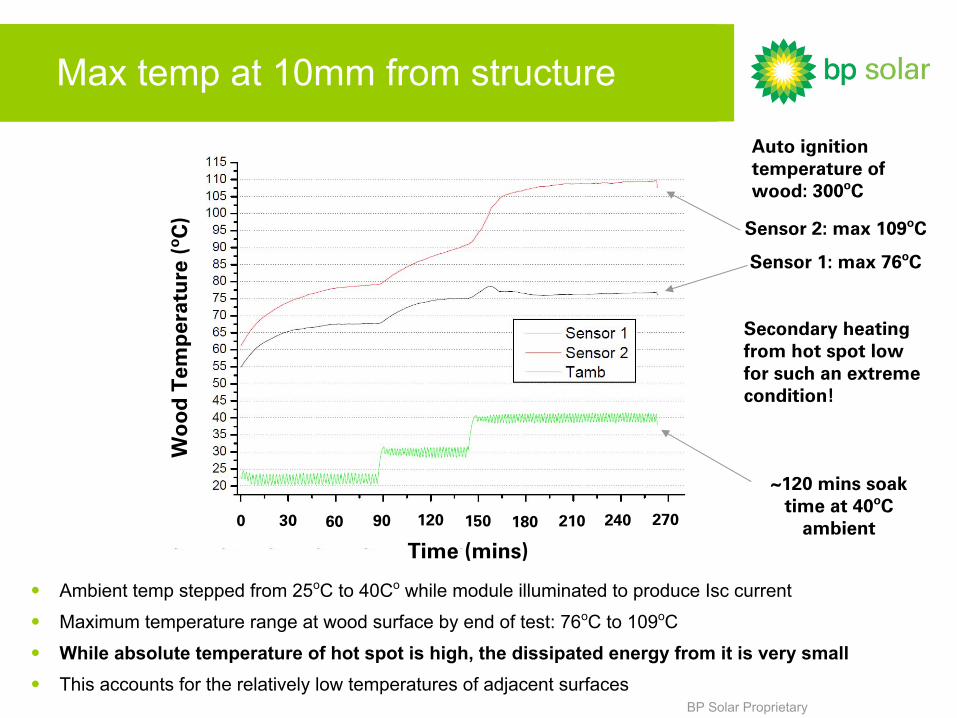
Max temp at 10mm from structure
•
Ambient temp stepped from 25oC to 40Co
while module illuminated to produce Isc current
•
Maximum temperature range at wood surface by end of test: 76oC to 109oC
•
While absolute temperature of hot spot is high, the dissipated energy from it is very small•
This accounts for the relatively low temperatures of adjacent surfaces
~120 mins
soak time at 40oC
ambient
Sensor 2: max 109oC
Sensor 1: max 76oC
Secondary heating from hot spot low for such an extreme condition!
Auto ignition temperature of wood: 300oC
0 30 60 90 120 150 180 210 240 270
Time (mins)
Wo
od
Tem
per
atu
re (
oC
)
BP Solar Proprietary
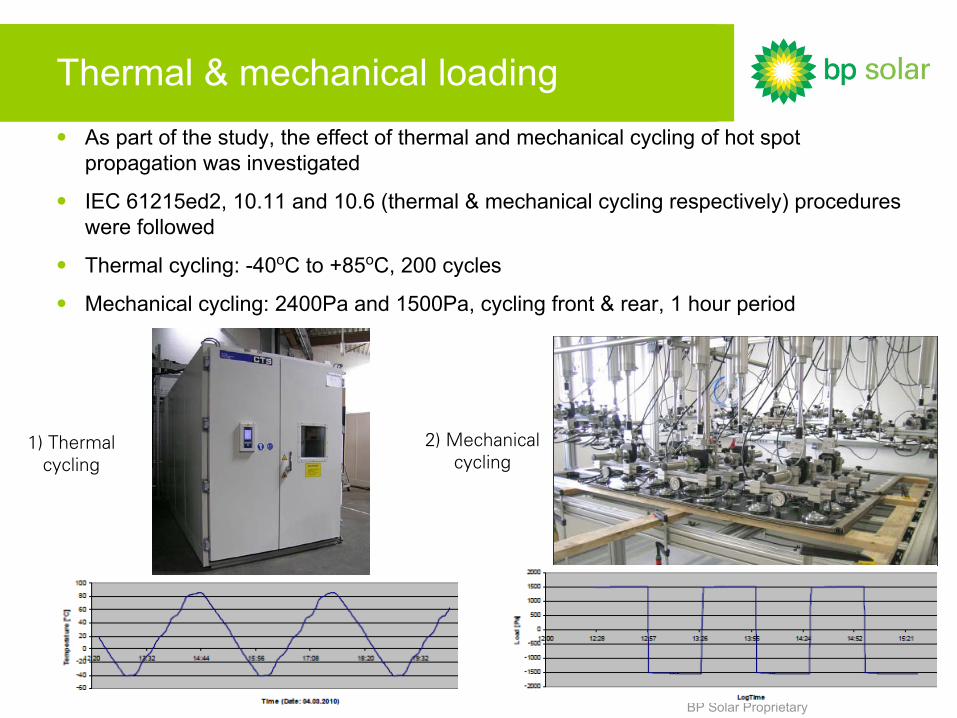
Thermal & mechanical loading•
As part of the study, the effect of thermal and mechanical cycling of hot spot propagation was investigated
•
IEC 61215ed2, 10.11 and 10.6 (thermal & mechanical cycling respectively) procedures were followed
•
Thermal cycling: -40oC to +85oC, 200 cycles
•
Mechanical cycling: 2400Pa and 1500Pa, cycling front & rear, 1 hour period
1) Thermal cycling
2) Mechanical cycling
BP Solar Proprietary
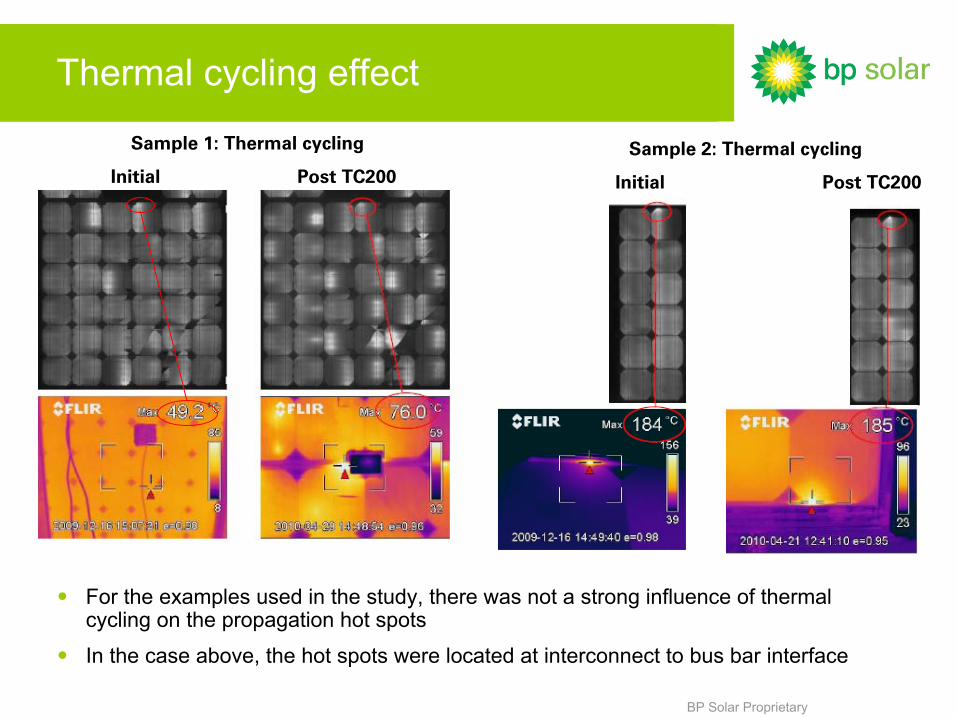
Thermal cycling effect
•
For the examples used in the study, there was not a strong influence of thermal cycling on the propagation hot spots
•
In the case above, the hot spots were located at interconnect to
bus bar interface
Sample 1: Thermal cycling
Initial
Post TC200
Sample 2: Thermal cycling
Initial
Post TC200
BP Solar Proprietary
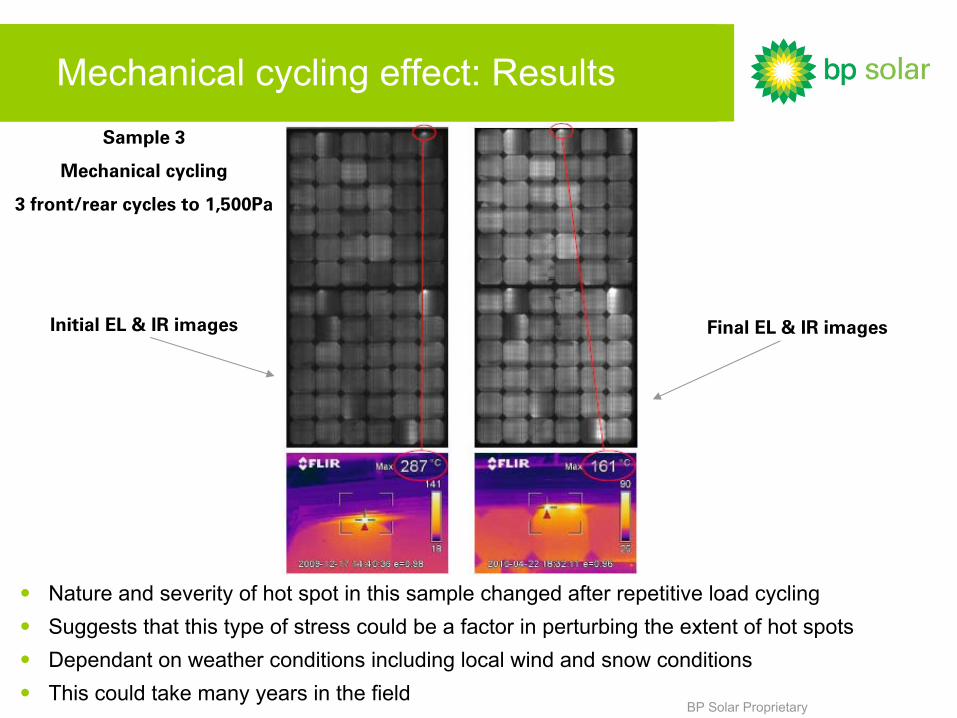
Mechanical cycling effect: Results
•
Nature and severity of hot spot in this sample changed after repetitive load cycling•
Suggests that this type of stress could be a factor in perturbing the extent of hot spots•
Dependant on weather conditions including local wind and snow conditions•
This could take many years in the field
Sample 3
Mechanical cycling
3 front/rear cycles to 1,500Pa
Initial EL & IR images Final EL & IR images
BP Solar Proprietary
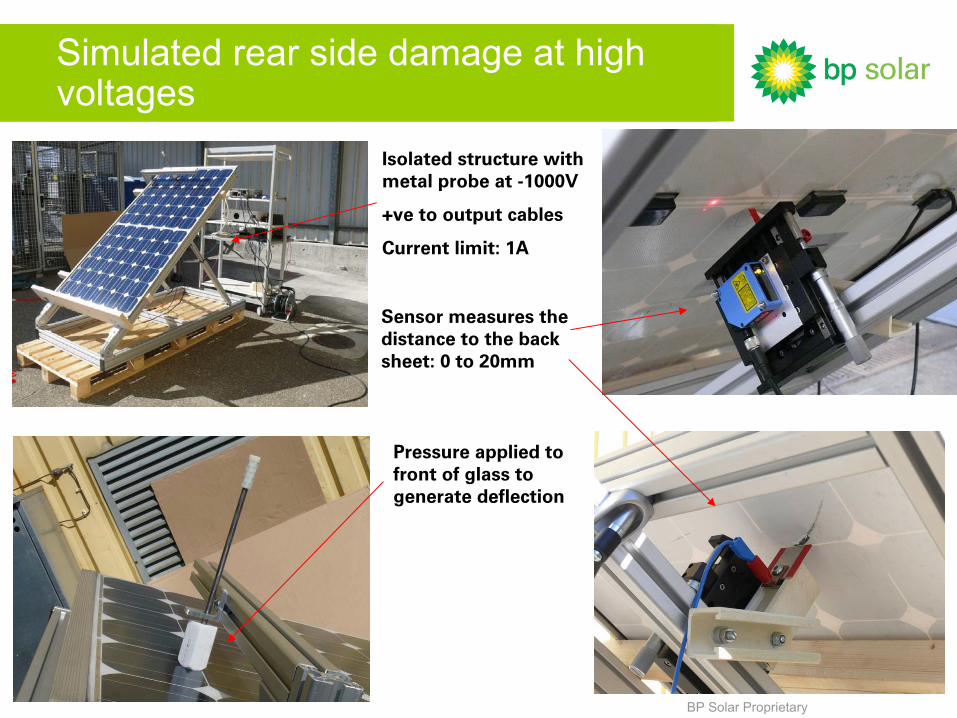
Simulated rear side damage at high voltages
Isolated structure with metal probe at -1000V
+ve
to output cables
Current limit: 1A
Sensor measures the distance to the back sheet: 0 to 20mm
Pressure applied to front of glass to generate deflection
BP Solar Proprietary
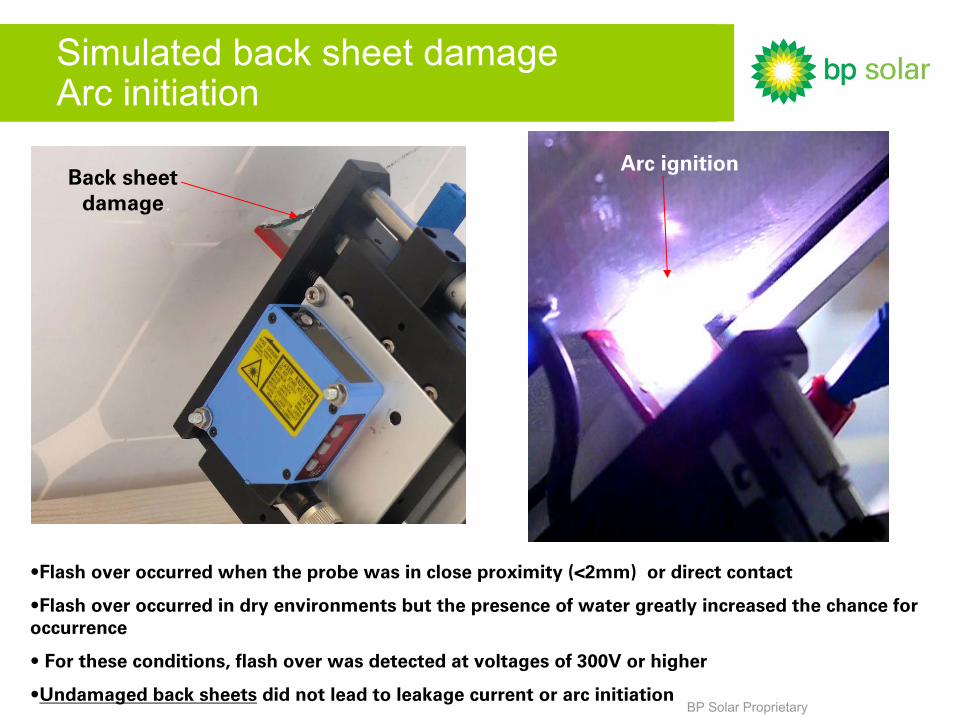
Simulated back sheet damage Arc initiation
•Flash over occurred when the probe was in close proximity (<2mm)
or direct contact
•Flash over occurred in dry environments but the presence of water greatly increased the chance for occurrence
• For these conditions, flash over was detected at voltages of 300V or higher
•Undamaged back sheets
did not lead to leakage current or arc initiation
Back sheet damage
Arc ignition
BP Solar Proprietary
Summary
•
Many different failure modes can create a hot spots not just p-n
junction effects from shading
•
A study between BP Solar, Fraunhofer
Institute, and VDE examined 28 modules with examples of hot spots
•
Broken cells were present but the most common root cause was resistive heating due to defective solder joints
•
Maximum temperature measured was 343oC, however the heating effect on the adjacent wooden structure was low
•
This is due to the small physical size of the hot spot and low energy dissipation
•
Stress testing showed a greater effect from mechanical cycling compared to thermal cycling
•
However, this did not significantly increase the hot spot temperature
•
By far the biggest risk for secondary damage from hot spots is if their source is a DC arc
•
This was demonstrated by simulated back sheet damage at high voltage