analysis of illegal wildlife shipments from latin … · to be tt er unders tand wildlife...
TRANSCRIPT

Seized Wildlife ShipmentsIn the 10-year span analyzed, FWS seized 10,082 wildlife shipments. This included 10,966 live animals and over 70,000 pounds of wildlife and wildlife products, 7,364 eggs among them. The annual average number of wildlife seizures was 914. Looking at seized shipments by year (Figure 1), 2011 had the highest number with a total of 1,380 cases seized.
Live TradeFWS seized a total of 10,996 live animals within the 10-year period. Breaking down these seizures by year (Figure 2), 2013 was the year with the most live ani-mals seized (4,051). A single shipment seized in Miami included 1,328 live red belly toads from Paraguay and
ANALYSIS OF ILLEGAL WILDLIFE SHIPMENTS FROM LATIN AMERICA SEIZED IN THE UNITED STATES, 2007–2017
TO BETTER UNDERSTAND wildlife trafficking from Latin America (Mexico, the Caribbean, Central America and South America) to the United States, Defenders of Wildlife reviewed 10 years of data on seizures of wildlife and wildlife parts and products from the Law Enforcement Management Information System (LEMIS) Trade Database managed by the U.S. Fish and Wildlife Service (FWS). In the 10-year period reviewed (April 2007 through May 2017), FWS seized a total of 10,082 wildlife shipments, and 2011 was the year with the most seizures (1,380). The seized shipments included 10,966 live animals and over 70,000 pounds of wildlife products. Most of this trade (87 percent) was sourced from wild populations and declared imported for personal use. The top U.S. ports for wildlife seizures were El Paso, Texas, and Miami, Florida, accounting for 56 percent of all shipments seized. Mexico was the top exporter with a total of 5,776 seized shipments—57 percent of all exports—originating there. This illegal trade is yet another threat to the wildlife of Latin America, the most biologically diverse region in the world. The neotropical index, a measure of the state of the region’s biodiversity, shows a dramatic 83 percent decline in wildlife populations since 1970.1
accounted for 32.7 percent of live seizures in 2013—more than in any year except 2009 when a single shipment of 966 live tarantulas from Guatemala accounted for 44.8 percent of the total number of live animals seized (2,154).
The data on U.S. seizures of shipments containing live animals, which does not account for the quantity of
Figure 1. Number of Seized Cases by Year
2007 2008 2009 2010 2011 2012 2013 2014 2015 2016 2017
888724 659
907
1,380 1,279 1,2371,091
868743
288
YEAR
Figure 2. Number of Live Animals Seized by Year
2015 2016 20172007 2008 2009 2010 2011 2012 2013 2014
568 401
2,154
191782
62
4,051
667 943412 735
YEAR
FACTSHEET
RED
BELL
Y TO
AD ©
S. R
IOS/
PYBI
O.OR
G
1 Living Planet Report 2014, http://assets.worldwildlife.org/publica-tions/723/files/original/WWF-LPR2014-low_res.pdf?1413912230&_ga=2.117227398.1478974227.1548449323-1512090897.1548449323
Countries of ExportMexico tops the list of the largest exporters of wildlife and wildlife products to the United States (Table 1) by far, accounting for 57 percent of all shipments. But because Mexico serves as a hub between the United States and South America, many of the shipments that come from Mexico do not originate there. The top two coun-tries of export, Mexico and Haiti, account for 68 percent of all wildlife shipments. Nonetheless, Mexico’s numbers exceed those of any other Latin American country, with a difference of 46 percent between Mexico and Haiti and an even greater difference between Mexico and the other high-ranked countries of export.
U.S. Ports of EntryEl Paso, Texas, is number one among the top five U.S. ports of entry for illegal wildlife traffickers by total number and percentage of total shipments (Table 2). El Paso accounts for 32 percent of all wildlife seizures in the Unites States, most of which come from Mexico. Miami is number two with 24 percent of total seizures. Miami tends to be the primary port for shipments coming from the Bahamas and other Caribbean islands. Two of the top-five ports of entry, El Paso and San Diego/San Ysidro, are on U.S.-Mexico land borders.
animals in those shipments, also shows 2013 was the year with the most seizures (62) (Figure 3).
Frogs and toads were the live species most trafficked from Latin America to the United States (Figure 4) with a total of 2,961 individual animals seized, most of them from Paraguay. The illegal trade in frogs and toads exported to the United States is more than double that of the second most trafficked live species, tarantulas, most of which come from Guatemala (966) and Chile (70).
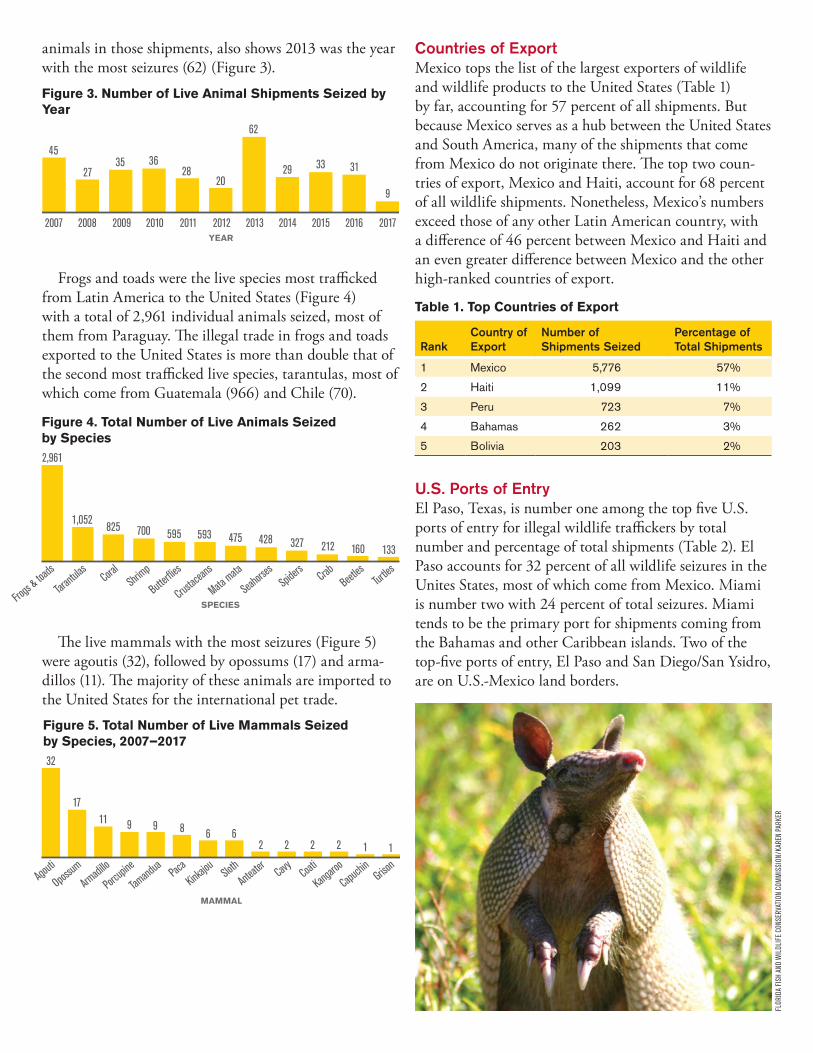
The live mammals with the most seizures (Figure 5) were agoutis (32), followed by opossums (17) and arma-dillos (11). The majority of these animals are imported to the United States for the international pet trade.
Table 1. Top Countries of Export
RankCountry of Export
Number of Shipments Seized
Percentage of Total Shipments
1 Mexico 5,776 57%
2 Haiti 1,099 11%
3 Peru 723 7%
4 Bahamas 262 3%
5 Bolivia 203 2%
Figure 4. Total Number of Live Animals Seized by Species
Frogs &
toads
Tarantu
las Coral
Shrimp
Butterflie
s
Crustace
ans
Mata mata
Seahor
sesSpid
ers CrabBeetl
esTurt
les
2,961
1,052 825 700 595 593 475 428 327 212 160 133
SPECIES
Figure 5. Total Number of Live Mammals Seized by Species, 2007–2017
Agouti
Opossum
Armadil
lo
Porcup
ine
Tamand
uaKinka
jouPaca
Sloth
Anteate
rCavy Coati
Kangaro
o
Capuchin Griso
n
32
1711 9 9 8 6 6
2 2 2 2 1 1
MAMMAL
Figure 3. Number of Live Animal Shipments Seized by Year
2015 2016 20172007 2008 2009 2010 2011 2012 2013 2014
45
2735 36
2820
62
29 33 31
9
YEAR
FLOR
IDA
FISH
AND
WIL
DLIF
E CO
NSER
VATI
ON C
OMM
ISSI
ON/K
AREN
PAR
KER

Shipments by GeneraThe genus with the highest number of shipments seized (Table 3) was Strombus, which includes medium to large sea snails, plus mollusks and conches often used for meat products or souvenirs. FWS seized 1,507 Strombus shipments, 15 percent of total shipment seizures. In demand for use for traditional medicine in oil and pow-der form, Crotalus, the genus for rattlesnakes, is the second most trafficked genus. The other genera in the top five account for only 9 percent of total shipments.
Shipments by ClassTable 4 breaks down seized wildlife shipments by class. Reptiles are the most seized class, and the reptile products most commonly seized in the United States are meat, eggs and skin pieces. The most trafficked live reptiles are turtles and tortoises. The top three classes in seized shipments, reptiles, mollusks and mammals, represent 65 percent of total shipment seizures.
Shipments by Volume and QuantityTable 5 shows the total volume in pounds of all wildlife parts and products seized each year. 2015 was the year with the highest volume, 27,225 pounds, which accounts for 38 percent of the total volume in the 2007–2017 period analyzed. The average annual volume was 6,473 pounds, about four times less than in 2015 alone.
Figure 7 shows the type and volume/quantity of wildlife products seized. Table 6 (next page) breaks down wildlife shipment seizures between 2007 and 2017 by class and quantity.
Table 3. Top Seized Shipments by Genera
Rank GeneraNumber of Shipments
Percentage of Total Shipments
1 Strombus 1,507 15%
2 Crotalus 735 7%
3 Iguana 460 5%
4 Cheloniidae 405 4%
5 Crocodylus 387 <1%
Table 4. Top Seized Shipments by Class
Rank ClassNumber of Shipments
Percentage of Total Shipments
1 Reptiles 3,256 32%
2 Mollusks 1,870 19%
3 Mammals 1,373 14%
4 Birds 944 9%
5 Fishes 592 6%
Table 2. Top U.S. Ports of Entry
Rank U.S. Port of EntryNumber of Shipments
Percentage of Total Shipments
1 El Paso, TX 3,234 32%
2 Miami, FL 2,431 24%
3 San Diego/San Ysidro, CA 836 8%
4 Houston, TX 726 7%
5 Louisville, KY 437 4%
Table 5. Volume by Year
Year Pounds
2007 1,380
2008 1,732
2009 1,810
2010 21,405
2011 7,911
2012 1,239
2013 2,879
2014 2,969
2015 27,225
2016 2,041
2017 623
Figure 7. Product Type by Volume and Quantity
FINS16 pounds of shark fins
MEAT58,061 pounds
DEAD ANIMALS813 specimens
ANIMAL BONES837 bones
SHELLS14,993 specimens
FEATHERS6,459 feathers
© A
LEJA
NDRO
VEG
A-ZE
PEDA

For more information please contact Alejandra Goyenechea: [email protected].
For a full report on combating wildlife trafficking from Latin America to the United States, more fact sheets and updates on the illegal wildlife trade, visit www.defenders.org/combating-wildlife-trafficking
03/19
Table 6. Wildlife Products Seized by Class and Quantity
Mammals2,802 pounds of mammal meat1,379 mammal specimens616 mammal horns388 mammal skin pieces318 mammal hair samples
Reptiles21,977 pounds of reptile meat6,775 reptile eggs and egg parts4,460 reptile skin pieces3,871 small leather products3,581 reptile medicinal parts and products
Birds5,204 bird feathers 1,280 pounds of bird meat984 bird products657 bird specimens506 bird eggs
© TO
M CO
HEN
© B
OB S
HIPB
AUGH
© A
DAM
VICT
ORIN
O