analysis of intra-industry trade in agri-food …
TRANSCRIPT

53
Snježana Brkić, Radovan Kastratović, Mirela Abidović Salkica
Abstract
Although research of intra-industry trade (IIT) has been intensive in the last several decades, the empirical lit-erature focusing on this phenomenon in the Western Balkans countries remains limited, especially in agricul-tural sector. Aiming to contribute to the existing literature, the paper analyses patterns and country-specific determinants of IIT in agri-food products between Bosnia and Herzegovina (BiH) and the European Union (EU) during the period of their mutual trade liberalisation (2008-2018). The analysis employs Grubel-Lloyd indices and Greenaway-Hine-Milner methodology for measurement of IIT, and applies an econometric panel data model using a Poisson Pseudo-maximum likelihood approach in order to estimate effects of IIT determi-nants. The findings suggest that intra-industry agri-food trade of BiH with the EU is of low intensity and main-ly of vertical nature, viewed totally and bilaterally. We found significant positive effects of trading countries’ sizes, common border and history on IIT, and negative effects of the geographic distance and differences in agricultural productivity.
Keywords: Intra-industry trade (IIT), agri-food prod-ucts, Bosnia and Herzegovina (BiH), the European Union (EU), Poisson Pseudo-maximum likelihood (PPML) approach
JEL classification: F14; Q17; O52.
1. Introduction
For decades, intra-industry trade (IIT) as a phenom-enon mostly related to product differentiation, scale economy and imperfect competition, has been a sub-ject of intensive research on the example of industrial products and developed countries. At the same time, IIT in agricultural sector has been neglected, due to different characteristics of the products and markets compared to industrial sector, such as resource inten-sity, low product differentiation and assumption of
Snježana Brkić, PhD (corresponding author)Associate ProfessorSchool of Economics and Business University of SarajevoE-mail: [email protected]: Trg oslobođenja – Alija Izetbegović 171 000 Sarajevo Bosnia and HerzegovinaORCID: https://orcid.org/0000-0003-1004-9855
Radovan Kastratović, PhDTeaching AssistantUniversity of Belgrade Faculty of Economics Belgrade, Republic of SerbiaE-mail: [email protected]: https://orcid.org/0000-0002-6138-906X
Mirela Abidović Salkica, MScSenior AssistantFaculty for Technical Studies University of TravnikTravnik, Bosnia and HerzegovinaE-mail: [email protected]: https://orcid.org/0000-0002-5325-5600
South East European Journal of Economics and BusinessVolume 16 (2) 2021, 53-67
DOI: 10.2478/jeb-2021-0014
Copyright © 2021 by the School of Economics and Business Sarajevo
ANALYSIS OF INTRA-INDUSTRY TRADE IN AGRI-FOOD PRODUCTS BETWEEN BOSNIA AND HERZEGOVINA
AND THE EUROPEAN UNION

ANALYSIS OF INTRA-INDUSTRY TRADE IN AGRI-FOOD PRODUCTS BETWEEN BOSNIA AND HERZEGOVINA AND THE EUROPEAN UNION
54 SOUTH EAST EUROPEAN JOURNAL OF ECONOMICS AND BUSINESS, VOLUME 16 (2) 2021
perfect competition. IIT in agricultural products is still insufficiently researched, particularly for developing countries.
In order to fill a gap in the empirical literature on IIT in agri-food sector of less advanced countries, es-pecially transition countries of the Western Balkans (WB)1, the paper focuses on the analysis of intra-indus-try agri-food trade of Bosnia and Herzegovina (BiH). Of all the WB countries, BiH has the total IIT the largest body of research. There is however the single study of IIT in agri-food sector of BiH, which was conducted by Mrdalj et al. (2017), but without modelling of IIT de-termination. The research was based on the K-means cluster analysis, aiming at identifying different clusters of agri-food product groups related to comparative advantages, IIT level and the ratio between unit values of exports and imports.
Our study covers the country’s IIT with the European Union (EU) in the agri-food sector for the period 2008-2018 which is characterised by the mu-tual trade liberalisation within the framework of the Stabilisation and Association Agreement (SAA). The WB countries mostly have the EU candidate status, ex-cept BiH which still is only a potential candidate coun-try and very slow on its path to the EU membership. It was expected that the institutionalisation of trade relations between BiH and the EU would result in the growth of the overall trade and IIT in many sectors, including the agri-food one, and would change IIT structure as well. This research provides a more com-prehensive insight into the characteristics (intensity, trend and composition) of the agri-food IIT of BiH with the EU, and possible changes. The paper also aims at identification and evaluation of country-specific IIT determinants by estimating an empirical model us-ing a Poisson Pseudo-maximum likelihood method (PPML).
The paper is structured as follows: The next sec-tion provides a short theoretical framework for the analysis of IIT characteristics and econometric analy-sis. The third section describes the used methodology and data. Research findings on the basic patterns of IIT of BiH with the EU in agri-food sector and country-specific IIT determinants are presented and discussed in the fourth section. The last part contains conclud-ing remarks, including policy implications.
2. Conceptual framework
Our research is based on the hypothesis that the pattern and determinants of IIT of BiH in agri-food products are consistent with theoretical assumptions and up-to-date empirical findings on IIT of transition
and less developed countries when trading with more developed countries. In that case, the trade pattern of less developed countries is dominantly inter-industry, for both industrial and agri-food products, while IIT is mostly of the vertical type2.
If we observe characteristics of the countries with which a given country trades, those characteristics will allow us to predict some features of its trade pattern. According to traditional trade theories, it is likely that inter-industry trade (international trade in products of different industries, based on differences in com-parative advantages) will prevail in relations between countries at different levels of economic develop-ment. By contrast, an intensive intra-industry trade i.e. international trade in products belonging to the same sector/industry, is expected to occur between similar countries (Krugman and Obstfeld 2009), and especial-ly in the form of a prominent horizontal IIT.
Namely, the structure of IIT is composed of two components – the horizontal component and the vertical one, which differ from each other in terms of types of product differentiation. Although IIT in homogenous products can emerge as well (due to seasonal variations, border trade, etc.), the phenom-enon is primarily related to more differentiated prod-ucts. Horizontal differentiation is based on the actual or perceived differences in products’ characteristics which do not result in the systematic variation in pric-es. Vertical differentiation implies varieties of different levels of quality and, consequently, of different prices.
There are two different approaches to modelling horizontal differentiation. The love-for-varieties mod-el, which was developed by Dixit and Stiglitz (1977), is based on the assumption that consumers will use as many varieties of the same product as possible if they are available. Lancaster (1980) however developed the core-attributes model, which starts from the as-sumption that each consumer prefers one variety with a special combination of characteristics. The theo-retical basis of horizontal IIT (HIIT) was further devel-oped by Krugman (1980), Helpman (1981), Helpman and Krugman (1985), etc. Vertical IIT (VIIT) models, as developed by Falvey (1981), Falvey and Kierzkowski (1985), and others, include the redefined traditional concept of comparative advantages as explanation of IIT, starting from the assumption that differences in the product quality result from the differences in production processes i.e. in factor endowment and technology.
The intensity of total IIT and its components is driven by different factors, both country-specific and industry-specific ones. With respect to IIT determi-nants, our analysis starts from the hypothesis that country-specific determinants, such as economic size,
ANALYSIS OF INTRA-INDUSTRY TRADE IN AGRI-FOOD PRODUCTS BETWEEN BOSNIA AND HERZEGOVINA AND THE EUROPEAN UNION
55SOUTH EAST EUROPEAN JOURNAL OF ECONOMICS AND BUSINESS, VOLUME 16 (2) 2021
difference in the level of development, geographic distance, trade intensity, foreign direct investment, common past etc., influence IIT in agri-food products the same way as in the case of industrial products. It means that determinants which relates to any kind of proximity (economic, geographic etc.) of trading countries have a positive effect on their mutual IIT, while differences between trading countries have a negative effect.
We hypothesised a significant and positive effect of trading countries’ economic size, measured by their gross domestic products (GDP). Reasons can be found on both the demand and the supply side. According to Lancaster (1980), greater average size of two coun-tries’ markets will result in the greater import demand for differentiated products, and more prominent IIT. Krugman (1980) argues that a larger market creates a greater possibility for achieving economy of scale, which in turn leads to greater IIT. A positive impact of economic size on IIT was confirmed by research in agri-food sector as well, such as in Jing, Leitão, and Faustino (2010), Jámbor (2013), Bojnec and Fertő (2016), etc.
Difference in the level of economic development, mostly expressed as difference in income distribution, as an IIT determinant is rooted both in the theories of increasing returns and in the H-O theory. On the demand side, differences in incomes per capita (p/c) reflect differences in the structure of demand (Linder 1961, Lancaster 1980), while, on the supply side, they represent differences in factor endowment (Helpman 1981). The negative effect of the difference in incomes p/c on the IIT was established in a number of stud-ies, and, on the example of the agri-food products, in research by Jing, Leitão and Faustino (2010), Leitão (2011), etc. The effect of the difference in incomes p/c depends on the type of IIT, e.g. the difference typically has a positive effect on VIIT.
In a similar way, Jámbor (2015) established the negative effect of difference in productivity of trad-ing countries on their mutual IIT in agri-food products. However, the effect of difference in productivity could vary depending on IIT type. Intensive VIIT occurs more frequently among countries that are different in terms of productivity.
Difference in other economic performances such as success in attracting foreign direct investment (FDI) also affects IIT. However, in general, FDI effect on IIT can be ambivalent. Some studies in agri-food sector such as those by Jámbor (2015), and Jámbor, Bologh and Kucsera (2016) determined a negative impact of FDI inflow on IIT, while Leitão (2011) found a positive effect. Ambroziak (2012) and Jámbor (2013) found that FDI can increase both HIIT and VIIT. Kandogan
(2003) believes that FDI is a determinant which pri-marily and positively affects VIIT, which was confirmed for the agri-food sector in the research by Jámbor and Leitão (2016).
Almost every model of bilateral trade, whether it is the total trade or one of its components such as IIT, takes into account the geographic distance. The dis-tance indirectly “measures” the effects of transport, transaction and information costs on trade. Balassa (1986) established that all types of trade decrease with increasing geographic distance, and it particu-larly applies to IIT. The negative effect of geographic distance on the IIT share in agri-food products was also pointed out by Jing, Leitão, and Faustino (2010), Jámbor (2015), Balogh and Leitão (2019), etc. On the other hand, geographically close, especially adjacent countries typically have similar economic, cultural and other characteristics. In economic terms, it pertains to the similarity of the product structure and the de-mand structure between them (Venables, Rice, and Stewart 2003). Therefore, as opposed to the deter-minant “geographic distance“, it is expected that the determinant “common border“ has a significant and positive impact on IIT.
Trade intensity is taken as the approximation of the geographic trade orientation, indicating how im-portant a trading partner is to the observed country. The positive effect of trade intensity on IIT in agri-food products was established in papers by Fidrmuc (2004) and Łapinska (2014).
Historical and political factors such as colonial his-tory or a common state in the past are significant for trade ties in general, and for IIT in particular. Countries with a common past usually share some economic, political and cultural characteristics that could inten-sify IIT between them. Effects of political and histori-cal factors on the example of intra-regional trade in the South East Europe were investigated by Trivić and Klimczak (2015).
3. Applied methodology3.1. Measurement of IITMeasurement of IIT mostly refers to calculating the IIT share or intensity in a given industry trade or trade of all industries of a country, using Grubel-Loyd indices. Standard Grubel-Lloyd index (Grubel and Lloyd 1975) is calculated as follows:
𝐺𝐺𝐺𝐺�� � �𝑋𝑋�� � 𝐶𝐶��� � �𝑋𝑋�� � 𝐶𝐶���𝑋𝑋�� � 𝐶𝐶��
� � 𝐺𝐺𝐺𝐺� � � (1)
𝐺𝐺𝐺𝐺 � � 𝐺𝐺𝐺𝐺���
���𝑤𝑤��
� � 𝐺𝐺𝐺𝐺 � � (2)
𝑤𝑤�� � ���������∑ �������������
(3)
𝑅𝑅𝑅𝑅𝑅𝑅�� � �����
����� (4)
� � � � 𝑅𝑅𝑅𝑅���
𝑅𝑅𝑅𝑅��� � � � � � ���� � 𝑅𝑅𝑅𝑅���
𝑅𝑅𝑅𝑅��� � ����
��� � � ���� (5)
𝑅𝑅𝑉𝑉𝑉𝑉𝑉𝑉� : 𝑅𝑅𝑅𝑅���
𝑅𝑅𝑅𝑅��� � � � � � 𝑅𝑅𝑅𝑅���
𝑅𝑅𝑅𝑅��� � ����
��� � � ���� (6)
𝑅𝑅𝑉𝑉𝑉𝑉𝑉𝑉� : 𝑅𝑅𝑅𝑅���
𝑅𝑅𝑅𝑅��� � � � � � 𝑅𝑅𝑅𝑅���
𝑅𝑅𝑅𝑅��� � ����
��� � � ���� ���
𝑉𝑉𝑉𝑉𝑉𝑉���� � ∑ �𝑋𝑋��
��� � 𝐶𝐶������ � ∑ �𝑋𝑋��
��� � 𝐶𝐶��������������
∑ �𝑋𝑋�� � 𝐶𝐶�������
� � 𝑉𝑉𝑉𝑉𝑉𝑉���� � � ���
𝑉𝑉𝑉𝑉𝑉𝑉�� � ��𝐷𝐷𝑉𝑉�𝐵𝐵����∆�𝐷𝐷𝐺𝐺𝐷𝐷𝐷𝐷����𝐷𝐷𝑉𝑉𝐷𝐷𝑉𝑉�
��
∆�𝑉𝑉𝑉𝑉����𝐷𝐷𝐷𝐷𝑅𝑅𝐷𝐷𝐷𝐷��
��∆�𝐷𝐷𝐷𝐷𝐷𝐷𝑉𝑉����
������𝐵𝐵𝐷𝐷𝑅𝑅𝐷𝐷𝐵𝐵𝑅𝑅� � ��𝐶𝐶𝐷𝐷𝐶𝐶𝐶𝐶𝐷𝐷𝐶𝐶� � ��� ��� ��� (9)
ANALYSIS OF INTRA-INDUSTRY TRADE IN AGRI-FOOD PRODUCTS BETWEEN BOSNIA AND HERZEGOVINA AND THE EUROPEAN UNION
56 SOUTH EAST EUROPEAN JOURNAL OF ECONOMICS AND BUSINESS, VOLUME 16 (2) 2021
GLij – standard Grubel-Lloyd index (IIT share) for the given industry i in trade between the given country and another country/country group j; Xij – exports of industry i from the given country to another coun-try/country group j; Mij – imports of industry i of the given country from another country/country group j; i = 1, … , n – the number of industries.
Value 0 indicates purely inter-industry trade, while index value 1 means that the entire trade is of intra-industry type. For most product groups, the value of G-L index is in interval between two extreme values 0 and 1.
Grubel-Lloyd index can be calculated as an aggre-gate index (a trade-weighted average of the industry indices) for a country’s individual trading partner or a group of a country’s trade partners, as follows:
where
wij – a share of industry i in total trade of the given country with the country/country group j.
The common feature of most methods for empiri-cal division of IIT into its horizontal and vertical com-ponents is their basis on the differences in quality, i.e. on the use of the unit value as a quality indicator. We used Greenaway, Hine, and Milner (1995) approach (GHM methodology) based on the pioneering paper by Abd-El-Rahman (1986), or more precisely on his relative unit value index (RUV):
RUVij – ratio between exports and imports unit value for industry i in trade of the given country with coun-try/country group j; UVXij – unit value of exports for industry i; UVMij – unit value of imports for industry i.
Horizontal IIT exists when export unit values are relatively close to import unit values of the given product, i.e. when the ratio between these unit values is within the ±0.15 or ±0.25 interval, depending on the selected dispersion factor (parameter α).
Trade in products whose unit values are beyond this interval is identified as vertical IIT. Blanes and Martın (2000) divide VIIT into two categories – high VIIT (VIITh) and low VIIT (VIITl) by using also the rela-tive unit value: VIITh (RUV above 1.15) signifies trade in vertically differentiated products of higher quality (meaning that quality of exports is higher than that of imports), while VIITl (RUV below 0.85) signifies trade in vertically differentiated products of lower quality (meaning that quality of exports is lower than that of imports).
For the purposes of calculating aggregate HIIT and VIIT according to GHM method, we applied the index in the following form:
where X and M stand for industry exports or im-ports respectively; H, V distinguishes HIIT from VIIT, i represents an industry and j represents a trading partner of the given country (i,j = 1,…, n).
3.2. Sample and econometric specification
We considered the decomposition of the dependent variable into its horizontal and vertical components. However, the preliminary analysis revealed that the vertical IIT strongly dominated the agri-food trade flows between BiH and the EU. For this reason, we fo-cused on examining the determinants of total IIT.
In order to investigate how various determinants affect the intra-industry agri-food trade of BiH with the EU member states we estimated an econometric mod-el, using the data on bilateral trade between BiH and 28 member states and providing a panel of 308 ob-servations. Due to data considerations, we adopted a more aggregate approach in the analysis, using coun-tries as units of analysis. The IIT indices were calculat-ed from the raw trade data provided by the Agency for Statistics of BiH (BHAS), classified according to
𝐺𝐺𝐺𝐺�� � �𝑋𝑋�� � 𝐶𝐶��� � �𝑋𝑋�� � 𝐶𝐶���𝑋𝑋�� � 𝐶𝐶��
� � 𝐺𝐺𝐺𝐺� � � (1)
𝐺𝐺𝐺𝐺 � � 𝐺𝐺𝐺𝐺���
���𝑤𝑤��
� � 𝐺𝐺𝐺𝐺 � � (2)
𝑤𝑤�� � ���������∑ �������������
(3)
𝑅𝑅𝑅𝑅𝑅𝑅�� � �����
����� (4)
� � � � 𝑅𝑅𝑅𝑅���
𝑅𝑅𝑅𝑅��� � � � � � ���� � 𝑅𝑅𝑅𝑅���
𝑅𝑅𝑅𝑅��� � ����
��� � � ���� (5)
𝑅𝑅𝑉𝑉𝑉𝑉𝑉𝑉� : 𝑅𝑅𝑅𝑅���
𝑅𝑅𝑅𝑅��� � � � � � 𝑅𝑅𝑅𝑅���
𝑅𝑅𝑅𝑅��� � ����
��� � � ���� (6)
𝑅𝑅𝑉𝑉𝑉𝑉𝑉𝑉� : 𝑅𝑅𝑅𝑅���
𝑅𝑅𝑅𝑅��� � � � � � 𝑅𝑅𝑅𝑅���
𝑅𝑅𝑅𝑅��� � ����
��� � � ���� ���
𝑉𝑉𝑉𝑉𝑉𝑉���� � ∑ �𝑋𝑋��
��� � 𝐶𝐶������ � ∑ �𝑋𝑋��
��� � 𝐶𝐶��������������
∑ �𝑋𝑋�� � 𝐶𝐶�������
� � 𝑉𝑉𝑉𝑉𝑉𝑉���� � � ���
𝑉𝑉𝑉𝑉𝑉𝑉�� � ��𝐷𝐷𝑉𝑉�𝐵𝐵����∆�𝐷𝐷𝐺𝐺𝐷𝐷𝐷𝐷����𝐷𝐷𝑉𝑉𝐷𝐷𝑉𝑉�
��
∆�𝑉𝑉𝑉𝑉����𝐷𝐷𝐷𝐷𝑅𝑅𝐷𝐷𝐷𝐷��
��∆�𝐷𝐷𝐷𝐷𝐷𝐷𝑉𝑉����
������𝐵𝐵𝐷𝐷𝑅𝑅𝐷𝐷𝐵𝐵𝑅𝑅� � ��𝐶𝐶𝐷𝐷𝐶𝐶𝐶𝐶𝐷𝐷𝐶𝐶� � ��� ��� ��� (9)
ANALYSIS OF INTRA-INDUSTRY TRADE IN AGRI-FOOD PRODUCTS BETWEEN BOSNIA AND HERZEGOVINA AND THE EUROPEAN UNION
57SOUTH EAST EUROPEAN JOURNAL OF ECONOMICS AND BUSINESS, VOLUME 16 (2) 2021
the Standard International Trade Classification (SITC) Revision 3. Data were aggregated for 42 individual three-digit product groups associated with the agri-food sector, as defined by UNCTAD (2021).
As there is no universally accepted form of speci-fying the IIT equation, we guided our econometric modelling approach by following the underlying theoretical model and by adopting the most com-monly included variables in the closely related empiri-cal studies. The descriptive statistics of the sample are provided in Table 1, along with the definitions of the variables considered in the model, their definitions, data sources, and expected effect on IIT.
There is considerable variability between the country pairs, particularly in terms of economic size, income differences, distance, and differences in agri-cultural productivity. The panel is unbalanced due to 10 missing values of IIT, which are caused by the ab-sence of trade between BiH on one side and Estonia, Latvia, Lithuania and Malta on the other in some ob-served years. Using Little’s test (Little 1988) we de-termined that the aforementioned observations are missing completely at random. Additionally, we con-sidered using the random-effects variant of Heckman’s sample selection model (Heckman 1979), to account for the fact that some observations are missing due to
Table 1. Description and descriptive statistics of the variables
Variable Variable description Datasource
Exp. effect Mean Std. dev. Min Max
IITjt The intensity of intra-industry agri-food trade measured as the value of GL index.
BHAS N/A 0.068 0.097 0 0.401
ASIZEjt The economic size expressed as the aver-age of nominal GDPs of BiH and a coun-try j (in current billions EUR) in year t.
IMF + 325.652 477.445 12.963 1984.866
DGDPCjt The inequality in income per capita measured as the absolute difference in per capita GDP (in current thousands EUR) between BiH and a country j in year t.
IMF - 28.331 21.762 2.174 113.494
DISTj The geographical distance as a direct straight-line distance in thousands kilo-meters between capital cities of BiH and a country j.
CEPII - 1.157 0.572 0.29 2.363
BORDERj The common border represented by dummy variable that equals 1 if an observed pair of countries has common border and 0 otherwise.
CEPII + 0.036 0.186 0 1
TIjt The trade intensity as the share of a trad-ing partner’s market in the foreign trade of BiH in agri-food products in year t.
BHAS + 0.019 0.041 0 0.271
DPRODjt The difference in productivity measured as the absolute difference of the value-added per worker in agriculture in BiH and a country j in year t in thousands EUR.
FAO - 28.528 22.458 0 99.331
DFDIjt The difference in FDI measured as the absolute difference between FDI stock in BiH and in a country j in year t in millions USD.
UNCTAD - 0.283 0.369 .004 1.882
COMMONj The common history represented by dummy variable that equals 1 if an observed pair of countries has common state or colonial relationship in the past, and 0 otherwise.
CEPII + 0.107 0.31 0 1
Source: Authors‘ own calculation.
ANALYSIS OF INTRA-INDUSTRY TRADE IN AGRI-FOOD PRODUCTS BETWEEN BOSNIA AND HERZEGOVINA AND THE EUROPEAN UNION
58 SOUTH EAST EUROPEAN JOURNAL OF ECONOMICS AND BUSINESS, VOLUME 16 (2) 2021
the lack of trade between the countries. However, the preliminary estimations of the model revealed that the Inverse Mills ratio and the correlation between the error terms in the selection and primary equations are insignificant, implying the absence of sample se-lection bias. For this reason, we based our empirical approach on estimating a single augmented gravity-type equation, which is particularly useful for analys-ing the economic relationships on the bilateral level.
The use of the gravity-type equation as a work-horse model is the most commonly adopted ap-proach in the related literature (Jing, Leitão, and Faustino 2010; Łapinska 2014; Jámbor, Bologh, and Kucsera 2016). In nearly all studies the gravity equa-tion is linearised using a log-transformation and then estimated using the ordinary least squares, gener-alised least squares, and generalised method of mo-ments. However, such an approach is inadequate in the cases where there is a significant share of zero val-ues of dependent variable, as it leads to loss of obser-vations and the dependency between the error term and covariates, resulting in inconsistent estimates (Silva and Teneyro 2006). In our sample, 23.49% of ob-servations contain zero dependent variable (which re-flect instances of perfect inter-industry trade), making the aforesaid problem a non-negligible concern. The common solution to the problem of zeros in estimat-ing gravity-type equations is the application of PPML method. This method, originally proposed by Silva and Teneyro (2006) allows the gravity equation to be estimated in its original multiplicative form, accomo-dating to zero values of dependent variable (Burger, Van Oort, and Linders 2009). The estimator was shown to be robust to heteroskedasticity if the conditional variance of the dependent variable is proportional to its conditional mean. This assumption is not violated, as there is only one process generating zero and miss-ing values of the dependent variable in our sample.
The model we estimated has the following form:
where dependent and independent variables are de-fined in the same manner as presented in Table 1, α denotes a constant, β and δ denote slope coefficients, j is the index of the EU trade partners of BiH, t signifies the time period, and μj, λt and εjt refer to individual ef-fect, time effect and the error term, respectively.
Our baseline model is a two-way panel data model, including individual and time-specific effects, which were included in the model due to the panel structure of the data and the joint statistical significance of the aforesaid effects. The inclusion of individual and time-specific effects allowed us to control for unobserved heterogeneity across the countries and time periods and the impact of factors not explicitly included in the model, which reduced the risk of misspecification. Our model is essentially an augmented gravity equation. We use a static specification, as there is no theoretical justification for using the dynamic one in the context of IIT, and as it is the most widely used approach in the related empirical literature (Fertő and Hubbard 2002; Jing, Leitão, and Faustino 2010). In model estimation, we were primarily interested in the significance of β and δ coefficients, which are directly related to our ini-tial hypotheses of the impact of various determinants on the IIT intensity.
Finally, in order to reduce the risk of spurious re-sults, we evaluated the stationarity of the panels using a Fisher-type stationarity test (Maddala and Wu 1999). The test results for the continuous variables are pre-sented in Table 2.
Table 2. Panel unit root test results for continuous variables
Variable Without time trend With time trend
Modified χ2 p-value Modified χ2 p-value
IITjt 1.6555 0.0489 3.4774 0.0003
ASIZEjt 8.8983 0.0000 2.8699 0.0021
ΔDGDPCjt 6.8023 0.0000 2.6353 0.0042
ΔTIjt 3.4924 0.0002 3.9437 0.0000
DPRODjt 4.4063 0.0000 5.2172 0.0000
ΔDFDIjt 10.4041 0.0000 7.5441 0.0000
Source: Authors’ own calculations based on Maddala and Wu (1999).
𝐼𝐼𝐼𝐼𝐼𝐼�� � ��𝐷𝐷𝐼𝐼�𝐵𝐵����∆�𝐷𝐷𝐷𝐷𝐷𝐷𝐷𝐷����𝐷𝐷𝐼𝐼𝐷𝐷𝐼𝐼�
��
∆�𝐼𝐼𝐼𝐼����𝐷𝐷𝐷𝐷𝐷𝐷𝐷𝐷𝐷𝐷��
��∆�𝐷𝐷𝐷𝐷𝐷𝐷𝐼𝐼����
������𝐵𝐵𝐷𝐷𝐷𝐷𝐷𝐷𝐵𝐵𝐷𝐷� � ��𝐶𝐶𝐷𝐷𝐶𝐶𝐶𝐶𝐷𝐷𝐶𝐶� � ��� ��� ��� (9)
ANALYSIS OF INTRA-INDUSTRY TRADE IN AGRI-FOOD PRODUCTS BETWEEN BOSNIA AND HERZEGOVINA AND THE EUROPEAN UNION
59SOUTH EAST EUROPEAN JOURNAL OF ECONOMICS AND BUSINESS, VOLUME 16 (2) 2021
In the initial testing, we found that DGDPC, TI, and DFDI contained unit roots in levels. However, the first differences of the variables were found to be station-ary. For this reason, the three variables are included in our model as first-order differences.
4. Results and discussion
4.3. Analysis of intra-industry trade patterns
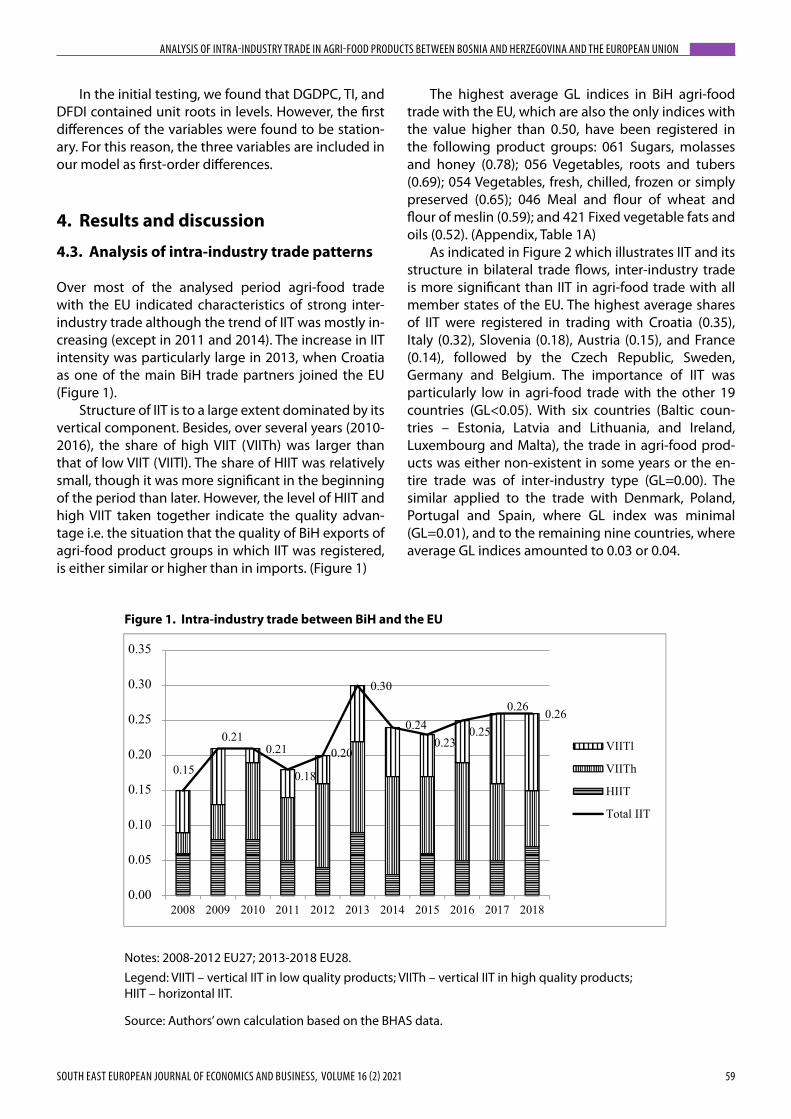
Over most of the analysed period agri-food trade with the EU indicated characteristics of strong inter-industry trade although the trend of IIT was mostly in-creasing (except in 2011 and 2014). The increase in IIT intensity was particularly large in 2013, when Croatia as one of the main BiH trade partners joined the EU (Figure 1).
Structure of IIT is to a large extent dominated by its vertical component. Besides, over several years (2010-2016), the share of high VIIT (VIITh) was larger than that of low VIIT (VIITl). The share of HIIT was relatively small, though it was more significant in the beginning of the period than later. However, the level of HIIT and high VIIT taken together indicate the quality advan-tage i.e. the situation that the quality of BiH exports of agri-food product groups in which IIT was registered, is either similar or higher than in imports. (Figure 1)
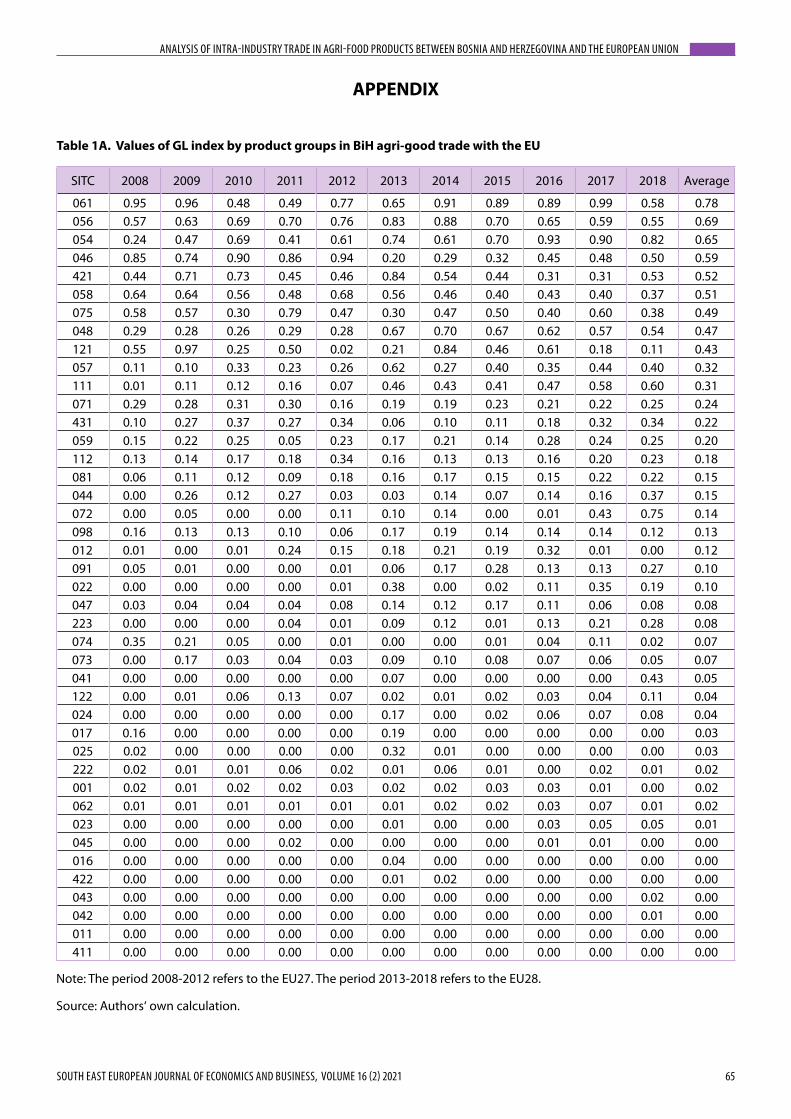
The highest average GL indices in BiH agri-food trade with the EU, which are also the only indices with the value higher than 0.50, have been registered in the following product groups: 061 Sugars, molasses and honey (0.78); 056 Vegetables, roots and tubers (0.69); 054 Vegetables, fresh, chilled, frozen or simply preserved (0.65); 046 Meal and flour of wheat and flour of meslin (0.59); and 421 Fixed vegetable fats and oils (0.52). (Appendix, Table 1A)
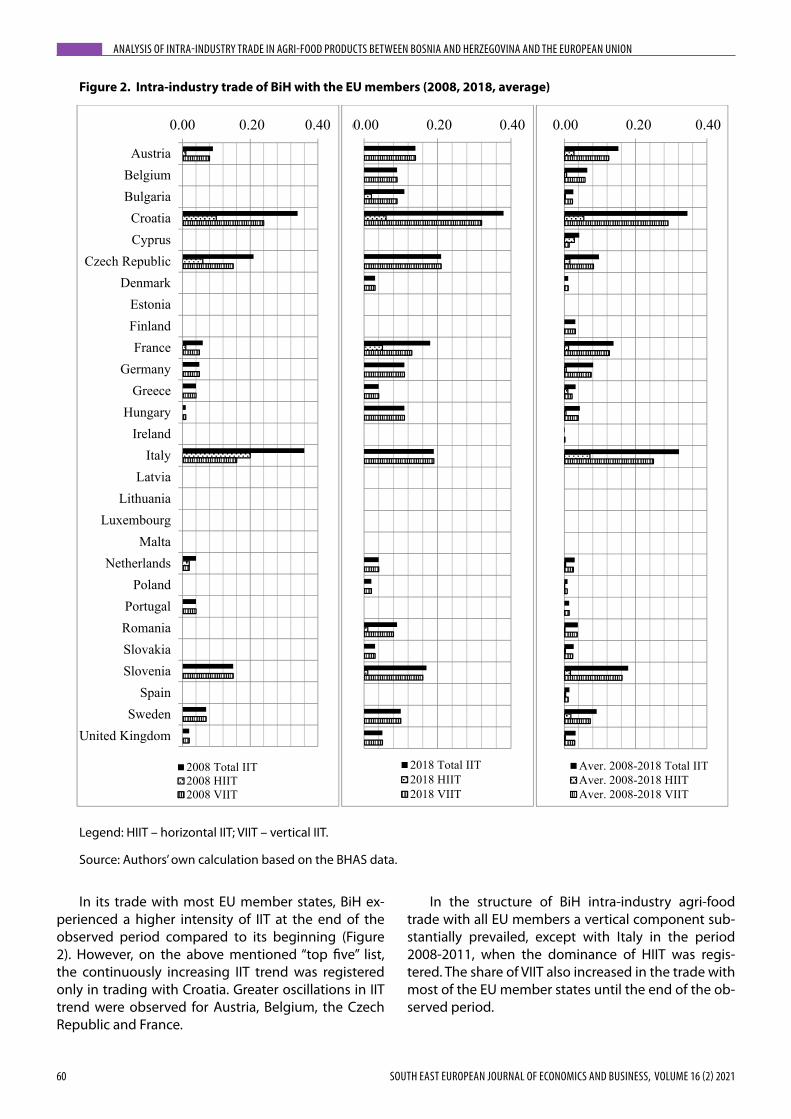
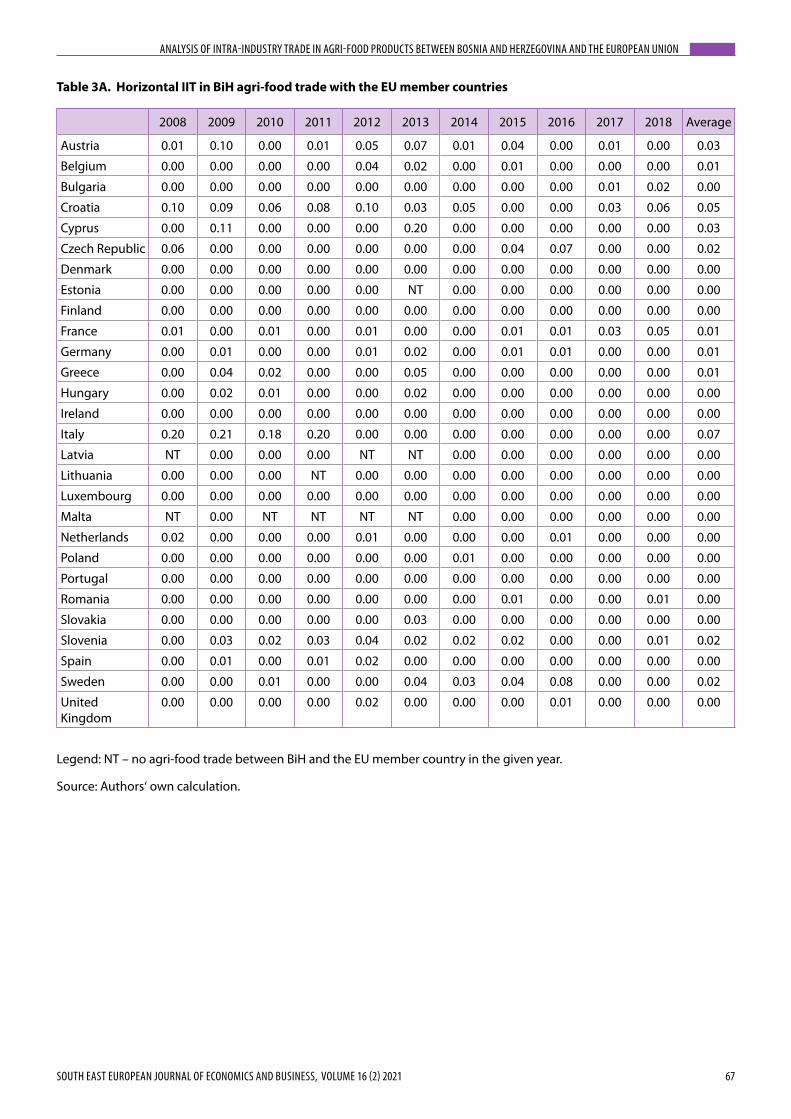
As indicated in Figure 2 which illustrates IIT and its structure in bilateral trade flows, inter-industry trade is more significant than IIT in agri-food trade with all member states of the EU. The highest average shares of IIT were registered in trading with Croatia (0.35), Italy (0.32), Slovenia (0.18), Austria (0.15), and France (0.14), followed by the Czech Republic, Sweden, Germany and Belgium. The importance of IIT was particularly low in agri-food trade with the other 19 countries (GL<0.05). With six countries (Baltic coun-tries – Estonia, Latvia and Lithuania, and Ireland, Luxembourg and Malta), the trade in agri-food prod-ucts was either non-existent in some years or the en-tire trade was of inter-industry type (GL=0.00). The similar applied to the trade with Denmark, Poland, Portugal and Spain, where GL index was minimal (GL=0.01), and to the remaining nine countries, where average GL indices amounted to 0.03 or 0.04.
0.15
0.210.21
0.18
0.20
0.30
0.240.23
0.25
0.26 0.26
0,00
0,05
0,10
0,15
0,20
0,25
0,30
0,35
2008 2009 2010 2011 2012 2013 2014 2015 2016 2017 2018
VIITl
VIITh
HIIT
Total IIT
0,00 0,20 0,40
AustriaBelgiumBulgaria
CroatiaCyprus
Czech RepublicDenmark
EstoniaFinlandFrance
GermanyGreece
HungaryIreland
ItalyLatvia
LithuaniaLuxembourg
MaltaNetherlands
PolandPortugalRomaniaSlovakiaSlovenia
SpainSweden
United Kingdom
2008 Total IIT2008 HIIT2008 VIIT
0,00 0,20 0,40
2018 Total IIT2018 HIIT2018 VIIT
0,00 0,20 0,40
Aver. 2008-2018 Total IITAver. 2008-2018 HIITAver. 2008-2018 VIIT
Figure 1. Intra-industry trade between BiH and the EU
Notes: 2008-2012 EU27; 2013-2018 EU28. Legend: VIITl – vertical IIT in low quality products; VIITh – vertical IIT in high quality products; HIIT – horizontal IIT.
Source: Authors’ own calculation based on the BHAS data.
0.35
0.30
0.25
0.20
0.15
0.10
0.05
0.00
ANALYSIS OF INTRA-INDUSTRY TRADE IN AGRI-FOOD PRODUCTS BETWEEN BOSNIA AND HERZEGOVINA AND THE EUROPEAN UNION
60 SOUTH EAST EUROPEAN JOURNAL OF ECONOMICS AND BUSINESS, VOLUME 16 (2) 2021
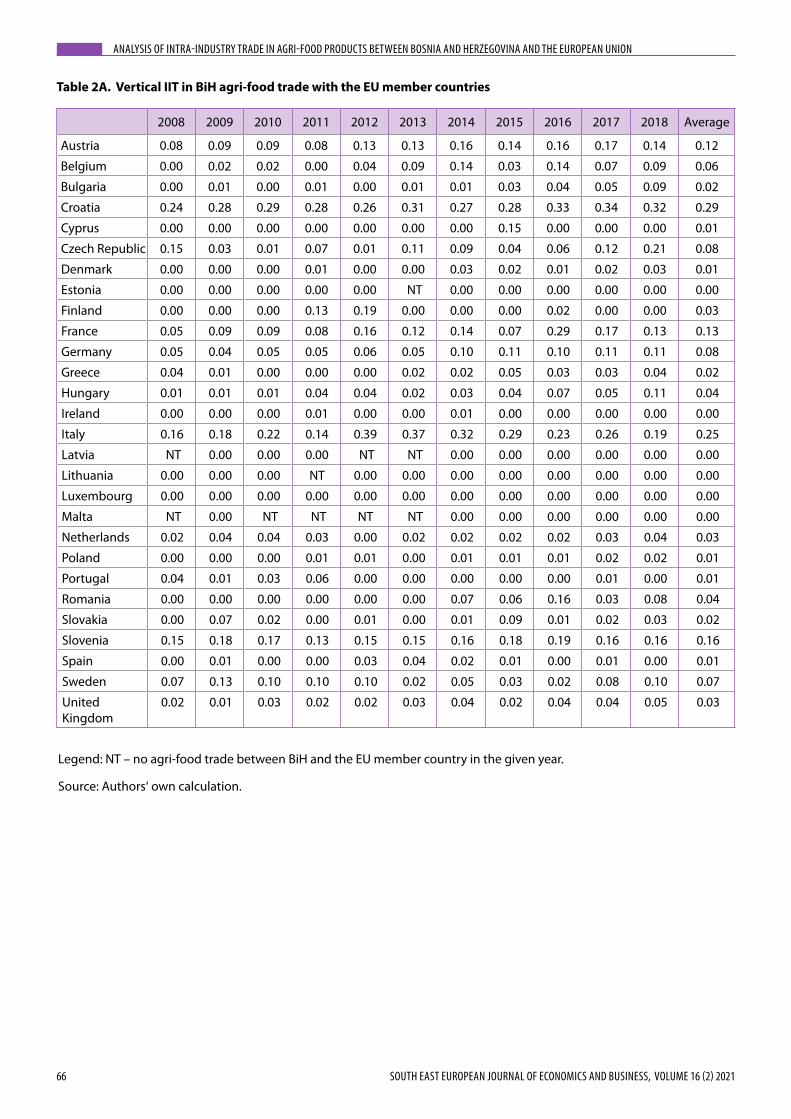
In its trade with most EU member states, BiH ex-perienced a higher intensity of IIT at the end of the observed period compared to its beginning (Figure 2). However, on the above mentioned “top five” list, the continuously increasing IIT trend was registered only in trading with Croatia. Greater oscillations in IIT trend were observed for Austria, Belgium, the Czech Republic and France.
In the structure of BiH intra-industry agri-food trade with all EU members a vertical component sub-stantially prevailed, except with Italy in the period 2008-2011, when the dominance of HIIT was regis-tered. The share of VIIT also increased in the trade with most of the EU member states until the end of the ob-served period.
0.15
0.210.21
0.18
0.20
0.30
0.240.23
0.25
0.26 0.26
0,00
0,05
0,10
0,15
0,20
0,25
0,30
0,35
2008 2009 2010 2011 2012 2013 2014 2015 2016 2017 2018
VIITl
VIITh
HIIT
Total IIT
0,00 0,20 0,40
AustriaBelgiumBulgariaCroatiaCyprus
Czech RepublicDenmark
EstoniaFinlandFrance
GermanyGreece
HungaryIreland
ItalyLatvia
LithuaniaLuxembourg
MaltaNetherlands
PolandPortugalRomaniaSlovakiaSlovenia
SpainSweden
United Kingdom
2008 Total IIT2008 HIIT2008 VIIT
0,00 0,20 0,40
2018 Total IIT2018 HIIT2018 VIIT
0,00 0,20 0,40
Aver. 2008-2018 Total IITAver. 2008-2018 HIITAver. 2008-2018 VIIT
Figure 2. Intra-industry trade of BiH with the EU members (2008, 2018, average)
Legend: HIIT – horizontal IIT; VIIT – vertical IIT.
Source: Authors’ own calculation based on the BHAS data.
0.00 0.20 0.40 0.00 0.20 0.40 0.00 0.20 0.40
ANALYSIS OF INTRA-INDUSTRY TRADE IN AGRI-FOOD PRODUCTS BETWEEN BOSNIA AND HERZEGOVINA AND THE EUROPEAN UNION
61SOUTH EAST EUROPEAN JOURNAL OF ECONOMICS AND BUSINESS, VOLUME 16 (2) 2021
4.2. Model estimation results
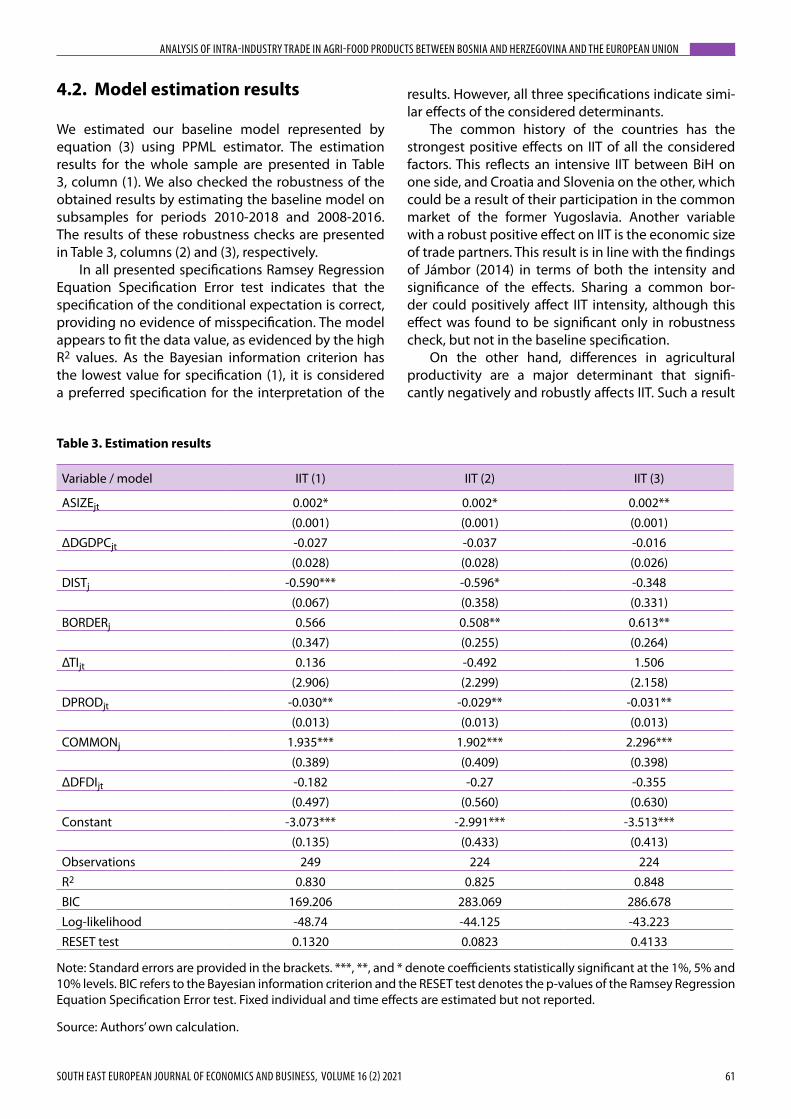
We estimated our baseline model represented by equation (3) using PPML estimator. The estimation results for the whole sample are presented in Table 3, column (1). We also checked the robustness of the obtained results by estimating the baseline model on subsamples for periods 2010-2018 and 2008-2016. The results of these robustness checks are presented in Table 3, columns (2) and (3), respectively.
In all presented specifications Ramsey Regression Equation Specification Error test indicates that the specification of the conditional expectation is correct, providing no evidence of misspecification. The model appears to fit the data value, as evidenced by the high R2 values. As the Bayesian information criterion has the lowest value for specification (1), it is considered a preferred specification for the interpretation of the
results. However, all three specifications indicate simi-lar effects of the considered determinants.
The common history of the countries has the strongest positive effects on IIT of all the considered factors. This reflects an intensive IIT between BiH on one side, and Croatia and Slovenia on the other, which could be a result of their participation in the common market of the former Yugoslavia. Another variable with a robust positive effect on IIT is the economic size of trade partners. This result is in line with the findings of Jámbor (2014) in terms of both the intensity and significance of the effects. Sharing a common bor-der could positively affect IIT intensity, although this effect was found to be significant only in robustness check, but not in the baseline specification.
On the other hand, differences in agricultural productivity are a major determinant that signifi-cantly negatively and robustly affects IIT. Such a result
Table 3. Estimation results
Variable / model IIT (1) IIT (2) IIT (3)
ASIZEjt 0.002* 0.002* 0.002**(0.001) (0.001) (0.001)
ΔDGDPCjt -0.027 -0.037 -0.016(0.028) (0.028) (0.026)
DISTj -0.590*** -0.596* -0.348(0.067) (0.358) (0.331)
BORDERj 0.566 0.508** 0.613**(0.347) (0.255) (0.264)
ΔTIjt 0.136 -0.492 1.506(2.906) (2.299) (2.158)
DPRODjt -0.030** -0.029** -0.031**(0.013) (0.013) (0.013)
COMMONj 1.935*** 1.902*** 2.296***(0.389) (0.409) (0.398)
ΔDFDIjt -0.182 -0.27 -0.355(0.497) (0.560) (0.630)
Constant -3.073*** -2.991*** -3.513***(0.135) (0.433) (0.413)
Observations 249 224 224R2 0.830 0.825 0.848BIC 169.206 283.069 286.678Log-likelihood -48.74 -44.125 -43.223RESET test 0.1320 0.0823 0.4133
Note: Standard errors are provided in the brackets. ***, **, and * denote coefficients statistically significant at the 1%, 5% and 10% levels. BIC refers to the Bayesian information criterion and the RESET test denotes the p-values of the Ramsey Regression Equation Specification Error test. Fixed individual and time effects are estimated but not reported.
Source: Authors’ own calculation.
ANALYSIS OF INTRA-INDUSTRY TRADE IN AGRI-FOOD PRODUCTS BETWEEN BOSNIA AND HERZEGOVINA AND THE EUROPEAN UNION
62 SOUTH EAST EUROPEAN JOURNAL OF ECONOMICS AND BUSINESS, VOLUME 16 (2) 2021
supports the previous findings reported in the re-lated empirical literature. Geographic distance was also found to be negatively related to IIT. The effect is, however, not robust in the case of the Specification (3). As for the differences in GDP p/c and FDI, as well as for the trade intensity, no statistically significant ef-fects were found in any estimated specifications.
5. Conclusion
The empirical evidence presented in this pa-per confirms the theoretical hypotheses explaining the patterns of IIT of less advanced countries (and in less differentiated products), and those explaining ef-fects of country-specific determinants on IIT.
The analysis of characteristics of IIT in agri-food trade between BiH and the EU points to several main concluding observations. Firstly, a relative importance of intra-industry trade as opposed to inter-industry trade was significantly lower in the observed period – inter-industry trade proved as a strongly dominant form of trade specialisation in the agri-food trade of BiH with the EU, viewed totally and bilaterally. Despite the increasing level of trade liberalisation between the trading partners, an expected change in IIT pat-terns from dominant inter- to dominant intra-industry trade did not happen. The time series analysis indi-cated that the intensity of IIT with the EU as a whole experienced a slight growth. However, the increasing trend seems to correspond to the latest EU enlarge-ment in 2013, when Croatia joined, rather than the growth in the level and scope of mutual trade liber-alisation related to BiH obtaining the potential can-didate status. Trends in IIT intensity did not point to a significant positive development that would lead to greater convergence between agri-food sectors of the analysed trading partners. Finally, the analysis of IIT structure, i. e. the distinction between HIIT and VIIT, revealed that the agri-food trade of BiH with the EU was dominated by its vertical component, referring to trade of different quality products. In trading with the EU as a whole, the high VIIT was somewhat more prominent than a low VIIT over the major part of the observed period.
The IIT patterns were explained through the analysis of impact of several country-specific charac-teristics. Our initial hypotheses are supported by the estimates of the econometric model in the case of economies’ size, common border, and common his-tory effects, all of which were found to positively af-fect IIT. Our hypothesis regarding the negative effect of distance is also supported by the presented empiri-cal evidence, to a certain extent. As it is expected, the
impact of differences in productivity on IIT was found to be significantly negative. Finally, the results of our study do not support the hypotheses related to the significance of effects of trade intensity, as well as dif-ferences in GDP p/c and FDI.
By providing a deeper insight into characteristics and determinants of IIT, the paper contributes to a better understanding of the position of the agri-food sector of the EU potential candidate country in one of its most important foreign markets. It also provides useful information for policymakers.
The significantly high share of inter-industry trade implies a higher possibility of increasing adjustment costs for BiH agri-food sector, associated with further liberalisation of trade with the EU. Contrary to the smooth adjustment hypothesis (Balassa, 1966) related to a higher share of IIT, an increase in trade as a result of liberalisation might cause more transfer of pro-duction factors between expanding and contracting product lines and more temporary unemployment in BiH agri-food sector.
Therefore further association of BiH to the EU by completing the free trade area, and by harmonizing regulations in the field of trade in agri-food products, will require restructuring of BiH agri-food sector to increase its competitiveness. With respect to our find-ings on IIT patterns and following Bojnec and Fertő (2016), it is recommended to focus on two specific market niches that differ by income p/c. As price com-petitiveness is more important for HIIT and low VIIT, competing in prices enabled by increasing economy of scale in production will attract more EU consum-ers with lower income. On the other hand, in product groups with dominant high VIIT, meaning higher qual-ity and higher value-added of BiH exports, as well as higher prices, efforts should focus on marketing pro-motion and branding at micro-level (level of compa-nies) or local/regional level (level of agri-food clusters).
Endnotes
1 After Croatia‘s accession to the European Union, the Western Balkans region includes only five eco-nomies: Albania, Bosnia and Herzegovina, North Macedonia, Serbia and Kosovo*. (*The name does not prejudge the status of Kosovo* and is in line with the Resolution of the United Nations Security Council UNSC 1244 and the opinion of the International Court of Justice on the Declaration on Kosovo’s Independence of 2008).
2 Empirical literature contains evidence that the share of vertical IIT is larger than that of horizontal IIT in the trade between countries at different levels of economic development (Mardas and Nikas 2008).
ANALYSIS OF INTRA-INDUSTRY TRADE IN AGRI-FOOD PRODUCTS BETWEEN BOSNIA AND HERZEGOVINA AND THE EUROPEAN UNION
63SOUTH EAST EUROPEAN JOURNAL OF ECONOMICS AND BUSINESS, VOLUME 16 (2) 2021
References
Abd-El-Rahman, K. S. 1986. Réexamen de la définition et de la mesure des échanges croisés de produits similaires entre les nations (Review of the definition and meas-urement of cross-trade in similar products between na-tions). Revue Economique 37 (1): 89-116.
Agency for Statistics of Bosnia and Herzegovina (BHAS). Statistical database – Foreign trade statistics (Available on request only)
Ambroziak, Ł. 2012. FDI and intra-industry trade: Theory and empirical evidence from the Visegrad countries. International Journal of Economics and Business Research 4 (1/2): 180–198.
Balassa, B. 1966. Tariff reductions and trade in manufactures among the industrialised countries. American Economic Review 56 (3): 466-473.
Balassa, B. 1986. Intra-industry trade among exporters of manufactured goods. In Imperfect competition and in-ternational trade, edited by D. Greenaway and P. K. M. Tharakan, 108-128. Brighton: Wheatshef.
Balogh, J. M., and Leitão, N. C. 2019. A gravity approach of agricultural trade: The nexus of the EU and African, Caribbean and Pacific countries. Agricultural Economics 65 (11): 509-519.
Blanes, J. V., and Martín, C. 2000. The nature and causes of intra-industry trade: Back to the comparative advantage explanation? The case of Spain. Weltwirtschaftliches Archiv 136 (3): 423–441.
Bojnec, Š., and Fertő, I. 2016. Patterns and drivers of the agri-food intra-industry trade of European Union coun-tries. International Food and Agribusiness Management Review 19 (2): 53-73.
Burger, M., Van Oort, F., and Linders, G-J. 2009. On the speci-fication of the gravity model of trade: Zeros, excess zeros and zero-inflated estimation. Spatial Economic Analysis 4 (2): 167-190.
Centre d’études prospectives et d’informations internation-als (CEPII) 2020. Distance database (database online). http://www.cepii.fr/anglaisgraph/bdd/distances.htm (accessed August 2020)
Dixit, A. K., and Stiglitz, J. E. 1977. Monopolistic competition and optimum product diversity. American Economic Review 67 (3): 297-308.
Falvey, R. E. 1981. Commercial policy and intra-industry trade. Journal of International Economics 11 (4): 495-511.
Falvey, R. E., and Kierzkowski, H. 1987. Product quality, intra-industry trade and (im)perfect competition. In Protection and competition in international trade, edited by H. Kierzkowski, 143-161. Oxford (USA): Basil Blackwell.
Fertő, I., and Hubbard, L. J. 2002. Intra-industry trade in hori-zontally and vertically differentiated agri-food products between Hungary and the EU. Hungarian Academy of Sciences. Institute of Economics Discussion Paper 2002/2
Fidrmuc, J. 2004. The Endogeneity of the optimum currency area criteria, intra-industry trade, and EMU enlargement. Contemporary Economic Policy 22 (1): 1-12.
Food and Agriculture Organization of the United Nations (FAO) 2020. FAOSTAT (database online). http://www.fao.org/faostat/en/#data/RL (accessed 20 November 2020)
Greenaway, D., Hine, R., and Milner, C. 1995. Vertical and hor-izontal intra-industry trade: A cross industry analysis for the United Kingdom. The Economic Journal 105 (433): 1505-1518.
Grubel, H. G., and Lloyd, P. J. 1975. Intra-Industry Trade: The Theory and Measurement of International Trade in Differentiated Products. London: The Macmillan Press.
Heckman, J. J. 1979. Sample selection bias as a specification error. Econometrica 47 (1): 153-161.
Helpman, E. 1981. International trade in the presence of product differentiation, economies of scale and mo-nopolistic competition: A Chamberlin-Heckscher-Ohlin approach. Journal of International Economics 11 (3): 305-340.
Helpman, E., and Krugman, P. R. 1985. Market structure and foreign trade. 8th edition. Cambridge, MA: MIT Press.
International Monetary Fund (IMF) 2019. World Economic Outlook Database (database online). https://www.imf.org/en/Publications/WEO/weo-database/2019/October (accessed July 2020)
Jámbor, A. 2013. Country-specific determinants of horizon-tal and vertical intra-industry agri-food trade: the case of Bulgaria and Romania. Applied Studies in Agribusiness and Commerce 7 (4-5): 69-76.
Jámbor, A. 2014. Country specific determinants of horizon-tal and vertical intra-industry agri-food trade: The case of the EU new member states. Journal of Agricultural Economics 65 (3): 663-682.
Jámbor, A. 2015. Country and industry-specific determi-nants of intra-industry trade in agri-food products in the Visegrad countries. Studies in Agricultural Economics 117 (2): 93-101.
Jámbor, A., and Leitão N. C. 2016. Industry-specific deter-minants of vertical intra-industry trade: the case of EU new member states’ agri-food sector. Post-Communist Economies 28 (1): 34-48.
Jámbor, A., Bologh, J., and Kucsera, P. 2016. Country and in-dustry specific determinants of intra-industry agri-food trade in the Baltic countries. Agricultural Economics (Zemědělská Ekonomika) 62 (6): 280–291.
Jing, W., Leitão, N. C., and Faustino, H. C. 2010. Intra-industry trade in agricultural products: The case of China. Instituto Superior de Economia e Gestão. DE Working papers 6-2010/DE/SOCIUS
Kandogan, Y. 2003. Intra-industry trade of transition coun-tries: Trends and determinants. Emerging Markets Review 4 (3): 273-286.
ANALYSIS OF INTRA-INDUSTRY TRADE IN AGRI-FOOD PRODUCTS BETWEEN BOSNIA AND HERZEGOVINA AND THE EUROPEAN UNION
64 SOUTH EAST EUROPEAN JOURNAL OF ECONOMICS AND BUSINESS, VOLUME 16 (2) 2021
Krugman, P. R. 1980. Scale economies, product differen-tiation, and the patterns of trade. American Economic Review 70 (5): 950-959.
Krugman, P. R., and Obstfeld, M. 2009. International econom-ics: theory and policy. 8th edition. Boston, MA: Pearson Education Inc.
Lancaster, K. 1980. Intra-industry trade under perfect monopolistic competition. Journal of International Economics 10 (2): 151-175.
Łapinska, J. 2014. Determinants of intra-industry trade in agricultural and food products between Poland and EU countries. Danube: Law and Economics Review 5 (3): 159-172.
Leitão, N. C. 2011. Intra-industry trade in the agriculture sec-tor: The experience of United States. African Journal of Agricultural Research 6 (1): 186-190.
Linder, S. B. 1961. An essay on trade and transformation. New York: John Wiley & Sons.
Little, R. J. 1988. A test of missing completely at random for multivariate data with missing values. Journal of the American Statistical Association 83 (404): 1198-1202.
Maddala, G. S., and Wu, S. 1999. A comparative study of unit root tests with panel data and a new simple test. Oxford Bulletin of Economics and Statistics 61 (S1): 631-652.
Mardas D., and Nikas, Ch. (2008): Economic integration and intra-industry trade between the European Community and the Western Balkan countries. Transition Studies Review 15 (3): 511-523.
Mrdalj, V., Ostojić, A., Vasko, Z., and Brković, D. 2017. Structure and determinants of intra-industry trade in agri-food
sector of Bosnia and Herzegovina. European Journal of Interdisciplinary Studies 3 (3): 154-163.
Silva, J. M. C., and Teneyro, S. 2006. The log of gravity. The Review of Economics and Statistics 88 (4): 641-658.
Trivić,, J., and Klimczak, L. 2015. The determinants of intra-regional trade in the Western Balkans. Proceedings of Rijeka Faculty of Economics: Journal of Economics and Business 33 (1): 37-66.
United Nations Conference on Trade and Development (UNCTAD) 2021. Statistical database: Product groups and composition (SITC Rev. 3) (database online). https://unctadstat.unctad.org/EN/Classifications/DimSitcR ev3Produc ts_DsibSpecia lGroupings_Hierarchy.pdf (accessed March 2021)
United Nations Statistics Division (UNSTAT) 2021. Statistical database (database online). https://unstats.un.org/home/ (accessed August 2020)
Venables, A. J., Rice, P. G., and Stewart, M. 2003. The geogra-phy of intra-industry trade: Empirics. Topics in Economic Analysis and Policy 3 (1): 1-25.
World Bank (WB) 2020. Agriculture value added per worker (database online). https://datacatalog.worldbank.org/agriculture-value-added-worker-constant-2010-us (ac-cessed July 2020)
World Bank (WB) 2020. World development indicators (da-tabase online). https://databank.worldbank.org/indica-tor/NY.GDP.PCAP.CD/1ff4a498/Popular-Indicators# (ac-cessed July 2020)
ANALYSIS OF INTRA-INDUSTRY TRADE IN AGRI-FOOD PRODUCTS BETWEEN BOSNIA AND HERZEGOVINA AND THE EUROPEAN UNION
65SOUTH EAST EUROPEAN JOURNAL OF ECONOMICS AND BUSINESS, VOLUME 16 (2) 2021
APPENDIX
Table 1A. Values of GL index by product groups in BiH agri-good trade with the EU
SITC 2008 2009 2010 2011 2012 2013 2014 2015 2016 2017 2018 Average
061 0.95 0.96 0.48 0.49 0.77 0.65 0.91 0.89 0.89 0.99 0.58 0.78056 0.57 0.63 0.69 0.70 0.76 0.83 0.88 0.70 0.65 0.59 0.55 0.69054 0.24 0.47 0.69 0.41 0.61 0.74 0.61 0.70 0.93 0.90 0.82 0.65046 0.85 0.74 0.90 0.86 0.94 0.20 0.29 0.32 0.45 0.48 0.50 0.59421 0.44 0.71 0.73 0.45 0.46 0.84 0.54 0.44 0.31 0.31 0.53 0.52058 0.64 0.64 0.56 0.48 0.68 0.56 0.46 0.40 0.43 0.40 0.37 0.51075 0.58 0.57 0.30 0.79 0.47 0.30 0.47 0.50 0.40 0.60 0.38 0.49048 0.29 0.28 0.26 0.29 0.28 0.67 0.70 0.67 0.62 0.57 0.54 0.47121 0.55 0.97 0.25 0.50 0.02 0.21 0.84 0.46 0.61 0.18 0.11 0.43057 0.11 0.10 0.33 0.23 0.26 0.62 0.27 0.40 0.35 0.44 0.40 0.32111 0.01 0.11 0.12 0.16 0.07 0.46 0.43 0.41 0.47 0.58 0.60 0.31071 0.29 0.28 0.31 0.30 0.16 0.19 0.19 0.23 0.21 0.22 0.25 0.24431 0.10 0.27 0.37 0.27 0.34 0.06 0.10 0.11 0.18 0.32 0.34 0.22059 0.15 0.22 0.25 0.05 0.23 0.17 0.21 0.14 0.28 0.24 0.25 0.20112 0.13 0.14 0.17 0.18 0.34 0.16 0.13 0.13 0.16 0.20 0.23 0.18081 0.06 0.11 0.12 0.09 0.18 0.16 0.17 0.15 0.15 0.22 0.22 0.15044 0.00 0.26 0.12 0.27 0.03 0.03 0.14 0.07 0.14 0.16 0.37 0.15072 0.00 0.05 0.00 0.00 0.11 0.10 0.14 0.00 0.01 0.43 0.75 0.14098 0.16 0.13 0.13 0.10 0.06 0.17 0.19 0.14 0.14 0.14 0.12 0.13012 0.01 0.00 0.01 0.24 0.15 0.18 0.21 0.19 0.32 0.01 0.00 0.12091 0.05 0.01 0.00 0.00 0.01 0.06 0.17 0.28 0.13 0.13 0.27 0.10022 0.00 0.00 0.00 0.00 0.01 0.38 0.00 0.02 0.11 0.35 0.19 0.10047 0.03 0.04 0.04 0.04 0.08 0.14 0.12 0.17 0.11 0.06 0.08 0.08223 0.00 0.00 0.00 0.04 0.01 0.09 0.12 0.01 0.13 0.21 0.28 0.08074 0.35 0.21 0.05 0.00 0.01 0.00 0.00 0.01 0.04 0.11 0.02 0.07073 0.00 0.17 0.03 0.04 0.03 0.09 0.10 0.08 0.07 0.06 0.05 0.07041 0.00 0.00 0.00 0.00 0.00 0.07 0.00 0.00 0.00 0.00 0.43 0.05122 0.00 0.01 0.06 0.13 0.07 0.02 0.01 0.02 0.03 0.04 0.11 0.04024 0.00 0.00 0.00 0.00 0.00 0.17 0.00 0.02 0.06 0.07 0.08 0.04017 0.16 0.00 0.00 0.00 0.00 0.19 0.00 0.00 0.00 0.00 0.00 0.03025 0.02 0.00 0.00 0.00 0.00 0.32 0.01 0.00 0.00 0.00 0.00 0.03222 0.02 0.01 0.01 0.06 0.02 0.01 0.06 0.01 0.00 0.02 0.01 0.02001 0.02 0.01 0.02 0.02 0.03 0.02 0.02 0.03 0.03 0.01 0.00 0.02062 0.01 0.01 0.01 0.01 0.01 0.01 0.02 0.02 0.03 0.07 0.01 0.02023 0.00 0.00 0.00 0.00 0.00 0.01 0.00 0.00 0.03 0.05 0.05 0.01045 0.00 0.00 0.00 0.02 0.00 0.00 0.00 0.00 0.01 0.01 0.00 0.00016 0.00 0.00 0.00 0.00 0.00 0.04 0.00 0.00 0.00 0.00 0.00 0.00422 0.00 0.00 0.00 0.00 0.00 0.01 0.02 0.00 0.00 0.00 0.00 0.00043 0.00 0.00 0.00 0.00 0.00 0.00 0.00 0.00 0.00 0.00 0.02 0.00042 0.00 0.00 0.00 0.00 0.00 0.00 0.00 0.00 0.00 0.00 0.01 0.00011 0.00 0.00 0.00 0.00 0.00 0.00 0.00 0.00 0.00 0.00 0.00 0.00411 0.00 0.00 0.00 0.00 0.00 0.00 0.00 0.00 0.00 0.00 0.00 0.00
Note: The period 2008-2012 refers to the EU27. The period 2013-2018 refers to the EU28.
Source: Authors‘ own calculation.
ANALYSIS OF INTRA-INDUSTRY TRADE IN AGRI-FOOD PRODUCTS BETWEEN BOSNIA AND HERZEGOVINA AND THE EUROPEAN UNION
66 SOUTH EAST EUROPEAN JOURNAL OF ECONOMICS AND BUSINESS, VOLUME 16 (2) 2021
Table 2A. Vertical IIT in BiH agri-food trade with the EU member countries
2008 2009 2010 2011 2012 2013 2014 2015 2016 2017 2018 Average
Austria 0.08 0.09 0.09 0.08 0.13 0.13 0.16 0.14 0.16 0.17 0.14 0.12
Belgium 0.00 0.02 0.02 0.00 0.04 0.09 0.14 0.03 0.14 0.07 0.09 0.06
Bulgaria 0.00 0.01 0.00 0.01 0.00 0.01 0.01 0.03 0.04 0.05 0.09 0.02
Croatia 0.24 0.28 0.29 0.28 0.26 0.31 0.27 0.28 0.33 0.34 0.32 0.29
Cyprus 0.00 0.00 0.00 0.00 0.00 0.00 0.00 0.15 0.00 0.00 0.00 0.01
Czech Republic 0.15 0.03 0.01 0.07 0.01 0.11 0.09 0.04 0.06 0.12 0.21 0.08
Denmark 0.00 0.00 0.00 0.01 0.00 0.00 0.03 0.02 0.01 0.02 0.03 0.01
Estonia 0.00 0.00 0.00 0.00 0.00 NT 0.00 0.00 0.00 0.00 0.00 0.00
Finland 0.00 0.00 0.00 0.13 0.19 0.00 0.00 0.00 0.02 0.00 0.00 0.03
France 0.05 0.09 0.09 0.08 0.16 0.12 0.14 0.07 0.29 0.17 0.13 0.13
Germany 0.05 0.04 0.05 0.05 0.06 0.05 0.10 0.11 0.10 0.11 0.11 0.08
Greece 0.04 0.01 0.00 0.00 0.00 0.02 0.02 0.05 0.03 0.03 0.04 0.02
Hungary 0.01 0.01 0.01 0.04 0.04 0.02 0.03 0.04 0.07 0.05 0.11 0.04
Ireland 0.00 0.00 0.00 0.01 0.00 0.00 0.01 0.00 0.00 0.00 0.00 0.00
Italy 0.16 0.18 0.22 0.14 0.39 0.37 0.32 0.29 0.23 0.26 0.19 0.25
Latvia NT 0.00 0.00 0.00 NT NT 0.00 0.00 0.00 0.00 0.00 0.00
Lithuania 0.00 0.00 0.00 NT 0.00 0.00 0.00 0.00 0.00 0.00 0.00 0.00
Luxembourg 0.00 0.00 0.00 0.00 0.00 0.00 0.00 0.00 0.00 0.00 0.00 0.00
Malta NT 0.00 NT NT NT NT 0.00 0.00 0.00 0.00 0.00 0.00
Netherlands 0.02 0.04 0.04 0.03 0.00 0.02 0.02 0.02 0.02 0.03 0.04 0.03
Poland 0.00 0.00 0.00 0.01 0.01 0.00 0.01 0.01 0.01 0.02 0.02 0.01
Portugal 0.04 0.01 0.03 0.06 0.00 0.00 0.00 0.00 0.00 0.01 0.00 0.01
Romania 0.00 0.00 0.00 0.00 0.00 0.00 0.07 0.06 0.16 0.03 0.08 0.04
Slovakia 0.00 0.07 0.02 0.00 0.01 0.00 0.01 0.09 0.01 0.02 0.03 0.02
Slovenia 0.15 0.18 0.17 0.13 0.15 0.15 0.16 0.18 0.19 0.16 0.16 0.16
Spain 0.00 0.01 0.00 0.00 0.03 0.04 0.02 0.01 0.00 0.01 0.00 0.01
Sweden 0.07 0.13 0.10 0.10 0.10 0.02 0.05 0.03 0.02 0.08 0.10 0.07
United Kingdom
0.02 0.01 0.03 0.02 0.02 0.03 0.04 0.02 0.04 0.04 0.05 0.03
Legend: NT – no agri-food trade between BiH and the EU member country in the given year.
Source: Authors‘ own calculation.
ANALYSIS OF INTRA-INDUSTRY TRADE IN AGRI-FOOD PRODUCTS BETWEEN BOSNIA AND HERZEGOVINA AND THE EUROPEAN UNION
67SOUTH EAST EUROPEAN JOURNAL OF ECONOMICS AND BUSINESS, VOLUME 16 (2) 2021
Table 3A. Horizontal IIT in BiH agri-food trade with the EU member countries
2008 2009 2010 2011 2012 2013 2014 2015 2016 2017 2018 Average
Austria 0.01 0.10 0.00 0.01 0.05 0.07 0.01 0.04 0.00 0.01 0.00 0.03
Belgium 0.00 0.00 0.00 0.00 0.04 0.02 0.00 0.01 0.00 0.00 0.00 0.01
Bulgaria 0.00 0.00 0.00 0.00 0.00 0.00 0.00 0.00 0.00 0.01 0.02 0.00
Croatia 0.10 0.09 0.06 0.08 0.10 0.03 0.05 0.00 0.00 0.03 0.06 0.05
Cyprus 0.00 0.11 0.00 0.00 0.00 0.20 0.00 0.00 0.00 0.00 0.00 0.03
Czech Republic 0.06 0.00 0.00 0.00 0.00 0.00 0.00 0.04 0.07 0.00 0.00 0.02
Denmark 0.00 0.00 0.00 0.00 0.00 0.00 0.00 0.00 0.00 0.00 0.00 0.00
Estonia 0.00 0.00 0.00 0.00 0.00 NT 0.00 0.00 0.00 0.00 0.00 0.00
Finland 0.00 0.00 0.00 0.00 0.00 0.00 0.00 0.00 0.00 0.00 0.00 0.00
France 0.01 0.00 0.01 0.00 0.01 0.00 0.00 0.01 0.01 0.03 0.05 0.01
Germany 0.00 0.01 0.00 0.00 0.01 0.02 0.00 0.01 0.01 0.00 0.00 0.01
Greece 0.00 0.04 0.02 0.00 0.00 0.05 0.00 0.00 0.00 0.00 0.00 0.01
Hungary 0.00 0.02 0.01 0.00 0.00 0.02 0.00 0.00 0.00 0.00 0.00 0.00
Ireland 0.00 0.00 0.00 0.00 0.00 0.00 0.00 0.00 0.00 0.00 0.00 0.00
Italy 0.20 0.21 0.18 0.20 0.00 0.00 0.00 0.00 0.00 0.00 0.00 0.07
Latvia NT 0.00 0.00 0.00 NT NT 0.00 0.00 0.00 0.00 0.00 0.00
Lithuania 0.00 0.00 0.00 NT 0.00 0.00 0.00 0.00 0.00 0.00 0.00 0.00
Luxembourg 0.00 0.00 0.00 0.00 0.00 0.00 0.00 0.00 0.00 0.00 0.00 0.00
Malta NT 0.00 NT NT NT NT 0.00 0.00 0.00 0.00 0.00 0.00
Netherlands 0.02 0.00 0.00 0.00 0.01 0.00 0.00 0.00 0.01 0.00 0.00 0.00
Poland 0.00 0.00 0.00 0.00 0.00 0.00 0.01 0.00 0.00 0.00 0.00 0.00
Portugal 0.00 0.00 0.00 0.00 0.00 0.00 0.00 0.00 0.00 0.00 0.00 0.00
Romania 0.00 0.00 0.00 0.00 0.00 0.00 0.00 0.01 0.00 0.00 0.01 0.00
Slovakia 0.00 0.00 0.00 0.00 0.00 0.03 0.00 0.00 0.00 0.00 0.00 0.00
Slovenia 0.00 0.03 0.02 0.03 0.04 0.02 0.02 0.02 0.00 0.00 0.01 0.02
Spain 0.00 0.01 0.00 0.01 0.02 0.00 0.00 0.00 0.00 0.00 0.00 0.00
Sweden 0.00 0.00 0.01 0.00 0.00 0.04 0.03 0.04 0.08 0.00 0.00 0.02
United Kingdom
0.00 0.00 0.00 0.00 0.02 0.00 0.00 0.00 0.01 0.00 0.00 0.00
Legend: NT – no agri-food trade between BiH and the EU member country in the given year.
Source: Authors‘ own calculation.