analysis of marine ecology monitoring plan data from the...
TRANSCRIPT
E.ON Climate & Renewables
Analysis of Marine Ecology Monitoring Plan Data from the Robin Rigg Offshore
Wind Farm, Scotland (Operational Year 2)
Technical Report
Chapter 3: Benthic Ecology
Report: 1012206 Chapter Authors: Victoria Rutherford & Dr Jane Lancaster. Final Issue: 06/09/2013
Natural Power Consultants The Greenhouse Forrest Estate Dalry, Dumfries and Galloway DG15 7XS Tel: +44 (0) 1644 430 008

Report: 1012206
Analysis of Marine Ecology Monitoring Plan Data from the Robin Rigg Offshore Wind Farm,
Scotland (Operational Year 2) Technical report
Chapter 3: Benthic Ecology
Authors Victoria Rutherford & Dr Jane Lancaster 07/09/2012
Checked Dr Jane Lancaster 12/09/2012
Approved Dr Jane Lancaster 14/09/2012
Classification COMMERCIAL IN CONFIDENCE
Distribution Sally Shenton, E.ON Climate & Renewables
DISCLAIMER OF LIABILITY This report is prepared by us, THE NATURAL POWER CONSULTANTS LIMITED, (“NATURAL POWER”) for you, Shelly Shenton, E.ON Climate & Renewables (the “Client”) to assist the Client in analysing ecological data in connection with the Robin Rigg Offshore Wind Farm. It has been prepared to provide general information to assist the Client in its decision, and to outline some of the issues, which should be considered by the Client. It is not a substitute for the Client’s own investigation and analysis. No final decision should be taken based on the content of this report alone. This report should not to be copied, shown to or relied upon by any third parties without our express prior written consent. Nothing in this report is intended to or shall be deemed to create any right or benefit in favour of a third party. In compiling this report, we have relied on information supplied to us by the Client and by third parties. We accept no Liability for the completeness and/or veracity of the information supplied to us, nor for our conclusions or recommendations based on such information should it prove not to be complete or true. We have been asked to comment on analysis of ecological data collected as part of the MEMP, in accordance with the Client’s instructions as to the scope of this report. We have not commented on any other matter and exclude all Liability for any matters out with the said scope of this report. If you feel there are any matters on which you require additional or more detailed advice, we shall be glad to assist. We hereby disclaim any and all liability for any loss (including without limitation consequential or economic loss), injury, damage, costs and expenses whatsoever (“Liability”) incurred directly or indirectly by any person as a result of any person relying on this report except as expressly provided for above. In any case, our total aggregate Liability in connection with the provision of this report (whether by contract, under delict or tort, by statute or otherwise) shall be limited to the aggregate of fees (excluding any VAT) actually paid by the Client to us for provision of this report.
Revision History
Issue Date Changes
A 18/10/2012 Draft Issue
B 17/01/2013 First Issue
Final 06/09/2013 Final Issue
Client: Sally Shenton, E.ON Climate & Renewables
1012206 7
3. BENTHIC ECOLOGY
3.1. Introduction
Benthic fauna (benthos) is the community of organisms which live on, in, or near the seabed, which is also known as the benthic zone. In the context of this report the term benthos generally refers to macro-invertebrate infauna which are >1mm in size and live in the interstitial spaces of marine sediments.
The benthos is populated by organisms from a wide range of taxonomic groups, including (but not limited to) sponges (Porifera), anemones and hydroids (Cnidarians), worms (Polychaeta and Oligochaeta), clams and snails (Mollusca), crabs and shrimps (Crustacea), and starfish, brittle stars and urchins (Echinodermata). The dynamics of benthic communities are largely driven by physical processes such as seabed type, sediment size, and hydrodynamics. For example, sediment grain size is a strong predictor of benthic infauna composition. As a result of the high level of association between physical, chemical and biological processes, benthic communities are good indicators of anthropogenic and natural disturbances (Borja et al., 2003; Dauvin et al., 2007). Macrobenthic fauna possess life history traits and functions which lead to relatively rapid responses to a multitude of disturbances.
The construction and operation of an offshore wind farm has the potential to affect benthic communities in a number of ways, including sediment disturbance during construction, to alteration of hydrodynamic regimes during operation (Section 3.1.1). The response of benthic macrofauna to disturbance has been well characterised in peer-reviewed literature, with increases in abundance of small opportunistic fauna and decreases in larger more specialised fauna. The number of species and biomass decrease following a disturbance, and recovery periods can vary depending on local hydrodynamic regimes, recruitment processes and the relic community at the site.
The Environmental Statement for the Robin Rigg Offshore Wind Farm identified a number of potential impacts and assessed their likely significance. The purpose of post consent monitoring is to ascertain whether these predictions were correct.
3.1.1. Predicted impacts from ES
Habitat loss (construction phase)
During the EIA the biotope SS.SSa.IFiSa.NcirBat - Nephtys cirrosa and Bathyporeia spp. in infralittoral sand was the only one identified at the site of the proposed Robin Rigg Wind Farm installation. In total the loss of habitat to for N. cirrosa and Bathyporeia spp. was only 0.4% of the total area inside the wind farm. In addition other habitats (biotopes) identified around the wind farm site were described as comprising of fauna which is characterised by the Presence of short lived benthic species tolerant to sediment disturbance.
As a result the ES predicted that any impacts on the benthos in this area would not be significant and where any may occur they would be of a short duration.
The main impact predicted by laying the cable route was smothering from disturbed sediments, particularly through ploughing. However this area is naturally highly disturbed and turbid, with strong tidal currents and wave disturbance.
As a result the ES predicted that any sedimentation or disturbance suffered by fauna would be short in duration due to the highly dynamic nature of the area and therefore would not cause significant impacts on the benthos.
According to the Robin Rigg ES (Natural Power, 2002) the naturally highly dynamic nature of the seabed at the site of the proposed Robin Rigg Wind Farm led to predicted impacts during construction caused by minor habitat loss and sedimentation to be insignificant. Habitats in the area recover quickly from disturbance and the mobile and resistant nature of fauna result in rapid re-colonisation. Encrusting fauna, such as bryozoans and hydroids, attached to boulders, have a high resistance and therefore low sensitivity to such disturbance.

1012206 8
Habitat loss (operation)
It is predicted that there would be localised scour effects due to the diffraction and funnelling of waves around the turbine foundation bases. This local erosion or deposition around the bases should not be significant given the high level of natural bed movement. This is not expected to impact the already impoverished benthic community, which is adapted to extreme natural fluctuations in sediment stability.
As a result the ES predicted that there would be no changes to the hydrodynamic regime due to the cumulative effect of multiple turbines and therefore no effects to the wider benthic environment due to changes to hydrographic processes.
Toxic contamination
Multi-pile foundations would be protected by the provision of sacrificial anodes which would lead to the emission of aluminium into the water. Mono-pile foundations would use a sacrificial layer of steel, which would lead to the emission of steel into the surrounding environment. The ES predicted that:
Given the spacing of the structures and the high degree of water around the structures, and particularly the high currents and tidal range on the site, the impact on the site would be insignificant. No impacts to identified benthic communities are predicted.
Operational noise
With regards to noise and vibration, during the operation the underwater noise generated from the wind turbines may be in a similar frequency range as shipping vessels, wind and waves, and would therefore contribute to the background low frequency noise. As yet, little research has been conducted on the effects of noise and vibration on the benthic communities.
As a result the ES predicted that unless vibration of the wind turbines alters the physical composition of the seabed, there should be no significant impacts on benthic communities.
3.1.2. Benthic communities present in the Solway Firth
The Solway Firth extends from the Mull of Galloway in Scotland across to St. Bees Head on the Cumbrian coast of north-west England.
The Solway Firth estuary forms the third largest continuous area of sedimentary habitat in the country. Tidal currents in the estuary are moderately strong and levels of wave energy are high (Anon, 2000). The area where the wind farm is located is characteristic of this high wave exposure, comprising a highly dynamic environment with shifting subtidal sand banks. The subtidal area within the Solway Firth has been described as being dominated by mobile sediments brought into the area from the Irish Sea. The marine environment of the Solway Firth around the Robin Rigg Wind Farm is a dynamic one, particularly in relation to the seabed. The sand banks of the Solway Firth are well documented as being mobile, movements of which can result in a change of depth, particle size and subsequently the benthos at a particular location.
The inner Solway Firth, to the north-east of the Robin Rigg Wind Farm is designated as a European marine site (Special Area of Conservation (SAC), Special Protection Area (SPA), and a Ramsar site). This 44,000 ha area supports extensive intertidal mudflats and sand flats and extensive mobile subtidal sandbanks. These habitats form one of the largest continuous areas of sedimentary habitats in the UK and are of international importance. The mudflats and sand flats of the site provide important nursery and feeding grounds for commercial and recreational fish species, as well as providing a significant food source for birds (Anon, 2000). The subtidal sandbanks of the Inner Solway Firth are the best example of muddy sandbanks influenced by reduced salinity in the UK. The sublittoral sediment communities of the inner estuary is typically sparse but becomes richer towards the outer estuary due to the less extreme environmental conditions and a more varied substrate. These provide spawning and nursery grounds for fish, invertebrates, and shrimps (Anon, 2000).
Due to the status of the Inner Solway as a European Marine Site (EMS) there have been a number of studies describing the marine fauna and flora of the qualifying interest features. However, the intertidal and subtidal areas outside the EMS have been less well studied. Studies by Perkins and

1012206 9
Williams (1966) reveal the dominant fauna in sediments to be Nephtys cirrosa dominating in clean sands and Microphthalmus similis in more mixed sediments (with gravel). N. cirrosa and Bathyporeia elegans were also found to dominated fine to medium sands which were the predominant sediment type to the west of the Solway (Table 3.1).
Table 3.1: Characteristic species of the Solway sublittoral sand flats (Perkins and Williams, 1966).
Species Characteristic sediment
Mactra corallina Fine sediments
Donax vittatus Fine sediments
Nephtys spp Medium sands
Nucula sulcata Muddy sands
Abra albida Muddy sands
Angulus tenuis Muddy sands
Cutts and Hemingway (1996) conducted a broad scale habitat mapping project of both the intertidal and subtidal areas of the Solway Firth in the region of the wind farm. Using a combination of Roxann, video ground-truthing and grab sampling, the sublittoral habitat was seen to be dominated by fine to medium sands with areas of coarser sediment existing in the channels. The areas of fine and medium sands were found to have low species diversity dominated by N. cirrosa, Magelona mirabilis and Bathyporeia pelagica at abundances of approximately 20-25 individuals/0.1m
2. A later study
undertaken by Axelsson et al., (2006) also found overall species diversity and abundance to be low throughout the Solway Firth. Towards the west and the head of the Solway Firth other species present include the bivalves Angulus fabula, Spisula subtruncata and Angulus tenuis, and the juvenile horse mussel Modiolus modiolus. With increasing depth, sediments become more stable and are characterised by brittlestars and a richer infauna of polychaete and bivalves (Perkins and Williams, 1966).
More detailed information on the benthic ecology of the Solway around the Robin Rigg was obtained from the ES baseline survey comprising of 113 grab sampling stations (Section 3.2.1) conducted as part of the Environmental Impact Assessment (EIA) for the Robin Rigg Wind Farm during 2001-2002. Sampling stations throughout the baseline survey area were consistently represented by a low number of species and individuals. It was concluded that this low level of biodiversity was shaped by the unstable nature of the mobile sand banks. The fauna present is characterised by the presence of short lived benthic species tolerant to sediment disturbance. The fauna was dominated by the polychaete N. cirrosa, and the amphipod B. elegans and was reflective of the biotope. IGS.Ncir.Bat. A full list of the biotopes identified during the baseline is presented (Table 3.2). Samples collected along the cable route tended to be more diverse as a result of a lower energy, and thus a more stable system, as well as the presence of increased levels of hard substrate (e.g. boulders).
Table 3.2: Biotopes present in the baseline EIA survey 2001-2002 (Biotope descriptions as per Connor et al., 2004)
Biotope Name Description Location
SS.IGS.FaS (new code SS.SCS.ICS)
Infralittoral coarse sediment
Moderately exposed habitats with coarse sand, gravely sand, shingle and gravel in the infralittoral, are subject to disturbance by tidal steams and wave action. Such habitats found on the open coast or in tide-swept marine inlets are characterised by a robust fauna of infaunal polychaetes such as Chaetozone setosa and Lanice conchilega, cumacean crustacea such
This is the predominant biotope present throughout the Robin Rigg survey area and along the shallower elements of the cable route and can be sub-divided into IGS.NcirBat for the whole of the Robin Rigg survey area. May grade into IGS.Mob

1012206 10
Biotope Name Description Location
as Iphinoe trispinosa and Diastylis bradyi, and venerid bivalves.
in areas of high sediment disturbance.
SS.IGS.FaS.NcirBat (new code SS.SSa.IFiSa.NcirBat)
Nephtys cirrosa and Bathyporeia spp. in infralittoral sand
Well-sorted medium and fine sands characterised by N. cirrosa and Bathyporeia spp. (and sometimes Pontocrates spp.) which occur in the shallow sublittoral to at least 30 m depth. This biotope occurs in sediments subject to physical disturbance, as a result of wave action (and occasionally strong tidal streams). The magelonid polychaete Magelona mirabilis may be frequent in this biotope in more sheltered, less tide swept areas whilst in coarser sediments the opportunistic polychaete Chaetozone setosa may be commonly found. The faunal diversity of this biotope is considerably reduced compared to less disturbed biotopes (such as FfabMag) and for the most part consists of the more actively-swimming amphipods. Sand eels Ammodytes sp. may occasionally be observed in association with this biotope (and others) and spionid polychaetes such as Spio filicornis and S. martinensis may also be Present. Occasional Lanice conchilega may be visible at the sediment surface.
SS.IGS.FaS.Mob (new code SS.SSa.IFiSa.IMoSa)
Infralittoral mobile clean sand with sparse fauna
Medium to fine sandy sediment in shallow water, often formed into dunes, on exposed or tide-swept coasts often contains very little infauna due to the mobility of the substratum. Some opportunistic populations of infaunal amphipods may occur, particularly in less mobile examples in conjunction with low numbers of mysids such as Gastrosaccus spinifer, the polychaete N. cirrosa and the isopod Eurydice pulchra. Sand eels Ammodytes sp. may occasionally be observed in association with this biotope (and others). This biotope is more mobile than SSA.NcirBat and may be closely related to LSa.BarSa on the shore. Common epifaunal species such as Pagurus bernhardus, Liocarcinus depurator, Carcinus maenas and Asterias rubens may be encountered and are the most conspicuous
1012206 11
Biotope Name Description Location
species Present.
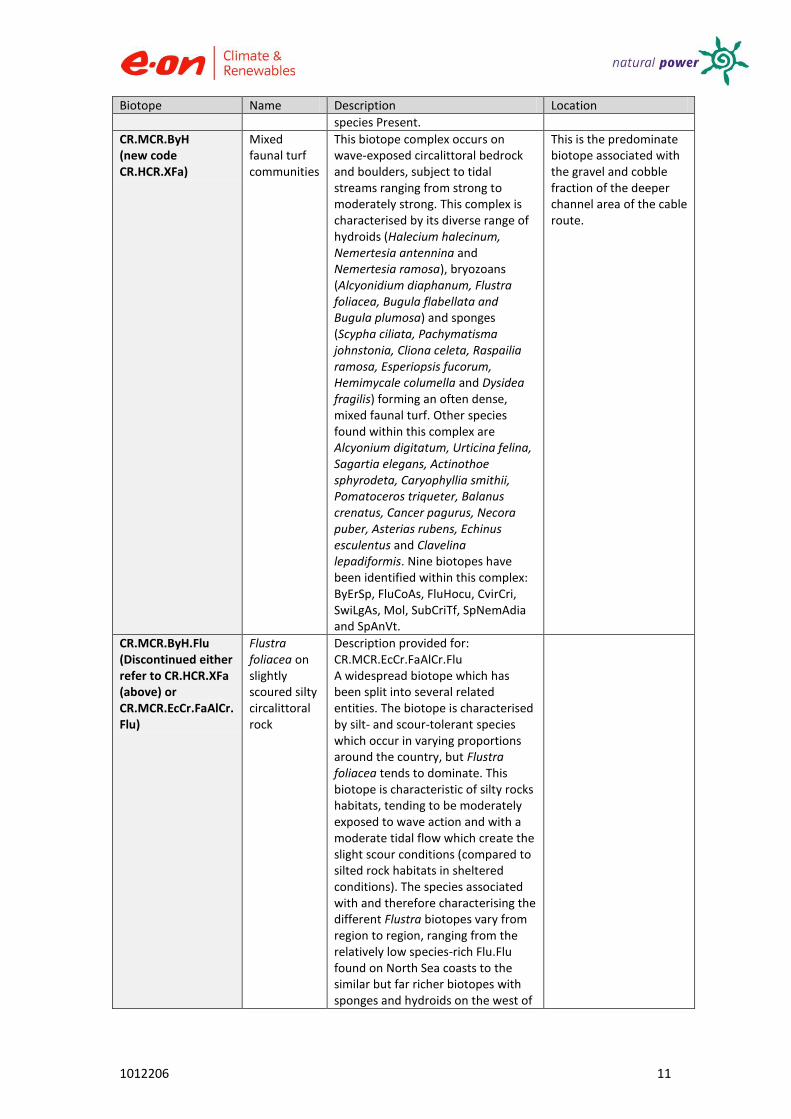
CR.MCR.ByH (new code CR.HCR.XFa)
Mixed faunal turf communities
This biotope complex occurs on wave-exposed circalittoral bedrock and boulders, subject to tidal streams ranging from strong to moderately strong. This complex is characterised by its diverse range of hydroids (Halecium halecinum, Nemertesia antennina and Nemertesia ramosa), bryozoans (Alcyonidium diaphanum, Flustra foliacea, Bugula flabellata and Bugula plumosa) and sponges (Scypha ciliata, Pachymatisma johnstonia, Cliona celeta, Raspailia ramosa, Esperiopsis fucorum, Hemimycale columella and Dysidea fragilis) forming an often dense, mixed faunal turf. Other species found within this complex are Alcyonium digitatum, Urticina felina, Sagartia elegans, Actinothoe sphyrodeta, Caryophyllia smithii, Pomatoceros triqueter, Balanus crenatus, Cancer pagurus, Necora puber, Asterias rubens, Echinus esculentus and Clavelina lepadiformis. Nine biotopes have been identified within this complex: ByErSp, FluCoAs, FluHocu, CvirCri, SwiLgAs, Mol, SubCriTf, SpNemAdia and SpAnVt.
This is the predominate biotope associated with the gravel and cobble fraction of the deeper channel area of the cable route.
CR.MCR.ByH.Flu (Discontinued either refer to CR.HCR.XFa (above) or CR.MCR.EcCr.FaAlCr.Flu)
Flustra foliacea on slightly scoured silty circalittoral rock
Description provided for: CR.MCR.EcCr.FaAlCr.Flu A widespread biotope which has been split into several related entities. The biotope is characterised by silt- and scour-tolerant species which occur in varying proportions around the country, but Flustra foliacea tends to dominate. This biotope is characteristic of silty rocks habitats, tending to be moderately exposed to wave action and with a moderate tidal flow which create the slight scour conditions (compared to silted rock habitats in sheltered conditions). The species associated with and therefore characterising the different Flustra biotopes vary from region to region, ranging from the relatively low species-rich Flu.Flu found on North Sea coasts to the similar but far richer biotopes with sponges and hydroids on the west of

1012206 12
Biotope Name Description Location
Britain and Irish Sea coasts (Flu.HbyS). There are also several other related biotopes: these include the Uricina (Urt.Urt) and Ciocalypta (Urt.Cio) biotopes which occur at rock-sediment interfaces; ascidian-doiminated biotopes with Flustra (StoPaur) and several other biotopes characterised by other slight scour-tolerant or turbid-water species such as Sabellaria spinulosa which include Flustra (Sspi and MolPol.Sab) and Alcyonidium diaphanum (SnemAdia). Only use this biotope if records do not fit into other categories.
SS.IMS.FaMS (new code SS.SSa.IMuSa)
Infralittoral muddy sand
Non-cohesive muddy sand (with 5% to 20% silt/clay) in the infralittoral zone, extending from the extreme lower shore down to more stable circalittoral zone at about 15-20 m. The habitat supports a variety of animal-dominated communities, particularly polychaetes (Magelona mirabilis, Spiophanes bombyx and Chaetozone setosa), bivalves (Fabulina fibula* and Chamelea gallina) and the urchin Echinocardium cordatum.
This biotope is associated with siltier sediments along the cable route
*NOTE Fabulina fibula is now renamed Angulus fabula, however this table presents the biotope description (Connor et al., 2004) hence Fabulina fibula is used.
3.1.3. Temporal variation in benthic communities
In order to put any monitoring results of the potential impact of the offshore wind farm into context, it necessary to understand variation in benthic faunal assemblages over time, as benthic infaunal communities are known to exhibit cyclical variations (e.g. Gray and Elliott 2009). In addition other human activities such as fishing or our influence on climate also have long term impacts on marine communities, which cannot be directly related to a point source of disturbance such as a wind farm.
Gray and Elliott (2009) identified three general patterns of temporal variability in marine benthic systems. Some species tend to maintain population numbers relatively constant through time and may be said to be persistent; many organisms undergo repeatable cycles, which may be annual or longer term with periods from six to seven years to >30 years; there may also be changes in response to longer-term processes which may or may not be cyclical such as variation in the North Atlantic Oscillation. However, insufficient information is available to make definitive assertions about the patterns and Gray and Elliott (2009) go on to say ‘In fact, so little data is available on long-term cycles and variations in recruitment that the patterns described above may in time prove not to be typical at all. Understanding recruitment variability and the factors causing that variability is one of the central problems in understanding long-term fluctuations in benthic communities.’ Thus repeat surveys of the same place might detect very similar assemblages, but they will not be identical. They might detect very different assemblages which form part of a natural successional cycle (e.g. mussels, barnacles or algae, on rocky shores) (Crowe et al., 2011).
Relatively few studies have characterised the long term dynamics of benthic biodiversity. Patterns of benthic variation have been associated with climatic factors such as the North Atlantic Oscillation, local factors related to recruitment and fluctuations in organic matter to the sea floor (Frid et al.,

1012206 13
2009a & b). However none of the relationships identified by Frid et al., (2009b) between fauna and environmental variables held true over the entire sampling time (up to 36 years) and decadal shifts associated with various drivers were observed in community assemblages. Furthermore, variability in community structures which were associated with anthropogenic activities, such as fishing, were not clear cut, and environmental factors were just as influential (Frid et al., 2009b).

1012206 14
3.2. Survey Methods
Benthic surveys have been undertaken both offshore on the site and along the cable route, as well as intertidally at the cable landing point from baseline through to the operational phase of the offshore wind farm (Table 3.3). As this report relates to the offshore environment only, the results of the intertidal survey are not included or discussed as a separate report for intertidal surveys was issued.
EIA baseline surveys
Marenco Ltd was commissioned in 2001 by Solway Offshore LTD and Offshore Energy Resources to assess the like impacts of the development on benthic flora and fauna as part of the EIA process.
Samples were collected using Day and Hamon Grabs from a total of 113 stations within and adjacent to the perimeter of the proposed wind farm development area during October 2001 and February 2002 (see Figure 3.1).
Samples were also collected at five additional sites to the north and northwest of the main development area during February 2002 by Solenvo Marine Environmental Consultants.
These additional surveys were undertaken in order to provide information on possible food sources for common scoters, which were found to be feeding in these areas.
As the location of the cable route had not been finalised at this stage, no surveys of this area were undertaken.
MEMP monitoring
Amec Environment and Infrastructure Ltd (previously Entec UK Ltd) were contracted by NPC since July 2007 to undertake post-EIA ecology benthic monitoring.
Bi-annual benthic surveys were conducted using a day grab throughout the pre-construction and construction phases on both the cable route and wind farm site (generally in the spring and autumn).
Post-construction: annual surveys for two years.
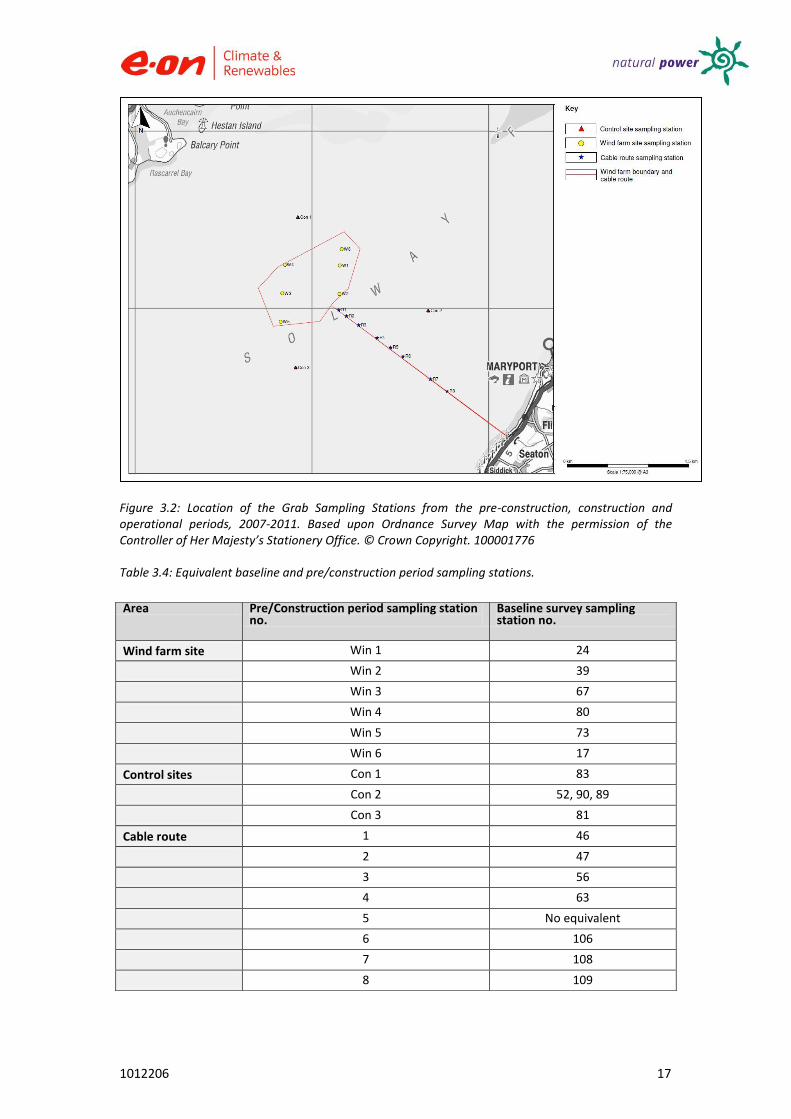
Samples were collected from six stations within the site and three from outside the development area. All sampling (see Figure 3.2 and Table 3.4).
For the cable route, sampling was conducted at eight stations along the cable route.
Locations of baseline sampling stations and the FEPA monitoring requirements are illustrated within this report (see Figure 3.1 and Table 3.4).

1012206 15
Table 3.3: Summary of when benthic surveys were conducted. WFS = Wind Farm Site; CR = Cable Route; Light blue = baseline/EIA; Orange = pre-construction; Purple = Construction; Green = Operation.
Benthic Jan Feb Mar Apr May Jun Jul Aug Sep Oct Nov Dec
2001 Benthic Benthic Benthic
2002 Benthic Benthic
2003
2004
2005 Intertidal
2006
2007 Benthic (WFS)
Benthic
(CR)
2008 Benthic (WFS)
Intertidal
Benthic (CR)
Benthic
(WFS/CR)
2009 Intertidal Benthic
(WFS/CR) Intertidal
2010 Intertidal Benthic
(WFS/CR) Intertidal Intertidal
2011 Intertidal Intertidal Intertidal Benthic
(WFS/CR) Intertidal

1012206 16
Figure 3.1: Location of Grab Sampling Stations from the Baseline Surveys in 2001-2002.
1012206 17
Figure 3.2: Location of the Grab Sampling Stations from the pre-construction, construction and operational periods, 2007-2011. Based upon Ordnance Survey Map with the permission of the Controller of Her Majesty’s Stationery Office. © Crown Copyright. 100001776
Table 3.4: Equivalent baseline and pre/construction period sampling stations.
Area Pre/Construction period sampling station no.
Baseline survey sampling station no.
Wind farm site Win 1 24
Win 2 39
Win 3 67
Win 4 80
Win 5 73
Win 6 17
Control sites Con 1 83
Con 2 52, 90, 89
Con 3 81
Cable route 1 46
2 47
3 56
4 63
5 No equivalent
6 106
7 108
8 109

1012206 18
3.2.1. Grab sample methodology
Benthic infauna samples were recovered using a 0.1 m2 Day Grab. The baseline survey was carried out
by Marenco Ltd using the FV Boy Tom and by Amec E & I UK Ltd using the FP Solway Protector for the post consent surveys.
The time and location of each grab was recorded using the vessel’s Global Positioning System (GPS). Depth was measured using the vessel’s depth sounder and temperature was measured by the vessel’s in-built thermometer. Surface water salinity was measured using a hand-held refractometer and turbidity was measured using a Secchi disc. A visual assessment of sediment type in each grab sample was made and a sample of sediment from the first grab sample was retained for particle size analysis (PSA) and Total Organic Carbon (TOC) analysis. The sediment from each grab sample was sieved using a 1 mm mesh and the fauna retained in the sieve were preserved in 5% Formaldehyde.
During the baseline survey triplicate samples were collected. There was a large degree of similarity between replicate samples obtained in terms of both sediment and benthos characteristics over the survey area. As a result, following consultation with the Robin Rigg Monitoring Group, only duplicate grab samples during pre-construction and construction phase monitoring were required. Taxonomic identification of the macro-faunal species found in one replicate from each sampling station was undertaken by Identichaete, while the PSA and TOC analysis on the sediment samples was undertaken by Northumbrian Water Scientific Services
1.
1 United Kingdom Accreditation Service (UKAS) accredited laboratory

1012206 19
3.3. Statistical Analysis Methodology
In the baseline sampling period, 113 grab sampling stations were surveyed, however many of these were quite far from the wind farm site and not near the FEPA monitoring stations. Therefore, only baseline sampling stations in the vicinity of the wind farm, cable route and control stations were used (representing a total of 18 out of 113; (see Figure 3.2 and Table 3.4).
The general purpose of performing statistical analyses is to determine whether there were differences resulting from the construction and operation of the Robin Rigg Offshore Wind Farm. Therefore the Null Hypothesis H0 states: “there is no difference in benthic invertebrate community composition across different [year/construction period/season/area]”.
3.3.1. Benthic infauna analysis
Analysis rational
Initially all data from all years/sampling periods, seasons and areas were combined in order to assess if there were significant differences between these variables. ANOSIM analyses were used initially to look at the variation in the community structures as a whole. These were further justified by performing PERMANOVA+ analyses to provide more detail and in-depth explanations as to where significant differences laid. These are illustrated by MDS plots (Section 3.4.1).
Due to the unbalanced nature of the of MEMP survey requirements, whereby some years sampling occurred biannually, others quarterly etc, additional analyses were also performed looking at the sampling periods in more detail using PERMANOVA+. Data from each year was compared season by season. Direct comparisons were made between the community structures throughout specific sampling periods using ANOVA and PERMANOVA+ analyses as before. This provided more in depth justification as to where differences occurred and how differences could be accounted.
Univariate methods were also used to analyse the data. Species diversity indices were calculated to determine how diverse the wind farm and cable route area is each year, and whether the diversity has changed over the years. There are a number of diversity indices available and for the purpose of this report, those most frequently used in literature have been adopted and calculated.
The diversity indices were analysed using PRIMER (Clarke and Gorley, 2006) to determine if there was any significance between the construction periods. The H0 states that there is no difference between the construction periods. Statistical significance was chosen at p ≤ 0.05. PRIMER v6 was used to calculate the species diversity indices.
For PSA BEST analysis was used to find the ‘best’ match between the multivariate among-sample patterns of an assemblage and that from environmental variables associated with those samples.
Benthic infauna and PSA results were used as the basis for biotope identification (Connor et al., 2004). Additional information on the epibenthos from the non-migratory fish survey (Section 4) was also consulted in order to confirm the biotope. Other factors used to aid the classification are location, exposure and other general area information such as from the epibenthic survey. Clusters present from the hierarchical clustering diagrams were grouped and coupled with PSA and BIOEnv, and SIMPER analyses enabled the designation of biotopes to each cluster. The biotopes identified were then mapped.
Many different statistical methods were used for this analysis and it should be noted that results may be affected due to the fact a small number of sampling stations were sampled between results obtained. Initial analysis with ANOSIM, on some occasions, revealed no statistical significances, however further analysis with PERMANOVA+, which is a stronger test which extends the resemblance-based methods of PRIMER and allows the analysis of more complex sampling structures, experimental designs and models (Anderson et al., 2008), produced statistically significant results. It can be concluded, PERMANOVA+ results are more accurate and were taken to be correct as the test is more rigorous and takes into account more of the data.
1012206 20
More detail of individual statistical methods is provided below.
All statistical analysis was undertaken using the statistical package PRIMER v6 and Microsoft Excel. Initially data were sorted and stored in Excel spread sheets with all species counts and physical data for all years. All species names were checked and revisions made for new taxonomic classifications. Data were sorted by abundance to enable simple observations to be made. This prepared the data for the more in depth statistical analyses performed.
Multivariate statistics
All analysis was based on a Bray-Curtis similarity index. As the raw data consisted of sparse faunal abundance and species richness, with the odd high abundance of one or two species, square root transformations were applied. Dummy Variables were added to reduce the influence of outliers and reduced the impact zeros have on the dataset. Statistical tests used are non-metric Multidimensional Scaling (MDS) ordinations, Analysis of Similarities (ANOSIM), Species Contributions (SIMPER), PERMANOVA+ and hierarchical clustering. A more in-depth explanation of each test is given below.
MDS Ordination MDS plots were produced to examine the similarity of sites/samples in terms of their species composition. The MDS analysis plots a measure of similarity between the samples into two or more dimensional spaces so that the distance between objects corresponds closely to their input similarities. Simply stated, if sample one has a higher similarity to sample two than it does to sample three then sample one will be placed closer on the map to sample two than to sample three. The stress value indicates how faithfully the high-dimensional relationships among the samples are represented. The lower the stress value, the less distortion occurs.
Hierarchical Clustering Cluster analysis aims to find “natural groupings” of samples such that samples within a group are more similar to each other, generally, than samples in different groups. The most commonly used clustering techniques are hierarchical agglomerative methods. These take a similarity matrix (Bray-Curtis in this instance) and successively fuse the samples into groups and the groups into larger clusters, starting with the highest mutual similarities, and then gradually lowering the similarity level at which groups are formed. The process ends with a single cluster classification.
ANOSIM ANOSIM was used to determine whether there was a difference in benthic invertebrate community/composition between the survey years/construction phases. ANOSIM is a simple non-parametric permutation procedure applied to a similarity matrix underlying the ordination, or classification, or samples. It works by using a null hypothesis (H0) which states that there is no difference in benthic invertebrate community/composition across the survey years/construction phases. ANOSIM calculates an R value that is between -1 and +1, although normally the R value lies between 0 and 1, with R values of 1 denoting complete differences exist between groups and 0 denoting no difference is observed between groups. If R is approximately zero then the H0 is accepted. If R equals 1 then the H0 is rejected. R will usually fall between 0 and 1 indicating some degree of discrimination between sites. The R value itself is a useful comparative measure of the degree of separation of sites, and its value is at least as important as its statistical significance. Statistical significance was chosen at p ≤ 0.05. If the value of R is significant, you can conclude that there is evidence that the samples within groups are more similar than would be expected by chance.
SIMPER SIMPER (similarity percentages) analysis looks at the role of individual species in contributing to the separation between two groups of samples, or the closeness of samples within a group. SIMPER was used to determine the main species contributing to the groups identified during the cluster analysis, thus aiding in determining the biotope. Average Bray-Curtis dissimilarity was used between all pairs of samples, and percentage contributions from each species were placed in decreasing order of contribution. The species that cumulatively made up 90% of the samples were used.
BIOENV The BIOENV procedure identifies the best combination of environmental variables at increasing levels of complexity and correlates these with patterns in the biotic data. This is achieved by producing a Euclidean distance dissimilarity matrix for the environmental variables and maximises the rank

1012206 21
correlation between the community Bray-Curtis dissimilarity matrix. The Spearman rank correlation coefficient is then presented for the subset of environmental variables that best explains the patterns in the multivariate community data.
PERMANOVA+ PERMANOVA+ is a recent (2008) add-on package to the main PRIMER v6 programme, which extends the resemblance-based methods of PRIMER and allows the analysis of more complex sampling structures, experimental designs and models (Anderson et al., 2008).
There are two essential differences between ANOSIM and PERMANOVA. Firstly, ANOSIM ranks the values before proceeding with the analysis, and is consistent with the philosophy of non-metric MDS ordination. PERMANOVA is a semi-parametric (permutation-based) analysis of the data, where the information of interest is in the dissimilarity values themselves. The second essential difference is in the construction of the test statistic. ANOSIM uses the R statistic with a scale from -1 to +1, and it is possible to interpret the R statistic directly as an absolute measure of the strength of the difference between the groups. It is also comparable between different studies. PERMANOVA uses the pseudo-F statistic, which is reliant on the degrees of freedom of the analysis, so it cannot necessarily be compared across studies. For example, a pseudo-F value of 2 will generally provide much stronger evidence against the null hypothesis if the residual degrees of freedom are 98 than if they are 5.
As with ANOSIM, the H0 for PERMANOVA analysis is that there is no difference in benthic invertebrate community/composition across the survey years/construction phases.
Univariate statistics
There are a variety of different, single number statistics that can be used as measures of some attribute of community structure in a sample, all labelled as species diversity indices. The main aim of species diversity indices is to reduce the multivariate complexity of the data into a single index, which can then be handled statistically by univariate analysis.
Species diversity indices used in this report are:
Species richness (S): the number of species present in an ecosystem, with no indication of relative abundances.
Number of individuals (N): total number of individuals counted.
Margalef’s indexes (d): a measure of the number of species present for a given number of individuals. The higher the index, the greater the diversity.
Pielou’s evenness (J’): shows how equally the individuals in a population are distributed. J’ = 0 – 1. The less variation in the samples, the higher J’ is.
Shannon-Wiener index (H’log2): measures the uncertainty of being able to predict the identity of the next species withdrawn from a sample (like picking lottery balls). H’ = 1.2 – 7.0 (approximately). The higher the index the greater the diversity.
Simpson’s indexes (1-λ): a measure of the probability of choosing two individuals from a sample that are different species. D = 0 (minimum diversity) – 1.0 (maximum diversity).
1012206 22
3.4. Results
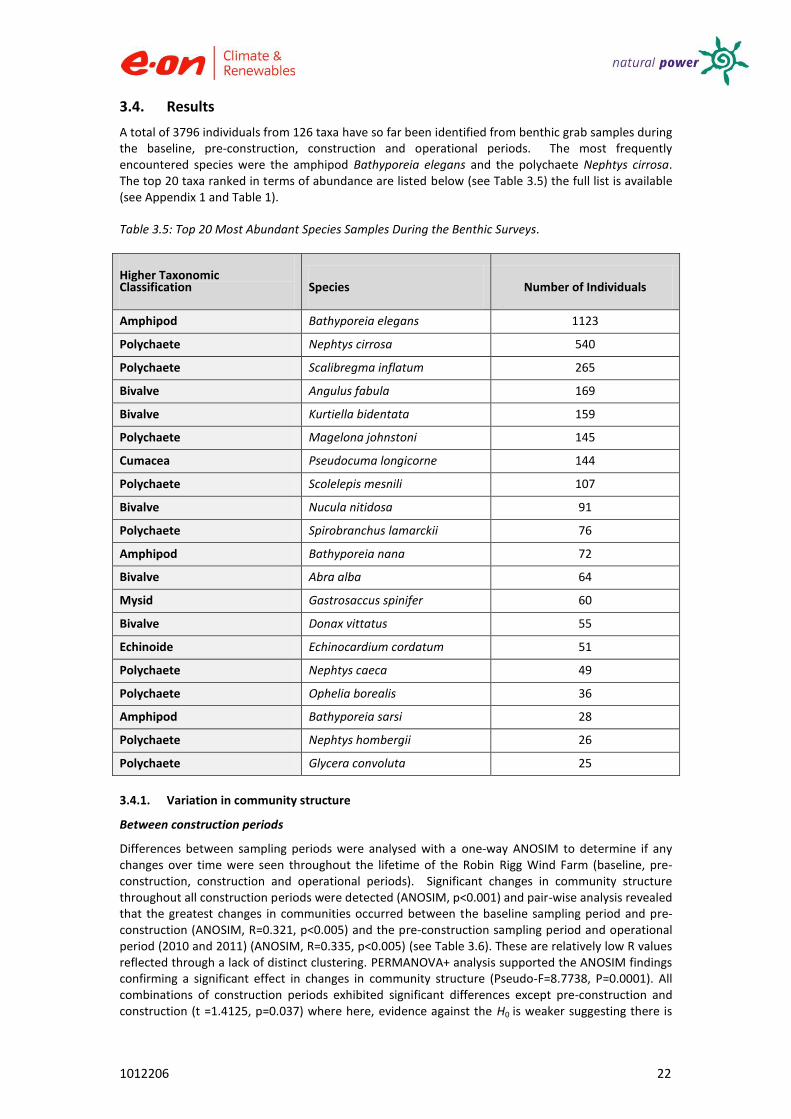
A total of 3796 individuals from 126 taxa have so far been identified from benthic grab samples during the baseline, pre-construction, construction and operational periods. The most frequently encountered species were the amphipod Bathyporeia elegans and the polychaete Nephtys cirrosa. The top 20 taxa ranked in terms of abundance are listed below (see Table 3.5) the full list is available (see Appendix 1 and Table 1).
Table 3.5: Top 20 Most Abundant Species Samples During the Benthic Surveys.
Higher Taxonomic Classification Species Number of Individuals
Amphipod Bathyporeia elegans 1123
Polychaete Nephtys cirrosa 540
Polychaete Scalibregma inflatum 265
Bivalve Angulus fabula 169
Bivalve Kurtiella bidentata 159
Polychaete Magelona johnstoni 145
Cumacea Pseudocuma longicorne 144
Polychaete Scolelepis mesnili 107
Bivalve Nucula nitidosa 91
Polychaete Spirobranchus lamarckii 76
Amphipod Bathyporeia nana 72
Bivalve Abra alba 64
Mysid Gastrosaccus spinifer 60
Bivalve Donax vittatus 55
Echinoide Echinocardium cordatum 51
Polychaete Nephtys caeca 49
Polychaete Ophelia borealis 36
Amphipod Bathyporeia sarsi 28
Polychaete Nephtys hombergii 26
Polychaete Glycera convoluta 25
3.4.1. Variation in community structure
Between construction periods
Differences between sampling periods were analysed with a one-way ANOSIM to determine if any changes over time were seen throughout the lifetime of the Robin Rigg Wind Farm (baseline, pre-construction, construction and operational periods). Significant changes in community structure throughout all construction periods were detected (ANOSIM, p<0.001) and pair-wise analysis revealed that the greatest changes in communities occurred between the baseline sampling period and pre-construction (ANOSIM, R=0.321, p<0.005) and the pre-construction sampling period and operational period (2010 and 2011) (ANOSIM, R=0.335, p<0.005) (see Table 3.6). These are relatively low R values reflected through a lack of distinct clustering. PERMANOVA+ analysis supported the ANOSIM findings confirming a significant effect in changes in community structure (Pseudo-F=8.7738, P=0.0001). All combinations of construction periods exhibited significant differences except pre-construction and construction (t =1.4125, p=0.037) where here, evidence against the H0 is weaker suggesting there is

1012206 23
little or no difference in benthic invertebrate community composition across the two construction periods.
The above described patterns can be seen in the MDS plot (see Figure 3.3) where some slight clustering is observable, however many of the samples taken from the different periods are intermingled throughout. The baseline and pre-construction samples are clustered slightly to the left and right respectively, and the pre-construction and operational slightly to the right and left respectively.
Table 3.6: Pair-wise ANOSIM results for Period (Significant results (%) and R values signifying groups differ in community structure (R>0.1) in red).
Period ANOSIM results
Significance Level (%) R statistic (where R = 1 denotes groups differ completely in community composition)
Baseline – Pre-Construction 0.1 0.321
Baseline – Construction 0.1 0.32
Baseline – Operational 2.4 0.162
Pre-Construction – Construction
37.7 0.009
Pre-Construction – Operational 0.1 0.335
Construction – Operational 0.1 0.278
Figure 3.3: Non-metric MDS plot of benthic abundance (square root transformed and dummy variable added) for each sampling period.
Over time
Differences were also examined over time (i.e. year) as some construction periods stretched over several years. Overall a significant variation in community structure was observed over time (ANOSIM, R=0.24 p<0.01). Pair-wise analysis revealed the greatest changes in communities occurred in 2002 and 2009 (ANOSIM, R=0.463, p<0.01), and, between 2009 and 2010 (R=0.54, p<0.01) (see Table 3.7). All
1012206 24
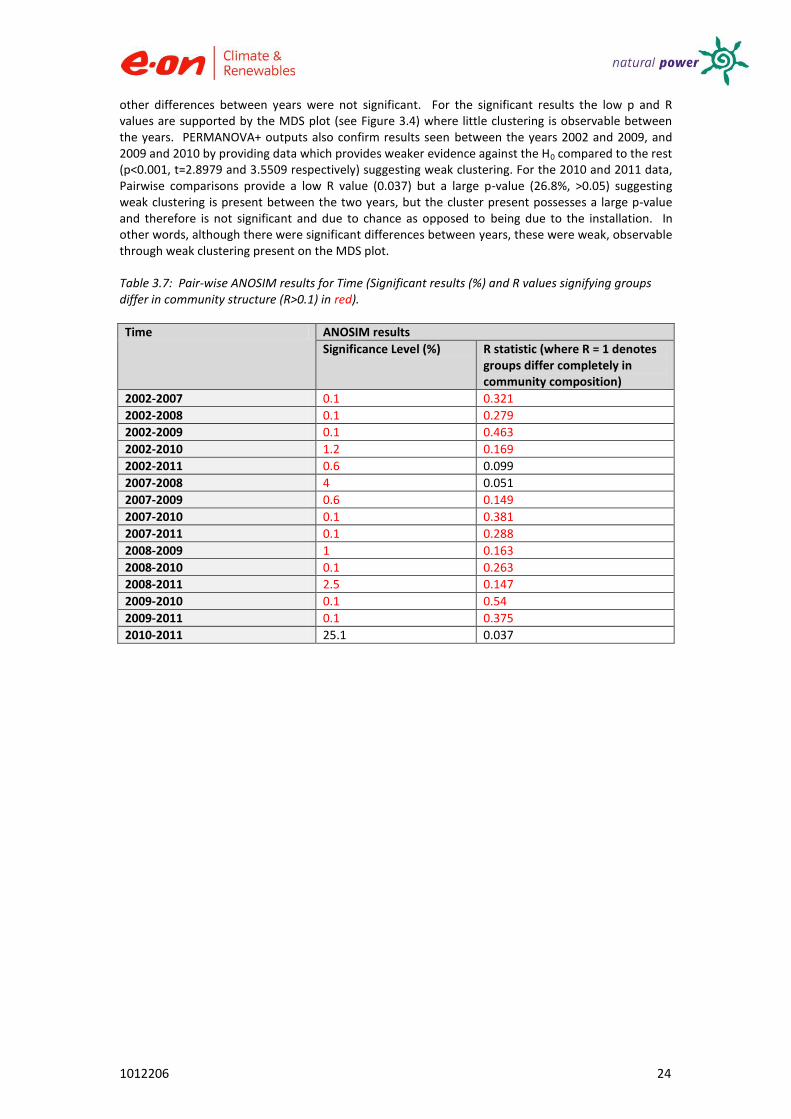
other differences between years were not significant. For the significant results the low p and R values are supported by the MDS plot (see Figure 3.4) where little clustering is observable between the years. PERMANOVA+ outputs also confirm results seen between the years 2002 and 2009, and 2009 and 2010 by providing data which provides weaker evidence against the H0 compared to the rest (p<0.001, t=2.8979 and 3.5509 respectively) suggesting weak clustering. For the 2010 and 2011 data, Pairwise comparisons provide a low R value (0.037) but a large p-value (26.8%, >0.05) suggesting weak clustering is present between the two years, but the cluster present possesses a large p-value and therefore is not significant and due to chance as opposed to being due to the installation. In other words, although there were significant differences between years, these were weak, observable through weak clustering present on the MDS plot.
Table 3.7: Pair-wise ANOSIM results for Time (Significant results (%) and R values signifying groups differ in community structure (R>0.1) in red).
Time ANOSIM results
Significance Level (%) R statistic (where R = 1 denotes groups differ completely in community composition)
2002-2007 0.1 0.321
2002-2008 0.1 0.279
2002-2009 0.1 0.463
2002-2010 1.2 0.169
2002-2011 0.6 0.099
2007-2008 4 0.051
2007-2009 0.6 0.149
2007-2010 0.1 0.381
2007-2011 0.1 0.288
2008-2009 1 0.163
2008-2010 0.1 0.263
2008-2011 2.5 0.147
2009-2010 0.1 0.54
2009-2011 0.1 0.375
2010-2011 25.1 0.037

1012206 25
Figure 3.4: Non-metric MDS plot of benthic abundance (square root transformed and dummy variable added) for each year.
Location
No significant differences in community structure were found between the area samples taken inside the wind farm, outside the site, or along the cable route (ANOSIM: R=0.007, p>0.005). Pair-wise analyses produced significance levels ranging between 5.8% and 63.3% (see Table 3.8). PERMANOVA+ analysis supports these results (Pseudo-F=2.5237, P>0.0001). This pattern can be observed (see Figure 3.5) where the data for all years is present and averaged for each sampling site respectively.
Table 3.8: Pair-wise ANOSIM results for Location (Significant results (%) and R values signifying groups differ in community structure (R>0.1) in red).
Time ANOSIM results
Significance Level (%) R statistic (where R = 1 denotes groups
differ completely in community composition)
Wind Farm Site - Control 35.6 0.009
Wind Farm Site - Cable Route 5.8 0.023
Control - Cable Route 63.3 -0.018

1012206 26
Figure 3.5: Non metric MDS plot of benthic abundance data (square root transformed and dummy variable added) for each sampling area.
Season
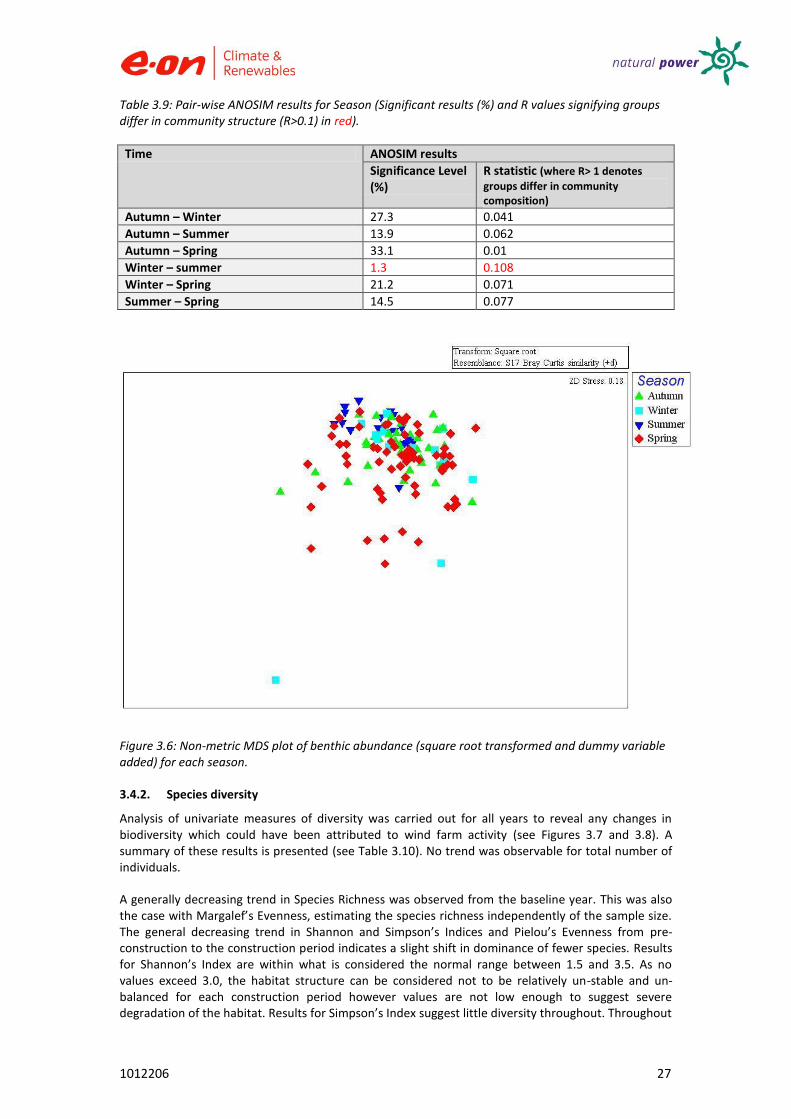
Overall seasonal variation was not significant (ANOSIM, R =0.034, p>0.05). In the MDS plot (see Figure 3.6) most samples are interspersed with others from different seasons with no clear clustering observable.
A pair-wise ANOSIM test was performed to reveal if any significant differences were present between seasons (see Table 3.9). Although no overall significant differences between seasons were found it should be noted that seasonal differences are difficult to determine due to inconsistencies in the MEMP requirements for surveying during different construction periods. Therefore PERMANOVA+ analysis was performed with the two variables, season and construction period. Two group combinations showed significant differences (p<0.05) in autumn sampling: baseline and pre-construction (t=1.607, P=0.004), baseline and construction (t=1.963, P=0.002). One group possessed a significant difference between winter sampling: baseline and construction (t=2.3324, P=0.003). The most frequently sampled season was spring, where one group of sampling periods possessed significant results: construction and operational (t=3.4169, P=0.001).
The significant results presented from the PERMANOVA+ analysis indicate rejection of H0 thereby suggesting there is a difference in benthic invertebrate community composition across the autumn baseline and pre-construction, and baseline and construction, throughout winter baseline and construction, and throughout spring construction and operational periods.
1012206 27
Table 3.9: Pair-wise ANOSIM results for Season (Significant results (%) and R values signifying groups differ in community structure (R>0.1) in red).
Time ANOSIM results
Significance Level (%)
R statistic (where R> 1 denotes
groups differ in community composition)
Autumn – Winter 27.3 0.041
Autumn – Summer 13.9 0.062
Autumn – Spring 33.1 0.01
Winter – summer 1.3 0.108
Winter – Spring 21.2 0.071
Summer – Spring 14.5 0.077
Figure 3.6: Non-metric MDS plot of benthic abundance (square root transformed and dummy variable added) for each season.
3.4.2. Species diversity
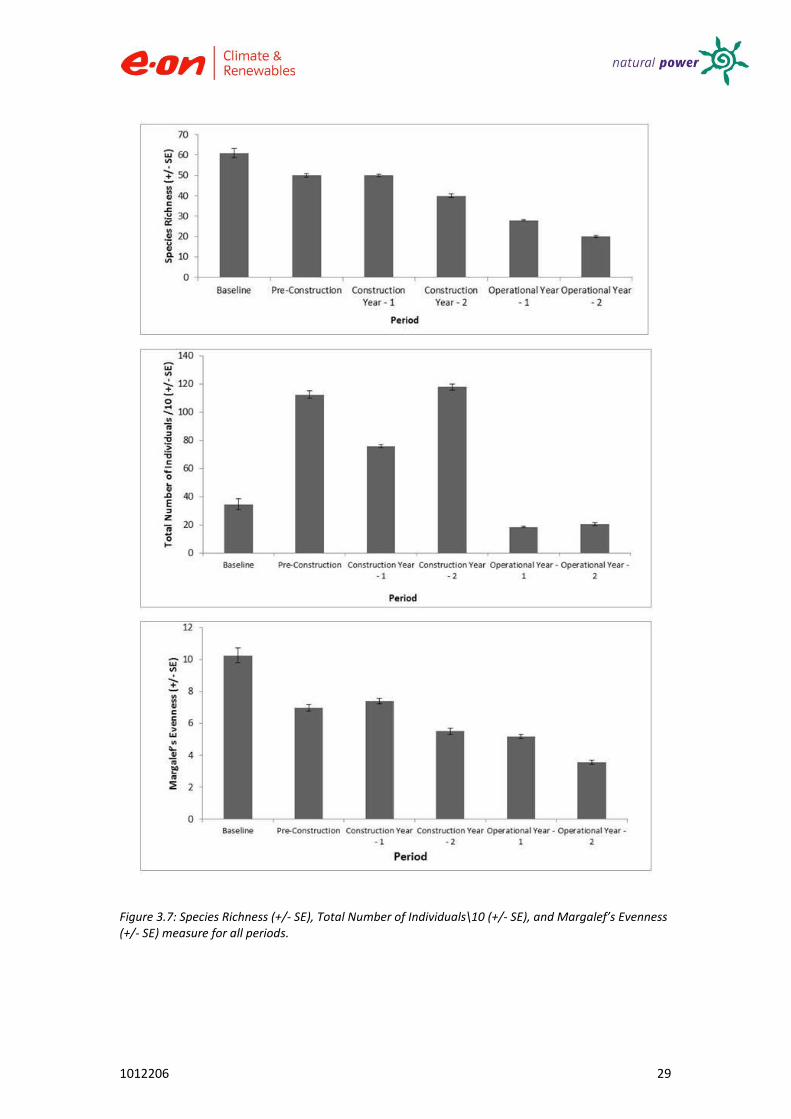
Analysis of univariate measures of diversity was carried out for all years to reveal any changes in biodiversity which could have been attributed to wind farm activity (see Figures 3.7 and 3.8). A summary of these results is presented (see Table 3.10). No trend was observable for total number of individuals.
A generally decreasing trend in Species Richness was observed from the baseline year. This was also the case with Margalef’s Evenness, estimating the species richness independently of the sample size. The general decreasing trend in Shannon and Simpson’s Indices and Pielou’s Evenness from pre-construction to the construction period indicates a slight shift in dominance of fewer species. Results for Shannon’s Index are within what is considered the normal range between 1.5 and 3.5. As no values exceed 3.0, the habitat structure can be considered not to be relatively un-stable and un-balanced for each construction period however values are not low enough to suggest severe degradation of the habitat. Results for Simpson’s Index suggest little diversity throughout. Throughout

1012206 28
the entire process, there is a general decreasing trend from baseline years to operational year two. Operational year one data is an exception to the general decreasing trend. Results show an increase in Shannon’s and Simpson’s Indices, and Pielou’s Evenness.
Table 3.10: Univariate statistic results for all construction periods.
Period Species Richness (S)
Number of Individuals (N)
Margalef’s Index (d)
Pielou’s Evenness (J’)
Shannon’s Index (H’)
Simpson’s Index (1-λ)
Baseline 61 346 10.26 0.7492 3.08 0.9104
Pre-construction 50 1124 6.975 0.7156 2.8 0.8985
Construction Year One
50 757 7.391 0.6842 2.677 0.8506
Construction Year Two
40 1178 5.515 0.5859 2.161 0.7967
Operational Year One
28 184 5.177 0.6847 2.282 0.8093
Operational Year Two
20 205 3.569 0.6545 1.961 0.7747
SIMPER analysis
SIMPER analyses were performed to enable a clearer understanding of changes in species diversity across construction periods. Key species are those driving the differences observed, by accounting for the highest percentages of individuals within the statistical analyses.
SIMPER analyses performed on the construction periods provides an overview of each period, but prevents detailed annual changes to be seen.
During the baseline period, the polychaete Nephtys cirrosa and the crustacean Gastrosaccus spinifer comprised nearly 80% of the infaunal community whereas during the pre-construction period, three key species comprised three quarters of the sample species: Bathyporeia elegans, Nephtys cirrosa, and Scolelepis mesnili. The construction period infaunal community as a whole comprised of four main species comprising over 83% of the species present: Bathyporeia elegans, Nephtys cirrosa, Pseudocuma longicorne, and Angulus fabula. The construction period featured different species on an annual basis between the years. In construction year one: Bathyporeia elegans, Nephtys cirrosa, and Bathyporeia nana contributed to over 80% of the individuals seen. Whereas in construction year two, the species composition comprising over 70% of individuals were: Bathyporeia elegans, Nephtys cirrosa, and Pseudocuma longicorne.
The operational period as a whole consists of two species comprising over 90% contribution to the sample, these were Nephtys cirrosa and Bathyporeia elegans. Throughout operational year one, two species comprised over 90% of the species present contribution to samples, these were Nephtys cirrosa and Bathyporeia elegans. Whereas in operational year two, three species comprised over 90% contribution to the results seen due to the species present in samples, these were Nephtys cirrosa, Bathyporeia elegans, and Ophelia borealis. Each period and year can be related to an associated biotope, these are all listed with descriptions (Section 3.1.2).
1012206 29
Figure 3.7: Species Richness (+/- SE), Total Number of Individuals\10 (+/- SE), and Margalef’s Evenness (+/- SE) measure for all periods.

1012206 30
Figure 3.8: Pielou’s Evenness (+/- SE), Shannon’s Index (+/- SE) and Simpson’s Index (+/- SE) for all periods.
1012206 31
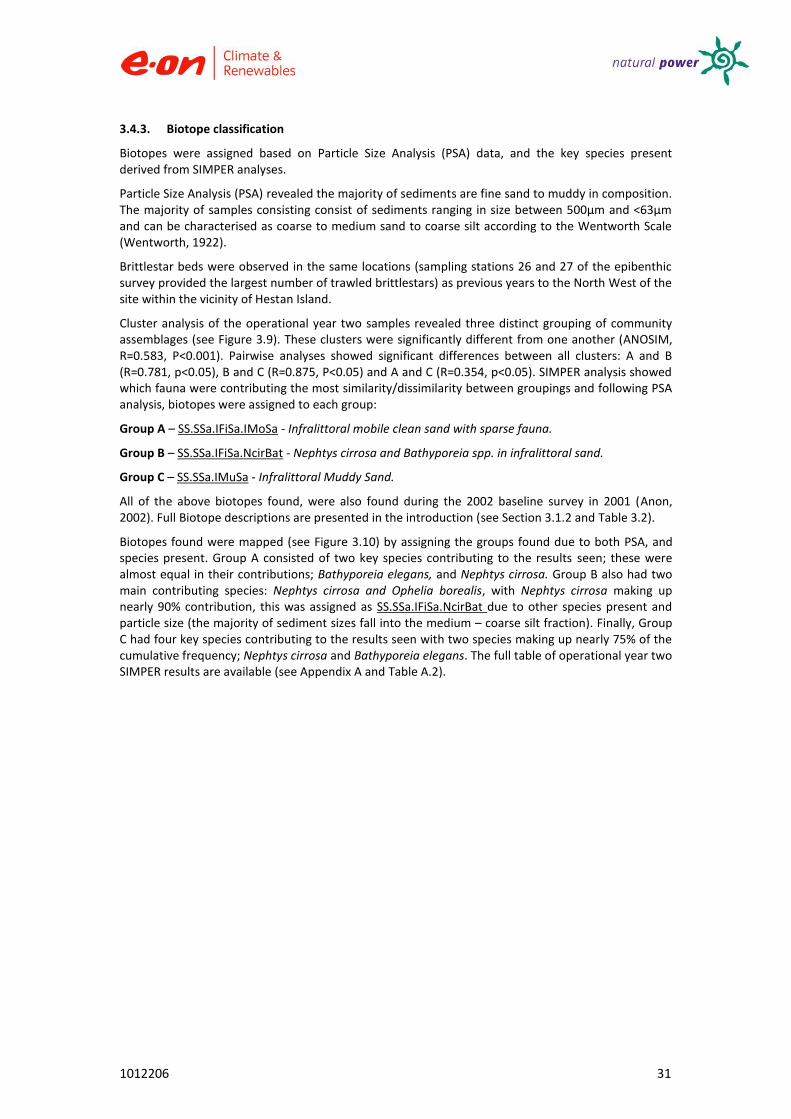
3.4.3. Biotope classification
Biotopes were assigned based on Particle Size Analysis (PSA) data, and the key species present derived from SIMPER analyses.
Particle Size Analysis (PSA) revealed the majority of sediments are fine sand to muddy in composition. The majority of samples consisting consist of sediments ranging in size between 500µm and <63µm and can be characterised as coarse to medium sand to coarse silt according to the Wentworth Scale (Wentworth, 1922).
Brittlestar beds were observed in the same locations (sampling stations 26 and 27 of the epibenthic survey provided the largest number of trawled brittlestars) as previous years to the North West of the site within the vicinity of Hestan Island.
Cluster analysis of the operational year two samples revealed three distinct grouping of community assemblages (see Figure 3.9). These clusters were significantly different from one another (ANOSIM, R=0.583, P<0.001). Pairwise analyses showed significant differences between all clusters: A and B (R=0.781, p<0.05), B and C (R=0.875, P<0.05) and A and C (R=0.354, p<0.05). SIMPER analysis showed which fauna were contributing the most similarity/dissimilarity between groupings and following PSA analysis, biotopes were assigned to each group:
Group A – SS.SSa.IFiSa.IMoSa - Infralittoral mobile clean sand with sparse fauna.
Group B – SS.SSa.IFiSa.NcirBat - Nephtys cirrosa and Bathyporeia spp. in infralittoral sand.
Group C – SS.SSa.IMuSa - Infralittoral Muddy Sand.
All of the above biotopes found, were also found during the 2002 baseline survey in 2001 (Anon, 2002). Full Biotope descriptions are presented in the introduction (see Section 3.1.2 and Table 3.2).
Biotopes found were mapped (see Figure 3.10) by assigning the groups found due to both PSA, and species present. Group A consisted of two key species contributing to the results seen; these were almost equal in their contributions; Bathyporeia elegans, and Nephtys cirrosa. Group B also had two main contributing species: Nephtys cirrosa and Ophelia borealis, with Nephtys cirrosa making up nearly 90% contribution, this was assigned as SS.SSa.IFiSa.NcirBat due to other species present and particle size (the majority of sediment sizes fall into the medium – coarse silt fraction). Finally, Group C had four key species contributing to the results seen with two species making up nearly 75% of the cumulative frequency; Nephtys cirrosa and Bathyporeia elegans. The full table of operational year two SIMPER results are available (see Appendix A and Table A.2).

1012206 32
Figure 3.9: Cluster analysis dendrogram of benthic macrofauna sampled across all locations during operational year two (WFS = Wind Farm Site, R = Cable Route site, and C = Control site).
Figure 3.10: Operational year two biotope map.
A summary table is also provided for immediate comparisons between all sampling periods (see Table 3.11) maps are also provided detailing locations of individual biotopes across all sampling periods (see Figures 3.11 to 3.14).

1012206 33
3.5. Discussion
The analysis undertaken on the benthic infauna data was used to identify any temporal, spatial, seasonal, and/or location trends and to determine whether any trends could be seen between the benthic infauna throughout the entire process.
Control sites were included in all analyses, however results from pairwise analyses provided no significant results indicating no differences in the community structure have been observed throughout the different sampling locations (wind farm site, cable route and control) over time.
Temporal variations in benthic communities
Significant variation in community structure was observed over time. The greatest changes in communities occurred between the collection of baseline data and pre-construction and pre-construction and operation. Changes in the benthos observed between the baseline sampling and during pre-construction occurred in the absence of any offshore wind farm construction activity. Despite the observed changes in the benthic assemblages between pre-construction and operational periods, the fact that these changes occurred at control sites outside the offshore wind farm would suggest that these changes were due to dynamic nature of the Solway Firth and cyclical patterns in benthic fauna. This is supported by the fact that there was a difference in the intensity of construction activity between 2008, where the majority of activity involved dredging along the cable route, and 2009 when the turbines were installed, but this was not reflected in the outcome of the benthic analysis.
When community assemblage was examined by year (i.e. over time rather than between construction periods) shrifts in community structure were seen. There was a significant shift in communities between the baseline and construction year two from one dominated by amphipods & polychaetes (SS.SSa.IFiSa.NcirBat) to one dominated by bivalves and polychaetes (SS.SSa.CFiSa.ApriBatPo). A further significant shift was seen in the operational year two when the community appears to have shifted back towards the baseline conditions, i.e. SS.SSa.IFiSa.NcirBat. The three biotopes found in the baseline period were the same as were also found in the operational year two period. With the exception of SS.SSa.IMuSa, the other two biotopes were observed throughout every sampling period (see Table 3.11). These biotopes were ‘Nephtys cirrosa and Bathyporeia spp. in infralittoral sand’ (SS.SSa.IFiSa.NcirBat) and ‘Infralittoral mobile clean sand with sparse fauna’ (SS.SSa.IFiSa.IMoSa) and are common throughout the survey area. The only other biotope identified was found during the construction periods was Abra prismatica, Bathyporeia elegans and polychaetes in circalittoral fine sand (SS.SSa.CFiSa.ApriBatPo). This biotope was only present throughout construction and not during the baseline period. This new biotope is however comprised of very similar species (Abra prismatica is in the same family of bivalve as (Angulus fabula) to those found in the baseline survey).
Shifts in species assemblages (i.e. biotope type) were also noted along the cable route over time, this could be attributed to shifting sand banks over time. Up until operation year one, the main biotope present along the cable route was SS.SSa.IFiSa.NcirBat. In construction year one, the biotope SS.SSa.CFiSa.ApriBatPo was also present and in operation year two, two biotopes were present: SS.SSa.IMuSa and SS.SSa.IFiSa.IMoSa. Changes and movements of biotopes within the area could reflect natural shifts associated with sandbank movement in naturally highly dynamic ecosystems such as the Solway. Shifts could also be put down to natural cyclic variations in species and sediment regimes. No ecologically significant changes were observed in biotopes throughout the construction periods. SS.SSa.IMuSa was observed during the baseline survey and again in the second year of operation. The 1994 survey undertaken by Cutts and Hemingway (1996) also identified the same biotopes as the Robin Rigg surveys. According to the baseline survey, this biotope was found in the more inshore part of the original cable route. This area was not surveyed after the baseline survey so direct comparisons can’t be made. In 2011 this biotope was found in four different sites (Group C, Figure 3.9).
1012206 34
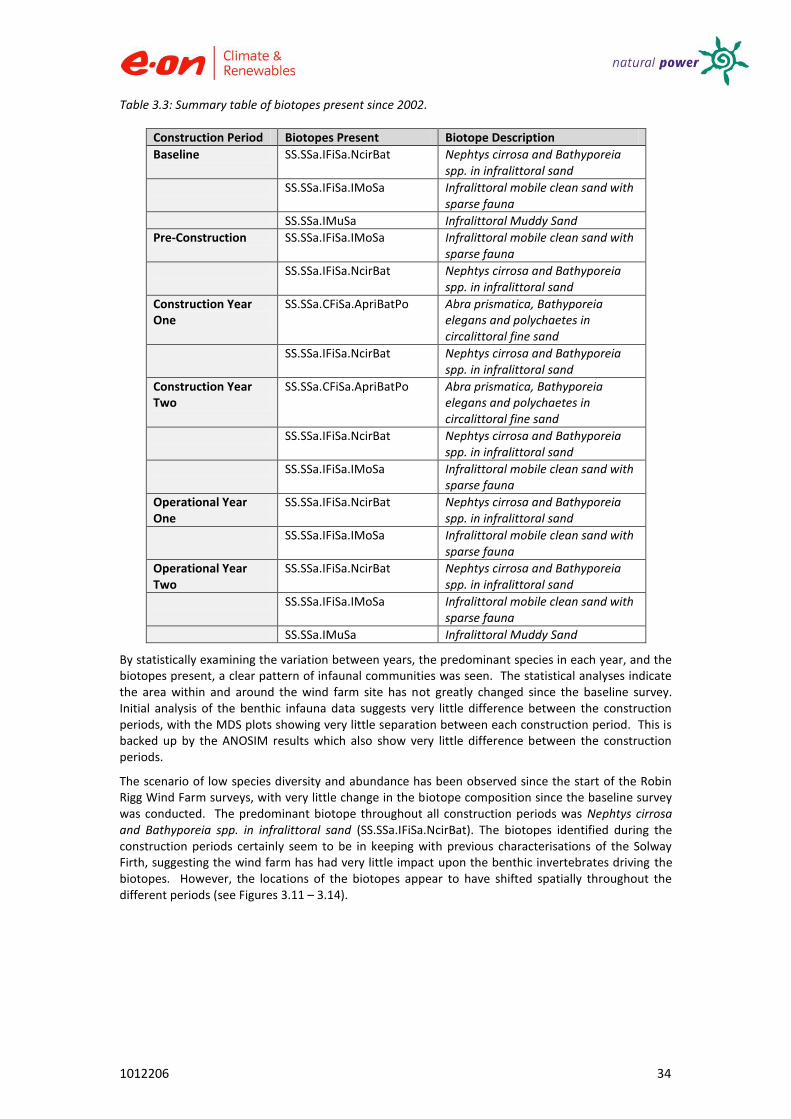
Table 3.3: Summary table of biotopes present since 2002.
Construction Period Biotopes Present Biotope Description Baseline SS.SSa.IFiSa.NcirBat
Nephtys cirrosa and Bathyporeia spp. in infralittoral sand
SS.SSa.IFiSa.IMoSa
Infralittoral mobile clean sand with sparse fauna
SS.SSa.IMuSa Infralittoral Muddy Sand
Pre-Construction SS.SSa.IFiSa.IMoSa
Infralittoral mobile clean sand with sparse fauna
SS.SSa.IFiSa.NcirBat
Nephtys cirrosa and Bathyporeia spp. in infralittoral sand
Construction Year One
SS.SSa.CFiSa.ApriBatPo Abra prismatica, Bathyporeia elegans and polychaetes in circalittoral fine sand
SS.SSa.IFiSa.NcirBat
Nephtys cirrosa and Bathyporeia spp. in infralittoral sand
Construction Year Two
SS.SSa.CFiSa.ApriBatPo Abra prismatica, Bathyporeia elegans and polychaetes in circalittoral fine sand
SS.SSa.IFiSa.NcirBat
Nephtys cirrosa and Bathyporeia spp. in infralittoral sand
SS.SSa.IFiSa.IMoSa
Infralittoral mobile clean sand with sparse fauna
Operational Year One
SS.SSa.IFiSa.NcirBat
Nephtys cirrosa and Bathyporeia spp. in infralittoral sand
SS.SSa.IFiSa.IMoSa
Infralittoral mobile clean sand with sparse fauna
Operational Year Two
SS.SSa.IFiSa.NcirBat
Nephtys cirrosa and Bathyporeia spp. in infralittoral sand
SS.SSa.IFiSa.IMoSa
Infralittoral mobile clean sand with sparse fauna
SS.SSa.IMuSa Infralittoral Muddy Sand
By statistically examining the variation between years, the predominant species in each year, and the biotopes present, a clear pattern of infaunal communities was seen. The statistical analyses indicate the area within and around the wind farm site has not greatly changed since the baseline survey. Initial analysis of the benthic infauna data suggests very little difference between the construction periods, with the MDS plots showing very little separation between each construction period. This is backed up by the ANOSIM results which also show very little difference between the construction periods.
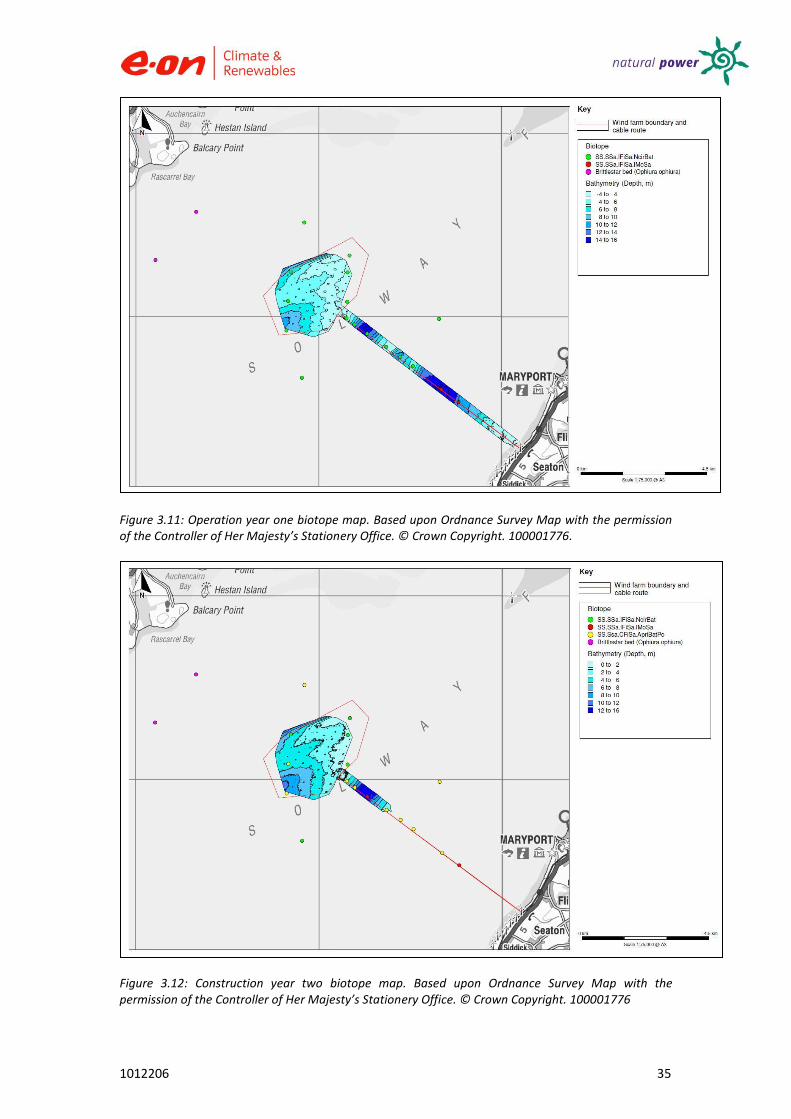
The scenario of low species diversity and abundance has been observed since the start of the Robin Rigg Wind Farm surveys, with very little change in the biotope composition since the baseline survey was conducted. The predominant biotope throughout all construction periods was Nephtys cirrosa and Bathyporeia spp. in infralittoral sand (SS.SSa.IFiSa.NcirBat). The biotopes identified during the construction periods certainly seem to be in keeping with previous characterisations of the Solway Firth, suggesting the wind farm has had very little impact upon the benthic invertebrates driving the biotopes. However, the locations of the biotopes appear to have shifted spatially throughout the different periods (see Figures 3.11 – 3.14).
1012206 35
Figure 3.11: Operation year one biotope map. Based upon Ordnance Survey Map with the permission of the Controller of Her Majesty’s Stationery Office. © Crown Copyright. 100001776.
Figure 3.12: Construction year two biotope map. Based upon Ordnance Survey Map with the permission of the Controller of Her Majesty’s Stationery Office. © Crown Copyright. 100001776

1012206 36
Figure 3.13: Construction year one biotope map. Based upon Ordnance Survey Map with the permission of the Controller of Her Majesty’s Stationery Office. © Crown Copyright. 100001776
Figure 3.14: Pre-construction biotope map. Based upon Ordnance Survey Map with the permission of the Controller of Her Majesty’s Stationery Office. © Crown Copyright. 100001776
1012206 37
Throughout the entire univariate statistical analyses, there was a general decreasing trend from baseline years to operational year two. Operational year one data is an exception to the general decreasing trend. Results show an increase in Shannon’s and Simpson’s Indices, and Pielou’s Evenness. This suggests the areas are changing from those which exhibit a slight shift in dominance of fewer species to those which exhibit a lower species evenness and slight increase in stability and diversity. Results for Pielou’s Evenness indicate the distribution of individuals is relatively even throughout samples for each sampling period as results are all above 0.6. Individuals present within samples are similar across all years (all >0.6) indicating the species composition has not changed dramatically throughout the project. During the construction year two, the lowest value was seen. This is expected as the construction periods are those most likely to cause detriment to the seabed and result in changing species (Petersen and Malm, 2006).
The outcome of this analysis indicated that, in the area of the Robin Rigg Wind Farm installation, little or no significant effect was seen on benthic communities in the immediate or surrounding vicinity however post construction, during the operational periods, communities appear to be returning to a pre-wind farm state.
Seasonal patterns of benthic communities
Although no overall significant differences were found between seasons, it should be noted that seasonal differences are difficult to determine due to inconsistencies in the MEMP requirements for surveying during different construction periods. PERMANOVA+ analyses, a more in depth method of analysing data of this nature, did however reveal significant seasonal differences between different periods. Seasonal changes in benthic community structure are well documented (Chainho et al., 2010; Van Hoey et al., 2010) and natural variation across seasons can be large, with lower abundances and richness in winter, and higher numbers of individuals and species at the end of summer months.
In this instance seasonal differences were observed through PERMANOVA+ analysis. These results point to natural cyclic variation occurring as no construction activities had occurred within the five years.
Evaluation of ES predictions
The ES predicted any impacts on the benthos as a result of construction activity in this area would not be significant and where any may occur they would be of a short duration. In addition the ES predicted that any sedimentation or disturbance suffered by fauna would be short in duration due to the highly dynamic nature of the area and therefore would not cause significant impacts on the benthos.
During the operational years the ES predicted that there will be no changes to the hydrodynamic regime of the area, and that given the spacing of the turbines and the high currents and tidal range of the area any impacts on the site are insignificant and no impacts are predicted on the benthic communities.
Overall the dominant class of taxa and therefore biotope type tends to remain the same. This ties in with the temporal patterns that show the survey site to be a dynamic equilibrium, with continual small scale changes over the years, but with the overall picture remaining the same. It can, therefore, be concluded that there has been no significant change in the biota of the survey area between this survey and the baseline survey as a result of the construction of the wind farm. Differences were seen throughout the construction period and operational year one, however, biota appear to be returning to pre-wind farm, baseline, composition and variation of communities. This is supported by the lack of any significant difference between wind farm site, cable route and control sampling station.
Any significant changes in communities were due to shifts in the relative abundance of a few dominant species, which is common in naturally highly dynamic sedimentary environments. Communities inhabiting soft sediments in exposed coastal areas, such as the Solway, are prone to periodic storm-induced disturbance. As such species found are characterised by an opportunistic life history which includes high fecundity, wide larval dispersal, fast growth-rate and high population turnover. Dominant species of these communities are relatively short-lived and have life history characteristics that are associated with species in unstable environments (Elliott et al., 1998, Jones et

1012206 38
al., 2000). As a result of this high turnover changes in the relative abundance of short-lived opportunistic species in the makeup of individual grab samples is to be expected.
The species found during the baseline, pre-construction, construction and operational period benthic surveys were all common to the Solway Firth area and around the British Isles. No species recovered were rare or of high conservation value. Sabellaria alveolata reefs are present on the intertidal section of the cable route, however none occur sub tidally. The results of the operational year two period surveys support the findings of the ES with sampling stations throughout the Robin Rigg Survey being low in both the number of species and the number of individuals. This low level of biodiversity is a result of the unstable nature of the mobile sand banks, where the fauna present is characterised by the presence of short lived benthic species which are tolerant to sediment disturbance.
No trends were observable between the number of individuals throughout the different periods. This could suggest either natural cyclic differences in certain abundant individuals over many years or could be due to sampling times.
Analysis of the infaunal data showed no significant differences between the pre-construction and construction years, but a subtle temporal shifting of communities around the whole site which may be considered to be characteristic of the dynamic equilibrium present at the Solway Firth. In addition no significant differences were found between the benthic communities at the wind farm, cable route or control sites in any construction period. On this basis, the ES predictions appear to be correct.

1012206 39
3.6. Conclusion
Conclusions
Predictions made in the environmental statement relating to the potential impacts of the construction and operation of the Robin Rigg Wind Farm were supported by the data collected. There is no evidence, to date, that the construction and operation of the Robin Rigg Wind Farm has had any significant impact upon the fish and benthic fauna in the immediate or surrounding area.
The predominant biotope in the area, Nephtys cirrosa and Bathyporeia spp. in infralittoral sand (SS.SSa.IFiSa.NcirBat), is characteristic of naturally high energy environments, and has been the predominant biotope since the baseline survey. Over the construction years there appears to have been spatial shift in biotopes, with Abra prismatica, Bathyporeia elegans and polychaetes in circalittoral fine sand (SS.SSa.CFiSa.ApriBatPo) biotope emerging, with a return to SS.SSa.IFiSa.NcirBat during the operational years.

1012206 40
3.7. References
Anderson, M.J., Gorley, R.N., & Clarke, K.R. 2008. PERMANOVA+ for PRIMER: Guide to Software and Statistical Methods. PRIMER-E: Plymouth, UK.
Anon 2000. Solway European Marine Site: English Nature’s and Scottish Natural Heritage’s advice given in compliance with Regulation 33(2) and in support of the implementation of The Conservation (Natural Habitats & c.) Regulations 1994.
Anon 2002. Supporting application for an offshore wind farm at Robin Rigg. Environmental Statement. A report by Natural Power for OERL and TXU.
Axelsson, M., Dewey, S., Tourell, A., & Karpouzli, E. 2006. Site condition monitoring – the sublittoral sandbanks of the Solway Firth. Scottish Natural Heritage Commissioned Report No. 155 (ROAME No. F02AA409).
Borja, A., Muxika, I. & Franco, J. 2003. The application of a marine biotic index to different impact sources affecting soft-bottom benthic communities along European coasts. Mar. Pollut. Bull., 46, 835–845.
Chainho, P., Silva, G., Lane, M. F., Costa, J. L., Pereira, T., Azeda, C., Almeida, P. R., Metelo, I., & Costa, M. J. 2010. Long-Term Trends in Intertidal and Subtidal Benthic Communities in Response to Water Quality Improvement Measures. Journal of the Coastal and Estuaries Research Federation, 33(6) 1314-1326.
Clarke, K.R. & Gorley, R.N. 2006. PRIMER v6: User Manual/Tutorial. PRIMER-E, Plymouth.
Coates, D., Vanaverbeke, J., Rabaut, M. & Vincx, M. 2011. Chapter 6. Soft-sediment macrobenthos around offshore wind turbines in the Belgian part of the North Sea reveals a clear shift in species composition. In: Degraer, S., Brabant, R. & Rumes, B. (Eds). Offshore wind farms in the Belgian part of the North Sea: Selected findings from the baseline and targeted monitoring. Royal Belgian Institute of Natural Sciences, Management Unit of the North Sea mathematical Models. Marine ecosystem management unit. 157 pp. + annex.
Connor, D. W., Allen, J.H., Golding, N., Howell, K.L., Lieberknecht, L.M., Northen, K.O. & Reker, J.B. (2004). The marine habitat classification for Britain and Ireland (version 04.05). Joint Nature Conservation Committee, 49 pages. Joint Nature Conservation Committee, Peterborough. ISBN 1 861 07561 8 (internet version). http://jncc.defra.gov.uk/MarineHabitatClassification.
Crowe, T.P., Fitch, J.E., Frid, C.L.J. & Somerfield, P. 2011. A framework for managing seabed habitats in Special Areas of Conservation. A report for the Department of Environment, Heritage and Local Government, Ireland.
Cutts, N. & Hemingway, K. 1996. The Solway Firth broad scale habitat mapping. Institute of Estuarine and Coastal Studies, University of Hull, Report to SNH. Unpublished report.
Dauvin, J.C., Ruellet, T., Desroy, N. & Janson, A.L. 2007. The ecological quality status of the Bay of Seine and the Seine Estuary: Use of biotic indices. Mar. Poll. Bull., 55, 241–257.
Elliott, M., Nedwell., S, Jones, N. V., Read, S. J., Cutts, N. D. & Hemingway, K. L., 1998. Intertidal Sand and Mudflats & Subtidal Mobile Sandbanks (volume II). An overview of dynamic and sensitivity characteristics for conservation management of marine SACs. Scottish Association for Marine Science (UK Marine SACs Project). 151 Pages.
Frid, C.L.J., Garwood, P.R. & Robinson, L.A. 2009a. Observing change in a North Sea benthic system: A 33 year time series. Journal of Marine Systems, 77, 227-236.
Frid, C.L.J., Garwood, P.R. & Robinson, L.A. 2009b. The North Sea benthic system: a 36 year time-series. Journal of the Marine Biological Association of the United Kingdom, 89(1), 1-10.
Gray, J.S., Elliott, M. 2009. Ecology of Marine Sediments: Science to Management. Oxford University Press, Oxford.

1012206 41
Jones, L. A., Hiscock, K. & Connor, D. W., 2000. A summary of ecological requirements and sensitivity characteristics for the conservation and management of marine SACs. Marine Habitat Review. UK Marine SACs Project Report by JNCC, Peterborough.
Natural Power. 2002. Environmental Statement: Supporting application for an offshore wind farm at Robin Rigg.. A report by Natural Power for OERL and TXU.
Perkins, E. J. & Williams, B. R. H. 1966. The biology of the Solway Firth in relation to the movement and accumulation of radioactive materials. Part II. The distribution of sediment and benthos. Chapelcross, United Kingdom Energy Authority. (UKEA Production Group Report, 587).
Petersen, J. K, & Malm, T., 2006. Offshore Windmill Farms: Threats to or Possibilities for the Marine Environment. AMBIO: A Journal of the Human Environment, 35(2): 75-80.
Van Hoey, G., Borja, A., Birchenough, S., Buhl-Mortensen, L., Degraer, S., Fleischer, D., Kerckhof, F., Magni, P., Muxika, I., Reiss, H., Schröder, A. & Zettler, M. L., 2010. The use of benthic indicators I Europe: From the Water Framework Directive to the Marine Strategy Framework Directive. Marine Pollution Bulletin, 60(12):2187-2196.
Wentworth, C. K., 1922. A Scale of Grade and Class Terms for Clastic Sediments. The Journal of Geology, 30(5): 377-392.

1012206 42