analysis of milk and egg allergens in wine using uplc-ms - waters corporation food safety
TRANSCRIPT

©2015 Waters Corporation 1
Analysis of Milk and Egg Allergens
in Wine Using UPLC-MS
Work performed in collaboration with:

©2015 Waters Corporation 2
Presentation Overview
Background
– Allergenic proteins in wine
– MS technology for allergen analysis
Establishing a Routine Workflow on
Tandem Quad MS
– QTof to Tandem quad MS
– Software to Tandem quad MS
Conclusions

©2015 Waters Corporation 3
Milk and Egg Proteins for Wine Clarification
Clarification is an important step in wine making
– Remove phenolic compounds (e.g. tannins)
Fining agents include egg whites (albumin) and
milk (casein)
– Forms insoluble complex that settles at the bottom
– Wine is filtered to remove these finings
– Minimal quantities are used to achieve the desired
result without stripping too much flavour
Finings should be removed when the wine is
clarified.
In some countries it is a legal requirement to
state any potential allergens on the label

©2015 Waters Corporation 7
Analysis of Allergens Popular Technologies Adopted
ELISA
PCR
MS In
creasin
g C
urren
t U
sag
e
In
creasin
g I
nstr
um
en
t C
om
ple
xit
y &
Pric
e

©2015 Waters Corporation 8
What information can MS detection provide?
Analyse peptide markers of the protein causing the
allergic reaction
Targeted and specific m/z analysis
Quantifiable technique
Capability to modify / optimise routine methods for
challenging matrices (without additional cost)
Potential to use a multi-allergen approach
©2015 Waters Corporation 9
Strategy 1
Instrument-based strategy to identify egg
and milk peptide markers using
Xevo G2 QTof MS

©2015 Waters Corporation 10
Bottom-up Proteomic Experiment
1. Enzyme digestion
2. UPLC separation
Precursor ions
MSE product ions
3. MS analysis
4. Data interpretation
©2015 Waters Corporation 11
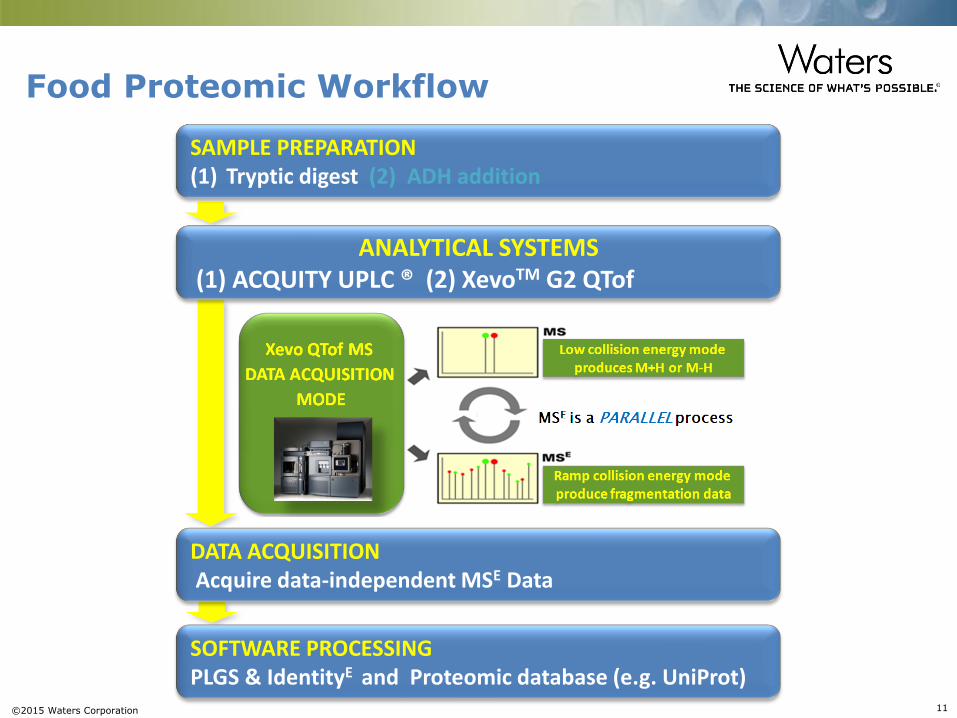
Food Proteomic Workflow
SAMPLE PREPARATION (1) Tryptic digest (2) ADH addition
DATA ACQUISITION Acquire data-independent MSE Data
SOFTWARE PROCESSING PLGS & IdentityE and Proteomic database (e.g. UniProt)
ANALYTICAL SYSTEMS (1) ACQUITY UPLC ® (2) XevoTM G2 QTof

©2015 Waters Corporation 13
Food Proteomics Workflow Software processing
High energy product ion data gives increased confidence in peptide sequence identification
Markers are from a SINGLE protein
Unique marker peptides sequences listed here
©2015 Waters Corporation 14
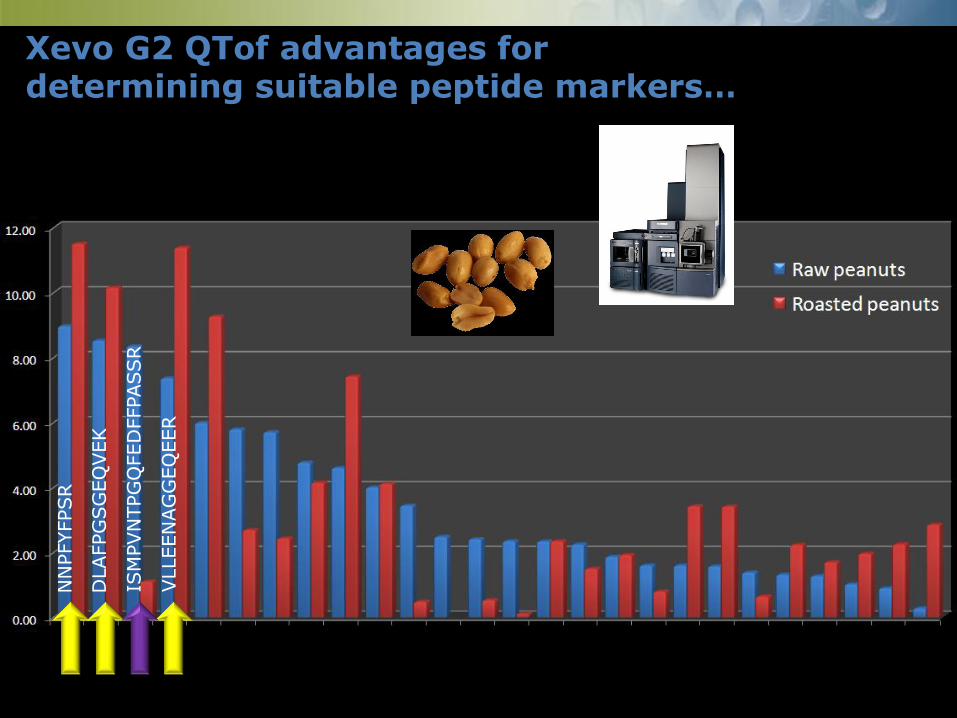
Xevo G2 QTof advantages for determining suitable peptide markers…
NN
PFYFPSR
DLAFPG
SG
EQ
VEK
VLLEEN
AG
GEQ
EER
ISM
PVN
TPG
QFED
FFPASSR
©2015 Waters Corporation 15
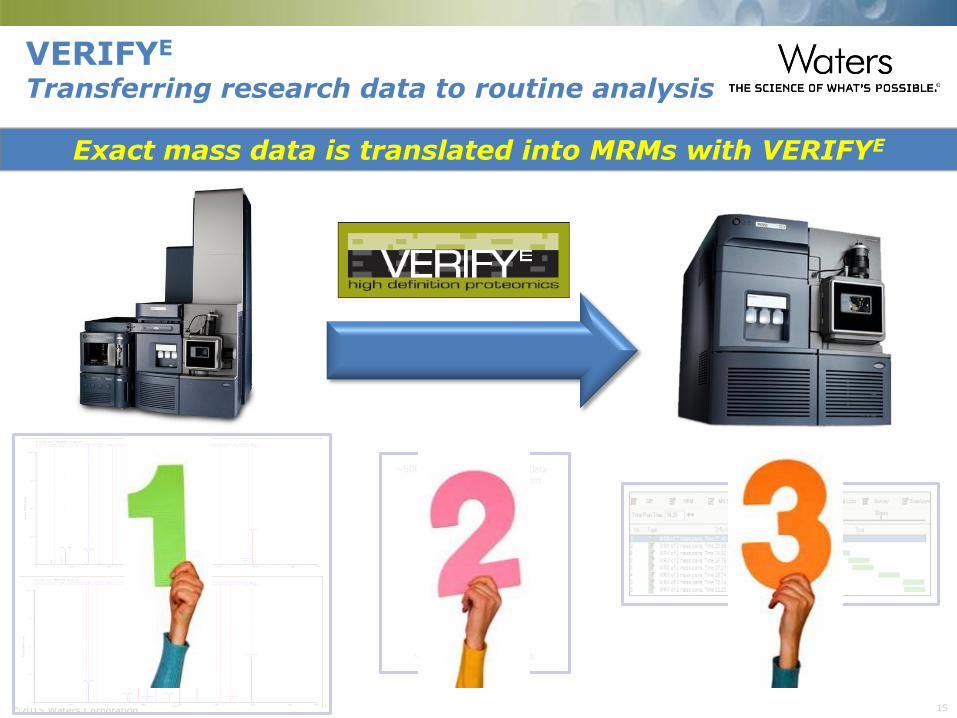
VERIFYE
Transferring research data to routine analysis
Exact mass data is translated into MRMs with VERIFYE

©2015 Waters Corporation 16
VERIFYE …Proteotypic Peptide Review …MRM Method Generation
©2015 Waters Corporation 17
Strategy 2
Software-based strategy to identify peptide
markers

©2015 Waters Corporation 18
Skyline Experimental Design
Peptide settings
Transition settings
MRM generation
©2015 Waters Corporation 19
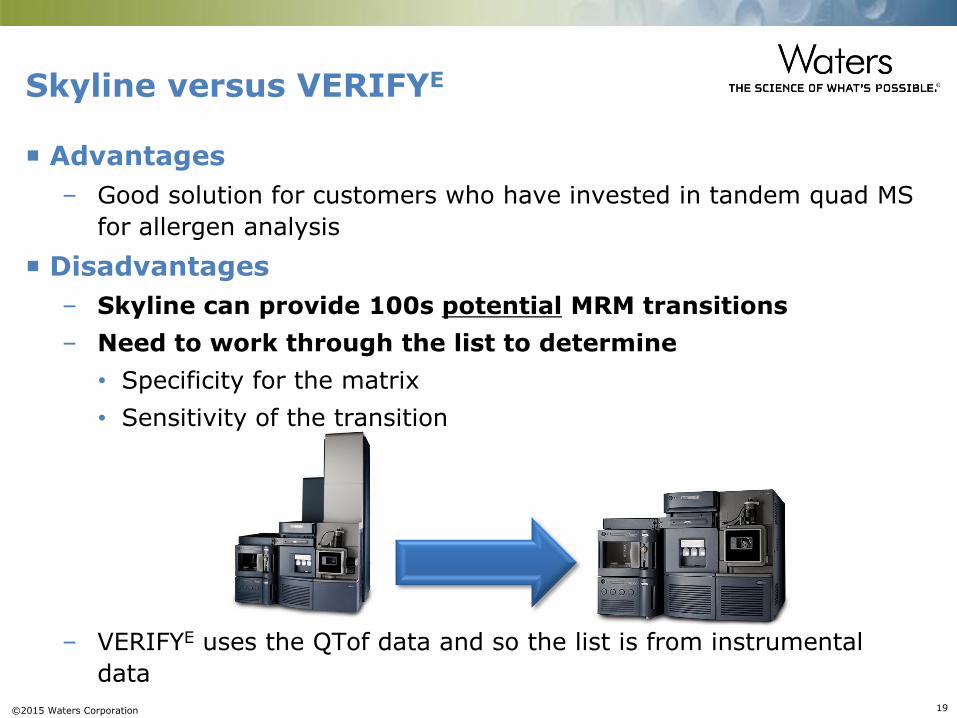
Skyline versus VERIFYE
Advantages
– Good solution for customers who have invested in tandem quad MS
for allergen analysis
Disadvantages
– Skyline can provide 100s potential MRM transitions
– Need to work through the list to determine
• Specificity for the matrix
• Sensitivity of the transition
– VERIFYE uses the QTof data and so the list is from instrumental
data

©2015 Waters Corporation 20
Milk and egg allergen in milk: Sample prep development
Samples:
– Red and white wine, fortified before/after extraction
Tested extraction/concentration protocols:
1. Ultrafiltration (cut-off 3kDa and 10 kDa)
2. precipitation with acetone
3. precipitation with acetone/TCA
4. precipitation with KDS
5. precipitation with ethanol
Protein pellet suspended in a solution of 120mM Tris 7M urea 2M thiourea
Best sample prep results:
– Precipitation with cold acetone or ethanol
©2015 Waters Corporation 23
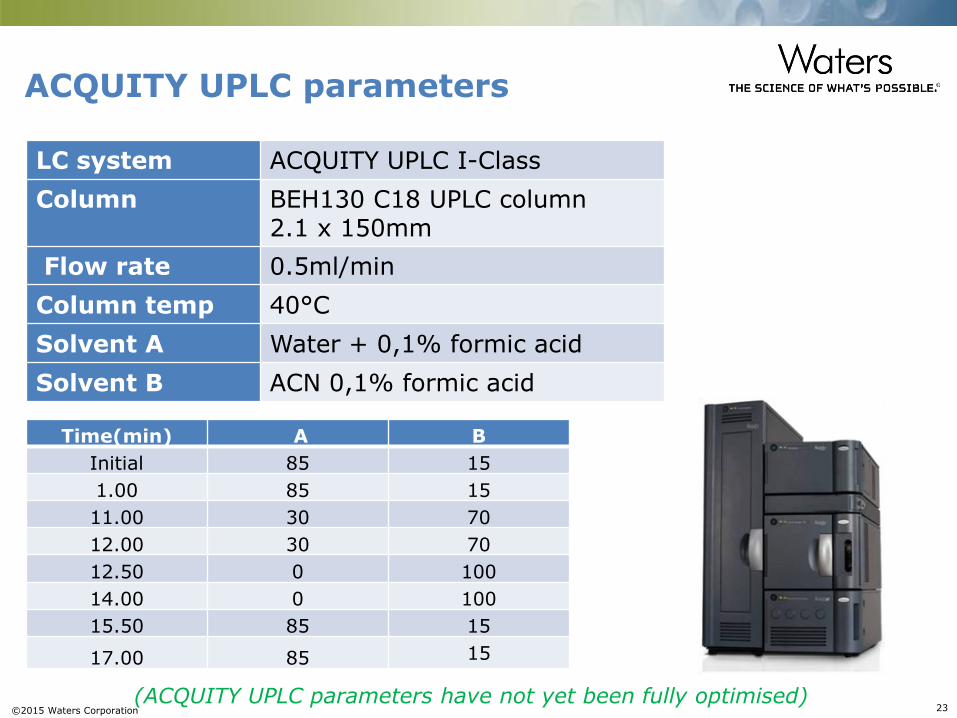
ACQUITY UPLC parameters
(ACQUITY UPLC parameters have not yet been fully optimised)
LC system ACQUITY UPLC I-Class
Column BEH130 C18 UPLC column 2.1 x 150mm
Flow rate 0.5ml/min
Column temp 40°C
Solvent A Water + 0,1% formic acid
Solvent B ACN 0,1% formic acid
Time(min) A B
Initial 85 15
1.00 85 15
11.00 30 70
12.00 30 70
12.50 0 100
14.00 0 100
15.50 85 15
17.00 85 15

©2015 Waters Corporation 24
Milk allergens: Targeted peptides and MRMs
Peptide Precursor
(m/z) Product (m/z)
YLGYLEQLLR (casein S1) 423.2 529.3
634.4 658.4
634.4 771.5
634.4 934.5
VPQLEIVPNSAEER (casein S1) 527.6 802.4
790.9 779.5
790.9 802.4
790.9 1014.5
FFVAPFPEVFGK (casein S1) 692.9 465.2
692.9 676.4
692.9 920.5
692.9 991.5
ALNEINQFYQK (casein S2) 456.6 827.4
684.3 713.4
684.3 827.4
684.3 940.5
FALPQYLK (casein S2) 490.2 332.2
490.2 551.3
490.2 648.4
490.2 761.5

©2015 Waters Corporation 25
Egg allergens: Targeted peptides and MRMs
Peptide Precursor (m/z)
Product (m/z)
DILNQITKPNDVYSFSLASR (ovalbumin) 761.0 767.4
761.0 930.5
761.0 1355.7
1141.1 1355.7
GGLEPINFQTAADQAR (ovalbumin) 563.3 732.4
844.4 860.4
844.4 1007.5
844.4 1121.5
844.4 1331.7
ELINSWVESQTNGIIR (ovalbumin) 620.3 673.4
620.3 888.5
930.0 1017.5
930.0 1116.6
EVVGSAEAGVDAASVSEEFR (ovalbumin) 670.3 853.4
670.3 924.4
1005.0 1110.5
1005.0 1266.6

©2015 Waters Corporation 26
Peptide Identification & Confirmation Using ACQUITY UPLC & Xevo TQ-S
1. Retention time
2. Standard MRM transitions

©2015 Waters Corporation 27
Peptide Identification & Confirmation Using ACQUITY UPLC & Xevo TQ-S
1. Retention time
2. Standard MRM transitions
3. Standard MRM transitions & full scan data
4. Product ion scanning confirmation
(PICs)
©2015 Waters Corporation 28
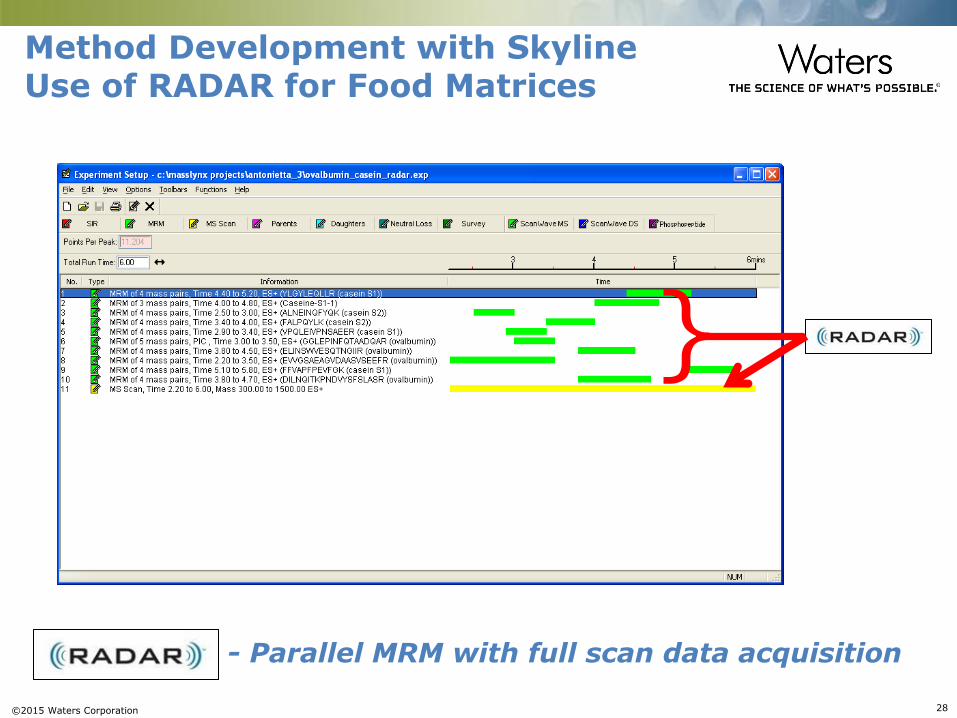
Method Development with Skyline Use of RADAR for Food Matrices
- Parallel MRM with full scan data acquisition
}

©2015 Waters Corporation 29
Method Development with Skyline Use of RADAR for Food Matrices
Once the most selective, and then the most sensitive MRMs have been selected for a subset of
food matrices, RADAR can be used to support routine analysis
Casein
S1-
YLG
Casein
S1-
FFV
Ovalb
um
in-
EVV O
valb
um
in-
GG
L
Ovalb
um
in-
DIL
O
valb
um
in-
ELI
Casein
S2-
FAL
Casein
S1 -
VPQ
Casein
S2-
ALN
4
3
2 1
6
5
Full scan
MRMs

©2015 Waters Corporation 30
Peptide Protein Charge state: m/z
GPFPIIV β-CN +1: 742.4490
FFVAPFPEVFGK α-S1-CN +2: 692.8695
HQGLPQEVLNENLLR α-S1-CN +2: 880.4770
YLGYLEQLLR α-S1-CN +2: 634.3568
Comparing RADAR data with Journal Citations
L. Monaci, I. Losito, F. Palmisano, M. Godula & A. Visconti (2011): Food Additives & Contaminants: Part A: Chemistry, Analysis, Control, Exposure & Risk Assessment, 28:10, 1304-1314
XIC of m/z 742.4
RT – 5.33 or 6.13
©2015 Waters Corporation 31
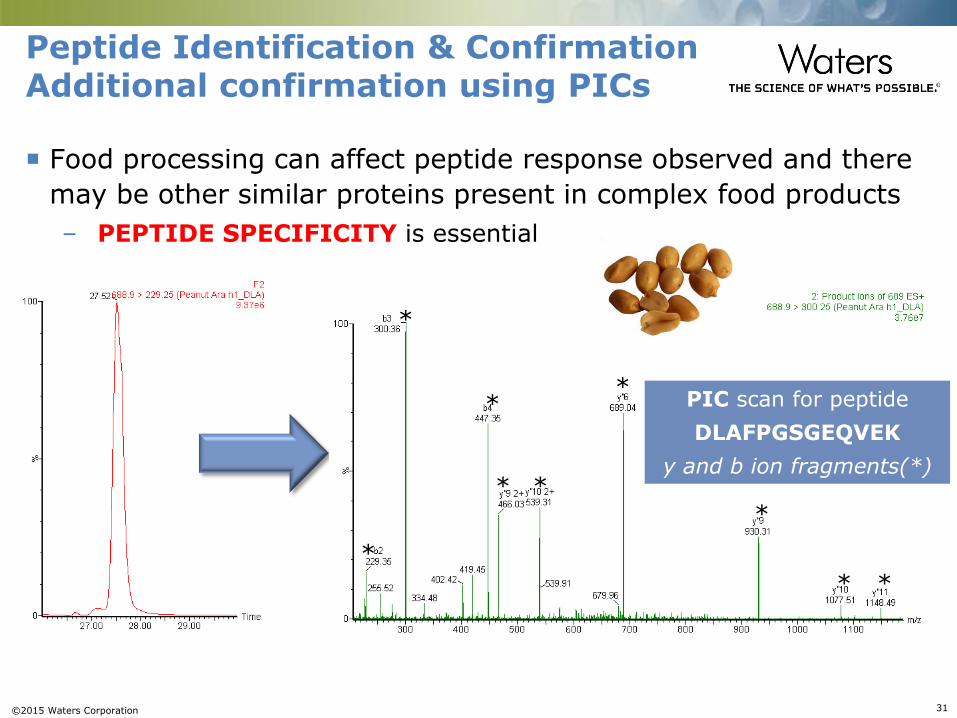
Peptide Identification & Confirmation Additional confirmation using PICs
Food processing can affect peptide response observed and there
may be other similar proteins present in complex food products
– PEPTIDE SPECIFICITY is essential
PIC scan for peptide
DLAFPGSGEQVEK
y and b ion fragments(*)
*
* *
*
*
* *
*
*

©2015 Waters Corporation 32
Peptide Identification & Confirmation Additional confirmation using PICs
PIC scan for peptide marker
FFVAPFPEVFGK
found in Casein S1
Matrix: White wine

©2015 Waters Corporation 33
Peptide Identification & Confirmation Additional confirmation using PICs
PIC scan for peptide marker
FFVAPFPEVFGK
found in Casein S1
Matrix: Red wine
©2015 Waters Corporation 34
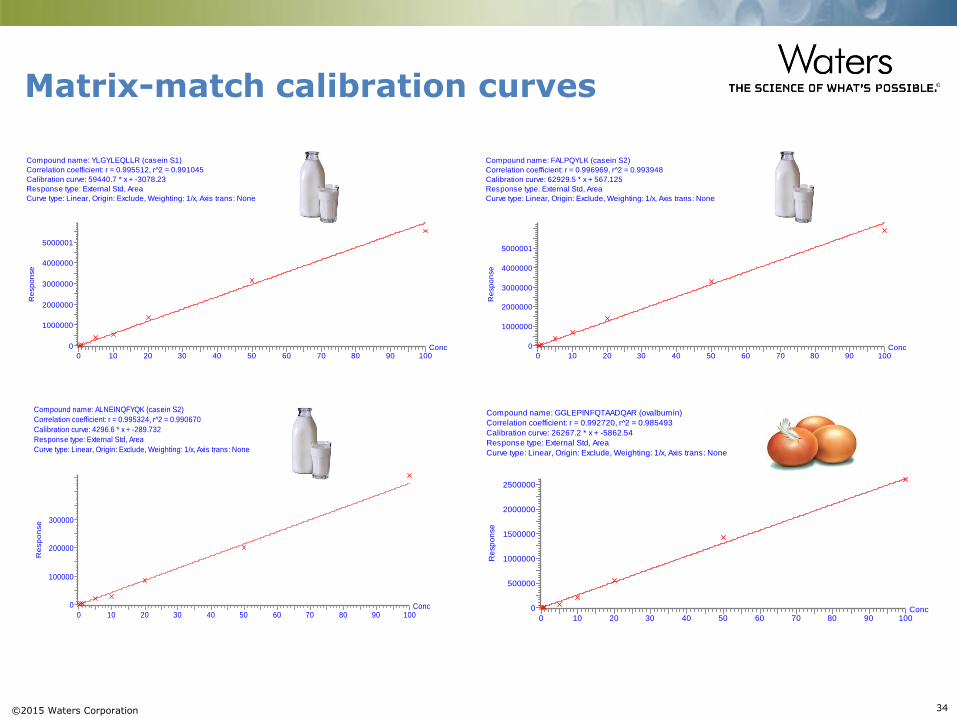
Compound name: YLGYLEQLLR (casein S1)
Correlation coefficient: r = 0.995512, r^2 = 0.991045
Calibration curve: 59440.7 * x + -3078.23
Response type: External Std, Area
Curve type: Linear, Origin: Exclude, Weighting: 1/x, Axis trans: None
Conc0 10 20 30 40 50 60 70 80 90 100
Re
sp
on
se
0
1000000
2000000
3000000
4000000
5000001
Compound name: ALNEINQFYQK (casein S2)
Correlation coefficient: r = 0.995324, r^2 = 0.990670
Calibration curve: 4296.6 * x + -289.732
Response type: External Std, Area
Curve type: Linear, Origin: Exclude, Weighting: 1/x, Axis trans: None
Conc0 10 20 30 40 50 60 70 80 90 100
Re
sp
on
se
0
100000
200000
300000
Compound name: FALPQYLK (casein S2)
Correlation coefficient: r = 0.996969, r^2 = 0.993948
Calibration curve: 62929.5 * x + 567.125
Response type: External Std, Area
Curve type: Linear, Origin: Exclude, Weighting: 1/x, Axis trans: None
Conc0 10 20 30 40 50 60 70 80 90 100
Re
sp
on
se
0
1000000
2000000
3000000
4000000
5000001
Compound name: GGLEPINFQTAADQAR (ovalbumin)
Correlation coefficient: r = 0.992720, r^2 = 0.985493
Calibration curve: 26267.2 * x + -5862.54
Response type: External Std, Area
Curve type: Linear, Origin: Exclude, Weighting: 1/x, Axis trans: None
Conc0 10 20 30 40 50 60 70 80 90 100
Re
sp
on
se
0
500000
1000000
1500000
2000000
2500000
Matrix-match calibration curves

©2015 Waters Corporation 35
Software Tools for Long-Term Routine Allergens Analysis

©2015 Waters Corporation 36
Conclusions
Existing allergens methods employ ELISA & PCR-based techniques
Recent years interest in tandem quad MS
– Increased selectivity
– Potential for multi-allergen analysis
– Capability to modify LC-MS methods for challenging matrices / proteins
affected during the food processing
Routine methods need MRMs to be selective and sensitive to
identify and confirm the presence / absence allergenic protein(s).
Method development stage can be time-consuming & useful to
have additional tools to support process
– RADAR – parallel acquisition of full scan and MRM data
– PICS – additional peptide confirmation
– TrendPlot – long term monitoring: QC standards, samples…

©2015 Waters Corporation 37
Acknowledgements
CER Group
o Nathalie Gillard
o Olivier Spee
o Philippe Delahaut
Waters Corporation
o Lee Gethings
o Kelly McMahon