analysis of mississinewa shale-liston a thesis …
TRANSCRIPT
.-
ANALYSIS OF MISSISSINEWA SHALE-LISTON
CP£EK LIMESTONE CONTACT IN NORTHEASTERN INDIANA
A THESIS
SUBMITTED TO THE HONOR'S COLLEGE
IN PARTIAL FULFILLMENT OF THE REQUIREMENTS
for the
HONOR'S PROGRAM
by
L. DOUGL..4S MCKEE
Adviser - Dr. Harlan H. Roepke
~ /paz: 01 L-C;;~J/.~~/<1L. / c;:/>. BALL STATE UNIVERSITY
MUNCIE, INDIANA
MAY, 1983

,-
~Co\\~ \r\~::"-L,-'
LI>
ACKNOWLEDGEMENTS
I would like to take this opportunity to thank all those
who aided in this study. Special thanks is offered to'Dr.
Harlan H. Roepke, Honors Thesis advisor, for his aid in the
preparation and editing of this manuscript. Special thanks go
to Dr. Walter H. Pierce, who suggested this particular pro
ject. Sj_ncere appreciation is also extended to the Ball State
DepartmEmt of Geology which provided research facilities and
to the Student-Faculty Research Committee which provided
funding for this project in the form of an undergraduate
research grant.
My appreciation is also extended to Dr. Henry E. Kane,
Dr. R. William Orr, and Dr. Alan Samuelson for all the geo
logic knowledge they have imparted to me over the past four
years. And of course, I wish to thank the Ball State Honors
College for the stimulus for this entire research project.

---
l'ABLE OF CONTENTS Page
I. IN'TRODUCTION ....................................... 'I. 1
A. Purpose of Study........ .. .. .. .. .. .. .. .. .. .. .. .. .. .. .. .. .. .. .. .. .. .. .. .. .. .. .. .... 1 B. Significance ......................................................................... 8 C. Selection of Field Locaclities ................... 8
II. GEOLOGIC SETTING
A. Structural Setting ............................................................ 12 B. Stratigraphy of Wabash Formation ................. 15 C. Paleogeographic Setting .......................... 18 D. Depositional Model ............................... 18
III. FIELD METHODS AND LABORATORY PROCEDURES
A. Field Methods and Sampling ....................... 20 B. Laboratory Procedures ............................ 20
1 . Insoluble Res id ue Analys is ................... 21 2. Pipette Analysis ............................. 21
C. Procedure Reliability ........•................... 24
IV.. INTERPRETATION .. I ...................................... 26
V. CONCLUSIONS ....................................................... 34
VI • REFERENCES CITED ••..••.••••••.••••.•••..••.•.•••.••• 35
VII. APPENDIX A (Pipette Analysis Data Form) ............. J7
VIII. APPENDIX B (Stratigraphic Distribution of Total Detritus (percent insoluble) and Silt/Clay Ratios ... J9
IX. APPENDIX C (Stratigraphic Distribution of Silt/ Carbona te Ra tics) ...................................... 44
X. APPENDIX D (Stratigraphic Distribution of Clay/ Carbona te Ra tics) ...................................... 47
XI. APPENDIX E (Paleogeographic Setting of North America During Silurian ............................. 50

-ANALYSIS OF MISSISSINEWA SHALE-LISTON
CREEK LIMESTONE CONTACT IN NORTHEASTERN INDIANA
I. INTRODUCTION
ThE~ Wabash Formation, with its encompassed Mississinewa
Shale and Liston Creek Limestone Members, is a Silurian in
terreef deposit of late Niagaran age (Shaver et. al., 1971)
(figure 1). In northeastern Indiana the contact between
these two members is exposed at several quarries, road, and
stream cuts. Existing contemporaneously with the deposition
of the Wabash Formation were numerous pinnacle reefs in addi
tion to two major reef complexes along the edges of the Mich
igan and Illinois basins (Shaver, 1978). These Silurian reefs
of the Midwest have been, over the last few years, the tar
gets of petroleum exploration, and are prized as sources of
crushed stone and chemical-grade carbonates. In southwestern
Indiana, petroleum has been extracted from the overlying
strata which are usually domed due to differential compaction
of subsequently deposited layers. In some areas, such as in
Michigan and Illinois, but not in Indiana as yet, petroleum
has been produced directly from the reef bodies (Becker and
Keller, 1976).
A.Purpose of Study
The objective of this research is to determine how the
detrital component of the Wabash Formation varies in the

-
2
PINSAK AND SHAVER, 1964 DROSTE AND SHAVE R 1976 DROSTE AND SHAVER , 1982
illW~ illliJt'-'--'--'-Y~1 LJ....L.J...J.-~ i 11 j 11111111111 I ~ II 1 j I I 1
}U-J-g.l..ll.jrU-'--l...U..J...u..L.L...L-'-<?Xf::j Kenneth ~ a ~enneth Q.. ~ Kenneth .- Liston ::.:.:~'.~r- and - - ~ Liston and - z :::> <l: Liston r- ond -<l: Creek .:":Cfl:: Kokomo ~ ~ Creek Kokomo 0 ~ Creek Kokomo ~ Ls. Mbr. ~:w:'( Ls. Mbrs. a: Ls. Mbr. Ls. Mbrs. _ 0 0 Ls. Mbr. Ls. Mbrs.
fr :'.- ~~ ~ f2 1---------""------., .- a: u.. :r 1------<-<f U ~~ ~ a: :r S <l: (!) :r en M.issis- 9.<t":4 ~ ~ (f) Mississinewa ) ~ ~ ~ slnewa «flL ... ~ fT\ ~ Shale Member ) a: (l)
Sh. Mbr. t::·:·::~ (j) <l: (J) 0 <l: ~ t.lL .~~ 0 <l: ~ ~ u.. <l: ~ 1-------'-----7 ~.:: :.~ ::0 Z U en
<-.:. w . ~ c _ <t Z-.J
Mis sis sin e wa Shale Member
&w:·~ ~ ..J LL <l: _..J Z
E (:··~ 0 LOUISVILLE..J Z c:::: Louisville LOUISVILL \~'.~.) ~ <l: ~ _ ..J c:: 0 LlMESTONE~:.:-:·:.1 0 ....... (f) LIMESTONE W..J ~ equivalent
< •• ::.!< "r.. z <l:'-<l:
?:::'::~ I~II/)'o}- ~ <l: CJ) ~ ~~--------1 ~W-A-L-D-R-O-N-:F=-=M'-'--<-.. ? :.:'."::.} Illi-=> WALDRON FM. CJ) ~ e Waldron e~quivo~~
........ ~ brownn4'j:':":: ':'.:~ .L.ld.Llo'-'-loLlm.lJi-'-teLl.lJ...LL.L~~---=-:-,-: LL':-=I:=:'M=:-S'" E R LOS T) '" WQ..' Lim be r los t ' .... '-___ :~::.:. ________ ~'__D_O_LO_M_I_T_E __ _'~"_> _ _I: '""" ~ Dolomite Member
-.-. -.. : white •• dolomite
SALAMONIE DOLOMITE SALAMONIE DOLOMITE SALAMONIE DOLOMITE
Figure 1. - Chart showing the evolution of nomenclature of Middle (Niagaran) and Upper (Cayugan) Silurian rocks (from Droste and Shaver, 1982, Fig. 2).

3
vicinity of the Mississinewa-Liston Creek contact. As early
as 1927, in the work of Cumings and Shrock (1927), it was
noted that there was a decrease in the silica content of the
Mississinewa Member in a traverse from Yorktown to Kokomo
(30.28 percent at Yorktown to 15.90 at Kokomo).
Owens (1981) further developed this issue of using ter
rigenous clastics as a research tool in his work on the Mis
sissinewa Member. Owens determined two source areas for the
supply of detritus to the Mississinewa shale. Figure 2, a
map displaying the regional distribution of insoluble res
idues in the Mississinewa Member, indicates these two source
areas. One of these, southeast of the Wabash Formation out
crop area, was a clay-rich source. This source was supplied
via ocean currents carrying materials derived possibly from
the Appalachians, or exposed Ordovician sediments in the
Cincinnati area. Silt and clay from this source settled out
of suspension in high concentrations in the southeast of
Owens' study area (extreme southeastern Madison and Delaware
counties) (figures 3 and 4). Finer silt and clay remained in
suspension and was finally deposited further northwest in
substantially lower concentrations.
The second of Owens' sources was a sil~rich source
from the northwest (figures 3 and 4). Figure 5, a map illus
trating the regional distribution of silt-clay ratios in the
Mississinewa Member of the Wabash Formation, shows the greater
potency of the northwestern source as a source of silt.
Owens believed this source was of aeolian origin, blown into

4
~; I~::: "-:-- ~ H~.:I •• t~n" --' 'I ," i!!Jt ." I / 6'>.8' /~/ W?erl!:l
~~2 ·';4.58~ I 0' 'I .60.01 )l{e . I A) ~ ~
,f QI f7//, I 'L~/ J
~ , +-1' -.J ~O ." 1 I I .,.,"'"
- . ---J \ -t-=7>!)~~ I' ~ Howard I I Blackford
, ___ ~::B_~ r" _" ~ j ,,1 /" M.d; ••• ; I 0.1.0.', ~
..".."", i 3~8 : 'I ".of;)O~ N
F /" :. m-m-:'7-to- n-~o': I
I, /A"" ~f;)" ~2J ' -- , ----I
32.20' ./ " ./%.~ 6 37,40 .,. 6.-' , __ .-...G, __ ,
Scale I I 1 o 5 10
mil ..
Figure 2. - Map displaying the regional distribution of insoluble residues in the Mississinewa Member of the 1rJabash Formation. Notice areas of higher concentration at the northwest and southeast corners. Black dots represent localities where the entire stratigraphic sequence was sampled. Small tr~angles indicate sites where a single sample representative of the entire exposure was collected. Large black symbols indicate reef-proximal localities. Contour interval e~uals 10 percent (from Owens, 19~1, Fig. 9).

-
r-;;b~~ . j. . - . ~ . ---J wal Hunt ington
MIami '1 • ~48 . Y
I ~~ ?~!lY " ./ • • 2.8 /'
~~O i /~i~ ~ /_--...~ I A~ 42 . ",
,
. I .~.
IHowa~ ................. I Blackford
1)2.1 L . ..... ......
~TI.ton t--:?~O-d-i-Io-n' To',::,' ·I--N....J
I I (OmiItOn . rJ ~~. 4~.2 37. J' . ~ ~ I
fl' 0 . .
I ~ ~JlJ . L._.~·=~L.,
Seal. Contour Interval = 10% I A 1
o miles 10
Figure J. - Regional distribution of silt in the Mississinewa Member of the Wabash Formation. Notice increased silt in northwest and southeast corners. Values represent silt content as a percentage of total lithologic composition. Black dots represent localities where the entire stratigraphic sequence was sampled. Small triangles indicate sites where a singlE! sample representative of the entire exposure was collected (from Owens, 1981, Fig. 10).

6
N
I Mi~ I Wab:ab I Huntingto
6 . - 6.) ~ I 10 .9 -. I
I - 10 8 8. 9.1
eiiS"l •
I I L I Grant
r-- -~ -6.1 I Bl~kT-'~HOWard ! -S.3 --.lCOrd I
TiPt:n I Madison 1 Delaware -
I I
i HaJnil ;o;j 1 r :j I ~10 t4 ,-
• I AJ--~ SCALE
o 20
r- L;;;; J
1 inch = 20 miles
Figure 4. - Map illustrating the regional distribution of clay as a percentage of total lithologic composition. Notice areas of higher concentration of clay at the northwest and southeast corners. Contour interval equals 5 percent (from Owens, 1981, Fig. 12).
- -- -- .- .. _"

-
~~I .
. 1 ,.,
.
1
CONTOUR INTERVAL· 15.0 % I o
Scale
I 5
..,11 ..
1 10
Figure 5. - Map illustrating the regional distribution of silt-clay ratios in the Mississinewa Member of the Wabash Formation. Black dots represent localities where the entire stratigraphic sequence was sampled. Small triangles indicate sites where a single sample representative of the entire exposure was collected (from Owens, 1981, Fig. 11).

8
the marine waters from arid lands west of the Michigan basin.
The amount of detritus, from this source, decreased to the
southeast.
B. Significance
Should it be possible to determine some sort of pattern
in the silt and clay components of the Wabash Formation at
the Mississinewa-Liston Creek contact, it-might Bhed light
on the events that caused the abrupt lithic change at this
contact. Paleocurrents, paleowinds, and paleoclimatic events
might be deduced if this pattern could be applied over a
large area, such as northeastern Indiana.
C. Selection of Field Localities
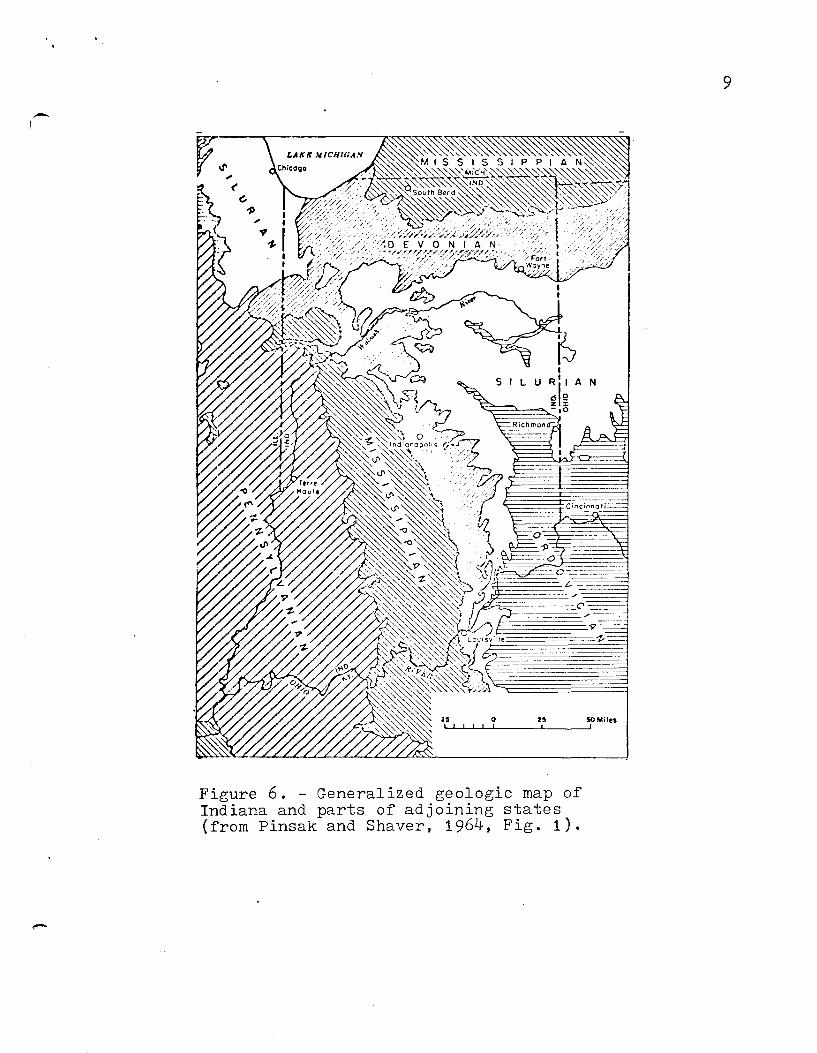
Silurian rocks in Indiana crop out in a broad belt in
northeast Indiana, extending southward in some areas (fig
ure 6). This general region became the basis for this study.
In. order to test Owens' data, and examine the upper
contact relationship of the Mississinewa with the overlying
Liston Creek, four sample areas were selected. Two of these
were in the vicinity of Wabash, at the northern end of the
Silurian outcrop area of Indiana. Two other localities were
selected at the southern edge of the Silurian outcrop belt
(figure 7). The exact locations of these localities are
as follows:
1. Wabash: Deep road cut on state road 13 on the south edge of Wabash, Indiana, North Reserve 55, T27N, R6E
2. Shanty Falls: 3 miles west of Wabash, Indiana, southern bank of the Wabash River, north Reserve 55, T27N, R6E
9
.-I
Fig~re 6. - Generali Indlana and parts 0 zed.g~ologic map of (from Pinsak and Shf adJolning states aver 1964 . , , Flg. 1).

- N
SCALE
o 20
~ b1Q1me:J 1 inch ~ 20 miles
Marion
Figure 7. - Map of study region showing sampling localities. site 1 - Wabash, site 2 - Shanty Falls, site 3 - Noblesville, site 4 - McCordsville Study region equals approximatelY 470 square miles.
10
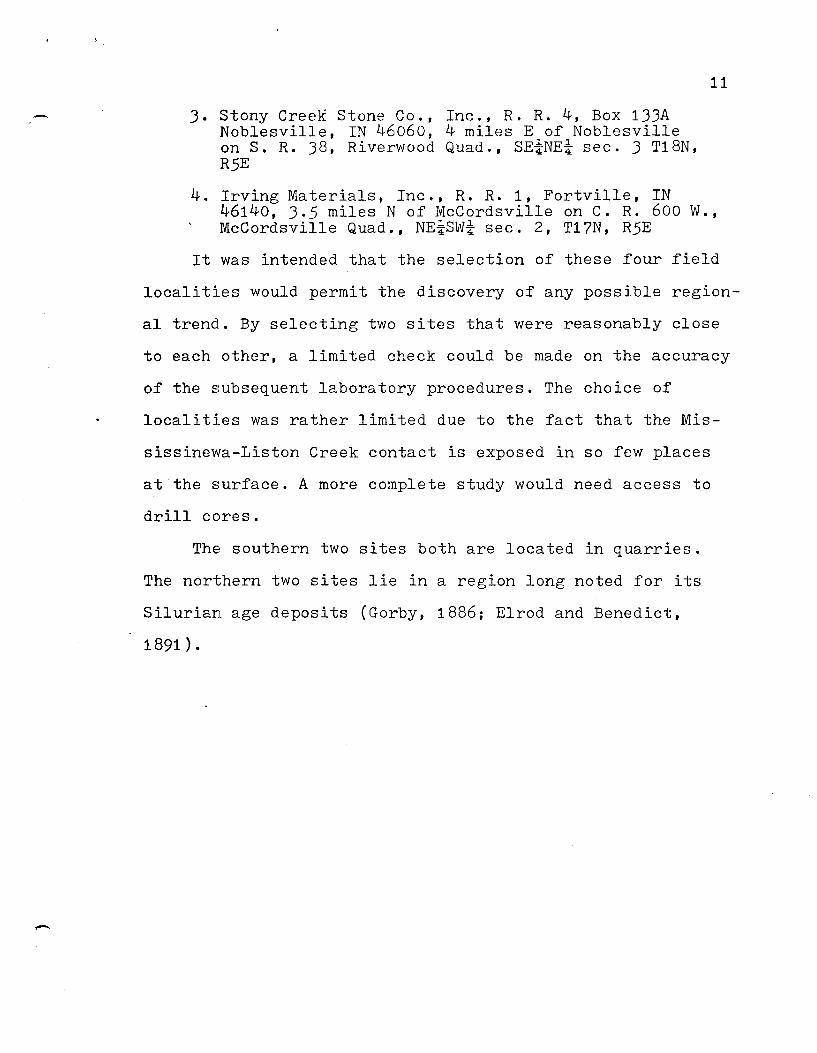
3. Stony CreeK Stone Co., Inc., R. R. 4, Box 133A Noblesville, IN 46060, 4 miles E of Noblesville on S. R. 38, Riverwood Quad., SEiNEi sec. 3 T18N, R5E
11
4. Irving Materials, Inc., R. R. 1, Fortville, IN 46140, 3.5 miles N of McCordsville on C. R. 600 W., McCordsville Quad., NEiswi sec. 2, T17N, R5E
It was intended that the selection of these four field
localities would permit the discovery of any possible region-
al trend. By selecting two sites that were reasonably close
to each other, a limited check could be made on the accuracy
of the subsequent laboratory procedures. The choice of
localities was rather limited due to the fact that the Mis-
sissinewa-Liston Creek contact is exposed in so few places
at the surface. A more complete study would need access to
drill cores.
The southern two sites both are located in quarries~
The northern two sites lie in a region long noted for its
Silurian age deposits (Gorby, 1886; Elrod and Benedict,
1891).

- N
fI SCALE
20 o I tm"mw:J
1 inch ~ 20 miles Marlon
Figure 7. - Map of study region showing sampling localities. site 1 - Wabash, site 2 - Shanty Falls, site 3 - Noblesville, site 4 - McCordsville Study region equals approximately 470 square miles.
10

- 3. Stony Creek Stone Co., Inc., R. R. 4, Box 133A Noblesville, IN 46060, 4 miles E of Noblesville on S. R. 38, Riverwood Quad., SEiNEi sec. 3 T18N, R5E
11
4. Irving Materials, Inc., R. R. 1, Fortville, IN 46140, 3.5 miles N of McCordsville on C. R. 600 W., McCordsville Quad., NEiswi sec. 2, T17N, R5E
It was intended that the selection of these four field
localities would permit the discovery of any possible region-
al trend. By selecting two sites that were reasonably close
to each other, a limited check could be made on the accuracy
of the subsequent laboratory procedures. The choice of
localiti.es was rather limited due to the fact that the Mis-
sissinewa-Liston Creek contact is exposed in so few places
at the surface. A more complete study would need access to
drill cores.
The southern two sites both are located in quarries9
The northern two sites lie in a region long noted for its
Silurian age deposits (Gorby, 1886; Elrod and Benedict,
1891 ) .

II. GEOLOGIC SETTING
A. Structural Setting
Structurally, Indiana is dominated by two basins,
separated by a system of arches. The axis of the principal
arch, the Cincinnati Arch, trends northward along the Indi
ana-Ohio State Line, then branches, with one branch that
trends northwestward, the other northeastward. In the vicin
ity of Cass County, the northwestern branch joins the Kanka
kee Arch, a southeastern extension of the Wisconsin Dome
(Becker, 1974). To the northeast of this feature is the
Michigan Basin, and to the southwest the Illinois Basin (fig
ure 8). Some earlier authors such as Pinsak and Shaver (1964)
termed the entire Cincinnati-Kankakee Arch system simply the
Cincinnati Arch.
During the Silurian, the area between the Michigan
and Illinois Basins was so broad that Shaver (1978) has
termed· this area the Wabash Platform (figure 9). This plat
form became the site of nilllerous pinnacle reefs. Along the
margins of the platform, barrier reef complexes developed.
The complex on the edge of the Michigan Basin has been termed
the Ft. Wayne Bank, and the one along the edge of the Illi
nois Basin, the Terre Haute Bank. These banks and individual
reefs have been the topic of numerous articles such as those

,----------LAX! MICHIGAN
I
, Wl.
I I
I I I
HUNTINGTON
GRANT
S'iiUIo.--' I I
.J Of lAtl
AUfN
... : ...... -;:j
WEUl ADAiiiNi
IlACKFORD JAY
WOOOlPH
WAYNE
o 2S Miles
2S o 2S Km I I I I I r
Figure 8. - Map of Indiana showing county names and major structural features (from Carpenter, Dawson, and Keller, 1975, Fig. 1).
1.3

? •
o 200 Miles t-I --LI-rl _~--1-.1 ---,J o 300 Km +
Figure 9. Map of the Great Lakes area showing paleogeography and locations of some but not all known discrete
-reefs (dots and stars), carbonate banks or barrier reefs (stipples), and gross structural-sedimentational features, all composited for Silurian time. Individual reefs are not shown in bank areas; arrows represent reported forereefto-backreef directions for given reefs (from Shaver, 1978, Fig. 1).

-I 15
by Carrozzi and Zadnik (1959), Textoris and Carrozzi (1964),
and Droste and Shaver (1980) to name but a few.
B. Stratigraphy of the Wabash Formation
The stratigraphy of the Wabash Formation and its adja-
cent formations have undergone a gradual evolution of nomen
clature. The Mississinewa and Liston Creek Members were
originally described respectively as an irregularly fractured
"cement rock" of approximately 135 feet overlain by 60 feet
of cherty limestone or "quarry rock" (Elrod and Benedict,
1891) .
The current nomenclature for the Niagaran and Lower
Cayugan Series began to take form through the work of Pinsak
and Shaver (1964). They named the stratigraphic sequence for
Indiana (oldest to youngest) as the Salamonie Dolomite,
Waldron Formation, Louisville Limestone, and Wabash Formation.
The Salamonie Dolomite is named from the exposures of dolomite in the headwaters area of the Salamonie River in the vicinity of Portland, Jay County, in east-central Indiana. It is characteristically a ligh-colored mediumgrained fossil-fragmental porous dolomite. The Waldron Formation in northern Indiana consists of distinctive mottled dark-gray and tan fine-grained to sublithographic argillaceous limestone or dolomitic limestone. The Louisville LImestone characteristically is tan and gray fine-to medium-grained thick-to medium-bedded fossilfragmental limestone and dolomitic limestone. The Wabash Formation has two major subdivisions, the Mississinewa Shale Member and the Liston Creek Limestone Member. The Mississinewa Member generally is composed of gray fine-grained argillaceous silty dolomite and dolomitic siltstone and minor amounts of pyrite. The Liston Creek Member consists of a light-gray and tan fine-to mediurngrained fossil-fragmental cherty limestone and dolomitic limestone (Pinsak and Shaver, 1964, pp. 24-39).
This nomenclature has been modified twice since its
inception by Droste and Shaver (1976) who proposed the name

-I
16
Limberlost Dolomite be used for the upper portion of the
Salamonie Dolomite. This unit was formerly termed the brown
upper part of the Salamonie Dolomite, but was renamed the
Limberlost Dolomite due to its differing lithology. In ad-
dition,
the Limberlost Dolomite represents the onset of restrictive Salina influences within the Michigan Basin that transgressed in time onto the Wabash Platform as far south as Indianapolis (Droste and Shaver, 1976, p. 1).
Droste and Shaver (1982) further proposed the combin-
ation of the Limberlost, Waldron, and Louisville Limestone
Formations under the new name Pleasant Mills Formation. This
. proposed regrouping is designed to reflect, considering the
Great Lakes area as a whole, a complete facies relationship
that existed between the evaporites of the Michigan Basin
and the interbasin rocks of the Wabash Platform. The Pleasant
Mills and Wabash Formations are subsequently placed in the
Salina Group, a name previously applied only to the evapor-
ites of the Michigan Basin. Figure 1 shows this gradual ev-
olution of nomenclature.
In keeping with this new nomenclature, Droste and Shaver
'(1982) have extended the Wabash Formation northward into the
Michigan Basin
to include all rocks in the upper part of the Salina Group, that is, those Salina rocks lying above the Pleasant Mills Formation (Droste and Shaver, 1982 p. 21) .
Southwestward, the Wabash Formation is roughly correlated to
the upper Moccasin Springs Formation and lower Bailey Lime
stone of the Illinois Basin. Figure 10 shows these correla-
tions.

-
17
'Z ct (.)t/'I
a: uJ
wa: :i: W ctt/'l
Z z
<t (!)
=>
-----SOUTHWESTERN
AND
SOUTH-CENTRAL
11.
INDIANA
UJ Z o ~ (/)
UJ ::!!
>.! X.J:l
~:i! ~ Q)
u c o
co III ... (II
)- ~
.J
>UJ .J
OIl E :i:.::i
.. <t" "0'"
u
z
UJ
.. ~ ..
cr 11. (/) . u u
ID :x: (/)
<[
UJ UJ .J Z .J 0 > ~ (/) Vl
AREA OF THIS REPORT, NORTH-SOUTHERN
CENTRAL AND WESTERN MICHIGAN
NORTHERN INDIANA OHIO
BASS IS. GR. i<.!)
Iu.. LL
Kenneth Liston and uJ Creek w Q.
Ls. Mbr. Kokomo ~
Ls. Mbrs. 0 0 ....................................... 0: ................... .
Mississinewa
--- Shale Member --- ro---------<[
N Z I
Louisville <t
equivalent .J
(.)
N I
<t
....... .. ~ .... o . W
~ :i! •.. 0
z
o
z
::!:
w z o ~
Vl
.J .J
W. FM. UJ ~
OIl
:i! ~ o .J:l
Limber!ost Dolomite Member
o I
<t
.J ~ o :i! UJ o ~ ~
.J ~ <[ ~ o-cr w ~ cr z :'!!
<[ z .J SALAMONIE DOLOMITE C> 0 0<[0 ...J ~ 11. .J U 0 0 <[cr ~ 0
.••••.•.• ::!: ............................................................................................... . • 'U .... U 0 ~ <[ 0 - ......
o C1' OIl
o z o
Figure 10. - Chart showing the evolution of nomenclature of Middle (Niagaran) and Upper (Cayugan) Silurian rocks (from Droste and Shaver, 1982, Fig. 2).
Z <t (J) W W 0... -0 a: a: w ~ (J)
uJ
z c::x:
-1 0 0
0:: a..
Z
c::x:
> 0
-1
0
=> .J
Z
c::x:
~
u 0 .J
Z W
3:
OZ oc::x: z-c::x:O:: .JW -.J~ .!
.-I
18 "
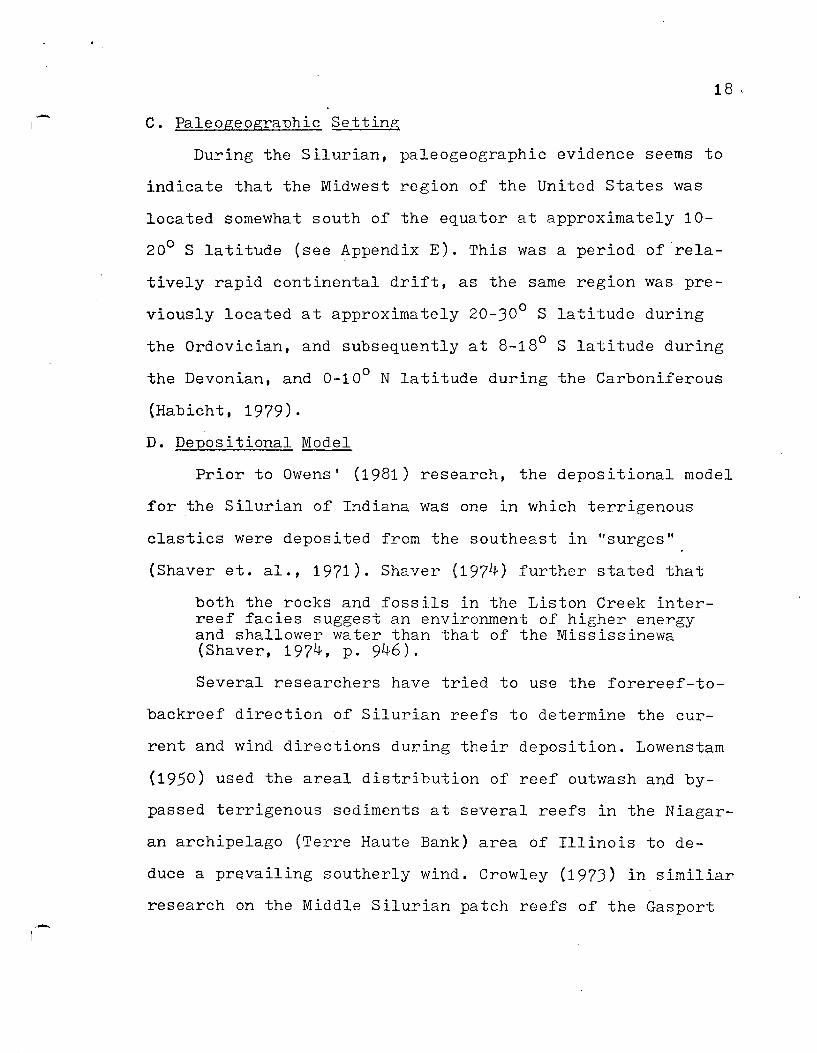
C. Paleogeographic Setting
Du~ing the Silurian, paleogeographic evidence seems to
indicate that the Midwest region o£ the United States was
located somewhat south o£ the equator at approximately 10-
200 S latitude (see Appendix E). This was a period o£"rela-
tively rapid continental drift, as the same region was pre
viously located at approximately 20-300 S latitude during
the Ordovician, and subsequently at 8-180 S latitude during
the Devonian, and 0-10 0 N latitude during the Carboni£erous
(Habicht, 1979).
D. Depositional Model
Prior to Owens' (1981) research, the depositional model
for the Silurian of Indiana was one in which terrigenous
clastic;s were deposited from the southeast in "surges"
(Shaver et. al., 1971). Shaver (1974) £urther stated that
both the rocks and fossils in the Liston Creek interreef facies suggest an environment of higher energy and shallower water than that of the Mississinewa (Shaver, 1974, p. 946).
Several researchers have tried to use the forereef-to-
backreef direction of Silurian reefs to determine the cur-
rent and wind directions during their deposition. Lowenstam
(1950) used the areal distribution o£ reef outwash and by-
passed terrigenous sediments at several reefs in the Niagar-
an archipelago (Terre Haute Bank) area of Illinois to de
duce a prevailing southerly wind. Crowley (1973) in similiar
research on the Middle Silurian patch reefs of the Gasport

-
--I
19
Member (Lockport Formation) in New York came to the conclu
sion that wind-generated currents from the northwest were
responsible for the north-to-south forereef-to-backreef re
lationships that he found.
-III. FIELD METHODS AND LABORATORY PROCEDURES
A. Field Methods and Sampling
The Mississinewa-Liston Creek contact at the four
sample sites was deduced on the basis of differences in
lithology and weathering profile. Once the contact was ident
ified, samples were taken above and below the contact. Above
the contact, samples were taken at six inch intervals be
ginning at the top of the contact itself. This was continued
up section to three feet above the contact. Below the contact,
samples were taken at foot intervals beginning at the base
of the contact. This was continued down to three feet below
the contact. A total of eleven samples was taken at each
of the sampling sites.
For each sample collected, several pieces of rock were
taken for a total of approximately 500 grams. Great care was
taken to collect samples that were in place, not talus from
higher. layers, as this could badly confuse results.
B. Laboratory Procedures
Laboratory analysis was initiated with two goals in
mind. The first of these was to determine the percentage of
detritus in each sample. The second goal was to acquire a
grain-size distribution for each sample by the pipette method
of Folk (1968).

-
21
1. Insoluble Residue Analysis
Insoluble resfdue analyses were conducted to deter
mine the vertical distribution of insoluble detritus above
and below the contact at each site. The method used was sim
iliar to that used by Owens (1981) with some personal mod
ifications.
The detrital analysis of each sample began with weigh
ing out approximately 100 grams of sample. This sample was
then crushed with a rock hammer to marble-sized chips. These
were sU~Jmerged in a 25% HCI solution, with additional acid
added when needed to completely dissolve the sample. Once
the carbonate was dissolved, the sample was filtered through
filter paper to catch the detritus. The filtered sample was
then "flushed" several times with distilled water to cleanse
it of any unreacted HCI that might cause flocculation in
the pipette process. The detritus was dried and weighed, and
its percentage as part of the original sample weight was
calculated (figure 11).
2. Pipette Analysis
Ten to fifteen gram samples of the insoluble residue
derived from the dissolution process were next run through
a 4~ wet sieve in order that the sand and mud fractions
might bl~ split. It was found that almost the entire amount
of each sample was less than 4% (silt and clay). What was
not, was dried and weighed to determine the mass of the sand
fraction.
Insoluble residues of the mud size range can be analyzed
by the procedures outlined by Folk (1968). The core of this

)
Calcite Digestion Dolomite Digestion
/~ I Crush > Add Recharge Recharge Filter, Calculate Sample 25% > Spent ) Spent > Wash ') Percent
HCL Hel HCl With Detrital (warm) Distilled
Figure 11 - Insoluble Residue Procedural Flow Chart (modified from Owens, 1981, Fig. 5)
Water, Dry
1\) 1\)

process is an equation derived from Stokes Law:
T = D 1500 x A x d 2
where: D is equal to the depth of pipette submersion
1500 is a constant
A is a constant dependent upon temperature at the time of the experiment and particle density (assumed to be that of quartz)
d is the diameter (mm) of the various particle sizes the experimenter wishes to retrieve
T is settling time (in minutes) required for the particle to settle a given distance beneath the surface
2J
The methodology of the procedure was to take each mud
fraction that passed through the wet sieve and place it in
a standard kitchen blender with additional dispersant solu-
tion. This solution had dissolved in it a calgon dispersing
agent .(7.4g/liter). The mud sample was then mixed for several
minutes and placed in a one liter graduated cylinder.
The graduated cylinder was next allowed to set out over-
night. The purpose of this was twofold. First, to see if the
dispersant was of sufficient concentration, and second, so
that the temperature of the water in the cylinder could
equalize with the room temperature. The following morning,
the cylinders (usually in groups of three) were placed in an
insulated ice chest. Alequots of 25 milliliters were drawn-off

-
--
24 c
by pipette at the required times calculated by the equation
given on the previous page, and placed in pre-weighed beakers.
After each withdrawal, the ice chest was sealed in order that
the initial temperature (the one the values for T were based
on) could be maintained. The beaker was next dried in 'an oven
and weighed. The mass of the dried sample was miltiplied by
40 (because the 25 milliliter alequot was 1/40th of the whole
liter) to find the mass of particles still in suspension.
The difference in mass between two successive alequots cor
responds to an entire % size which has settled out of suspen
sion. (figure 12). A sample data sheet is found in Appendix A.
c. Procedure Reliability
Two preparations of each rock sample were processed.
The data from these two trials were then compared for dis
crepancies. This means that a total of 88 trials were run
through the above-discribed procedure.

) )
Weigh san1fSize Fraction
10-15' Gram ) Add Dispersent ) Wash through . > Place in Sample Solution and Wet Sieve Graduated
Check --~) Dispersion
Effectiveness.
Blend Cylinders
Figure 12. - Pipette Analysis Procedural Flow Chart (modified from Owens, 1981, Fig. 6)
~ Stir and Initiate Timing
~ Calculate Cumulative Percentages ~
Plot DistributiQns on Log-Probablllty Paper
l\) V\

-IV. INTERPRETATION
The data generated from laboratory analysis was used to
construet a series of graphs. In the plotting of these graphs
(see Appendixes B-D), along the ordinate was placed the rela
tive position of the sample above or below the Mississinewa
Liston Creek contact. Each foot interval over which the sam
ples were taken was given a constant interval on the graph.
This interval was also used to separate the sample taken below
the contact from the one taken above the contact for an em
phasis of the contact itself.
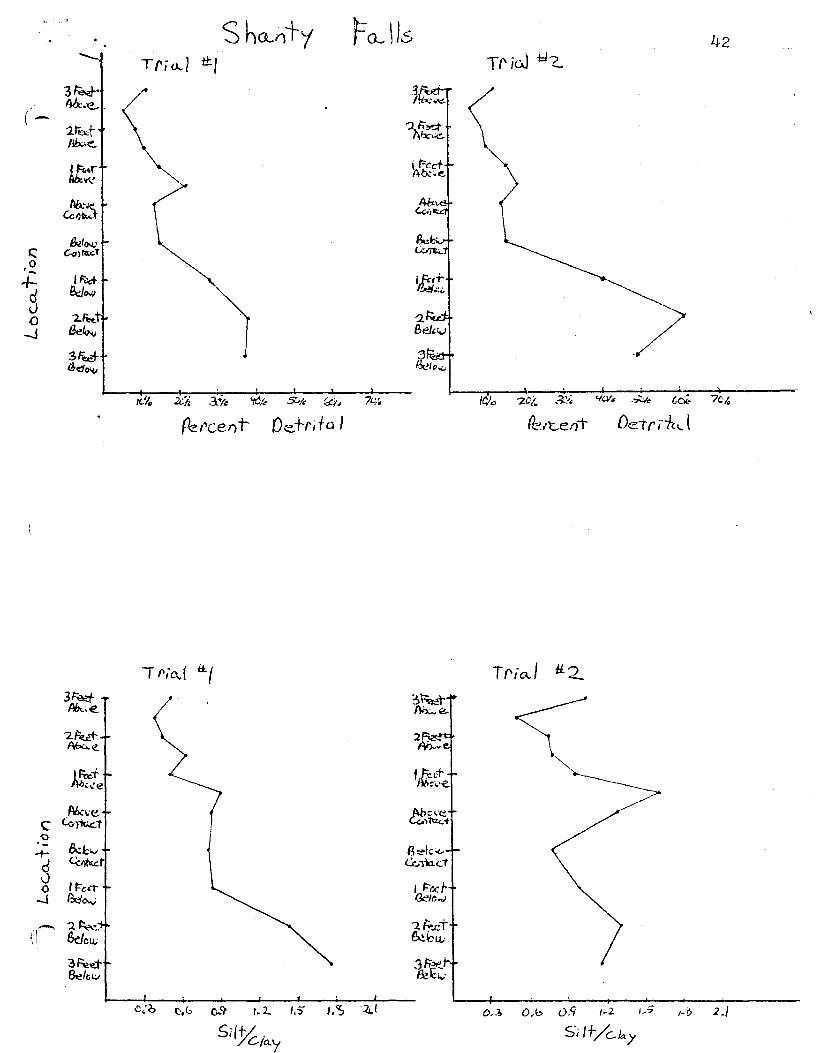
All four sequences of Mississinewa-Liston Creek samples
show some decrease in detrital content as the contact is
approached. The site that shows the least decrease in per
cent detritus is the McCordsville site, which is the site
nearest the clay-rich source area southeast of the study area.
The other sites showed a much greater decrease in detritus
at the contact, especially the northern two sites near Wabash
(see Appendix B).
The silt/clay curves for the sites show a less pro
nounced pattern (see Appendix B). At three of the sites
(Wabash, Shanty Falls, and Noblesville) there is a general
decrease in the ratio up section. At the McCordsville site,
the ratio actually increases somewhat above the contact.

-I
27
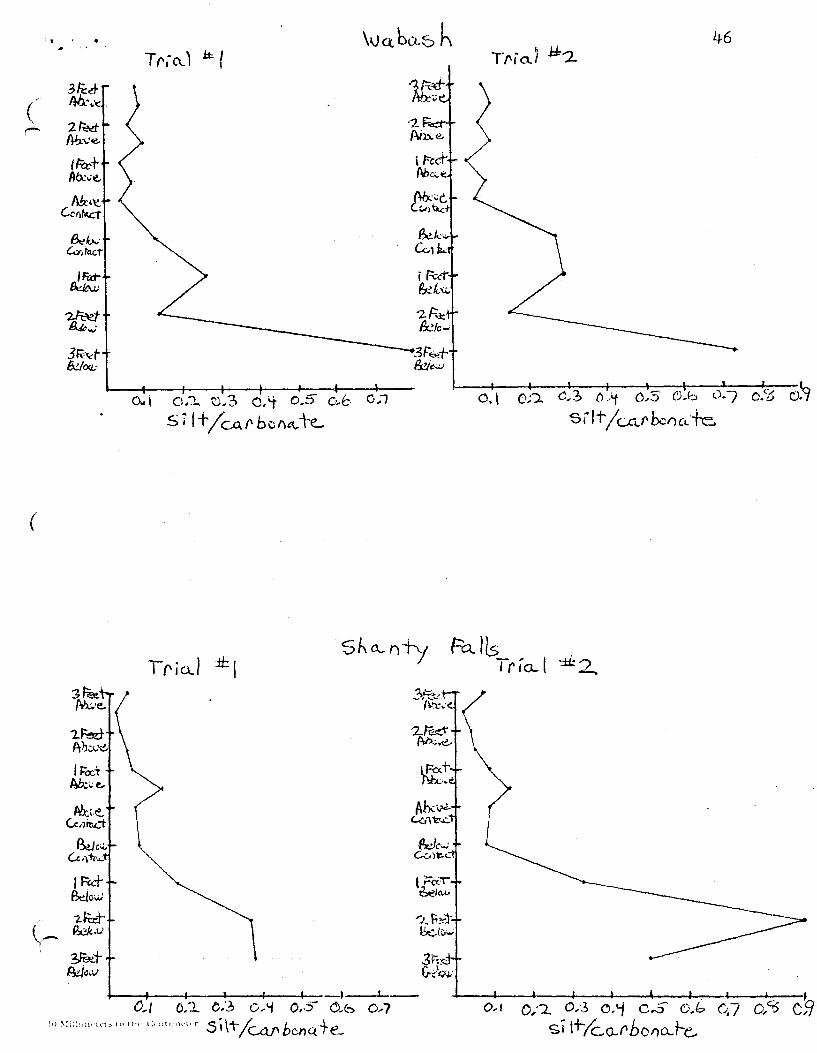
When the silt "and the clay content for the four sites
are plotted against the carbonate content (that is assuming
that the parameter of carbonate production is somewhat con
stant) an interesting pattern emerges (see Appendixes C and
D). The northern two sites show almost no silt a~ter Missis
sinewa depostion stops. The southern two sites, Noblesville
and McCordsville, show a somewhat higher level of silt versus
carbonate, but these higher levels characteristically appear
in surges at different distances above the Mississinewa
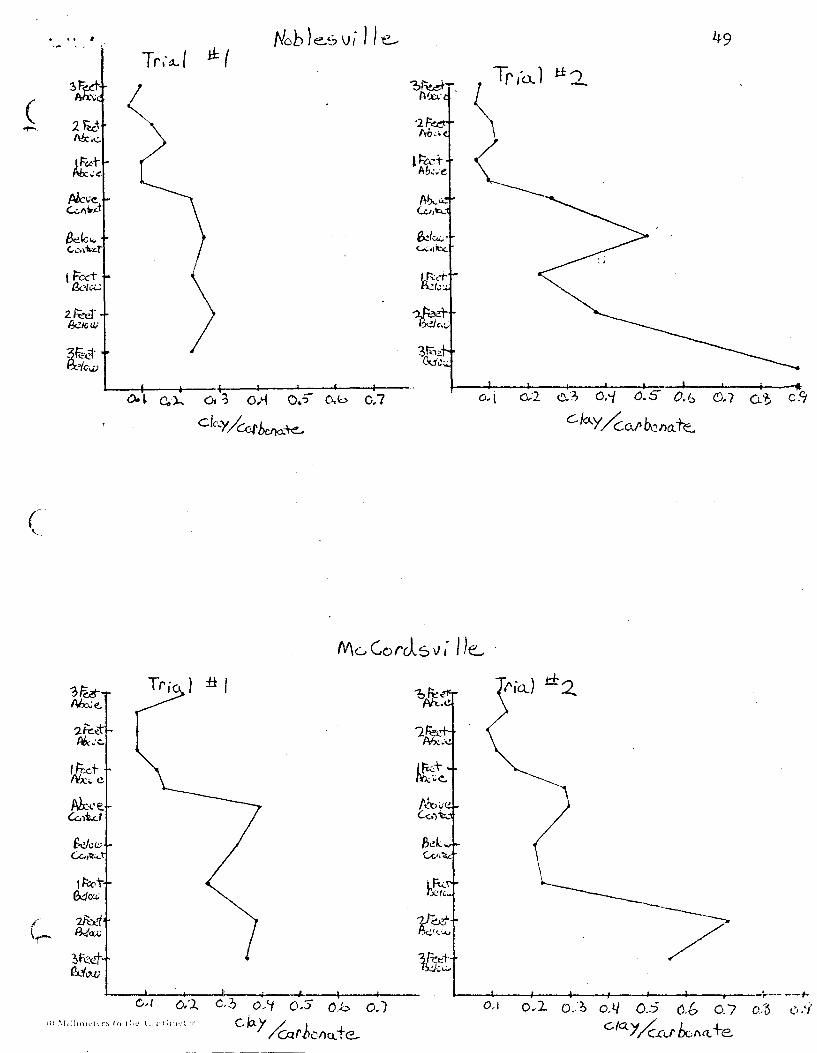
Liston Creek contact. The clay versus carbonate of these two
southern sites also show surges· in clay content. These in
creases in clay at Noblesville and McCordsville occur in the
same samples as do the surges in silt, and again, the McCords
ville site shows somewhat higher levels than that of the
Noblesville site. The clay versus carbonate curves of the
northern two sites, Wabash and Shanty Falls, show generally
uniformly lew levels after the end of Mississinewa deposition.
A further analysis of the data was made by constructing,
for each sample, a grain-size distribution curve on prob
ability paper. A comperison of these curves was made to that
of a cumulative grain-size distribution of a loess deposit,
the type of curve match on which Owens (1981) based his
theory of aeolian transport (figure 13). The curves of those
samples below the contact closely matched the loess deposit
curve, those above the contact did not.
It is this author's interpretation that after the end
of Mississinewa deposition, the supply of northern silt

28
4 5 7 9i SIZE
8 9 10
CUM % 99
Figure 1J. - Comparison of cumulative grain-size distributions of a loess deposit, Nemaha Gouny, Kansaa (after Swineford and Frye, 1945) to those of samples below and above the Mississinewa-Liston Greek contact.
II' • • cumulative grain-size distribution of a loess deposi C
(8 E1 [!j typical cumulative grain-size distribution below Mississinewa-Liston Creek contact
e 9 9 typical cumulative grain-size distribution above Mississinewa-Liston Creek contact
stopped. This is suggusted by both the detritus and cumula
tive grain-size distribution curves. What is left of the
terrigenous clastic supply is being supplied in surges from
the southeastern clay-rich source only. The bulk of this
material settles out. of suspension long before it reaches
the northern two sites of Wabash and Shanty Falls. In fact,
a great portion of silt-sized particles settled out be
tween the sites of McCordsville and Noblesville.
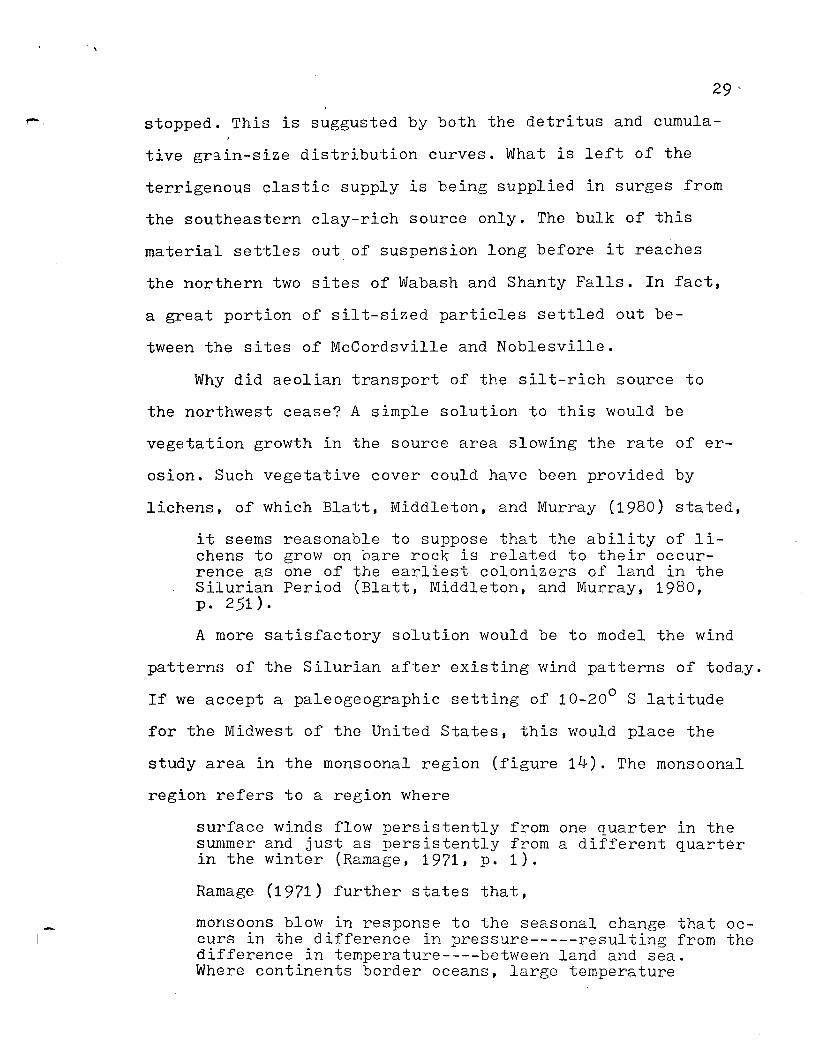
Why did aeolian transport of the silt-rich source to
the northwest cease? A simple solution to this would be
vegetation growth in the source area slowing the rate of er
osion. Such vegetative cover could have been provided by
lichens, of which Blatt, Middleton, and Murray (1980) stated,
it seems reasonable to suppose that the ability of lichens to grow on bare rock is related to their occurrence as one of the earliest colonizers of land in the Silurian Period (Blatt, Middleton, and Murray, 1980, p. 251).
A more satisfactory solution would be to model the wind
patterns of the Silurian after existing wind patterns of today.
If we accept a paleogeographic setting of 10-200 S latitude
for the Midwest of the United States, this would place the
study area in the monsoonal region (figure 14). The monsoonal
region refers to a region where
surface winds flow persistently from one quarter in the S~lmer and just as persistently from a different quarter in the winter (Ramage, 1971, p. 1).
Ramage (1971) further states that,
monsoons blow in response to the seasonal change that occurs in the difference in pressure-----resulting from the difference in temperature----between land and sea. Where continents border oceans, large temperature
-I
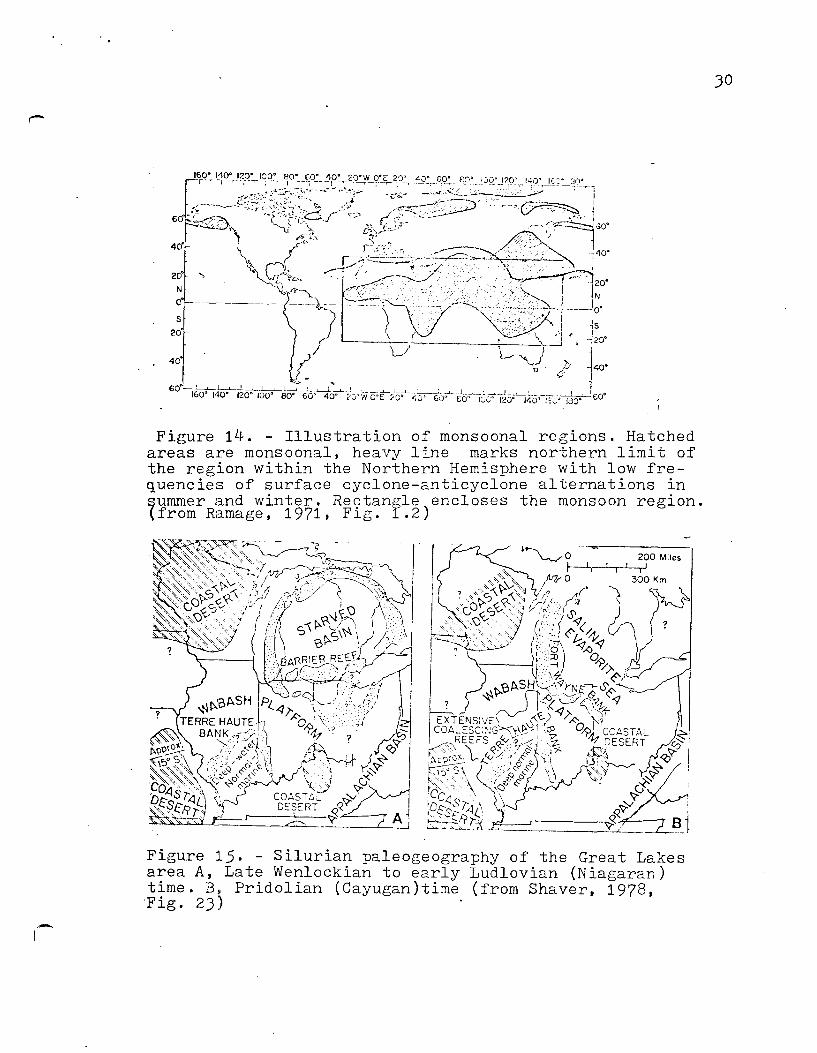
Figure 14. - Illustration of monsoonal regions. Hatched areas are monsoonal, heavy line marks northern limit of the region within the Northern Hemisphere with low frequencies of surface cyclone-anticyclone alternations in 9ummer and winter. Re<;:tangle encloses the monsoon region. \from Ramage, 1971, Flg. 1.2)
Figure 15. - Silurian paleogeography of the Great Lakes area A, Late Wenlockian to early Ludlovian (Niagaran) time. B, Pridolian (Cayugan)time (from Shaver, 1978, "Fig. 23)
30

differences and hence large differences in pressure might be expected. However, the shapes of continents and their topographies, as well as variations in seasurface temperatures, all interact to produce considerable regional and temporal variability in the monsoons.(Ramage, 1971, p.8) .
. During the summers in monsoonal regions, land masses
31 .
heat-up more rapidly than do the nearby bodies of water, and
subseqUE:mtly become areas of low pressure; such a region is
termed a cyclone. The wind direction of a cyclone is counter-
clockwise in the Northern Hemisphere, clockwise in the South-
ern Hemisphere. During the winter, the same land masses cool-
off more rapidly and become areas of high pressure; such a
region is termed an anticyclone. The wind direction of an
anticyclone is clockwise in the Northern Hemisphere, counter
clockwise in the Southern Hemisphere (Ramage, 1971).
Desert regions are excellent examples of regions that
seasonally change temperature. Just such a region is theorized
by Shaver (1978) to have existed to .the northwest of the study
area (figure 15). This desert region, along with a paleo
geographic setting of 10-200 S latitude would suggest a
modeling of the Silurian in this area after the present East-
ern Africa and Western Indian Ocean region.
The African continent spans the equator and so in January radiational cooling results in high pressures over the Sahara and Arabia; radiational heating results in low pressure over the Kalahari Desert. The consequent north-south pressure gradient sets up a flow of air from north to south across the equator. The most intense heat lows overlie deserts and occupy the same latitude over the oceans. In contrast to January, radiational cooling res~lts in high pressure over the Kalahari Desert, and radiational heating, in low pressure over the Sahara.
The south-north pressure gradient sets up a southerly flow across the equator, eventually merging with the southeast trades over the southern Indian Ocean and with the southwest monsoon north of the equator. The upwelling effect, mentioned above contributes to the southerly monsoon being stronger than the northerly monsoon of January (Ramage, 1971, pp 11-16).
This seasonal variation in wind, besides being an ex-
cellent model, might explain the differences in wind dir-
ection cited by Lowenstam (1950) and Crowley (1973). At
the close of Mississinewa deposition this seasonal varia-
tion in wind must have been disrupted by continental drift
or some other mechanism.
The southeast current needed to supply detritus from
32
the clay-rich source to the southeast of the study area would
also exist in the Eastern Africa and Western Indian Ocean
region. Figure 16 shows a clockwise current existing in the
Indian Ocean today that would fit nicely.

-
--------- -~-- ---------.....,r
Figure 16. - Present world distribution of arid zones and ocean c~rrents. solid arrows-cold currents, dashed arrowswarm currents, dotted areas-deserts, diagonal lined areassteppes (from Habicht, 1979, Fig. J).
JJ <

v. CONCLUSIONS
The Mississinewa-Liston Creek contact represents a
change in the depositional environment in the northeastern
Indiana region. It represents the transition of an area
being supplied by two terrigenous clastic sources, to an
area being supplied by onJ.y one source. The events that
triggered this change are only conjecture upon the part of
this author. Possible explainations for this change are
changes in the wind pattern caused by continental drift,
or vegetation growth in a terrestrial source area that existed
to the northwest.
-.
-
VI. REF'ERENCES CITED
Becker, Leroy E. 1974, Silurian and Devonian Rocks in Indiana Southwest of the Cincinnsti Arch: Indiana Geol .. Surv. Bull. v. 50, pp. 83.
Becker, Leroy E., and Keller, Stanley,J. 1976, Silurian Reefs in Southwestern Indiana and Their Relation to Petroleum ACGumulation: Indiana Geol. Surv. Occasional Paper 19, p. 11.
Blatt, Harvey, Middleton, Gerard, and Murray, Raymond. 1980, Origin of Sedimentary Rocks: Prentice-Hall Inc., Englewood Cliffs. New Jersey. p. 251.
Carpenter, G. L., Dawson. T. A .• and Keller, S. J. 1975, Petroleum Industry in Indiana: Indiana Geol. Surv. Bull. v. 42, p. 57.
Carrozzi, A. V. and Zadnik, V.E. 1959. Microfacies of Wabash, Indiana: Jour. of Sed. Pet .• V. 29, pp. 164-171.
Crowley. D. J. 1973. Middle Silurian Patch Reefs in Gasport Member (Lockport Formation), New York: Am. Assoc. Petroleum Geol. Bull. v. 57, pp. 283-300.
Cummings, E. R., and Shrock, R. R. 1928, Niagaran Coral Reefs of Indiana and Adjacent States and Their Stratigraphic Relations: Geol. Soc. Amer. Bull. v. 39. pp. 579-620.
Droste, John B., and Shaver, Robert H. 1976, The Limberlost Dolomite of Indiana; a Key to the Great Silurian Facies in the Southern Great Lakes Area: Indiana Geol. Surv. Occasional Paper 15. p. 21.
____ -= __ . 1980, Recognition of Buried Silurian Reefs in Southwestern Indiana; Application to the Terre Haute Bank: Jour. of Geol. V. 88, pp. 567-587.
______ ~. 1982, The Salina Group (Middle and Upper Silurian) of Indiana: Indiana Geol. Surv. Special Report 24, p. 41.
Elrod, M. N .• and Benedict, A. C. 1891, Geology of Wabash County: Indiana Dept. of Geology and Nat. Resources, Ann Report 17, pp. 192-272.

----!
Folk, Robert L. 1968, Petrology of Sedimentary Rocks: The University of Texas, pp.170.
36
Gorby, S. S. 1886, The Wabash Arch: Indiana Dept. of Geology and Nat. Resources, Ann. Report 15, pp. 228-242.
Habicht, J.K. A. 1979, Paleoclimate, Paleomagnetism, and Co~tinental Drift: Am. Assoc. Petroleum Geol. Studies in Geology no. 9, pp. 1-30.
Lowenstam, H. A. 1950, Niagaran Reefs of the Great Lakes Area: Jour. Geol. v. 58, pp. 430-487.
Owens, Robert N. 1981, Petrologic Analysis of the Mississinewa Member of the Wabash Formation and the Effect of Reef Proximity on interrreef Sedimentation: unpub. M. S. thesis, Ball State Univ., Muncie, Indiana, pp. 1-83.
Pinsak, A. P., and Shaver, R. H. 1964, The Silurian Formations of Northern Indiana: Indiana Geol. Surv. Bull v. 32, pp. 1-87.
Ramage, C. S. 1971, Monsoon Meteorology: Academic Press, New York and London, pp.296.
Shaver, et al. 1971, Silurian and Middle Devonian Stratigraphy of the Michigan Basin; a View from the Southwest Flank, in J. L. Forsyth, ed., Geology of the Lake Erie Islands and Adjacent Shbres: Michigan Basin Geol. Soc., pp. 37-59.
Shaver, R. H. 1974, The Silurian Reefs of Northern Indiana; Reef and Interreef Macrofaunas: Am. Assoc. Pet. Geol. Bull. v. 58, pp. 934-956.
, and others. 1978, The Search for a Silurian Reef Model Great Lakes Area: Indiana Geol. Surv. Special Report 15, pp. 1-36.
Swineford, A., and Frye, J. E. 1945, Petrographic Comparison of Some Loess Samples from Western Europe with Kansas Loess: Jour. of Sed. Pet. v. 25, pp. 3-23.
Textoris, D. A., and Carrozzi, A. V. 1964, Petrography and Evolution of Niagaran (Silurian) Reefs, Indiana: Am. Assoc. Petroleum Geol. Bull. v. 48, pp. 397-426.

Appendix A
Pipette Analysis Data Form
-I

) PIPETTE ANALYSIS DA~A FORM
1
SAMPLE NO. LOCATION ______________________________________________________ ___
EXPERIMENTER'S NAME REMARKS ______________________________ _
TEMPERATURE CONCENTRATION OF DISPERSENT ____________ _
rJ ,4';_""", P \..liOlU. depth(cm) time beaker no. sample and
beaker beaker sample wt. wt. X40
dIspers cum.~.
74 Z4
~ ~6
S2 Z8
~ < 10
weight obtained by wet sieving- ______ {Sl
100(S+(F-P) ) S+F
__ ilQQSl [S+F)
{f)
(p)
(rl __ 1._p.<-.1 __
{p)
-- ~(P,-,-)--.
(pl
\..oJ co

----I
Appendix B
Stratigraphic Distribution of Total Detritus (percent insoluble) and Silt/Clay Ratio

3~1"
r Ao:-,;e,
t-I '2.~
AtN<...
t R\.-t ~
Ab;1J~ <...NI)~(
BJow ~'fltac;
©;. ,~
2F6:t &/ow
3tcd &Io<.u
(
3~~
2~ f'ki,;4
1f::tx1-nb:i.~
!! .. ~ 141-
~/~ .. G..:.i\
i foot 8..~ON
~-2fe.z\ &!ie.1i
3~">t:i-~IOVJ
Tf'io...l ±l:.1 I
( ~
'\
Tria. I H(
MG coP-OS \.r~1-LE ) l=rlDTN'v'A -r('io..l ±:l.:2
40
b_'ic ;Ut 3 . .'10 I.{c/" :;";"'1,, (:<::i~ ?I)}.
fulc:t.. < .. urkd
Fk::tcen+- De +1' j' itt. i
\ ~--I-~!IIII
0..0 o.~ 08 j.1. L::> ,S 2 .. / I I I l-f
II) \;"~:.",,,r<d" II,,, C.nti""·,,. 5/1+;e.Iu.y 0 .. 6 0,10 08 1~7_ ;.5 I'~ :2.!
S;/i/C/QY

Noblesv i I Je~ J j: n cl. i'ClnCL
I {' i t.l I H. ( Tria. I ..Y 2. 41
3~t
(:-. Ab .. :l:
2#ee1" A~'~
I~ Abc"f!:,
Abc~'e c".,,,,",-
c .:?
1F=c.:r ~ Bt:,",-,
V 0
"2.~t -.J &If,,,,,
3n lX.jc~
2i:)'(., .'11;:11: 'tC1" ~c!.. be;:.
fkrcen+ De.t,'1/-k I f I .1 < I
-:;>'::;'1, I{:::/<. .:Xl. e-C.'Ii 7cl ..
~('ce/')-t- ~+I'i+c\.l
Tried t±/
'3~~T Ilb..;v e
2Nd' Abo.;lZ.
i ~a:J-Ab;.y(L i~
Abtl-<!o
C c:...:..lf1:4' <>
~ tkak\;.l
Gu\fu.c:t 0 0 I~Cl..i-
--.I Beio.u
, . ,,.-., '2~t \1 &ow
3Fe.i:: 8elc ......
o.~ t. ?> 0.'1 1.'1 1.:1 1.C6
5,' It/C/Q."j
,
(-:2.~t /1J:,.;;.<!.
, ~ .. f" AbG,«
Ab.. .. a Cc/)lI.<,;
RYcIO<J; C C-ol~t
,~
+- 1""4+
3 8dQo.lJ
'l.~ 0 -J &~
3V ~f!J0'<;
3~ Pix..€.
2M Abc...e
~~:e Abc~'e
C' "'lit;c.t -0 '- &lcv -+-d ~ v
I r=-~.,.. 0 -J &de-...;
- '2.~ /,1 6do~
3~.a-(klcv
S ha..nty Tfio...) ttl
'1 I I I
K? 2<:k 3:+ic 'tCk s:.,R (,q~
Pe,'ceT)t- Oe+l'jfa J
T (lj(".! at
~CL\15
I 7t7~
.3~ I. -.:.-.:!
,\h:~ Ix~
13~1c"" ~ ... 1b.c:t
42 Tf'icJ hI? -
» , I , .
i4'", 2Ci'., .~~;. <io.r~ .~t'.! co;;. 7Ck
fl:, ... t..e;') 1- Detrdc. .... t
Tf'io.../ #2.
0 .. ; O,b 0.9 ,~2 13 I-t> 2.'
Si/t/Ck)'

3Fe21
C I!b..ve.
'2~<rl AJ,cile
tFi:c+ Ab,;.c,.
~~ Ii!ICI.;l
C<1)iwr...+
I~f-G:k ...
Zr:c:et-6eit· ...
31e€t 8c!Jo~
(
~Ib!.T Abc.vc
(-d
Trio.. Itt I W(.L b(\.s~ ) Tnl.:l j'({ tl ~
to1o I I ,
10k ,:):"/. ~% 5C;~ &::ic . )(}" Percen+ Del-I' ," iu.1
TI' /0..1 ttl
~
/ , 0)1 I. 'l.. IS
S.!f/ C/a..y 1,/
3fJ:cl
'2~i ~~
l~t.
~L L<"l
Tf'iG\./ H: 2. 43
iclo 2c1: ,;:;;; 4D/, SC;J bd.. 74'.
Perce n+ Oe. tl' /'1cL (
fl'ia.1 ±t-z..
0.'3 o .. CI I.'l. 1.5 5;'/f/C k1

-
Appendix C
Stratigraphic Distribution of Silt/Carbonate Ratios

(~
( ,.
3h:<!t ~.'<-
~~fI.+ t.::... c..
I F'",t A~;e-
Ab;..:~ C",k,..
&iOJJ C,.l~
I tu;t' &feCI.'
2~t G:J~
3fc\1:t &lciJ)
3~f\~.e,
2ka.~ flh;-I!
(~ L~ 3~t &Ic ....
Trio .. \ i!.1
0,1 (',,'--L C),3 C .. li (;.5 0 .. - (),./
S i It/ CQr bexl"'- f..c:...
Trra.J .i:i:(
; I ; I 0, I O~2. 0.::) 0. '+ C, ~- lU:> (l, J
ill ~Iilj,,",·tc-r' 1(. Ih.> C,.l1im, I., si 1+ /c..o.. I' l>Of)Qte
8 0::, j; .... c.:,,-)!!'.c..
45 triG\., 1 H2
a,i o.~s 0.9
I t '---i---I
o.i 0;2 0-.3 O~lJ o~·::;- 0..0 O~) C.() 0.-9 si j 1-/ Gel f'Cof) Q te....
(
· . . ..
M:i.e.. (.e;)inl.,.'i
BvG'" 6.,y~, .
1M Sdcw
L~ Px/t.:..J
0..1 0;:1. ~43 C.'t 0.5 0,6 0 .. 1
S i 1+ /ca.l'bCf\~ k
"2-&Ic ....
31-~t &.?Ie:...;
46
O.l 0;'). (),3 0 ··If O~5 (:))~ 0·7 o.~ c)'::! silt / CM.f' hen Cto·k.
fa.lls Tri'a..1 ~~
/). f;~1: OC.(ih.,
1 I I _._~l __ ~--~--+---+---~--+---~~~~~--, 0 .. 1 0;2 O,.~ 0.'1 0$ o.h 0,7 0/1 oR 0,/ D:1. C.:?1 O .. "i o,cr C),b 0 .. 7
si \+/CO-f' bOl)o...t-e...

· . .- ,. -<'
Appendix D
Stratigraphic Distribution of Clay/Carbonate Ratios

, •• r ...
(
(
( '1
3~t· 6..:Jc~
TriQ 1 .t! I
I i I I I
I(\;a.) i±. (
'--+---+~ I I , , 0-1 0,-1... 0.1.> 0" '-I 0.5" Q.h 6.7
:" '.L:Ii; ,,,",, ,.; '" ;;, ' , ,-,,;"",' r C ia.y /ca.t.bc.1a.i e
48 Tria. !!2
I I •
ti" lis Tf'iQ} ±l: 2.
i ~ , ~~
0,' 6,'1 c .. ? 0.'+ C'L5 O.G 0.7 ()~~ ('.9
C Ic-y I C .. ,. .bclie.. +c::..
. .. • - .. ,
( ~~
2~ """,.
Nx...:...
"3QE A/x.';e,
').k· PIx .• .....
liU:t f¥x· .. 'c
Ab.::ce. c::u)~r
f-.dcr:; U.tt:.:
Ikct e.:/c;u;
! 2M \ 8.{a:v r
~fQ1 (lxfow
Tr.-o... ( ±h {
I I • I 6.l Q.}.. o..~ o,o.i 0.5"' o,b 0.7
Ck"y /eorb+e..
49
Tr,'o..l ll2
o. i c;2 c.?> c.'j 0.5 0.6 e.7 o.'b c.9
G!o..y /cOJlbcl>at~
MG Gorc1sv j J)~
Tric ) :f± I
1 ) II J ' I I
C,' O.'.l. c.,? 0~'T oS 0.10 0.1 , I -r-- -.,+
.il .'·L:l""d·." I" .,.c, l.. ill;,,,.·, I" C h.y /CIl.rbcl)o..te... 0.2 b;~ 0.1./ 05 (J.b 0.7 o·D c!.'/
C.la.. Y /c..cLf buM!. +e

1 • • ...
--
Appendix E
Paleogeographic Setting of North America During Silurian