analysis of pesticides in surface water and - usgs · project design ... mean recovery of...
TRANSCRIPT


Analysis of Pesticides in Surface Water and Sediment from Yolo Bypass, California, 2004–2005by Kelly L. Smalling, James L. Orlando, and Kathryn M. Kuivila
Scientific Investigations Report 2005-5220
Sacramento, California2005

U.S. Department of the Interior Gale A. Norton, Secretary U.S. Geological Survey P. Patrick Leahy, Acting Director U.S. Geological Survey, Reston, Virginia: 2005
For Sale by U.S. Geological Survey, Information Services Box 25286, Denver Federal Center Denver, CO 80225-0286 For more information about the USGS and its products: Telephone: 1-888-ASK-USGS World Wide Web: http://www.usgs.gov Any use of trade, product, or firm names in this publication is for descriptive purposes only and does not imply endosement by the U.S. Government. Although this report is in the public domain, permission must be secured from the individual copyright owners to reproduce any copyrighted materials contained within this report.
Suggested citation:
Smalling, K.L., Orlando, J.L., and Kuivila, K.M., 2005, Analysis of Pesticides in Surface Water and Sediment from Yolo Bypass, California, 2004–2005: U.S. Geological Survey Scientific Investigations Report 2005-5220, 20 p.
ContentsAbstract .............................................................................................................................................................................. 1Introduction........................................................................................................................................................................ 1
Hydrology ................................................................................................................................................................... 1Pesticide Use and Transport ................................................................................................................................... 2Project Design ........................................................................................................................................................... 2Purpose and Scope .................................................................................................................................................. 4Acknowledgments .................................................................................................................................................... 4
Sample Collection and Analytical Methods ................................................................................................................. 5Sample Collection ..................................................................................................................................................... 5
Water .................................................................................................................................................................. 5Suspended Sediment ....................................................................................................................................... 7Bed Sediment .................................................................................................................................................... 7
Analysis of Dissolved Pesticides ........................................................................................................................... 7Analysis of Pesticides Associated with Bed and Suspended Sediments ....................................................... 7Quality Assurance and Quality Control ................................................................................................................. 9Method Detection Limits ......................................................................................................................................... 9Sediment Organic Carbon Analysis ..................................................................................................................... 10Analysis of Suspended Sediments and Water-Quality Parameters ............................................................... 11
Results .............................................................................................................................................................................. 11Dissolved Pesticide Concentrations .................................................................................................................... 11Bed and Suspended-Sediment Concentrations ................................................................................................ 14Suspended-Sediment Concentrations and Water-Quality Parameters ........................................................ 18Sediment Organic Carbon ..................................................................................................................................... 18
Conclusions...................................................................................................................................................................... 18References .......................................................................................................................................................................20
iii

FiguresFigure 1. Input sources and locations of sampling sites within the Yolo Bypass,
California ........................................................................................................................................3Figure 2. Map of 10 sampling locations along a transect conducted in the Yolo Bypass,
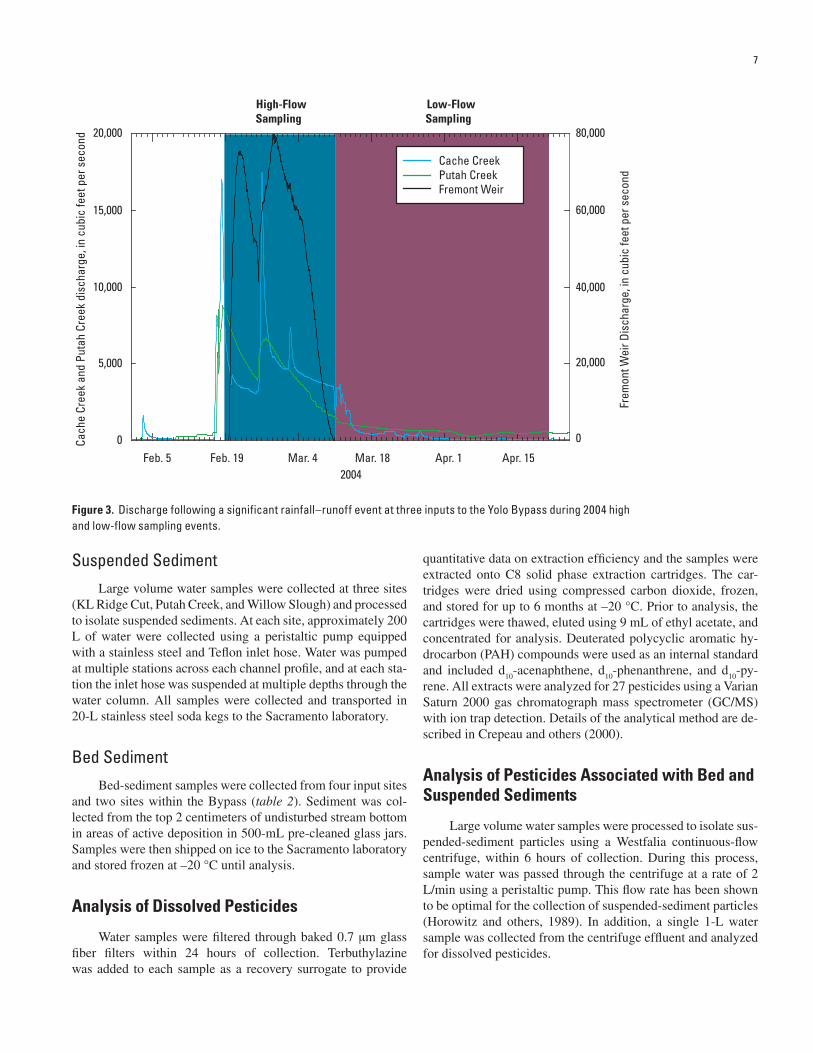
California on March 3, 2004 .........................................................................................................6Figure 3. Discharge following a significant rainfall–runoff event at three inputs to the
Yolo Bypass ....................................................................................................................................7
TablesTable 1. 2003 Pesticide application amounts for the five source watersheds to the
Yolo Bypass, California. .............................................................................................................. 4Table 2. Surface water, suspended and bed sediment sampling sites in the Yolo Bypass and its
tributaries, California, and sample matrix collected ...............................................................5Table 3. Mean recovery of pesticides from matrix spikes (n = 9) using various bed (n = 5) and
suspended (n = 4) sediment and method detection limits (MDL) .........................................8Table 4. Method detection limits for pesticides analyzed in surface water in 2001 and 2002 ......10Table 5. Pesticide concentrations (ng/L) detected in surface water samples collected in 2004
from six source watersheds and two sites within the Yolo Bypass, California ................11Table 6. Pesticide concentrations detected in surface water samples from a Yolo Bypass,
California, transect on March 3, 2004 ......................................................................................14Table 7. .Total organic carbon and pesticide concentrations in bed sediment samples
collected September 21, 2004, from the Yolo Bypass, California ........................................15Table 8. Total organic carbon and pesticide concentrations detected in water and suspended
sediments collected from the Yolo Bypass, California, in 2004 and 2005 ..........................16Table 9. Suspended sediment concentrations and water-quality parameters for samples for
Yolo Bypass, California ..............................................................................................................19
iv
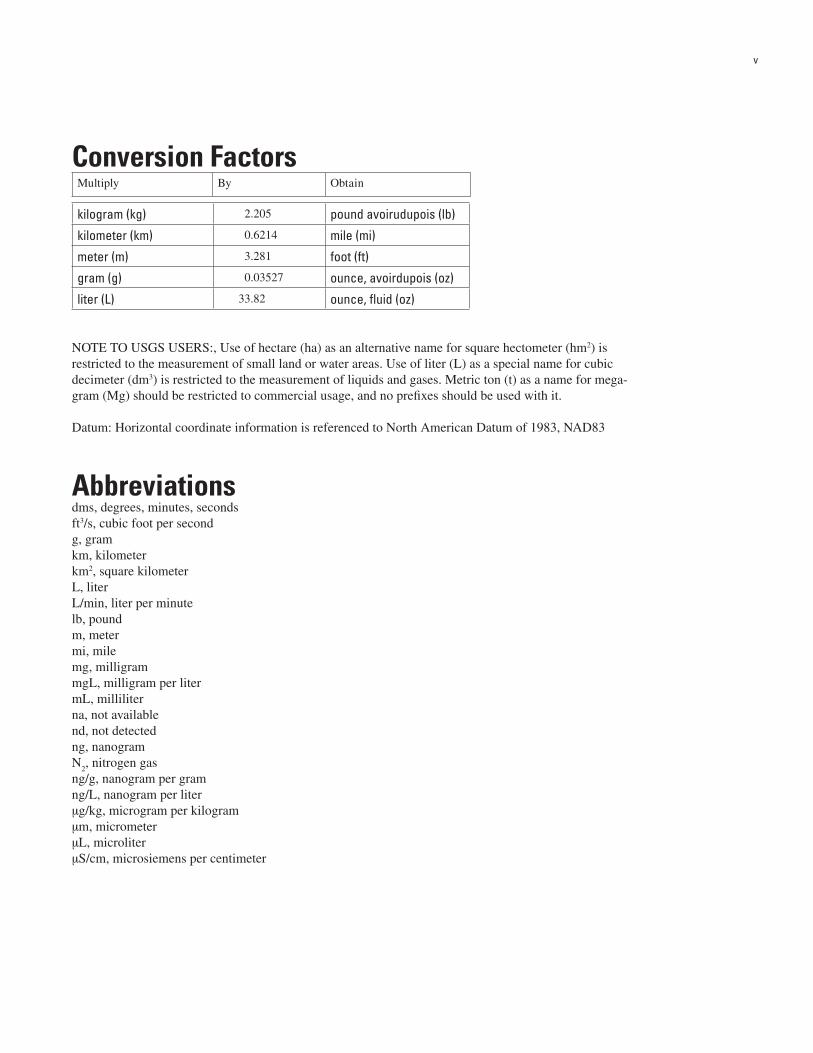
Conversion FactorsMultiply By Obtain
kilogram (kg) 2.205 pound avoirudupois (lb)
kilometer (km) 0.6214 mile (mi)
meter (m) 3.281 foot (ft)
gram (g) 0.03527 ounce, avoirdupois (oz)
liter (L) 33.82 ounce, fluid (oz)
NOTE TO USGS USERS:, Use of hectare (ha) as an alternative name for square hectometer (hm2) is restricted to the measurement of small land or water areas. Use of liter (L) as a special name for cubic decimeter (dm3) is restricted to the measurement of liquids and gases. Metric ton (t) as a name for mega-gram (Mg) should be restricted to commercial usage, and no prefixes should be used with it.
Datum: Horizontal coordinate information is referenced to North American Datum of 1983, NAD83
Abbreviationsdms, degrees, minutes, secondsft3/s, cubic foot per secondg, gramkm, kilometerkm2, square kilometerL, literL/min, liter per minutelb, poundm, metermi, milemg, milligrammgL, milligram per litermL, milliliterna, not availablend, not detectedng, nanogramN
2, nitrogen gas
ng/g, nanogram per gramng/L, nanogram per literµg/kg, microgram per kilogramµm, micrometerµL, microliterµS/cm, microsiemens per centimeter
v
Acronymsatm, atmospheresDCM, dichloromethaneEPA, U.S. Environmental Protection AgencyGC/MS, gas chromatograph/mass spectrometerGPC/HPLC, gel permeation chromatography/high pressure liquid chromatographyHCl, hydrochloric acidKL, Knights LandingMASE, microwave-assisted solvent extractionMDL, method detection limitsPAH, polycyclic aromatic hydrocarbonrpm, revolutions per minuteSPE, solid-phase extraction cartridgeSD, standard deviationv/v, volume-to-volumeUSGS, U.S. Geological Survey
vi
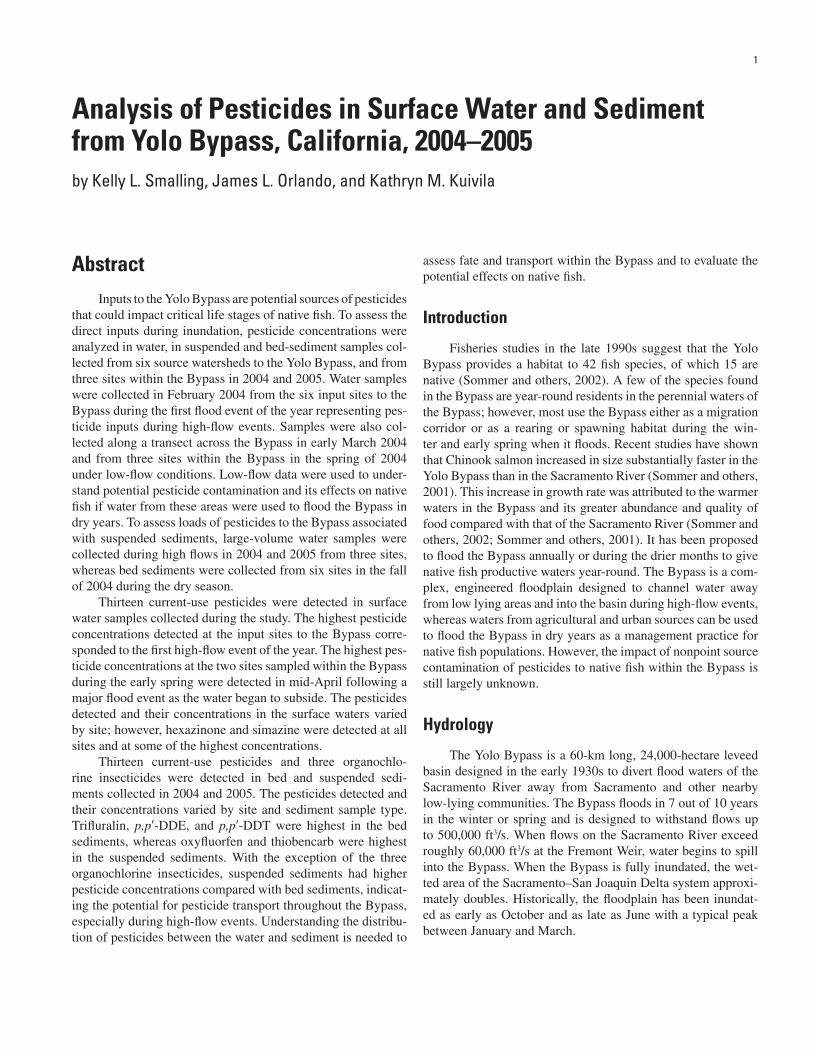
AbstractInputs to the Yolo Bypass are potential sources of pesticides
that could impact critical life stages of native fish. To assess the direct inputs during inundation, pesticide concentrations were analyzed in water, in suspended and bed-sediment samples col-lected from six source watersheds to the Yolo Bypass, and from three sites within the Bypass in 2004 and 2005. Water samples were collected in February 2004 from the six input sites to the Bypass during the first flood event of the year representing pes-ticide inputs during high-flow events. Samples were also col-lected along a transect across the Bypass in early March 2004 and from three sites within the Bypass in the spring of 2004 under low-flow conditions. Low-flow data were used to under-stand potential pesticide contamination and its effects on native fish if water from these areas were used to flood the Bypass in dry years. To assess loads of pesticides to the Bypass associated with suspended sediments, large-volume water samples were collected during high flows in 2004 and 2005 from three sites, whereas bed sediments were collected from six sites in the fall of 2004 during the dry season.
Thirteen current-use pesticides were detected in surface water samples collected during the study. The highest pesticide concentrations detected at the input sites to the Bypass corre-sponded to the first high-flow event of the year. The highest pes-ticide concentrations at the two sites sampled within the Bypass during the early spring were detected in mid-April following a major flood event as the water began to subside. The pesticides detected and their concentrations in the surface waters varied by site; however, hexazinone and simazine were detected at all sites and at some of the highest concentrations.
Thirteen current-use pesticides and three organochlo-rine insecticides were detected in bed and suspended sedi-ments collected in 2004 and 2005. The pesticides detected and their concentrations varied by site and sediment sample type. Trifluralin, p,p′-DDE, and p,p′-DDT were highest in the bed sediments, whereas oxyfluorfen and thiobencarb were highest in the suspended sediments. With the exception of the three organochlorine insecticides, suspended sediments had higher pesticide concentrations compared with bed sediments, indicat-ing the potential for pesticide transport throughout the Bypass, especially during high-flow events. Understanding the distribu-tion of pesticides between the water and sediment is needed to
assess fate and transport within the Bypass and to evaluate the potential effects on native fish.
Introduction
Fisheries studies in the late 1990s suggest that the Yolo Bypass provides a habitat to 42 fish species, of which 15 are native (Sommer and others, 2002). A few of the species found in the Bypass are year-round residents in the perennial waters of the Bypass; however, most use the Bypass either as a migration corridor or as a rearing or spawning habitat during the win-ter and early spring when it floods. Recent studies have shown that Chinook salmon increased in size substantially faster in the Yolo Bypass than in the Sacramento River (Sommer and others, 2001). This increase in growth rate was attributed to the warmer waters in the Bypass and its greater abundance and quality of food compared with that of the Sacramento River (Sommer and others, 2002; Sommer and others, 2001). It has been proposed to flood the Bypass annually or during the drier months to give native fish productive waters year-round. The Bypass is a com-plex, engineered floodplain designed to channel water away from low lying areas and into the basin during high-flow events, whereas waters from agricultural and urban sources can be used to flood the Bypass in dry years as a management practice for native fish populations. However, the impact of nonpoint source contamination of pesticides to native fish within the Bypass is still largely unknown.
Hydrology
The Yolo Bypass is a 60-km long, 24,000-hectare leveed basin designed in the early 1930s to divert flood waters of the Sacramento River away from Sacramento and other nearby low-lying communities. The Bypass floods in 7 out of 10 years in the winter or spring and is designed to withstand flows up to 500,000 ft3/s. When flows on the Sacramento River exceed roughly 60,000 ft3/s at the Fremont Weir, water begins to spill into the Bypass. When the Bypass is fully inundated, the wet-ted area of the Sacramento–San Joaquin Delta system approxi-mately doubles. Historically, the floodplain has been inundat-ed as early as October and as late as June with a typical peak between January and March.
Analysis of Pesticides in Surface Water and Sediment from Yolo Bypass, California, 2004–2005by Kelly L. Smalling, James L. Orlando, and Kathryn M. Kuivila
1

The Yolo Bypass receives water from six sources that vary greatly during low-flow and high-flow conditions, making the hydrology of the system complex (fig. 1). The watersheds that drain into the Yolo Bypass include, Willow Slough (697 km2), Putah Creek (1,685 km2), Cache Creek (2,957 km2), Knights Landing Ridge Cut (4,374 km2), and the Sacramento and Feather Rivers (61,299 km2) at the Fremont Weir (fig. 1). The Bypass itself is relatively small, only 243 km2; however, un-der high-flow conditions, the watershed includes all the basins mentioned previously and increases in size to 71,255 km2.
During high-flow conditions, the primary input to the Bypass is the Fremont Weir, which conveys flood water from the Sacramento River, the Feather River, and the Sutter Bypass. Water flowing into the Bypass at the Freemont Weir initially flows through the Toe Drain (fig. 1), a riparian channel run-ning along the eastern edge of the Bypass, and then spills onto the floodplain when flows through the small channel exceed 3,500 ft3/s (Sommer and others, 2002). Minor inundations of the Bypass also may occur during high flows on Cache Creek, Putah Creek, Willow Slough, and Knights Landing Ridge Cut, without the overtopping of Fremont Weir.
During low-flow conditions, the Yolo Bypass receives most of its water from four watersheds: Putah Creek, Cache Creek, Knights Landing Ridge Cut, and Willow Slough. Water from Putah Creek and Cache Creek is shunted off for irrigation as it enters the Bypass and eventually drains into the Toe Drain on the eastern edge of the floodplain. Water from Cache Creek enters a leveed settling basin and is slowly drained through a series of ditches across the Bypass into the Toe Drain. When the settling basin exceeds capacity, water flows into the Bypass over a large concrete ‘step ladder’ spillway. During the dry summer months, Cache Creek, which is dry upstream of the settling basin, is not a source of surface water to the Bypass. Also during the sum-mer, the Toe Drain, which connects to a complex network of channels and ditches used for irrigation, becomes the primary source of perennial water into the Bypass. Knights Landing Ridge Cut is an artificial overflow channel that connects the lower end of the Colusa Basin Drain to the Bypass. The Colusa Basin Drain is a 70-mi long channel running along the western edge of the Sacramento River. Under low-flow conditions, the drain discharges directly to the Sacramento River; however, un-der high-flow conditions, water in the drain is shunted through Knights Landing Ridge Cut to the Bypass (Jones and Stokes, 2001). The Willow Slough watershed, which is the smallest watershed connected to the Bypass, drains principally agricul-tural areas immediately west of the Bypass. Willow Slough also conveys effluent from the city of Davis’s wastewater treatment plant.
Pesticide Use and Transport
Historically, corn, melons, rice, safflower, and tomatoes have been the predominant crops grown inside the Yolo Bypass, whereas the major crops grown in the areas surrounding the Bypass include alfalfa, beans, nuts (almonds and walnuts), orchards, and rice. The variety of crops grown in the region gives
rise to the use of many different types of herbicides and insecti-cides. Of the 38 current-use pesticides analyzed in the study, 17 were used in the Yolo Bypass watershed (table 1). Molinate and thiobencarb, two thiocarbamate herbicides, are used extensively on rice, both within and outside the Yolo Bypass (Crepeau and Kuivila, 2000). Greater than 500,000 lb (active ingredient) each of molinate and thiobencarb were applied to rice fields within the Bypass high-flow watershed in 2003 (California Department of Pesticide Regulation, 2003). Other pesticides used in these watersheds include chlorpyrifos, diazinon, hexazinone, meto-lachlor, oxyfluorfen, and trifluralin (California Department of Pesticide Regulation, 2003) (table 1).
Pesticide use in the watersheds surrounding the Bypass has a direct impact on the Bypass itself, especially under high-flow conditions or during the first rainfall of the season, as sediments move from the fields to the creeks. High flows from the input watersheds may increase bound suspended-sediment loads to the Bypass, increasing depositional rates of sediment pesticides in some areas. The influx of dissolved pesticides into the bypass during high-flow events may have an impact on lo-cal fish populations. Limited information is available regarding the long-term effects of pesticide exposure to fish in the Bypass during high-flow years when the pesticide flux from the sur-rounding watersheds is greatly increased.
A conceptual model of pesticide transport and fate sug-gests three potential sources of contamination to the Bypass. During inundation, dissolved pesticides as well as pesticides sorbed to suspended sediments are present in the surface wa-ter used to flood the Bypass. A third potential source of expo-sure is pesticides applied directly to soils within the Bypass. Understanding the fate of pesticides in the Yolo Bypass will help fisheries biologists assess the potential risks of long-term exposure to juvenile and adult fish.
Project Design
The project was designed to measure the concentrations of pesticides entering the Yolo Bypass during a high-flow event and to determine the types and amounts of pesticides present within the Bypass itself. A variety of pesticide classes was ana-lyzed in surface water and in bed and suspended sediments to achieve the goals of this study. Modifications to our previous sediment method were made to add new compounds and de-crease method detection limits for some analytes, especially the pyrethroids owing to their aquatic toxicity at extremely low levels.
Surface waters were sampled during two different phases for this study. The first phase of sampling (or high flow) was de-signed to measure the direct inputs of pesticides during an event in February 2004 that represents the Bypass when it floods. The second sampling phase (or low flow) was designed to compare pesticide concentrations in the Toe Drain and Putah Creek in late March and April 2004 because water from these sites may be used to flood the Bypass in dry years in support of native fish populations.
2
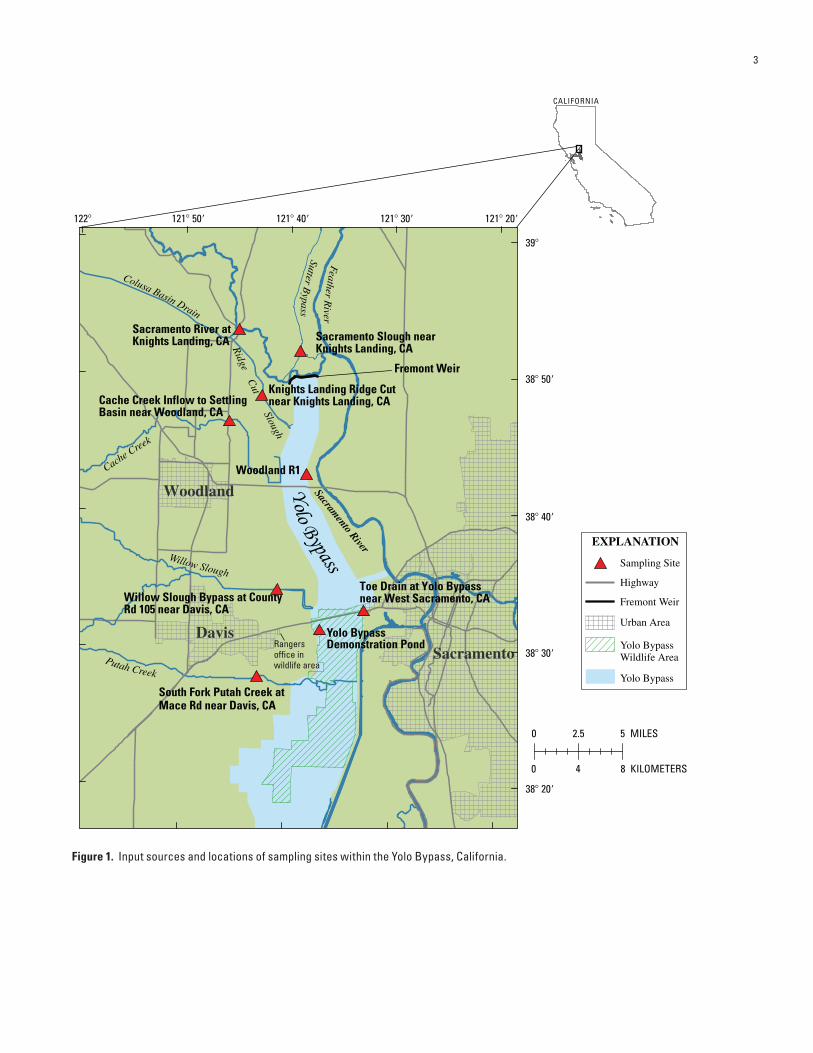
Figure 1. Input sources and locations of sampling sites within the Yolo Bypass, California.
#
#
#
#
#
#
#
#
#
A
YoloBypass
SacramentoDavis
Woodland
Cache Creek Inflow to SettlingBasin near Woodland, CA
Woodland R1
Toe Drain at Yolo Bypassnear West Sacramento, CAWillow Slough Bypass at County
Rd 105 near Davis, CA
Knights Landing Ridge Cutnear Knights Landing, CA
Sacramento Slough nearKnights Landing, CA
Sacramento River atKnights Landing, CA
Fremont Weir
0 2.5 5 MILES
0 4 8 KILOMETERS
CALIFORNIA
SutterB
ypass
Colusa Basin Drain
Cache Creek
Ridge
Cut
Slough
Sacramento
River
Willow Slough
Putah Creek
FeatherR
iver
39
38 50
38 40
38 30
38 20
121 20121 30121 40121 50122
South Fork Putah Creek atMace Rd near Davis, CA
Yolo BypassDemonstration PondRangers
office inwildlife area
EXPLANATION
Yolo Bypass Wildlife Area
Urban Area
Yolo Bypass
Fremont Weir
Highway
Sampling Site
3

Another element of this study assessed both the transport of pesticides associated with suspended sediments to the Bypass and those associated with agricultural soils in and around the Bypass. Large volume water samples were collected for the iso-lation of suspended sediments in February 2004 and January 2005 during high-flow events from three source watersheds (Putah Creek, Willow Slough, and Knights Landing Ridge Cut), and bed sediment samples were collected in September 2004 after pesticide application when the Bypass was dry. All water and sediment samples were analyzed for pesticides at the U.S. Geological Survey’s (USGS) California Water Science Center laboratory in Sacramento, California (Sacramento laboratory).
Purpose and Scope
This report describes the methods and procedures used during sampling, extraction, and analysis of pesticides at various sites (fig. 1) and presents water and sediment data for samples collected during this study. Several pyrethroid insecticides were added to the sediment method, and modi-fications were made to decrease analytical detection limits. Concentrations of 27 current-use pesticides were analyzed in 48 water samples, and total organic carbon and concentrations of 41 pesticides were analyzed in 10 sediment samples. In
addition, suspended-sediment concentrations and water-qual-ity parameter data are presented, as well as method detections limits for pesticides analyzed in water and sediments. During this study, the USGS was responsible for the initiation of field sampling, collection of surface water and suspended sediments and all chemical analyses. Larry Walker and Associates, a consulting firm in Davis, California, conducted the bed-sedi-ment sampling in 2004. Water and sediment samples were an-alyzed for pesticides and total organic carbon at the USGS’s California Water Science Center organic chemistry laboratory in Sacramento, California.
Acknowledgments
The authors acknowledge Lisa Jacobson, Stephanie Smith, and Patrick Nicholas of the USGS for their many hours of sam-pling, laboratory work, and pesticide analysis. We also thank the personnel from the California Department of Water Resources and Dave Feliz of the California Department of Fish and Game for help with water sampling and Aramand Ruby for collect-ing the bed-sediment samples analyzed in the study. This proj-ect was funded by the California Resources Agency/California Bay-Delta Authority (Contract # 4600002755) and the USGS Federal–State Cooperative Program.
Table 1 2003 Pesticide application amounts for the five source watersheds to the Yolo Bypass, California.
[For the Yolo Bypass high-flow watershed, the total application amounts equal the sum of the watersheds listed below for the entire Bypass. Values are in pounds per year. Pesticide application amounts are in pounds per year active ingredient. KL, Knights Landing]
Pesticide Cache Creek Putah Creek KL Ridge Cut Willow SloughSacramento and Feather Rivers
Bifenthrin 43 0 670 25 600
Carbaryl 630 62 1,100 170 4,200
Chlorpyrifos 5,340 2,400 25,000 5,500 92,000
DCPA 0 0 440 0 400
Diazinon 1,540 1,100 8,200 1,700 52,000
EPTC 1,300 0 3,800 0 4,300
Hexazinone 1,270 1,300 7,700 5,400 27,000
Methidathion 0 0 1,200 0 6,400
Metolachlor 2,600 1,800 11,000 5,900 3,200
Molinate 0 1,100 150,000 7,000 370,000
Napropamide 580 250 3,100 370 4,800
Oxyfluorfen 3,600 1,100 15,000 1,700 12,000
Pendimethalin 360 210 5,900 240 6,000
Simazine 1,820 650 2,500 210 19,000
Tau-fluvalinate 0 0 36 0 36
Thiobencarb 2,000 0 250,000 14,000 280,000
4
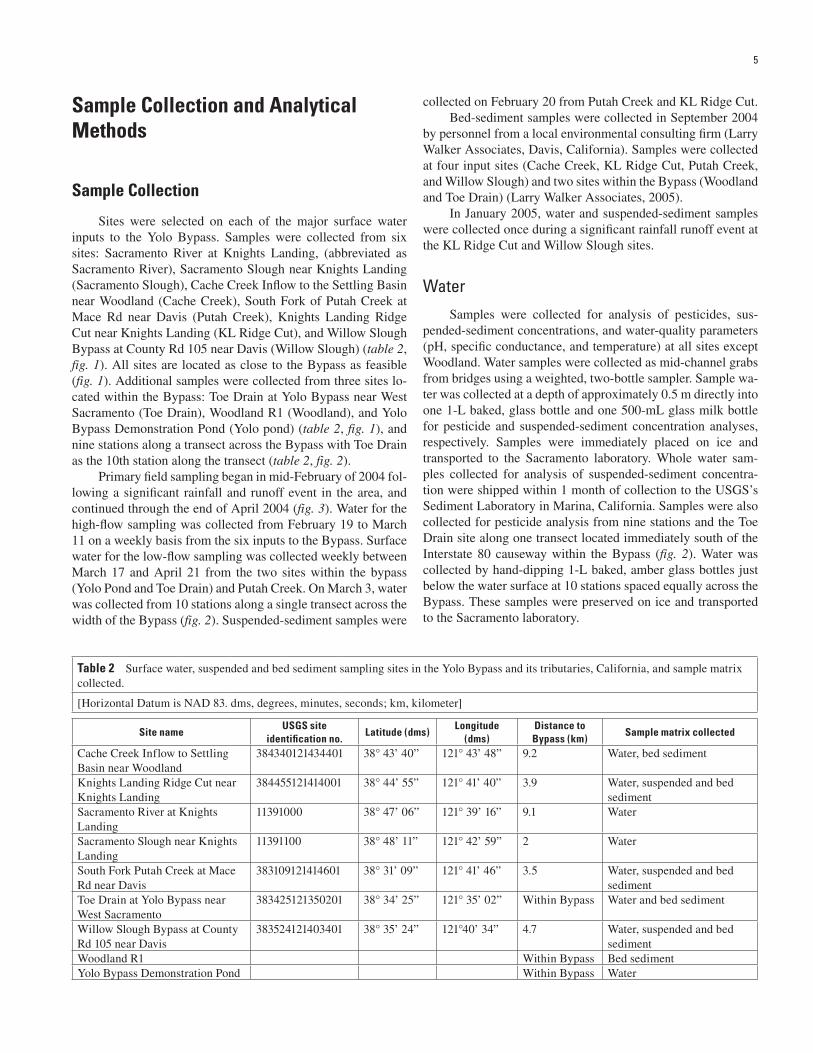
Sample Collection and Analytical Methods
Sample Collection
Sites were selected on each of the major surface water inputs to the Yolo Bypass. Samples were collected from six sites: Sacramento River at Knights Landing, (abbreviated as Sacramento River), Sacramento Slough near Knights Landing (Sacramento Slough), Cache Creek Inflow to the Settling Basin near Woodland (Cache Creek), South Fork of Putah Creek at Mace Rd near Davis (Putah Creek), Knights Landing Ridge Cut near Knights Landing (KL Ridge Cut), and Willow Slough Bypass at County Rd 105 near Davis (Willow Slough) (table 2, fig. 1). All sites are located as close to the Bypass as feasible (fig. 1). Additional samples were collected from three sites lo-cated within the Bypass: Toe Drain at Yolo Bypass near West Sacramento (Toe Drain), Woodland R1 (Woodland), and Yolo Bypass Demonstration Pond (Yolo pond) (table 2, fig. 1), and nine stations along a transect across the Bypass with Toe Drain as the 10th station along the transect (table 2, fig. 2).
Primary field sampling began in mid-February of 2004 fol-lowing a significant rainfall and runoff event in the area, and continued through the end of April 2004 (fig. 3). Water for the high-flow sampling was collected from February 19 to March 11 on a weekly basis from the six inputs to the Bypass. Surface water for the low-flow sampling was collected weekly between March 17 and April 21 from the two sites within the bypass (Yolo Pond and Toe Drain) and Putah Creek. On March 3, water was collected from 10 stations along a single transect across the width of the Bypass (fig. 2). Suspended-sediment samples were
collected on February 20 from Putah Creek and KL Ridge Cut.Bed-sediment samples were collected in September 2004
by personnel from a local environmental consulting firm (Larry Walker Associates, Davis, California). Samples were collected at four input sites (Cache Creek, KL Ridge Cut, Putah Creek, and Willow Slough) and two sites within the Bypass (Woodland and Toe Drain) (Larry Walker Associates, 2005).
In January 2005, water and suspended-sediment samples were collected once during a significant rainfall runoff event at the KL Ridge Cut and Willow Slough sites.
WaterSamples were collected for analysis of pesticides, sus-
pended-sediment concentrations, and water-quality parameters (pH, specific conductance, and temperature) at all sites except Woodland. Water samples were collected as mid-channel grabs from bridges using a weighted, two-bottle sampler. Sample wa-ter was collected at a depth of approximately 0.5 m directly into one 1-L baked, glass bottle and one 500-mL glass milk bottle for pesticide and suspended-sediment concentration analyses, respectively. Samples were immediately placed on ice and transported to the Sacramento laboratory. Whole water sam-ples collected for analysis of suspended-sediment concentra-tion were shipped within 1 month of collection to the USGS’s Sediment Laboratory in Marina, California. Samples were also collected for pesticide analysis from nine stations and the Toe Drain site along one transect located immediately south of the Interstate 80 causeway within the Bypass (fig. 2). Water was collected by hand-dipping 1-L baked, amber glass bottles just below the water surface at 10 stations spaced equally across the Bypass. These samples were preserved on ice and transported to the Sacramento laboratory.
Table 2 Surface water, suspended and bed sediment sampling sites in the Yolo Bypass and its tributaries, California, and sample matrix collected.
[Horizontal Datum is NAD 83. dms, degrees, minutes, seconds; km, kilometer]
Site name USGS site
identification no.Latitude (dms)
Longitude (dms)
Distance to Bypass (km)
Sample matrix collected
Cache Creek Inflow to Settling Basin near Woodland
384340121434401 38° 43’ 40” 121° 43’ 48” 9.2 Water, bed sediment
Knights Landing Ridge Cut near Knights Landing
384455121414001 38° 44’ 55” 121° 41’ 40” 3.9 Water, suspended and bed sediment
Sacramento River at Knights Landing
11391000 38° 47’ 06” 121° 39’ 16” 9.1 Water
Sacramento Slough near Knights Landing
11391100 38° 48’ 11” 121° 42’ 59” 2 Water
South Fork Putah Creek at Mace Rd near Davis
383109121414601 38° 31’ 09” 121° 41’ 46” 3.5 Water, suspended and bed sediment
Toe Drain at Yolo Bypass near West Sacramento
383425121350201 38° 34’ 25” 121° 35’ 02” Within Bypass Water and bed sediment
Willow Slough Bypass at County Rd 105 near Davis
383524121403401 38° 35’ 24” 121°40’ 34” 4.7 Water, suspended and bed sediment
Woodland R1 Within Bypass Bed sedimentYolo Bypass Demonstration Pond Within Bypass Water
5

§̈¦I 80
Yolo Bypass
Willow Slough
Yolo BypassDemonstration PondRangers office in
wildlife area
Putah Creek
ToeD
rainShip
Channel
Sacramento
River
Willow Slough Bypass at CountyRd 105 near Davis, CA
South Fork Putah Creek atMace Rd near Davis, CA
Toe Drain at Yolo Bypassnear West Sacramento, CA
987654321
10
# Sampling Site
X Transect Site
0 2 41 MILES
0 2.5 51.25 KILOMETERS
38 32
38 30
38 28
121 35
38 36
38 34
121 40
EXPLANATION
Yolo Bypass
Yolo Bypass Wildlife Area
Highway
Figure 2. Map of 10 sampling locations along a transect conducted in the Yolo Bypass, California on March 3, 2004.
6
Suspended SedimentLarge volume water samples were collected at three sites
(KL Ridge Cut, Putah Creek, and Willow Slough) and processed to isolate suspended sediments. At each site, approximately 200 L of water were collected using a peristaltic pump equipped with a stainless steel and Teflon inlet hose. Water was pumped at multiple stations across each channel profile, and at each sta-tion the inlet hose was suspended at multiple depths through the water column. All samples were collected and transported in 20-L stainless steel soda kegs to the Sacramento laboratory.
Bed SedimentBed-sediment samples were collected from four input sites
and two sites within the Bypass (table 2). Sediment was col-lected from the top 2 centimeters of undisturbed stream bottom in areas of active deposition in 500-mL pre-cleaned glass jars. Samples were then shipped on ice to the Sacramento laboratory and stored frozen at –20 °C until analysis.
Analysis of Dissolved Pesticides
Water samples were filtered through baked 0.7 µm glass fiber filters within 24 hours of collection. Terbuthylazine was added to each sample as a recovery surrogate to provide
quantitative data on extraction efficiency and the samples were extracted onto C8 solid phase extraction cartridges. The car-tridges were dried using compressed carbon dioxide, frozen, and stored for up to 6 months at –20 °C. Prior to analysis, the cartridges were thawed, eluted using 9 mL of ethyl acetate, and concentrated for analysis. Deuterated polycyclic aromatic hy-drocarbon (PAH) compounds were used as an internal standard and included d
10-acenaphthene, d
10-phenanthrene, and d
10-py-
rene. All extracts were analyzed for 27 pesticides using a Varian Saturn 2000 gas chromatograph mass spectrometer (GC/MS) with ion trap detection. Details of the analytical method are de-scribed in Crepeau and others (2000).
Analysis of Pesticides Associated with Bed and Suspended Sediments
Large volume water samples were processed to isolate sus-pended-sediment particles using a Westfalia continuous-flow centrifuge, within 6 hours of collection. During this process, sample water was passed through the centrifuge at a rate of 2 L/min using a peristaltic pump. This flow rate has been shown to be optimal for the collection of suspended-sediment particles (Horowitz and others, 1989). In addition, a single 1-L water sample was collected from the centrifuge effluent and analyzed for dissolved pesticides.
Feb. 5 Feb. 19 Mar. 4 2004
Mar. 18 Apr. 1 Apr. 15
Frem
ont W
eir D
isch
arge
, in
cubi
c fe
et p
er s
econ
d
Cach
e Cr
eek
and
Puta
h Cr
eek
disc
harg
e, in
cub
ic fe
et p
er s
econ
d
High-FlowSampling
Low-FlowSampling
20,000 80,000
Cache Creek Putah Creek Fremont Weir
60,000
40,000
20,000
0
15,000
5,000
0
10,000
Figure 3. Discharge following a significant rainfall–runoff event at three inputs to the Yolo Bypass during 2004 high and low-flow sampling events.
7

Following centrifugation, the concentrated sediment and sediment-water slurry were removed from the stainless steel centrifuge bowls and further dewatered by centrifuging for 20 minutes at 10,000 rpm using a high speed refrigerated centrifuge (Sorvall RC-5B centrifuge, DuPont Company, Wilmington, Delaware). The water separated from the samples during this step was decanted, and the remaining sediments were placed in precleaned glass jars and stored frozen until analysis.
The sediments were analyzed using the method described by LeBlanc and others (2004) with slight modifications to lower the MDL and limit matrix interference. The modified method, discussed in detail in this section, includes six compounds not analyzed in the original method and excludes three previously analyzed compounds. To avoid cross contamination and arti-facts associated with drying and to increase extraction efficien-cy of the MASE, wet sediments were used (Jayaraman and oth-ers, 2001). Approximately 5 g of sediment (dry weight) were fortified with a labeled surrogate recovery solution containing 400-ng 13C-labeled trifluralin, chlorpyrifos, p,p′-DDE, and per-methrin (cis/trans mixture) (Cambridge Isotope Laboratories Inc., Andover, Massachusetts). The amount of moisture in the sediment was set at 50 percent prior to MASE by adding be-tween 0.2 and 1.5 mL of organic free deionized water depending on the moisture content of each sediment sample. The sediment samples were extracted two times with a mixture of dichloro-methane (DCM) and acetone (50:50 v/v) using an MSP 1000 (CEM Corporation, Mathews, North Carolina). Details of the MASE procedure are described in Leblanc and others (2004).
Following extraction, the samples were decanted through glass funnels packed with approximately 30 g of sodium sulfate to remove excess water. Extracts were reduced at 25 °C and 0.6 atm to 0.75 mL using a Turbovap II (Zymark Corporation, Hopkinton, Maryland). Sediment matrix was removed by pass-ing the sample extract via vertical flow under gravity through two stacked solid-phase extraction (SPE) cartridges containing different sorbents. A 6 mL, 500 mg, nonporous, graphitized carbon SPE (Restek Corporation, Bellefonte, Virginia) was stacked on top of a 500 mg Alumina SPE (Varian Inc., Palo Alto, California) and washed with 10 mL of DCM to remove cartridge impurities. The organic rich, colored sample extract was added to the cartridges, rinsed in tandem with 10 mL of DCM, and collected as fraction 1 (F1). The carbon SPE was removed and the Alumina SPE was eluted with 10 mL of ethyl acetate and DCM (50:50 v/v) and collected as fraction 2 (F2). With the exception of the triazines/triazinones, carbamates, and napropamide, most pesticide classes were eluted primarily in the F1 with minimal carryover into the F2. Only molinate and methidathion split between the F1 and F2. Because the F2 con-tained more sample matrix than the F1, the two fractions were analyzed separately to reduce interferences with the pyrethroids in the first fraction and improve the (MDLs). Concentrations of each analyte were calculated in each fraction separately and then summed together to give a final reported value.
Both fractions were evaporated separately under a gentle stream of highly purified nitrogen gas (N-evap, Organomation Associates, Berlin, Massachusetts) to 0.5 mL and exchanged
into ethyl acetate. Sulfur, found only in the F1 extracts, was removed using a gel permeation/high pressure liquid chroma-tography (GPC/HPLC) system. The F1 and F2 extracts were reduced under a gentle stream of N
2 to 0.2 mL, and 40 µL of the
deuterated internal PAH standard was added. The extracts were analyzed by GC/MS for a suite of 41 pesticides.
Five pyrethroids were added to the method, which includ-ed deltamethrin, fenpropathrin, phenothrin, resmethrin, and tau-fluvalinate (table 3). Diethylatyl-ethyl and azinphos-methyl were the two compounds removed from the original method developed by LeBlanc and others (2004).
Table 3 Mean recovery of pesticides from matrix spikes (n = 9) using various bed (n = 5) and suspended (n = 4) sediment and method detection limits (MDL).[All MDLs were determined in Cache Creek sediment only (n = 7). µg/kg, microgram per kilogram; SD, standard deviation; MDL, method detection limit; NA, not available]
Mean ± SD (%) MDL (ng/g)
Triazines/Triazones
Atrazine¹ 85.0 ± 5.1 1.7
Hexazinone 114 ± 12.7 2.3
Prometryn¹ 89.3 ± 9.0 1.9
Simazine¹ 91.3 ± 7.8 1.4
Anilines
Ethalfluralin¹ 82.8 ± 8.9 1.2
Pendamethalin 105 ± 5.1 1.5
Trifluralin 88.9 ± 13.6 1.1
Chloacetanilides
Alachlor¹ 86.1 ± 10.9 1.4
Metolachlor¹ 85.1 ± 5.6 1.7
Carbamates
Carbaryl 103 ± 8.0 2.2
Carbofuran¹ 102 ± 13.0 5.3
Thiocarbamates
Butylate¹ 60.0 ± 6.6 1.1
Cycloate¹ 66.6 ± 5.5 0.8
EPTC¹ 62.3 ± 8.1 1.4
Molinate 62.9 ± 7.7 0.6
Pebulate¹ 60.6 ± 6.9 0.9
Thiobencarb 93.9 ± 10.7 1.6
8

Table 3 Mean recovery of pesticides from matrix spikes (n = 9) using various bed (n = 5) and suspended (n = 4) sediment and method detection limits (MDL).[All MDLs were determined in Cache Creek sediment only (n = 7). µg/kg, microgram per kilogram; SD, standard deviation; MDL, method detection limit; NA, not available]
Mean ± SD (%) MDL (ng/g)
Organochlorines
p,p’-DDD 85.4 ± 12.7 1.3
p,p′-DDE 85.1 ± 9.1 1.5
p,p′-DDT 85.2 ± 12.4 1.9
Organophosphates
Chlorpyrifos 82.5 ± 6.0 0.8
Diazinon¹ 85.1 ± 14.8 0.6
Malathion¹ 94.4 ± 7.8 2.2
Methidathion¹ 102 ± 10.5 1.5
Methylparathion¹ 103 ± 7.4 2
Phosmet¹ 93.8 ± 17.0 2.4
Pyrethroids
Bifenthrin 84.2 ± 15.1 2.3
Cyfluthrin¹ 81.5 ± 7.3 7.9
Cypermethrin¹ 86.0 ± 14.1 5.6
Deltamethrin¹ 88.5 ± 15.1 1.1
Esfevalerate¹ 80.1 ± 6.6 1.8
Fenpropathrin¹ 85.3 ± 17.9 1.4
Lambda-Cyhalothrin¹ 77.1 ± 9.8 1.6
Permethrin¹ 79.0 ± 12.8 1.2
Sumithrin¹ 92.8 ± 16.3 2.9
Tau-fluvalinate 83.5 ± 14.9 1.1
Miscellaneous
DCPA 82.4 ± 8.4 1.5
Napropamide 98.2 ± 8.5 1.6
Oxuflurofen 92.7 ± 10.5 2.5
Piperonyl butoxide¹ 106 ± 10.0 1.3
¹Pesticides not detected in this study.
Quality Assurance and Quality Control
Dissolved pesticide concentrations were validated against a comprehensive set of quality control parameters including lab-oratory and field blanks, matrix spikes, replicate samples, and surrogate recovery. Laboratory and field blanks were analyzed every 10–20 samples for a total of 6 in 2004 and 1 in 2005. No pesticides were detected in any of the blanks. Replicate samples (6) were analyzed constituting approximately 10 percent of the samples and were within 25 percent agreement for all pesticides detected. Matrix spikes were analyzed in approximately 10 per-cent of the samples as part of the described method validation with recoveries ranging from 80 to 120 percent. Terbuthylazine was used as a recovery surrogate to assess the efficiency of sam-ple extraction. The average percentage recovery and standard deviation of the recovery surrogate were calculated for each site. Sample data were excluded if the recovery of terbuthyla-zine was outside the mean plus or minus two standard devia-tions.
Sediment matrix spikes, method blanks, and replicate samples were also processed for quality control purposes. During final method testing, 200 ng of each pesticide listed in table 3 was spiked into five bed sediment and four suspended-sediment samples. Matrix spike percentage recoveries ranged from 60 to 114 percent (table 3). Replicate samples constituted approximately 10 percent of the total samples analyzed, and the differences between replicates were less than 25 percent for all pesticides detected. No pesticides were detected in any blank sample run with each batch of five sediment samples. Recovery of the sediment surrogate mixture was used to monitor the effi-ciency of each extraction. The average percentage recoveries of 13C-labeled trifluralin, chlorpyrifos, p,p′-DDE, and permethrin (cis/trans mixture) were 92.0 ± 10.2, 93.0 ± 9.0, 87.5 ± 13.3 and 95.2 ± 10.0, respectively.
Method Detection Limits
Surface water method detection limits were validated in a previous study (Orlando and others, 2004) using the EPA pro-cedure (U.S. Environmental Protection Agency, 1992; table 4). Water used for the MDLs was collected in 2001 and 2002 from the San Joaquin River near Vernalis (USGS site ID number 11303500), which has similar water chemistry to the sites sam-pled in the study.
9

Table 4 Method detection limits for pesticides analyzed in surface water in 2001 and 2002.[The method detection limits for pesticides analyzed in surface water in 2001 and 2002 are taken from Orlando and others, 2004. Method detection limits not available for Bifenthrin, Cyfluthrin, Cypermethrin, Deltamethrin, Esfenvalerate, Fenpropathrin, Lambda-
cyhalothrin, Resmethrin, Permethrin, Phenothrin, p,p′-DDD,
p,p′-DDE, p,p′-DDT, Tau-fluvalinate; ng/L, nanogram per liter]
Pesticide Method detection limit (ng/L)
Alachlor¹ 2.1
Atrazine¹ 4.2
Butylate¹ 1.8
Carbaryl 4.2
Carbofuran¹ 3.3
Chlorpyrifos¹ 4.2
Cycloate¹ 1.5
DCPA¹ 1.2
Diazinon 3.6
EPTC 4.5
Ethalfluralin¹ 2.4
Hexazinone 5.7
Malathion¹ 2.1
Methidathion 5.4
Methyl parathion¹ 4.2
Metolachlor 3.3
Molinate 2.7
Napropamide 7.2
Oxyfluorfen 4.2
Pebulate¹ 0.6
Pendimethalin 2.4
Phosmet¹ 4.2
Piperonyl butoxide¹ 3.3
Prometryn¹ 2.7
Simazine 6.9
Thiobencarb 3.9
Trifluralin 3.0
MDLs for the sediment samples were determined using seven replicates of Cache Creek sediment collected for this study. Cache Creek was chosen because it had low background pesticide concentrations and was similar in organic carbon content to the other sites. A mixture containing approximately 50 ng of each analyte (approximately10 ng/g dry weight) was added to the sediment and carried through the entire procedure. The method detection limits for each compound in sediment and water are listed in tables 3 and 4.
The MDL was calculated for each pesticide using the fol-lowing equation:
MDL = S × t (n–1, 1–a = 0.99)
where:
MDL = method detection limit (µg/kg)S = standard deviation of replicate samplesn = number of replicatest = value of Student’s t statistic at 6 degrees of freedom
and 99 percent confidence level
MDLs for sediment ranged from 0.6 to 7.9 µg/kg (table 3), whereas MDLs for dissolved pesticides ranged from 0.6 to 7.2 ng/L (table 4). Analytes can be identified at concentrations less than the MDL with a lower confidence in the actual value; there-fore, these concentrations are reported as estimated values.
Sediment Organic Carbon Analysis
Suspended and bed sediments were analyzed for organic carbon content using a Perkin Elmer CHNS/O analyzer (Perkin Elmer Corporation, Norwalk, Connecticut). Sediments were combusted at 925 °C in silver boats after being exposed to concentrated HCl fumes in a desiccator for 24 hours to remove inorganic carbon. Before analysis, sediments were dried to a constant weight at 100 °C for 3 hours. Acetanilimide was used for instrument calibration of elemental carbon and nitrogen.
¹Pesticides not detected in this study
10

Analysis of Suspended Sediments and Water-Quality Parameters
Whole water samples were analyzed for suspended-sedi-ment concentration at the U.S. Geological Survey Sediment Laboratory in Marina, California. Details of the analytical method can be found in Guy (1969). Analytical results of single-blind quality control samples provided by the USGS’s Sediment Laboratory Quality Assurance Project show that lab-oratory performance during the period of this study was satis-factory (U.S. Geological Survey, 2005).
Water parameters (pH, specific conductance, and water temperature) were measured in whole-water samples on site or at the Sacramento laboratory within 24 hours of sample collec-tion. Specific conductance and pH were measured using two handheld instruments, (Cole Parmer Model 141-61 and Orion Model 250A, respectively), following methods described in the USGS’s National Field Manual (Wilde and Radtke, 1998). Water temperature was measured in the field at the time of collection using a digital thermometer.
Results
Dissolved Pesticide Concentrations
In this study, 13 current-use pesticides were detected in surface water samples collected from the six input sites to the Bypass and the two sites within the Bypass (table 2). Hexazinone and simazine were detected in samples collected from every site and were the highest in early February at KL Ridge Cut and Willow Slough, respectively, in 2004. Willow Slough, KL Ridge Cut, and Toe Drain had the highest pesticide concentrations compared with the other sites with values rang-ing from 5 to 2,500 ng/L (table 5).
Table 5 Pesticide concentrations detected in surface water samples collected in 2004 from six source watersheds and two sites within the Yolo Bypass, California.[Site names are abbreviated; for complete names, see table 2. Pesticide concentrations in nanogram per liter. Samples were analyzed for the following pesti-cides that were not detected: Alachlor, Atrazine, Butylate, Carbofuran, Chlorpyrifos, Cycloate, DCPA, Ethalfluralin, Malathion, Methyl parathion, Pebulate, Phosmet, Piperonyl butoxide, and Prometryn. hh:mm, hours:minutes; mm/dd/yy, month/day/year; nd, not detected; ( ), concentrations less than MDL and are estimated values]
SiteDate
(mm/dd/yy)Time
(hh:mm)Carbaryl Diazinon EPTC Hexazinone
Methida-thion
Metola-chlor
Molinate
Cache Creek 2/19/04 14:00 nd nd nd 19.4 nd nd nd
2/26/04 09:10 nd nd nd 46.4 nd 3.5 nd
3/04/04 10:50 nd nd nd 7.7 nd nd nd
3/11/04 11:00 nd nd nd 6.0 nd nd nd
Knights Landing Ridge Cut 2/19/04 14:35 nd 157 nd 947 39.5 22.8 12.5
2/26/04 08:40 nd 41.7 nd 315 nd 10.4 27.7
3/04/04 11:05 nd 40.8 nd 409 nd 26.9 20.4
3/11/04 11:15 nd 20.7 nd 271 nd 23.3 23.7
Putah Creek 2/19/04 10:45 nd nd nd 15.2 nd nd nd
2/26/04 10:15 nd nd nd 10.8 nd nd nd
3/04/04 09:20 nd nd nd nd nd nd nd
3/11/04 11:15 nd nd nd nd nd nd nd
3/17/04 11:10 nd nd nd nd nd nd nd
3/23/04 10:45 nd nd nd nd nd nd nd
3/29/04 10:45 nd nd nd nd nd nd nd
4/05/04 08:50 nd nd nd nd nd nd nd
4/12/04 12:00 nd nd nd nd nd 8.6 nd
4/21/04 12:10 nd nd nd 14.9 nd nd nd
11

SiteDate
(mm/dd/yy)Time
(hh:mm)Carbaryl Diazinon EPTC Hexazinone
Methida-thion
Metola-chlor
Molinate
Sacramento River 2/19/04 15:00 nd 28.1 nd 31.6 nd nd nd
2/26/04 08:05 nd nd nd 32.3 nd (1.7) nd
3/04/04 11:35 nd 4.1 nd 17.3 nd 4.0 nd
3/11/04 11:45 nd (3.4) nd 10.9 nd nd nd
Sacramento Slough 2/19/04 15:25 nd 11.9 11.4 328 nd 24.5 33.3
2/26/04 07:35 nd nd nd 17.5 nd nd nd
3/04/04 12:00 nd (0.2) nd 22.7 nd nd nd
3/11/04 12:20 nd nd nd 15.0 nd 3.9 nd
Toe Drain 3/11/04 09:30 nd 10.1 nd 167 nd 20.8 15.4
3/17/04 13:05 nd 4.0 nd 87.5 nd 24.2 8.6
3/23/04 12:15 nd 5.7 nd 56.9 nd 22.1 nd
3/29/04 12:00 41.3 nd nd 57.9 nd 113 nd
4/05/04 09:40 nd (0.9) nd 66.1 nd 55.1 nd
4/12/04 13:05 nd nd nd 70.9 nd 265 nd
4/21/04 13:10 nd nd 32.0 196 367 9.4
Willow Slough 2/19/04 12:50 nd 12.2 nd 2539 nd 28.9 nd
2/26/04 09:50 nd 96.4 nd 1556 nd 49.5 nd
3/04/04 10:19 nd nd nd 369 nd 13.5 nd
3/11/04 10:35 nd nd nd 318 nd 10.7 nd
Yolo Pond 2/19/04 11:45 nd 16.0 nd 89.8 nd nd nd
3/17/04 12:00 nd nd nd 174 nd 7.2 nd
3/23/04 11:30 nd nd nd 314 nd 9.6 nd
3/29/04 11:30 nd nd nd 365 nd 9.9 nd
4/05/04 09:25 nd nd nd 352 nd 9.9 nd
4/12/04 12:30 nd nd nd 403 nd 11.6 nd
4/21/04 12:40 nd nd nd 368 nd 6.3 nd
Table 5 Pesticide concentrations detected in surface water samples collected in 2004 from six source watersheds and two sites within the Yolo Bypass, California—Continued.[Site names are abbreviated; for complete names, see table 2. Pesticide concentrations in nanogram per liter. Samples were analyzed for the following pesti-cides that were not detected: Alachlor, Atrazine, Butylate, Carbofuran, Chlorpyrifos, Cycloate, DCPA, Ethalfluralin, Malathion, Methyl parathion, Pebulate, Phosmet, Piperonyl butoxide, and Prometryn. hh:mm, hours:minutes; mm/dd/yy, month/day/year; nd, not detected; ( ), concentrations less than MDL and are estimated values]
12

SiteDate
(mm/dd/yy)Time
(hh:mm)Napropamide Oxyfluorfen Pendimethalin Simazine Thiobencarb Trifluralin
Cache Creek 02/19/04 14:00 nd nd nd 43.3 nd nd02/26/04 09:10 nd nd nd 24.4 nd 9.803/04/04 10:50 nd nd nd 30.5 nd nd03/11/04 11:00 nd nd nd 20.8 nd nd
Knights Landing Ridge Cut 02/19/04 14:35 38.4 nd 8.0 604 27.3 nd02/26/04 08:40 nd nd nd 457 30.9 9.103/04/04 11:05 nd nd nd 394 32.4 12.403/11/04 11:15 nd nd nd 266 25.3 nd
Putah Creek 02/19/04 10:45 nd nd nd 41.9 nd nd02/26/04 10:15 nd nd nd 84.0 nd nd03/04/04 09:20 nd nd nd 35.3 nd nd03/11/04 10:15 nd nd nd 35.1 nd nd03/17/04 11:10 nd nd nd 39.6 nd nd03/23/04 10:45 nd nd nd 33.6 nd nd03/29/04 10:45 nd nd nd 30.3 nd nd04/05/04 08:50 nd nd nd 28.0 nd nd04/12/04 12:00 nd nd nd 29.4 nd 11.204/21/04 12:10 nd nd nd 26.8 nd 4.1
Sacramento River 02/19/04 15:00 nd nd nd 106 nd nd02/26/04 08:05 nd nd nd 27.1 nd nd03/04/04 11:35 nd nd nd 43.0 nd nd03/11/04 11:45 nd nd nd 15.9 nd nd
Sacramento Slough 02/19/04 15:25 nd 48.6 nd 84.8 24.6 5.402/26/04 07:35 nd nd nd nd nd nd03/04/04 12:00 nd nd nd 49.1 nd nd03/11/04 12:20 nd nd nd 22.4 nd nd
Toe Drain 03/11/04 09:30 nd nd nd 164 nd 4.103/17/04 13:05 nd nd nd 90.1 15.3 9.403/23/04 12:15 nd nd nd 51.7 12.1 9.103/29/04 12:00 nd nd 9.7 44.2 nd 4.404/05/04 09:40 nd nd 21.0 73.8 8.8 nd04/12/04 13:05 nd nd 8.5 50.7 10.3 6.504/21/04 13:10 nd nd nd 45.9 12.8 12.5
Willow Slough 02/19/04 12:50 nd 39.5 nd 85.6 nd 66.402/26/04 09:50 78.8 71.1 nd 148 nd 56.803/04/04 10:19 nd 15.3 nd 36.3 18.4 12.503/11/04 10:35 nd 30.6 nd 23.8 9.3 9.8
Yolo Pond 02/19/04 11:45 nd nd nd nd nd nd03/17/04 12:00 nd nd nd 61.7 nd nd03/23/04 11:30 nd nd nd 49.0 nd nd03/29/04 11:30 nd nd nd 34.0 nd 4.804/05/04 09:25 nd nd nd 24.4 nd nd04/12/04 12:30 nd nd nd 20.0 nd nd04/21/04 12:40 nd nd nd 26.0 nd nd
Table 5 Pesticide concentrations detected in surface water samples collected in 2004 from six source watersheds and two sites within the Yolo Bypass, California—Continued.[Site names are abbreviated; for complete names, see table 2. Pesticide concentrations in nanogram per liter. Samples were analyzed for the following pesti-cides that were not detected: Alachlor, Atrazine, Butylate, Carbofuran, Chlorpyrifos, Cycloate, DCPA, Ethalfluralin, Malathion, Methyl parathion, Pebulate, Phosmet, Piperonyl butoxide, and Prometryn. hh:mm, hours:minutes; mm/dd/yy, month/day/year; nd, not detected; ( ), concentrations less than MDL and are estimated values]
13
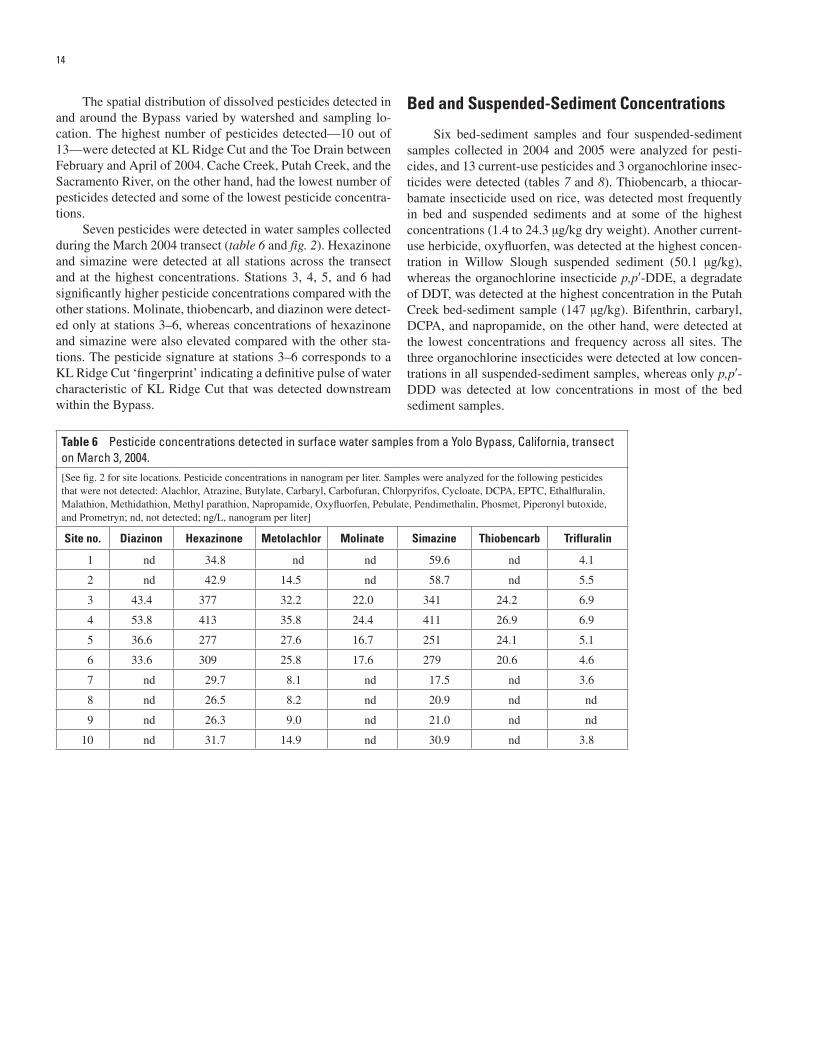
The spatial distribution of dissolved pesticides detected in and around the Bypass varied by watershed and sampling lo-cation. The highest number of pesticides detected—10 out of 13—were detected at KL Ridge Cut and the Toe Drain between February and April of 2004. Cache Creek, Putah Creek, and the Sacramento River, on the other hand, had the lowest number of pesticides detected and some of the lowest pesticide concentra-tions.
Seven pesticides were detected in water samples collected during the March 2004 transect (table 6 and fig. 2). Hexazinone and simazine were detected at all stations across the transect and at the highest concentrations. Stations 3, 4, 5, and 6 had significantly higher pesticide concentrations compared with the other stations. Molinate, thiobencarb, and diazinon were detect-ed only at stations 3–6, whereas concentrations of hexazinone and simazine were also elevated compared with the other sta-tions. The pesticide signature at stations 3–6 corresponds to a KL Ridge Cut ‘fingerprint’ indicating a definitive pulse of water characteristic of KL Ridge Cut that was detected downstream within the Bypass.
Table 6 Pesticide concentrations detected in surface water samples from a Yolo Bypass, California, transect on March 3, 2004.[See fig. 2 for site locations. Pesticide concentrations in nanogram per liter. Samples were analyzed for the following pesticides that were not detected: Alachlor, Atrazine, Butylate, Carbaryl, Carbofuran, Chlorpyrifos, Cycloate, DCPA, EPTC, Ethalfluralin, Malathion, Methidathion, Methyl parathion, Napropamide, Oxyfluorfen, Pebulate, Pendimethalin, Phosmet, Piperonyl butoxide, and Prometryn; nd, not detected; ng/L, nanogram per liter]
Site no. Diazinon Hexazinone Metolachlor Molinate Simazine Thiobencarb Trifluralin
1 nd 34.8 nd nd 59.6 nd 4.1
2 nd 42.9 14.5 nd 58.7 nd 5.5
3 43.4 377 32.2 22.0 341 24.2 6.9
4 53.8 413 35.8 24.4 411 26.9 6.9
5 36.6 277 27.6 16.7 251 24.1 5.1
6 33.6 309 25.8 17.6 279 20.6 4.6
7 nd 29.7 8.1 nd 17.5 nd 3.6
8 nd 26.5 8.2 nd 20.9 nd nd
9 nd 26.3 9.0 nd 21.0 nd nd
10 nd 31.7 14.9 nd 30.9 nd 3.8
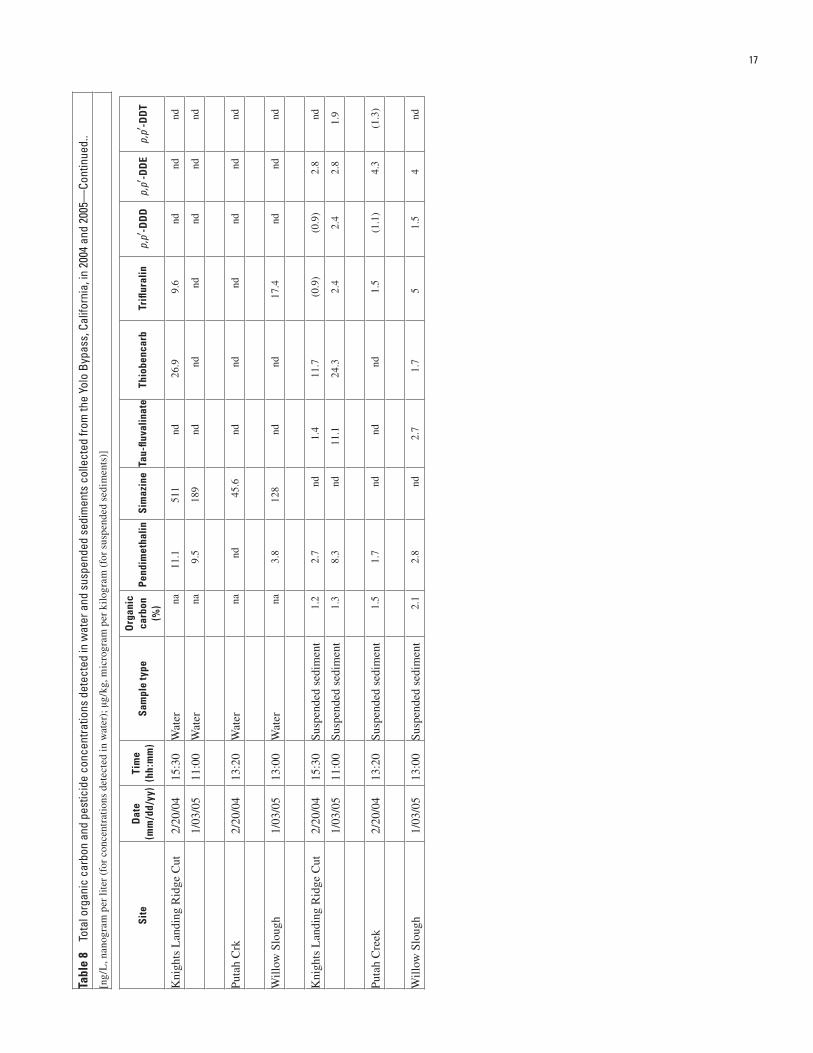
Bed and Suspended-Sediment Concentrations
Six bed-sediment samples and four suspended-sediment samples collected in 2004 and 2005 were analyzed for pesti-cides, and 13 current-use pesticides and 3 organochlorine insec-ticides were detected (tables 7 and 8). Thiobencarb, a thiocar-bamate insecticide used on rice, was detected most frequently in bed and suspended sediments and at some of the highest concentrations (1.4 to 24.3 µg/kg dry weight). Another current-use herbicide, oxyfluorfen, was detected at the highest concen-tration in Willow Slough suspended sediment (50.1 µg/kg), whereas the organochlorine insecticide p,p′-DDE, a degradate of DDT, was detected at the highest concentration in the Putah Creek bed-sediment sample (147 µg/kg). Bifenthrin, carbaryl, DCPA, and napropamide, on the other hand, were detected at the lowest concentrations and frequency across all sites. The three organochlorine insecticides were detected at low concen-trations in all suspended-sediment samples, whereas only p,p′-DDD was detected at low concentrations in most of the bed sediment samples.
14

Tabl
e 7
To
tal o
rgan
ic c
arbo
n an
d pe
stic
ide
conc
entra
tions
in b
ed s
edim
ent s
ampl
es c
olle
cted
Sep
tem
ber 2
1, 2
004,
from
the
Yolo
Byp
ass,
Cal
iforn
ia.
[Sit
e na
mes
are
abb
revi
ated
; for
com
plet
e na
mes
, see
tabl
e 2.
Con
cent
rtat
ions
are
in µ
g/kg
dry
wei
ght.
Sam
ples
wer
e an
alyz
ed f
or th
e fo
llow
ing
pest
icid
es th
at w
ere
not d
etec
ted:
Ala
chlo
r, A
traz
ine,
Bif
en-
thri
n, B
utyl
ate,
Car
bofu
ran,
Cyc
loat
e, C
yflu
thri
n, C
yper
met
hrin
, Dia
zino
n, D
elta
met
hrin
, EP
TC
, Esf
enva
lera
te, E
thal
flur
alin
, Fen
prop
athr
in, H
exaz
inon
e, L
ambd
a-cy
halo
thri
n, M
alat
hion
, Met
hida
thio
n,
Met
hyl p
arat
hion
, Peb
ulat
e, P
endi
met
hali
n, P
erm
ethr
in, P
heno
thri
n, P
hosm
et, P
iper
onyl
but
oxid
e, P
rom
etry
n, R
esm
ethr
in, S
imaz
ine,
Tau
-flu
vali
nate
; nd,
not
det
ecte
d; (
), c
once
ntra
tion
s le
ss th
an M
DL
an
d ar
e es
tim
ated
val
ues.
Site
O
rgan
ic
carb
on (%
)Ca
rbar
ylCh
lorp
yrifo
s-D
CPA
Met
olac
hlor
Mol
inat
eN
apro
pam
ide-
Oxy
fluro
fen
Thio
benc
arb-
Trifl
ural
inp,
p′-D
DD
p,p′-
DD
Ep,
p′-D
DT
Cac
he C
reek
1.5
ndnd
ndnd
ndnd
nd(1
.4)
ndnd
ndnd
Puta
h C
reek
0.9
7.7
nd2.
6(0
.4)
nd2.
715
.8nd
2415
.814
741
.1
Kni
ghts
Lan
ding
R
idge
Cut
1.3
ndnd
nd(1
.2)
1.1
ndnd
2.5
(0.1
)(0
.5)
ndnd
Toe
Dra
in0.
8nd
ndnd
nd0.
8nd
nd5.
6(0
.2)
(0.6
)nd
nd
Woo
dlan
d0.
6nd
3.9
ndnd
ndnd
nd8.
8(0
.3)
1.5
ndnd
Will
ow S
loug
h1.
8nd
2.4
ndnd
ndnd
nd3.
1nd
2.2
3nd
15

Tabl
e 8
To
tal o
rgan
ic c
arbo
n an
d pe
stic
ide
conc
entra
tions
det
ecte
d in
wat
er a
nd s
uspe
nded
sed
imen
ts c
olle
cted
from
the
Yolo
Byp
ass,
Cal
iforn
ia, i
n 20
04 a
nd 2
005.
[ng/
L, n
anog
ram
per
lite
r (f
or c
once
ntra
tion
s de
tect
ed in
wat
er);
µg/
kg, m
icro
gram
per
kil
ogra
m (
for
susp
ende
d se
dim
ents
)]
Site
Dat
e (m
m/d
d/yy
)Ti
me
(hh:
mm
)Sa
mpl
e ty
peO
rgan
ic
carb
on
(%)
Bife
nthr
inCh
lorp
yrifo
sD
iazi
non
Hex
azin
one
Met
hida
thio
nM
etol
achl
orM
olin
ate
Oxy
fluor
fen
Kni
ghts
Lan
ding
Rid
ge C
ut2/
20/0
415
:30
Wat
erna
ndnd
160
987
30.3
32.2
24.2
56.6
1/3/
0511
:00
Wat
erna
ndnd
nd30
0nd
21.9
8.12
14.7
Puta
h C
reek
2/20
/04
13:2
0W
ater
nand
ndnd
14.4
ndnd
ndnd
Will
ow S
loug
h1/
3/05
13:0
0W
ater
nand
ndnd
9210
nd74
.9nd
27.1
Kni
ghts
Lan
ding
Rid
ge C
ut2/
20/0
415
:30
Susp
ende
d se
dim
ent
1.2
ndnd
ndnd
nd(0
.4)
2.4
16.3
1/3/
0511
:00
Susp
ende
d se
dim
ent
1.3
nd(0
.5)
ndnd
nd(1
.29)
4.5
26.4
Puta
h C
reek
2/20
/04
13:2
0Su
spen
ded
sedi
men
t1.
5nd
ndnd
ndnd
ndnd
nd
Will
ow S
loug
h1/
3/05
13:0
0Su
spen
ded
sedi
men
t2.
1(1
.7)
1.3
nd9.
4nd
3.9
nd50
.1
16
Site
Dat
e (m
m/d
d/yy
)Ti
me
(hh:
mm
)Sa
mpl
e ty
peO
rgan
ic
carb
on
(%)
Pend
imet
halin
Sim
azin
eTa
u-flu
valin
ate
Thio
benc
arb
Trifl
ural
inp,
p′-D
DD
p,p′-
DD
Ep,
p′-D
DT
Kni
ghts
Lan
ding
Rid
ge C
ut2/
20/0
415
:30
Wat
erna
11.1
511
nd26
.99.
6nd
ndnd
1/03
/05
11:0
0W
ater
na9.
518
9nd
ndnd
ndnd
nd
Puta
h C
rk2/
20/0
413
:20
Wat
erna
nd45
.6nd
ndnd
ndnd
nd
Will
ow S
loug
h1/
03/0
513
:00
Wat
erna
3.8
128
ndnd
17.4
ndnd
nd
Kni
ghts
Lan
ding
Rid
ge C
ut2/
20/0
415
:30
Susp
ende
d se
dim
ent
1.2
2.7
nd1.
411
.7(0
.9)
(0.9
)2.
8nd
1/03
/05
11:0
0Su
spen
ded
sedi
men
t1.
38.
3nd
11.1
24.3
2.4
2.4
2.8
1.9
Puta
h C
reek
2/20
/04
13:2
0Su
spen
ded
sedi
men
t1.
51.
7nd
ndnd
1.5
(1.1
)4.
3(1
.3)
Will
ow S
loug
h1/
03/0
513
:00
Susp
ende
d se
dim
ent
2.1
2.8
nd2.
71.
75
1.5
4nd
Tabl
e 8
To
tal o
rgan
ic c
arbo
n an
d pe
stic
ide
conc
entra
tions
det
ecte
d in
wat
er a
nd s
uspe
nded
sed
imen
ts c
olle
cted
from
the
Yolo
Byp
ass,
Cal
iforn
ia, i
n 20
04 a
nd 2
005—
Cont
inue
d..
[ng/
L, n
anog
ram
per
lite
r (f
or c
once
ntra
tion
s de
tect
ed in
wat
er);
µg/
kg, m
icro
gram
per
kil
ogra
m (
for
susp
ende
d se
dim
ents
)]
17

Suspended sediments had a greater number of detections and higher pesticide concentrations compared with the corre-sponding bed sediment samples, with the exception of Putah Creek. Tau-fluvalinate, a pyrethroid insecticide, was detected in the suspended sediments collected from KL Ridge Cut in 2004 and 2005 and from Willow Slough in 2005. With the excep-tion of p,p′-DDE, pesticide concentrations from 2005 KL Ridge Cut suspended-sediment samples were higher than those from 2004. The only pesticide not detected in 2004 that showed up at very low concentrations in 2005 (< 2 µg/kg) was p,p′-DDT.
When the large volume water samples were processed for suspended sediments in 2004 and 2005, the centrifuge efflu-ent was also analyzed for dissolved pesticides. Hexazinone and simazine were detected at the highest concentrations in these water samples similar to the surface water samples collected at each site (table 8). The more hydrophobic compounds, such as the pyrethroids and the organochlorine insecticides, were de-tected only in suspended sediments, whereas the more water soluble compounds, such as simazine, were detected only in the water. Seven of the sixteen compounds detected were found in both the water and the suspended sediments.
Suspended-Sediment Concentrations and Water-Quality Parameters
Suspended-sediment concentrations were determined for the 44 out of the 46 water samples collected during this study (table 9). Suspended-sediment concentrations varied between sites and over time. The trend observed in suspended-sediment concentrations for the six inputs to the Bypass was greater for Cache Creek than for Willow Slough followed by KL Ridge Cut, Sacramento River, Putah Creek, and Sacramento Slough. The highest concentrations of suspended sediments were ob-served on either February 19 or February 26, 2004. Suspended-sediment concentrations at the inputs to the Bypass generally increased during the first flood of water and then slowly de-creased over time. Toe Drain and the Yolo Pond, the two low-flow sampling sites within the Bypass, had the highest concen-trations on March 29, 2004, and April 21, 2004, respectively. Yolo Pond generally had the lowest suspended-sediment con-centrations, ranging from 5 to 93 mg/L.
Water temperature, conductivity, and pH also were mea-sured for the 46 water samples collected, and these values are presented in table 9. The pH was similar between sites and over
time, whereas the conductivity varied by location and sampling time. The average temperature at each site increased steadily over the 2-month sampling period.
Sediment Organic Carbon
Sediment organic carbon was measured in both bed and suspended-sediment samples in 2004 and 2005 (tables 7 and 8). The amount of organic carbon ranged from 0.6 to 2.1 percent and was generally higher in the suspended sediments compared with the bed sediments.
ConclusionsThis project was designed to assess the potential expo-
sure of native fish in the Bypass to pesticides during high and low-flow events. One step was to modify the existing sediment analytical method to achieve lower method detection limits and increased recoveries while adding more analytes. The modifica-tions to the sediment method discussed in the report decreased matrix interferences in both bed and suspended sediments, and for some compounds, especially the pyrethroids, decreased the method detection limits. Tau-fluvalinate, a pyrethroid insecti-cide, was one of the six new compounds added and was de-tected at very low concentrations in suspended sediments from KL Ridge Cut and Willow Slough.
Representative samples were analyzed from the possible sources of pesticide contamination to the Bypass which in-cludes surface water and suspended sediments from the source watersheds, as well as resuspension of pesticides bound to bed sediments within the Bypass. Hexazinone and simazine were detected most frequently in the surface water from all sites, whereas thiobencarb and oxyfluorfen were detected at some of the highest concentrations in bed and suspended sediments from most sites. The highest number of pesticides was detected in the suspended sediments compared with bed sediments and surface water. With the exception of a few compounds, the same pesti-cides were detected in the sediment and the water, and correlate with the agricultural use in each of the different watersheds. To successfully optimize the Yolo Bypass as a fisheries habitat, it is important to understand the fate and transport of pesticides to the Bypass under high and low-flow events.
18

Sampling site
Date (mm/dd/yy)
Time (hh:mm)
Suspended sediment
concentration (mg/L)
pHSpecific
conductance (µS/cm)
Water temperature
(°C)
Cache Creek 2/19/04 14:00 1026 7.56 302 12.72/26/04 19:10 1683 7.63 227 10.43/4/04 10:50 613 7.92 365 10.2
3/11/04 11:00 1167 8.37 257 14.7
Knights Landing Ridge Cut 2/19/04 14:35 420 7.34 284 14.02/26/04 08:40 524 7.49 400 11.63/04/04 11:05 210 7.96 370 10.93/11/04 11:15 171 8.14 540 17.11/30/05 11:00 na 7.07 302 na
Sacramento River 2/19/04 15:00 435 6.97 101 12.02/26/04 08:05 123 7.31 134 10.33/04/04 11:35 195 8.02 132 9.83/11/04 11:45 182 8.44 151 13.1
Sacramento Slough 2/19/04 15:25 174 7.05 460 13.32/26/04 07:35 81 7.28 132 10.43/04/04 12:00 71 7.89 135 11.63/11/04 12:20 19 8.16 149 15.4
Willow Slough 2/19/04 12:50 318 7.31 280 12.72/26/04 09:50 920 7.38 146 10.63/04/04 10:19 206 8.05 580 10.53/11/04 10:35 196 8.67 896 16.01/03/05 01:00 na 7.01 162 na
Putah Creek 2/19/04 10:45 250 7.37 314 10.72/26/04 10:15 258 7.65 302 11.03/04/04 09:20 32 8.28 335 10.63/11/04 10:15 34 8.60 343 13.53/17/04 11:10 21 8.58 338 15.73/23/04 10:45 21 8.04 342 15.03/29/04 10:45 28 7.65 340 13.84/05/04 08:50 36 6.97 395 13.64/12/04 12:00 24 7.95 530 18.84/21/04 12:10 231 7.95 530 16.5
Toe Drain 3/11/04 09:30 84 8.29 411 16.03/17/04 13:05 76 8.40 605 na3/23/04 12:15 50 7.89 623 18.53/29/04 12:00 477 7.98 712 18.04/05/04 09:40 86 8.12 818 16.04/12/04 13:05 100 7.98 732 20.24/21/04 13:10 149 7.90 559 16.4
Yolo Pond 2/19/04 11:45 5 7.56 561 14.43/17/04 12:00 23 8.55 558 22.33/23/04 11:30 59 7.93 737 17.73/29/04 11:30 55 7.92 748 22.54/05/04 09:25 52 8.91 918 12.24/12/04 12:30 67 8.31 980 20.14/21/04 12:40 93 8.41 1075 19.5
Table 9. Suspended sediment, concentratons, and water-qualituy parameters for samples from the Yolo Bypass, California.
[Woodland R1 site not sampled for these constituents. hh:mm, hours:minutes; mm/dd/yy, month/day/year; mg/L, milligram per liter; µS/com, microsie-mends per centimeter; na, not analyzed]
19

ReferencesCrepeau, K.L., and Kuivila, K.M., 2000, Rice pesticide concentrations in the Colusa Basin Drain and the Sacramento River,
California, 1990–1993: Journal of Environmental Quality, v. 29, p. 926–935.Crepeau, K.L., Baker, L.M., and Kuivila, K.M., 2000, Method analysis and quality assurance practices for determination of
pesticides in water by solid-phase extraction and capillary-column gas chromatography/mass spectrometry at the U.S. Geological Survey California District Organic Chemistry Laboratory, 1996–99: U.S. Geological Survey Open File Report 2000-229, 19 p.
California Department of Pesticide Regulation, 2003, Pesticide use data for 2003 [digital data]: Sacramento, California Department of Pesticide Regulation.
Guy, H.P., 1969, Laboratory theory and methods for sediment analysis: U.S. Geological Survey Techniques of Water-Resources Investigations, book 5, chap. C1, 58 p.
Horowitz, A.J., Elrick, K.A., and Hooper, R.C., 1989, A comparison of instrumental dewatering methods for the separation and concentration of suspended sediments for subsequent trace element analysis: Hydrological Processes, v. 2, p. 163–184.
Jayaraman, S., Pruell, R.J., and McKinney, R., 2001, Extraction of organic contaminants from marine sediments and tissues using microwave energy: Chemosphere, v. 44, p. 181–191.
Jones and Stokes, 2001, A framework for the future: Yolo Bypass management strategy, final report, accessed May 12, 2005, at http://www.yolobasin.org/bypass_strategy.cfm
Larry Walker Associates, 2005, Yolo Bypass water quality management plan report, accessed May 25, 2005, at http://www.lwa.com/public/YoloBypass/
LeBlanc, L.A., Schroeder, R.A., Orlando, J.L., and Kuivila, K.M., 2004, Pesticide concentrations in water and in suspended and bottom sediments in the New and Alamo Rivers, Salton Sea watershed, April 2003: U.S. Geological Survey Data Series Report 104, 20 p.
Orlando, J.L., Jacobson, L.A., and Kuivila, K.M., 2004, Dissolved pesticide and organic carbon concentrations detected in surface waters, northern central valley, California, 2001–2002: U.S. Geological Survey Open File Report 2004-1214, 32 p.
Sommer, T.R., Harrell, W.C., Nobriga, M.L., Brown, Randall; Moyle, Peter; Kimmerer, W.J., and Schemel, Larry, 2002, California’s Yolo Bypass: evidence that flood control can be compatible with fisheries, wetlands, wildlife, and agriculture: Fisheries, v. 26, p. 6–16.
Sommer, T.R., Nobriga, M.L., Harrell, W.C., Batham, Wendy; and Kimmerer, W.J., 2001, Floodplain rearing of juvenile Chinook salmon: evidence of enhanced growth and survival: Canadian Journal of Fisheries and Aquatic Science, v. 58, p. 325–333.
U.S. Environmental Protection Agency, 1992, Definition and procedure for the determination of the method detection limit—revision 1.11, Code of Federal Regulations 40, Protection of the Environment, CFR Part 136, Appendix B, p. 565–567.
U.S. Geological Survey, 2005, Sediment Laboratory Quality Assurance Project data, accessed February 28, 2005, at http://sedserv.cr.usgs.gov/Lab_results/ca.htm
Wilde, F.D., Radtke, D.B., eds., 1998, chapter sections variously dated, Field measurements: U.S. Geological Survey Techniques of Water-Resources Investigations, book 9, chap. A6.
20
