analysis of price incentives for cotton in uganda for the ... · analysis of price incentives for...
TRANSCRIPT
Technical note: Analysis of price incentives for cotton in Uganda for the time period 2005–2013
November, 2014
Technical note: Analysis of price incentives for cotton in Uganda for the time period 2005–2013
November, 2014
This technical note is a product of the Monitoring and Analyzing Food and Agricultural Policies (MAFAP) programme. It may be updated as new data becomes available.
MAFAP is implemented by the Food and Agriculture Organization of the United Nations (FAO) in collaboration with the Organisation for Economic Co-operation and Development (OECD) and national partners in participating countries. It is financially supported by the Bill and Melinda Gates Foundation, the United States Agency for International Development (USAID) and FAO.
The analysis presented in this document is the result of partnerships established in the context of the MAFAP programme with National Agricultural Research Organisation
This technical note was prepared by [Names of primary author(s)] of the [Name of institution(s)], with support and contributions from [Name of secondary author(s)] of the [Name of institution(s)].
For more information: www.fao.org/in-action/mafap
Recommended citation: FAO. 2014. Analysis of price incentives for cotton in Uganda. Technical notes series, MAFAP, by Ahmed, M., Ojangole, S., Xenakis, M., Rome.
The designations employed and the presentation of material in this information product do not imply the expression of any opinion whatsoever on the part of the Food and Agriculture Organization of the United Nations (FAO) concerning the legal or development status of any country, territory, city or area or of its authorities, or concerning the delimitation of its frontiers or boundaries. The mention of specific companies or products of manufacturers, whether or not these have been patented, does not imply that these have been endorsed or recommended by FAO in preference to others of a similar nature that are not mentioned.
The views expressed in this information product are those of the author(s) and do not necessarily reflect the views or policies of FAO.
© FAO, 2014
FAO encourages the use, reproduction and dissemination of material in this information product. Except where otherwise indicated, material may be copied, downloaded and printed for private study, research and teaching purposes, or for use in non-commercial products or services, provided that appropriate acknowledgement of FAO as the source and copyright holder is given and that FAO’s endorsement of users’ views, products or services is not implied in any way.
All requests for translation and adaptation rights, and for resale and other commercial use rights should be made via www.fao.org/contact-us/licence-request or addressed to [email protected].
FAO information products are available on the FAO website (www.fao.org/publications) and can be purchased through [email protected].
CONTENTS CONTENTS ............................................................................................................................................... iv
SUMMARY OF THE NOTE .......................................................................................................................... v
COMMODITY CONTEXT .................................................................................................................... v
DRIVING FACTORS ........................................................................................................................... vi
RECOMMENDATIONS ...................................................................................................................... vi
1. PURPOSE OF THE NOTE ................................................................................................................... 1
2. COMMODITY CONTEXT ................................................................................................................... 1
PRODUCTION ....................................................................................................................................... 1
CONSUMPTION/UTILIZATION ............................................................................................................. 4
MARKETING AND TRADE ..................................................................................................................... 5
DESCRIPTION OF THE VALUE CHAIN ................................................................................................... 6
POLICY DECISIONS AND MEASURES .................................................................................................... 9
3. METHODOLOGY ............................................................................................................................. 13
4. DATA REQUIREMENTS AND CALCULATION OF INDICATORS ........................................................ 17
TRADE STATUS OF THE PRODUCT ..................................................................................................... 17
MARKET PATHWAY ANALYSED .......................................................................................................... 17
BENCHMARK PRICES .......................................................................................................................... 17
DOMESTIC PRICES ............................................................................................................................. 18
EXCHANGE RATES .............................................................................................................................. 19
ACCESS COSTS ................................................................................................................................... 20
BUDGET AND OTHER TRANSFERS ..................................................................................................... 23
QUALITY AND QUANTITY ADJUSTMENTS .......................................................................................... 23
DATA OVERVIEW ............................................................................................................................... 24
SUMMARY OF INDICATORS ............................................................................................................... 25
5. RESULTS AND INTERPRETATION .................................................................................................... 27
6. CONCLUSIONS ............................................................................................................................... 33
RECOMMENDATIONS ........................................................................................................................ 33
MAIN MESSAGE ................................................................................................................................. 34
LIMITATIONS ..................................................................................................................................... 34
FURTHER INVESTIGATION AND RESEARCH ....................................................................................... 34
BIBLIOGRAPHY ....................................................................................................................................... 35
ANNEX I: Data and calculations used in the analysis ............................................................................ 37
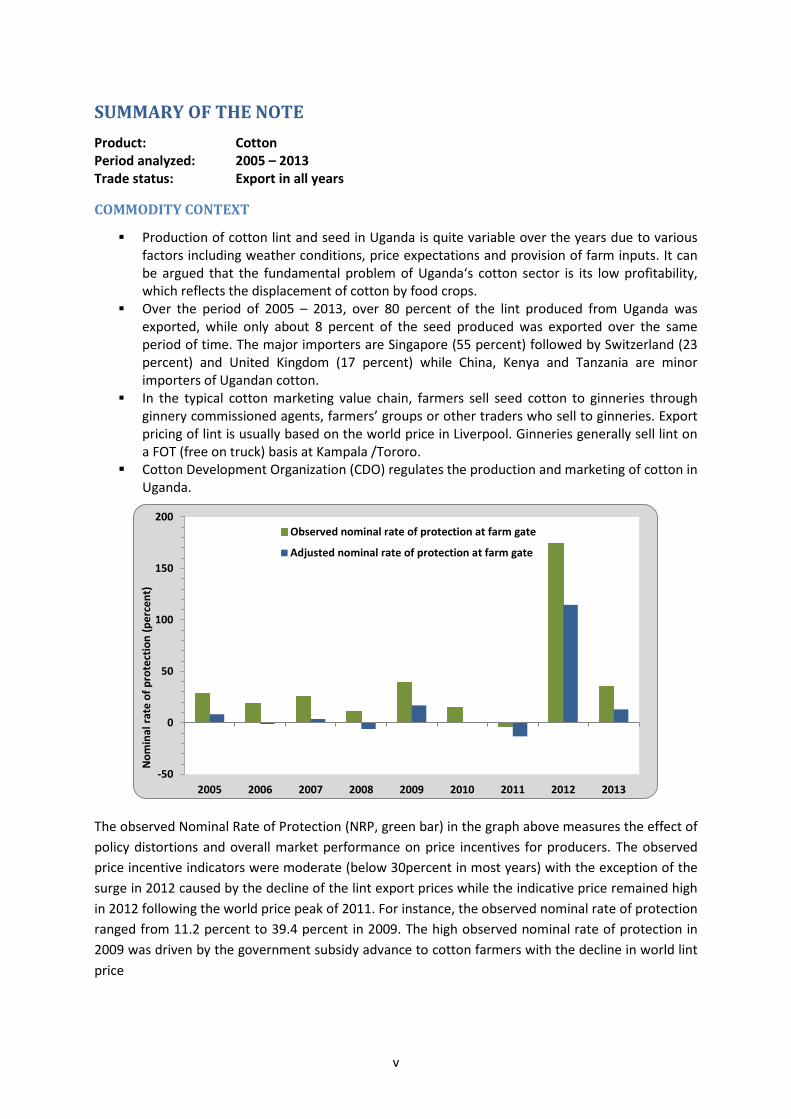
SUMMARY OF THE NOTE Product: Cotton Period analyzed: 2005 – 2013 Trade status: Export in all years
COMMODITY CONTEXT
Production of cotton lint and seed in Uganda is quite variable over the years due to various factors including weather conditions, price expectations and provision of farm inputs. It can be argued that the fundamental problem of Uganda‘s cotton sector is its low profitability, which reflects the displacement of cotton by food crops.
Over the period of 2005 – 2013, over 80 percent of the lint produced from Uganda was exported, while only about 8 percent of the seed produced was exported over the same period of time. The major importers are Singapore (55 percent) followed by Switzerland (23 percent) and United Kingdom (17 percent) while China, Kenya and Tanzania are minor importers of Ugandan cotton.
In the typical cotton marketing value chain, farmers sell seed cotton to ginneries through ginnery commissioned agents, farmers’ groups or other traders who sell to ginneries. Export pricing of lint is usually based on the world price in Liverpool. Ginneries generally sell lint on a FOT (free on truck) basis at Kampala /Tororo.
Cotton Development Organization (CDO) regulates the production and marketing of cotton in Uganda.
The observed Nominal Rate of Protection (NRP, green bar) in the graph above measures the effect of policy distortions and overall market performance on price incentives for producers. The observed price incentive indicators were moderate (below 30percent in most years) with the exception of the surge in 2012 caused by the decline of the lint export prices while the indicative price remained high in 2012 following the world price peak of 2011. For instance, the observed nominal rate of protection ranged from 11.2 percent to 39.4 percent in 2009. The high observed nominal rate of protection in 2009 was driven by the government subsidy advance to cotton farmers with the decline in world lint price
-50
0
50
100
150
200
2005 2006 2007 2008 2009 2010 2011 2012 2013
Nom
inal
rate
of p
rote
ctio
n (p
erce
nt)
Observed nominal rate of protection at farm gate
Adjusted nominal rate of protection at farm gate
v
The adjusted NRP (blue bar) captures the same elements as the observed NRP in addition to any market distortions resulting from inefficiencies in the commodity’s value chain. Unlike the observed, the adjusted nominal rate of protection at the farm gate is quite variable. This indicator was negative and almost zero in 2006 and 2010 and moderately negative in 2011 while it is positive and quite high in 2011 and positive and relatively small in the other years. Overall, the price incentive indicators reveal that cotton producers in Uganda were receiving price incentives in most years even when inefficiencies related to access costs are factored as suggested by the adjusted nominal rate of protection.
Rather than price incentives to producers, the above indicators suggests that the poor performance of the cotton sector is related to factors other than disincentives caused by economic policies including low productivity caused by the low use of purchased capital inputs and low profitability which is directly related to crop yields and output prices and inversely related to the cost of production.
DRIVING FACTORS The major driving force for the generally positive indicators is the cotton pricing system adopted which is based on world prices for lint prevailing at time of price announcement. The indicative price often becomes a price ceiling. However, the variability of the indicators is caused mainly by highly volatile world price of cotton and the difference in price between the price announcement and the realized export price for lint.
RECOMMENDATIONS Given the positive price incentives to producers, the poor performance of the cotton sector in Uganda may be due to low profitability rather than price incentives. A major part of the profitability of cotton is related to fluctuation and volatility of world cotton prices. Uganda, as small cotton producer and exporter, has little room to influence producer prices by influencing world market prices. Despite the incentives to producers, the tendency of the indicative price to manifest itself as a price ceiling may prevent cotton producers from benefiting fully from potentially higher prices during the time of sale as was the case of 2011. Moreover, producer prices of cotton in Uganda are influenced by the world market volatility which may lead in some years to a producer prices below break-even levels since cotton is priced based on prevailing world market prices of lint. We strongly suggest that the government continues maintaining its regulatory role and intervening only to support prices when they fall below the levels required for farmers to break even. There is need for a price stabilization fund to protect farmers from falling prices by topping up farm gate prices when they fall below a stipulated price floor. However, the Cotton Development Act as it stands today is fairly comprehensive and leaves little room for this type of reforms. Hence, adoption of some of this proposal may require amendment of the cotton act.
A key to address low cotton profitability is yield improvement through technological change led by scientific research. The issue of crop yields and productivity can be addressed through the use of high-quality seed of high-yielding cotton varieties combined with the use of purchased inputs, specifically inorganic fertilizer. However, this requires revitalizing the seed sector, provision of credit to producers and access to inputs for farmers. The government may consider increasing investment in transportation infra-structure not only to increase the producer prices of output but also to lower not only the cost of inputs in rural areas.
vi
1. PURPOSE OF THE NOTE This technical note is an attempt to measure, analyze and interpret price incentives for cotton in Uganda over the period 2005 to 2013
For this purpose, yearly averages of domestic farm gate and wholesale prices are compared with reference prices calculated on the basis of the price of the commodity in the international market. The price gaps between reference prices and domestic prices along the commodity’s value chain indicate the extent to which incentives (positive gaps) or disincentives (negative gaps) were present at the farm gate and wholesale level. The price gaps are expressed in relative terms as a percentage of the reference price, referred to as the Nominal Rate of Protection (NRP). These key indicators are used by MAFAP to assess the effects of policy and market performance on prices.
This technical note begins with a review of the commodity’s production, consumption/utilization, marketing and trade, value chain and policy context (Chapter 2). It also provides a detailed description of how key data elements were obtained and indicators were calculated (Chapter 3). The indicators were then interpreted in light of existing policies and market characteristics (Chapter 4). Finally, the note concludes with a few main messages, key policy recommendations, limitations of the analysis and areas identified for further research to improve the analysis (Chapter 5).
The results and recommendations presented in this analysis of price incentives can be used by stakeholders involved in policy-making for the food and agriculture sector. They can also serve as input for evidence-based policy dialogue at the national, regional or international level.
This technical note should not be interpreted as an in-depth value chain analysis or detailed description of the commodity’s production, consumption/utilization, marketing and trade or policy context. All information related to these areas is presented merely to provide background on the commodity under review, help understand major trends and facilitate the interpretation of the indicators.
All information in this technical note is subject to review and validation.
1

2. COMMODITY CONTEXT In Uganda, cotton is considered to be one of the strategic commodities in the Agricultural Sector Development Strategy & Investment Plan: 2010/11 - 2014/15 of the Ministry of Agriculture Animal Industry and Fisheries. Cotton is one of the main foreign exchange earners. Its value chain is vertically integrated with other products and industries, namely textile, vegetable oil for human consumption and other industries such as soap, and seed cake which is important for dairy. As such, the contribution of cotton to employment and the economy of Uganda goes beyond the growing households.
Cotton is Uganda’s third largest export crop after coffee and tea. It is the main source of income for some 250,000 households, who cultivate cotton under rain-fed conditions and with minimal use of inputs, such as fertilizers and chemicals. Since the climate and the soil are very suitable for cotton cultivation, it is a very popular commodity among smallholders with an average farm size of 0.5 hectares.
PRODUCTION Cotton was introduced in Uganda by the British in the early twentieth century, perhaps simultaneous with the introduction of the crop into Sudan and Kenya. Since then, cotton industry has evolved and undergone through many institutional and policy changes. During the 1960s, Uganda was Sub-Saharan Africa‘s largest cotton producer. However, political instability and poor policy choices of the 1970s led to the sector‘s precipitate decline. While attempts to revive the sector with lending operations during the 1980s failed, policy reforms combined with a lending operation and high cotton prices revitalized the sector in the 1990s (Baffes, 2009). Nevertheless there remains the sense that the sector lags behind its full potential. Various reports have linked this chronic underperformance to low quality of cotton, lack of domestic textile industry, and low use of purchased capital inputs due to lack of rural credit as the key constraints (Baffes, 2009; Baffes, 2010).
Uganda first experimented with cotton cultivation in 1903. Cotton was produced for commercial purposes after the construction of the 1 400 kilometer Mombasa-Kisumu rail-way and later increased with the completion of the Busoga railway that connected the Lake Kyoga region with Kampala and substantially reduced the cost of transporting goods from Kampala to Mombasa (Carr, 1982). Cotton production received a further boost following the introduction of a poll tax by the colonial government, which served the dual purpose of collecting revenue and supplying raw material to the British textile industry— at the time, cotton was the country‘s only cash crop hence the only way peasants could pay the poll tax was by cultivating cotton. The tax, UGS 15 per year, equivalent to 100 lbs of seed cotton, in effect, made cotton a forced-labor crop (Baffes, 2009). However, due to economic and political instabilities experienced in the 1970s and 1980s, the cotton industry in Uganda declined steadily reaching a low production of only 11,000 bales in 1988 (CDO, 2000).
Until 1994, the ginning and marketing of cotton was regulated under the Cotton Act, revised in 1964, and the Lint Marketing Board Act of 1959, amended in 1976. As stated above, the Government Marketing Agency – the Lint Marketing Board (LMB) – had a monopoly of cotton lint and seed sales both locally and externally. Marketing of seed cotton and ginning was vested in co-operatives (CDO, 2000). In the late 1991, the government took a deliberate move to liberalize the ginning and marketing of cotton in an effort to revive the cotton sector. A cotton sub sector strategy evolved, which incorporated the policies of the government and also advocated for a five-year COTTON SUB-
1
SECTOR DEVELOPMENT PROJECT (CSDP) 1994-2001 (CDO, 2000). In 1994, the Cotton Development Organization was created to promote and regulate the production and marketing of cotton in Uganda as an autonomous agency. CDO has continued to undertake these functions since then.
The initial genetic material for cotton came from American varieties, which after extensive research and experimentation gave way to varieties better suited to local growing conditions. In the two decades following the crop‘s introduction, output exceeded 30,000 tons. Cotton production grew further to reach 60,000 tons during the mid-1930s, when coffee began to compete in the cash crop market (CDO, 2000). Cotton output and area continued to grow at a slower rate until around 1970, when the area under cultivation peaked and production reached 86,900 tons of lint (CDO, 2010).
Uganda cotton is a rain fed annual crop of medium staple, grown using low input, low output methods mainly by small scale farmers with an average of 1.2 acres (PMA, 2009). The use of fertilizers and pesticides is limited. It is grown at less than 1,500m above sea level, and requires a rainfall regime of over 800 mm/annum. It competes mainly with annual food crops. Cotton has a fairly long growing season of 6 – 7 months. It is usually planted in May/June and harvested in November or December.
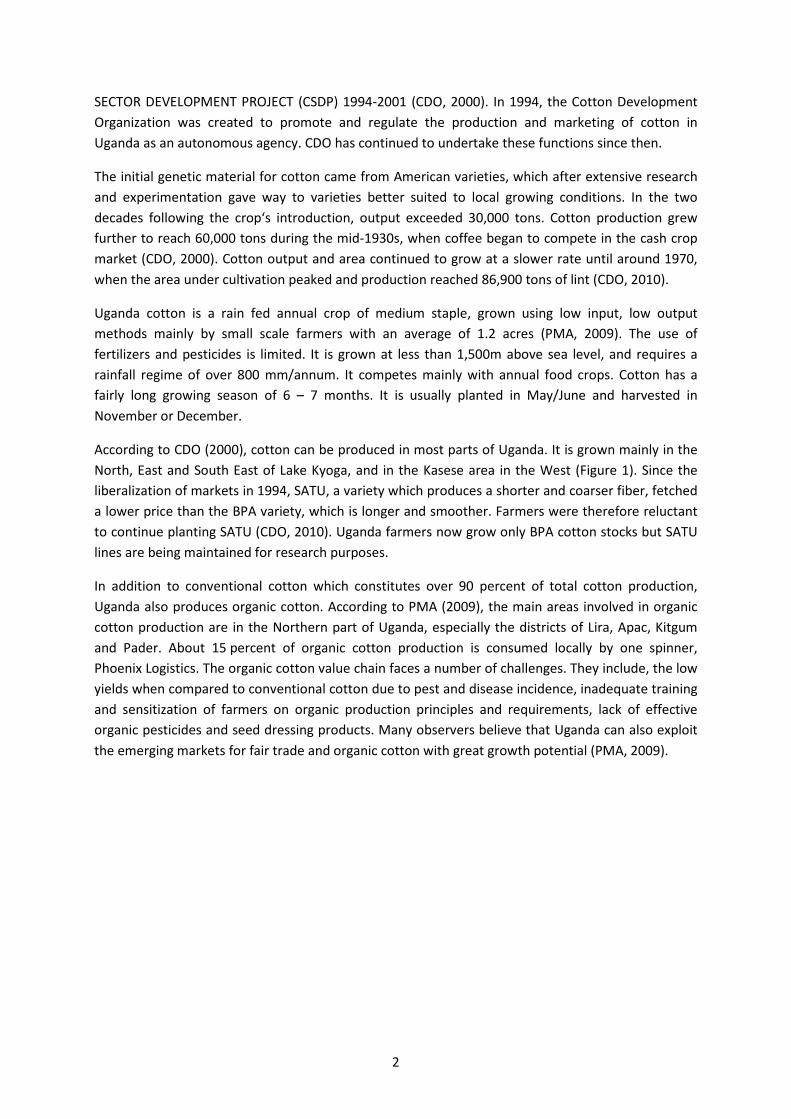
According to CDO (2000), cotton can be produced in most parts of Uganda. It is grown mainly in the North, East and South East of Lake Kyoga, and in the Kasese area in the West (Figure 1). Since the liberalization of markets in 1994, SATU, a variety which produces a shorter and coarser fiber, fetched a lower price than the BPA variety, which is longer and smoother. Farmers were therefore reluctant to continue planting SATU (CDO, 2010). Uganda farmers now grow only BPA cotton stocks but SATU lines are being maintained for research purposes.
In addition to conventional cotton which constitutes over 90 percent of total cotton production, Uganda also produces organic cotton. According to PMA (2009), the main areas involved in organic cotton production are in the Northern part of Uganda, especially the districts of Lira, Apac, Kitgum and Pader. About 15 percent of organic cotton production is consumed locally by one spinner, Phoenix Logistics. The organic cotton value chain faces a number of challenges. They include, the low yields when compared to conventional cotton due to pest and disease incidence, inadequate training and sensitization of farmers on organic production principles and requirements, lack of effective organic pesticides and seed dressing products. Many observers believe that Uganda can also exploit the emerging markets for fair trade and organic cotton with great growth potential (PMA, 2009).
2
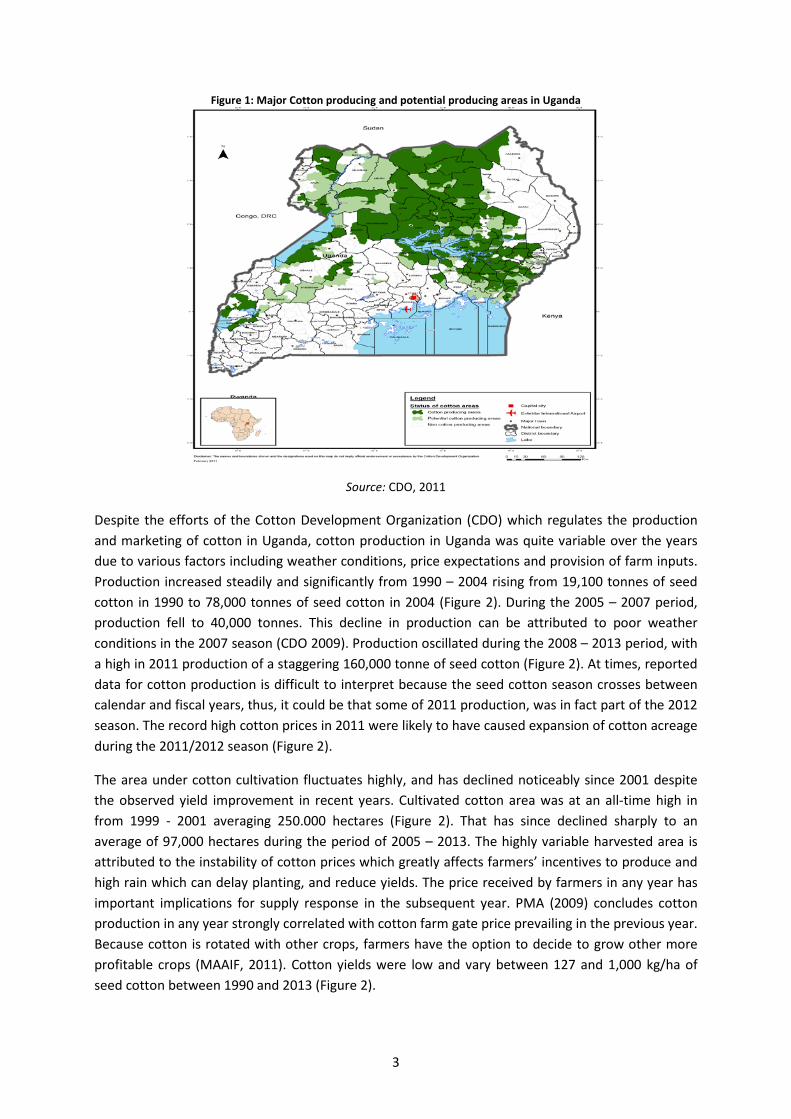
Figure 1: Major Cotton producing and potential producing areas in Uganda
Source: CDO, 2011
Despite the efforts of the Cotton Development Organization (CDO) which regulates the production and marketing of cotton in Uganda, cotton production in Uganda was quite variable over the years due to various factors including weather conditions, price expectations and provision of farm inputs. Production increased steadily and significantly from 1990 – 2004 rising from 19,100 tonnes of seed cotton in 1990 to 78,000 tonnes of seed cotton in 2004 (Figure 2). During the 2005 – 2007 period, production fell to 40,000 tonnes. This decline in production can be attributed to poor weather conditions in the 2007 season (CDO 2009). Production oscillated during the 2008 – 2013 period, with a high in 2011 production of a staggering 160,000 tonne of seed cotton (Figure 2). At times, reported data for cotton production is difficult to interpret because the seed cotton season crosses between calendar and fiscal years, thus, it could be that some of 2011 production, was in fact part of the 2012 season. The record high cotton prices in 2011 were likely to have caused expansion of cotton acreage during the 2011/2012 season (Figure 2).
The area under cotton cultivation fluctuates highly, and has declined noticeably since 2001 despite the observed yield improvement in recent years. Cultivated cotton area was at an all-time high in from 1999 - 2001 averaging 250.000 hectares (Figure 2). That has since declined sharply to an average of 97,000 hectares during the period of 2005 – 2013. The highly variable harvested area is attributed to the instability of cotton prices which greatly affects farmers’ incentives to produce and high rain which can delay planting, and reduce yields. The price received by farmers in any year has important implications for supply response in the subsequent year. PMA (2009) concludes cotton production in any year strongly correlated with cotton farm gate price prevailing in the previous year. Because cotton is rotated with other crops, farmers have the option to decide to grow other more profitable crops (MAAIF, 2011). Cotton yields were low and vary between 127 and 1,000 kg/ha of seed cotton between 1990 and 2013 (Figure 2).
3
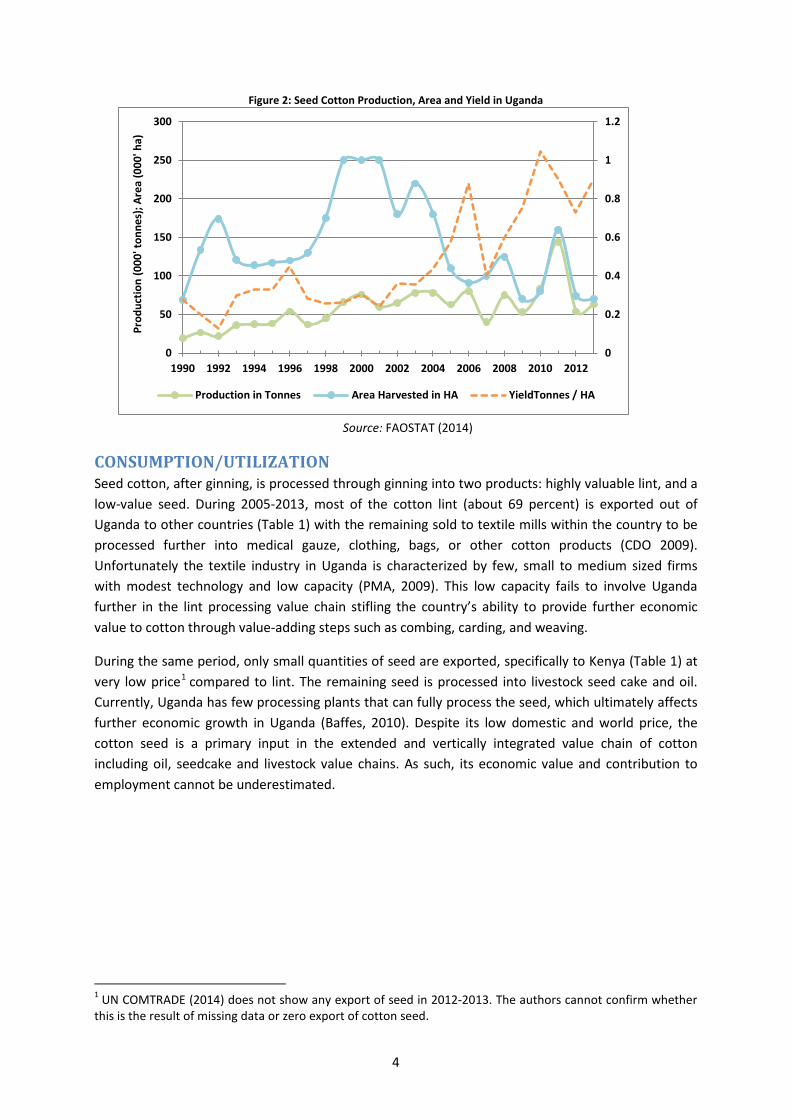
Figure 2: Seed Cotton Production, Area and Yield in Uganda
Source: FAOSTAT (2014)
CONSUMPTION/UTILIZATION Seed cotton, after ginning, is processed through ginning into two products: highly valuable lint, and a low-value seed. During 2005-2013, most of the cotton lint (about 69 percent) is exported out of Uganda to other countries (Table 1) with the remaining sold to textile mills within the country to be processed further into medical gauze, clothing, bags, or other cotton products (CDO 2009). Unfortunately the textile industry in Uganda is characterized by few, small to medium sized firms with modest technology and low capacity (PMA, 2009). This low capacity fails to involve Uganda further in the lint processing value chain stifling the country’s ability to provide further economic value to cotton through value-adding steps such as combing, carding, and weaving.
During the same period, only small quantities of seed are exported, specifically to Kenya (Table 1) at very low price1 compared to lint. The remaining seed is processed into livestock seed cake and oil. Currently, Uganda has few processing plants that can fully process the seed, which ultimately affects further economic growth in Uganda (Baffes, 2010). Despite its low domestic and world price, the cotton seed is a primary input in the extended and vertically integrated value chain of cotton including oil, seedcake and livestock value chains. As such, its economic value and contribution to employment cannot be underestimated.
1 UN COMTRADE (2014) does not show any export of seed in 2012-2013. The authors cannot confirm whether this is the result of missing data or zero export of cotton seed.
0
0.2
0.4
0.6
0.8
1
1.2
0
50
100
150
200
250
300
1990 1992 1994 1996 1998 2000 2002 2004 2006 2008 2010 2012
Prod
uctio
n (0
00' t
onne
s); A
rea
(000
' ha)
Production in Tonnes Area Harvested in HA YieldTonnes / HA
4
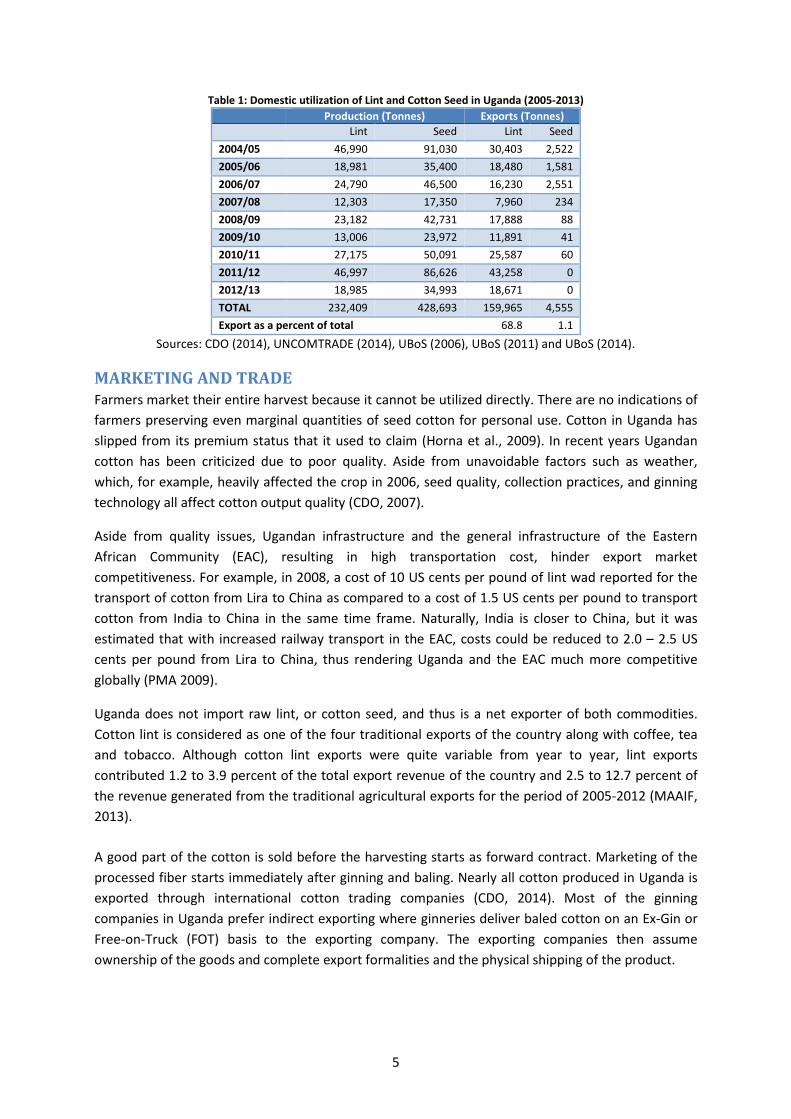
Table 1: Domestic utilization of Lint and Cotton Seed in Uganda (2005-2013) Production (Tonnes) Exports (Tonnes)
Lint Seed Lint Seed 2004/05 46,990 91,030 30,403 2,522 2005/06 18,981 35,400 18,480 1,581 2006/07 24,790 46,500 16,230 2,551 2007/08 12,303 17,350 7,960 234 2008/09 23,182 42,731 17,888 88 2009/10 13,006 23,972 11,891 41 2010/11 27,175 50,091 25,587 60 2011/12 46,997 86,626 43,258 0 2012/13 18,985 34,993 18,671 0 TOTAL 232,409 428,693 159,965 4,555 Export as a percent of total 68.8 1.1
Sources: CDO (2014), UNCOMTRADE (2014), UBoS (2006), UBoS (2011) and UBoS (2014).
MARKETING AND TRADE Farmers market their entire harvest because it cannot be utilized directly. There are no indications of farmers preserving even marginal quantities of seed cotton for personal use. Cotton in Uganda has slipped from its premium status that it used to claim (Horna et al., 2009). In recent years Ugandan cotton has been criticized due to poor quality. Aside from unavoidable factors such as weather, which, for example, heavily affected the crop in 2006, seed quality, collection practices, and ginning technology all affect cotton output quality (CDO, 2007).
Aside from quality issues, Ugandan infrastructure and the general infrastructure of the Eastern African Community (EAC), resulting in high transportation cost, hinder export market competitiveness. For example, in 2008, a cost of 10 US cents per pound of lint wad reported for the transport of cotton from Lira to China as compared to a cost of 1.5 US cents per pound to transport cotton from India to China in the same time frame. Naturally, India is closer to China, but it was estimated that with increased railway transport in the EAC, costs could be reduced to 2.0 – 2.5 US cents per pound from Lira to China, thus rendering Uganda and the EAC much more competitive globally (PMA 2009).
Uganda does not import raw lint, or cotton seed, and thus is a net exporter of both commodities. Cotton lint is considered as one of the four traditional exports of the country along with coffee, tea and tobacco. Although cotton lint exports were quite variable from year to year, lint exports contributed 1.2 to 3.9 percent of the total export revenue of the country and 2.5 to 12.7 percent of the revenue generated from the traditional agricultural exports for the period of 2005-2012 (MAAIF, 2013).
A good part of the cotton is sold before the harvesting starts as forward contract. Marketing of the processed fiber starts immediately after ginning and baling. Nearly all cotton produced in Uganda is exported through international cotton trading companies (CDO, 2014). Most of the ginning companies in Uganda prefer indirect exporting where ginneries deliver baled cotton on an Ex-Gin or Free-on-Truck (FOT) basis to the exporting company. The exporting companies then assume ownership of the goods and complete export formalities and the physical shipping of the product.
5
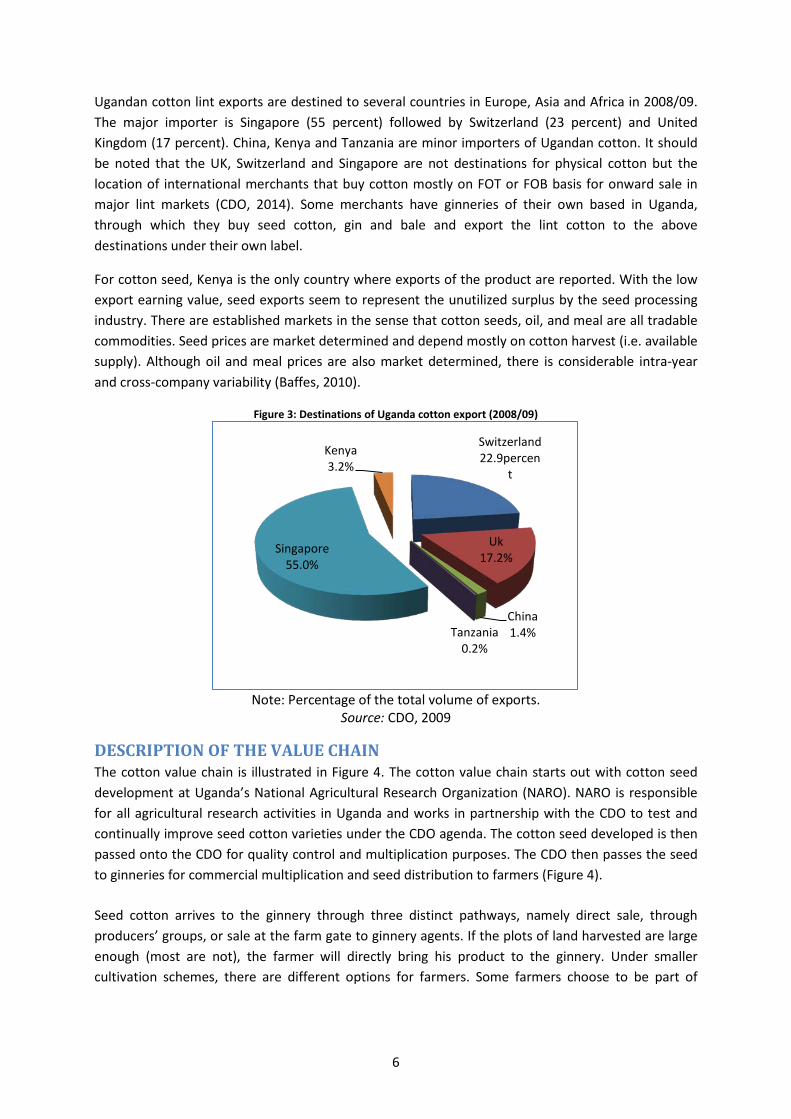
Ugandan cotton lint exports are destined to several countries in Europe, Asia and Africa in 2008/09. The major importer is Singapore (55 percent) followed by Switzerland (23 percent) and United Kingdom (17 percent). China, Kenya and Tanzania are minor importers of Ugandan cotton. It should be noted that the UK, Switzerland and Singapore are not destinations for physical cotton but the location of international merchants that buy cotton mostly on FOT or FOB basis for onward sale in major lint markets (CDO, 2014). Some merchants have ginneries of their own based in Uganda, through which they buy seed cotton, gin and bale and export the lint cotton to the above destinations under their own label.
For cotton seed, Kenya is the only country where exports of the product are reported. With the low export earning value, seed exports seem to represent the unutilized surplus by the seed processing industry. There are established markets in the sense that cotton seeds, oil, and meal are all tradable commodities. Seed prices are market determined and depend mostly on cotton harvest (i.e. available supply). Although oil and meal prices are also market determined, there is considerable intra-year and cross-company variability (Baffes, 2010).
Figure 3: Destinations of Uganda cotton export (2008/09)
Note: Percentage of the total volume of exports.
Source: CDO, 2009
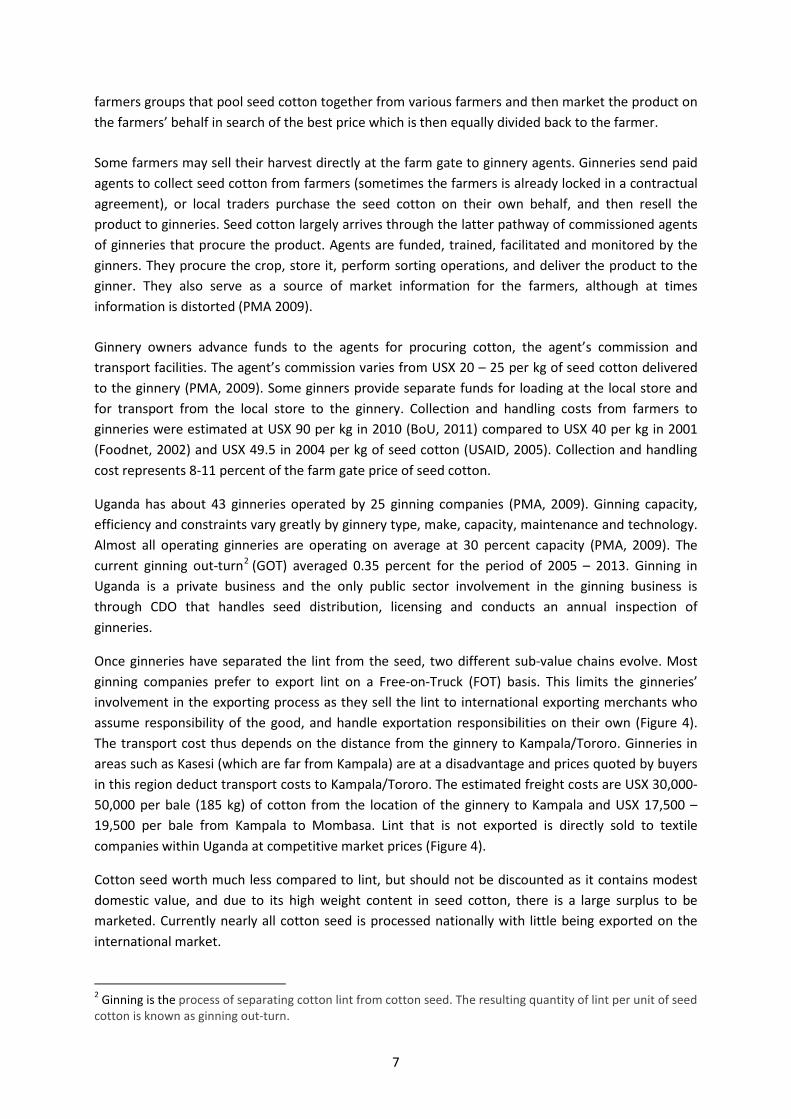
DESCRIPTION OF THE VALUE CHAIN The cotton value chain is illustrated in Figure 4. The cotton value chain starts out with cotton seed development at Uganda’s National Agricultural Research Organization (NARO). NARO is responsible for all agricultural research activities in Uganda and works in partnership with the CDO to test and continually improve seed cotton varieties under the CDO agenda. The cotton seed developed is then passed onto the CDO for quality control and multiplication purposes. The CDO then passes the seed to ginneries for commercial multiplication and seed distribution to farmers (Figure 4).
Seed cotton arrives to the ginnery through three distinct pathways, namely direct sale, through producers’ groups, or sale at the farm gate to ginnery agents. If the plots of land harvested are large enough (most are not), the farmer will directly bring his product to the ginnery. Under smaller cultivation schemes, there are different options for farmers. Some farmers choose to be part of
Switzerland 22.9percen
t
Uk 17.2%
China 1.4% Tanzania
0.2%
Singapore 55.0%
Kenya 3.2%
6
farmers groups that pool seed cotton together from various farmers and then market the product on the farmers’ behalf in search of the best price which is then equally divided back to the farmer.
Some farmers may sell their harvest directly at the farm gate to ginnery agents. Ginneries send paid agents to collect seed cotton from farmers (sometimes the farmers is already locked in a contractual agreement), or local traders purchase the seed cotton on their own behalf, and then resell the product to ginneries. Seed cotton largely arrives through the latter pathway of commissioned agents of ginneries that procure the product. Agents are funded, trained, facilitated and monitored by the ginners. They procure the crop, store it, perform sorting operations, and deliver the product to the ginner. They also serve as a source of market information for the farmers, although at times information is distorted (PMA 2009).
Ginnery owners advance funds to the agents for procuring cotton, the agent’s commission and transport facilities. The agent’s commission varies from USX 20 – 25 per kg of seed cotton delivered to the ginnery (PMA, 2009). Some ginners provide separate funds for loading at the local store and for transport from the local store to the ginnery. Collection and handling costs from farmers to ginneries were estimated at USX 90 per kg in 2010 (BoU, 2011) compared to USX 40 per kg in 2001 (Foodnet, 2002) and USX 49.5 in 2004 per kg of seed cotton (USAID, 2005). Collection and handling cost represents 8-11 percent of the farm gate price of seed cotton.
Uganda has about 43 ginneries operated by 25 ginning companies (PMA, 2009). Ginning capacity, efficiency and constraints vary greatly by ginnery type, make, capacity, maintenance and technology. Almost all operating ginneries are operating on average at 30 percent capacity (PMA, 2009). The current ginning out-turn2 (GOT) averaged 0.35 percent for the period of 2005 – 2013. Ginning in Uganda is a private business and the only public sector involvement in the ginning business is through CDO that handles seed distribution, licensing and conducts an annual inspection of ginneries.
Once ginneries have separated the lint from the seed, two different sub-value chains evolve. Most ginning companies prefer to export lint on a Free-on-Truck (FOT) basis. This limits the ginneries’ involvement in the exporting process as they sell the lint to international exporting merchants who assume responsibility of the good, and handle exportation responsibilities on their own (Figure 4). The transport cost thus depends on the distance from the ginnery to Kampala/Tororo. Ginneries in areas such as Kasesi (which are far from Kampala) are at a disadvantage and prices quoted by buyers in this region deduct transport costs to Kampala/Tororo. The estimated freight costs are USX 30,000-50,000 per bale (185 kg) of cotton from the location of the ginnery to Kampala and USX 17,500 – 19,500 per bale from Kampala to Mombasa. Lint that is not exported is directly sold to textile companies within Uganda at competitive market prices (Figure 4).
Cotton seed worth much less compared to lint, but should not be discounted as it contains modest domestic value, and due to its high weight content in seed cotton, there is a large surplus to be marketed. Currently nearly all cotton seed is processed nationally with little being exported on the international market.
2 Ginning is the process of separating cotton lint from cotton seed. The resulting quantity of lint per unit of seed cotton is known as ginning out-turn.
7
Locally ginners sell the seed to oil millers based in Kampala, Jinja, and Mbale. These plants are specialized in transforming cottonseed into oil, and cotton seed cake that is used as animal feed (Figure 4). Cottonseed oil is refined, bleached and deodorized, usually blended with other oils such as sesame oil, packaged and sold primarily in the domestic market.
It should be noted that out of every bale of seed cotton (185 kg) ginneries are required by the CDO to conserve 15percent of recovered cotton seed (Figure 4). This cotton seed is levied by the CDO to cover costs to famers such as planting material and raw seeds. Yet, the farmer is not being supplied with free seed and materials by the CDO or ginner, as prices of seed cotton received by the farmer are adjusted to factor in the CDO levy.
Figure 4: The typical cotton value chain in Uganda
Source: Adopted from Horna et al., 2009 and FoodNet 2001
According to estimates of PMA (2009), the typical cost and revenue structure of the ginning business reveals a net margin on ginning of USX 607/kg of lint or USX 112,295 per (185 kg) bale as the return to investment and management at 30 percent capacity of operation. Ceteris paribus, this would amount to USX 336,885 per bale at about 90 percent capacity of operation. In 2008, the total cost of ginning was USX 2,932/kg of lint of which only 8 percent is comprised of fixed costs and 92 percent
8
are variable costs including the cost of seed cotton, electricity, casual labour, grading, documentation and communication.
POLICY DECISIONS AND MEASURES Evolution of Cotton policies in Uganda is described by CDO (2000) and Baffes (2009). The evolution of cotton policies followed largely the political changes in the country as well as the increases and declines in cotton production. Many of the policy initiatives were meant to solve the structural problems facing the cotton sector. For example, in 1985 the Government of Uganda (GoU), in collaboration with the World Bank, undertook a comprehensive review of the industry. Two follow-up studies resulted in the formation of the Cotton Task Force whose objective was to identify institutional impediments and prepare investment proposals. As a result, the Emergency Cotton Production Program was launched in 1986/87. Its key objectives were to increase cotton production, revitalize research, initiate a system of seed multiplication, and rehabilitate primary processing facilities (Bibangambah 1995). Despite attention the sector received both in policy and finance, it performed poorly with the collapse of cotton prices in 1985.
GoU launched the Emergency Cotton Production Program in 1986/87. Under the program GoU redefined its role, taking on new responsibilities—especially during the transitional phase—while shedding other activities (World Bank 1994). The reforms introduced in the cotton sector in 1993 coupled with high prices of the mid-1990s led to considerable supply response with cotton production reaching 20,000 tons in 1996 (Baffes, 2009).
Until 1994, the ginning and marketing of cotton was regulated under the Cotton Act, revised in 1964, and the Lint Marketing Board Act of 1959, amended in 1976 (CDO, 2000). The Government Marketing Agency – the Lint Marketing Board (LMB) – had a monopoly of cotton lint and seed sales both locally and externally. Marketing of seed cotton and ginning was vested in co-operatives. Under the Cotton Development Statute of 1994, the Lint Marketing Board was liquidated and a new regulatory agency was established, the Cotton Development Organization (CDO) (Baffes, 2009). The CDO, a statutory body, was created to promote, regulate the production and marketing of cotton in Uganda and as an autonomous agency, to represent the cotton industry in all aspects3 (CDO, 2000).
CDO issues ginning and export licenses and manages a fund for the collection, processing, and distribution of cotton seed for planting. Thus, CDO took over some of the functions of the former Lint Marketing Board. Its objective is to regulate the industry as well as collect and disseminate statistics. It is financed by a levy (2 percent) imposed on all cotton ex-ports. Often, CDO‘s functions are carried out in collaboration with other institutions with broader mandates including the Uganda Ginners and Cotton Exporters Association (UGCEA), the Cotton Research Institute, and various ministries (Baffes, 2009).As for other commodities in Uganda, cotton is not subject to export taxes except the 2 percent of export price levied by CDO to finance its activities. In some cases, commodities are subject to local taxes (cess) during market transactions. Such local taxes were not reported for cotton.
3 Its Board of directors consists of the Chairman (appointed by the Minister), representatives from Ministry of Finance, Planning and Economic Development, MAAIF, and NARO, and six private sector representatives from cotton-related industries. The Managing Director is appointed by the Board.
9
Cotton Pricing policy
One of the major responsibilities of CDO is the announcement of indicative farm gate price, ex-ginnery buying price and export price and to monitor prices actually paid at these levels together with prices of cotton seed for planting and milling (PMA, 2009). Just before the start of cotton harvesting and ginning activities, CDO, in consultation with the industry stakeholders including ginners, evaluates the situation in world and domestic markets, at the end of which an indicative price is set on the basis that they help farmers negotiate a fair share of world prices. In practice, indicative prices are set at conservative levels (Baffes, 2011).
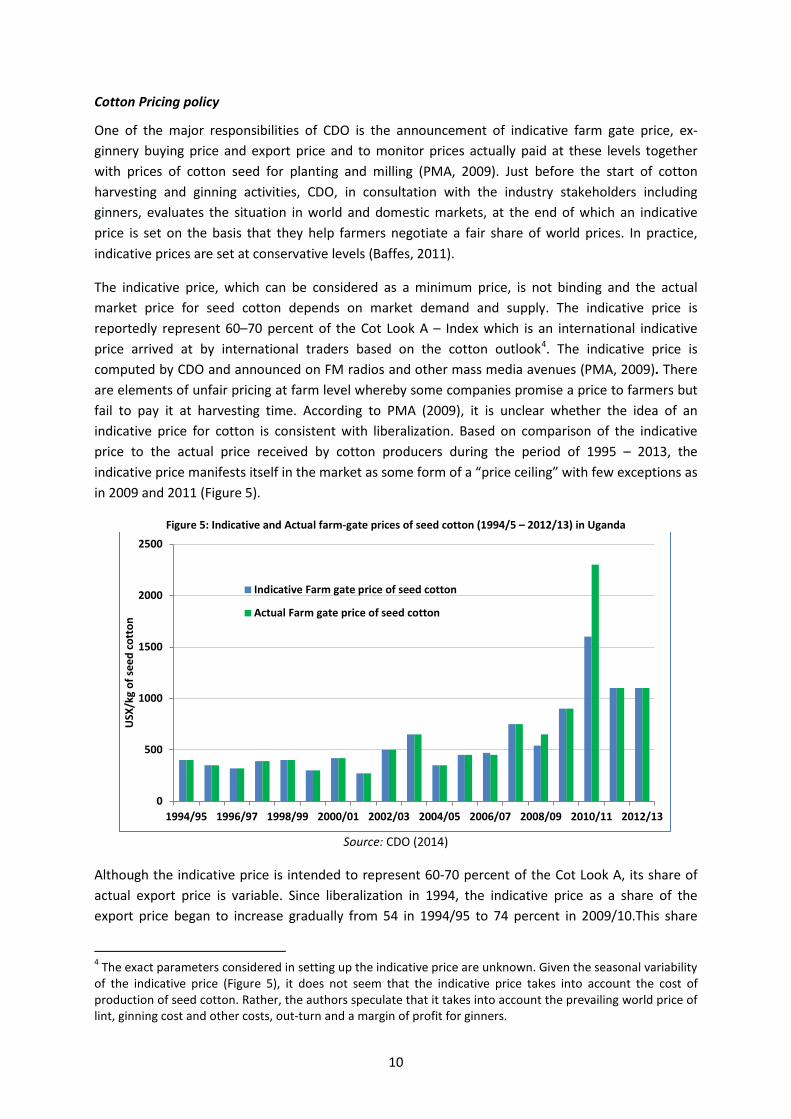
The indicative price, which can be considered as a minimum price, is not binding and the actual market price for seed cotton depends on market demand and supply. The indicative price is reportedly represent 60–70 percent of the Cot Look A – Index which is an international indicative price arrived at by international traders based on the cotton outlook4. The indicative price is computed by CDO and announced on FM radios and other mass media avenues (PMA, 2009). There are elements of unfair pricing at farm level whereby some companies promise a price to farmers but fail to pay it at harvesting time. According to PMA (2009), it is unclear whether the idea of an indicative price for cotton is consistent with liberalization. Based on comparison of the indicative price to the actual price received by cotton producers during the period of 1995 – 2013, the indicative price manifests itself in the market as some form of a “price ceiling” with few exceptions as in 2009 and 2011 (Figure 5).
Figure 5: Indicative and Actual farm-gate prices of seed cotton (1994/5 – 2012/13) in Uganda
Source: CDO (2014)
Although the indicative price is intended to represent 60-70 percent of the Cot Look A, its share of actual export price is variable. Since liberalization in 1994, the indicative price as a share of the export price began to increase gradually from 54 in 1994/95 to 74 percent in 2009/10.This share
4 The exact parameters considered in setting up the indicative price are unknown. Given the seasonal variability of the indicative price (Figure 5), it does not seem that the indicative price takes into account the cost of production of seed cotton. Rather, the authors speculate that it takes into account the prevailing world price of lint, ginning cost and other costs, out-turn and a margin of profit for ginners.
0
500
1000
1500
2000
2500
1994/95 1996/97 1998/99 2000/01 2002/03 2004/05 2006/07 2008/09 2010/11 2012/13
USX
/kg
of se
ed c
otto
n
Indicative Farm gate price of seed cotton
Actual Farm gate price of seed cotton
10
declined to 48 percent in 2010/11 as lint export price increased significantly later in the season. Although seed is low-valued product compared to lint, it represents significant value due to its volume. The value of cotton seed relative to lint depends heavily on expected trends in relative prices. In 2007-09, seed contribution was 15.7 percent and 22.4 percent of the ginnery revenue corresponding to the high and low ginning ratios (Baffes, 2010).
In August 2008, CDO announced a pre-season indicative price of USX 800 per kg of seed cotton. However, in November 2008, actual proucer’s prices dropped to USX 450 per kg of seed cotton as a result of lower international prices at the time of purchase. Ginners could not give a firm offer for seed cotton. As a consequence, the farm gate price dropped from USX 800 announced in August to 450 in November 2008 (CDO, 2009). Subsequently, the government intervened with a price support of USX 150 per kg of seed cotton raising the farm gate price from USX 450 to USX 600 per Kg of cotton. Recently in 2010/11, the FOB price of cotton lint more than doubled compared to previous year5 (from USD 1.59 to USD 3.8 per kg of lint). Consequently, actual producers’ price was about 44 percent above the indicative price (Figure 5) with the international price peak was transmitted at producer level.
5 Price in 2011 increased because of the world production decreased between 08 and 10 following the 08 crisis; demand from China increased; shocks affecting the production in major producer countries (Australia and Pakistan) and export restriction policies in India.
11

3. METHODOLOGY MAFAP methodology seeks to measure price incentives for producers and other marketing agents in key agricultural value chains. The analysis is based on the comparison between observed domestic prices and constructed reference prices. Reference prices are calculated from the international price of the product at the country’s border, where the product enters the country (if imported) or exits the country (if exported). This price is considered the benchmark price free of influence from domestic policies and markets. MAFAP estimates two types of reference prices – observed and adjusted. Observed reference prices are those that producers and other marketing agents could receive if the effects of distortions from domestic market and trade policies, as well as overall market performance, were removed. Adjusted reference prices are the same as observed reference prices, but also exclude the effects of any additional distortions from domestic exchange rate policies, structural inefficiencies in the commodity’s value chain, and imperfect functioning and non-competitive pricing in international markets.
MAFAP’s price incentives analysis is based on the law of one price, which is the economic theory that there is only one prevailing price for each product in a perfectly competitive market. This law only applies in the case of homogeneous goods, if information is correct and free, and if transaction costs are zero. Thus, this analysis was conducted for goods that are either perfectly homogeneous or perfect substitutes in the local market in terms of quality, or, failing that, are simply comparable goods. Indicators calculated from reference and domestic prices will, therefore, reveal whether domestic prices represent support (incentives) or a tax (disincentives) to various agents in the value chain.
Domestic prices are compared to reference prices at two specific locations along commodity value chains – the farm gate (usually the main production area for the product) and the point of competition (usually the main wholesale market where the domestic product competes with the internationally traded product). The approach for comparing prices at each location is summarized below, using an imported commodity as an example. In this situation, the country is importing a commodity that arrives in the port at the benchmark price (usually the unit value CIF price at the port of entry). In the domestic market, we observe the price of the same commodity at the point of competition, which is in this case the wholesale market, and at the farm gate. We also have information on observed access costs, which are all the costs associated with bringing the commodity to market, such as costs for processing, storage, handling, transport and the different margins applied by marketing agents in the value chain. These include access costs between the border and wholesale, as well as between the farm gate and wholesale.
The benchmark price is made comparable to the domestic price at wholesale by adding the access costs between the border and wholesale, resulting in the observed reference price at wholesale. This takes into account all the costs incurred by importers and other agents to bring the commodity to market, which in effect, raises the price of the commodity. The reference price at wholesale is further made comparable to the domestic price at the farm gate by deducting the access costs between the farm gate and wholesale, resulting in the observed reference price at farm gate. This takes into account all the costs incurred by farmers and other agents to bring the commodity from the farm to the wholesale market. Mathematically, the equations for calculating the observed
13
reference prices at wholesale (𝑅𝑅𝑅𝑅𝑜𝑜𝑜𝑜ℎ) and farm gate �𝑅𝑅𝑅𝑅𝑜𝑜𝑜𝑜𝑜𝑜� for an imported commodity are as follows:
𝑅𝑅𝑅𝑅𝑜𝑜𝑜𝑜ℎ = 𝑅𝑅𝑏𝑏 + 𝐴𝐴𝐴𝐴𝑜𝑜𝑜𝑜ℎ
𝑅𝑅𝑅𝑅𝑜𝑜𝑜𝑜𝑜𝑜 = 𝑅𝑅𝑅𝑅𝑜𝑜𝑜𝑜ℎ − 𝐴𝐴𝐴𝐴𝑜𝑜𝑜𝑜𝑜𝑜
where 𝐴𝐴𝐴𝐴𝑜𝑜𝑜𝑜ℎ are the observed access costs from the border to wholesale, including handling costs at the border, transport costs from the border to the wholesale market, profit margins and all observed taxes and levies, except tariffs, and 𝑅𝑅𝑏𝑏 is the benchmark price. 𝐴𝐴𝐴𝐴𝑜𝑜𝑜𝑜𝑜𝑜 are the observed access costs from the farm gate to wholesale, including handling costs at the farm, transport costs from farm to wholesale market, processing, profit margins and all observed taxes and levies.
The same steps described above can be taken a second time using benchmark prices and access costs that have been adjusted to eliminate market distortions due to exchange rate misalignments, structural inefficiencies in the commodity’s value chain 6 and imperfect functioning and non-competitive pricing in international markets, where possible and relevant. The adjusted benchmark prices and access costs are then used to generate a second set of adjusted reference prices, in addition to the first set of observed reference prices calculated.
For exported commodities, a slightly different approach is used. In this case, the border is generally considered the point of competition (wholesale), and the unit value FOB price for the commodity is normally taken as the benchmark price. Furthermore, observed and adjusted reference prices at wholesale are obtained by subtracting, rather than adding, the access costs between the border and wholesale. Mathematically, the equations for calculating the observed reference prices at wholesale (𝑅𝑅𝑅𝑅𝑜𝑜𝑜𝑜ℎ) and farm gate �𝑅𝑅𝑅𝑅𝑜𝑜𝑜𝑜𝑜𝑜� for an exported commodity are as follows:
𝑅𝑅𝑅𝑅𝑜𝑜𝑜𝑜ℎ = 𝑅𝑅𝑏𝑏 − 𝐴𝐴𝐴𝐴𝑜𝑜𝑜𝑜ℎ
𝑅𝑅𝑅𝑅𝑜𝑜𝑜𝑜𝑜𝑜 = 𝑅𝑅𝑅𝑅𝑜𝑜𝑜𝑜ℎ − 𝐴𝐴𝐴𝐴𝑜𝑜𝑜𝑜𝑜𝑜
After observed and adjusted reference prices are calculated for the commodity, they are subtracted from the domestic prices at each point in the value chain to obtain the observed and adjusted price gaps at wholesale and farm gate. Observed price gaps capture the effect of distortions from trade and market policies directly influencing the price of the commodity in domestic markets (e.g. price ceilings and tariffs), as well as overall market performance. Adjusted price gaps capture the same as the observed, in addition to the effect of any distortions from domestic exchange rate policies, structural inefficiencies in the commodity’s value chain, and imperfect functioning and non-competitive pricing in international markets. Mathematically, the equations for calculating the observed price gaps at wholesale (𝑅𝑅𝑃𝑃𝑜𝑜𝑜𝑜ℎ) and farm gate �𝑅𝑅𝑃𝑃𝑜𝑜𝑜𝑜𝑜𝑜� are as follows:
𝑅𝑅𝑃𝑃𝑜𝑜𝑜𝑜ℎ = 𝑅𝑅𝑜𝑜ℎ − 𝑅𝑅𝑅𝑅𝑜𝑜𝑜𝑜ℎ
𝑅𝑅𝑃𝑃𝑜𝑜𝑜𝑜𝑜𝑜 = 𝑅𝑅𝑜𝑜𝑜𝑜 − 𝑅𝑅𝑅𝑅𝑜𝑜𝑜𝑜𝑜𝑜
6 Structural inefficiencies in commodity value chains may include government taxes and fees (excluding fees for services), high transportation and processing costs, multiple intermediaries, excessive profit margins captured by various marketing agents and bribes and other non-tariff barriers.
14
where 𝑅𝑅𝑜𝑜𝑜𝑜 is the domestic price at farm gate, 𝑅𝑅𝑅𝑅𝑜𝑜𝑜𝑜𝑜𝑜 is the observed reference price at farm gate, 𝑅𝑅𝑜𝑜ℎ is the domestic price at wholesale, and 𝑅𝑅𝑅𝑅𝑜𝑜𝑜𝑜ℎ is the observed reference price at wholesale.
A positive price gap, resulting when the domestic price exceeds the reference price, means that the policy environment and market functioning as a whole generate incentives (support) to producers or wholesalers. For an imported commodity this could be due to distortions such as the existence of an import tariff. On the other hand, if the reference price exceeds the domestic price, resulting in a negative price gap, this means that the policy environment and market functioning as a whole generate disincentives (taxes) to producers or wholesalers. For an imported commodity this could be due to distortions such as a price ceiling established by the government to keep domestic prices low.
In general, price gaps provide an absolute measure of the market price incentives (or disincentives) that producers and wholesalers face. Therefore, price gaps at wholesale and farm gate are divided by their corresponding reference price and expressed as a ratio, referred to as the Nominal Rate of Protection (NRP), which can be compared between years, commodities, and countries.
The Observed Nominal Rates of Protection at the farm gate (𝑁𝑁𝑅𝑅𝑅𝑅𝑜𝑜𝑜𝑜𝑜𝑜) and wholesale (𝑁𝑁𝑅𝑅𝑅𝑅𝑜𝑜𝑜𝑜ℎ) are defined by the following equations:
𝑁𝑁𝑅𝑅𝑅𝑅𝑜𝑜𝑜𝑜𝑜𝑜 =𝑅𝑅𝑃𝑃𝑜𝑜𝑜𝑜𝑜𝑜𝑅𝑅𝑅𝑅𝑜𝑜𝑜𝑜𝑜𝑜
; 𝑁𝑁𝑅𝑅𝑅𝑅𝑜𝑜𝑜𝑜ℎ =𝑅𝑅𝑃𝑃𝑜𝑜𝑜𝑜ℎ𝑅𝑅𝑅𝑅𝑜𝑜𝑜𝑜ℎ
where 𝑅𝑅𝑃𝑃𝑜𝑜𝑜𝑜𝑜𝑜 is the observed price gap at farm gate, 𝑅𝑅𝑅𝑅𝑜𝑜𝑜𝑜𝑜𝑜 is the observed reference price at the farm gate, 𝑅𝑅𝑃𝑃𝑜𝑜𝑜𝑜ℎis the observed price gap at wholesale and 𝑅𝑅𝑅𝑅𝑜𝑜𝑜𝑜ℎ is the observed reference price at wholesale.
Similarly, the Adjusted Nominal Rates of Protection at the farm gate (𝑁𝑁𝑅𝑅𝑅𝑅𝑎𝑎𝑜𝑜𝑜𝑜) and wholesale (𝑁𝑁𝑅𝑅𝑅𝑅𝑎𝑎𝑜𝑜ℎ) are defined by the following equations:
𝑁𝑁𝑅𝑅𝑅𝑅𝑎𝑎𝑜𝑜𝑜𝑜 =𝑅𝑅𝑃𝑃𝑎𝑎𝑜𝑜𝑜𝑜𝑅𝑅𝑅𝑅𝑎𝑎𝑜𝑜𝑜𝑜
; 𝑁𝑁𝑅𝑅𝑅𝑅𝑎𝑎𝑜𝑜ℎ =𝑅𝑅𝑃𝑃𝑎𝑎𝑜𝑜ℎ𝑅𝑅𝑅𝑅𝑎𝑎𝑜𝑜ℎ
where 𝑅𝑅𝑃𝑃𝑎𝑎𝑜𝑜𝑜𝑜 is the adjusted price gap at farm gate, 𝑅𝑅𝑅𝑅𝑎𝑎𝑜𝑜𝑜𝑜 is the adjusted reference price at the farm gate, 𝑅𝑅𝑃𝑃𝑎𝑎𝑜𝑜ℎis the adjusted price gap at wholesale and 𝑅𝑅𝑅𝑅𝑎𝑎𝑜𝑜ℎ is the adjusted reference price at wholesale.
If public expenditure allocated to the commodity is added to the price gap at farm gate when calculating the ratios, the Nominal Rate of Assistance (NRA) is generated. This indicator summarizes the incentives (or disincentives) due to policies, market performance and public expenditure. Mathematically, the Nominal Rate of Assistance is defined by the following equation:
𝑁𝑁𝑅𝑅𝐴𝐴 =𝑅𝑅𝑃𝑃𝑎𝑎𝑜𝑜𝑜𝑜 + 𝑅𝑅𝑃𝑃𝑐𝑐𝑐𝑐𝑐𝑐
𝑅𝑅𝑅𝑅𝑎𝑎𝑜𝑜𝑜𝑜
where PEcsp is commodity-specific public expenditure that has been identified and measured as monetary units per tonne.
Finally, MAFAP methodology estimates the Market Development Gap (MDG), which is the portion of the price gap that can be attributed to “excessive” or inefficient access costs within a given value
15
chain, exchange rate misalignments, and imperfect functioning of international markets. “Excessive” access costs may result from factors such as poor infrastructure, high processing costs due to obsolete technology, government taxes and fees (excluding fees for services), high profit margins captured by various marketing agents, bribes and other non-tariff barriers. Therefore, the total MDG at farm gate is comprised of three components – gaps due to “excessive” access costs, the exchange rate policy gap and the international market gap. When added together, these components are equivalent to the difference between the observed and adjusted price gaps at farm gate.
Similar to the price gaps calculated, the MDG is an absolute measure, which is also expressed as a ratio to allow for comparison between years, commodities, and countries. This relative indicator of the total MDG affecting farmers is derived by calculating the ratio between the total MDG at farm gate and the adjusted reference price at farm gate as follows:
𝑀𝑀𝑀𝑀𝑃𝑃𝑜𝑜𝑜𝑜 = (𝐴𝐴𝐴𝐴𝐴𝐴𝑤𝑤ℎ+𝐴𝐴𝐴𝐴𝐴𝐴𝑓𝑓𝑓𝑓+𝐸𝐸𝐸𝐸𝐸𝐸𝐴𝐴+𝐼𝐼𝐼𝐼𝐴𝐴)𝑅𝑅𝐸𝐸𝑎𝑎𝑓𝑓𝑓𝑓
where ACGwh is the access cost gap at wholesale defined as the difference between observed and adjusted access costs at wholesale, ACGfg is the access cost gap at farm gate defined as the difference between observed and adjusted access costs at the farm gate, ERPG is the exchange rate policy gap, and IMG is the international market gap.
A more detailed description of the methodology applied in this analysis is available on MAFAP’s website at www.fao.org/in-action/mafap.
16

4. DATA REQUIREMENTS AND CALCULATION OF INDICATORS To calculate MAFAP’s price incentives indicators, several types of data are needed. This section presents the data that was obtained and methodological decisions that were taken in this analysis.
TRADE STATUS OF THE PRODUCT Most of the cotton lint produced in Uganda is for export market with a net positive trade balance (Figure 6). However, less than 10 per cent of cotton seed is exported. As a whole, Uganda is considered as a net exporter of cotton products, namely cotton lint and cotton seed.
Figure 6: Trade balance of cotton lint in Uganda (2005-2013)
Sources: UBoS (2006), UBoS (2011) and UBoS (2014)
MARKET PATHWAY ANALYSED The market pathway of cotton in this analysis covers the period of 2005-2013 and is based on the value chain mapping presented in Figure 4. While seed cotton, produced and marketed by small-holder farmers in Uganda, is non-traded internationally, its main products, cotton lint and cotton seed, are traded internationally. As such, cotton is analyzed on the basis of seed cotton sold at the farm gate in all producing areas processed into the composite products of lint and seed at ginning. Seed cotton flows from the farm gate to ginneries for processing by separating the lint from the seed and then sold mainly free on truck (FOT) to the exporting company at the ginnery at Tororo. Seed is then sold at the domestic market or exported. These need to be taken into account in deciding the benchmark and domestic prices as will be explained below. The analysis covers the period of 2005-2013.
BENCHMARK PRICES Observed
For calculating a reference price to determine whether cotton producers receive market incentives or disincentives, we need to establish a benchmark price, which represents the price (or equivalent value) of seed cotton free of domestic policy and market distortions in the world market. Since Uganda is a net exporter of both cotton lint and seed during the period of analysis (2005-2013), the relevant benchmark price of seed cotton is the weighted average of the FOB prices of lint and seed using the retention rate (outturn factor) of each as weights. This methodology is adopted since the commodity analyzed is seed cotton which is not traded but the products derived from it (lint and
average: 21,152
0
5000
10000
15000
20000
25000
30000
35000
40000
45000
50000
2005 2006 2007 2008 2009 2010 2011 2012 2013
Trad
e ba
lanc
e (T
onne
s)
17
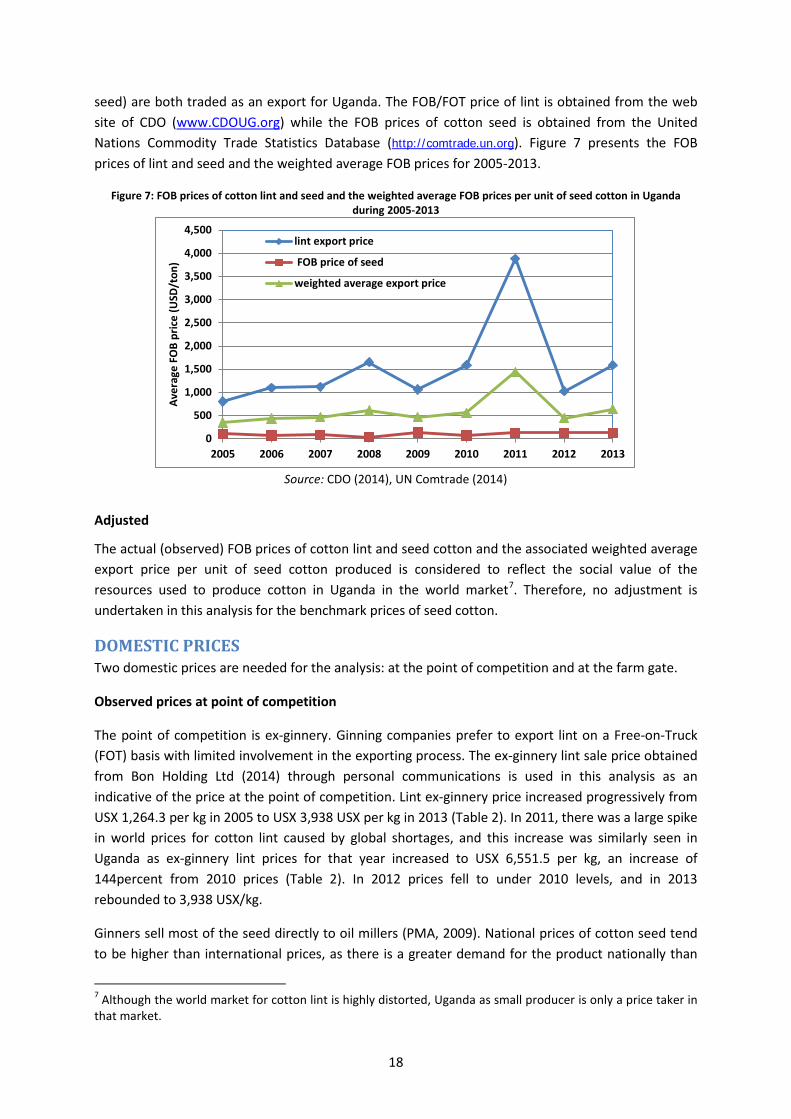
seed) are both traded as an export for Uganda. The FOB/FOT price of lint is obtained from the web site of CDO (www.CDOUG.org) while the FOB prices of cotton seed is obtained from the United Nations Commodity Trade Statistics Database (http://comtrade.un.org). Figure 7 presents the FOB prices of lint and seed and the weighted average FOB prices for 2005-2013.
Figure 7: FOB prices of cotton lint and seed and the weighted average FOB prices per unit of seed cotton in Uganda during 2005-2013
Source: CDO (2014), UN Comtrade (2014)
Adjusted
The actual (observed) FOB prices of cotton lint and seed cotton and the associated weighted average export price per unit of seed cotton produced is considered to reflect the social value of the resources used to produce cotton in Uganda in the world market7. Therefore, no adjustment is undertaken in this analysis for the benchmark prices of seed cotton.
DOMESTIC PRICES Two domestic prices are needed for the analysis: at the point of competition and at the farm gate.
Observed prices at point of competition
The point of competition is ex-ginnery. Ginning companies prefer to export lint on a Free-on-Truck (FOT) basis with limited involvement in the exporting process. The ex-ginnery lint sale price obtained from Bon Holding Ltd (2014) through personal communications is used in this analysis as an indicative of the price at the point of competition. Lint ex-ginnery price increased progressively from USX 1,264.3 per kg in 2005 to USX 3,938 USX per kg in 2013 (Table 2). In 2011, there was a large spike in world prices for cotton lint caused by global shortages, and this increase was similarly seen in Uganda as ex-ginnery lint prices for that year increased to USX 6,551.5 per kg, an increase of 144percent from 2010 prices (Table 2). In 2012 prices fell to under 2010 levels, and in 2013 rebounded to 3,938 USX/kg.
Ginners sell most of the seed directly to oil millers (PMA, 2009). National prices of cotton seed tend to be higher than international prices, as there is a greater demand for the product nationally than
7 Although the world market for cotton lint is highly distorted, Uganda as small producer is only a price taker in that market.
0
500
1,000
1,500
2,000
2,500
3,000
3,500
4,000
4,500
2005 2006 2007 2008 2009 2010 2011 2012 2013
Aver
age
FOB
pric
e (U
SD/t
on)
lint export price
FOB price of seed
weighted average export price
18
internationally. The ex-ginnery price of seed is available from CDO web site. Seed prices are relatively low compared to lint and from 2005 – 2013 ranged from USX 110 per kg in 2005 to USX 500 per kg in 2011 and 2012 (Table 2). The average price during these years was USX 331 per kg.
The equivalent price of seed cotton at the point of competition is thus calculated as the weighted average of the prices of these two products using the outturn factor. The average outturn ratio for lint from 2005 – 2013, computed from production data, was .351, with a low in 2010 of 0.323 and a high in 2007 of 0.3615. Table 2 presents the prices of cotton products at the point of competition and the calculation of the equivalent price of seed cotton at the point of competition.
Observed prices at farm gate
Although an indicative price of seed cotton at the farm level is announced at the beginning of the season, these prices may represent a price ceiling for producers in most of the years (Figure 5). In this analysis, the producers’ price of seed cotton is assumed to be the actual prices received by cotton growers as reported by CDO (2014). Table 2 presents actual producer prices of seed cotton.
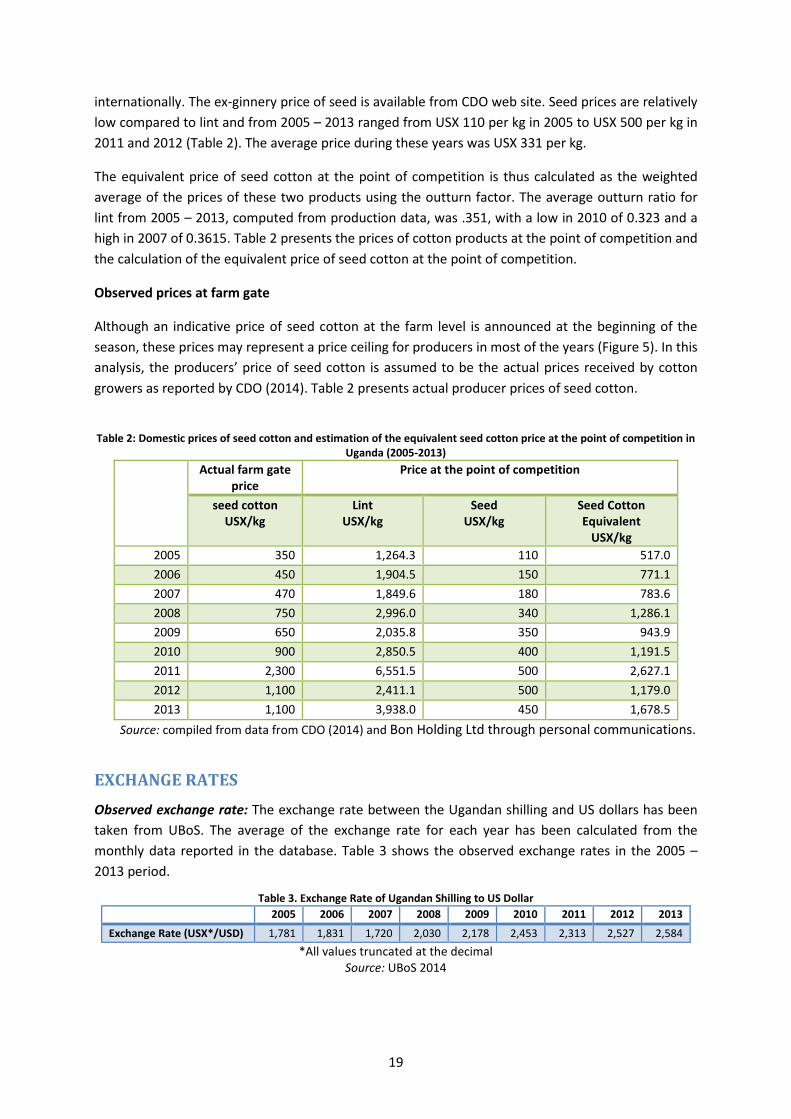
Table 2: Domestic prices of seed cotton and estimation of the equivalent seed cotton price at the point of competition in
Uganda (2005-2013) Actual farm gate
price Price at the point of competition
seed cotton USX/kg
Lint USX/kg
Seed USX/kg
Seed Cotton Equivalent
USX/kg
2005 350 1,264.3 110 517.0 2006 450 1,904.5 150 771.1 2007 470 1,849.6 180 783.6 2008 750 2,996.0 340 1,286.1 2009 650 2,035.8 350 943.9 2010 900 2,850.5 400 1,191.5 2011 2,300 6,551.5 500 2,627.1 2012 1,100 2,411.1 500 1,179.0 2013 1,100 3,938.0 450 1,678.5
Source: compiled from data from CDO (2014) and Bon Holding Ltd through personal communications.
EXCHANGE RATES Observed exchange rate: The exchange rate between the Ugandan shilling and US dollars has been taken from UBoS. The average of the exchange rate for each year has been calculated from the monthly data reported in the database. Table 3 shows the observed exchange rates in the 2005 – 2013 period.
Table 3. Exchange Rate of Ugandan Shilling to US Dollar 2005 2006 2007 2008 2009 2010 2011 2012 2013
Exchange Rate (USX*/USD) 1,781 1,831 1,720 2,030 2,178 2,453 2,313 2,527 2,584 *All values truncated at the decimal
Source: UBoS 2014
19
Adjusted exchange rate:
Since Uganda is adopting free market foreign currency market, real (equilibrium) exchange rate is assumed to be equal to the observed exchange rate. For the years considered, this assumption is close to reality as exchange rate misalignment is likely to be minimal since the foreign exchange market in Uganda has been fairly liberal.
ACCESS COSTS Observed access costs
Access costs between farm gate and wholesale market and between the wholesale market and the country’s border are needed to compute the observed reference prices at these respective points along the value chain.
Border to point of competition
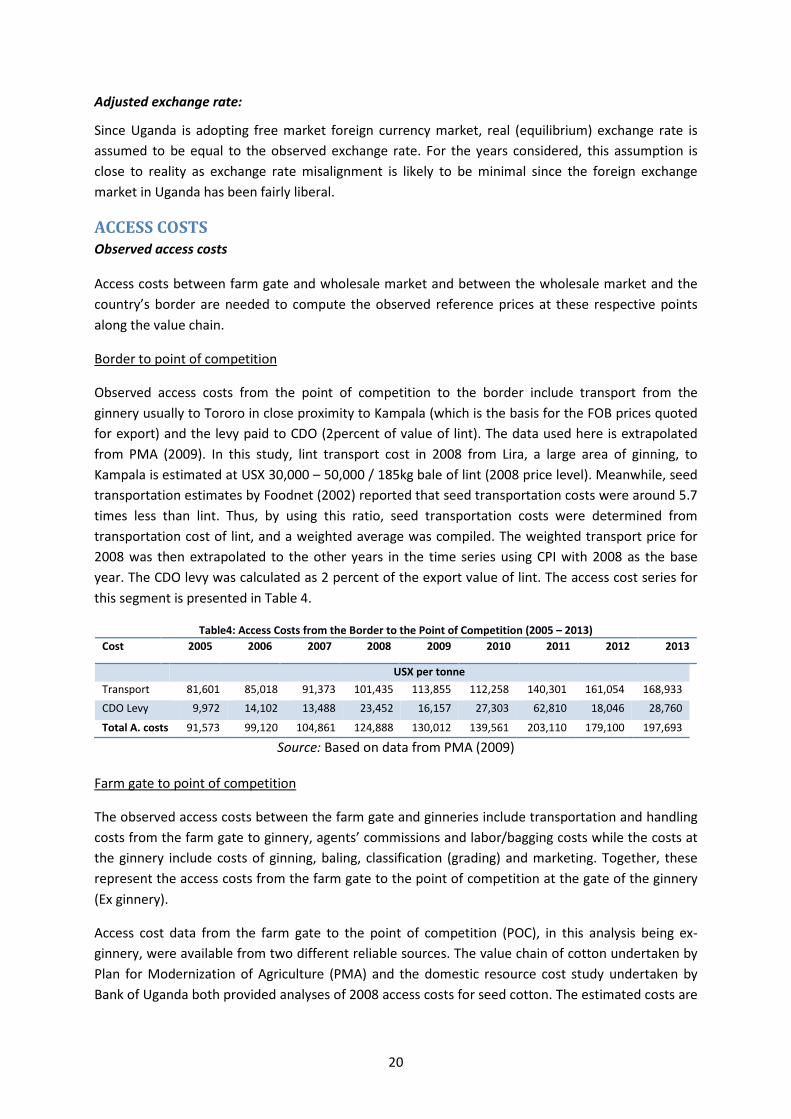
Observed access costs from the point of competition to the border include transport from the ginnery usually to Tororo in close proximity to Kampala (which is the basis for the FOB prices quoted for export) and the levy paid to CDO (2percent of value of lint). The data used here is extrapolated from PMA (2009). In this study, lint transport cost in 2008 from Lira, a large area of ginning, to Kampala is estimated at USX 30,000 – 50,000 / 185kg bale of lint (2008 price level). Meanwhile, seed transportation estimates by Foodnet (2002) reported that seed transportation costs were around 5.7 times less than lint. Thus, by using this ratio, seed transportation costs were determined from transportation cost of lint, and a weighted average was compiled. The weighted transport price for 2008 was then extrapolated to the other years in the time series using CPI with 2008 as the base year. The CDO levy was calculated as 2 percent of the export value of lint. The access cost series for this segment is presented in Table 4.
Table4: Access Costs from the Border to the Point of Competition (2005 – 2013) Cost 2005 2006 2007 2008 2009 2010 2011 2012 2013
USX per tonne Transport 81,601 85,018 91,373 101,435 113,855 112,258 140,301 161,054 168,933 CDO Levy 9,972 14,102 13,488 23,452 16,157 27,303 62,810 18,046 28,760
Total A. costs 91,573 99,120 104,861 124,888 130,012 139,561 203,110 179,100 197,693
Source: Based on data from PMA (2009)
Farm gate to point of competition
The observed access costs between the farm gate and ginneries include transportation and handling costs from the farm gate to ginnery, agents’ commissions and labor/bagging costs while the costs at the ginnery include costs of ginning, baling, classification (grading) and marketing. Together, these represent the access costs from the farm gate to the point of competition at the gate of the ginnery (Ex ginnery).
Access cost data from the farm gate to the point of competition (POC), in this analysis being ex-ginnery, were available from two different reliable sources. The value chain of cotton undertaken by Plan for Modernization of Agriculture (PMA) and the domestic resource cost study undertaken by Bank of Uganda both provided analyses of 2008 access costs for seed cotton. The estimated costs are
20
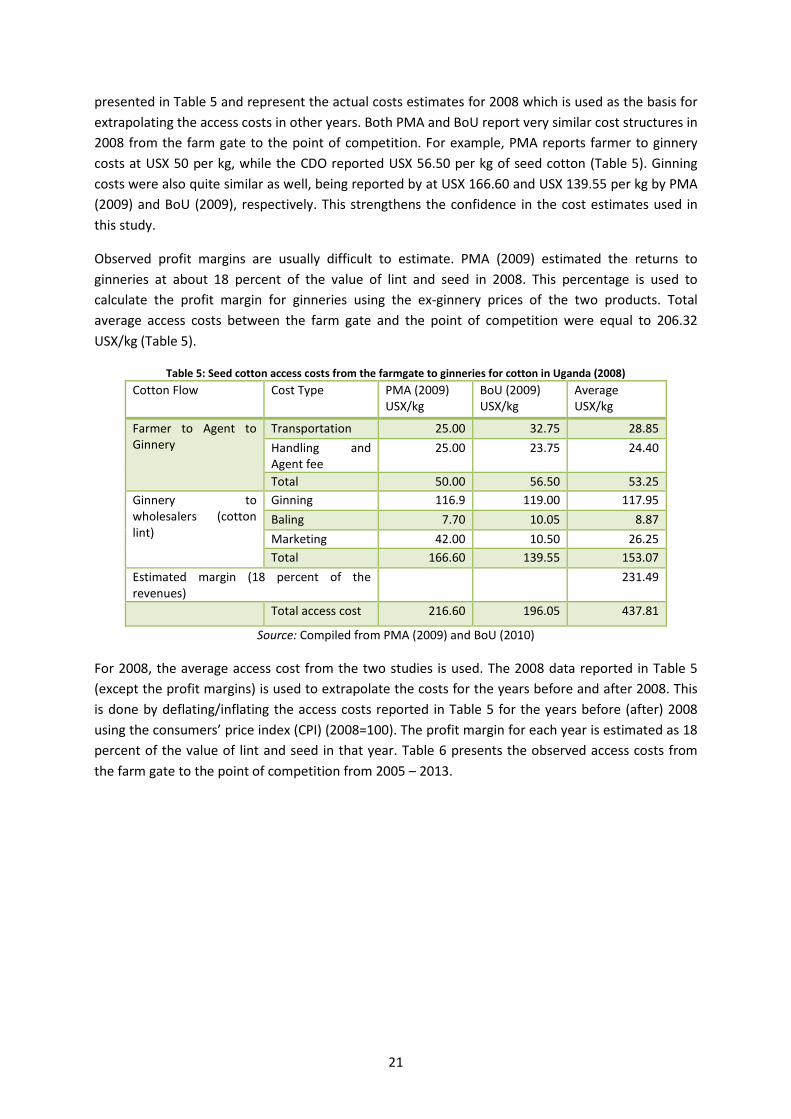
presented in Table 5 and represent the actual costs estimates for 2008 which is used as the basis for extrapolating the access costs in other years. Both PMA and BoU report very similar cost structures in 2008 from the farm gate to the point of competition. For example, PMA reports farmer to ginnery costs at USX 50 per kg, while the CDO reported USX 56.50 per kg of seed cotton (Table 5). Ginning costs were also quite similar as well, being reported by at USX 166.60 and USX 139.55 per kg by PMA (2009) and BoU (2009), respectively. This strengthens the confidence in the cost estimates used in this study.
Observed profit margins are usually difficult to estimate. PMA (2009) estimated the returns to ginneries at about 18 percent of the value of lint and seed in 2008. This percentage is used to calculate the profit margin for ginneries using the ex-ginnery prices of the two products. Total average access costs between the farm gate and the point of competition were equal to 206.32 USX/kg (Table 5).
Table 5: Seed cotton access costs from the farmgate to ginneries for cotton in Uganda (2008) Cotton Flow Cost Type PMA (2009)
USX/kg BoU (2009) USX/kg
Average USX/kg
Farmer to Agent to Ginnery
Transportation 25.00 32.75 28.85 Handling and Agent fee
25.00 23.75 24.40
Total 50.00 56.50 53.25 Ginnery to wholesalers (cotton lint)
Ginning 116.9 119.00 117.95 Baling 7.70 10.05 8.87 Marketing 42.00 10.50 26.25 Total 166.60 139.55 153.07
Estimated margin (18 percent of the revenues)
231.49
Total access cost 216.60 196.05 437.81
Source: Compiled from PMA (2009) and BoU (2010)
For 2008, the average access cost from the two studies is used. The 2008 data reported in Table 5 (except the profit margins) is used to extrapolate the costs for the years before and after 2008. This is done by deflating/inflating the access costs reported in Table 5 for the years before (after) 2008 using the consumers’ price index (CPI) (2008=100). The profit margin for each year is estimated as 18 percent of the value of lint and seed in that year. Table 6 presents the observed access costs from the farm gate to the point of competition from 2005 – 2013.
21
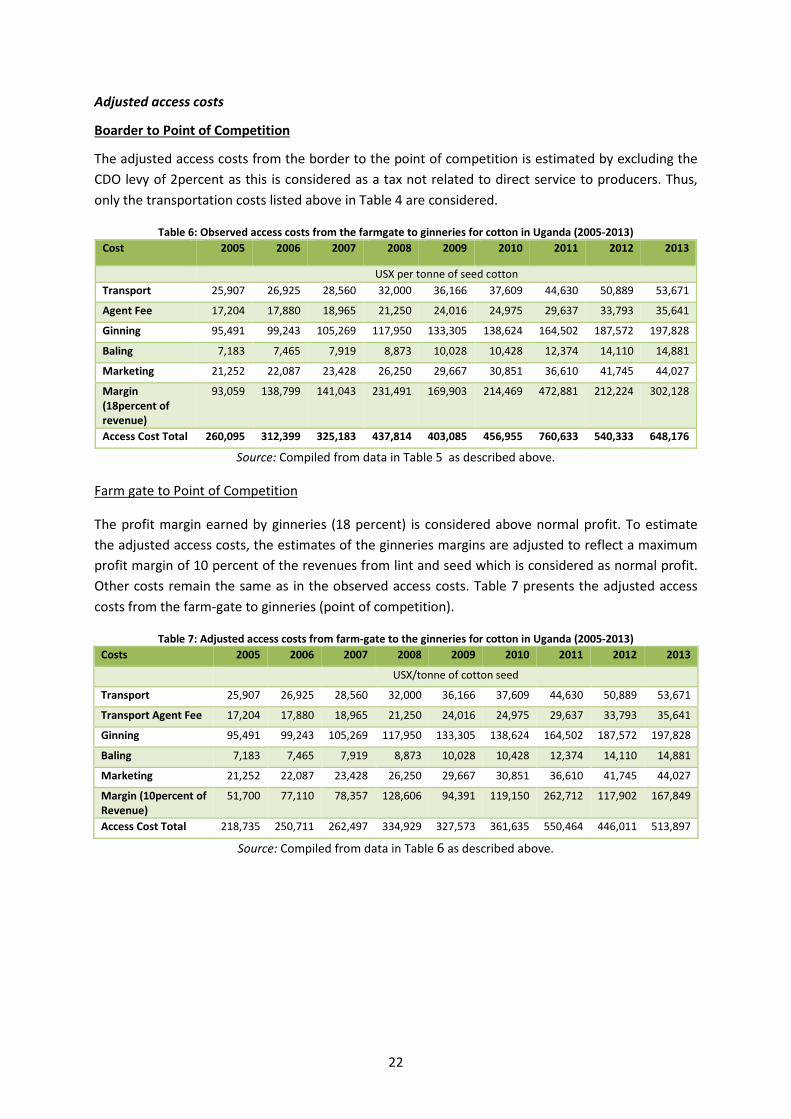
Adjusted access costs
Boarder to Point of Competition
The adjusted access costs from the border to the point of competition is estimated by excluding the CDO levy of 2percent as this is considered as a tax not related to direct service to producers. Thus, only the transportation costs listed above in Table 4 are considered.
Table 6: Observed access costs from the farmgate to ginneries for cotton in Uganda (2005-2013) Cost 2005 2006 2007 2008 2009 2010 2011 2012 2013
USX per tonne of seed cotton Transport 25,907 26,925 28,560 32,000 36,166 37,609 44,630 50,889 53,671
Agent Fee 17,204 17,880 18,965 21,250 24,016 24,975 29,637 33,793 35,641
Ginning 95,491 99,243 105,269 117,950 133,305 138,624 164,502 187,572 197,828
Baling 7,183 7,465 7,919 8,873 10,028 10,428 12,374 14,110 14,881
Marketing 21,252 22,087 23,428 26,250 29,667 30,851 36,610 41,745 44,027
Margin (18percent of revenue)
93,059 138,799 141,043 231,491 169,903 214,469 472,881 212,224 302,128
Access Cost Total 260,095 312,399 325,183 437,814 403,085 456,955 760,633 540,333 648,176
Source: Compiled from data in Table 5 as described above.
Farm gate to Point of Competition
The profit margin earned by ginneries (18 percent) is considered above normal profit. To estimate the adjusted access costs, the estimates of the ginneries margins are adjusted to reflect a maximum profit margin of 10 percent of the revenues from lint and seed which is considered as normal profit. Other costs remain the same as in the observed access costs. Table 7 presents the adjusted access costs from the farm-gate to ginneries (point of competition).
Table 7: Adjusted access costs from farm-gate to the ginneries for cotton in Uganda (2005-2013) Costs 2005 2006 2007 2008 2009 2010 2011 2012 2013
USX/tonne of cotton seed
Transport 25,907 26,925 28,560 32,000 36,166 37,609 44,630 50,889 53,671
Transport Agent Fee 17,204 17,880 18,965 21,250 24,016 24,975 29,637 33,793 35,641
Ginning 95,491 99,243 105,269 117,950 133,305 138,624 164,502 187,572 197,828
Baling 7,183 7,465 7,919 8,873 10,028 10,428 12,374 14,110 14,881
Marketing 21,252 22,087 23,428 26,250 29,667 30,851 36,610 41,745 44,027
Margin (10percent of Revenue)
51,700 77,110 78,357 128,606 94,391 119,150 262,712 117,902 167,849
Access Cost Total 218,735 250,711 262,497 334,929 327,573 361,635 550,464 446,011 513,897
Source: Compiled from data in Table 6 as described above.
22
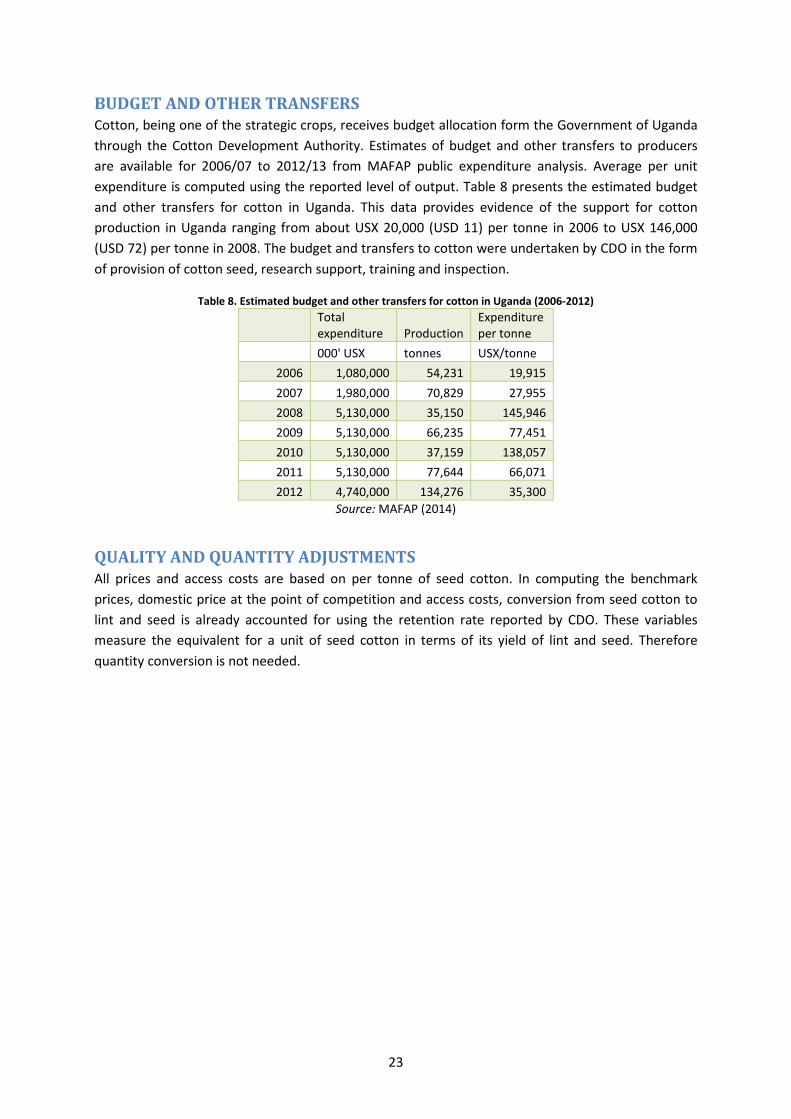
BUDGET AND OTHER TRANSFERS Cotton, being one of the strategic crops, receives budget allocation form the Government of Uganda through the Cotton Development Authority. Estimates of budget and other transfers to producers are available for 2006/07 to 2012/13 from MAFAP public expenditure analysis. Average per unit expenditure is computed using the reported level of output. Table 8 presents the estimated budget and other transfers for cotton in Uganda. This data provides evidence of the support for cotton production in Uganda ranging from about USX 20,000 (USD 11) per tonne in 2006 to USX 146,000 (USD 72) per tonne in 2008. The budget and transfers to cotton were undertaken by CDO in the form of provision of cotton seed, research support, training and inspection.
Table 8. Estimated budget and other transfers for cotton in Uganda (2006-2012)
Total expenditure Production
Expenditure per tonne
000' USX tonnes USX/tonne
2006 1,080,000 54,231 19,915 2007 1,980,000 70,829 27,955 2008 5,130,000 35,150 145,946 2009 5,130,000 66,235 77,451 2010 5,130,000 37,159 138,057 2011 5,130,000 77,644 66,071 2012 4,740,000 134,276 35,300
Source: MAFAP (2014)
QUALITY AND QUANTITY ADJUSTMENTS All prices and access costs are based on per tonne of seed cotton. In computing the benchmark prices, domestic price at the point of competition and access costs, conversion from seed cotton to lint and seed is already accounted for using the retention rate reported by CDO. These variables measure the equivalent for a unit of seed cotton in terms of its yield of lint and seed. Therefore quantity conversion is not needed.
23
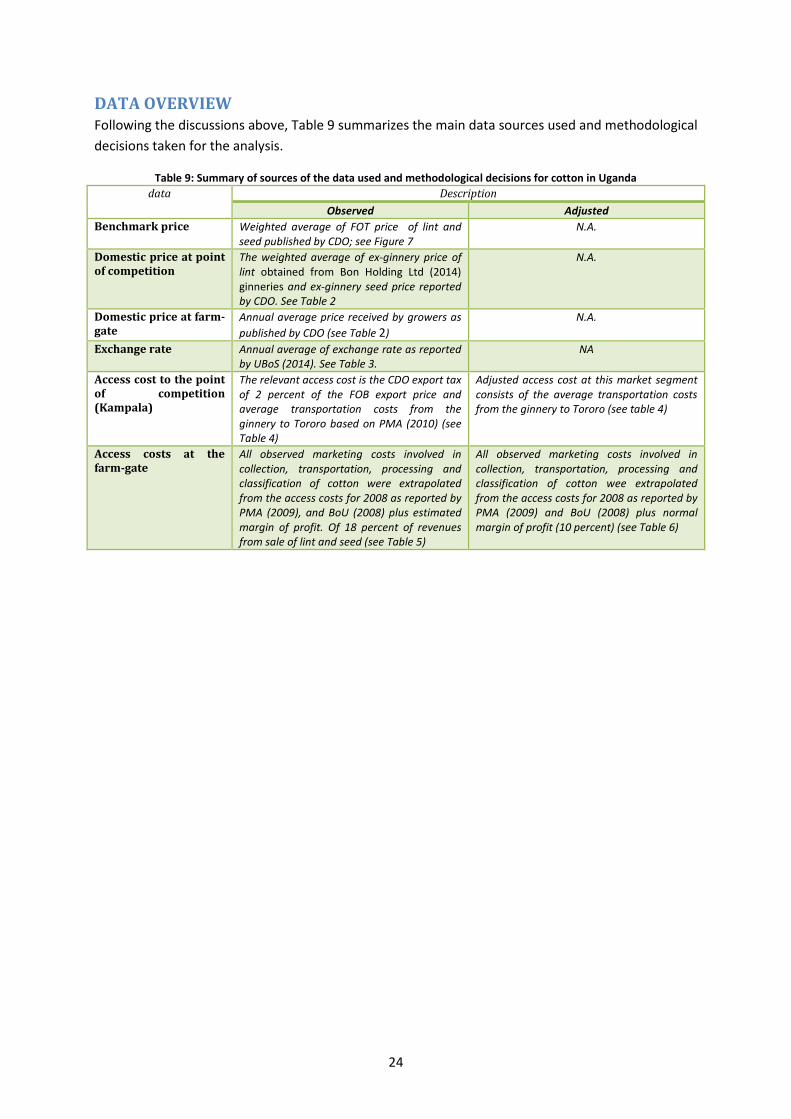
DATA OVERVIEW Following the discussions above, Table 9 summarizes the main data sources used and methodological decisions taken for the analysis.
Table 9: Summary of sources of the data used and methodological decisions for cotton in Uganda data Description
Observed Adjusted Benchmark price Weighted average of FOT price of lint and
seed published by CDO; see Figure 7 N.A.
Domestic price at point of competition
The weighted average of ex-ginnery price of lint obtained from Bon Holding Ltd (2014) ginneries and ex-ginnery seed price reported by CDO. See Table 2
N.A.
Domestic price at farm-gate
Annual average price received by growers as published by CDO (see Table 2)
N.A.
Exchange rate Annual average of exchange rate as reported by UBoS (2014). See Table 3.
NA
Access cost to the point of competition (Kampala)
The relevant access cost is the CDO export tax of 2 percent of the FOB export price and average transportation costs from the ginnery to Tororo based on PMA (2010) (see Table 4)
Adjusted access cost at this market segment consists of the average transportation costs from the ginnery to Tororo (see table 4)
Access costs at the farm-gate
All observed marketing costs involved in collection, transportation, processing and classification of cotton were extrapolated from the access costs for 2008 as reported by PMA (2009), and BoU (2008) plus estimated margin of profit. Of 18 percent of revenues from sale of lint and seed (see Table 5)
All observed marketing costs involved in collection, transportation, processing and classification of cotton wee extrapolated from the access costs for 2008 as reported by PMA (2009) and BoU (2008) plus normal margin of profit (10 percent) (see Table 6)
24
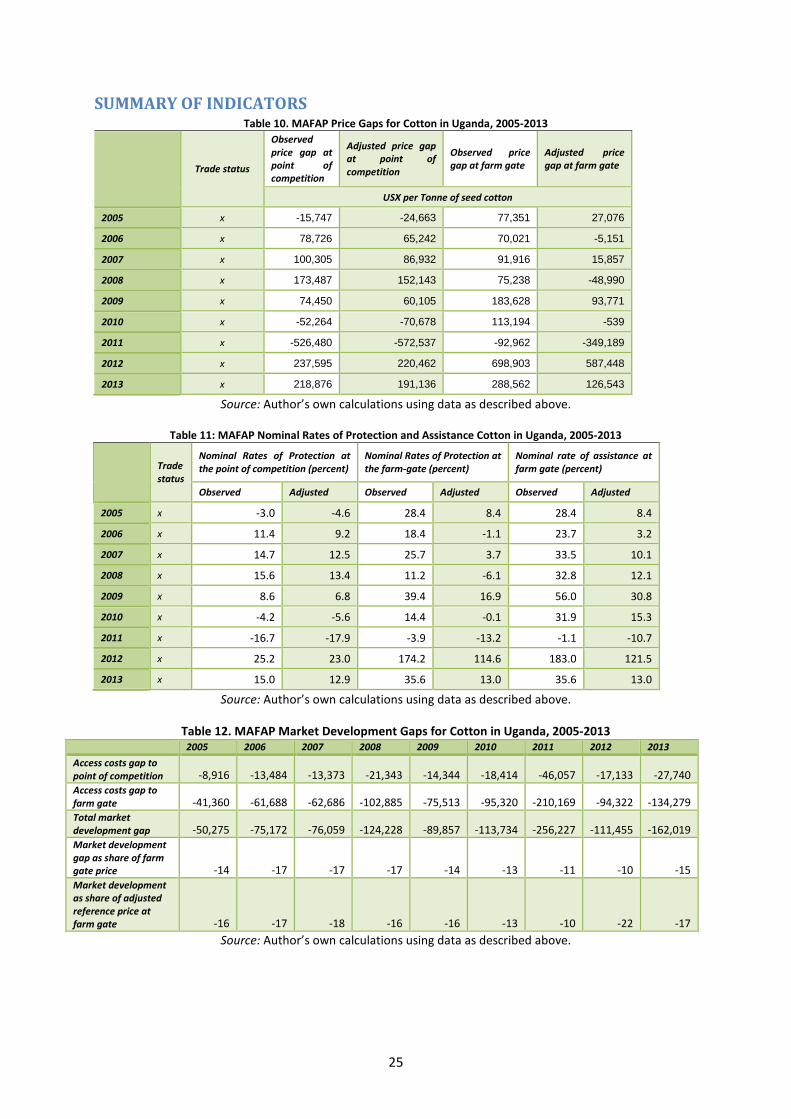
SUMMARY OF INDICATORS Table 10. MAFAP Price Gaps for Cotton in Uganda, 2005-2013
Trade status
Observed price gap at point of competition
Adjusted price gap at point of competition
Observed price gap at farm gate
Adjusted price gap at farm gate
USX per Tonne of seed cotton
2005 x -15,747 -24,663 77,351 27,076
2006 x 78,726 65,242 70,021 -5,151
2007 x 100,305 86,932 91,916 15,857
2008 x 173,487 152,143 75,238 -48,990
2009 x 74,450 60,105 183,628 93,771
2010 x -52,264 -70,678 113,194 -539
2011 x -526,480 -572,537 -92,962 -349,189
2012 x 237,595 220,462 698,903 587,448
2013 x 218,876 191,136 288,562 126,543
Source: Author’s own calculations using data as described above.
Table 11: MAFAP Nominal Rates of Protection and Assistance Cotton in Uganda, 2005-2013
Trade status
Nominal Rates of Protection at the point of competition (percent)
Nominal Rates of Protection at the farm-gate (percent)
Nominal rate of assistance at farm gate (percent)
Observed Adjusted Observed Adjusted Observed Adjusted
2005 x -3.0 -4.6 28.4 8.4 28.4 8.4
2006 x 11.4 9.2 18.4 -1.1 23.7 3.2
2007 x 14.7 12.5 25.7 3.7 33.5 10.1
2008 x 15.6 13.4 11.2 -6.1 32.8 12.1
2009 x 8.6 6.8 39.4 16.9 56.0 30.8
2010 x -4.2 -5.6 14.4 -0.1 31.9 15.3
2011 x -16.7 -17.9 -3.9 -13.2 -1.1 -10.7
2012 x 25.2 23.0 174.2 114.6 183.0 121.5
2013 x 15.0 12.9 35.6 13.0 35.6 13.0
Source: Author’s own calculations using data as described above.
Table 12. MAFAP Market Development Gaps for Cotton in Uganda, 2005-2013 2005 2006 2007 2008 2009 2010 2011 2012 2013 Access costs gap to point of competition -8,916 -13,484 -13,373 -21,343 -14,344 -18,414 -46,057 -17,133 -27,740 Access costs gap to farm gate -41,360 -61,688 -62,686 -102,885 -75,513 -95,320 -210,169 -94,322 -134,279 Total market development gap -50,275 -75,172 -76,059 -124,228 -89,857 -113,734 -256,227 -111,455 -162,019 Market development gap as share of farm gate price -14 -17 -17 -17 -14 -13 -11 -10 -15 Market development as share of adjusted reference price at farm gate -16 -17 -18 -16 -16 -13 -10 -22 -17
Source: Author’s own calculations using data as described above.
25

5. RESULTS AND INTERPRETATION Point of competition indicators
As other export commodities of Uganda, cotton export is subject to export promotion measures that aim at providing incentives to increase and diversify exports. Under these policies, cotton exports are not subject to any export tax except the levy paid to CDO. Besides, the foreign exchange regime is fully liberalized and exporters are entitled to retain 100 percent of their foreign exchange earnings accruing from their export transactions. Accordingly, exporters can exchange their export earnings at the market exchange rate.
Thus for cotton in Uganda, the export promotion measures eliminate all major factors causing deviation of cotton prices at the point of competition from its reference prices (except the CDO tax on lint exports). Consequently, the observed price gap at the point of competition are relatively small (Table 10) and positive in most of the years. However, the export of cotton lint is still subject to the tax paid to CDO which amounts to 2 percent of the value of lint. This tax increases the price gap slightly.
The nominal rate of protection at the point of competition follows the same trend as those of the price gap. The observed nominal rate of protection was negative in 2005 and 2010-2011 and positive in other years while the adjusted nominal rate of protection was negative only in 2005 and 2011 (Figure 8). However, the magnitude of both indicators is relatively small except in 2011 (Table 10 and 11). Clearly, the liberalized trade and export policies of Uganda are providing a measurable support to ginneries by eliminating any form of direct or indirect taxation that may lead to price disincentives at the point of competition. In absence of other factors influencing the domestic cotton market performance and, hence, the domestic price, the indicators would be close to zero. However, the estimated indicators at the point of competition deviate substantially from their expected value.
The deviation of the indicators at the Ex-ginnery is the due to the domestic demand for seed price and the short-term volatility of the world prices of lint. Due to the relatively high domestic demand for cotton seed, the domestic price of seed most often is much higher than its border price which explains the relatively high level of domestic utilization of seed. This raises the revenues for the ginneries relative to the reference prices since most of their sales are domestic. This results in positive price gaps and, consequently, nominal rates of protection in most years. The exception to this was the lower domestic price of seed in 2005 compared to its corresponding border price (Figure 9) resulting in slightly negative indicators. Moreover, although the domestic seed price is relatively stable, the variability of the export prices explains most of the variability of the estimated indicators over time.
The small negative deviation of the estimated indicators at the point of competition in 2010 and the modest deviation of the indicators in 2011 are due to the low price of lint received at the ex-ginnery. The ginning company normally receive lint price of 4 – 12 percent (8 percent on average) lower than the export price to cover the transportation cost to Tororo. However, the reported ex-ginnery prices in 2010 and 2011 were 37 percent lower than the export prices (Figure 9). This might have been due to quality issues and/or timing of sale by the ginnery. As a result, the domestic prices at the point of
27
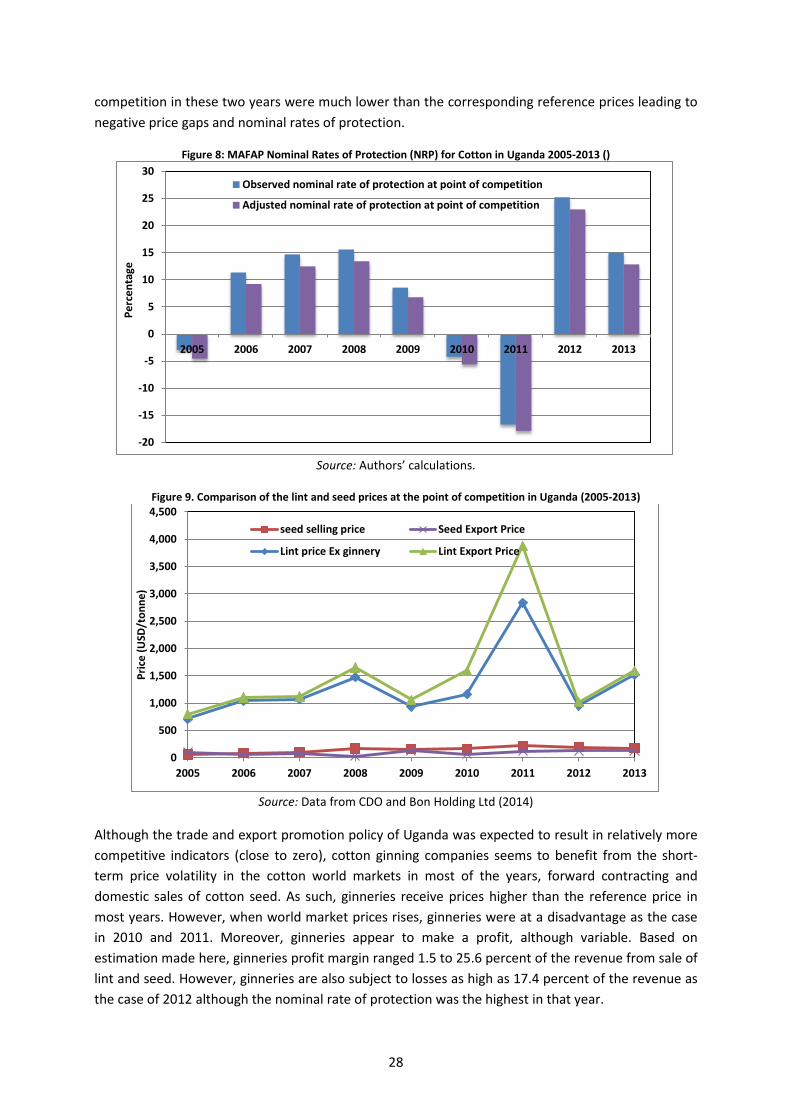
competition in these two years were much lower than the corresponding reference prices leading to negative price gaps and nominal rates of protection.
Figure 8: MAFAP Nominal Rates of Protection (NRP) for Cotton in Uganda 2005-2013 ()
Source: Authors’ calculations.
Figure 9. Comparison of the lint and seed prices at the point of competition in Uganda (2005-2013)
Source: Data from CDO and Bon Holding Ltd (2014)
Although the trade and export promotion policy of Uganda was expected to result in relatively more competitive indicators (close to zero), cotton ginning companies seems to benefit from the short-term price volatility in the cotton world markets in most of the years, forward contracting and domestic sales of cotton seed. As such, ginneries receive prices higher than the reference price in most years. However, when world market prices rises, ginneries were at a disadvantage as the case in 2010 and 2011. Moreover, ginneries appear to make a profit, although variable. Based on estimation made here, ginneries profit margin ranged 1.5 to 25.6 percent of the revenue from sale of lint and seed. However, ginneries are also subject to losses as high as 17.4 percent of the revenue as the case of 2012 although the nominal rate of protection was the highest in that year.
-20
-15
-10
-5
0
5
10
15
20
25
30
2005 2006 2007 2008 2009 2010 2011 2012 2013
Perc
enta
ge
Observed nominal rate of protection at point of competition
Adjusted nominal rate of protection at point of competition
0
500
1,000
1,500
2,000
2,500
3,000
3,500
4,000
4,500
2005 2006 2007 2008 2009 2010 2011 2012 2013
Pric
e (U
SD/t
onne
)
seed selling price Seed Export Price
Lint price Ex ginnery Lint Export Price
28

As Table 11 indicates, the adjusted indicators at the ex-ginnery level are much lower than the observed indicators due to the difference between the actual higher profit margin of the ginneries (18 percent of the revenue on average) and what can be considered as normal profit of 10 percent.
Farm-gate indicators
The indicators at the farm-gate can be interpreted as price incentives to cotton producers. The observed price gap and the nominal rate of protection were only negative but small in 2011 estimated at USX 92,962 per tonne (Table 10). This represents only 3.9 percent of the reference price at the farm-gate, as the nominal rate of protection may suggest (Table 11). This disincentive was realized during the year with the highest export price of lint and farm-gate price since 2005. In 2011, actual price of seed cotton paid to farmers were 44 percent above the indicative price announced earlier due to the lucrative prices of lint in the world market8. In other words, the producers did not capture their share of the international price in that year. This may be due to the fact that the sale of seed cotton takes place several months earlier before exports. During the time, lint price may change. However, this level of disincentive for the particular year seems to be insignificant compare to the incentives received in other years.
The observed price gaps are generally and modest in other years except 2012 when the price gap exceeded USX 698,900 (USD 276) per tonne (Table 10). Equivalently, the observed nominal rate of protection exceeded 174 percent (Table 11). This surge of indicators was caused by the decline of the lint export prices by about USD 1,000 of its level of 2011. As the Cot Look A just before cotton harvest is the major factor in determining the indicative prices paid to producers for seed cotton, it seems that the producer price of seed cotton was based on an earlier much higher price than the realized export price later in the year.
With the exception of the estimated indicators in the aforementioned years, the observed price incentive indicators are moderate. For instance, the observed nominal rate of protection ranged from 11.2 percent to 39.4 percent in 2009. The high observed nominal rate of protection in 2009 was driven by the government subsidy advance to cotton farmers with the decline in world lint price, as explained above. Without that subsidy, the observed nominal rate of protection in 2009 would have dropped to about 15 percent.
Unlike the observed, the adjusted nominal rate of protection at the farm gate is quite variable (Figure 10). This indicator was negative almost zero in 2006 and 2010 and moderately negative in 2011 while it is positive and quite high in 2011 and positive and relatively small in the other years. The difference between the observed and adjusted indicators is explained by the levy paid to CDO and the profit margin for ginning companies. Although the levy paid to CDO is charged on the lint exports, ginning companies may transmit the burden of such levy to producers through the indicative or actual producer price. Based PMA (2009) estimates of cost and revenue in 2008, ginneries may generate a profit about 18 percent of the revenue. This seems to be excessive compared to the interest of credit in Uganda of 15-24 percent per year given that cotton season spans less than a full year. Factoring in the CDO levy and the excess profit margin reduces the price incentive indicators substantially as reflected in the adjusted price gap (Table 10) and the adjusted nominal rate of protection at the farm-gate (Figure 10).
8 The lint export price increased from USD 900 in 2010 to USD 1,600 per tonne in 2011 (Figure 7).
29
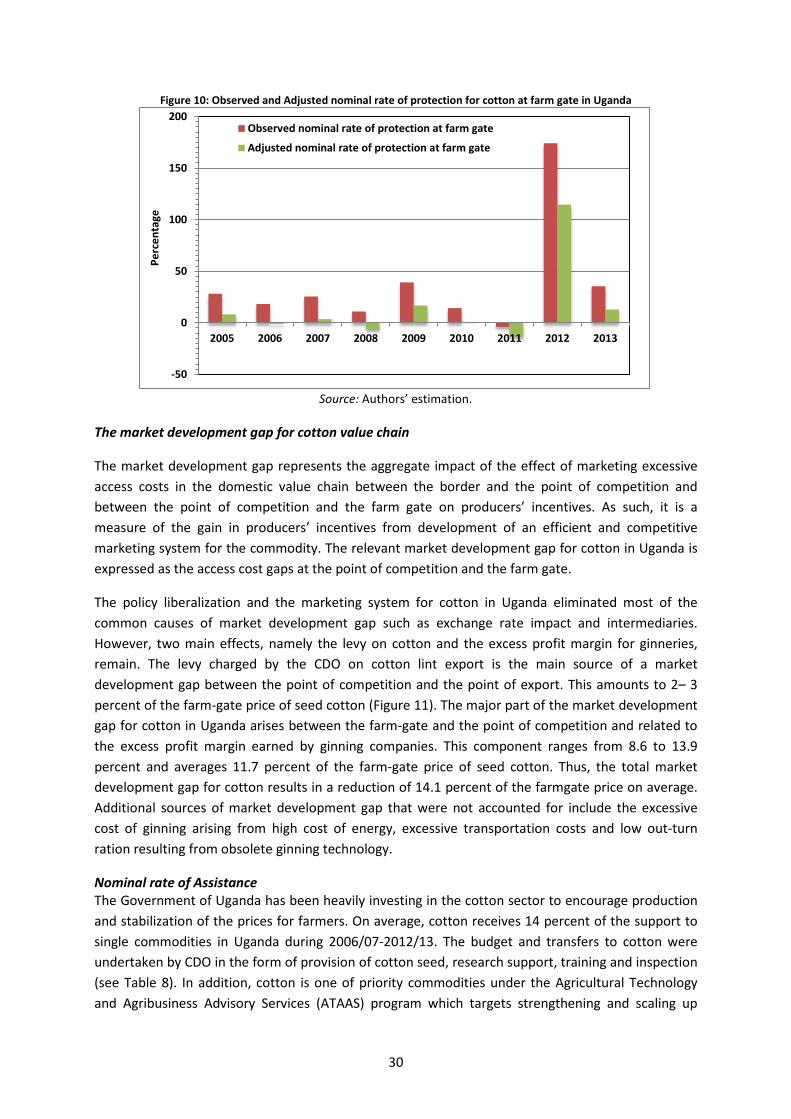
Figure 10: Observed and Adjusted nominal rate of protection for cotton at farm gate in Uganda
Source: Authors’ estimation.
The market development gap for cotton value chain
The market development gap represents the aggregate impact of the effect of marketing excessive access costs in the domestic value chain between the border and the point of competition and between the point of competition and the farm gate on producers’ incentives. As such, it is a measure of the gain in producers’ incentives from development of an efficient and competitive marketing system for the commodity. The relevant market development gap for cotton in Uganda is expressed as the access cost gaps at the point of competition and the farm gate.
The policy liberalization and the marketing system for cotton in Uganda eliminated most of the common causes of market development gap such as exchange rate impact and intermediaries. However, two main effects, namely the levy on cotton and the excess profit margin for ginneries, remain. The levy charged by the CDO on cotton lint export is the main source of a market development gap between the point of competition and the point of export. This amounts to 2– 3 percent of the farm-gate price of seed cotton (Figure 11). The major part of the market development gap for cotton in Uganda arises between the farm-gate and the point of competition and related to the excess profit margin earned by ginning companies. This component ranges from 8.6 to 13.9 percent and averages 11.7 percent of the farm-gate price of seed cotton. Thus, the total market development gap for cotton results in a reduction of 14.1 percent of the farmgate price on average. Additional sources of market development gap that were not accounted for include the excessive cost of ginning arising from high cost of energy, excessive transportation costs and low out-turn ration resulting from obsolete ginning technology.
Nominal rate of Assistance The Government of Uganda has been heavily investing in the cotton sector to encourage production and stabilization of the prices for farmers. On average, cotton receives 14 percent of the support to single commodities in Uganda during 2006/07-2012/13. The budget and transfers to cotton were undertaken by CDO in the form of provision of cotton seed, research support, training and inspection (see Table 8). In addition, cotton is one of priority commodities under the Agricultural Technology and Agribusiness Advisory Services (ATAAS) program which targets strengthening and scaling up
-50
0
50
100
150
200
2005 2006 2007 2008 2009 2010 2011 2012 2013
Perc
enta
ge
Observed nominal rate of protection at farm gate
Adjusted nominal rate of protection at farm gate
30
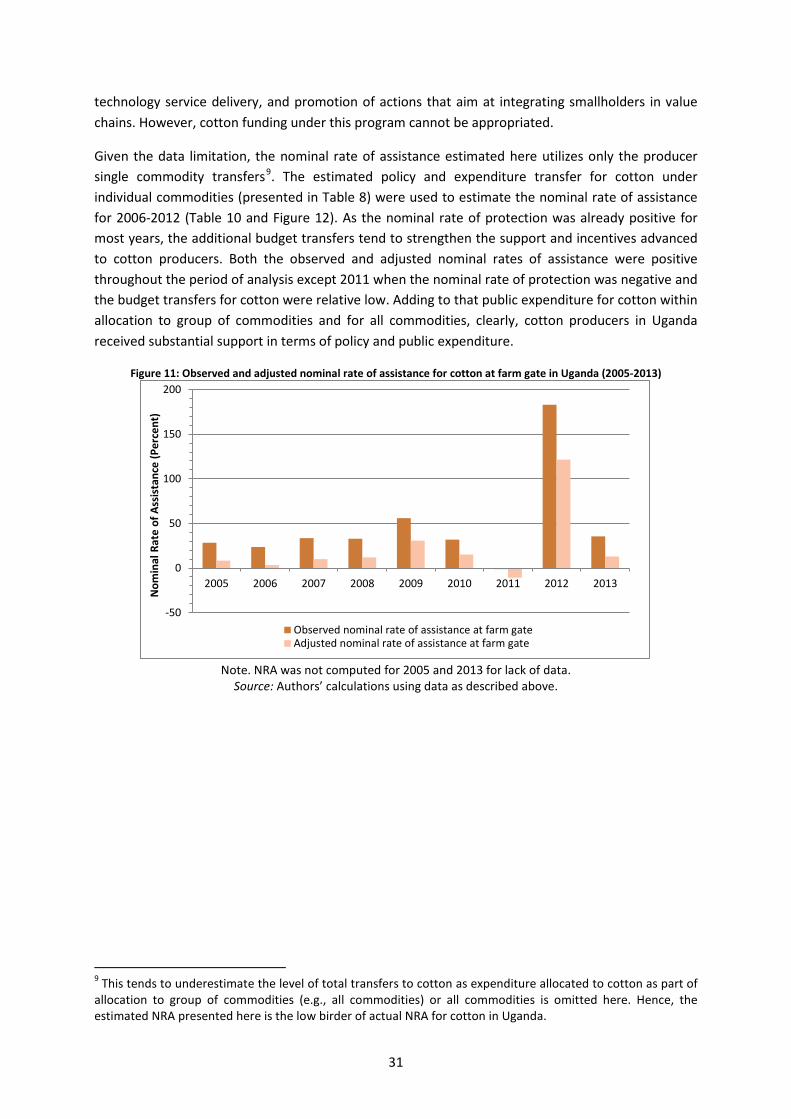
technology service delivery, and promotion of actions that aim at integrating smallholders in value chains. However, cotton funding under this program cannot be appropriated.
Given the data limitation, the nominal rate of assistance estimated here utilizes only the producer single commodity transfers9. The estimated policy and expenditure transfer for cotton under individual commodities (presented in Table 8) were used to estimate the nominal rate of assistance for 2006-2012 (Table 10 and Figure 12). As the nominal rate of protection was already positive for most years, the additional budget transfers tend to strengthen the support and incentives advanced to cotton producers. Both the observed and adjusted nominal rates of assistance were positive throughout the period of analysis except 2011 when the nominal rate of protection was negative and the budget transfers for cotton were relative low. Adding to that public expenditure for cotton within allocation to group of commodities and for all commodities, clearly, cotton producers in Uganda received substantial support in terms of policy and public expenditure.
Figure 11: Observed and adjusted nominal rate of assistance for cotton at farm gate in Uganda (2005-2013)
Note. NRA was not computed for 2005 and 2013 for lack of data.
Source: Authors’ calculations using data as described above.
9 This tends to underestimate the level of total transfers to cotton as expenditure allocated to cotton as part of allocation to group of commodities (e.g., all commodities) or all commodities is omitted here. Hence, the estimated NRA presented here is the low birder of actual NRA for cotton in Uganda.
-50
0
50
100
150
200
2005 2006 2007 2008 2009 2010 2011 2012 2013
Nom
inal
Rat
e of
Ass
ista
nce
(Per
cent
)
Observed nominal rate of assistance at farm gateAdjusted nominal rate of assistance at farm gate
31

6. CONCLUSIONS The above analysis reveals that cotton producers in Uganda were receiving substantial support from several sources including pricing policy and budget transfers, despite the inefficiencies revealed by the presence of a significant market development gap. For instance, the export promotion and liberalization policies and cotton pricing policies should allow for reasonable transmission of world price to producers. Any price gap between the indicative price and the world price is met by ginners (PMA, 2009) except in exceptional cases as that of 2008/09 season.
Despite the generally positive price incentives and support to producers, the cotton sector appears to face many challenges including production and processing constraints. National production is highly variable over time and yields were low and variable despite the recent improvement. Farmers in most of the cotton growing areas in Uganda have abandoned the crop to other enterprises with higher profitability and are less labor intensive (Shinyekwa, et al., 2014). Cotton harvest area has declined significantly since 2000 despite the increased and heavy public investment in the sector. The highly variable harvested area is attributed to the volatility and low cotton prices which greatly affect cotton profitability and the incentives to produce. With this decline in harvested area, the recent improvement in yields seems to be insufficient to increase and stabilize cotton output.
RECOMMENDATIONS Given the above discussion, the analysis suggests that the price incentives failed to overcome the constraints facing the cotton sector. Therefore, the causes of the poor performance of the cotton sector is related to factors other than price disincentives caused by economic policies. Various reports have linked the chronic underperformance to low quality of cotton, lack of domestic textile industry, and low use of purchased capital inputs due to lack of rural credit as the key constraints (Baffes (2009); Baffes (2010)). The lagging performance is occurring against the background that Uganda has taken all the proper policy reforms and investment actions. Baffes (2009) argues that the fundamental problem of Uganda‘s cotton sector is its low profitability which is directly related to crop yields, output prices and inversely related to the cost of production. The cost of production, in turn, is a function of the purchase price of inputs and level of output obtained.
Technological change led by scientific research is a key to address low cotton yields. The issue of crop yields and productivity can be addressed through the use of high-quality seed of high-yielding cotton varieties combined with the use of purchased inputs, specifically inorganic fertilizer. However, this requires revitalizing the seed sector, provision of credit to producers and access to inputs for farmers. Increased investment in transportation infra-structure to lower not only the cost of input in rural areas but also to increase the producer prices of output produced.
A major part of the profitability of cotton is related to cotton prices. Since cotton is priced based on prevailing world market prices of lint, producer prices of cotton in Uganda are likely to be influenced by the world market volatility which may lead in some years to a producer price below break-even level. Moreover, the price variability is a major cause of supply fluctuation. Uganda, as small cotton producer and exporter, has little room to influence producer prices by influencing world market prices. We strongly suggest that the government maintaining its regulatory role and intervening only to support prices when they fall below the levels required for farmers to break even. There is need for a price stabilization fund to protect farmers from falling prices by topping up farm gate prices when they fall below a stipulated price floor. However, the Cotton Development Act as it stands
33
today is fairly comprehensive and leaves little room for this type of reforms. Hence, adoption of some of this proposal may require amendment of the cotton act. The analysis suggests that the indicative price be updated more frequently during the season to reduce the disincentives resulting from the ability of ginners to extract above normal profit.
MAIN MESSAGE The objective of the current cotton marketing system, administered by CDO, is to assist cotton growers in receiving higher share of world prices of lint. This has been achieved and evident in the high share of export price received by producers and the generally positive price incentive indicators estimated in this paper. The generally positive observed price gaps and nominal rates of protection suggests that the liberalization and export promotion policies adopted by Uganda generally provide respectable level of producer incentives as a guarantee that farmers receive at the minimum the equivalent of the world price for seed cotton. However, these policy-generated incentives cannot shield cotton producers against the volatility and low prices in the world markets.
Other interventions are required to increase cotton productivity and to improve its quality to improve the profitability of cotton enterprises including adoption of improved and high-yielding cotton cultivars combined with inorganic fertilizer. Without these interventions, the profitability of cotton will remain low and variable and may lead farmers eventually to abandon growing it as a result of low productivity and prices and high cost of production. To protect farmers from the frequent fall of prices in world market, some form of stabilization fund supported by levies on cotton sales may be considered.
LIMITATIONS Although CDO maintains excellent data sets on its web site, cotton prices at the point of competition are not published. The data used here is obtained from a single ginnery.
FURTHER INVESTIGATION AND RESEARCH Further analysis of profitability of cotton in Uganda and the impact of the indicative price on profitability may provide insights into the poor performance of the cotton sector in Uganda given that producers are often receive price incentives.
34
BIBLIOGRAPHY Baffes, John. 2009a. Comparative analysis of organization and performance of African cotton sectors: the
cotton sector of Uganda.
Baffes, John. 2009b. The ‘Full’ Potential of Uganda’s Cotton Industry. Development Policy Review. 27: 67-85.
Baffes, John. 2010. Markets for Cotton By-Products: Global Trends and Implications for African Cotton Producers. Policy Research Working Paper 5355. Development Prospects Group & Africa Region. World Bank.
Bank of Uganda (BoU). 2008. Report on the Domestic Resource Cost ratios for Selected Export Commodities- Survey June/July 2008. DRC/IAP Division. Bank of Uganda, Kampala, Uganda.
Bank of Uganda (BoU). 2011. Report on the Domestic Resource Cost ratios for Selected Export Commodities 2009/10. DRC/IAP Division. Bank of Uganda, Kampala, Uganda.
Bibangambah, Jossy Rwakishana (1995) ‘Marketing smallholder crops in Uganda. Kampala Uganda Fountain Publisher Ltd.
Carr, Stephen (1982) ‘’Impact of Government Intervention on smallholder development in North and East Uganda’’ Agrarian Development Unit Occasional paper 5, Wyn College University of London
Collier , P. 1997. Trade Policy Review of Uganda. The World Economy 20 (5):649-64.
Cotton Development Organisation (CDO). 2000. The Cotton Industry in Uganda. Production trends and earnings. www.cdo.org Accessed October 2014.
Cotton Development Organisation (CDO). 2007. Annual Report 2006/07. Kampala: CDO Cotton Development Organisation (CDO). 2008. Annual Report 2007/08 . Kampala: CDO.
Cotton Development Organisation (CDO). 2009. Annual Report 2008/09. Kampala: CDO.
Cotton Development Organisation (CDO). 2012. Production trends and earnings. www.cdo.org Accessed October 2014.
FAOSTAT. (2012). Various statistics. http://faostat.fao.org/?lang=en .
Foodnet. 2002. Transaction Cost Analysis Report. Prepared for Plan for Modernization of Agriculture by The Natural Resource Institute (NRI) and the International Institute for Tropical Agriculture (IITA).
Horna, D., K. Kyotalimye, and J. Falck-Zepeda. Cotton Production in Uganda: Would GM Technologies Be the Solution? Diss. IFRI, 2009. N.p.: IFRI, n.d. Print.
Ministry of Agriculture, Animal Industry and Fisheries (MAAIF). 2010. Statistical Abstract 2010. MAAIF. Entebbe, Uganda.
Ministry of Agriculture, Animal Industry and Fisheries (MAAIF). 2011. Statistical Abstract 2011. MAAIF. Entebbe, Uganda.
Plan for Modernization of Agriculture (PMA). 2009. Cotton Value Chain Study in Lango and Acholi Sub-regions. PMA Secretariat. MAAIF. Kampala.
Tsakok, I. 1990. Agricultural Price Policy: A Practitioner's Guide to Partial-Equilibrium Analysis. Cornell University Press. Ithaca. New York.
Uganda Bureau of Statistics (UBoS). 2014. Trade data. http://www.ubos.org/index.php?st=pagerelations&id=15&p=related%20pages:Macro-economic. Accessed September 2014.
USAID. 2005. Value Chain Analysis: Mapping maize, sunflower and cotton chains. Final Report. USAID Uganda.
35
World Bank. 1994. Uganda – Cotton Subsector Development Project. Staff Appraisal Report No 4150 UG. Washington DC.
36
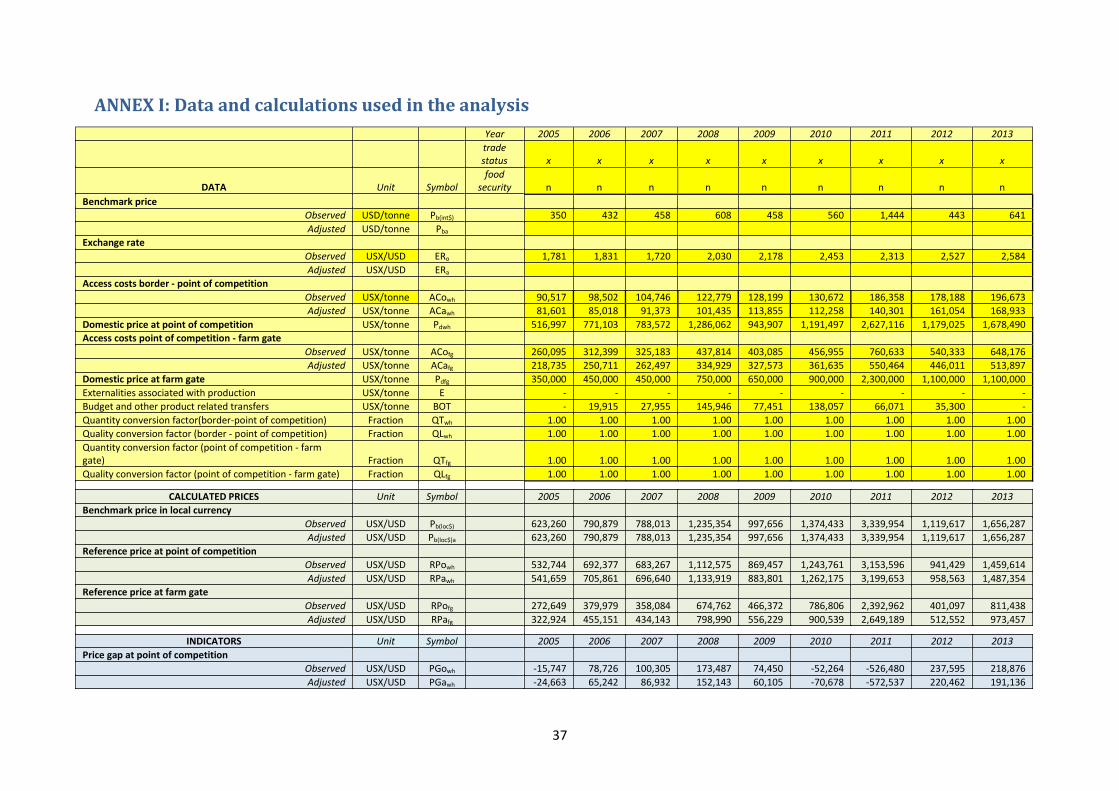
ANNEX I: Data and calculations used in the analysis Year 2005 2006 2007 2008 2009 2010 2011 2012 2013
trade status x x x x x x x x x
DATA Unit Symbol food
security n n n n n n n n n Benchmark price
Observed USD/tonne Pb(int$)
350 432 458 608 458 560 1,444 443 641 Adjusted USD/tonne Pba
Exchange rate Observed USX/USD ERo 1,781 1,831 1,720 2,030 2,178 2,453 2,313 2,527 2,584
Adjusted USX/USD ERa Access costs border - point of competition Observed USX/tonne ACowh 90,517 98,502 104,746 122,779 128,199 130,672 186,358 178,188 196,673
Adjusted USX/tonne ACawh 81,601 85,018 91,373 101,435 113,855 112,258 140,301 161,054 168,933 Domestic price at point of competition USX/tonne Pdwh 516,997 771,103 783,572 1,286,062 943,907 1,191,497 2,627,116 1,179,025 1,678,490 Access costs point of competition - farm gate
Observed USX/tonne ACofg 260,095 312,399 325,183 437,814 403,085 456,955 760,633 540,333 648,176 Adjusted USX/tonne ACafg
218,735 250,711 262,497 334,929 327,573 361,635 550,464 446,011 513,897
Domestic price at farm gate USX/tonne Pdfg 350,000 450,000 450,000 750,000 650,000 900,000 2,300,000 1,100,000 1,100,000 Externalities associated with production USX/tonne E - - - - - - - - - Budget and other product related transfers USX/tonne BOT
- 19,915 27,955 145,946 77,451 138,057 66,071 35,300 -
Quantity conversion factor(border-point of competition) Fraction QTwh 1.00 1.00 1.00 1.00 1.00 1.00 1.00 1.00 1.00 Quality conversion factor (border - point of competition) Fraction QLwh 1.00 1.00 1.00 1.00 1.00 1.00 1.00 1.00 1.00 Quantity conversion factor (point of competition - farm gate) Fraction QTfg 1.00 1.00 1.00 1.00 1.00 1.00 1.00 1.00 1.00 Quality conversion factor (point of competition - farm gate) Fraction QLfg 1.00 1.00 1.00 1.00 1.00 1.00 1.00 1.00 1.00
CALCULATED PRICES Unit Symbol 2005 2006 2007 2008 2009 2010 2011 2012 2013 Benchmark price in local currency
Observed USX/USD Pb(loc$) 623,260 790,879 788,013 1,235,354 997,656 1,374,433 3,339,954 1,119,617 1,656,287 Adjusted USX/USD Pb(loc$)a 623,260 790,879 788,013 1,235,354 997,656 1,374,433 3,339,954 1,119,617 1,656,287
Reference price at point of competition Observed USX/USD RPowh 532,744 692,377 683,267 1,112,575 869,457 1,243,761 3,153,596 941,429 1,459,614
Adjusted USX/USD RPawh 541,659 705,861 696,640 1,133,919 883,801 1,262,175 3,199,653 958,563 1,487,354 Reference price at farm gate
Observed USX/USD RPofg 272,649 379,979 358,084 674,762 466,372 786,806 2,392,962 401,097 811,438 Adjusted USX/USD RPafg 322,924 455,151 434,143 798,990 556,229 900,539 2,649,189 512,552 973,457
INDICATORS Unit Symbol 2005 2006 2007 2008 2009 2010 2011 2012 2013 Price gap at point of competition
Observed USX/USD PGowh -15,747 78,726 100,305 173,487 74,450 -52,264 -526,480 237,595 218,876 Adjusted USX/USD PGawh -24,663 65,242 86,932 152,143 60,105 -70,678 -572,537 220,462 191,136
37
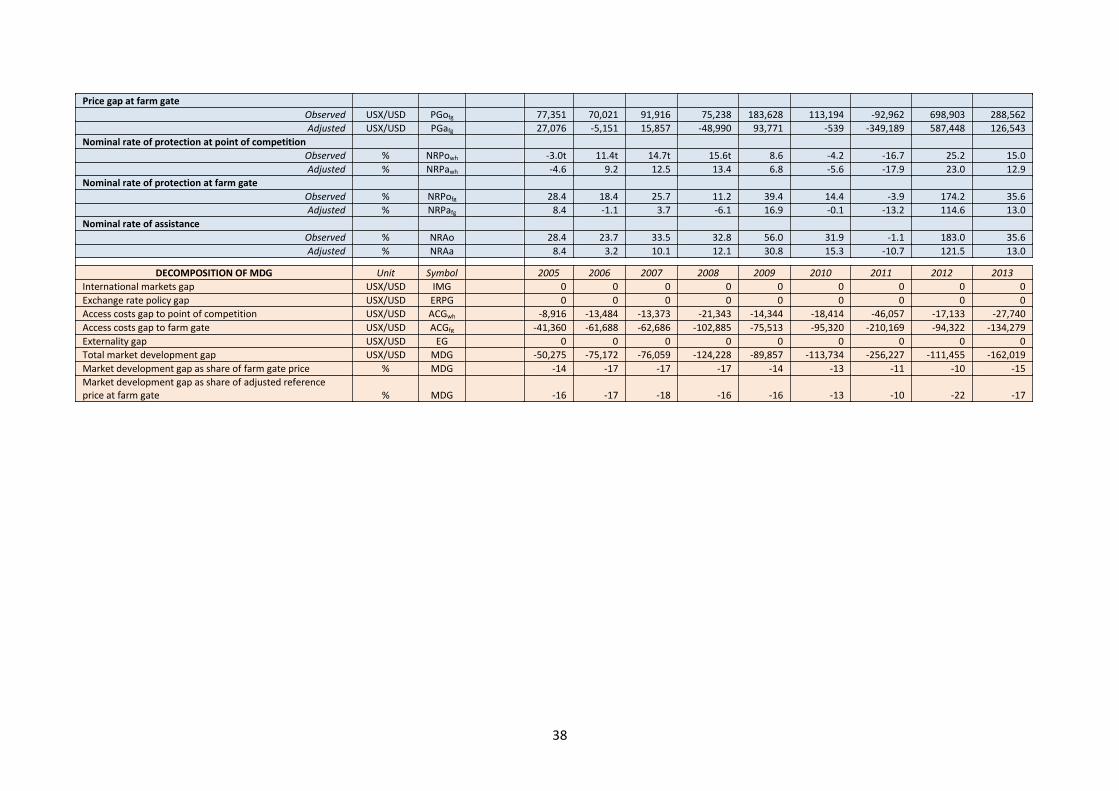
Price gap at farm gate Observed USX/USD PGofg 77,351 70,021 91,916 75,238 183,628 113,194 -92,962 698,903 288,562
Adjusted USX/USD PGafg 27,076 -5,151 15,857 -48,990 93,771 -539 -349,189 587,448 126,543 Nominal rate of protection at point of competition
Observed % NRPowh -3.0t 11.4t 14.7t 15.6t 8.6 -4.2 -16.7 25.2 15.0 Adjusted % NRPawh -4.6 9.2 12.5 13.4 6.8 -5.6 -17.9 23.0 12.9
Nominal rate of protection at farm gate Observed % NRPofg 28.4 18.4 25.7 11.2 39.4 14.4 -3.9 174.2 35.6
Adjusted % NRPafg 8.4 -1.1 3.7 -6.1 16.9 -0.1 -13.2 114.6 13.0 Nominal rate of assistance
Observed % NRAo 28.4 23.7 33.5 32.8 56.0 31.9 -1.1 183.0 35.6 Adjusted % NRAa 8.4 3.2 10.1 12.1 30.8 15.3 -10.7 121.5 13.0
DECOMPOSITION OF MDG Unit Symbol 2005 2006 2007 2008 2009 2010 2011 2012 2013 International markets gap USX/USD IMG 0 0 0 0 0 0 0 0 0 Exchange rate policy gap USX/USD ERPG 0 0 0 0 0 0 0 0 0 Access costs gap to point of competition USX/USD ACGwh -8,916 -13,484 -13,373 -21,343 -14,344 -18,414 -46,057 -17,133 -27,740 Access costs gap to farm gate USX/USD ACGfg -41,360 -61,688 -62,686 -102,885 -75,513 -95,320 -210,169 -94,322 -134,279 Externality gap USX/USD EG 0 0 0 0 0 0 0 0 0 Total market development gap USX/USD MDG -50,275 -75,172 -76,059 -124,228 -89,857 -113,734 -256,227 -111,455 -162,019 Market development gap as share of farm gate price % MDG -14 -17 -17 -17 -14 -13 -11 -10 -15 Market development gap as share of adjusted reference price at farm gate % MDG -16 -17 -18 -16 -16 -13 -10 -22 -17
38
I4541E/1/04.15