analysis of productivity in japanese information … › riss › rcss › dps › pdf ›...
TRANSCRIPT

RCSS ディスカッションペーパーシリーズ ISSN-1347-636X
第 70 号 2008 年 9 月
Discussion Paper Series
No.70 September, 2008
Analysis of Productivity in Japanese
Information Service Industries
Kazunori Minetaki
RCSS
文部科学大臣認定 共同利用・共同研究拠点
関西大学ソシオネットワーク戦略研究機構
関西大学ソシオネットワーク戦略研究センター
(文部科学省私立大学学術フロンティア推進拠点)
Research Center of Socionetwork Strategies,
The Research Institute for Socionetwork Strategies,
Kansai University
Suita, Osaka, 564-8680 Japan
URL: http://www.rcss.kansai-u.ac.jp
http://www.socionetwork.jp
e-mail: [email protected]
tel: 06-6368-1228
fax. 06-6330-3304

1
Analysis of Productivity in Japanese Information Service Industries
Kazunori Minetaki
The Research Institute for Socionetwork Strategies, Kansai University
The Research Center of Socionetwork Strategies, Kansai University
3-3-35 Yamate-cho, Suita, Osaka 564-8680 JAPAN
E-mail: [email protected]
ABSTRACT
In this paper, we examine whether the NSM (the natural selection mechanism) works properly in
Japanese information service industries.
Many start-up companies in information service industries enjoyed a bubble until 2000, when the
bubble burst in IT and information service industries. Productive firms, as opposed to unproductive
firms, are on the average driven out of the market in severe recessions, which was most noticeable in
the burst of 2000. The breakdown of the NSM may indicate capital markets’ inability to sort out
good firms of high productivity that will eventually recover, from bad firms that should be driven out
of the market anyway.
The breakdown is not found in custom software firms, which are the mainstream of information
service firms. Instead, we see a breakdown of the NSM in prepackaged and business software and
Internet data service firms. They are relatively new (though rapidly increasing) services in Japanese
information services industries. This may imply that suppliers of capital did not have sufficient
expertise to choose good firms from bad ones in the panic of the IT bubble burst of 2000.
Analysis of clusters in the information service industry shows that new firms with high productivity
have been emerging in several areas in Japan, and an analysis of clusters shows how we can find the
business networks in such clusters.
Key Words: information service industry, natural selection mechanism, productivity, entry effect,
cluster, Total Factor Productivity
JEL Classification: D24, L86
Senior Researcher for Statistical Analysis Researcher

2
1. Introduction
Information service industries including the software industry are an integral part of the
so-called “IT (information technology) Revolution” alongside with the hardware industry, which has
attracted much attention in recent discussions of economic growth. Both governments and business
communities around the world consider information service industries as “strategic” industries. For
example, the Japanese government launched an initiative called “e-Japan Strategy II” in 2003, and
clearly targeted information service industries. Some firms in electronic industries are shifting their
business emphasis from computer hardware to software and information services. Because of the
prominent role of IT on recent economic development, in-depth analysis of software and other
information service industries is urgently needed, especially from the perspective of promoting
innovations and thus enhancing international competitiveness.
The necessity of Industry-dynamics analysis of software and information service industries is all
the more apparent when we look at these industries from a productivity perspective. There is ample
evidence that Japanese software and information service industries have problems preventing
productivity enhancement (see Nishimura and Minetaki (2004) and references therein)). 1
It has also been argued that a sharp difference in new business starts might also be an important
cause of productivity differences in software and other information service industries between Japan
and the United States. Proponents of this view, which might be the Japanese government’s position,
stress that a hallmark of US software and other information service industries is a very high rate of
start-up companies. Through the NSM, high-productivity firms survive and low-productivity ones
exit the market. Thus, as the argument goes, if entry is rather random, then there are a greater
number of entrants, and if more high-productivity firms survive, then the industry’s average
productivity improvement is greater. At the same time, the less-competitiveness of software and
other information service industries might arise from a malfunctioning of the NSM. Nishimura et al.
(2005) investigated the natural selection mechanism in Japanese industries and suggested that there
was a malfunctioning of the NSM in the banking-crisis period of 1996-1997. If there is a
malfunctioning of the NSM, this causes a low-performance of Japanese information service
industries.
Unfortunately however, there have been very few empirical studies investigating entry and exit in
software and information service industries at the firm level, even in the United States where data
1 In particular, Nishimura and Kurokawa (2004) have shown that seemingly productivity-enhancing outsourcing has actually negative effects on productivity in Japanese information service industries. They suggest that a particular industrial structure of these industries, namely, a remnant of the old competition-reducing main-supplier-subcontractor relationship, is a culprit of this dismal productivity performance. This is a stark contrast with US software and information service industries, in which outsourcing has been considered one of the major drivers of productivity improvement.
3
about IT industries are relatively available. 2 To the best of our knowledge, there is no empirical
work done in Japan. This research fills this vacuum of empirical studies. Therefore, our main
purposes are as follows: (1) To estimate total-factor productivity (TFP) in the information service
sector using large-scale firm-level data, (2) To investigate entry and exit behavior to examine
whether the information service industries are stagnant, and (3) To investigate whether the NSM
works: Are surviving firms more productive than exiting firms?
The research reported here is based on large-scale Census-like survey data on all firms and
establishments engaged in software and other information services, called the Survey on Selected
Service Industries, Volume of Information Services. This is the most comprehensive data of
information service industries in Japan. All firms at least partly engaging in software and
information services are covered by this survey. This “census-like” characteristic is particularly
important since we are concerned with entry and exit in these industries. Moreover, this survey is
sufficiently detailed to enable us to examine not only country-level characteristics of entry and exit,
but also their regional differences. This property is particularly important to assess regional policies
regarding information and communication technology.
The results of this study show a rather lively picture of Japanese information service industries,
and thus suggest that the “too low rates of business starts” argument is not convincing. Entries are
numerous and exits are also not uncommon. Survival ratios are rather low, but the probability of
survival increases significantly after several years. These characteristics are not unique in
information service industries: they are qualitatively and quantitatively similar to those of other
industries in Japan as shown in Nishimura et al. (2005).
There are, however, several striking results. Nishimura et al. (2005) have shown that efficient
firms in terms of TFP went out of business while inefficient ones survived in the period from
1996-1997 of the banking crisis. That is, the Natural Selection Mechanism, which is supposedly
inherent in a market economy, was apparently malfunctioning. This paper finds a similar breakdown
of the Natural Selection Mechanism in information service industries in the period from 2000 to
2001, in which the so-called “IT bubble” burst.
This paper is organized as follows. The next section presents a brief survey of previous empirical
entry/exit studies. Section 3 provides a brief explanation of the data we use. In section 4, we explore
entry/exit behavior patterns of software and other information service firms nationwide and show
basic TFP calculation results and analyze the relationship between a firm’s entry/exit and the
aggregated levelTFP. The final section concludes the paper.
2 A notable exception is Cusmano (2004, chapter 6) who examines ten start-up companies in software and information service industries.
4
2. Literature survey
The standard model of the NSM, since Javanovic (1982), depicts a firm’s decision for entry,
surviving, and exiting as a result of the maximization of the expected discounted future net cash
flows. Empirical analysis based on firm models is necessary for investigating whether the NSM is
working properly. However, the complexity of a rich theoretical model makes it difficult to
accomplish a direct statistical test of structural equations. Thus, empirical studies try to examine the
feasibility of a firm’s model by testing the consistency between the model’s implication and its
reality with entry/exit behavior. Jovanovic and MacLonald (1994) demonstrate that firms’ failure to
capture innovative technology causes productivity slowdown and leads finally to a “shake-out”.
These studies show one of several choices, for a firm to decide entry and exit behavior. Klepper
and Simons (2000) empirically confirm that the theoretical model, which explains why less
productive firms are shaken out from the market, is consistent with firms’ surviving/exit behavior in
the U.S. tire industry.
If a panel dataset that depicts firms’ entry, surviving, and exit behavior is available, we can
calculate productivity measures and test whether they really conform to the theory. Haltiwanger
(1997) found that a plant-level entry/exit pattern has significant effects on the overall TFP growth of
U.S. manufacturing by using the Longitudinal Research Database. Hahn (2000) showed that a firm’s
turnover made a considerable contribution to industry-level TFP growth in the Korean
manufacturing sector, based on establishment-level panel data. Aw et al. (2001) also showed that a
firm’s turnover contributes considerably to industry-level TFP growth using the Taiwanese Census
of Manufacturers. Bellone et al. (2005) found that exiting firms, as a whole, display below-average
performance levels, and are significantly smaller than their surviving counterparts using a French
firms’ dataset covering 14 manufacturing industries over the period from 1990-2002.
Although these studies give support to the function of the NSM, their data coverage is restricted
to the manufacturing sector. Because of data constraints, there are few studies using datasets
including the service sector. Nishimura et al. (2005), however, investigated the relationship between
a firm’s entry/exit behavior and TFP, based on a comprehensive firm-level panel dataset including
manufacturing and service sectors for Japan from 1994 to 1998. They show that efficient firms in
terms of TFP exited while inefficient ones survived in the banking-crisis period of 1996-1997 and
suggest a malfunctioning of the NSM in severe recessions.
To the best of our knowledge, our paper is the first empirical analysis of this issue in the
Japanese information service sector.
5
3. Data
3.1 Data source
The Survey of Selected Service Industries, Volume of Information Service Industries, has the most
comprehensive statistics about Japanese information service industries. This survey, conducted by
the Ministry of Economy, Trade, and Industry (METI), is a Census-like one, in which all firms and
establishments engaged in information service industries are surveyed. Moreover, the coverage of
the survey is far wider in its scope of information service industries than even the Establishment and
Enterprise Census. The survey collects information about establishments and firms that have some
business activities in information service, while the Census gathers information about establishments
and firms whose major business activities are in information service. This is particularly important
since information service industries are rapidly expanding ones with many entries from and exits to
other industries.
The purpose of our study is to examine entry and exit behavior and investigate their effect on
industry productivity. The Survey of Selected Service Industries, Volume of Information Service
Industries is particularly suited for this purpose in several respects. First, the Survey meticulously
distinguishes revenues, costs, labor inputs, and capital stocks in firms’ information service activities
from their other activities. This is important since some firms in our samples engage only partially in
information service activities. In our empirical analysis, we use these revenues, costs, labor inputs,
and capital stocks solely in their information service activities to construct value-added and other
data necessary for TFP calculation. That is, our value-added, labor input, and capital stock data are
solely of the firms’ information service activities, and thus are not “contaminated” by other
activities.
A notable characteristic of capital investment data in this data set is the many zeros and blanks
found in the category of “acquisition of structure and buildings” and “acquisition of machines and
equipment”, on the one hand, and relatively large payments of computer-time lease and other rental
payments that are supposedly equipment and building rents. This implies that in some cases a
traditional perpetual inventory (PI) method may not be appropriate, especially in the case of capital
service inputs of computers, where capitalization is more appropriate. Thus, in the following analysis,
we use the PI method as much as possible, but when it is not appropriate, we resort to other
procedures to get capital service inputs.
Finally, there is no intangible asset data in the Survey. In particular, there is no data of software
assets that firms have. It is inconceivable that firms engaging information service activities have no
software assets. Consequently, in the following empirical analysis, we should take this fact in mind.

6
3.2 “Active firms”
As in other surveys, it is not always possible to get sufficient information to compute TFP for all
firms. For this reason, we restrict our attention to firms that are “actively involved” in software and
information service activities. We set the following two criteria, and firms satisfying all these criteria
are put in the following empirical analysis.
In the first step, if firms whose information service activities yield negative value-added and/or
hire no worker in a particular year, we exclude these firms from our sample of the particular year. If
these firms show positive value-added after that year, they are included in our sample thereafter.
Actual occurrence of negative value-added is rather rare, accounting for less than 1% of our total
firm-years. As shown in Table 1, this procedure results in, for example, 4,430 firms in the year of
1997.
In the second step, if firms do not have enough data points (a minimum of two years) to construct
the average annual rate of investment, we excluded them from our sample. This procedure is needed
to construct a benchmark-year capital stock to start from in the PI method.3 Through this procedure,
we get 3,551 “active firms” from 4,430 total firms in the first step. As shown in Table 1, our sample
period is from1997-2002, and our sample is an unbalanced panel.4
To discern the characteristics of our set of “active firms”, we compare the whole samples and our
truncated samples in the following tables.
3 In Kurokawa and Nishimura (2005), we have used more restrictive criterion in that, if firms do not have five consecutive years of information service- related equipment investment, we excluded them from our sample. This is necessary for accurate calculation of TFP: Kurokawa and Nishimura (2005) use the five-year average investment growth rate to estimate benchmark-year capital stocks. Here we use a looser criterion since we are concerned with mostly entry and exit and their effects on industry productivity level, rather than determinants of productivity growth. 4 Alongside the survey itself, we use other industry information to correct errors and confusion in the survey in identifying enterprises and establishments. This meticulous procedure is extremely time-consuming, so that we are obliged to confine our analysis to the period between 1997 and 2002 due to time constraint. Moreover, the Ministry changed the data collection method substantially from an essentially enterprise-based one to an establishment-based one in 2000, without proper adjustment to maintain quality of data. This causes a serious discontinuity in many data series found in the survey, especially in investment and capital lease. We make necessary adjustment by assuming per-worker capital stocks are the same between 1999 and 2000.
7
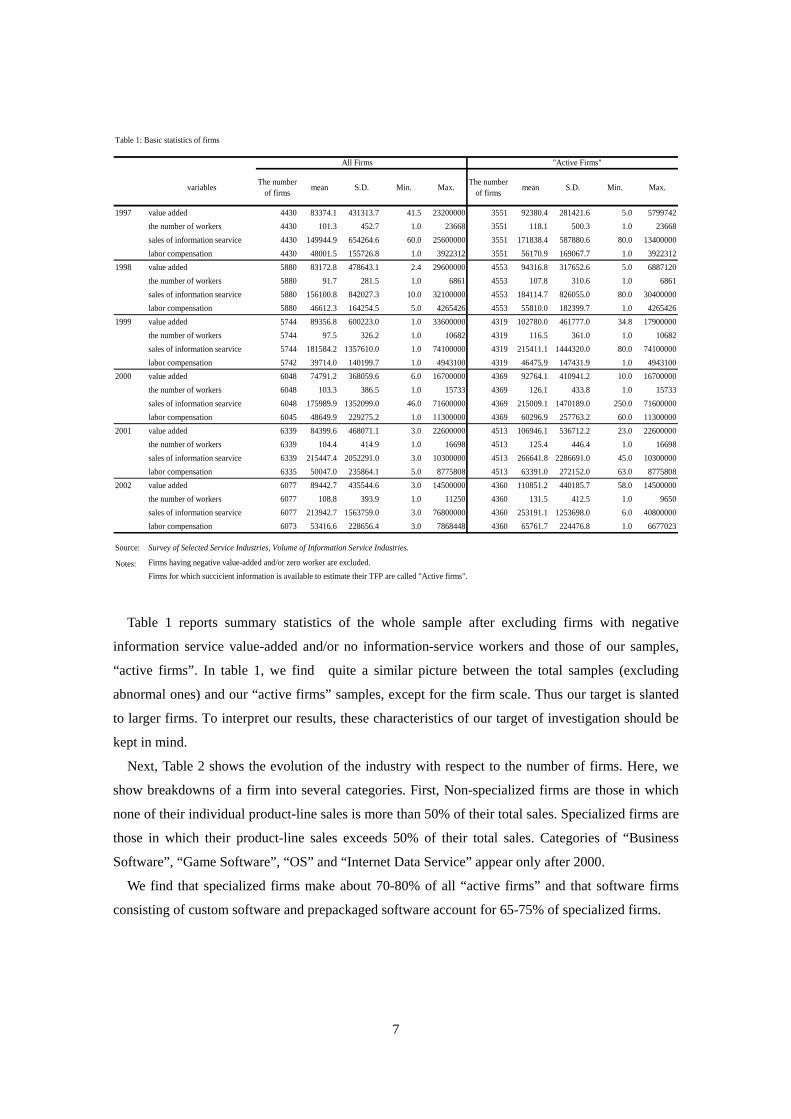
Table 1: Basic statistics of firms
All Firms "Active Firms"
variablesThe number
of firmsmean S.D. Min. Max.
The numberof firms
mean S.D. Min. Max.
1997 value added 4430 83374.1 431313.7 41.5 23200000 3551 92380.4 281421.6 5.0 5799742
the number of workers 4430 101.3 452.7 1.0 23668 3551 118.1 500.3 1.0 23668
sales of information searvice 4430 149944.9 654264.6 60.0 25600000 3551 171838.4 587880.6 80.0 13400000
labor compensation 4430 48001.5 155726.8 1.0 3922312 3551 56170.9 169067.7 1.0 3922312
1998 value added 5880 83172.8 478643.1 2.4 29600000 4553 94316.8 317652.6 5.0 6887120
the number of workers 5880 91.7 281.5 1.0 6861 4553 107.8 310.6 1.0 6861
sales of information searvice 5880 156100.8 842027.3 10.0 32100000 4553 184114.7 826055.0 80.0 30400000
labor compensation 5880 46612.3 164254.5 5.0 4265426 4553 55810.0 182399.7 1.0 4265426
1999 value added 5744 89356.8 600223.0 1.0 33600000 4319 102780.0 461777.0 34.8 17900000
the number of workers 5744 97.5 326.2 1.0 10682 4319 116.5 361.0 1.0 10682
sales of information searvice 5744 181584.2 1357610.0 1.0 74100000 4319 215411.1 1444320.0 80.0 74100000
labor compensation 5742 39714.0 140199.7 1.0 4943100 4319 46475.9 147431.9 1.0 4943100
2000 value added 6048 74791.2 368059.6 6.0 16700000 4369 92764.1 410941.2 10.0 16700000
the number of workers 6048 103.3 386.5 1.0 15733 4369 126.1 433.8 1.0 15733
sales of information searvice 6048 175989.9 1352099.0 46.0 71600000 4369 215009.1 1470189.0 250.0 71600000
labor compensation 6045 48649.9 229275.2 1.0 11300000 4369 60296.9 257763.2 60.0 11300000
2001 value added 6339 84399.6 468071.1 3.0 22600000 4513 106946.1 536712.2 23.0 22600000
the number of workers 6339 104.4 414.9 1.0 16698 4513 125.4 446.4 1.0 16698
sales of information searvice 6339 215447.4 2052291.0 3.0 10300000 4513 266641.8 2286691.0 45.0 10300000
labor compensation 6335 50047.0 235864.1 5.0 8775808 4513 63391.0 272152.0 63.0 8775808
2002 value added 6077 89442.7 435544.6 3.0 14500000 4360 110851.2 440185.7 58.0 14500000
the number of workers 6077 108.8 393.9 1.0 11250 4360 131.5 412.5 1.0 9650
sales of information searvice 6077 213942.7 1563759.0 3.0 76800000 4360 253191.1 1253698.0 6.0 40800000
labor compensation 6073 53416.6 228656.4 3.0 7868448 4360 65761.7 224476.8 1.0 6677023
Source: Survey of Selected Service Industries, Volume of Information Service Industries.
Notes: Firms having negative value-added and/or zero worker are excluded.
Firms for which succicient information is available to estimate their TFP are called "Active firms".
Table 1 reports summary statistics of the whole sample after excluding firms with negative
information service value-added and/or no information-service workers and those of our samples,
“active firms”. In table 1, we find quite a similar picture between the total samples (excluding
abnormal ones) and our “active firms” samples, except for the firm scale. Thus our target is slanted
to larger firms. To interpret our results, these characteristics of our target of investigation should be
kept in mind.
Next, Table 2 shows the evolution of the industry with respect to the number of firms. Here, we
show breakdowns of a firm into several categories. First, Non-specialized firms are those in which
none of their individual product-line sales is more than 50% of their total sales. Specialized firms are
those in which their product-line sales exceeds 50% of their total sales. Categories of “Business
Software”, “Game Software”, “OS” and “Internet Data Service” appear only after 2000.
We find that specialized firms make about 70-80% of all “active firms” and that software firms
consisting of custom software and prepackaged software account for 65-75% of specialized firms.

8
Table 2: The number of firms
1997 1998 1999 2000 2001 2002All Firms 3551 4553 4319 4369 4513 4360 Non-specialized Firms 754 945 947 1255 1319 1288 Specialized Firms 2797 3608 3372 3114 3194 3072 Custom Software 1632 2071 1943 2191 2235 2151 Prepackaged Software 199 292 266 263 291 287 Business Software 199 197 192 Game Software 38 61 60 OS 18 26 26 System Administration and Management 65 117 113 130 148 159 Internet Data Service 11 17 21 Research 81 106 101 199 194 188 Others 820 1022 949 320 309 266 Software Firms 81 106 101 199 194 188 Non-software Firms 820 1022 949 320 309 266
The survey includes firms that are only partly involved in information service industries. They are
the non-specialized firms in Table 2. These firms’ performance duly affects profitability and
productivity of information service businesses, and thus the analysis of profitability and productivity
should take account of them. However, the entry and exit decisions of these firms are not likely to be
much affected by their partial information service activities. Consequently, we should focus our
attention on specialized firms when we consider the effects of entry and exit.
4. Entry, exit and productivity
4.1 Entry/exit behavior of Japanese information service industries
Here, we capture the entry/exit behavior of Japanese information service industries. Before we
actually learn the results of entry/exit, it should be noted that the entry/exit behavior observed in
our sample illustrates the dynamics of “active firms”. In popular terminology, “exit” means a
complete closure of business. However, according to this definition, “dormant” firms with no
significant business that are still not closed are classified as continuing firms. In the economic
analysis of productivity, we are concerned not with dormant firms, but with “active” firms. As
depicted earlier, firms in our sample are “active firms”, so that this problem may not occur.
Table 3 depicts how firms originated in a certain year have survived since then. While the
“unconditional” rate is a ratio of the number of surviving firms to the number of firms in their entry
year, “conditional” represents a comparison with the previous year.
9
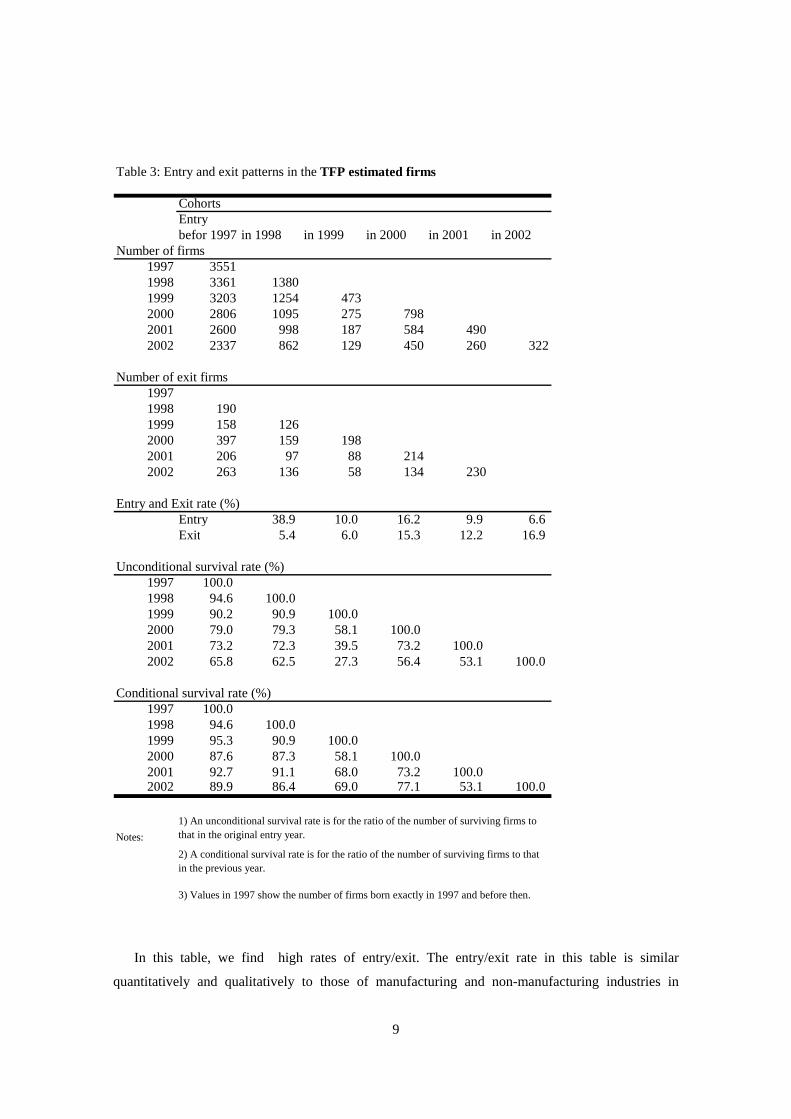
Table 3: Entry and exit patterns in the TFP estimated firms
CohortsEntrybefor 1997 in 1998 in 1999 in 2000 in 2001 in 2002
Number of firms1997 35511998 3361 13801999 3203 1254 4732000 2806 1095 275 7982001 2600 998 187 584 4902002 2337 862 129 450 260 322
Number of exit firms19971998 1901999 158 1262000 397 159 1982001 206 97 88 2142002 263 136 58 134 230
Entry and Exit rate (%)Entry 38.9 10.0 16.2 9.9 6.6Exit 5.4 6.0 15.3 12.2 16.9
Unconditional survival rate (%)1997 100.01998 94.6 100.01999 90.2 90.9 100.02000 79.0 79.3 58.1 100.02001 73.2 72.3 39.5 73.2 100.02002 65.8 62.5 27.3 56.4 53.1 100.0
Conditional survival rate (%)1997 100.01998 94.6 100.01999 95.3 90.9 100.02000 87.6 87.3 58.1 100.02001 92.7 91.1 68.0 73.2 100.02002 89.9 86.4 69.0 77.1 53.1 100.0
Notes:
1) An unconditional survival rate is for the ratio of the number of surviving firms tothat in the original entry year.
2) A conditional survival rate is for the ratio of the number of surviving firms to thatin the previous year.
3) Values in 1997 show the number of firms born exactly in 1997 and before then.
In this table, we find high rates of entry/exit. The entry/exit rate in this table is similar
quantitatively and qualitatively to those of manufacturing and non-manufacturing industries in

10
Nishimura et al. (2005).. Although these are different industries, we compare the entry/exit rates with
those of other countries’ studies. The entry rates of 6.6-38.9% in Table 3 are much higher than in the
Canadian case (2-7%), and close to the French case (7-12%), but less than in the U.S. case
(30-50%). 5 The same relationship holds for the exit rates of the four countries so that firms’
turnover rate in Japanese information service industries is very active compared with other Japanese
industries and with manufacturing in other countries.
Furthermore, from the Table we observe (1) the unconditional survival rate is about 90% in the
first year after entry in 1998, and 80% in the second year, (2) after 1999, 20%- plus to 40%- plus
firms exit in the first year, (3) the probability of survival increases significantly after several years.
Survival rates are primarily the same for the manufacturing sectors in Canada, the U.S., and all
industries in Japan.6 These results clearly imply that the picture depicting Japanese information
service industries as stagnant is wrong. A large number of businesses, or more precisely, ‘activity
starts’ are observed and a large number of business failures are also common. Also the survival ratio
of new businesses is quite low, but it improves as firms survive longer. Business starts, however,
decline sharply afterward. This decline may be influenced by the burst of the IT bubble, which
affected Japanese information service industries strongly.
4.2 The Natural Selection Mechanism
Although we checked the similarities and differences in entry/exit patterns, those alone are not
enough to evaluate the NSM in Japanese information service industries. Let us now consider the
total factor productivity of firms. Thus, we examine whether firms with relatively a higher
performance survive and whether those with a lower performance exit.
The macro- (industry) level TFP is calculated from the firm-level TFP as follows:
i
it
it TFPvTFP lnln , (1)
where itv is a value-added share for firm i at time t . According to Olley and Pakes (1996), Eq.
(1) can be rewritten as
5 Dunne et al. (1988) covers all plants and their subsidiary firms except the smallest firms in the U.S. manufacturing industry from 1963 to1982. Baldwin and Gorecki (1991) also constructed a dataset on manufacturing plants and firms in Canada for 1970 to1982. 6 The 5-year survival rate of the entry cohort is 40-60% for the U.S., 40% for Canada, and 53% for Japan.

11
i
it
it TFPvTFPTFP lnlnln ,
tit
it vvv , t
it
it TFPTFPTFP lnlnln , (2)
where tv is an arithmetic mean of a firm’s value-added share at time t . The first term is the
non-weighted mean of firms’ TFP and the second term is the covariance of firms’ TFP and
value-added share. The value of the second term will be positive (negative) if there is a positive
(negative) correlation between a firm size and TFP.
Table 4 shows the results based on Eq. (2). The value of the covariance term is positive for all
industries throughout the observation period, which implies that the firm-level economies- of- scale
are observed in Japanese information service industries.

12
Table 4: TFP and its decomposition
Industrylevel lnTFP
Non-weighted
mean lnTFP
Covariance Industrylevel lnTFP
Non-weighted
mean lnTFP
Covariance
All Firms Prepackaged Software1997 0.171 -0.098 0.269 1997 0.977 0.131 0.8461998 0.172 -0.128 0.300 1998 0.612 0.102 0.5101999 0.010 -0.198 0.208 1999 0.450 -0.022 0.4722000 0.031 -0.239 0.270 2000 0.380 -0.040 0.4202001 0.173 -0.226 0.399 2001 0.908 -0.151 1.0592002 0.162 -0.232 0.393 2002 0.612 -0.029 0.641
Non-specialized Firms Business Software1997 0.067 -0.082 0.149 19971998 0.180 -0.122 0.303 19981999 -0.051 -0.225 0.174 19992000 -0.104 -0.341 0.238 2000 0.309 -0.013 0.3222001 0.101 -0.348 0.448 2001 0.714 0.023 0.6912002 0.101 -0.335 0.436 2002 0.592 0.020 0.572
Specialized Firms Game Software1997 0.270 -0.103 0.373 19971998 0.164 -0.129 0.293 19981999 0.073 -0.191 0.264 19992000 0.091 -0.198 0.289 2000 0.406 -0.119 0.5262001 0.219 -0.176 0.396 2001 0.887 -0.221 1.1082002 0.199 -0.188 0.387 2002 0.440 -0.118 0.558
Custom Software OS1997 0.306 -0.036 0.342 19971998 0.172 -0.066 0.238 19981999 0.107 -0.115 0.221 19992000 0.114 -0.154 0.268 2000 0.185 -0.188 0.3732001 0.196 -0.123 0.319 2001 1.191 0.228 0.9632002 0.196 -0.142 0.338 2002 0.828 -0.075 0.902
System Management and Administration Others1997 -0.144 -0.282 0.138 1997 -0.057 -0.292 0.2351998 -0.159 -0.229 0.070 1998 0.029 -0.327 0.3561999 -0.115 -0.314 0.199 1999 -0.152 -0.399 0.2482000 -0.358 -0.542 0.184 2000 -0.108 -0.479 0.3722001 -0.345 -0.556 0.211 2001 -0.129 -0.500 0.3722002 0.064 -0.450 0.513 2002 -0.283 -0.524 0.241
Internet Data Service Software Firms1997 1997 0.413 -0.017 0.4311998 1998 0.279 -0.044 0.3231999 1999 0.215 -0.103 0.3182000 -0.719 -1.086 0.367 2000 0.133 -0.144 0.2772001 0.042 -0.887 0.929 2001 0.300 -0.117 0.4162002 -0.272 -0.604 0.331 2002 0.266 -0.133 0.399
Research Non-software Firms1997 0.291 0.036 0.255 1997 0.005 -0.195 0.2001998 0.443 0.011 0.432 1998 0.110 -0.230 0.3401999 0.165 -0.012 0.176 1999 -0.138 -0.309 0.1702000 0.253 -0.157 0.410 2000 -0.153 -0.380 0.2282001 0.170 -0.158 0.328 2001 -0.011 -0.390 0.3792002 0.045 -0.221 0.266 2002 0.018 -0.378 0.396
Notes: Business Software, Game Software, OS and Internet Data Service emerge in Survey of Selected ServiceIndustries, Volume of Information Service Industries since 2000. The firms are categorized by the sales share,which is more than 50% of sales.

13
Next, we examine whether the NSM has worked in the Japanese information service industries. If
there exists an efficiency of a competitive market economy based on the NSM, firms with high
productivity would survive while those with low productivity would exit.
Table 5 shows a simple comparison of TFP levels between surviving and exiting firms. The
results are striking. When we look at the results for all firms, TFP levels of exiting firms are higher
than those of surviving firms in the period from 1998-1999. When we pay attention to the results for
specialized firms, exiting firms’ TFP levels are higher than those of surviving firms in the period
from 2000-2001. This exiting of relatively productive firms suggests a breakdown of the NSM.
Table 5: TFP of surviving & exiting firms
1997-1998 1998-1999 1999-2000 2000-2001 2001-2002
Survive Exit Survive Exit Survive Exit Survive Exit Survive Exit
All Firms1.189 1.110 1.180 1.474 1.013 0.984 1.030 1.044 1.222 0.947
Non-specialized Firms1.073 0.943 1.182 2.313 0.954 0.919 0.912 0.799 1.141 0.741
Specialized Firms1.312 1.259 1.178 1.176 1.078 1.054 1.089 1.156 1.281 1.032
Software Firms1.515 1.443 1.317 1.444 1.247 1.172 1.146 1.103 1.395 1.063
There is a difference between the two periods. In the 1998-1999 period, non-specialized firms
show such a break down. As explained before, entry and exit of these non-specialized firms may not
be related to the productivity of their information service activities, since the latter are not their main
business activities. Thus, we should not put too much emphasis on the breakdown of the 1998-1999
period.
In contrast, however, the breakdown of the 2000-2001 period is a serious one, and is found in
specialized firms. It should be noted here that more than 50% of specialized firms’ sales are from
information services. Thus, this clearly shows a breakdown of the natural selection mechanism in
information service industries in this period.
It should be noted that the 2000-2001 period is the collapse of so-called IT bubble in the stock
markets in Japan and the U.S.
Many start-up companies in information service industries enjoyed a bubble until 2000, but
turned sour in subsequent years. As Nishimura et al. (2005) suggests, these results suggest that there
exists a malfunctioning of the NSM in severe recessions. Productive firms, rather than unproductive

14
firms, are on the average driven out of the market in severe recessions. And this dropping out is most
noticeable in the burst of the IT bubble of 2000 in software and other information service industries.
The breakdown of the NSM may indicate capital markets’ inability to sort out good firms of high
productivity that will eventually recover, from bad firms that should be driven out of market anyway.
In other words, market malfunctioning may be interpreted in connection with serious
non-performing loan problems within the Japanese banking system.
In fact, more information is found in Table 6. The breakdown is not found in custom software
firms, which are the mainstream of information service firms. Instead, we see a breakdown of the
NSM in prepackaged and business software and Internet data service firms. They are relatively new
(though rapidly increasing) services in Japanese information services industries. This may imply that
suppliers of capital do not have sufficient expertise to choose good firms from bad ones in a panic
situation such as in the IT bubble burst of 2000.
Table 6: TFP of surviving & exiting firms for detailed Specialized Firms
Survive Exit Survive Exit Survive Exit Survive Exit Survive Exit
Specialized Firms1.312 1.259 1.178 1.176 1.078 1.054 1.089 1.156 1.281 1.032
Custom Software1.358 1.384 1.182 1.311 1.114 1.101 1.121 1.116 1.248 1.050
Prepackaged Software ***
2.734 1.252 1.825 2.216 1.579 1.513 1.406 2.201 2.555 1.479
Business Software1.367 2.672 2.315 1.290
Game Software1.508 1.416 2.473 1.337
OS1.484 0.819 3.510 1.931
System Management and0.866 0.625 0.852 0.879 0.917 0.758 0.700 0.693 0.720 0.607
Internet Data Service0.458 0.893 1.068 0.600
Research1.339 1.310 1.591 0.812 1.239 0.917 1.284 1.300 1.191 1.124
Others
1.051 0.670 1.077 1.130 0.953 0.814 0.888 1.326 0.921 0.846
2001-20021997-1998 1999-20001998-1999 2000-2001
15
5. Analysis of Information service cluster in Japan
In this section, we focus on several areas where information service companies seem to
accumulate, collaborate, and where spin-off trees exist. We define such areas as information
service industry cluster.
Sapporo valley is most famous cluster from the 1960’s. In the early stage, some software
companies collaborated with Professor Aoki’s laboratory of Hokkaido University. There is spin-off
tree in Sapporo valley. Hudson and BUG started up in 1970’s. Computer-land Hokkaido and
DATTJAPAN started up in 1980’s. Famous companies such as Soft Front and OPENLOOP, emerged
in the Sapporo valley. The reason why Sapporo valley is a cluster is that there are core companies in
the network, and lots of spin offs. After the Net bubble collapsed in 2000-2002, Sapporo valley has
not shown a very good performance. We point out several problems where the long stagnating
Hokkaido economy has been wrongly influenced, where competitors located in other areas emerged,
and where the competitiveness of Sapporo valley’s venture companies has been weakened.
Shibuya Bit valley is famous as an Internet cluster. Unfortunately, the dataset we use cannot
cover the entire Internet industry, but we try to analyze Shibuya in Tokyo. In addition to Internet
companies, many software companies also accumulated in Shibuya. The characteristics of companies
within this area is the tendency of independence from large and existing ICT companies, and little
dependence on the public sector on the demand side.
In this chapter, we decompose TFP growth by using equation(3) as follows:
tTFP
si
itit TFPln + )ln(ln
tsi
itit TFPTFP +
si
itit TFPln
+ )ln(ln t
Niitit TFPTFP + )lnln(
it
Xitit TFPTFP (3)
: Share of value added of each firm to total
:t Starting year of observation
:t Ending year of observation
:s Existing group of firms
:N Entry group of firms
X : Exit group of firms
The first term on the right- hand of equation(3) is within effect, the second is between effect, the
third is the covariance effect, the forth is the entry effect, and the fifth is the exit effect.
16
Table7 shows the decomposition of TFP growth at the prefectural level in Japan, and additionally
shows the decomposition of TFP growth at Shibuya in Tokyo. The particularity of Shibuya is that
almost all parts of TFP growth (except for the exit effect) are positive and push up TFP growth totally.
Within effect, between effect, and covariance effect represent the effect of existing firms. Entry effect
represents the effect of new emerging firms. In Shibuya, both existing firms and new emerging
firms have positive effect on TFP growth. According to table 8, the share of sales within the same
industry is comparatively high, and this share suggests information service firms including Internet
service collaborate together.
Table7 also shows that the entry effect in Kyoto is very high. In other words, new firms have
been emerging and have pulled up TFP growth in Kyoto.
Table8 shows the characteristics of each area where information service firms accumulate.

17
Table7 Decomposition of TFP Growth in Prefecture from 2000 to 2002
within effect share effect covariance effect entry effect exit effect TFP growth rateHokkaido -0.136 -0.019 -0.022 0.002 -0.028 -0.203Aomori -0.239 -0.062 0.003 -0.001 0.002 -0.296Iwate 0.186 -0.039 -0.015 0.098 -0.003 0.226Miyagi -0.022 -0.059 0.001 0.059 -0.062 -0.083Akita 0.205 -0.025 -0.028 0.216 -0.030 0.338Yamagata 0.050 -0.093 -0.008 0.132 -0.007 0.074Fukushima 0.144 -0.020 -0.006 0.001 0.000 0.120Ibaragi -0.090 -0.056 0.002 -0.008 -0.006 -0.158Tochigi 0.305 -0.446 0.073 0.003 0.001 -0.064Gunma 0.136 -0.036 -0.006 0.017 -0.012 0.098Saitama 0.065 0.055 0.012 0.022 -0.064 0.091Chiba -0.082 -0.024 -0.027 0.005 -0.143 -0.271Tokyo 0.067 -0.047 -0.004 0.026 -0.010 0.033Tokyo (Shibuya) 0.129 0.032 0.013 0.019 -0.017 0.175Kanagawa 0.206 -0.108 -0.012 0.056 -0.025 0.117Nigata 0.073 -0.049 0.000 0.004 -0.010 0.018Toyama 0.265 0.016 -0.063 -0.015 0.000 0.202Ishikawa 0.129 -0.110 -0.033 0.116 -0.008 0.094Fukui 0.083 -0.164 -0.027 0.034 -0.004 -0.079Yamanashi 0.167 -0.194 -0.081 0.126 -0.013 0.004Nagano -0.024 -0.027 -0.002 0.027 -0.067 -0.093Gifu 0.117 -0.031 -0.030 0.063 -0.018 0.100Shizuoka 0.142 -0.056 -0.005 0.163 -0.044 0.201Aichi 0.114 -0.056 -0.006 0.055 -0.025 0.082Mie 0.067 -0.035 -0.019 -0.005 0.019 0.028Shiga -0.020 -0.358 0.004 0.010 0.000 -0.364Kyoto 0.460 -0.160 -0.275 0.452 -0.013 0.463Osaka 0.016 -0.124 -0.001 0.021 -0.019 -0.108Hyogo -0.037 -0.078 -0.002 0.080 -0.037 -0.074Wakayawa -0.140 -0.133 0.025 -0.006 -0.058 -0.311Tottori 0.131 -0.012 -0.001 -0.002 0.000 0.116Simane -0.125 -0.048 0.006 0.005 0.016 -0.145Okayama 0.016 -0.007 0.000 0.010 -0.012 0.007Hirosima 0.026 -0.050 0.002 0.020 -0.035 -0.038Yamaguchi 0.125 -0.078 -0.024 0.084 -0.001 0.105Tokushima 0.563 -0.463 0.001 0.019 -0.010 0.110Kagawa 0.094 -0.021 -0.004 0.032 0.108 0.209Ehime -0.047 -0.053 -0.014 0.012 -0.012 -0.114Kochi -0.010 -0.028 -0.001 0.006 -0.038 -0.071Fukuoka 0.049 -0.099 -0.005 0.019 -0.008 -0.044Saga -0.091 -0.079 0.007 0.054 -0.005 -0.114Nagasaki -0.082 -0.067 0.027 0.019 -0.010 -0.113Kumamoto 0.491 0.154 -0.192 0.113 -0.006 0.559Ohita 0.086 -0.062 -0.002 0.068 -0.048 0.042Miyazaki 0.091 0.015 -0.006 0.003 -0.002 0.101Kagoshima 0.148 -0.048 -0.026 0.335 -0.142 0.267Okinawa -0.083 -0.198 0.008 0.042 0.008 -0.223

18
Table8 Characteristics of each area
custom software package software to pubic sector within industryHokkaido 45.8% 9.5% 12.8% 25.3%Tokyo Shibuya 45.2% 9.8% 3.5% 29.8%Gifu 39.9% 10.9% 14.0% 15.8%Shizuoka 55.0% 7.4% 5.4% 21.7%Kyoto 44.8% 11.9% 11.8% 21.2%Fukuoka 53.7% 8.4% 9.7% 31.1%
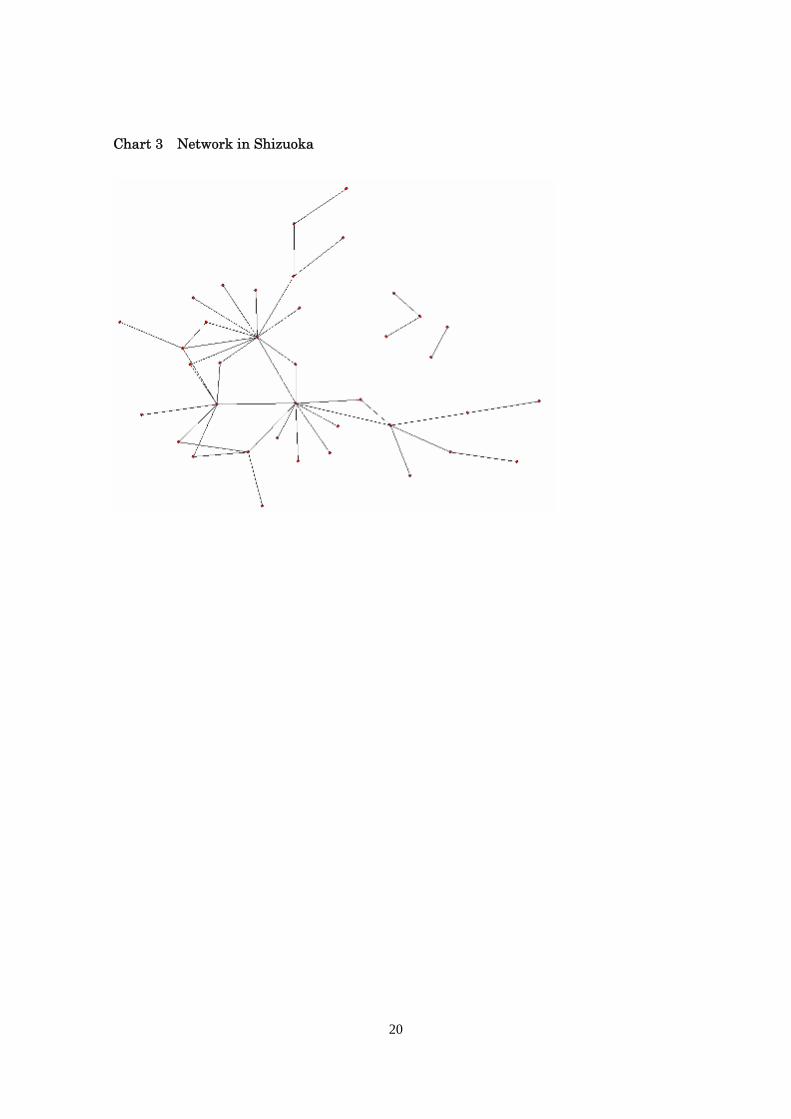
Charts 1-4 show the business networks in some areas where clusters of the information service
industry are located. Chart 1 shows the business network in Hokkaido, with two types of centrality: 1)
firms belonging to major ICT vendors, and 2) firms belonging to Sapporo valley that we mentioned
previously. Chart 2 shows the business network in Gifu, and in Softpia Japan, a core base for
IT-related enterprises.
Chart 3 shows the business network in Shizuoka, which, from the user side, is a centrality for
famous companies. Chart 4 shows the business network in Fukuoka.
Chart 1 Network in Hokkaido

19
Chart 2 Network in Gifu
20
Chart 3 Network in Shizuoka

21
Chart 4 Network in Fukuoka
22
6. Conclusion
Using large-scale census-like data, we have examined the industry-dynamics of Japanese
information service industries. Recent development of firm models provides theoretical background
to the NSM in terms of productivity growth, showing that firms’ rational decisions on entry,
surviving, and exit lead to macroeconomic TFP growth. We have attempted to examine whether
NSM works properly in Japanese information service industries. We have found very active
industries: a large number of business starts are observed, and at the same time a large number of
business failures are also common. The survival ratio of new businesses is quite low, but it improves
as firms survive longer. These characteristics are also found in other industries in Japan and in other
countries. Thus, all in all, Japanese industries are not stagnant, as some researchers tend to picture
them, but are rather a quite competitive environment of struggle for survival.
However, in contrast with previous studies, the results of this study and Nishimura et al. (2005)
suggest that there exist serious problems in the working of the market mechanism, especially in
periods of severe recession. We have found that productive firms, rather than unproductive firms, are
on the average driven out of the market in severe recessions. This anomaly appears in the spell of
banking crises of 1997 in manufacturing and non-manufacturing industries, and in the burst of the IT
bubble of 2000 in software and other information service industries. This clearly implies problems of
the markets’ selection mechanism, in particular, in banking and stock market systems that should
play a crucial role in any such selection mechanisms
Analysis of clusters in the information service industry shows that new firms with high
productivity have been emerging in several areas in Japan. This analysis also shows that we can find
the business networks in such clusters.

23
References
[1]Aw, B., Chen, X. and Roberts, M. (2001) “Firm-level evidence on productivity differentials and
turnover in Taiwanese manufacturing,” Journal of Development Economics, 66, pp. 51-86.
[2]Baldwin, J., Gorecki, P. (1991) “Firm entry and exit in the Canadian manufacturing sector
1970-1982,” The Canadian Journal of Economics, 24, p. 300-323.
[3]Bellone, F., Musso, P., Nesta, L. and Quere, M. (2005) “Productivity and market selection of
French manufacturing firms in the nineties,” mimeo, International Workshop on Competition,
Innovation and Productivity: Empirical Evidence from Firm-level Data, December.
[4]Cusumano, M. (2004) The Business of Software: What Every Manager, Programmer, and
Entrepreneur Must Know to Thrive and Survive in Good Times and Bad, Free Press, NewYork.
[5]Dunne, T., Roberts, M., Samuelson, L. (1988) “Patterns of firm entry and exit in U.S.
manufacturing industries,” The RAND Journal of Economics, 19, pp. 495-515.
[6]Hahn, C. H. (2000) “Entry, exit and aggregate productivity growth: micro evidence on Korean
manufacturing,” Technical Report 45, OECD Economics Department, December.
[7]Haltiwanger, J. (1997) “Measuring and analyzing aggregate fluctuations: the importance of
building from microeconomic evidence,” Review of the Federal Reserve Bank of St. Louis, 79,
pp. 55-77.
[8]Jovanovic, B. and MacDonald, G. (1994) “The life cycle of a competitive industry,” Journal of
Political Economy, 102, pp. 322-347.
[9]Klepper, S. and Simons, K. (2000) “The making of an oligopoly: firm survival and technological
change in the evolution of the U.S. tire industry,” The Journal of Political Economy, 108, pp.
728-760.
[10]Nishimura, K. and Kurokawa, F. (2004) “Total factor productivity in Japanese information
service industries: firm-level analysis,” MMRC-F-11, MMRC Discussion paper series.
[11]Nishimura, K., Nakajima, T. and Keota, K. (2005) “Does the natural selection mechanism still
work in severe recessions? Examination of the Japanese economy in the 1990s,” Journal of
Economic Behavior & Organization, 58, pp. 53-78.
[12]Olley, G., Pakes, A. (1996) “The dynamics of productivity in the telecommunications equipment
industry,” Econometrica , 64, pp. 1263-1297.