analysis of reasonable compensation for unique companies
TRANSCRIPT

#aicpafvc
Analysis of Reasonable Compensation for Unique Companies or Unique Employees

#aicpafvc
Speaker Biography
Robert Reilly has been a managing director of Willamette Management Associates for over 20 years. Willamette Management Associates provides business valuation, forensic analysis, and financial opinion services for transaction, financing, taxation, bankruptcy, litigation, and planning purposes. Robert has testified as an expert witness in federal, state, and international courts on approximately 200 occasions. Robert has also provided expert testimony in deposition on approximately 200 occasions.
Robert holds a BA in economics and an MBA in finance, both from Columbia University. He is a certified public accountant, accredited in business valuation, and certified in financial forensics. He is also a chartered financial analyst, chartered global financial accountant, certified management accountant, and certified business appraiser.
Robert is a member of the AICPA forensic and valuation services executive committee (FVSEC).
Robert can be reached at (773) 399-4318 or at [email protected].

#aicpafvc
Discussion Outline
Reasons to conduct the reasonableness of compensation analysisAlternative standards to determine reasonableness of compensationTwo categories of reasonableness of compensation analysisMultiple factor test analysesIndependent investor test analysesConsiderations in the reasonableness of compensation analysisMultiple factor test illustrative exampleIndependent investor test illustrative exampleReasonableness of compensation analysis caveatsSummary and conclusion, questions, and discussion

#aicpafvc
Reasons to Conduct the Reasonableness of Compensation Analysis
More obvious reasons1. Income normalization adjustment—when valuing a controlling
ownership interest in a business or professional practice2. C corporation – shareholder/employee compensation too high
S corporation – shareholder/employee compensation too low3. Family law – too high compensation causes understated
business value– too low compensation causes understated alimony
Less obvious reasons1. Shareholder litigation
- shareholder oppression – too high compensation results in understated dividends and capital gains
- dissenting shareholder appraisal rights – too high compensation results in understated fair value of stock

#aicpafvc
Reasons to Conduct the Reasonableness of Compensation Analysis (cont.)
Less obvious reasons (cont.)2. Tort litigation
- breach of fiduciary duty claims- dissipation of corporate assets claims
3. Breach of contract ligation- breach of joint venture agreement- breach of partnership agreement
4. Not-for-profit entity concerns- private inurement and excess benefits related to excess
physician/executive compensation- Medicare fraud and abuse
5. ESOP/ERISA litigation- claims against trustee for allowing excess compensation
6. Private equity fund (or other investor) negotiation of the terms of the private company investment
#aicpafvc
Tax Deduction for Employee/Shareholder Compensation
IRC Section 162(a)(1) allows a deduction for compensation that is “a reasonable allowance for salaries or other compensation for personal sources actually rendered”The four requirements for an employee compensation deduction described in Regulation 1.162-7 are:1. an ordinary and necessary expense,2. reasonable in amount,3. based on services actually rendered, and4. actually paid or incurred by the taxpayer corporation.
#aicpafvc
Tax Deduction for Employee/Shareholder Compensation (cont.)
According to Regulations 1.162-7 and 1.1032-1, a taxpayer corporation may deduct a shareholder/executive compensation payment that is based on a percentage formula. The percentage formula may be:• a percent of corporation revenue,• a percent of corporation earnings, or• a percent of some of corporation income measure.
However, the formula-based compensation payments should be:• reasonable in amount,• based on services actually performed, and• paid or incurred in the year in which the deduction is claimed.

#aicpafvc
Considerations in the Reasonable Compensation Analysis
What is meant by reasonable compensation?• maximum supportable level of compensation• greater than mean or median• greater than 75th percentile• greater than 90th, 95th, 98th percentile
Tie the quantitative analysis into the “story” of the employee’s performanceDescribe why superior company performance is due to the employee and not due to:• favorable market conditions• competitors’ failures• intangible assets and intellectual property• being in the right place at the right time

#aicpafvc
Considerations in theReasonable Compensation Analysis (cont.)
What are comparable companies?• same SIC code• same size – revenue, profits, assets, equity• same income tax status• same criteria as used to select BV comparable companies
When analyzing comparable companies, consider all forms of executive compensation• salary and bonus• stock and stock options• use of company assets• other employee benefits
What are “comparable employees” at “comparable companies”?
#aicpafvc
Considerations in theReasonable Compensation Analysis (cont.)
When analyzing comparable executives at comparable companies, remember that private company executive titles may not be comparable to public company executive titlesTouch all the bases in whatever multiple factor test that you selectFor tax-related compensation disputes, consider what judicial jurisdictions are available to the taxpayer

#aicpafvc
Additional Factors to Consider in Analysis of Shareholder/Employee Compensation
Personal guarantee for company debtPersonal guarantee for company leasesPersonal guarantee for company contractsAlso serves on board of directorsAlso serves as trustee for company retirement planOften, the last person to be paid salary and/or bonus

#aicpafvc
Reasonable Compensation versus Ownership Control Adjustments
Don’t confuse (or double count) excess compensation adjustments with other ownership control normalization adjustments:• company paid vacations• company paid club dues• use of company assets (car, plane, homes)• lease of related party assets• phantom employees• debt to/from the company• company-paid personal expenses• other
#aicpafvc
Illustrative Multi-Factor Test Judicial Precedent
Mayson Manufacturing Co.178 F.2d 115 (6th Cir. 1949)(factors also included in the Internal Revenue Manual)
Elliotts, Inc.716 F.2d 1241 (9th Cir. 1983)
Trucks, Inc. v. U.S.588 F. Supp. 638 (D.C. Neb. 1984)
Pulsar Components International, Inc.TCM 1996-129

#aicpafvc
Illustrative Independent Investor Test Judicial Precedent
Exacto Spring Corp. v. Commissioner196 F.3d 833 (7th Cir. 1999)
Menard Inc.560 F.3d 620 (7th Cir. 2009)
#aicpafvc
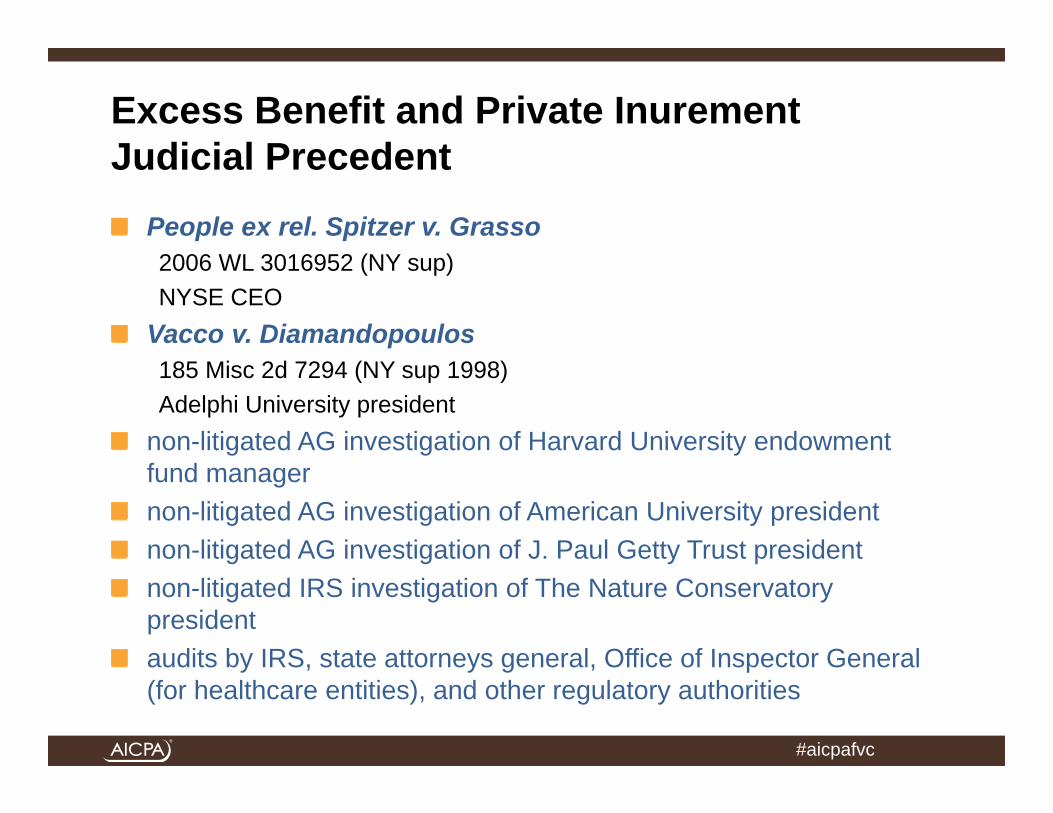
Excess Benefit and Private Inurement Judicial Precedent
People ex rel. Spitzer v. Grasso2006 WL 3016952 (NY sup)NYSE CEO
Vacco v. Diamandopoulos185 Misc 2d 7294 (NY sup 1998)Adelphi University president
non-litigated AG investigation of Harvard University endowment fund managernon-litigated AG investigation of American University presidentnon-litigated AG investigation of J. Paul Getty Trust presidentnon-litigated IRS investigation of The Nature Conservatory presidentaudits by IRS, state attorneys general, Office of Inspector General (for healthcare entities), and other regulatory authorities
#aicpafvc
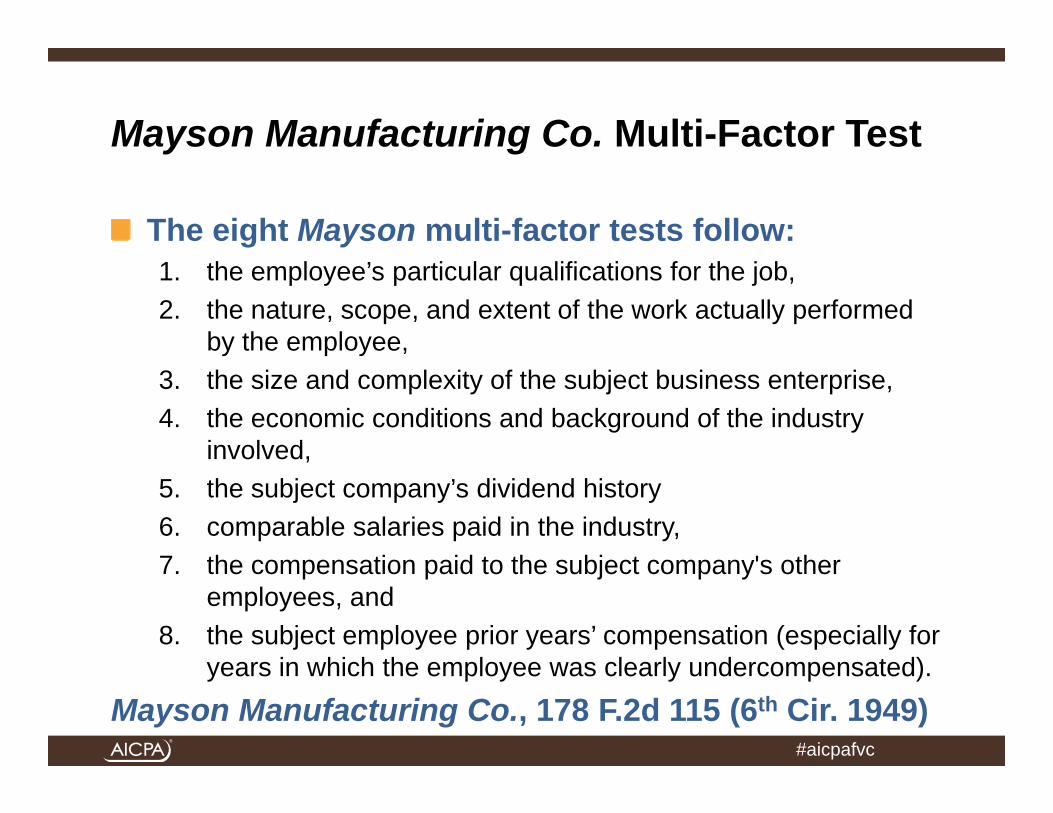
Mayson Manufacturing Co. Multi-Factor Test
The eight Mayson multi-factor tests follow:1. the employee’s particular qualifications for the job,2. the nature, scope, and extent of the work actually performed
by the employee,3. the size and complexity of the subject business enterprise,4. the economic conditions and background of the industry
involved,5. the subject company’s dividend history6. comparable salaries paid in the industry,7. the compensation paid to the subject company's other
employees, and8. the subject employee prior years’ compensation (especially for
years in which the employee was clearly undercompensated).
Mayson Manufacturing Co., 178 F.2d 115 (6th Cir. 1949)

#aicpafvc
Elliotts and Multi-Pak Multi-Factor Test
The Elliotts, Inc. (and the Multi-Pak Corp.) five reasonableness of compensation factors follow:1. the employee’s role in the subject corporation,2. an external comparison with other comparable companies,3. the character and the condition of the subject corporation,4. any potential conflicts of interest, and5. the internal consistency of executive compensation practices
within the subject corporation.
Elliotts, Inc., 716 F.2d 1241 (9th Cir. 1983)

#aicpafvc
The Trucks, Inc. Multi-Factor Test
The Trucks, Inc. v. U.S. multi-factor tests follow:1. employee qualifications and training2. nature, extent, and scope of employee duties3. responsibilities and number of hours involved4. size and complexity of the subject business5. results of the employee’s efforts6. prevailing rates for comparable employees in comparable businesses7. ratio of compensation to company growth and net income (measured
before salaries and tax)8. absence of usual fringe benefits (pension or profit-sharing plan, stock
options, etc.), which are available to executives of other companies of comparable size
9. employee’s responsibility for the company’s inception and/or success10. time of year the compensation was determined and by whom

#aicpafvc
The Trucks, Inc. Multi-Factor Test (cont.)
The Trucks, Inc. v. U.S. multi-factor tests follow: (cont.)11.correlation between the shareholder/executive compensation and
his/her ownership interest12. the corporation’s dividend history13.prevailing economic conditions14.examination of the financial condition of the subject company after
paying the compensation15.whether an independent investor would be willing to compensate the
shareholder/executive at the amount that he/she was compensatedTrucks, Inc. v. U.S. 588 F.Supp. 638 (D.C. Neb. 1984)

#aicpafvc
Pulsar Components International, Inc. Multi-Factor TestsThe Pulsar Components International, Inc. multi-factor tests follow:
1. the employee’s qualifications2. the nature, extent, and scope of the employee’s work3. the size and complexities of the employer’s business4. a comparison of salaries paid with the employer’s gross and net income5. the prevailing general economic conditions6. a comparison of salaries with distributions to officers and retained earnings7. the prevailing rates of compensation for comparable positions in comparable concerns8. the salary policy of the employer as to all employees9. the compensation paid to the particular employee in previous years the employer’s
financial condition10. whether the employer and the employee dealt at arm’s-length11. whether the employee guaranteed the employer’s debt12. whether the employer offered a pension plan or profit sharing plan to its employees13. whether the employee was reimbursed by the employer for business expenses that
the employee paid personallyPulsar Components International, Inc., TCM 1996-129

#aicpafvc
General Sources of Executive Compensation
Subscription-Based Sources• Compdata Surveys, Dolan Technologies, Corp.,
www.compdatasurveys.com• Compensation.BLR.com, Business & Legal Resources,
www.blr.com• CompQuest Online, Towers Watson Data Sources,
www.twdataservices.com• EquilarInsight, Equilar, Inc., www.equilar.com• Executive Compensation Assessor, Economic Research
Institute, www.erieri.com• Kenexa CompAnalyst Executive, Kenexa, Inc.,
www.kenexa.com
#aicpafvc
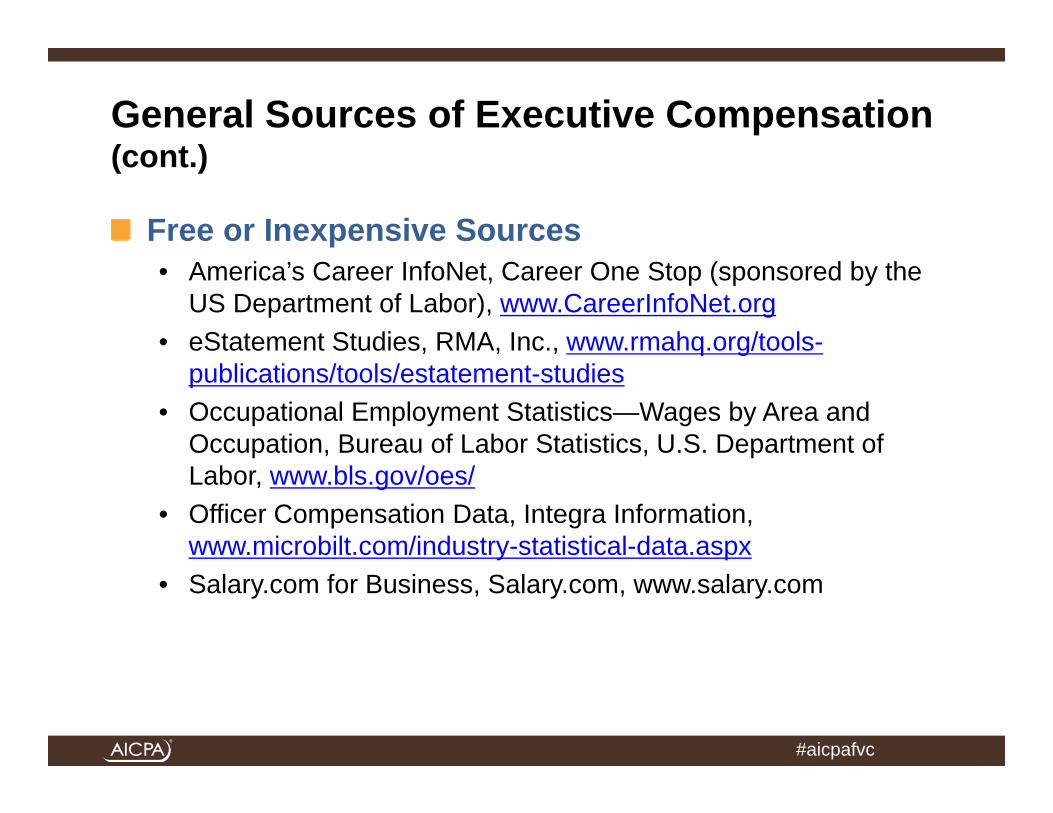
General Sources of Executive Compensation (cont.)
Free or Inexpensive Sources• America’s Career InfoNet, Career One Stop (sponsored by the
US Department of Labor), www.CareerInfoNet.org• eStatement Studies, RMA, Inc., www.rmahq.org/tools-
publications/tools/estatement-studies• Occupational Employment Statistics—Wages by Area and
Occupation, Bureau of Labor Statistics, U.S. Department of Labor, www.bls.gov/oes/
• Officer Compensation Data, Integra Information, www.microbilt.com/industry-statistical-data.aspx
• Salary.com for Business, Salary.com, www.salary.com

#aicpafvc
Selected Healthcare Compensation Sources
AAMC Data Book: Medical Schools and Teaching Hospitals by the Numbers, Association of American Medical Colleges, annual. Contains a section on total compensation attributable to teaching, patient care, and research for full-time faculty at accredited medical schools.Academic Practice Compensation and Production Survey for Faculty and Management, Medical Group Management Association, annual. Provides compensation and productivity information for full-time equivalent faculty physicians and nonphysician providers and compensation for executives and middle managers employed at academic medical centers and teaching hospitals.Hospital Salary & Benefits Report, Hospital & Healthcare Compensation Service, annual. Provides salaries and bonuses for 179 hospital positions including management, nursing, therapy, laboratory, radiological, rehabilitation, dietary, pharmacy, technical, and clerical.

#aicpafvc
Selected Healthcare Compensation Sources (cont.)
Management Compensation Survey, Medical Group Management Association, annual. Provides annual compensation and benefit informaitn for physician executives, executive management, senior management, general management, specialists, and supervisors within a medical group practice environment.Medical Group Compensation and Financial Survey, American Medical Group Association, annual. Provides compensation and productivity data for various medical specialties for physicians, nonphysician providers, and administrative staff.MGMA Physician Compensation and Production Survey, Medical Group Management Association, annual. Provides ranges of compensation and productivity for both full-time equivalent physicians and nonphysician providers.Physician Salary & Benefits Report, Hospital & Healthcare Compensation Service, annual. Provides total compensation for staff physicians in medical practices and at hospitals.

#aicpafvc
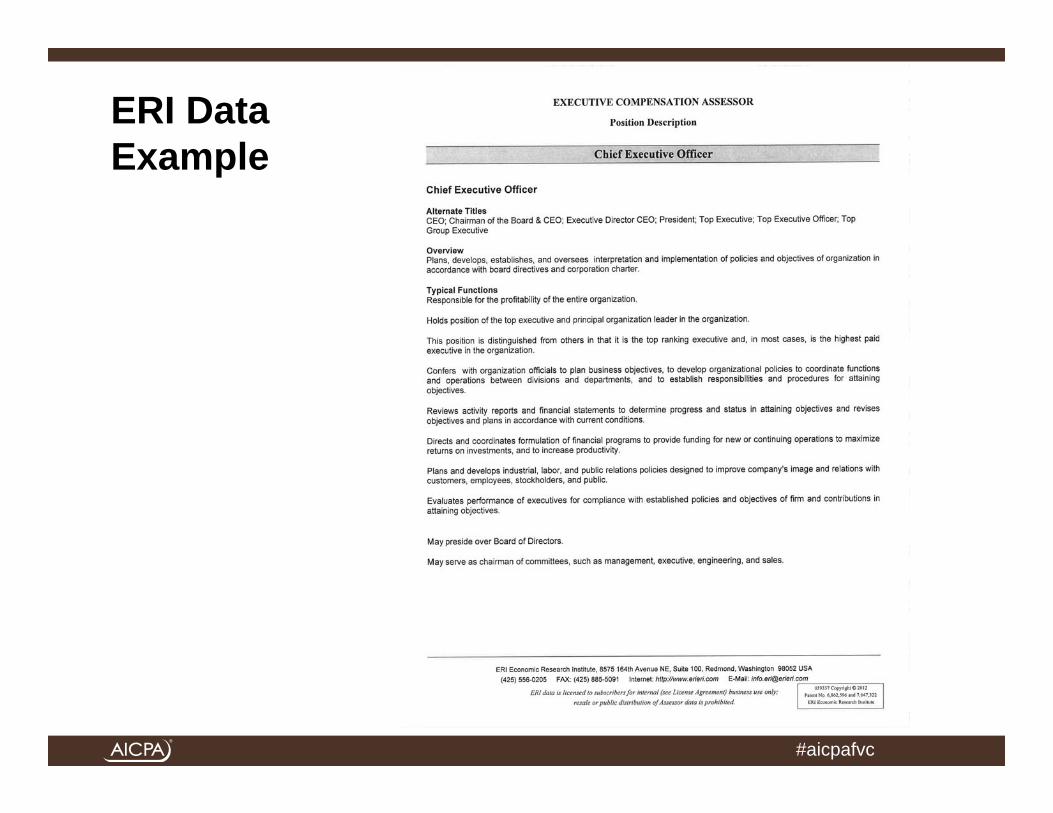
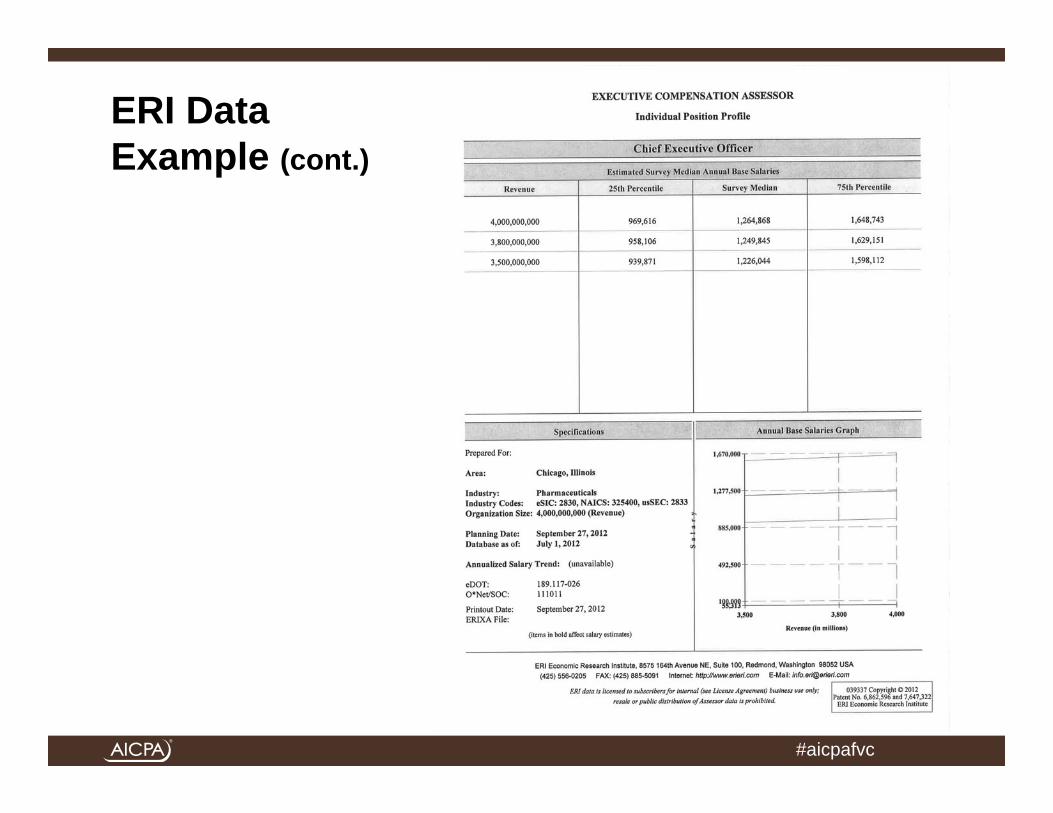
Illustrative Example of ERIExecutive Compensation Assessor
Illustrative fact set: Pharmaceutical company CEOIndustry SIC or NAICS code: SIC code 2830Area: Chicago, IllinoisOrganization size (revenue): $4,000,000,000Planning date (can be historical): current datePosition: CEOIt is possible to select the mean or median. The percentiles can also be changed. The lowest percentile is 10% and the highest percentile is 90%.
#aicpafvc
ERI Data Example
#aicpafvc
ERI Data Example (cont.)

#aicpafvc
ERI Data Example (cont.)
#aicpafvc
Illustrative Presentation to the Alpha Institute of Medical Research Compensation CommitteeOctober 1, 2012
Reasonableness of the Amount of Compensation Paid to Certain Senior Executives
#aicpafvc
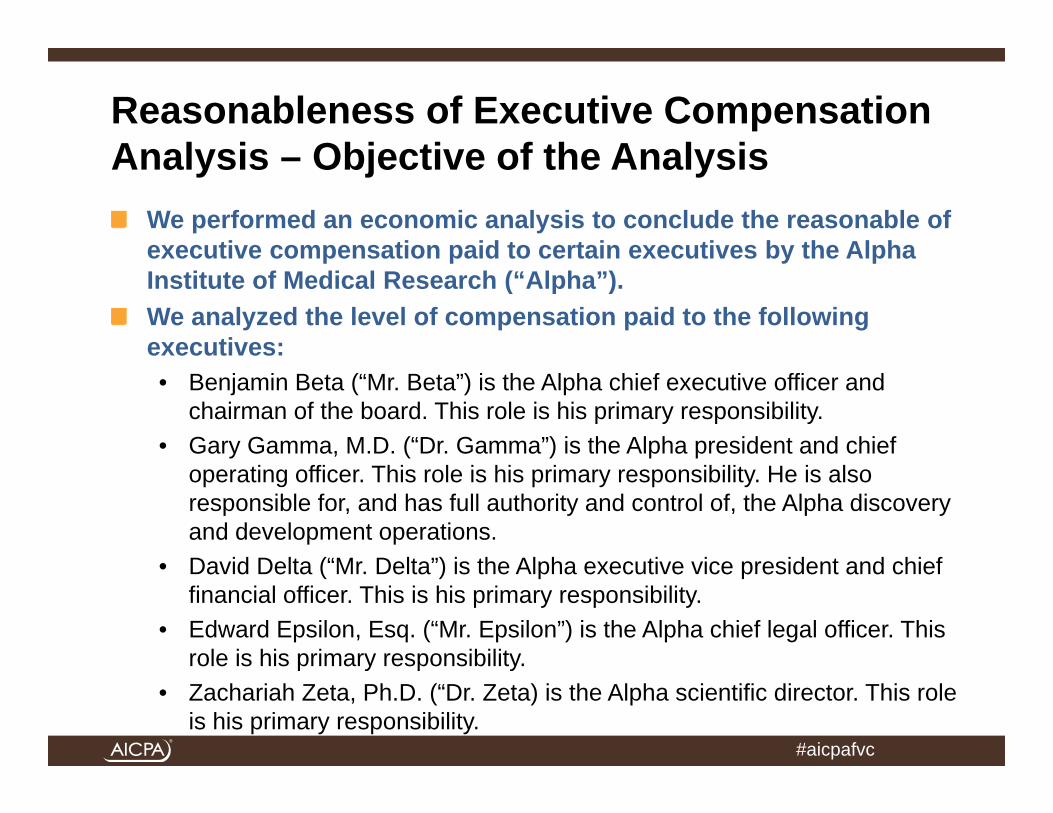
Reasonableness of Executive Compensation Analysis – Objective of the Analysis
We performed an economic analysis to conclude the reasonable of executive compensation paid to certain executives by the Alpha Institute of Medical Research (“Alpha”).We analyzed the level of compensation paid to the following executives:• Benjamin Beta (“Mr. Beta”) is the Alpha chief executive officer and
chairman of the board. This role is his primary responsibility.• Gary Gamma, M.D. (“Dr. Gamma”) is the Alpha president and chief
operating officer. This role is his primary responsibility. He is also responsible for, and has full authority and control of, the Alpha discovery and development operations.
• David Delta (“Mr. Delta”) is the Alpha executive vice president and chief financial officer. This is his primary responsibility.
• Edward Epsilon, Esq. (“Mr. Epsilon”) is the Alpha chief legal officer. This role is his primary responsibility.
• Zachariah Zeta, Ph.D. (“Dr. Zeta) is the Alpha scientific director. This role is his primary responsibility.
#aicpafvc
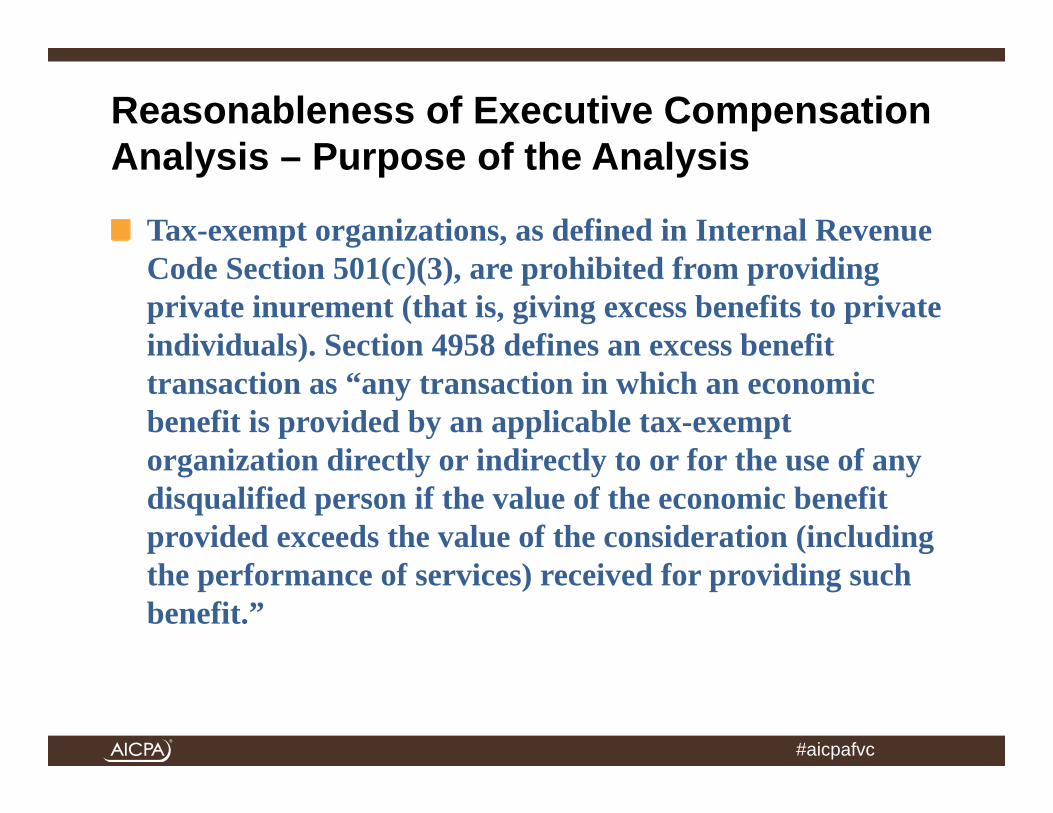
Reasonableness of Executive Compensation Analysis – Purpose of the Analysis
Tax-exempt organizations, as defined in Internal Revenue Code Section 501(c)(3), are prohibited from providing private inurement (that is, giving excess benefits to private individuals). Section 4958 defines an excess benefit transaction as “any transaction in which an economic benefit is provided by an applicable tax-exempt organization directly or indirectly to or for the use of any disqualified person if the value of the economic benefit provided exceeds the value of the consideration (including the performance of services) received for providing such benefit.”

#aicpafvc
Reasonableness of Executive Compensation Analysis – Purpose of the Analysis (cont.)
Prohibited transactions for tax-exempt organizations, as defined in Section 503, include payment of compensation “in excess of a reasonable allowance for salaries or other compensation for personal services actually rendered.”For for-profit organizations, reasonable compensation is defined as “such amount as would ordinarily be paid for like services by like enterprises under like circumstances” as described in Regulation 1.162-7 (b) (3). For purposes of this analysis, we define reasonable compensation as the amount that would ordinarily be paid for like services by like enterprises under like circumstances, not exceeding the value of the personal services rendered.

#aicpafvc
Reasonableness of Executive Compensation Analysis – Framework and Relevant Factors
The Internal Revenue Manual lists the factors that the Service considers in its determination of the reasonableness of executive compensation, for both for-profit entities and not-for-profit entities.The Internal Revenue Manual factors are often referred to as the Mayson factors, because they were first listed in Mayson Mfg. Co. v. Commissioner, 178 F.2d 115, 119 (6th Cir. 1949).
#aicpafvc
Reasonableness of Executive Compensation Analysis – Framework and Relevant Factors (cont.)
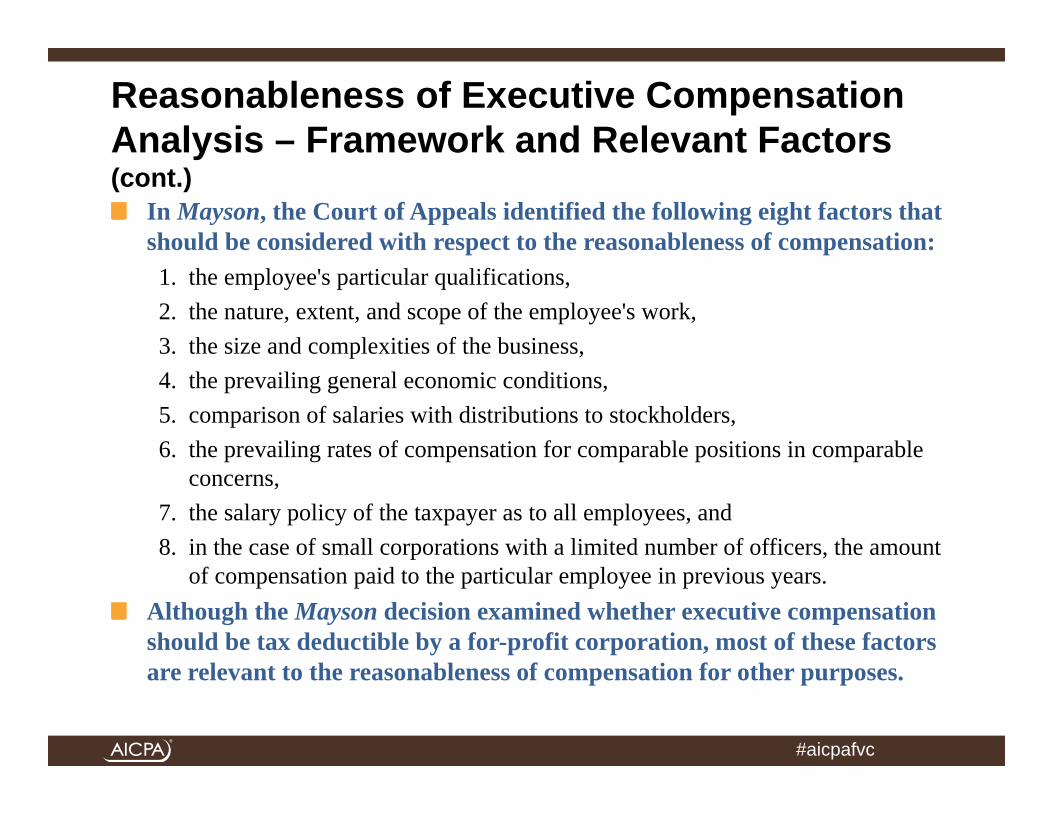
In Mayson, the Court of Appeals identified the following eight factors that should be considered with respect to the reasonableness of compensation: 1. the employee's particular qualifications,2. the nature, extent, and scope of the employee's work,3. the size and complexities of the business,4. the prevailing general economic conditions,5. comparison of salaries with distributions to stockholders,6. the prevailing rates of compensation for comparable positions in comparable
concerns,7. the salary policy of the taxpayer as to all employees, and 8. in the case of small corporations with a limited number of officers, the amount
of compensation paid to the particular employee in previous years.Although the Mayson decision examined whether executive compensation should be tax deductible by a for-profit corporation, most of these factors are relevant to the reasonableness of compensation for other purposes.

#aicpafvc
Reasonableness of Executive Compensation Analysis – Three Benchmark Analyses
Analysts typically use the following three benchmark analyses to estimate reasonable compensation for not-for-profit entity executives: • a salary survey analysis, • a proxy statement analysis, and • a financial ratio analysis.
Salary Survey Analysis• First, we estimated a range of reasonable compensation for each executive by
reference to published executive compensation survey data. We relied on the following two executive compensation references:
- Economic Research Institute (ERI)- Towers Watson Data Services
• However, the two identified references do not include any non-cash compensation, such as awards of stock or stock options.
• In order to provide a compensation package that is competitive with what executives could earn at for-profit organizations, Alpha may have to offer higher levels of cash compensation.

#aicpafvc
Reasonableness of Executive Compensation Analysis – Three Benchmark Analyses (cont.)
Proxy Statement Analysis• Second, we performed an analysis of compensation, including the
value of stock awards and stock options granted, paid by public companies in health-related industries. These compensation amounts are reported on proxy statements or other SEC documents.
Financial Ratio Analysis• Third, we calculated the ratios of (1) total officer/director
compensation to year end fund balance and (2) total officer/director compensation to beginning of year total assets for not-for-profit health-related and medical organizations. We applied these ratios to the Alpha fund balance and the Alpha total assets.

#aicpafvc
Reasonableness of Executive Compensation Analysis – Three Benchmark Analyses (cont.)
Financial Ratio Analysis (cont.)• Next, we subtracted the compensation paid to the Alpha officers/directors
other than each subject executive in order to estimate the reasonableness of the compensation paid to each executive.
• This analysis estimated the amount of compensation that would be “available” to pay to each executive while keeping the total amount of officer/director compensation within a reasonable range.
We did not assign specific weight to the third analysis in our final conclusion. The financial ratio analysis confirmed that the amount of compensation concluded from (1) the salary surveys and (2) the public company proxy statements fell within a reasonable range.

#aicpafvc
Salary Survey Analysis – Benjamin BetaERI Executive Compensation Assessor for Chairman of the Board and Chief Executive Officer Towers Watson Compensation Regression Analysis for Chief Executive Officer
75th 85th 75th 84thMedian Percentile Percentile Mean Percentile Percentile
Revenue Compensation Compensation Compensation Revenue Compensation Compensation CompensationIndustry Description $ $ $ $ Industry Description $ $ $ $
Pharmaceuticals 2,000,000,000 1,726,945 2,251,770 2,529,542 All Organizations (excluding financial services) 2,000,000,000 1,357,026 1,992,461 2,397,186General Medical and Surgical Hospitals 2,000,000,000 1,187,832 1,680,086 1,940,620 High Technology 2,000,000,000 1,382,535 1,893,580 2,203,218Medical Laboratories 2,000,000,000 1,203,270 1,701,921 1,965,842 Health Care 2,000,000,000 1,516,021 2,004,790 2,293,524Research, Development, and Testing 2,000,000,000 1,420,324 1,940,257 2,215,440 Engineering Services 2,000,000,000 1,293,578 1,803,108 2,115,755
Pharmaceuticals 1,500,000,000 1,575,365 2,054,124 2,307,516General Medical and Surgical Hospitals 1,500,000,000 1,085,219 1,534,949 1,772,977 All Organizations (excluding financial services) 1,500,000,000 1,252,724 1,839,318 2,212,936Medical Laboratories 1,500,000,000 1,097,947 1,552,951 1,793,770 High Technology 1,500,000,000 1,266,762 1,735,011 2,018,720Research, Development, and Testing 1,500,000,000 1,289,488 1,761,526 2,011,360 Health Care 1,500,000,000 1,402,319 1,854,430 2,121,509
Engineering Services 1,500,000,000 1,226,532 1,709,653 2,006,096Pharmaceuticals 1,000,000,000 1,384,468 1,805,213 2,027,900General Medical and Surgical Hospitals 1,000,000,000 955,888 1,352,021 1,561,682Medical Laboratories 1,000,000,000 965,979 1,366,294 1,578,168 All Organizations (excluding financial services) 1,000,000,000 1,119,185 1,643,250 1,977,040Research, Development, and Testing 1,000,000,000 1,125,896 1,538,047 1,756,186 High Technology 1,000,000,000 1,119,858 1,533,806 1,784,614
Health Care 1,000,000,000 1,256,395 1,661,459 1,900,746Pharmaceuticals 500,000,000 1,114,741 1,453,515 1,632,817 Engineering Services 1,000,000,000 1,137,894 1,586,102 1,861,122General Medical and Surgical Hospitals 500,000,000 772,705 1,092,925 1,262,408Medical Laboratories 500,000,000 780,609 1,104,104 1,275,320Research, Development, and Testing 500,000,000 897,382 1,225,883 1,399,748 All Organizations (excluding financial services) 500,000,000 923,029 1,355,243 1,630,531
High Technology 500,000,000 907,089 1,242,388 1,445,544Health Care 500,000,000 1,041,231 1,376,926 1,575,234Engineering Services 500,000,000 1,000,948 1,395,213 1,637,134
Indicated Range of Reasonable Annual Compensation Levels
Range of Annual Compensation [a]
Low High AverageSalary Survey Analysis $ $ $
ERI Executive Compensation Assessor 955,888 2,307,516 1,631,702Towers Watson Regression Analysis 1,119,185 2,212,936 1,666,061
#aicpafvc
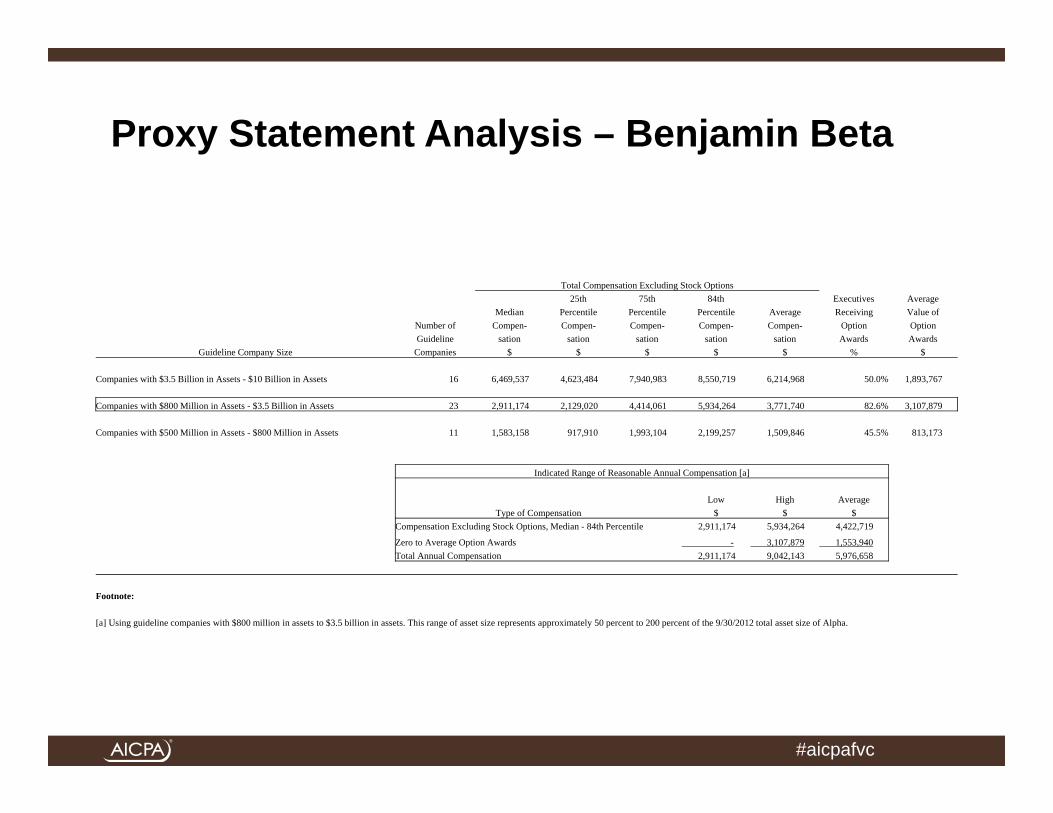
Proxy Statement Analysis – Benjamin Beta
Total Compensation Excluding Stock Options25th 75th 84th Executives Average
Median Percentile Percentile Percentile Average Receiving Value ofNumber of Compen- Compen- Compen- Compen- Compen- Option OptionGuideline sation sation sation sation sation Awards Awards
Guideline Company Size Companies $ $ $ $ $ % $
Companies with $3.5 Billion in Assets - $10 Billion in Assets 16 6,469,537 4,623,484 7,940,983 8,550,719 6,214,968 50.0% 1,893,767
Companies with $800 Million in Assets - $3.5 Billion in Assets 23 2,911,174 2,129,020 4,414,061 5,934,264 3,771,740 82.6% 3,107,879
Companies with $500 Million in Assets - $800 Million in Assets 11 1,583,158 917,910 1,993,104 2,199,257 1,509,846 45.5% 813,173
Indicated Range of Reasonable Annual Compensation [a]
Low High AverageType of Compensation $ $ $
Compensation Excluding Stock Options, Median - 84th Percentile 2,911,174 5,934,264 4,422,719
Zero to Average Option Awards - 3,107,879 1,553,940 Total Annual Compensation 2,911,174 9,042,143 5,976,658
Footnote:
[a] Using guideline companies with $800 million in assets to $3.5 billion in assets. This range of asset size represents approximately 50 percent to 200 percent of the 9/30/2012 total asset size of Alpha.

#aicpafvc
Supplemental Financial Ratio Analysis: Benjamin Beta
ASSET BALANCE FROM $800,000,000 TO $3,500,000,000NATIONAL CENTER FOR CHARITABLE STATISTICS - FORM 990 CORE FILES
ANNUAL COMPENSATION AS A PERCENT OF TOTAL ASSETS
Total Assets Compensation Compensation
at Beginning of Officers/ as a % of
of Year Directors Total Assets
$ $ Name of Organization
3,224,691,848 200,247 NORTHWESTERN MEMORIAL HOSPITAL 0.006%
3,023,233,140 9,433,421 TRINITY HEALTH-MICHIGAN 0.312%
2,958,848,111 8,230,168 SISTERS OF ST FRANCIS HEALTH SERVICES INC 0.278%
2,950,889,948 10,426,468 PARTNERS HEALTHCARE SYSTEM INC 0.353%
2,930,050,297 4,879,958 DUKE UNIVERSITY HEALTH SYSTEM INC 0.167%
2,775,777,168 4,297,831 TEXAS CHILDRENS HOSPITAL 0.155%
2,736,974,953 12,844,548 CATHOLIC HEALTHCARE PARTNERS 0.469%
2,727,541,033 11,420,955 ALLINA HEALTH SYSTEM 0.419%
2,694,067,000 12,251,000 UNIVERSITY HOSPITALS HEALTH SYSTEM INC 0.455%
2,578,396,030 12,950,331 CEDARS-SINAI MEDICAL CENTER 0.502%
. . . . . . . . . . . . . .
800,504,683 4,337,604 RADY CHILDRENS HOSPITAL-SAN DIEGO 0.542%
Median Total Compensation as a % of Total Assets 0.465%
25th Percentile Total Compensation as a % of Total Assets 0.248%
75th Percentile Total Compensation as a % of Total Assets 0.668%
84th Percentile Total Compensation as a % of Total Assets 0.841%

#aicpafvc
Supplemental Financial Ratio Analysis: Benjamin Beta (cont.)
FUND BALANCE FROM $600,000,000 TO $2,500,000,000NATIONAL CENTER FOR CHARITABLE STATISTICS - FORM 990 CORE FILES
ANNUAL COMPENSATION AS A PERCENT OF FUND BALANCE
Fund Compensation Compensation
Balance at of Officers/ as a % of
End of Year Directors Fund Balance
$ $ Name of Organization %
2,038,637,976 4,297,831 TEXAS CHILDRENS HOSPITAL 0.211%
1,907,013,413 2,608,082 ST JUDE CHILDRENS RESEARCH HOSPITAL INC 0.137%
1,849,945,551 25,167,194 ADVOCATE HEALTH AND HOSPITALS CORPORATION 1.360%
1,831,220,400 9,433,421 TRINITY HEALTH-MICHIGAN 0.515%
1,757,202,000 11,307,000 MEMORIAL SLOAN-KETTERING CANCER CENTER 0.643%
1,727,020,143 8,230,168 SISTERS OF ST FRANCIS HEALTH SERVICES INC 0.477%
1,722,056,000 6,586,000 UNIVERSITY HOSPITALS HEALTH SYSTEM INC 0.382%
1,715,855,818 2,687,081 AMERICAN LEBANESE SYRIAN ASSOC CHAR INC 0.157%
1,687,332,402 17,827,571 SUTTER HEALTH 1.057%
1,674,141,100 18,239,413 BANNER HEALTH 1.089%
. . . . . . . . . . . . . . .
600,660,854 458,146 TOLEDO HOSPITAL 0.076%
Median Total Compensation as a % of Fund Balance 0.588%
25th Percentile Total Compensation as a % of Fund Balance 0.351%
75th Percentile Total Compensation as a % of Fund Balance 0.994%
84th Percentile Total Compensation as a % of Fund Balance 1.325%
#aicpafvc
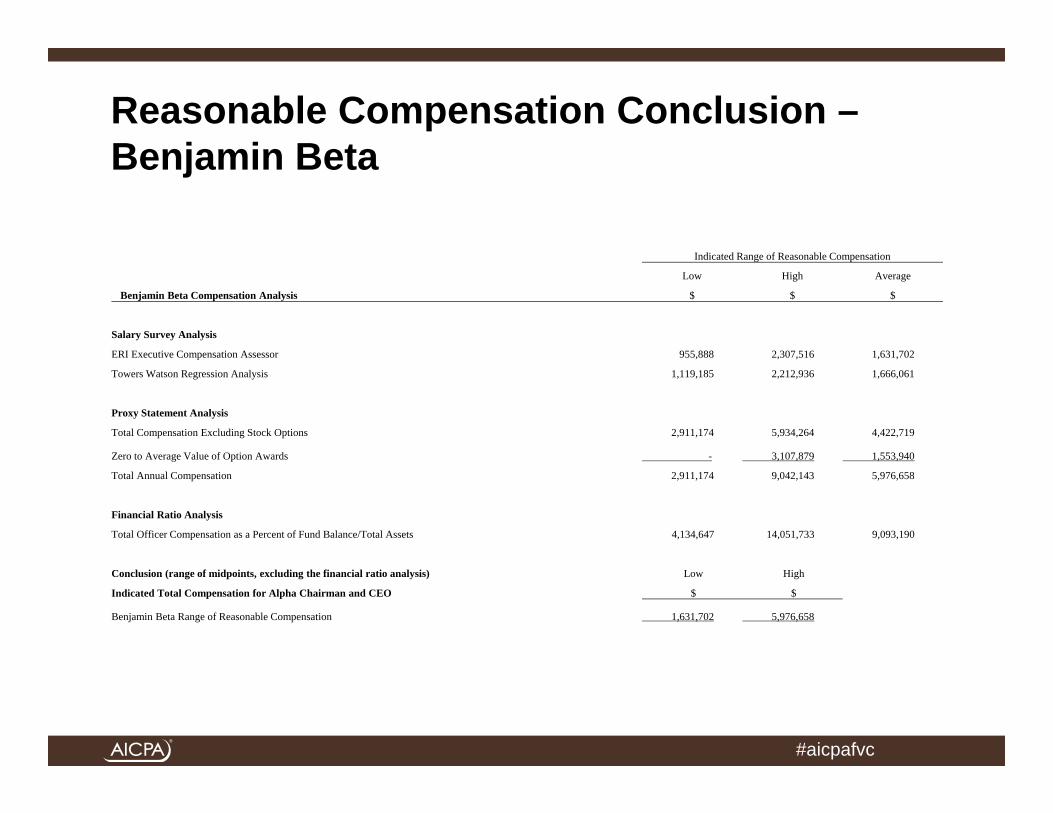
Reasonable Compensation Conclusion –Benjamin Beta
Indicated Range of Reasonable Compensation
Low High Average
Benjamin Beta Compensation Analysis $ $ $
Salary Survey Analysis
ERI Executive Compensation Assessor 955,888 2,307,516 1,631,702
Towers Watson Regression Analysis 1,119,185 2,212,936 1,666,061
Proxy Statement Analysis
Total Compensation Excluding Stock Options 2,911,174 5,934,264 4,422,719
Zero to Average Value of Option Awards - 3,107,879 1,553,940
Total Annual Compensation 2,911,174 9,042,143 5,976,658
Financial Ratio Analysis
Total Officer Compensation as a Percent of Fund Balance/Total Assets 4,134,647 14,051,733 9,093,190
Conclusion (range of midpoints, excluding the financial ratio analysis) Low High
Indicated Total Compensation for Alpha Chairman and CEO $ $
Benjamin Beta Range of Reasonable Compensation 1,631,702 5,976,658

#aicpafvc
Supplemental Comparable Employee Analysis: Benjamin Beta
Ending Name Number of Employees Fund Balance
T otal Assets EOY Name T it le
Compensat ion from Organizat ion
Compensat ion from Related
Organizat ions Other
Compensat ion T otal
Compensat ion
8/31/2012 Howard Hughes Medical Inst itute 3,645 15,739,866,136 18,237,793,953 Robert T ijan, PhD President 1,128,070 - 15,000 1,143,070 12/31/2011 Memorial Sloan-Ket tering Cancer Center [a] 13,595 3,897,526,000 6,448,415,000 Harold Varmus, MD President & CEO, Board Member MSK, MEM, SKI 1,234,315 - 102,732 2,005,571 12/31/2011 Memorial Sloan-Ket tering Cancer Center [a] 13,595 3,897,526,000 6,448,415,000 Craig T hompson, MD President & CEO, Board Member MSK, MEM, SKI 208,191 - 621 626,436 12/31/2011 T he Cleveland Clinic Foundat ion 26,606 2,367,475,265 5,996,125,874 Delos M. Cosgrove President & CEO 2,067,498 - 246,644 2,314,142 12/31/2011 Mayo Clinic 19,784 2,182,343,031 6,946,835,499 John M. Noseworthy CEO & P resident 1,725,646 714,279 2,439,925
9/30/2012 Partners HealthCare Systems Inc. 6,065 (45,937,448) 3,349,320,793 James J Mongan, MD, MBA President & CEO/T rustee 1,851,358 - 301,230 2,152,588 9/30/2012 Partners HealthCare Systems Inc. 6,065 (45,937,448) 3,349,320,793 Gary Got t lieb, MD, MBA President & CEO/T rustee 1,576,310 - 64,972 1,641,282 9/30/2012 Children's Hospital Corporat ion (Boston) 10,266 1,852,729,107 3,065,308,985 James Mandell, MD CEO/Noncomp T rustee 1,453,631 - 424,165 1,877,796 6/30/2012 Cedars-Sinai Medical Center 11,820 1,683,323,760 3,349,460,552 T homas M. P riselac P resident /CEO 2,553,663 - 1,364,544 3,918,207 6/30/2012 St . Jude Children's Research Hospital Inc. 4,025 2,123,269,905 2,440,966,547 William E. Evans Director and CEO 660,479 - 135,059 795,538 6/30/2012 Johns Hopkins Hospital 10,726 931,269,889 2,375,941,191 Ronald R. Peterson President 1,774,090 - 144,011 1,918,101 6/30/2012 Baylor Health Care System 2,343 12,671,576 1,996,544,365 Joel Allison President /CEO/T rustee 1,921,744 - 353,051 2,274,795 9/30/2012 T he Scripps Research Inst itute 2,861 683,055,077 850,789,296 Richard A. Lerner, MD President , CEO 1,039,101 - 331,227 1,370,328 9/30/2012 Beckman Research Inst itute of the City of Hop 972 636,940,312 739,833,649 Michael A Friedman, MD President and CEO - 929,821 212,706 1,142,527 6/30/2012 Fred Hutchinson Cancer Research Center 3,074 193,005,264 555,798,313 Leland H. Hartwell P resident & Director 722,011 - - 722,011
High 3,918,207 Average 1,756,154 Median 1,877,796 Low 626,436
Footnote s:[a] Harold Varmus, MD served as CEO for approximately 8 months and Craig T hompson, MD served as CEO for approximately 4 months. W e annualized total compensat ion for both execut ives.
#aicpafvc
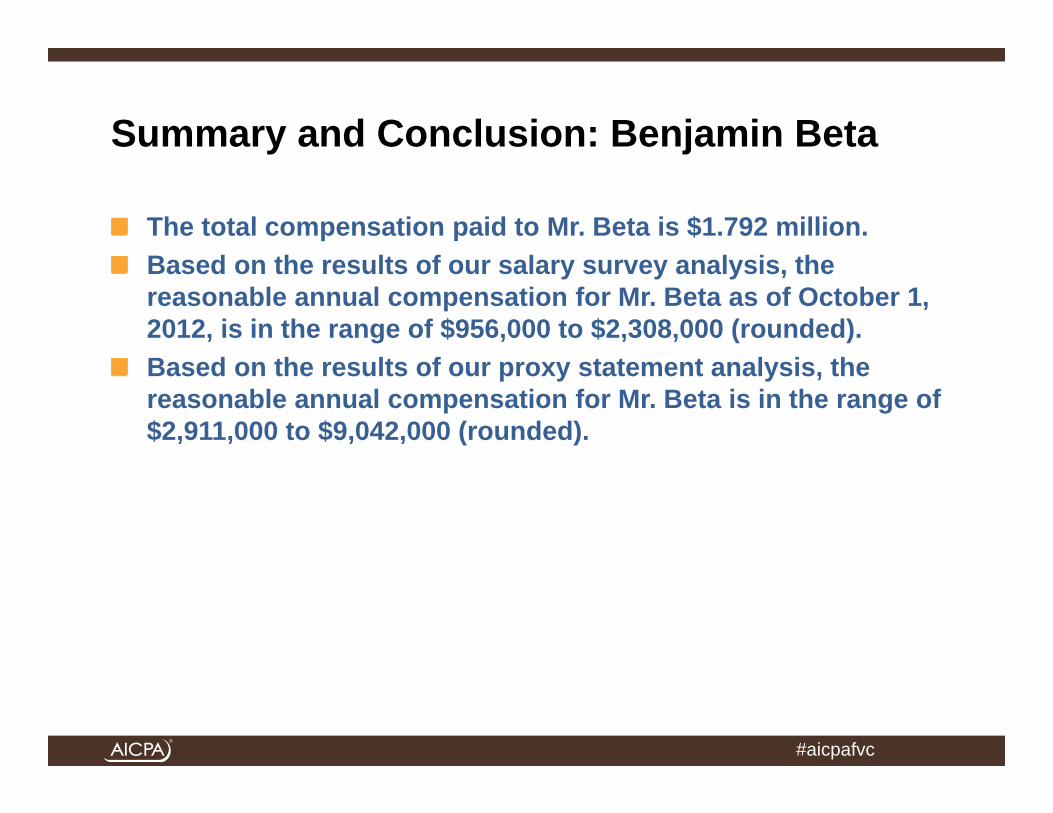
Summary and Conclusion: Benjamin Beta
The total compensation paid to Mr. Beta is $1.792 million.Based on the results of our salary survey analysis, the reasonable annual compensation for Mr. Beta as of October 1, 2012, is in the range of $956,000 to $2,308,000 (rounded).Based on the results of our proxy statement analysis, the reasonable annual compensation for Mr. Beta is in the range of $2,911,000 to $9,042,000 (rounded).
#aicpafvc
Summary and Conclusion: Benjamin Beta (cont.)
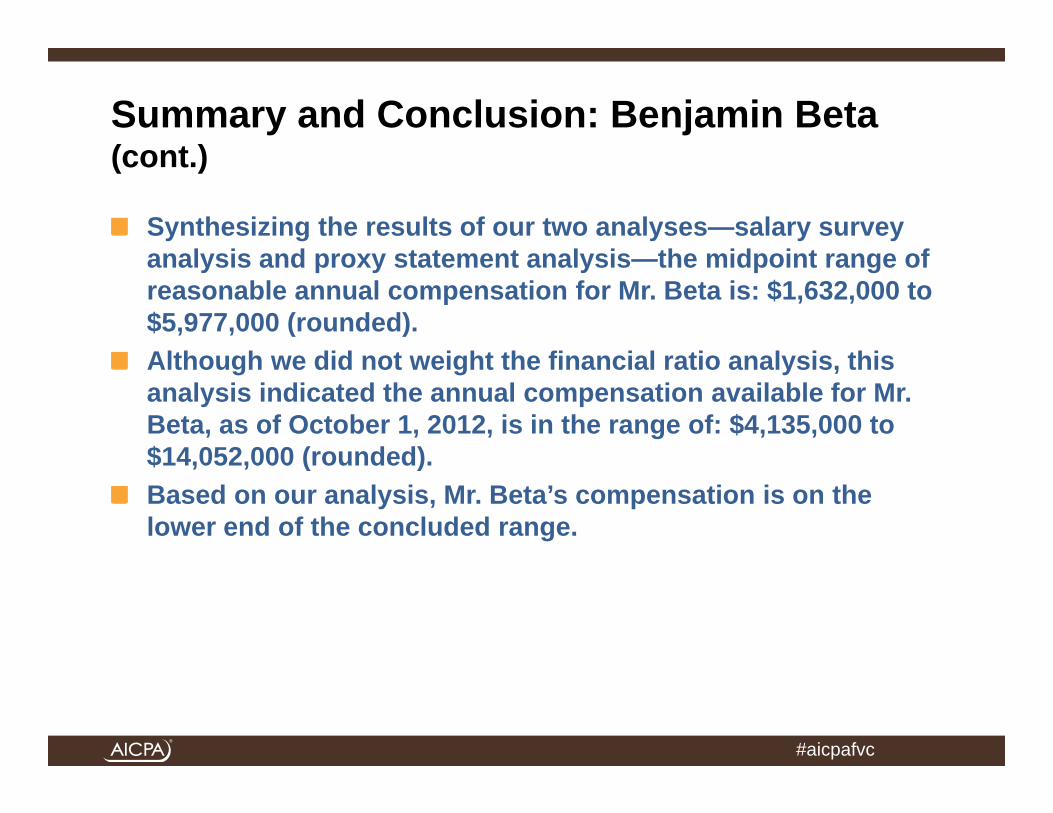
Synthesizing the results of our two analyses—salary survey analysis and proxy statement analysis—the midpoint range of reasonable annual compensation for Mr. Beta is: $1,632,000 to $5,977,000 (rounded).Although we did not weight the financial ratio analysis, this analysis indicated the annual compensation available for Mr. Beta, as of October 1, 2012, is in the range of: $4,135,000 to $14,052,000 (rounded).Based on our analysis, Mr. Beta’s compensation is on the lower end of the concluded range.

#aicpafvc
Illustrative Compensation Committee Presentation Summary and Conclusion
In our regulatory compliance economic analysis, we considered each of the Internal Revenue Manual (Mayson) factors for each subject executive.We specifically relied on the results of a salary survey analysis and a proxy statement analysis for each executive.We confirmed those results with a financial ratio analysis for each executive.We also specifically identified and considered comparable executives at comparable institutions in our analysis of each executive.Each subject executive's compensation falls within a reasonable range of compensation.
#aicpafvc
Independent Investor Test Illustrative Example Fact Set
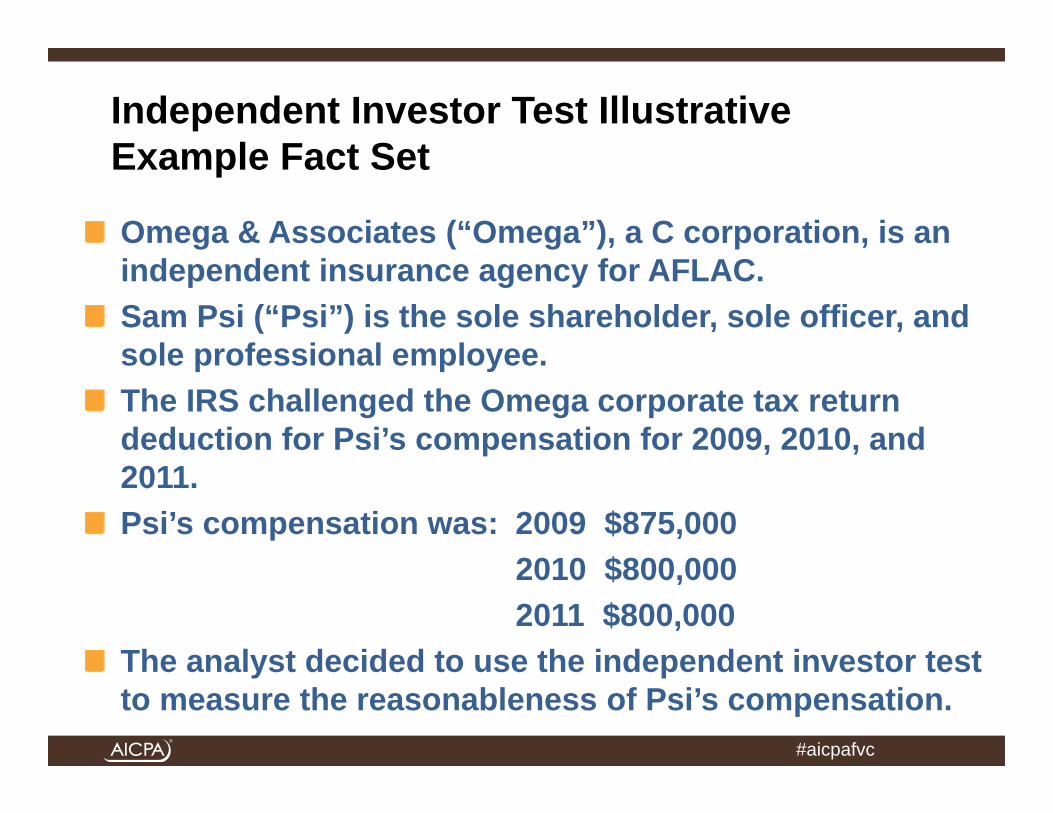
Omega & Associates (“Omega”), a C corporation, is an independent insurance agency for AFLAC.Sam Psi (“Psi”) is the sole shareholder, sole officer, and sole professional employee.The IRS challenged the Omega corporate tax return deduction for Psi’s compensation for 2009, 2010, and 2011.Psi’s compensation was: 2009 $875,000
2010 $800,0002011 $800,000
The analyst decided to use the independent investor test to measure the reasonableness of Psi’s compensation.
#aicpafvc
Omega Income Statements
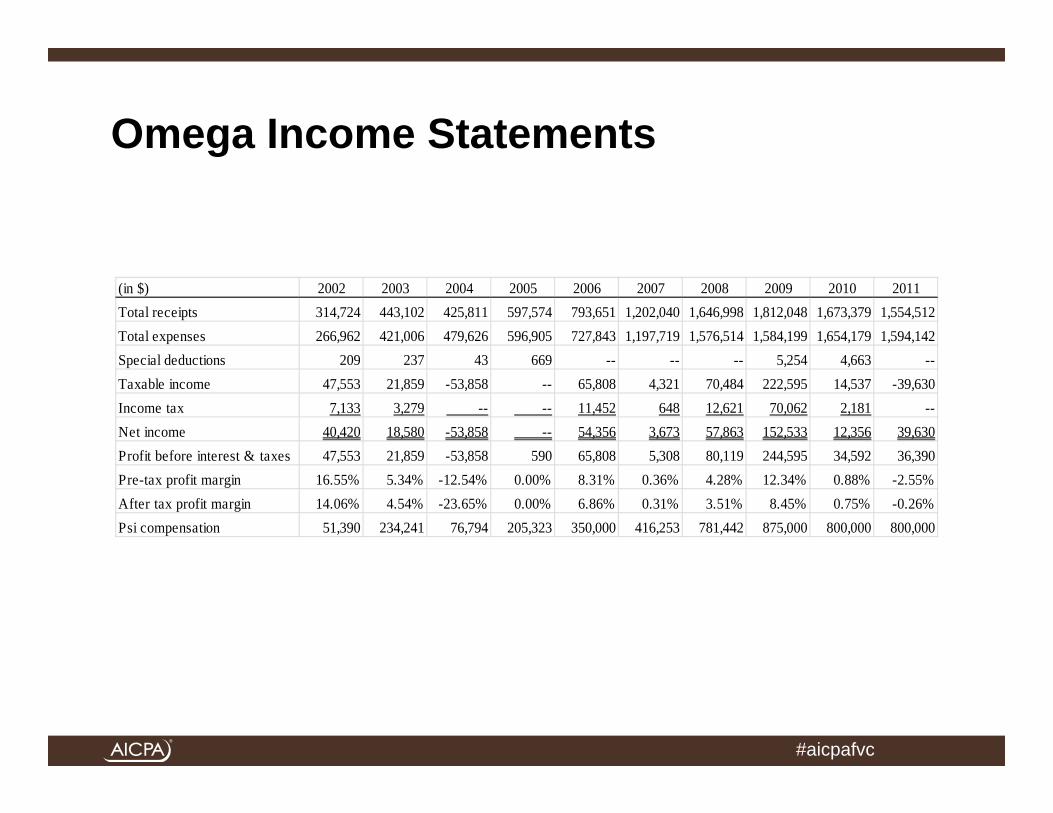
(in $) 2002 2003 2004 2005 2006 2007 2008 2009 2010 2011Total receipts 314,724 443,102 425,811 597,574 793,651 1,202,040 1,646,998 1,812,048 1,673,379 1,554,512Total expenses 266,962 421,006 479,626 596,905 727,843 1,197,719 1,576,514 1,584,199 1,654,179 1,594,142Special deductions 209 237 43 669 -- -- -- 5,254 4,663 --Taxable income 47,553 21,859 -53,858 -- 65,808 4,321 70,484 222,595 14,537 -39,630Income tax 7,133 3,279 -- -- 11,452 648 12,621 70,062 2,181 --Net income 40,420 18,580 -53,858 -- 54,356 3,673 57,863 152,533 12,356 39,630Profit before interest & taxes 47,553 21,859 -53,858 590 65,808 5,308 80,119 244,595 34,592 36,390Pre-tax profit margin 16.55% 5.34% -12.54% 0.00% 8.31% 0.36% 4.28% 12.34% 0.88% -2.55%After tax profit margin 14.06% 4.54% -23.65% 0.00% 6.86% 0.31% 3.51% 8.45% 0.75% -0.26%Psi compensation 51,390 234,241 76,794 205,323 350,000 416,253 781,442 875,000 800,000 800,000
#aicpafvc
Omega Balance Sheets
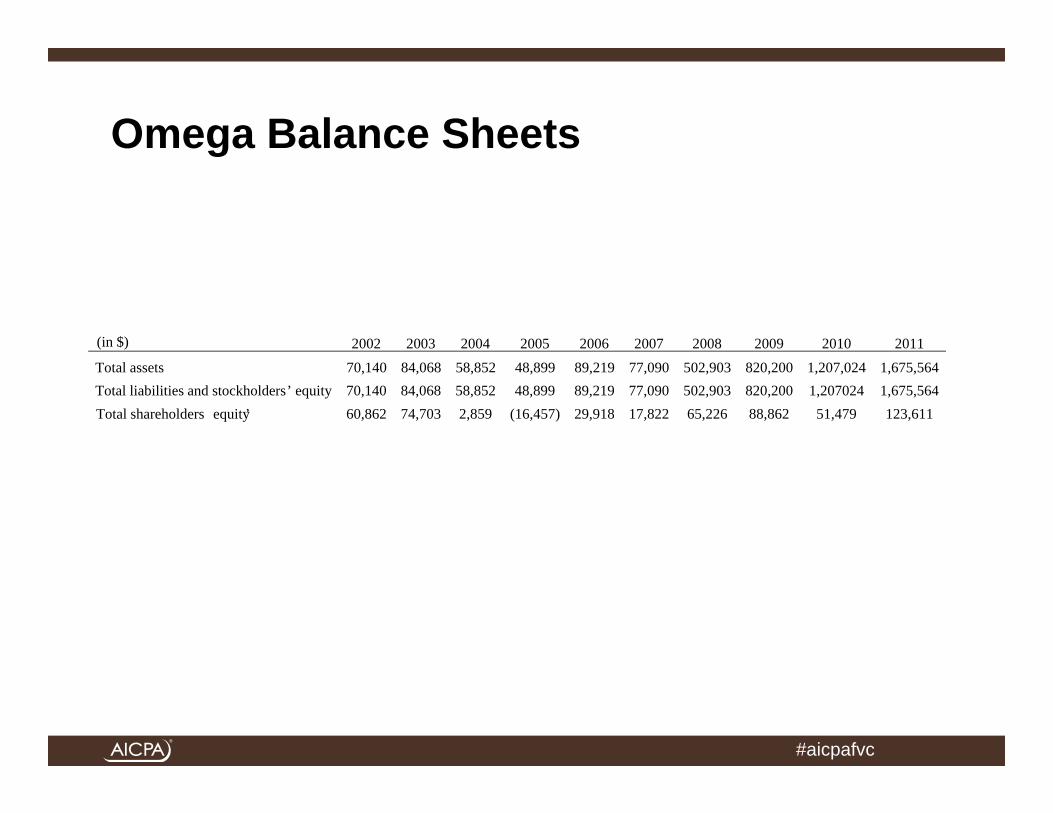
(in $) 2002 2003 2004 2005 2006 2007 2008 2009 2010 2011Total assets 70,140 84,068 58,852 48,899 89,219 77,090 502,903 820,200 1,207,024 1,675,564Total liabilities and stockholders’ equity 70,140 84,068 58,852 48,899 89,219 77,090 502,903 820,200 1,207024 1,675,564Total shareholders ’equity 60,862 74,703 2,859 (16,457) 29,918 17,822 65,226 88,862 51,479 123,611

#aicpafvc
Omega Actual Officer’s Compensation
YearCompensation
$
TotalRevenue
$
NetIncome
$
2011 800,000 1,554,512 (39,630)
2010 800,000 1,673,379 12,356
2009 875,000 1,812,048 152,533
2008 781,442 1,646,998 57,963
2007 416,253 1,202,040 3,673
2006 350,000 793,651 54,356
2005 205,323 597,574 -
2004 76,794 425,811 (53,858)
2003 234,241 443,102 18,580
2002 51,390 314,724 40,420

#aicpafvc
Omega Fair Return on Shareholder Equity Analysis Required Return on Equity [a]
Required Return on Equity 2009 2010 2011
Risk‐free rate [a] 1.96% 2.04% 2.64%
General equity risk premium [b] 7.20% 7.20% 7.10%
Small stock equity risk premium [b] 4.01% 4.02% 3.95%
Company‐specific equity risk premium 3.00% 3.00% 3.00%
After tax required return on equity 16.17% 16.26% 15.69%
Total income tax rate [c] 34% 34% 34%
Pre‐tax return on equity (rounded) 24.5% 24.6% 23.8%
Notes:
[a] Based on CAPM, build‐up model, Duff & Phelps model, public company
DCF model, or any other cost of equity capital model
[b] Industry‐adjusted
[c] Combined federal and state income tax rate
#aicpafvc
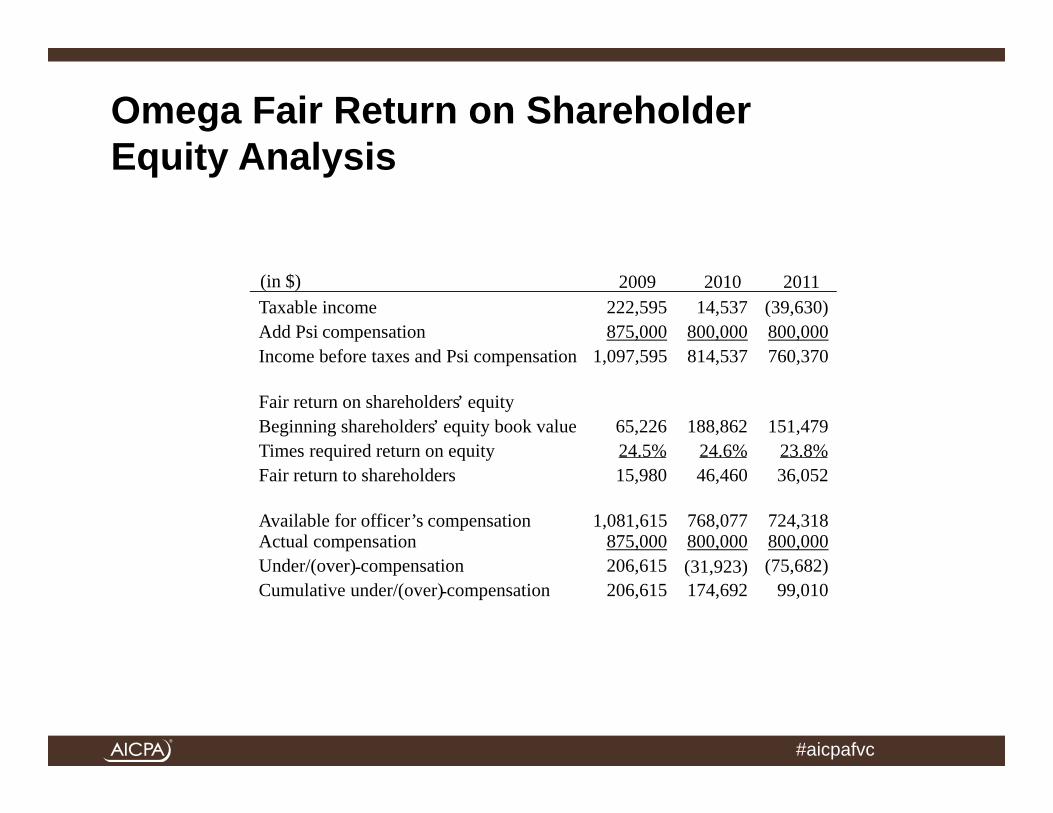
Omega Fair Return on Shareholder Equity Analysis
2009 2010 2011Taxable income 222,595 14,537 (39,630)Add Psi compensation 875,000 800,000 800,000Income before taxes and Psi compensation 1,097,595 814,537 760,370
Fair return on shareholders’ equityBeginning shareholders’ equity book value 65,226 188,862 151,479Times required return on equity 24.5% 24.6% 23.8%Fair return to shareholders 15,980 46,460 36,052
Available for officer’s compensation 1,081,615 768,077 724,318Actual compensation 875,000 800,000 800,000Under/(over)-compensation 206,615 (31,923) (75,682)Cumulative under/(over)-compensation 206,615 174,692 99,010
(in $)

#aicpafvc
Independent Investor Test Illustrative Example Conclusion
During the subject three year period, Omega paid Psi $2,475,000 in compensationDuring the subject three year period, based on our application of the independent investor test, a reasonable level of compensation for Omega to pay Psi was $2,574,010Even though Psi earned greater than a reasonable level of compensation in 2010 and 2011, his cumulative compensation was reasonable for the subject three year period
#aicpafvc
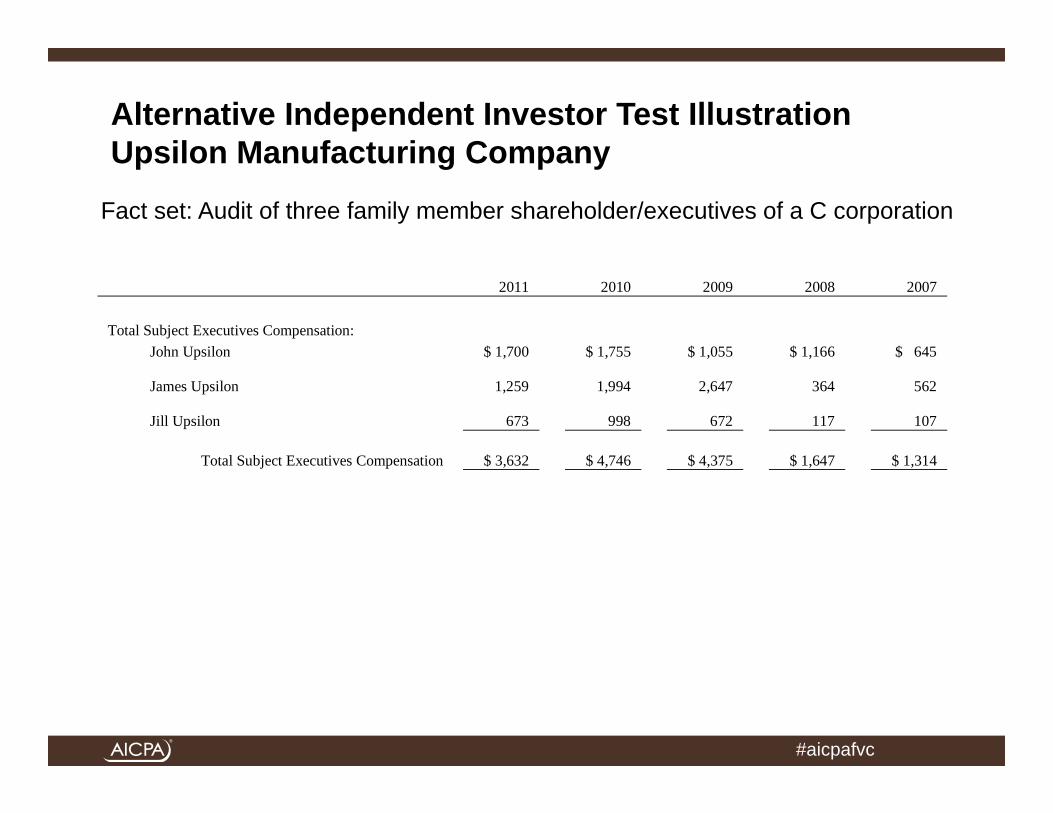
Alternative Independent Investor Test IllustrationUpsilon Manufacturing Company
2011 2010 2009 2008 2007
Total Subject Executives Compensation: John Upsilon $ 1,700 $ 1,755 $ 1,055 $ 1,166 $ 645
James Upsilon
1,259
1,994
2,647
364
562
Jill Upsilon
673
998
672
117
107
Total Subject Executives Compensation $ 3,632 $ 4,746 $ 4,375 $ 1,647 $ 1,314
Fact set: Audit of three family member shareholder/executives of a C corporation

#aicpafvc
Alternative Independent Investor Test IllustrationFair Return on Upsilon Shareholders’ Equity
Independent Investor Test Analysis 2011 2010 2009 2008 2007
Upsilon Manufacturing Company Net Revenue 110,797 108,900 110,170 95,490 81,079
Income Before Taxes and Subject Executives’ Compensation 15,633 18,869 17,650 11,405 8,797
Estimated Fair Market Value of Shareholders' Equity 47,369 50,530 46,157 36,554 30,368 Expected Pre-tax Current Income Yield 15% 15% 15% 15% 15%Pre-tax Fair Return on Shareholders' Equity 7,105 7,580 6,923 5,483 4,555
Economic Income before Taxes and Subject Executives Compensation 15,633 18,869 17,650 11,405 8,797
Fair Pre-tax Return on Shareholders' Equity 7,105 7,580 6,923 5,483 4,555
Residual Amount Available for Subject Executives’ Compensation 8,528 11,290 10,727 5,922 4,242
#aicpafvc
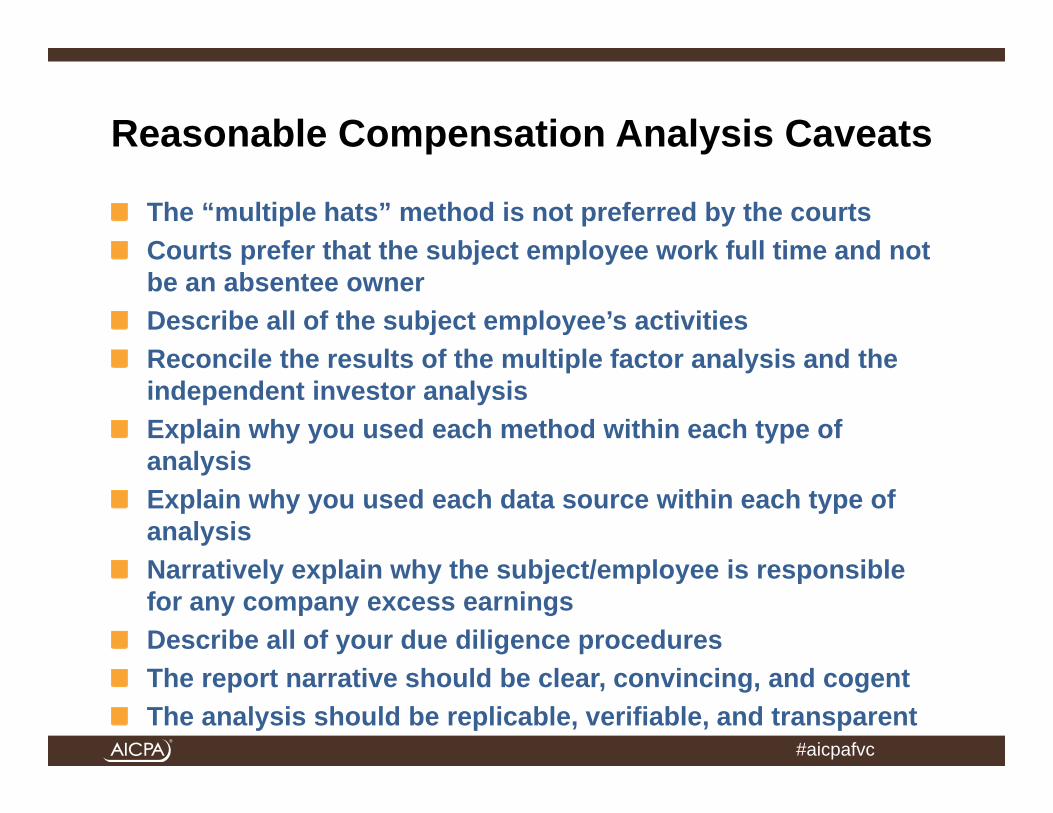
Reasonable Compensation Analysis Caveats
The “multiple hats” method is not preferred by the courtsCourts prefer that the subject employee work full time and not be an absentee ownerDescribe all of the subject employee’s activitiesReconcile the results of the multiple factor analysis and the independent investor analysisExplain why you used each method within each type of analysisExplain why you used each data source within each type of analysisNarratively explain why the subject/employee is responsible for any company excess earningsDescribe all of your due diligence proceduresThe report narrative should be clear, convincing, and cogentThe analysis should be replicable, verifiable, and transparent

#aicpafvc
Summary and Conclusion
Reasons to conduct the reasonable compensation analysisAlternative standards to determine reasonableness of compensationTwo categories of analysesMultiple factor test analysesIndependent investor test analysesConsiderations in the reasonableness of compensation analysisMultiple factor test illustrative exampleIndependent investor test illustrative exampleReasonableness of compensation analysis caveats