analysis of regulatory compliance costs: part i
TRANSCRIPT

Analysis of Regulatory Compliance Costs: Part I
Administrative tasks and excessive paperwork burden remain a long-standing distraction for business owners. Taking a broader view, the problem of excessive paperwork can lead to reduced business start-ups, trade and investment barriers and an overall decline in economic productivity by making it relatively more expensive for Canadian businesses to operate. A lack of detailed research, however, has made it difficult for governments to quantify paperwork burden in order to gain a thorough understanding of this issue. To date, most research has taken the form of broad opinion surveys in which business owners are asked to identify which aspects of running a business they consider most onerous. Along with taxes, excessive paperwork is frequently cited as a major area of concern.
This briefing will examine several aspects of paperwork burden and shed new light on elements such as cost savings, reinvestment, paperwork volume, use of information and communication technologies, and external service providers to assist with compliance. The findings should help policy-
makers gain a clearer understanding of the magnitude of the paperwork burden imposed on businesses
and prove useful for developing meaningful
reduction initiatives.
Table of ContentsHighlights ........................................................2Small and Medium-Sized Enterprise Perceptions of Government Paperwork Burden Reduction Initiatives ......... 2Quantity of Paperwork ......................................................... 2External Service Provider Assistance with Paperwork Compliance..........................................................................2Electronically-Based Compliance Methods ......................... 2
Background .....................................................3Purpose of this Briefing .................................4Key Terms .....................................................4Findings ..........................................................5Perceptions of Government Paperwork Burden Reduction Initiatives .........................5Regional Breakdown ........................................................... 6Size Breakdown...................................................................6How Time/Money Saved was Used ..................................... 6
Quantity of Paperwork ...................................7Regional Breakdown ........................................................... 8Size Breakdown...................................................................9Industry Breakdown ............................................................. 9Considerations ....................................................................9
How the Paperwork Gets Done ...................10External Service Provider Assistance with Paperwork Compliance........................................................................10SME Dependency on External Service Provider Assistance ......................................................................... 11Relationship between Business Size and External Service Provider Assistance ........................................................... 11Service Providers most Frequently Relied upon for Paperwork Compliance ..................................................... 11
Electronic Methods of Paperwork Compliance ...................................................13Methods of Preparation ..................................................... 13Methods of Submission ..................................................... 14
Next Survey Briefing ....................................15Annex 1: Survey Methodology ....................16Annex 2: Regulations Covered in the Survey of Regulatory Compliance Costs ................17
Time/money saved, paperwork volume and methods of compliance
April 2010
2 Analysis of Regulatory Compliance Costs 3Part I
Highlights
Small and Medium-Sized Enterprise Perceptions of Government Paperwork Burden Reduction Initiatives
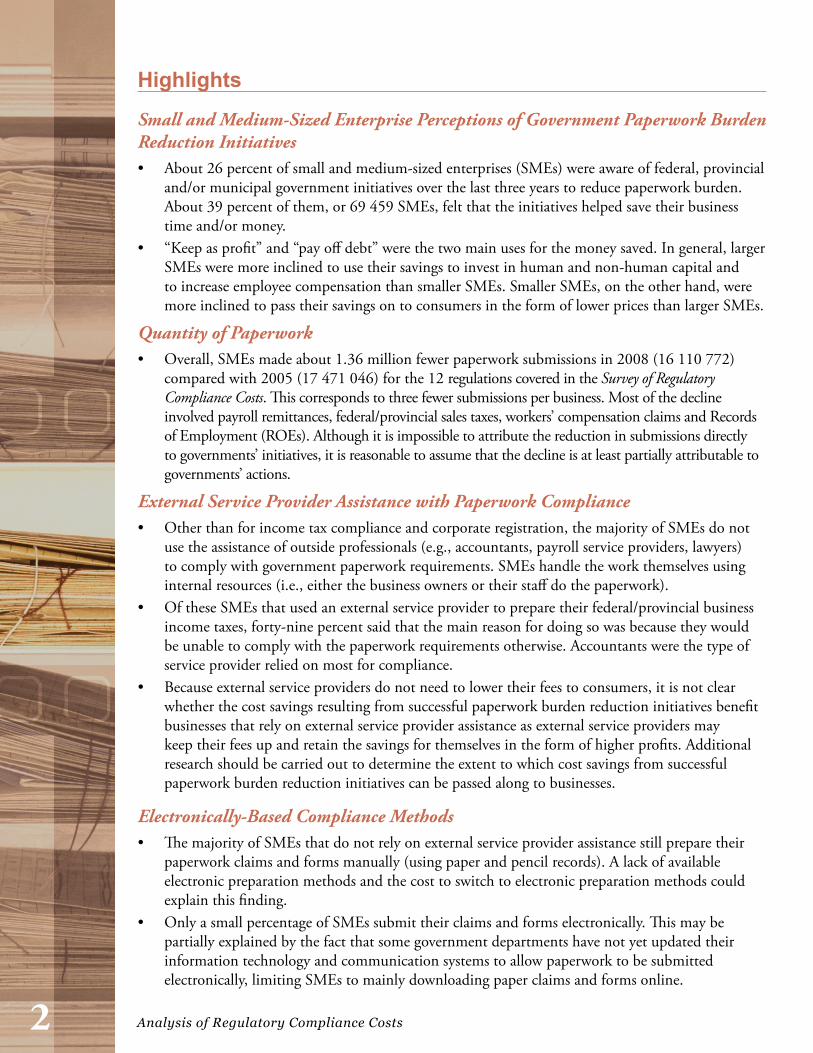
About 26 percent of small and medium-sized enterprises (SMEs) were aware of federal, provincial •and/or municipal government initiatives over the last three years to reduce paperwork burden. About 39 percent of them, or 69 459 SMEs, felt that the initiatives helped save their business time and/or money.“Keep as profit” and “pay off debt” were the two main uses for the money saved. In general, larger •SMEs were more inclined to use their savings to invest in human and non-human capital and to increase employee compensation than smaller SMEs. Smaller SMEs, on the other hand, were more inclined to pass their savings on to consumers in the form of lower prices than larger SMEs.
Quantity of PaperworkOverall, SMEs made about 1.36 million fewer paperwork submissions in 2008 (16 110 772) •compared with 2005 (17 471 046) for the 12 regulations covered in the Survey of Regulatory Compliance Costs. This corresponds to three fewer submissions per business. Most of the decline involved payroll remittances, federal/provincial sales taxes, workers’ compensation claims and Records of Employment (ROEs). Although it is impossible to attribute the reduction in submissions directly to governments’ initiatives, it is reasonable to assume that the decline is at least partially attributable to governments’ actions.
External Service Provider Assistance with Paperwork ComplianceOther than for income tax compliance and corporate registration, the majority of SMEs do not •use the assistance of outside professionals (e.g., accountants, payroll service providers, lawyers) to comply with government paperwork requirements. SMEs handle the work themselves using internal resources (i.e., either the business owners or their staff do the paperwork).Of these SMEs that used an external service provider to prepare their federal/provincial business •income taxes, forty-nine percent said that the main reason for doing so was because they would be unable to comply with the paperwork requirements otherwise. Accountants were the type of service provider relied on most for compliance.Because external service providers do not need to lower their fees to consumers, it is not clear •whether the cost savings resulting from successful paperwork burden reduction initiatives benefit businesses that rely on external service provider assistance as external service providers may keep their fees up and retain the savings for themselves in the form of higher profits. Additional research should be carried out to determine the extent to which cost savings from successful paperwork burden reduction initiatives can be passed along to businesses.
Electronically-Based Compliance MethodsThe majority of SMEs that do not rely on external service provider assistance still prepare their •paperwork claims and forms manually (using paper and pencil records). A lack of available electronic preparation methods and the cost to switch to electronic preparation methods could explain this finding.Only a small percentage of SMEs submit their claims and forms electronically. This may be •partially explained by the fact that some government departments have not yet updated their information technology and communication systems to allow paperwork to be submitted electronically, limiting SMEs to mainly downloading paper claims and forms online.
2 Analysis of Regulatory Compliance Costs 3Part I
BackgroundExcessive paperwork remains a frequently cited concern of business owners when asked which aspects of running a business they dislike most. A 2005 study conducted by the Canadian Federation of Independent Business (CFIB) found that 65 percent of its members considered government regulations and the associated paperwork burden to be one of their greatest concerns, second only to the tax burden. Members felt that the paperwork burden limited their ability to compete with larger businesses and significantly reduced their productivity. Similarly, an international study conducted by the Organisation for Economic Co-operation and Development (OECD) in 2001 concluded that, in general, small and medium-sized enterprises considered excessive paperwork to be a major limitation that distracted them from doing the best possible job of running their businesses.
In 2004, the Government of Canada launched the Paperwork Burden Reduction Initiative (PBRI) to study and address the effects of paperwork burden on SME competitiveness in
Canada. A joint private–public sector committee was established — Advisory Committee on Paperwork Burden Reduction (ACPBR) — to provide advice to the government on ways to reduce the burden and improve overall regulatory efficiency. As part of the PBRI, the government mandated Statistics Canada to conduct a survey on the SME paperwork burden — Survey of Regulatory Compliance Costs — and Industry Canada to analyze the results. This survey was intended to serve as a tool to help the government better understand and quantify the magnitude of the burden and, subsequently, provide information for policy development.
An analysis of the first survey results, covering 2005, was published in Briefing #1: Small Business View of Red Tape and Briefing #2: Measuring the Costs of Red Tape for Small Business. The results established a quantitative benchmark with which to track changes in the paperwork burden over time. Data from the second iteration of the survey cover 2008 and provide policy-makers with a first look at whether the cost of the paperwork burden has changed over the last three years.

4 Analysis of Regulatory Compliance Costs 5Part I
Key Terms For the purposes of this briefing, the following terms and definitions apply:
Small and medium-sized enterprise (SME) — For this report, an SME is an enterprise that:
(1) operates in the manufacturing; retail trade; professional, scientific and technical services; accommodation and food services; or other services industries; (2) employs fewer than 500 employees; (3) generates between $30 000 and $50 million in annual gross revenues; and (4) is located in Atlantic Canada, Quebec, Ontario, the Prairies or British Columbia.
Paperwork — This refers to claims, forms and submissions that businesses are required to fill out and submit, either on paper or electronically, to stay in compliance with government regulations. This includes income tax forms, sales tax submissions, payroll reports such as T4s and T4 summaries, employment-related information requests such as the Record of Employment, survey questionnaires, and workers’ compensation claims and remittances. For this briefing, paperwork excludes routine ongoing record-keeping activities that SMEs perform for the day-to-day operation of their business.
Internal compliance — This refers to the act of using internal resources (i.e., either the business owners or their staff do the paperwork) to comply with government regulations.
External compliance — This refers to the act of using an outside professional, such as an accountant, tax specialist or lawyer, to comply with government regulations.
Employer business — This is a business with at least one employee (excluding the owner/operator of the business).
Purpose of this Briefing
This briefing presents some preliminary results from the second iteration of the Survey of Regulatory Compliance Costs. The results cover five industries — manufacturing; retail trade; professional, scientific and technical services; accommodation and food services; and other services — and five regions — Atlantic Canada, Quebec, Ontario, the Prairies and British Columbia — and are representative of about 685 000 of the 2.3 million business establishments in Canada.1 A brief description of the survey methodology is provided in Annex 1.
This briefing focuses on the quantity of paperwork handled by Canada’s SMEs and examines the relationship between types of SME paperwork and methods of compliance. Findings on business owners’ knowledge and perception of federal, provincial and/or municipal governments’ initiatives over the last three years to reduce the paperwork burden are also presented.
Another briefing will be released in 2010 that will focus on compliance and the costs incurred. The effects of the paperwork burden on labour productivity will also be considered, as will SMEs’ opinions about how to simplify compliance requirements.
1 Statistics Canada, Business Register, 2009. There are approximately 1.2 million non-employer establishments in Canada and 1.1 million employer establishments.

4 Analysis of Regulatory Compliance Costs 5Part I
Findings This part of the briefing presents an analysis of the responses as they pertain to the following themes:
SME perceptions of government initiatives •undertaken to reduce the paperwork burden over the last three years;
The amount of paperwork and the •relationship between quantity and region, business size and industry sector;
The most burdensome types of paperwork; •
Methods used to complete paperwork •(i.e., internal resources or external service provider assistance, by hand using paper and pencil records or by using computer applications); and
External service providers used most often to •assist with compliance.
Perceptions of Government Paperwork Burden Reduction InitiativesThe federal government has implemented a number of regulatory reform/simplification initiatives over the last few years to reduce the paperwork burden. Initiatives have ranged from simplification of claims and forms to outright elimination of requirements. In other instances, electronic or online processing tools have been introduced. Others have sought harmonization of requirements between jurisdictions.
The federal government has not been alone in its efforts. Most provinces and several municipalities have launched a number of initiatives aimed at simplifying compliance and streamlining business-to-government interactions. Approaches taken are varied. Some, as in Ontario, have focused on eliminating business forms and making others available electronically. Nova Scotia’s approach has been to reduce the time spent completing paperwork, while Quebec has established departmental cost measures and imposed limits on the creation of new regulatory requirements. British Columbia, arguably the Canadian jurisdiction with the most experience in this area, began with the elimination of requirements followed by a cap on the overall number of requirements contained in legislation, regulations, and administrative and compliance policies.
All of these initiatives have been primarily driven by the desire to reduce the time and cost of compliance imposed on businesses. What has remained uncertain is whether they have actually reduced the time and cost and, if so, to what degree. In an attempt to answer this question, Statistics Canada asked survey respondents to identify (1) whether they were aware of any of the federal, provincial and/or municipal government’s initiatives over the last three years to reduce the paperwork burden and (2) whether the initiatives helped save their businesses any time and/or money (Figure 1 — A and B).
6 Analysis of Regulatory Compliance Costs 7Part I
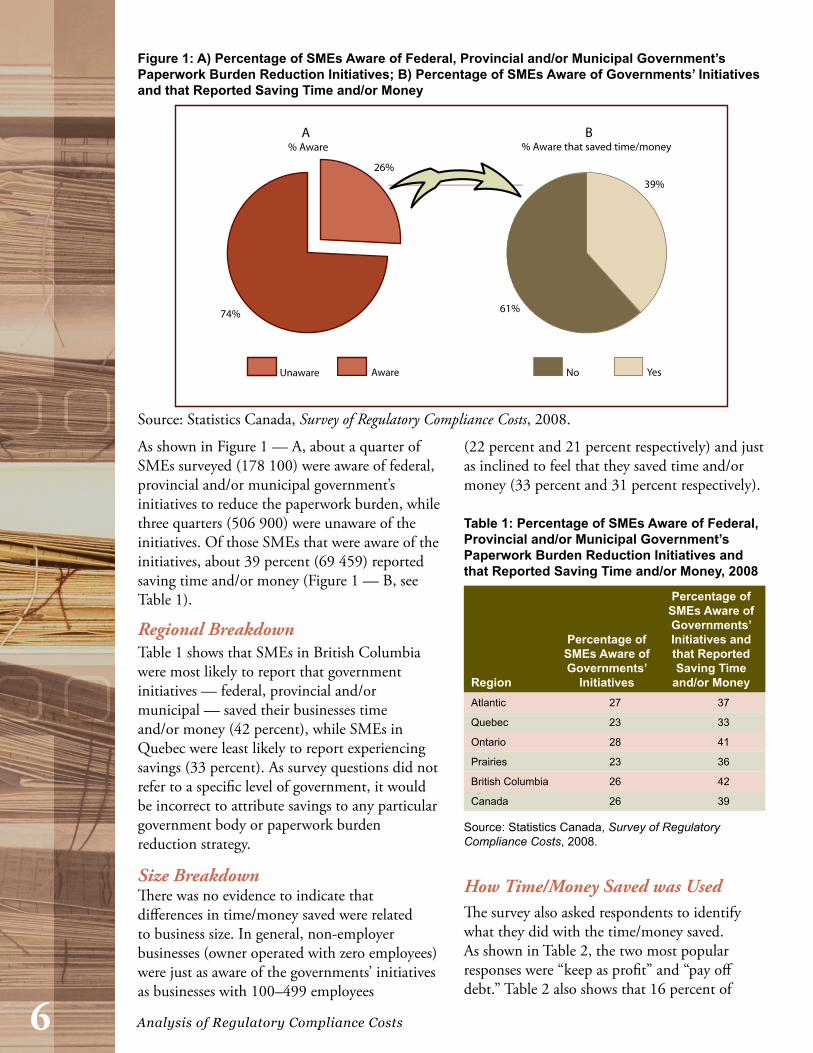
As shown in Figure 1 — A, about a quarter of SMEs surveyed (178 100) were aware of federal, provincial and/or municipal government’s initiatives to reduce the paperwork burden, while three quarters (506 900) were unaware of the initiatives. Of those SMEs that were aware of the initiatives, about 39 percent (69 459) reported saving time and/or money (Figure 1 — B, see Table 1).
Regional BreakdownTable 1 shows that SMEs in British Columbia were most likely to report that government initiatives — federal, provincial and/or municipal — saved their businesses time and/or money (42 percent), while SMEs in Quebec were least likely to report experiencing savings (33 percent). As survey questions did not refer to a specific level of government, it would be incorrect to attribute savings to any particular government body or paperwork burden reduction strategy.
Size BreakdownThere was no evidence to indicate that differences in time/money saved were related to business size. In general, non-employer businesses (owner operated with zero employees) were just as aware of the governments’ initiatives as businesses with 100–499 employees
(22 percent and 21 percent respectively) and just as inclined to feel that they saved time and/or money (33 percent and 31 percent respectively).
Table 1: Percentage of SMEs Aware of Federal, Provincial and/or Municipal Government’s Paperwork Burden Reduction Initiatives and that Reported Saving Time and/or Money, 2008
Region
Percentage of SMEs Aware of Governments’
Initiatives
Percentage of SMEs Aware of Governments’ Initiatives and that Reported Saving Time
and/or MoneyAtlantic 27 37
Quebec 23 33
Ontario 28 41
Prairies 23 36
British Columbia 26 42
Canada 26 39
Source: Statistics Canada, Survey of Regulatory Compliance Costs, 2008.
How Time/Money Saved was UsedThe survey also asked respondents to identify what they did with the time/money saved. As shown in Table 2, the two most popular responses were “keep as profit” and “pay off debt.” Table 2 also shows that 16 percent of
Figure 1: A) Percentage of SMEs Aware of Federal, Provincial and/or Municipal Government’s Paperwork Burden Reduction Initiatives; B) Percentage of SMEs Aware of Governments’ Initiatives and that Reported Saving Time and/or Money
Unaware Aware No Yes
26%
74% 61%
39%
A B% Aware % Aware that saved time/money
Source: Statistics Canada, Survey of Regulatory Compliance Costs, 2008.

6 Analysis of Regulatory Compliance Costs 7Part I
SMEs used their savings to invest in human and non-human capital. Eight percent of SMEs used their savings to lower prices for consumers, while 18 percent reported using their savings for other purposes. A more detailed examination of the results showed that SMEs’ overall savings behaviour varied by size of business. Savings spent on human and non-human capital generally increase as business size increases, while savings used to lower prices for consumers decrease as business size increases. In addition, larger SMEs were more inclined to use their savings to increase employee compensation (wages, bonuses or other benefits) than smaller SMEs.
Quantity of PaperworkQuantitative evidence-based approaches are essential to understand the size of the paperwork burden and to allow governments to develop solutions that result in tangible improvements for SME owners. The lack of such data makes it difficult for governments to target their burden reduction initiatives in those areas that could potentially provide SMEs with the greatest relief.
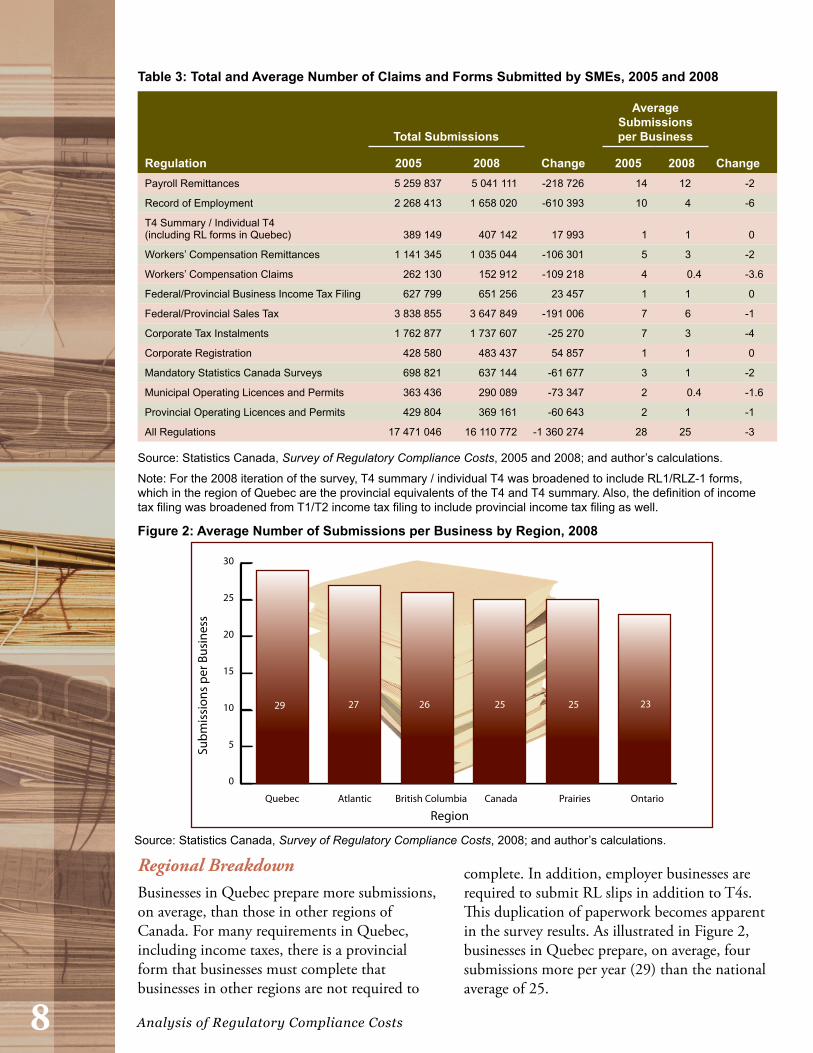
As part of the survey, SMEs were asked to identify, count and report the total number of submissions they made to governments pertaining to the 12 regulations covered in the survey (Table 3).2 In total, 16 110 772 claims and forms were prepared and submitted in 2008 by the 685 000 SMEs included in the survey population, an average of 25 submissions per business. SMEs submitted over five million payroll remittances and over 3.6 million sales tax submissions (averaging 12 payroll remittances and six sales tax submissions per business). SMEs submitted over 1.7 million corporate tax instalments, an average of three instalments per business. Workers’ compensation claims and remittances generated 1 187 956 submissions. An average of one mandatory Statistics Canada survey per business generated another 637 144 submissions. These findings indicate that since 2005, the volume of submissions has decreased by 8 percent. Closer analysis reveals
2 See Annex 2 for a brief description of each of the 12 regulations.
Table 2: Main Use of Time/Money Saved, 2008
Use %Hire additional employees 7
Invest in human capital (education and training) 7
Lower prices 8
Invest in non-human capital (purchase or develop structures, machines and/or equipment) 9
Increase employee compensation (wages, bonuses or benefits) 9
Other 18
Pay off debt 20
Keep as profit 22
Total 100
Source: Statistics Canada, Survey of Regulatory Compliance Costs, 2008.
that most of this decline comes from Records of Employment, payroll remittances, workers’ compensation remittances and claims, and federal/provincial sales taxes.
Just as there was a decline in the total number of claims and forms prepared by businesses, there was also a decline in the average number of submissions per business. As shown in Table 3, in 2008, SMEs that complied with mandatory Statistics Canada surveys made two fewer submissions, SMEs that complied with corporate tax instalments made four fewer submissions and SMEs that complied with Records of Employment made six fewer submissions.
The findings in Table 3 can also be used to identify the major types of paperwork burden faced by Canada’s SMEs. Paperwork burden is sometimes defined by the average number of claims and forms submitted by businesses.3 According to this definition, the three most burdensome regulations in 2008 were payroll remittances, federal/provincial sales taxes and Records of Employment. These findings are consistent with what was observed in 2005.
Generally speaking, disentangling the factors that influence the volume of submissions and attributing for reductions is nearly impossible owing to the simultaneous influences of many factors, including employment trends, business churn, departmental policies and overall economic activity.
3 This definition may be imprecise, and will be addressed in detail in the next briefing.
8 Analysis of Regulatory Compliance Costs 9Part I
Regional BreakdownBusinesses in Quebec prepare more submissions, on average, than those in other regions of Canada. For many requirements in Quebec, including income taxes, there is a provincial form that businesses must complete that businesses in other regions are not required to
complete. In addition, employer businesses are required to submit RL slips in addition to T4s. This duplication of paperwork becomes apparent in the survey results. As illustrated in Figure 2, businesses in Quebec prepare, on average, four submissions more per year (29) than the national average of 25.
Table 3: Total and Average Number of Claims and Forms Submitted by SMEs, 2005 and 2008
Regulation
Total Submissions
Change
Average Submissions per Business
Change2005 2008 2005 2008Payroll Remittances 5 259 837 5 041 111 -218 726 14 12 -2
Record of Employment 2 268 413 1 658 020 -610 393 10 4 -6
T4 Summary / Individual T4 (including RL forms in Quebec) 389 149 407 142 17 993 1 1 0
Workers’ Compensation Remittances 1 141 345 1 035 044 -106 301 5 3 -2
Workers’ Compensation Claims 262 130 152 912 -109 218 4 0.4 -3.6
Federal/Provincial Business Income Tax Filing 627 799 651 256 23 457 1 1 0
Federal/Provincial Sales Tax 3 838 855 3 647 849 -191 006 7 6 -1
Corporate Tax Instalments 1 762 877 1 737 607 -25 270 7 3 -4
Corporate Registration 428 580 483 437 54 857 1 1 0
Mandatory Statistics Canada Surveys 698 821 637 144 -61 677 3 1 -2
Municipal Operating Licences and Permits 363 436 290 089 -73 347 2 0.4 -1.6
Provincial Operating Licences and Permits 429 804 369 161 -60 643 2 1 -1
All Regulations 17 471 046 16 110 772 -1 360 274 28 25 -3
Source: Statistics Canada, Survey of Regulatory Compliance Costs, 2005 and 2008; and author’s calculations.
Note: For the 2008 iteration of the survey, T4 summary / individual T4 was broadened to include RL1/RLZ-1 forms, which in the region of Quebec are the provincial equivalents of the T4 and T4 summary. Also, the definition of income tax filing was broadened from T1/T2 income tax filing to include provincial income tax filing as well.
0
5
10
15
20
25
30
OntarioPrairiesCanadaBritish ColumbiaAtlanticQuebec
Subm
issi
ons
per B
usin
ess
29 27 26 25 25 23
Region
Figure 2: Average Number of Submissions per Business by Region, 2008
Source: Statistics Canada, Survey of Regulatory Compliance Costs, 2008; and author’s calculations.

8 Analysis of Regulatory Compliance Costs 9Part I
Size BreakdownThere is a positive relationship between the size of the workforce and the quantity of paperwork completed by businesses. There is one key reason for this — the larger the business, the greater the quantity of employment-related information requested by governments, and the greater the quantity of paperwork prepared by businesses in response (Figure 3).
Figure 3: Average Number of Submissions per Business by Size of Business, 2008
Source: Statistics Canada, Survey of Regulatory Compliance Costs, 2008; and author’s calculations.
Industry BreakdownBecause the quantity of paperwork is directly linked to workforce size, it is also reasonable to expect that SMEs in more labour-intensive industries will face a greater amount of paperwork than their counterparts in less labour-intensive industries. The five industry sectors included in the survey confirm this, with businesses in the manufacturing industry preparing the greatest amount of paperwork followed by those in the accommodation and food services, retail trade, other services, and professional, scientific and technical services industries (Table 4).
Table 4: Average Number of Submissions per Business by Industry, 2008
Industry
Average Submissions per Business
Average Number of Employees
per BusinessManufacturing 37 13
Accommodation and Food Services 33 12
Retail Trade 30 8
Other Services (except Public Administration) 23 5
Professional, Scientific and Technical Services 19 3
All Businesses 25 6
Source: Statistics Canada, Survey of Regulatory Compliance Costs, 2008; and author’s calculations.
Considerations When interpreting these numbers, it is important to note that they likely underestimate SMEs’ total and average paperwork responsibilities. For instance, there are about 2.3 million business establishments operating in Canada4 and about 685 000 included in the survey population, which means that the paperwork generated by the other 1.6 million establishments is not included in the survey nor is the paperwork related to many environmental and health and safety regulations or most of the paperwork generated at the municipal and provincial levels. Therefore, Canada’s SMEs may face a greater burden than represented by the figures presented here.
4 Statistics Canada, Business Register, 2009.
0
Subm
issi
ons
per B
usin
ess
0
20
40
60
80
100
120
140
160
180
Number of Employees
Canada100–49920–995–191–4
7
25
40
72
162
25
10 Analysis of Regulatory Compliance Costs 11Part I
How the Paperwork Gets DoneOne of the primary goals of the Survey of Regulatory Compliance Costs is to improve governments’ understanding of how SMEs comply with paperwork. Insights from SMEs regarding the methods in which they “prepare” their claims and forms, and “submit” their claims and forms, is key in achieving this goal.
External Service Provider Assistance with Paperwork ComplianceAn important issue to consider when examining the implications of paperwork compliance on businesses is the extent to which they rely on external service providers, such as accountants, tax specialists and payroll service providers. SMEs were asked to identify those regulations
for which they required external service provider assistance to prepare the majority of their claims and forms.
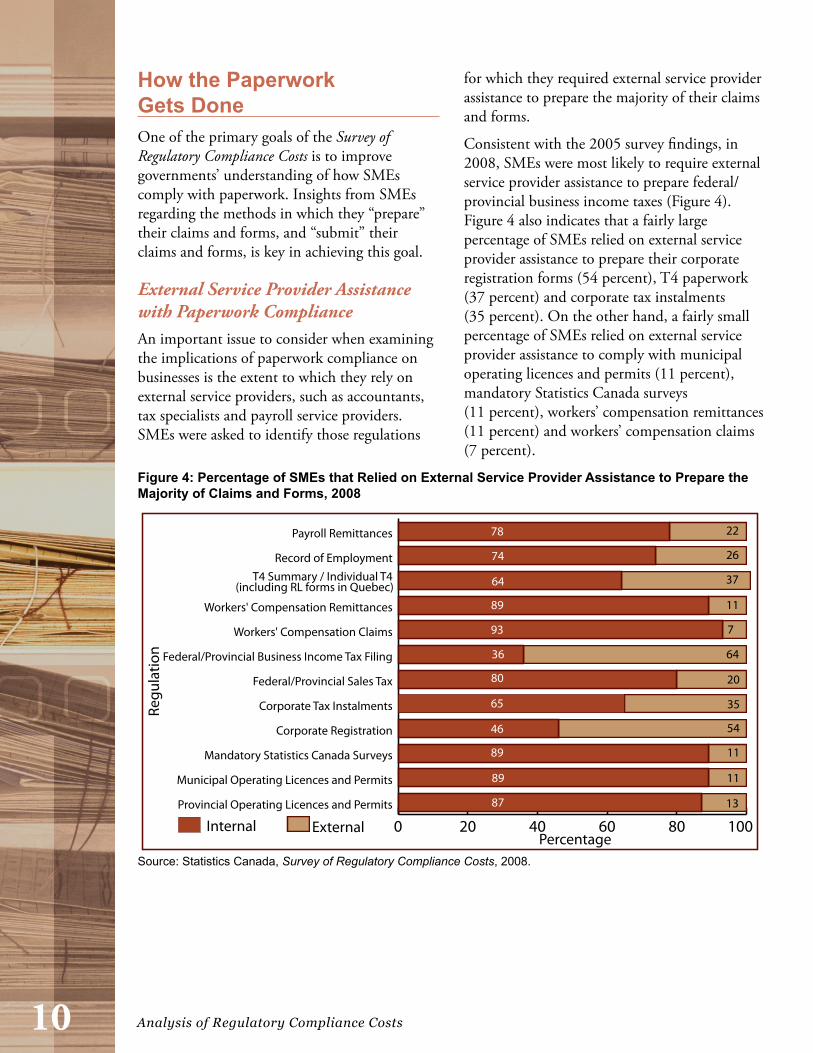
Consistent with the 2005 survey findings, in 2008, SMEs were most likely to require external service provider assistance to prepare federal/provincial business income taxes (Figure 4). Figure 4 also indicates that a fairly large percentage of SMEs relied on external service provider assistance to prepare their corporate registration forms (54 percent), T4 paperwork (37 percent) and corporate tax instalments (35 percent). On the other hand, a fairly small percentage of SMEs relied on external service provider assistance to comply with municipal operating licences and permits (11 percent), mandatory Statistics Canada surveys (11 percent), workers’ compensation remittances (11 percent) and workers’ compensation claims (7 percent).
Figure 4: Percentage of SMEs that Relied on External Service Provider Assistance to Prepare the Majority of Claims and Forms, 2008
Source: Statistics Canada, Survey of Regulatory Compliance Costs, 2008.
0 20 40 60 80 100External InternalProvincial Operating Licences and Permits
Municipal Operating Licences and Permits
Mandatory Statistics Canada Surveys
Corporate Registration
Corporate Tax Instalments
Federal/Provincial Sales Tax
Federal/Provincial Business Income Tax Filing
Workers' Compensation Claims
Workers' Compensation Remittances
T4 Summary / Individual T4Record of Employment
Payroll Remittances
Regu
latio
n
78 22
74 26
64 37
89 11
93 7
36 64
80 20
65 35
46 54
89 11
89 11
87 13
(including RL forms in Quebec)
Percentage
10 Analysis of Regulatory Compliance Costs 11Part I
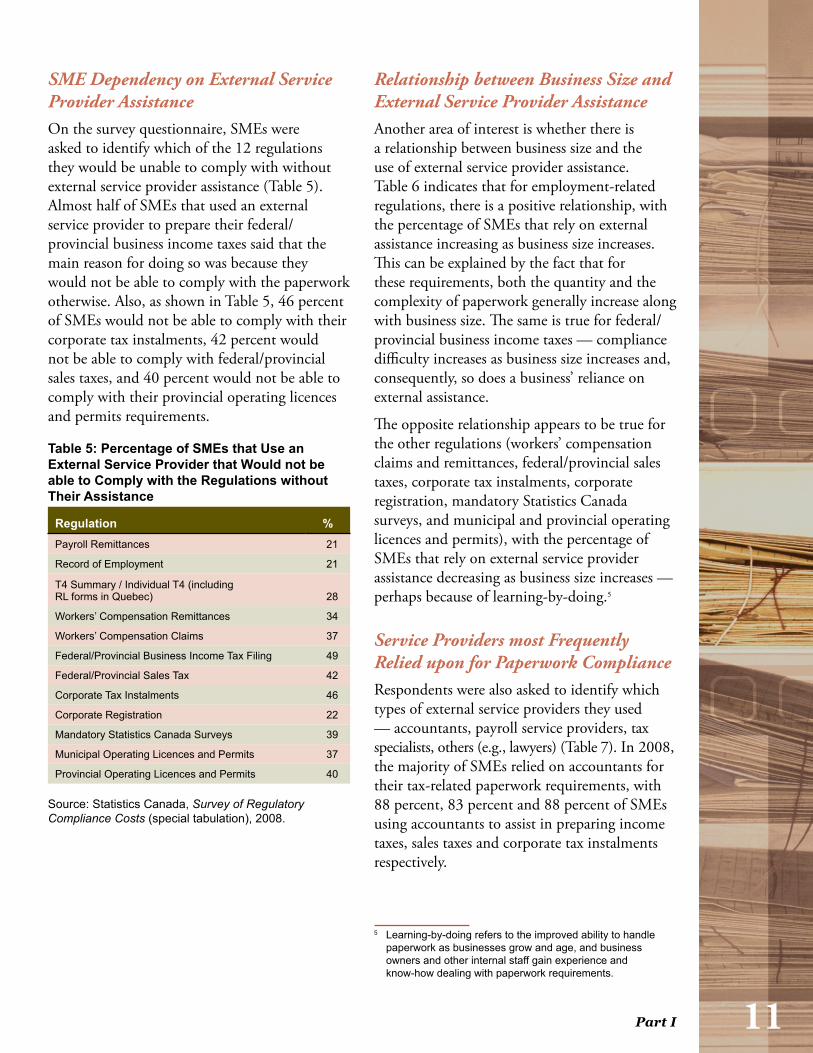
SME Dependency on External Service Provider AssistanceOn the survey questionnaire, SMEs were asked to identify which of the 12 regulations they would be unable to comply with without external service provider assistance (Table 5). Almost half of SMEs that used an external service provider to prepare their federal/provincial business income taxes said that the main reason for doing so was because they would not be able to comply with the paperwork otherwise. Also, as shown in Table 5, 46 percent of SMEs would not be able to comply with their corporate tax instalments, 42 percent would not be able to comply with federal/provincial sales taxes, and 40 percent would not be able to comply with their provincial operating licences and permits requirements.
Table 5: Percentage of SMEs that Use an External Service Provider that Would not be able to Comply with the Regulations without Their Assistance
Regulation % Payroll Remittances 21
Record of Employment 21
T4 Summary / Individual T4 (including RL forms in Quebec) 28
Workers’ Compensation Remittances 34
Workers’ Compensation Claims 37
Federal/Provincial Business Income Tax Filing 49
Federal/Provincial Sales Tax 42
Corporate Tax Instalments 46
Corporate Registration 22
Mandatory Statistics Canada Surveys 39
Municipal Operating Licences and Permits 37
Provincial Operating Licences and Permits 40
Source: Statistics Canada, Survey of Regulatory Compliance Costs (special tabulation), 2008.
Relationship between Business Size and External Service Provider AssistanceAnother area of interest is whether there is a relationship between business size and the use of external service provider assistance. Table 6 indicates that for employment-related regulations, there is a positive relationship, with the percentage of SMEs that rely on external assistance increasing as business size increases. This can be explained by the fact that for these requirements, both the quantity and the complexity of paperwork generally increase along with business size. The same is true for federal/provincial business income taxes — compliance difficulty increases as business size increases and, consequently, so does a business’ reliance on external assistance.
The opposite relationship appears to be true for the other regulations (workers’ compensation claims and remittances, federal/provincial sales taxes, corporate tax instalments, corporate registration, mandatory Statistics Canada surveys, and municipal and provincial operating licences and permits), with the percentage of SMEs that rely on external service provider assistance decreasing as business size increases — perhaps because of learning-by-doing.5
Service Providers most Frequently Relied upon for Paperwork ComplianceRespondents were also asked to identify which types of external service providers they used — accountants, payroll service providers, tax specialists, others (e.g., lawyers) (Table 7). In 2008, the majority of SMEs relied on accountants for their tax-related paperwork requirements, with 88 percent, 83 percent and 88 percent of SMEs using accountants to assist in preparing income taxes, sales taxes and corporate tax instalments respectively.
5 Learning-by-doing refers to the improved ability to handle paperwork as businesses grow and age, and business owners and other internal staff gain experience and know-how dealing with paperwork requirements.

12 Analysis of Regulatory Compliance Costs 13Part I
Table 6: Percentage of SMEs that Relied on External Service Provider Assistance to Prepare the Majority of Claims and Forms by Size of Business, 2008
Regulation
Business Size (number of employees)
0 1–4 5–19 20–99 100–499 All
SizesPayroll Remittances … 15 24 41 56 22
Record of Employment … 23 25 34 43 26
T4 Summary / Individual T4 (including RL forms in Quebec) … 34 36 47 58 37
Workers’ Compensation Remittances … 12 11 7 7 11
Workers’ Compensation Claims … 12 8 5 4 7
Federal/Provincial Business Income Tax Filing 61 62 69 75 75 64
Federal/Provincial Sales Tax 22 22 16 10 9 20
Corporate Tax Instalments 38 36 35 26 24 35
Corporate Registration 58 51 54 52 51 54
Mandatory Statistics Canada Surveys 13 13 10 5 6 11
Municipal Operating Licences and Permits 12 10 14 6 4 11
Provincial Operating Licences and Permits 14 15 14 8 4 13
Source: Statistics Canada, Survey of Regulatory Compliance Costs, 2008.
Table 7: Type of External Service Providers Used (%) by Regulation, 2008
Regulation
Service Provider
AccountantsPayroll Service
Provider
Tax Preparation
ServicesOther Service
ProviderPayroll Remittances 56 33 4 10
Record of Employment 69 21 5 8
T4 Summary / Individual T4 (including RL forms in Quebec) 57 33 4 8
Workers’ Compensation Remittances 75 12 3 11
Workers’ Compensation Claims 75 11 4 11
Federal/Provincial Business Income Tax Filing 88 2 9 5
Federal/Provincial Sales Tax 83 2 7 10
Corporate Tax Instalments 88 2 6 7
Corporate Registration 70 1 4 26
Mandatory Statistics Canada Surveys 79 3 4 14
Municipal Operating Licences and Permits 74 3 5 19
Provincial Operating Licences and Permits 75 2 5 18
Source: Statistics Canada, Survey of Regulatory Compliance Costs (special tabulation), 2008.
Note: Totals may not add to 100 percent when more than one service provider was used for compliance.

12 Analysis of Regulatory Compliance Costs 13Part I
Table 7 also shows that the majority of SMEs relied on accountants when complying with employment-related regulations.
Looking at the results individually for each service provider, Table 7 also indicates that payroll service providers are most frequently used to prepare payroll remittances, records of employment and T4 paperwork; tax preparation service providers are most frequently used to prepare taxes; and other service providers, such as lawyers and business consultants, are most frequently used to meet corporate registration and municipal and provincial operating licence and permit requirements.
Electronic Methods of Paperwork ComplianceMethods of Preparation
Various electronic compliance methods have been developed by both governments and private software vendors to facilitate the handling of paperwork requirements and to
simplify business-to-government interactions. In fact, electronic compliance methods are a key mechanism through which governments are implementing many of their paperwork burden reduction initiatives.
Despite the improved availability of electronic compliance methods, the Survey of Regulatory Compliance Costs discovered that SMEs that do not rely on external service provider assistance still prepare the majority of their claims and forms manually. As illustrated in Table 8, more than 50 percent of SMEs, in 2008, prepared their claims and forms manually for 8 of the 12 regulations covered in the survey (ROEs, workers’ compensation remittances, workers’ compensation claims, corporate tax instalments, corporate registration, mandatory Statistics Canada surveys, municipal operating licences and permits, and provincial operating licences and permits). Municipal operating licences and permits (92 percent), mandatory Statistics Canada surveys (91 percent) and provincial operating licences and permits (86 percent) were the three regulations most commonly prepared manually.
Table 8: Percentage of SMEs that Prepare the Majority of Claims and Forms Manually Using a Computer Application, or Both Manually and Using a Computer Application, 2008
Regulation
Method of Compliance
Manual PreparationComputer
Application
Manual and Computer
ApplicationPayroll Remittances 45 27 29
Record of Employment 58 18 24
T4 Summary / Individual T4 (including RL forms in Quebec) 31 42 27
Workers’ Compensation Remittances 64 15 21
Workers’ Compensation Claims 80 7 13
Federal/Provincial Business Income Tax Filing 36 38 26
Federal/Provincial Sales Tax 48 22 30
Corporate Tax Instalments 61 18 21
Corporate Registration 66 26 9
Mandatory Statistics Canada Surveys 91 2 8
Municipal Operating Licences and Permits 92 4 4
Provincial Operating Licences and Permits 86 9 5
Source: Statistics Canada, Survey of Regulatory Compliance Costs (special tabulation), 2008.
14 Analysis of Regulatory Compliance Costs 15Part I
T4 filing requirements and federal/provincial business income taxes were most commonly prepared electronically, with 69 percent and 64 percent of SMEs using some form of computer application to meet requirements. In general, the larger the business, the more likely it is to use electronic preparation methods. This relationship is most apparent as it relates to compliance with payroll remittances and T4 filing requirements. For instance, about 45 percent of SMEs with 1–4 employees used some form of computer application to prepare payroll remittances and 60 percent to prepare T4s, whereas almost all SMEs with 100–499 employees used computer applications to prepare payroll remittances and T4s (94 percent and 98 percent respectively).
It is important to note that a significant number of claims and forms cannot yet be prepared electronically, with many mandatory Statistics Canada surveys and municipal and provincial operating licence and permit requirements still requiring paper-based submissions.
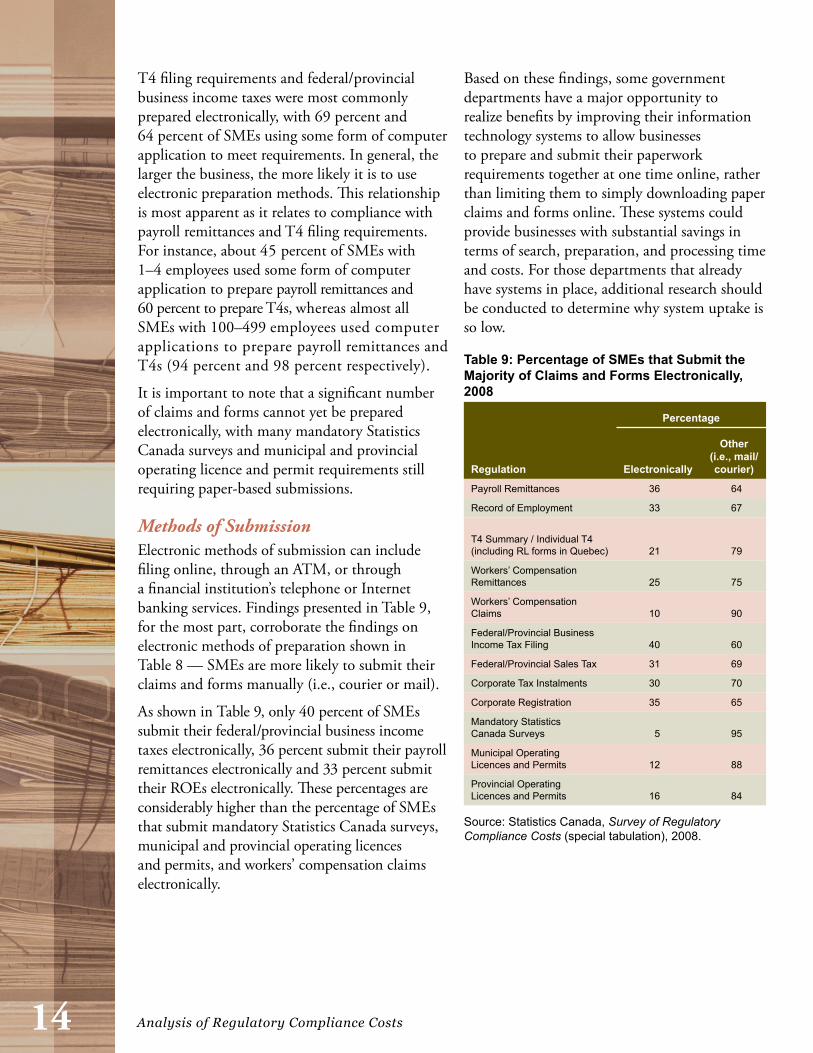
Methods of SubmissionElectronic methods of submission can include filing online, through an ATM, or through a financial institution’s telephone or Internet banking services. Findings presented in Table 9, for the most part, corroborate the findings on electronic methods of preparation shown in Table 8 — SMEs are more likely to submit their claims and forms manually (i.e., courier or mail).
As shown in Table 9, only 40 percent of SMEs submit their federal/provincial business income taxes electronically, 36 percent submit their payroll remittances electronically and 33 percent submit their ROEs electronically. These percentages are considerably higher than the percentage of SMEs that submit mandatory Statistics Canada surveys, municipal and provincial operating licences and permits, and workers’ compensation claims electronically.
Based on these findings, some government departments have a major opportunity to realize benefits by improving their information technology systems to allow businesses to prepare and submit their paperwork requirements together at one time online, rather than limiting them to simply downloading paper claims and forms online. These systems could provide businesses with substantial savings in terms of search, preparation, and processing time and costs. For those departments that already have systems in place, additional research should be conducted to determine why system uptake is so low.
Table 9: Percentage of SMEs that Submit the Majority of Claims and Forms Electronically, 2008
Regulation
Percentage
Electronically
Other (i.e., mail/courier)
Payroll Remittances 36 64
Record of Employment 33 67
T4 Summary / Individual T4 (including RL forms in Quebec) 21 79
Workers’ Compensation Remittances 25 75
Workers’ Compensation Claims 10 90
Federal/Provincial Business Income Tax Filing 40 60
Federal/Provincial Sales Tax 31 69
Corporate Tax Instalments 30 70
Corporate Registration 35 65
Mandatory Statistics Canada Surveys 5 95
Municipal Operating Licences and Permits 12 88
Provincial Operating Licences and Permits 16 84
Source: Statistics Canada, Survey of Regulatory Compliance Costs (special tabulation), 2008.
14 Analysis of Regulatory Compliance Costs 15Part I
Next Survey BriefingPaperwork burden reduction is an important issue for government bodies in Canada. Results from the 2005 Survey of Regulatory Compliance Costs provided a benchmark of the quantity of paperwork handled by SMEs covered in the survey. As illustrated in this briefing, the quantity of paperwork handled by SMEs has decreased since 2005. Opinions differ among SMEs regarding whether paperwork burden reduction initiatives implemented over the last three years (2006–2008) have helped save them time and/or money. This is to be expected given that most paperwork burden reduction initiatives do not affect all business sizes and all industries in the same way.
A key finding of this briefing is that government information and communication technology systems need to be updated to allow SMEs to prepare and submit their paperwork claims and forms electronically. Until now, many departments’ information technology systems have limited SMEs to mainly downloading paper claims and forms online.
This briefing has focused on the nature of paperwork compliance. Another briefing will be released in 2010 that will focus on the cost of and time spent on compliance.

16 Analysis of Regulatory Compliance Costs 17Part I
Annex 1: Survey MethodologyThe Small Business and Special Surveys Division of Statistics Canada designed and administered the survey questionnaire. Over 30 000 SMEs were selected to participate in the main survey questionnaire and over 5000 professional service providers to participate in a supplementary survey questionnaire. Participants were selected from Statistics Canada’s Business Register using a stratified random-sampling procedure that ensured that the desired regions, industries and business sizes were properly represented.
Business owners/respondents were first contacted by phone, at which time the purpose of the survey was explained and procedures for completing the survey were discussed. Survey questionnaires were then sent out to participants. Upon receiving the surveys, the next step was for respondents to fill out the questionnaires with information on their paperwork activities. To support this, the surveys were divided into separate sections. This allowed Statistics Canada to capture data on both paperwork completed within the firm and paperwork completed using an outside professional. In addition to basic questions on volume, methods of preparation and methods of submission, the survey questionnaires included questions on time and cost per submission, cost savings, reinvestment, compliance difficulty and simplification.
Table A1: Distribution of SMEs by Region and Size of Business
Number of EmployeesRegion (percentage)
Atlantic Quebec Ontario Prairies British Columbia Canada0 34 38 40 34 36 38
1–4 35 33 36 38 35 35
5–19 24 20 18 20 22 20
20–99 8 8 6 7 7 7
100–499 1 1 1 1 1 1
Total 100 100 100 100 100 100
Source: Statistics Canada, Survey of Regulatory Compliance Costs, 2008.
Questions on time and cost represented the bulk of the survey. Questions on cost savings asked respondents to explain whether the governments’ efforts to reduce the paperwork burden have helped. The reinvestment questions looked at two types of investment: investment in human capital and non-human capital. Also, a general attempt was made to learn about SMEs’ overall savings behaviour. Data on compliance difficulty was generated from the questions on methods of preparation. The question on simplification was asked to identify possible areas for reform.
To ensure high data quality, an attempt was made by Statistics Canada to obtain a 27–30 percent response rate, with a 29 percent response rate being achieved. Statistics Canada reviewed the data for reporting errors, oddities and inconsistencies. This was followed by telephone calls to respondents to discuss errors and validate the information.

16 Analysis of Regulatory Compliance Costs 17Part I
Annex 2: Regulations Covered in the Survey of Regulatory Compliance Costs
Only 12 government regulations considered to have the greatest impact on the largest number of SMEs across Canada were included in the Survey of Regulatory Compliance Costs.
Each regulation is discussed below.
Payroll remittances: Employer businesses are responsible for deducting Canada Pension Plan (CPP) contributions, Employment Insurance (EI) premiums and income taxes from their employees’ incomes and remitting them along with a remittance voucher to the Government of Canada.
Record of Employment (ROE): When an employee leaves a job, the employer must submit an official Government of Canada Record of Employment that describes how long the employee worked at the firm and how much income he/she earned while employed. Human Resources and Skills Development Canada (HRSDC) then uses this information to determine whether or not the employee qualifies for EI benefits, the benefit rate and the duration of his/her benefit term.
T4 and RL forms: A T4 (RL in Quebec) is an information slip that employer businesses send to their employees at the end of the tax year. It reports the employee’s earnings and the total amount of income taxes, Canada (Quebec) Pension Plan contributions, Employment Insurance premiums, and union dues deducted and remitted to the government during the year.
T4 summary and RLZ-1: A T4 summary (RLZ-1 in Quebec) is an information slip that employer businesses send to the Canada Revenue Agency (Revenue Quebec) at the end of the tax year. It reports the totals of the amounts reported on all individual T4 (RL) slips.
Workers’ compensation remittances: A workers’ compensation remittance is a payment made by a business to one of the Canadian Workers’ Compensation Boards in exchange for workplace insurance coverage. This insurance coverage provides employees who become ill or are injured while on the job with medical coverage and income replacement. It also protects businesses from being sued by employees for the workplace conditions that potentially caused the illness or injury. An employer business must file a workers’ compensation remittance form each time it makes a payment to its regional workers’ compensation board.
Workers’ compensation claims: When an employee becomes ill or is injured while at work, the employer must complete an incident and injury report within three to five business days of becoming aware of the illness or injury and send it to the workers’ compensation board within the region in which the business operates. The workers’ compensation board then reviews the report, along with both an employee report and a doctor’s report on the injury, to determine whether or not the illness or injury was caused while at work and whether it had something to do with the employee’s job.
Federal/provincial business income tax filing: All businesses that operate in Canada or earn an income in Canada must pay income taxes and file an annual income tax return with the federal government. Unincorporated businesses must file a T1 income tax return. Incorporated businesses must file a T2 income tax return. Also, depending on the region, businesses might have to file a provincial income tax return in addition to their federal return. These returns are used by businesses to report the income that was earned during the year, from all sources, to calculate any deductions and/or tax credits received during the year, and to determine, according to federal and provincial tax laws, whether there is any tax liability owed to the government, or any tax refund owed from the government.
18 Analysis of Regulatory Compliance Costs
GST/PST/HST: Almost everything that is bought is taxed. Federal and provincial sales taxes, GST and PST are types of consumption taxes that are added to the purchase price of goods or services at the time of purchase and are usually set as a percentage of the selling price. Most goods are subject to federal/provincial sales taxes, although some are exempt. Consumers are responsible for paying the taxes; businesses are responsible for collecting the taxes and remitting them to the government. Generally, businesses must remit taxes and file sales tax returns on a regular basis.
Corporate tax instalments: Generally, corporations have to pay their federal, provincial or harmonized federal–provincial income taxes in instalments, which means that they have to make regular payments of a portion of the total amount of income taxes that would be due at the end of the tax year. Federal and provincial/territorial income tax acts require corporations to make these instalment payments so that businesses are treated in the same way as taxpayers who have tax deducted automatically from their paycheques during the year. Each time a business makes an instalment payment, it is generally required to file a remittance voucher.
Corporate registration: In Canada, the process of registering a business as a corporation is called “incorporation.” Incorporation involves the creation of a legal entity that is recognized by law as a fictitious person. The legal rights and obligations of this entity include (a) the right to sue or be sued, (b) the right to own and dispose of assets, (c) the right to hire workers, (d) the right to enter into contracts, and (e) the right to manage its own internal affairs. In Canada, businesses have two options for incorporation: provincially or federally, and thus may be subject to federal or provincial corporate law. The act of incorporation involves the completion and submission of articles of incorporation, and any other supporting documentation with the registering authority, and the submission of a registration fee.
Mandatory Statistics Canada surveys: Recipients of a mandatory Statistics Canada survey are legally required to answer the survey questions and return it to Statistics Canada within the allotted period of time.
Municipal operating licences and permits: Municipal operating licences and permits are legal documents and agreements awarded by municipal governments to businesses granting them the legal right to manage and/or undertake certain work in a specific region and/or industry. Applying for municipal licences always requires the completion and submission of various government forms.
Provincial operating licences and permits: One of the first steps that new and established businesses must take to fulfill their legal responsibilities to provincial governments is to determine which provincial licences and/or permits they require in order to conduct business legally within the boundaries of the region. Because each province sets its own licensing requirements, there is no uniform set of licences/permits that businesses are required to acquire. Nonetheless, completing government forms in order to obtain the licences/permits is almost always necessary.
18 Analysis of Regulatory Compliance Costs 19
This paper was authored by Daniel Seens. Daniel is an economist who works in the research group of the Small Business and Tourism Branch of Industry Canada.
For additional copies of this publication, please contact:
Publishing and Depository Services Public Works and Government Services Canada Ottawa ON K1A 0S5
Telephone (toll-free): 1-800-635-7943 (Canada and U.S.) Telephone (local): 613-941-5995 TTY: 1-800-465-7735 Fax (toll-free): 1-800-565-7757 (Canada and U.S.) Fax (local): 613-954-5779 Email: [email protected] Website: www.publications.gc.ca
This publication is available upon request in accessible formats. Contact:
Multimedia Services Section Communications and Marketing Branch Industry Canada Room 264D, West Tower 235 Queen Street Ottawa ON K1A 0H5
Telephone: 613-995-8552 Fax: 613-947-7155 Email: [email protected]
This publication is also available online at www.reducingpaperburden.gc.ca
Permission to Reproduce Except as otherwise specifically noted, the information in this publication may be reproduced, in part or in whole and by any means, without charge or further permission from Industry Canada, provided that due diligence is exercised in ensuring the accuracy of the information reproduced; that Industry Canada is identified as the source institution; and that the reproduction is not represented as an official version of the information reproduced, nor as having been made in affiliation with, or with the endorsement of, Industry Canada.
For permission to reproduce the information in this publication for commercial redistribution, please email [email protected].
Cat. No. Iu188-101/1-2010E-PDF ISSN 978-1-100-15797-9 60776
Aussi offert en français sous le titre : Analyse du coût de la conformité à la réglementation : Partie I Économie de temps et d’argent, volume de documents à produire et méthodes de conformité.