analysis of roll gap heat transfers in hot steel strip rolling through roll
TRANSCRIPT
HAL Id: hal-00668233https://hal-enpc.archives-ouvertes.fr/hal-00668233
Submitted on 9 Feb 2012
HAL is a multi-disciplinary open accessarchive for the deposit and dissemination of sci-entific research documents, whether they are pub-lished or not. The documents may come fromteaching and research institutions in France orabroad, or from public or private research centers.
L’archive ouverte pluridisciplinaire HAL, estdestinée au dépôt et à la diffusion de documentsscientifiques de niveau recherche, publiés ou non,émanant des établissements d’enseignement et derecherche français ou étrangers, des laboratoirespublics ou privés.
Analysis of roll gap heat transfers in hot steel striprolling through roll temperature sensors and heat
transfer modelsDaniel Weisz-Patrault, Alain Ehrlacher, Nicolas Legrand, Nathalie Labbe,
Jaroslav Horsky, Tomas Luks
To cite this version:Daniel Weisz-Patrault, Alain Ehrlacher, Nicolas Legrand, Nathalie Labbe, Jaroslav Horsky, etal.. Analysis of roll gap heat transfers in hot steel strip rolling through roll temperaturesensors and heat transfer models. Key Engineering Materials, 2012, 504-506, pp.1043-1048.<10.4028/www.scientific.net/KEM.504-506.1043>. <hal-00668233>
Analysis of roll gap heat transfers in hot steel strip rolling
through roll temperature sensors and heat transfer models
N. Legrand1,a, N. Labbe1,b D. Weisz-Patrault2,c,
A. Ehrlacher2,d, T. Luks3,e, J. Horsky3,f 1ArcelorMittal Maizières Research, Maizieres-les-Metz, France
2U.R. Navier, Ecole des Ponts et Chaussées, Marne la Vallée, France
3Brno University of Technology, Brno, Czech republic
Keywords: hot strip rolling, roll bite heat transfer, inverse thermal analysis, thermal fatigue
Abstract. This paper presents an analysis of roll bite heat transfers during pilot hot steel strip
rolling. Two types of temperature sensors (drilled and slot sensors) implemented near roll surface
are used with heat transfer models to identify interfacial heat flux, roll surface temperature and Heat
Transfer Coefficient HTCroll-bite in the roll bite. It is shown that:
- the slot type sensor is more efficient than the drilled type sensor to capture correctly fast roll
temperature changes and heat fluxes in the bite during hot rolling but its life’s duration is shorter.
- average HTCroll-bite is within the range 15-26 kW/m2/K: the higher the strip reduction (e.g.
contact pressure) is, the higher the HTCroll-bite is.
- scale thickness at strip surface tends to decrease heat transfers in the bite from strip to roll.
- HTCroll-bite is not uniform along the roll-strip contact but seems proportional to contact pressure.
- this non uniform HTCroll-bite along the contact could contribute to decrease thermal shock (so roll
thermal fatigue) when the work roll enters the roll bite, in comparison to a uniform HTCroll-bite.
- Heat transfer in the roll bite is mainly controlled by heat conduction due to the huge roll-strip
temperature difference, while heat dissipated by friction at roll-strip interface seems negligible on
these heat transfers.
Introduction
In hot rolling, thermal sollicitations of rolls are characterized by cyclic thermal shocks in the roll
bite due to the cyclic contact between a strip at ~1000°C and a roll at 50-100°C. This cyclic thermal
loading, amplified with work roll water cooling, is responsible for roll degradation by thermal
fatigue that strongly shorten rolls life. A decrease of roll thermal fatigue requires a better knowledge
of real peaks of temperature and heat transfers in the roll bite that are the source of the roll thermal
shock. Currently, these roll bite peaks are approximated with Heat Transfer Coefficients ‘HTC’
macroscopically tuned on measured mill data. This current way of identification is sufficient to
optimize mill cooling capacity where only a knowledge of the average heat transfer within and from
the roll is needed. However, to determine roll degradation by thermal fatigue, an accurate and local
evaluation of these roll bite peaks of temperature and heat transfers is necessary: this is the first aim
of this paper. Furthermore, a huge amount of literature work has been focused on HTC and heat flux
identification by inverse models during hot rolling [1]. However, the long computing time
associated to these models does not allow a real time interpretation of measurements necessary for
on line control of rolling mills. The second aim of this paper is thus to show the applicability of fast
models for heat transfers identification quasi in real time.
Hot pilot mill trials
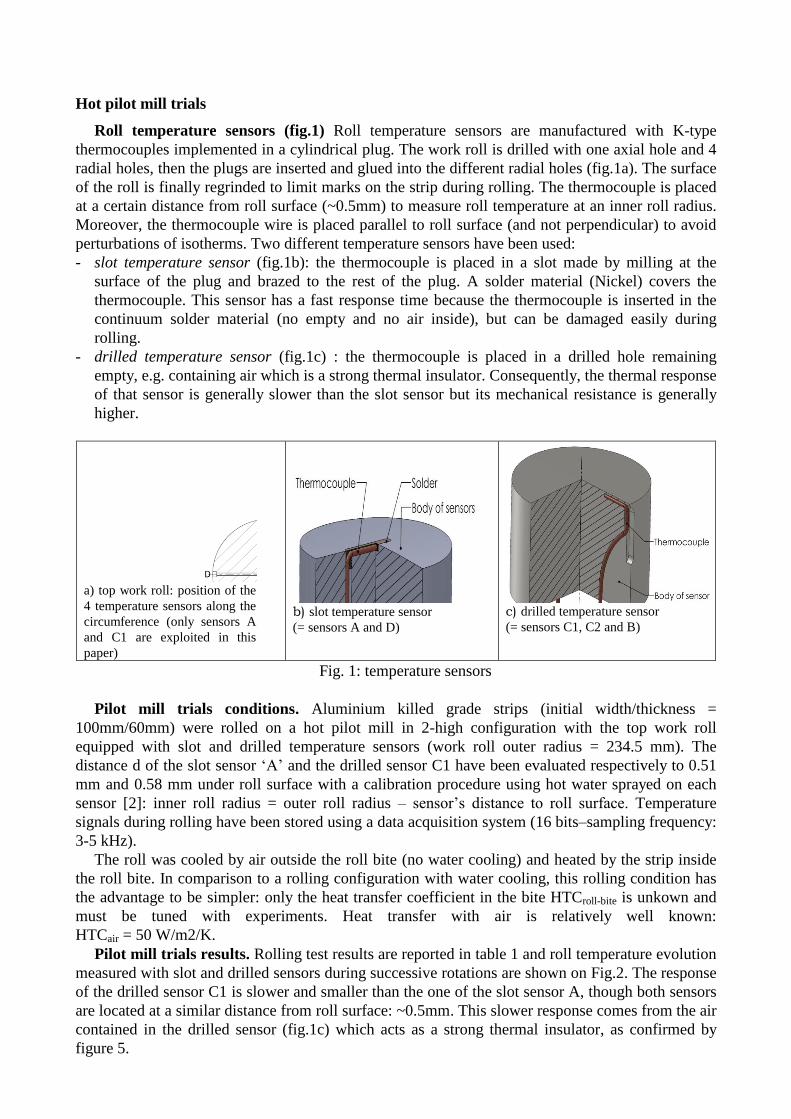
Roll temperature sensors (fig.1) Roll temperature sensors are manufactured with K-type
thermocouples implemented in a cylindrical plug. The work roll is drilled with one axial hole and 4
radial holes, then the plugs are inserted and glued into the different radial holes (fig.1a). The surface
of the roll is finally regrinded to limit marks on the strip during rolling. The thermocouple is placed
at a certain distance from roll surface (~0.5mm) to measure roll temperature at an inner roll radius.
Moreover, the thermocouple wire is placed parallel to roll surface (and not perpendicular) to avoid
perturbations of isotherms. Two different temperature sensors have been used:
- slot temperature sensor (fig.1b): the thermocouple is placed in a slot made by milling at the
surface of the plug and brazed to the rest of the plug. A solder material (Nickel) covers the
thermocouple. This sensor has a fast response time because the thermocouple is inserted in the
continuum solder material (no empty and no air inside), but can be damaged easily during
rolling.
- drilled temperature sensor (fig.1c) : the thermocouple is placed in a drilled hole remaining
empty, e.g. containing air which is a strong thermal insulator. Consequently, the thermal response
of that sensor is generally slower than the slot sensor but its mechanical resistance is generally
higher.
C1
C2
C
B
C1
C2
C
B
a) top work roll: position of the
4 temperature sensors along the
circumference (only sensors A
and C1 are exploited in this
paper)
b) slot temperature sensor
(= sensors A and D)
c) drilled temperature sensor
(= sensors C1, C2 and B)
Fig. 1: temperature sensors
Pilot mill trials conditions. Aluminium killed grade strips (initial width/thickness =
100mm/60mm) were rolled on a hot pilot mill in 2-high configuration with the top work roll
equipped with slot and drilled temperature sensors (work roll outer radius = 234.5 mm). The
distance d of the slot sensor ‘A’ and the drilled sensor C1 have been evaluated respectively to 0.51
mm and 0.58 mm under roll surface with a calibration procedure using hot water sprayed on each
sensor [2]: inner roll radius = outer roll radius – sensor’s distance to roll surface. Temperature
signals during rolling have been stored using a data acquisition system (16 bits–sampling frequency:
3-5 kHz).
The roll was cooled by air outside the roll bite (no water cooling) and heated by the strip inside
the roll bite. In comparison to a rolling configuration with water cooling, this rolling condition has
the advantage to be simpler: only the heat transfer coefficient in the bite HTCroll-bite is unkown and
must be tuned with experiments. Heat transfer with air is relatively well known:
HTCair = 50 W/m2/K.
Pilot mill trials results. Rolling test results are reported in table 1 and roll temperature evolution
measured with slot and drilled sensors during successive rotations are shown on Fig.2. The response
of the drilled sensor C1 is slower and smaller than the one of the slot sensor A, though both sensors
are located at a similar distance from roll surface: ~0.5mm. This slower response comes from the air
contained in the drilled sensor (fig.1c) which acts as a strong thermal insulator, as confirmed by
figure 5.
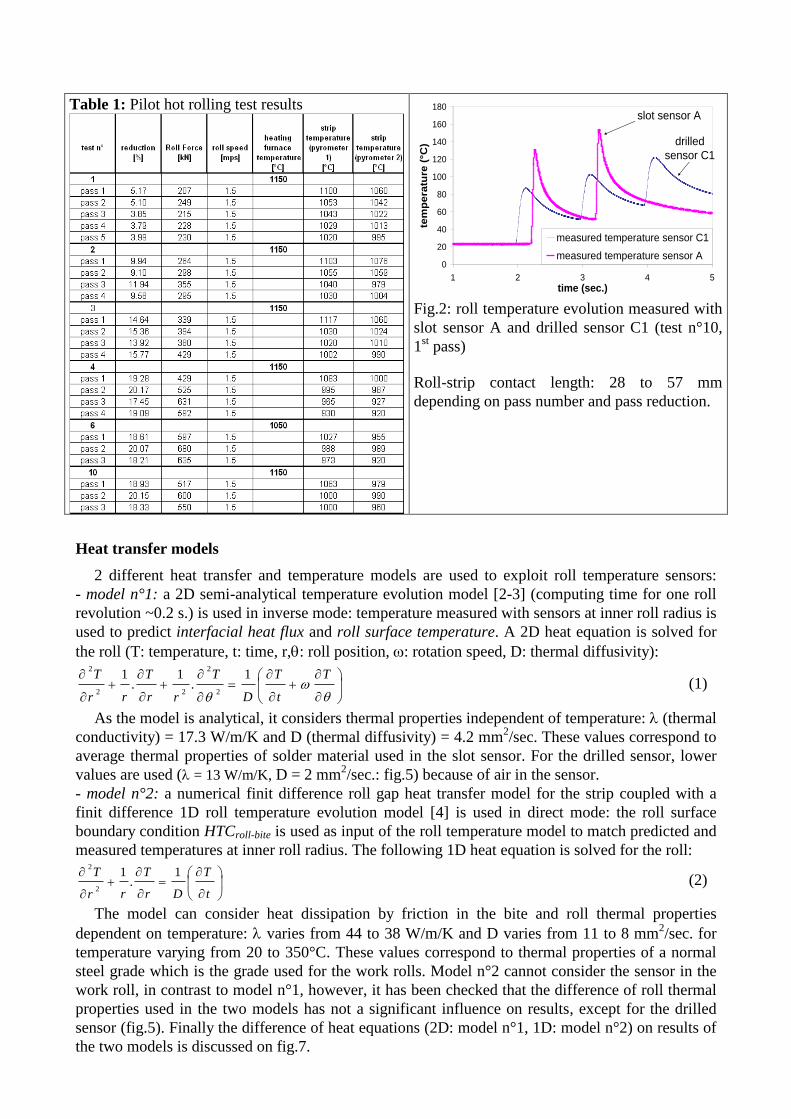
Table 1: Pilot hot rolling test results
0
20
40
60
80
100
120
140
160
180
1 2 3 4 5
time (sec.)
tem
pe
ratu
re (
°C)
measured temperature sensor C1
measured temperature sensor A
slot sensor A
drilled
sensor C1
Fig.2: roll temperature evolution measured with
slot sensor A and drilled sensor C1 (test n°10,
1st pass)
Roll-strip contact length: 28 to 57 mm
depending on pass number and pass reduction.
Heat transfer models
2 different heat transfer and temperature models are used to exploit roll temperature sensors:
- model n°1: a 2D semi-analytical temperature evolution model [2-3] (computing time for one roll
revolution ~0.2 s.) is used in inverse mode: temperature measured with sensors at inner roll radius is
used to predict interfacial heat flux and roll surface temperature. A 2D heat equation is solved for
the roll (T: temperature, t: time, r,: roll position, : rotation speed, D: thermal diffusivity):
T
t
T
D
T
rr
T
rr
T 1.
1.
1
2
2
22
2
(1)
As the model is analytical, it considers thermal properties independent of temperature: (thermal
conductivity) = 17.3 W/m/K and D (thermal diffusivity) = 4.2 mm2/sec. These values correspond to
average thermal properties of solder material used in the slot sensor. For the drilled sensor, lower
values are used ( = 13 W/m/K, D = 2 mm2/sec.: fig.5) because of air in the sensor.
- model n°2: a numerical finit difference roll gap heat transfer model for the strip coupled with a
finit difference 1D roll temperature evolution model [4] is used in direct mode: the roll surface
boundary condition HTCroll-bite is used as input of the roll temperature model to match predicted and
measured temperatures at inner roll radius. The following 1D heat equation is solved for the roll:
t
T
Dr
T
rr
T 1.
1
2
2
(2)
The model can consider heat dissipation by friction in the bite and roll thermal properties
dependent on temperature: varies from 44 to 38 W/m/K and D varies from 11 to 8 mm2/sec. for
temperature varying from 20 to 350°C. These values correspond to thermal properties of a normal
steel grade which is the grade used for the work rolls. Model n°2 cannot consider the sensor in the
work roll, in contrast to model n°1, however, it has been checked that the difference of roll thermal
properties used in the two models has not a significant influence on results, except for the drilled
sensor (fig.5). Finally the difference of heat equations (2D: model n°1, 1D: model n°2) on results of
the two models is discussed on fig.7.
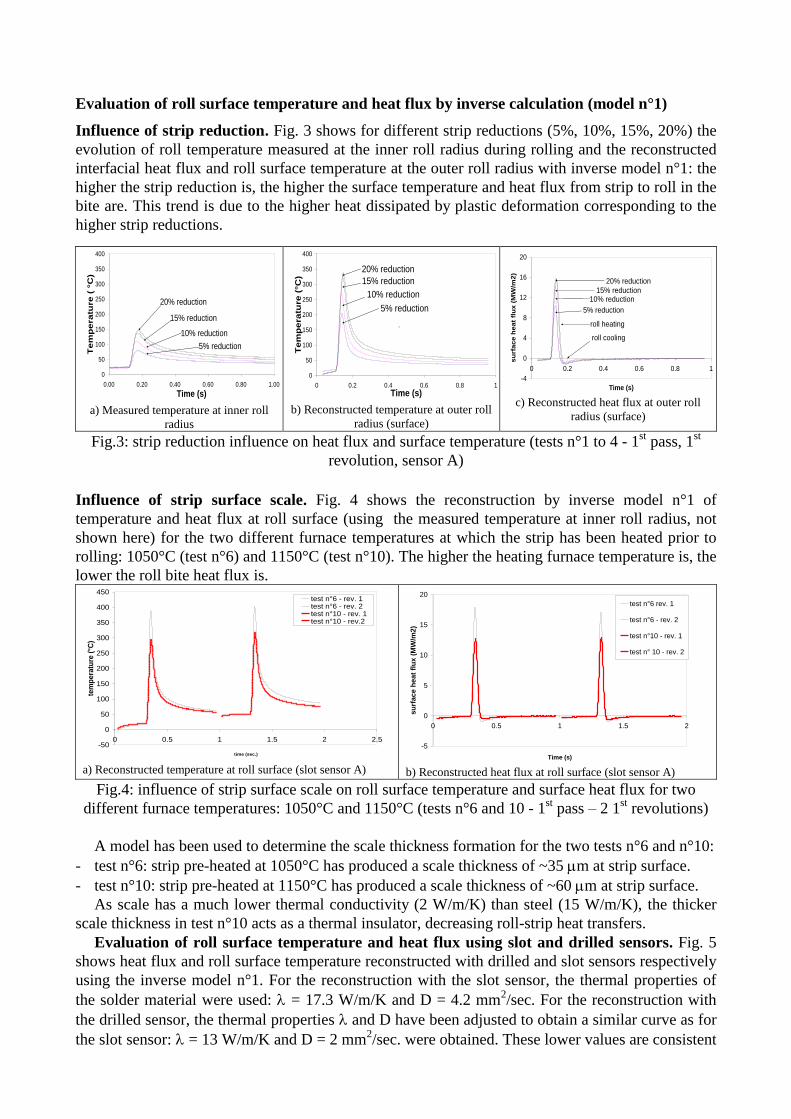
Evaluation of roll surface temperature and heat flux by inverse calculation (model n°1)
Influence of strip reduction. Fig. 3 shows for different strip reductions (5%, 10%, 15%, 20%) the
evolution of roll temperature measured at the inner roll radius during rolling and the reconstructed
interfacial heat flux and roll surface temperature at the outer roll radius with inverse model n°1: the
higher the strip reduction is, the higher the surface temperature and heat flux from strip to roll in the
bite are. This trend is due to the higher heat dissipated by plastic deformation corresponding to the
higher strip reductions.
0
50
100
150
200
250
300
350
400
0.00 0.20 0.40 0.60 0.80 1.00
Time (s)
Tem
peratu
re
( °
C)
20% reduction
15% reduction
10% reduction
5% reduction
a) Measured temperature at inner roll
radius
0
50
100
150
200
250
300
350
400
0 0.2 0.4 0.6 0.8 1
Time (s)
Te
mp
era
ture
(°C
)
20% reduction
15% reduction
10% reduction
5% reduction
²
b) Reconstructed temperature at outer roll
radius (surface)
-4
0
4
8
12
16
20
0 0.2 0.4 0.6 0.8 1
Time (s)
su
rface h
eat
flu
x (
MW
/m2)
5% reduction
10% reduction15% reduction
20% reduction
roll heating
roll cooling
c) Reconstructed heat flux at outer roll
radius (surface)
Fig.3: strip reduction influence on heat flux and surface temperature (tests n°1 to 4 - 1st pass, 1
st
revolution, sensor A)
Influence of strip surface scale. Fig. 4 shows the reconstruction by inverse model n°1 of
temperature and heat flux at roll surface (using the measured temperature at inner roll radius, not
shown here) for the two different furnace temperatures at which the strip has been heated prior to
rolling: 1050°C (test n°6) and 1150°C (test n°10). The higher the heating furnace temperature is, the
lower the roll bite heat flux is.
-50
0
50
100
150
200
250
300
350
400
450
0 0.5 1 1.5 2 2.5
time (sec.)
tem
pe
ratu
re (
°C)
test n°6 - rev. 1test n°6 - rev. 2test n°10 - rev. 1test n°10 - rev.2
a) Reconstructed temperature at roll surface (slot sensor A)
-5
0
5
10
15
20
0 0.5 1 1.5 2
Time (s)
su
rface h
eat
flu
x (
MW
/m2)
test n°6 rev. 1
test n°6 - rev. 2
test n°10 - rev. 1
test n° 10 - rev. 2
b) Reconstructed heat flux at roll surface (slot sensor A)
Fig.4: influence of strip surface scale on roll surface temperature and surface heat flux for two
different furnace temperatures: 1050°C and 1150°C (tests n°6 and 10 - 1st pass – 2 1
st revolutions)
A model has been used to determine the scale thickness formation for the two tests n°6 and n°10:
- test n°6: strip pre-heated at 1050°C has produced a scale thickness of ~35 m at strip surface.
- test n°10: strip pre-heated at 1150°C has produced a scale thickness of ~60 m at strip surface.
As scale has a much lower thermal conductivity (2 W/m/K) than steel (15 W/m/K), the thicker
scale thickness in test n°10 acts as a thermal insulator, decreasing roll-strip heat transfers.
Evaluation of roll surface temperature and heat flux using slot and drilled sensors. Fig. 5
shows heat flux and roll surface temperature reconstructed with drilled and slot sensors respectively
using the inverse model n°1. For the reconstruction with the slot sensor, the thermal properties of
the solder material were used: = 17.3 W/m/K and D = 4.2 mm2/sec. For the reconstruction with
the drilled sensor, the thermal properties and D have been adjusted to obtain a similar curve as for
the slot sensor: = 13 W/m/K and D = 2 mm2/sec. were obtained. These lower values are consistent

with the air contained in the drilled sensor that slows down heat exchanges with the sensor.
Nevertheless due to these heat exchanges modified by air, the reconstruction at roll surface with the
drilled sensor presents much more noise than the reconstruction with the slot sensor, especially for
heat transfer reconstruction. The slot sensor is thus more efficient than the drilled sensor.
0
50
100
150
200
250
300
350
400
0 0.2 0.4 0.6 0.8 1 1.2
time (sec.)
ro
ll s
urfa
ce t
em
peratu
re (
°C
) Slot sensor
Drilled sensor
Slot
drilled
a) roll surface temperature reconstruction
-5
0
5
10
15
20
0 0.2 0.4 0.6 0.8 1 1.2
time (sec.)
ro
ll s
urfa
ce h
eat
flu
x
(M
W/
m2
)
Slot sensor
Drilled sensor
Slot
drilled
b) roll surface heat flux reconstruction
Fig.5: roll surface temperature and heat flux reconstructed with slot and drilled sensors respectively
(test n°10 – 1st pass, revolution n°1)
Evaluation of roll surface temperature and HTCroll-bite by direct calculation (model n°2)
Heat Transfer Coefficient evaluation (HTC). HTCroll-bite is adjusted by direct calculations to
match measured and simulated roll temperatures at inner roll radius for test n°6, 1st pass, 1
st
revolution: HTCroll-bite was identified approximately to 20 kW/m2/K for test n°10 (fig.6a shows the
identification) and to 26 kW/m2/K for test n°6.
Evaluation of temperature response for slot and drilled sensors. For test n°10, fig.6a and 6b
compare at the inner roll radius the temperature measured with the two sensors with the temperature
predicted by the model n°2 assuming an homogeneous material.
0
50
100
150
200
250
0 0.5 1 1.5 2
Time (sec.)
Tem
pera
ture
at
inn
er
roll
rad
ius (
°C)
simulation HTCroll-bite = 30000 W/m2/Ksimulation HTCroll-bite = 20000 W/m2/Ksimulation HTCroll-bite = 10000 W/m2/Kmeasured temperature
experiment
HTCroll-bite=30 kW/m2/K
=20 kW/m2/K=10 kW/m2/K
sensor A
a) experiment: slot sensor A – d = 0.51 mm – HTCroll-bite
identification
0
50
100
150
200
250
0 0.5 1 1.5 2
time (sec.)
tem
pe
ratu
re a
t in
ner
roll r
ad
ius
(°C
) simulation - HTCroll-bite = 20000 W/m2/K
measured temperature sensor C1
HTCroll-bite = 20 kW/m2/K
experiment
b) experiment: drilled sensor C1 – d =0.58 mm – simulated
inner roll radius temperature using HTCroll bite identified with
sensor A compared with experiment
Fig.6: comparison of simulated and measured temperature responses with slot sensor A and drilled
sensor C1 (test n°10, 1st pass, two 1
st revolutions, high scale thickness : ~ 60 microns)
The slot type sensor do not perturb the measured temperature field and can capture correctly the
fast roll temperature change when passing through the roll bite (fig.6a), but life’s duration of the slot
sensor is shorter than the drilled sensor. The drilled sensor perturb the measured temperature field
when passing through the roll bite, this is due to the air contained in it that acts as thermal insulator
but its life duration is longer (fig. 6b). These results are consistent with the ones of fig.5.
HTCroll-bite as a function of strip surface scale. HTCroll-bite as a function of strip surface scale
thickness can be identified by comparison of test n°6 (small scale thickness ~35 microns: HTCroll-bite
= 26 kW/m2/°K) with test n° 10 (higher scale thickness ~60 microns: fig.6a: HTCroll-bite = 20
kW/m2/°K ).
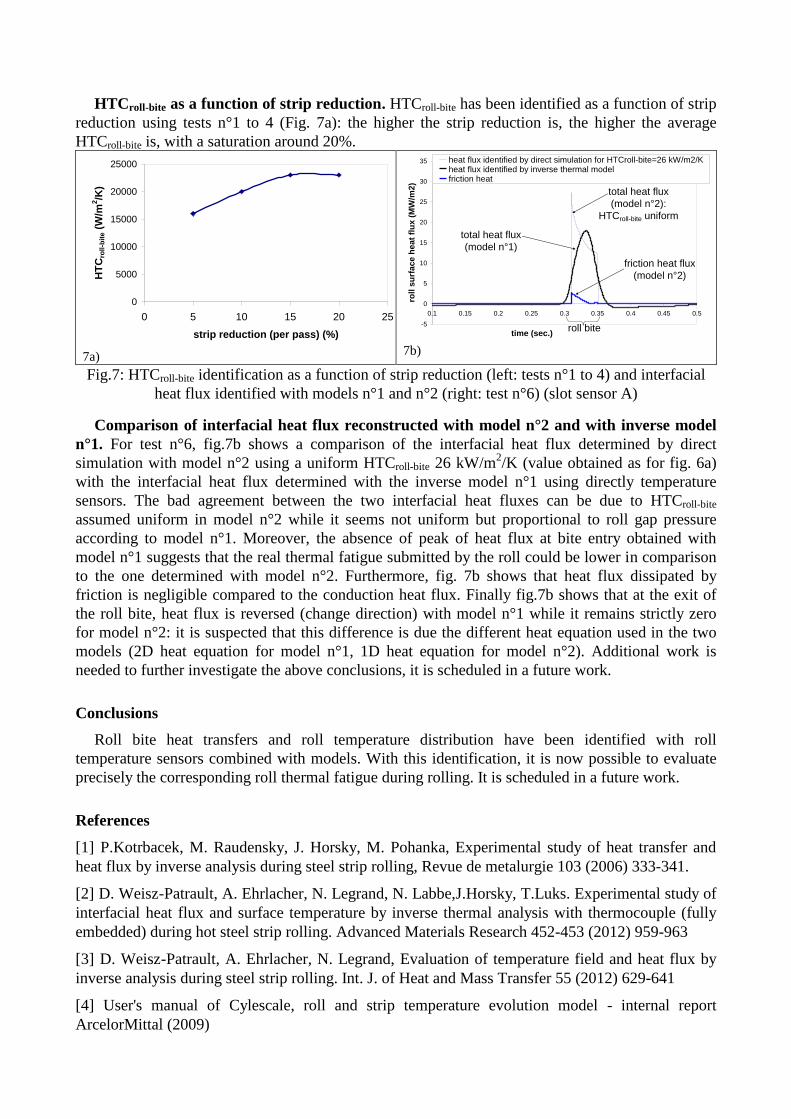
HTCroll-bite as a function of strip reduction. HTCroll-bite has been identified as a function of strip
reduction using tests n°1 to 4 (Fig. 7a): the higher the strip reduction is, the higher the average
HTCroll-bite is, with a saturation around 20%.
0
5000
10000
15000
20000
25000
0 5 10 15 20 25
strip reduction (per pass) (%)
HT
Cro
ll-b
ite (
W/m
2/K
)
7a)
-5
0
5
10
15
20
25
30
35
0.1 0.15 0.2 0.25 0.3 0.35 0.4 0.45 0.5
time (sec.)
roll
su
rface h
eat
flu
x (
MW
/m2)
heat flux identified by direct simulation for HTCroll-bite=26 kW/m2/Kheat flux identified by inverse thermal modelfriction heat
total heat flux
(model n°2):
HTCroll-bite uniform
total heat flux
(model n°1)
friction heat flux
(model n°2)
roll bite
7b)
Fig.7: HTCroll-bite identification as a function of strip reduction (left: tests n°1 to 4) and interfacial
heat flux identified with models n°1 and n°2 (right: test n°6) (slot sensor A)
Comparison of interfacial heat flux reconstructed with model n°2 and with inverse model
n°1. For test n°6, fig.7b shows a comparison of the interfacial heat flux determined by direct
simulation with model n°2 using a uniform HTCroll-bite 26 kW/m2/K (value obtained as for fig. 6a)
with the interfacial heat flux determined with the inverse model n°1 using directly temperature
sensors. The bad agreement between the two interfacial heat fluxes can be due to HTCroll-bite
assumed uniform in model n°2 while it seems not uniform but proportional to roll gap pressure
according to model n°1. Moreover, the absence of peak of heat flux at bite entry obtained with
model n°1 suggests that the real thermal fatigue submitted by the roll could be lower in comparison
to the one determined with model n°2. Furthermore, fig. 7b shows that heat flux dissipated by
friction is negligible compared to the conduction heat flux. Finally fig.7b shows that at the exit of
the roll bite, heat flux is reversed (change direction) with model n°1 while it remains strictly zero
for model n°2: it is suspected that this difference is due the different heat equation used in the two
models (2D heat equation for model n°1, 1D heat equation for model n°2). Additional work is
needed to further investigate the above conclusions, it is scheduled in a future work.
Conclusions
Roll bite heat transfers and roll temperature distribution have been identified with roll
temperature sensors combined with models. With this identification, it is now possible to evaluate
precisely the corresponding roll thermal fatigue during rolling. It is scheduled in a future work.
References
[1] P.Kotrbacek, M. Raudensky, J. Horsky, M. Pohanka, Experimental study of heat transfer and
heat flux by inverse analysis during steel strip rolling, Revue de metalurgie 103 (2006) 333-341.
[2] D. Weisz-Patrault, A. Ehrlacher, N. Legrand, N. Labbe,J.Horsky, T.Luks. Experimental study of
interfacial heat flux and surface temperature by inverse thermal analysis with thermocouple (fully
embedded) during hot steel strip rolling. Advanced Materials Research 452-453 (2012) 959-963
[3] D. Weisz-Patrault, A. Ehrlacher, N. Legrand, Evaluation of temperature field and heat flux by
inverse analysis during steel strip rolling. Int. J. of Heat and Mass Transfer 55 (2012) 629-641
[4] User's manual of Cylescale, roll and strip temperature evolution model - internal report
ArcelorMittal (2009)