analysis of saas and on premise ict solutions for smes in ... · analysis of saas and on premise...
TRANSCRIPT
Graduate School of Social Sciences
Department of Business Administration
Analysis of SaaS and On Premise
ICT solutions for SMEs in Turkey
e-MBA Graduation Project
Salih Bülent Özkır
101112127
Project Advisor:
Yrd.Doç.Dr. Levent Aksoy
İstanbul, Ocak 2012
T.C. MALTEPE ÜNİVERSİTESİ
e-MBA BİTİRME PROJESİ ONAY FORMU
Proje Konusu : Analysis of SaaS and On Premise ICT solutions for SMEs in Turkey
Projeyi Yapan Öğrencinin;
Adı Soyadı : SALİH BÜLENT ÖZKIR
Öğrenci Numarası : 101112127
Maltepe Üniversitesi e-MBA yüksek lisans programının Proje dersini “Başarılı” olarak
tamamlamıştır.
Bu form ile birlikte 2 suret ciltli bitirme projesi ve Bitirme Projesi dosyasını içeren CD ile
Sosyal Bilimler Enstitüsüne teslim edilecektir.
20 / 01 / 2012
Yrd.Doç.Dr.Levent Aksoy
Proje Danışmanı
TABLE OF CONTENTS
PREFACE ..................................................................................................................... i
ABSTRACT ................................................................................................................. ii
LIST OF ABBREVIATIONS ..................................................................................... iii
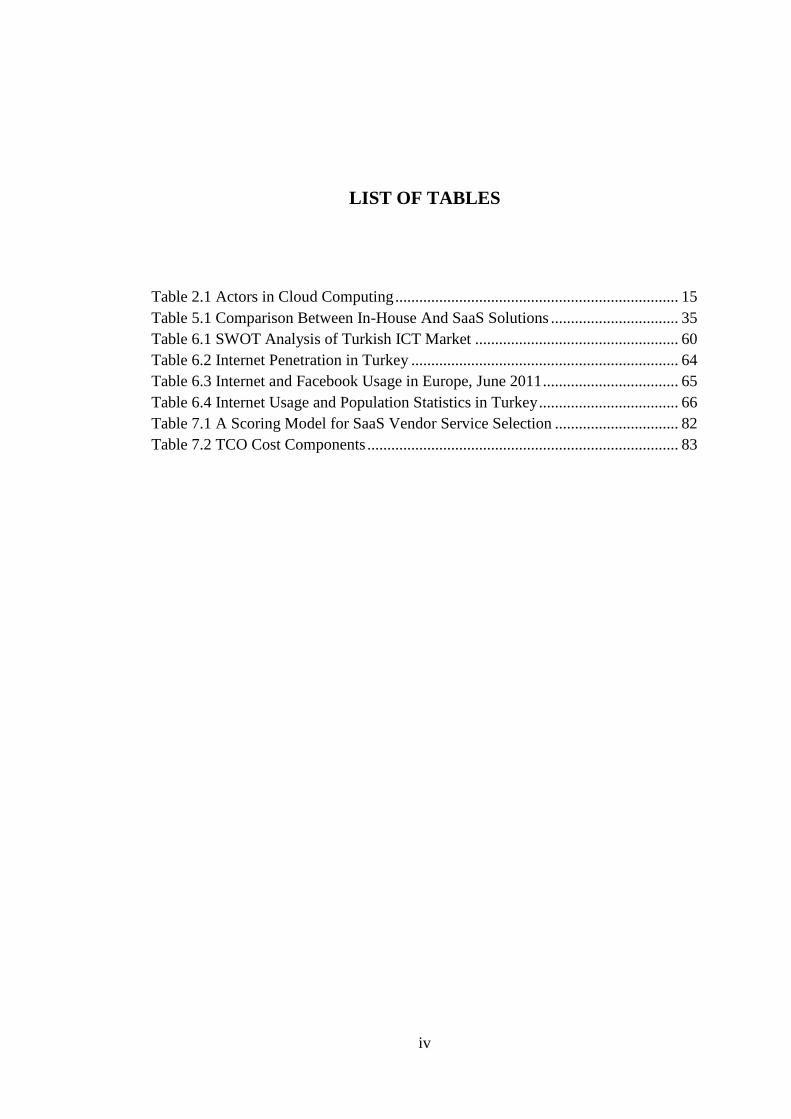
LIST OF TABLES ...................................................................................................... iv
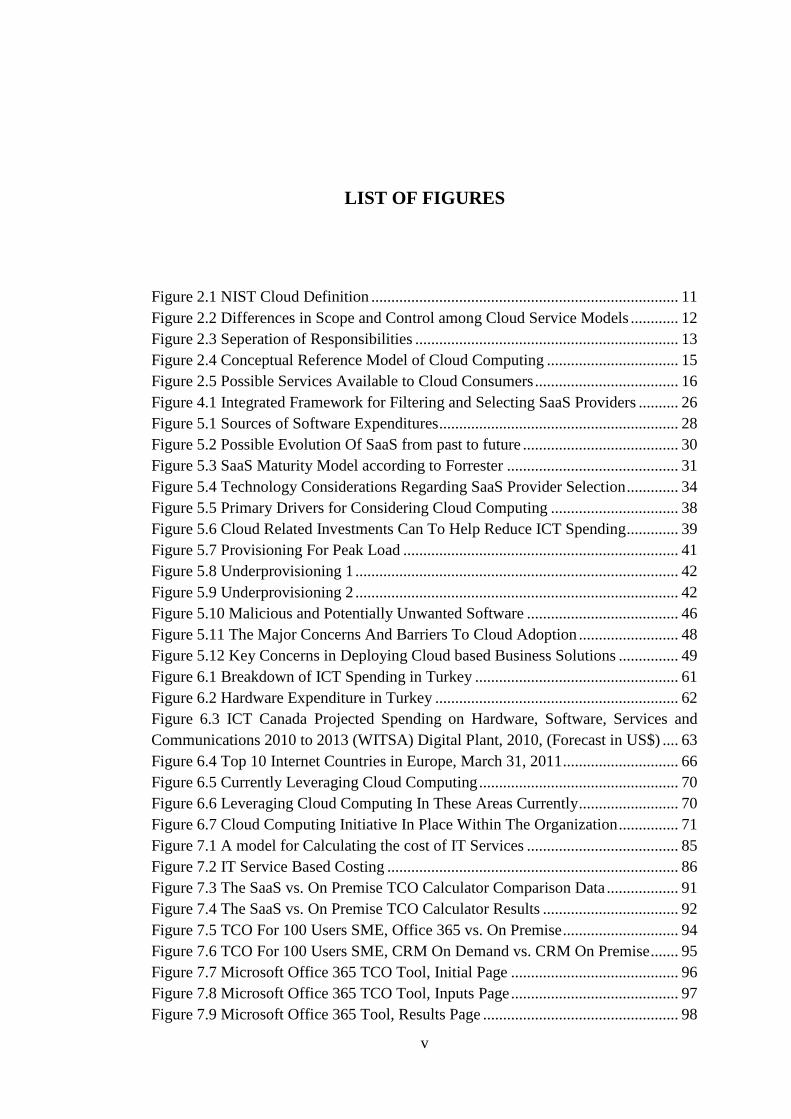
LIST OF FIGURES ..................................................................................................... v
1 INTRODUCTION ............................................................................................... 1
2 DEFINITION AND TAXONOMY ..................................................................... 4
2.1 Overview of Cloud Computing ..................................................................... 4
2.2 Definition of Cloud Computing .................................................................... 6
2.2.1 Deployment Models ............................................................................... 7
2.2.2 Service Models ....................................................................................... 8
2.2.3 Essential Characteristics ........................................................................ 9
2.2.4 Illustration of NIST Cloud Definition .................................................. 10
2.2.5 Differences in Scope and Control among Cloud Service Models ....... 11
2.3 Conceptual Cloud Reference Architecture .................................................. 13
2.4 Possible Services Available to Cloud Consumers ....................................... 16
3 PROBLEM DEFINITION ................................................................................. 20
4 METHODS ........................................................................................................ 24
5 SaaS MARKET AND VENDOR ANALYSIS .................................................. 27
5.1 Changing Sources of Firm Software ........................................................... 27
5.2 Evolution of SaaS - Yesterday, Today, and Tomorrow .............................. 28
5.3 Forrester Research SaaS Maturity Model ................................................... 30
5.4 Key Technology Considerations for SaaS Providers .................................. 33
5.5 In House or SaaS ......................................................................................... 34
5.6 Advantages of SaaS Service Model for Turkish SMEs .............................. 35
5.6.1 Hardware, Software, and IT Staff Cost Savings .................................. 38

5.6.2 Easy To Adopt ..................................................................................... 40
5.6.3 Less Problematic Software Updates and Patches ................................ 40
5.6.4 Scalability on Peak Times .................................................................... 40
5.6.5 Pay per Use Financial Model ............................................................... 43
5.6.6 Improved Release Management and Testing of New Releases ........... 43
5.6.7 Rapid Resource Provisioning ............................................................... 44
5.6.8 SLAs .................................................................................................... 44
5.6.9 Security ................................................................................................ 45
5.6.10 Few Technical Skills Required for New Technology .......................... 46
5.7 Disadvantages of SaaS Service Model for Turkish SMEs .......................... 47
5.7.1 Cloud Computing Knowledge and Understanding .............................. 49
5.7.2 Security ................................................................................................ 50
5.7.3 System Integration Capability .............................................................. 51
5.7.4 Ability to Move Among SaaS Providers and Ability to Change
Deployment Models When Necessary ............................................................... 51
5.7.5 Availability and Reliability .................................................................. 52
5.7.6 Adaptability and Task Productivity ..................................................... 54
5.7.7 Regulatory and Compliance Issues ...................................................... 54
5.7.8 Impact on IT Roles and Responsibilities ............................................. 54
5.7.9 IT Governance Issues ........................................................................... 55
5.7.10 Different Cloud Computing Standards among Cloud Providers ......... 56
6 TURKISH ICT MARKET ANALYSIS ............................................................ 59
6.1 Analysis of Current IT Usage, Risks, and Issues in Turkish ICT Market ... 59
6.1.1 ICT in Turkey and SWOT Analysis of the ICT Market ...................... 59
6.1.2 Internet and FaceBook Usage in Turkey and Europe .......................... 63
6.1.3 OECD Outlook for SMEs in Turkey ................................................... 66
6.1.4 Report Stating Turkey's SMEs Lag in IT ............................................. 68
6.2 Turkey Cloud Computing Survey Results .................................................. 69
6.3 SWOT Analysis of Using SaaS for Turkish SMEs ..................................... 71
6.3.1 Strengths of SaaS ................................................................................. 71
6.3.2 Weaknesses of SaaS ............................................................................. 73
6.3.3 Opportunities of SaaS .......................................................................... 75
6.3.4 Threats of SaaS .................................................................................... 76
7 DECISION MODEL FOR SELECTING SaaS PROVIDER ............................ 79
7.1 SaaS Provider Qualification Checklist ........................................................ 79
7.2 Multi Criteria Based Cloud Service Provider Selection Scoring Model ..... 81
7.3 Total Cost Of Ownership (TCO) ................................................................. 82
7.3.1 IT Service Costing Model for On Premise .......................................... 83
7.3.2 TCO Calculation Examples ................................................................. 86
7.3.3 TCO of SaaS vs. On Premise Using Simple Approach ....................... 86
7.3.4 TCO Of SaaS vs. On Premise Using another Simple Approach ......... 88
7.3.5 The SaaS vs. On Premise TCO Calculator .......................................... 90
7.3.6 TCO Calculation Comparing SaaS With On Premise Solution ........... 92
7.3.7 TCO for Office 365 vs. On Premise .................................................... 93
7.3.8 TCO for CRM On Demand vs. CRM On Premise .............................. 94
7.3.9 TCO for On Premise and Office 365 online using Microsoft’s tool .... 95
7.4 Return On Investment (ROI) ....................................................................... 99
7.4.1 ROI Comparisons for Different SaaS Applications Using Complex
Approaches ...................................................................................................... 100
7.4.2 Forrester Research’s Total Economic Impact Model Analysis for
Office 365 ........................................................................................................ 102
8 DISCUSSIONS ................................................................................................ 107
9 CONCLUSION ................................................................................................ 109
10 REFERENCES ................................................................................................ 111
CURRICULUM VITAE .......................................................................................... 113
i
PREFACE
This study is written as the final graduation work of the Maltepe EMBA English
program.
First of all, I would like to thank my study supervisor, Yrd.Doç.Dr. Levent Aksoy,
for lots of great inspiration, ideas, comments, and feedbacks.
I would like to sincerely thank Serdar Angün, Distance Education Coordinator at
Maltepe University, for his coordination, kindness, guidance, and professionalism
during my EMBA program.
I also want to express my utmost gratitude to my instructors at the program who
helped me to develop and improve my business acumen and skills.
Finally, lots of thanks are due to my wife, Yrd.Doç.Dr. Vildan Çetinsaya Özkır, for
expertly proof reading this study. Hopefully she has tried to remove all the serious
errors, but any that might be left are wholly my responsibility.
ii
ABSTRACT
This study is written to provide guidance for evaluation SaaS solutions and
comparing it with on premise solutions by developing an integrated framework
which includes qualitative and quantitative aspects. The cloud computing is a fairly
new technology that has many facets that remain mysterious to the average person.
This study will seek to help familiarize SMEs and analysts with the SaaS concept
and why it makes sense to subscribe IT applications online instead of owning them
on premise. The variety of options and potential benefits of SaaS make it a
consideration worth making.
This study is written for SMEs particularly who want to use their IT budget and
resources better than their competitors in the future. Although written with SMEs in
mind, large organizations may also benefit from it due to hybrid deployment models.
There are a several options when it comes to SaaS. SMEs must understand the
nuances inherent in the different models they evaluate, along with understanding the
difference between SaaS, hybrid, hosted, and in-house.
If we make analogy such as most companies do not build their own electrical
generating plants or their own water treatment facilities. They purchase only the
utilities they really need without wasting any resources deliberately. Why not do that
with computing in terms of fitness for purpose and fitness for use.
This study covers the in depth analysis of SaaS service model and public deployment
model of cloud computing. SaaS is never one-size-fits-all, however. IT departments
should have a clear framework for evaluating and operating any new model, and a
detailed supply chain IT impact assessment should be performed to determine if the
SaaS model is a good match for the operation. Benefits such as rapid deployment,
lower cost, and scalability must be balanced by other key decision criteria particular
to an organization such as fit for use, fit for purpose, total cost of ownership (TCO),
return on investment (ROI) and risk. Evaluations should consider both long-term
ROI and short-term total cost of ownership.

iii
LIST OF ABBREVIATIONS
CAL : Client Access License
COBIT : Control Objectives for Information and related Technology
CRM : Customer Relationship Management
ESB : Enterprise Service Bus
HIPAA : Health Insurance Portability and Accountability Act
HR : Human Resources
ICT : Information and Communication Technologies
IaaS : Infrastructure as a Service
ISO : International Organization for Standardization
IT : Information Technology
NIST : National Institute of Standards and Technology
NPV : Net Present Value
PaaS : Platform as a Service
PV : Present Value
ROI : Return on Investment
SaaS : Software as a Service
SLA : Service Level Agreement
SME : Small Medium Enterprise
SWOT : Strengths Weaknesses Opportunities Threats
TCO : Total Cost of Ownership
TUBISAD : Türkiye Bilişim Sanayicileri Derneği
iv
LIST OF TABLES
Table 2.1 Actors in Cloud Computing ....................................................................... 15
Table 5.1 Comparison Between In-House And SaaS Solutions ................................ 35
Table 6.1 SWOT Analysis of Turkish ICT Market ................................................... 60
Table 6.2 Internet Penetration in Turkey ................................................................... 64
Table 6.3 Internet and Facebook Usage in Europe, June 2011 .................................. 65
Table 6.4 Internet Usage and Population Statistics in Turkey ................................... 66
Table 7.1 A Scoring Model for SaaS Vendor Service Selection ............................... 82
Table 7.2 TCO Cost Components .............................................................................. 83
v
LIST OF FIGURES
Figure 2.1 NIST Cloud Definition ............................................................................. 11
Figure 2.2 Differences in Scope and Control among Cloud Service Models ............ 12
Figure 2.3 Seperation of Responsibilities .................................................................. 13
Figure 2.4 Conceptual Reference Model of Cloud Computing ................................. 15
Figure 2.5 Possible Services Available to Cloud Consumers .................................... 16
Figure 4.1 Integrated Framework for Filtering and Selecting SaaS Providers .......... 26
Figure 5.1 Sources of Software Expenditures ............................................................ 28
Figure 5.2 Possible Evolution Of SaaS from past to future ....................................... 30
Figure 5.3 SaaS Maturity Model according to Forrester ........................................... 31
Figure 5.4 Technology Considerations Regarding SaaS Provider Selection ............. 34
Figure 5.5 Primary Drivers for Considering Cloud Computing ................................ 38
Figure 5.6 Cloud Related Investments Can To Help Reduce ICT Spending ............. 39
Figure 5.7 Provisioning For Peak Load ..................................................................... 41
Figure 5.8 Underprovisioning 1 ................................................................................. 42
Figure 5.9 Underprovisioning 2 ................................................................................. 42
Figure 5.10 Malicious and Potentially Unwanted Software ...................................... 46
Figure 5.11 The Major Concerns And Barriers To Cloud Adoption ......................... 48
Figure 5.12 Key Concerns in Deploying Cloud based Business Solutions ............... 49
Figure 6.1 Breakdown of ICT Spending in Turkey ................................................... 61
Figure 6.2 Hardware Expenditure in Turkey ............................................................. 62
Figure 6.3 ICT Canada Projected Spending on Hardware, Software, Services and
Communications 2010 to 2013 (WITSA) Digital Plant, 2010, (Forecast in US$) .... 63
Figure 6.4 Top 10 Internet Countries in Europe, March 31, 2011 ............................. 66
Figure 6.5 Currently Leveraging Cloud Computing .................................................. 70
Figure 6.6 Leveraging Cloud Computing In These Areas Currently ......................... 70
Figure 6.7 Cloud Computing Initiative In Place Within The Organization ............... 71
Figure 7.1 A model for Calculating the cost of IT Services ...................................... 85
Figure 7.2 IT Service Based Costing ......................................................................... 86
Figure 7.3 The SaaS vs. On Premise TCO Calculator Comparison Data .................. 91
Figure 7.4 The SaaS vs. On Premise TCO Calculator Results .................................. 92
Figure 7.5 TCO For 100 Users SME, Office 365 vs. On Premise ............................. 94
Figure 7.6 TCO For 100 Users SME, CRM On Demand vs. CRM On Premise ....... 95
Figure 7.7 Microsoft Office 365 TCO Tool, Initial Page .......................................... 96
Figure 7.8 Microsoft Office 365 TCO Tool, Inputs Page .......................................... 97
Figure 7.9 Microsoft Office 365 Tool, Results Page ................................................. 98
vi
Figure 7.10 Microsoft Office 365 Tool, Cost Comparison Page For Office 365 vs. On
Premise Software ....................................................................................................... 99
Figure 7.11 Model: Total Economic Impact Analysis Summary - SaaS CRM ....... 101
Figure 7.12 Model: Total Economic Impact Analysis Summary - SaaS HR .......... 101
Figure 7.13 Model: Total Economic Impact Analysis Summary - Saas IT
Management ............................................................................................................. 102
Figure 7.14 Composite Organization Three-Year Risk-Adjusted Roi ..................... 103
Figure 7.15 Composite Organization Three-Year Risk-Adjusted Cumulative Cash
Flow ......................................................................................................................... 106

1
1 INTRODUCTION
Cloud computing is simply the ability to access files and applications online through
multiple devices, such as computer, browser, or phone. The analogy that derives
cloud computing concept is “if somebody needs milk, that person should not buy a
cow.”
Forrester Research defines cloud computing as a standardized IT capability
(software, infrastructure, or services) delivered in a pay-per-use self-service way
(Staten, 2009).
Cloud computing is a technology that uses the internet and central remote servers to
maintain data and applications. Cloud computing allows consumers and businesses to
use applications without installation and access their personal files at any computer
with internet access. This technology allows for much more inefficient computing by
centralizing storage, memory, processing and bandwidth.
Businesses around the world are already beginning to make the transition to this new
model of computing. Basically, there are three reasons why this trend is so
overwhelming: agility, focus and economics. Agility, focus, and economics are the
key factors that motivating companies to make the move to cloud computing.
The first is agility, which has several facets. Cloud computing speeds up the ability
to capitalize on new opportunities, and respond to changes in business demand.
Business can deploy applications much faster and more efficiently, and business can
deliver solutions to its end users so they can work from nearly anywhere, at any time,
across devices – in ways that are both secure and manageable. Also, with cloud
computing, the entire IT infrastructure business need to operate quickly and
2
efficiently is available at the “flip of a switch.” So, the next time the marketing
department launches a campaign and doesn't tell anybody, its Website is much less
likely to go down. The environment can quickly scale up and down to meet spikes in
demand.
The second factor driving adoption of cloud computing is "focus.” By this we mean
the ability to focus on improving the success of the business through better IT. Put
another way, business can focus more on innovation and less on infrastructure.
Today, the typical IT department spends most of its time and money on maintenance
and operations. Cloud computing cuts those costs down dramatically. ICT
infrastructure is abstracted and its resources are pooled, so IT runs more like a utility
than a collection of complicated (and often fragile) software and hardware systems.
When business can pay more attention to ideas than IT complexity, business adds a
new kind of value to the business.
The third factor driving adoption of cloud computing is economics. This means
lowering the cost of delivering IT and increasing the utilization and efficiency of the
datacenter and IT spending. The delivery costs go down because now business can
offer self-service of applications and resources, and business can meter the usage of
those resources in new and very precise ways. Utilization goes up because the
infrastructure resources (storage, compute, and network) are now pooled and
abstracted. So, for example, when a self-service application is finished, the server
and storage resources it used will go right back into the pool. The environment is
highly automated so the ICT systems are not just sitting around idle, they are always
at work as much as needed, not much, not less.
3
This study explores and analyzes the benefits and risks of cloud computing for Small
and Medium sized Enterprises (10 < full time employees < 251) in Turkey using
global and local information available. The study will inspects the ROI of public
Cloud Services offerings provided by some SaaS vendors. This study also performs
SWOT analysis of cloud computing for the SaaS market. The study will also exhibit
cost comparison of public cloud services vs. on premise IT including all direct and
indirect costs and benefits over 5 years. However, the keep the scope more
understandable and concise, the study will only focus on public deployment model
and SaaS service model, thus, private and hybrid deployment models as well as PaaS
and IaaS service models are excluded.
4
2 DEFINITION AND TAXONOMY
Consumer and business products, services and solutions delivered and consumed in
real-time over the Internet. Cloud services are shared, standard services, built for a
market, not for any specific customer. Cloud computing is a general term for
anything that involves delivering hosted services over the Internet. These services are
broadly divided into three categories: Infrastructure-as-a-Service (IaaS), Platform-as-
a-Service (PaaS) and Software-as-a-Service (SaaS). A cloud service has several
distinct characteristics that differentiate it from traditional hosting which is on-
premise. A cloud can be deployed as private, public, hybrid, or community.
2.1 Overview of Cloud Computing
Cloud computing, or simply cloud, is changing how IT delivers services and how a
user can access computing resources at work, from home, and on the go. Cloud
enables IT to respond to business opportunities with on-demand deliveries that are
cost-effective and agile in the long run. Much happening in enterprise IT now is a
journey to transform existing IT establishment into a cloud-friendly, cloud-ready,
cloud-enabled environment.
The evolution of cloud computing can be split into 3 phases (Banerjee, 2011).
The Idea Phase: This started in the 1960s and stretched to the pre internet
bubble era. The core idea of computing as a utility computing and grid
computing developed.
The Pre Cloud Phase: This started around 1999 and lasted till 2006. In this
phase internet as the mechanism to provide Application as Service got
developed.
5
The Cloud Phase: this phase started in 2007 when the term cloud computing
term became popular and the sub classification of IaaS, PaaS & SaaS got
formalized.
Client computing is one of the most optimum ways of providing computing
resources and software. The concept typically runs on the established convention of
the internet where clients and servers communicate remotely and on demand via
subscription model. The concept can sometimes be referred to as Internet as a
Product since all products provided via Internet infrastructure by commercial
companies can be rent as a kind of cloud computing service.
Cloud computing is a technology that uses the internet and central remote servers to
maintain data and applications. Cloud computing allows consumers and businesses to
use applications without installation and access their personal files at any computer
with internet access. This technology allows for much more inefficient computing by
centralizing storage, memory, processing and bandwidth.
Cloud computing provides new services ranging from data storage to end-to-end
computing. Cloud computing takes away the task of infrastructural deployment and
makes technology, platform or just software readily available commodities just like
electricity or water or gas or TV. One pays as per the usage besides other set up
costs, which when combined, are far less than the conventional ways of acquiring
technology.
Cloud computing is broken down into three segments: "application" "storage" and
"connectivity." Each segment serves a different purpose and offers different products
for businesses and individuals around the world.

6
Community cloud shares infrastructure between several organizations from a specific
community with common concerns (security, compliance, jurisdiction, etc.), whether
managed internally or by a third-party and hosted internally or externally. The costs
are spread over fewer users than a public cloud (but more than a private cloud), so
only some of the benefits of cloud computing are realized.
2.2 Definition of Cloud Computing
For Information Technology (IT) technical professionals, Cloud Computing may
mean utility computing, high speed grids, virtualization, automatic configuration and
deployment, on-demand and remote processing, and combinations of them. For
business users, Cloud Computing is simply the Internet, a cable form a service
provider or just something out there networked with my computer. Either public,
private, or in between, the conventional wisdom, as published in The NIST
Definition of Cloud Computing, assumes noticeable characteristic regarding how
computing resources are made available in Cloud.
Cloud computing is a model for enabling ubiquitous, convenient, on-demand
network access to a shared pool of configurable computing resources (e.g., networks,
servers, storage, applications, and services) that can be rapidly provisioned and
released with minimal management effort or service provider interaction. This cloud
model is composed of five essential characteristics, three service models, and four
deployment models (Mell & Grance, 2011).
The National Institute of Standards and Technology (NIST) explain these essential
characteristics, service models and deployment models as in the following
subsections.
7
2.2.1 Deployment Models
A cloud deployment model represents a specific type of cloud environment,
primarily distinguished by ownership and size. These can be summarized as private
cloud, community cloud, public cloud, and hybrid cloud (Mell & Grance, 2011).
Private cloud: The cloud infrastructure is provisioned for exclusive use by a
single organization comprising multiple consumers (e.g., business units). It may be
owned, managed, and operated by the organization, a third party, or some
combination of them, and it may exist on or off premises.
Community cloud: The cloud infrastructure is provisioned for exclusive
use by a specific community of consumers from organizations that have shared
concerns (e.g., mission, security requirements, policy, and compliance
considerations). It may be owned, managed, and operated by one or more of
the organizations in the community, a third party, or some combination of them,
and it may exist on or off premises.
Public cloud: The cloud infrastructure is provisioned for open use by the
general public. It may be owned, managed, and operated by a business, academic, or
government organization, or some combination of them. It exists on the premises of
the cloud provider.
Hybrid cloud: The cloud infrastructure is a composition of two or
more distinct cloud infrastructures (private, community, or public) that remain
unique entities, but are bound together by standardized or proprietary technology
that enables data and application portability (e.g., cloud bursting for load
balancing between clouds).
8
2.2.2 Service Models
A cloud delivery model represents a specific combination of IT resources offered by
a cloud provider. These can be summarized as Software as a Service, Platform as a
Service, and Infrastructure as a Service (Mell & Grance, 2011).
Software as a Service (SaaS): The capability provided to the consumer
is to use the provider’s applications running on a cloud infrastructure. The
applications are accessible from various client devices through either a thin client
interface, such as a web browser (e.g., web-based email), or a program interface. The
consumer does not manage or control the underlying cloud infrastructure including
network, servers, operating systems, storage, or even individual application
capabilities, with the possible exception of limited user-specific application
configuration settings.
Platform as a Service (PaaS): The capability provided to the consumer is to
deploy onto the cloud infrastructure consumer-created or acquired applications
created using programming languages, libraries, services, and tools supported
by the provider. The consumer does not manage or control the underlying
cloud infrastructure including network, servers, operating systems, or storage, but
has control over the deployed applications and possibly configuration settings for the
application-hosting environment.
Infrastructure as a Service (IaaS): The capability provided to the
consumer is to provision processing, storage, networks, and other fundamental
computing resources where the consumer is able to deploy and run arbitrary
software, which can include operating systems and applications. The consumer
does not manage or control the underlying cloud infrastructure but has control over
9
operating systems, storage, and deployed applications; and possibly limited control
of select networking components (e.g., host firewalls).
2.2.3 Essential Characteristics
A cloud is a distinct and remote IT environment designed for the purpose of remotely
provisioning scalable and measured IT resources. In order to remotely provision
scalable and measured IT resources in an effective manner, an IT environment
requires a specific set of characteristics. These characteristics need to exist to a
meaningful extent for the IT environment to be considered an effective cloud. These
can be summarized as on-demand self-service, broad network access, resource
pooling, rapid elasticity, and measured service (Mell & Grance, 2011).
On-demand self-service: A consumer can unilaterally provision
computing capabilities, such as server time and network storage, as needed
automatically without requiring human interaction with each service provider.
Broad network access: Capabilities are available over the network and
accessed through standard mechanisms that promote use by heterogeneous thin
or thick client platforms e.g., mobile phones, tablets, laptops, and workstations.
Resource pooling: The provider’s computing resources are pooled to serve
multiple consumers using a multi-tenant model, with different physical and
virtual resources dynamically assigned and reassigned according to consumer
demand. There is a sense of location independence in that the customer generally
has no control or knowledge over the exact location of the provided resources but
may be able to specify location at a higher level of abstraction e.g., country, state,
or datacenter. Examples of resources include storage, processing, memory, and
network bandwidth.

10
Rapid elasticity: Capabilities can be elastically provisioned and released,
in some cases automatically, to scale rapidly outward and inward
commensurate with demand. To the consumer, the capabilities available for
provisioning often appear to be unlimited and can be appropriated in any quantity at
any time.
Measured service: Cloud systems automatically control and optimize
resource use by leveraging a metering capability at some level of abstraction
appropriate to the type of service e.g., storage, processing, bandwidth, and active
user accounts. Resource usage can be monitored, controlled, and reported,
providing transparency for both the provider and consumer of the utilized
service.
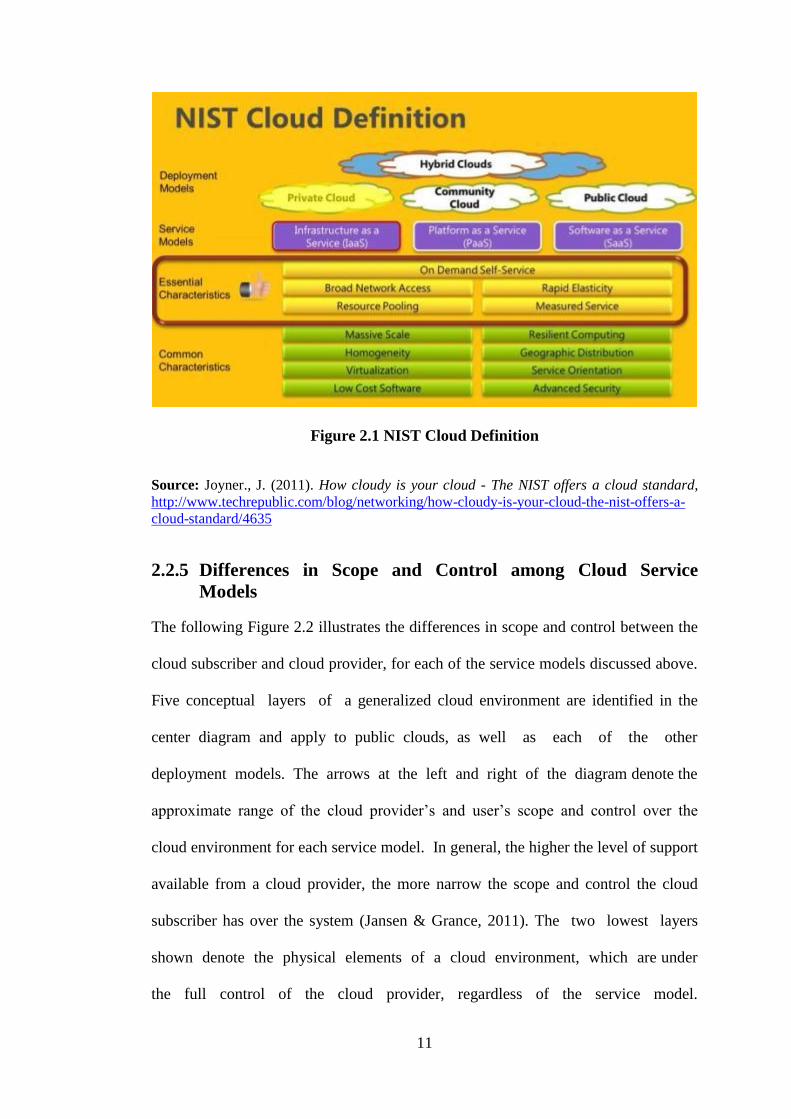
2.2.4 Illustration of NIST Cloud Definition
The NIST cloud definition shown in the Figure 2.1 below recognizes several types of
cloud deployment models, service models, essential and common characteristics.
This figure lists “Common Characteristics” which is not part of the NIST essential
definition additional quality attributes in the lower section that can help to prioritize
what cloud features are important to organizations.
11
Figure 2.1 NIST Cloud Definition
Source: Joyner., J. (2011). How cloudy is your cloud - The NIST offers a cloud standard,
http://www.techrepublic.com/blog/networking/how-cloudy-is-your-cloud-the-nist-offers-a-
cloud-standard/4635
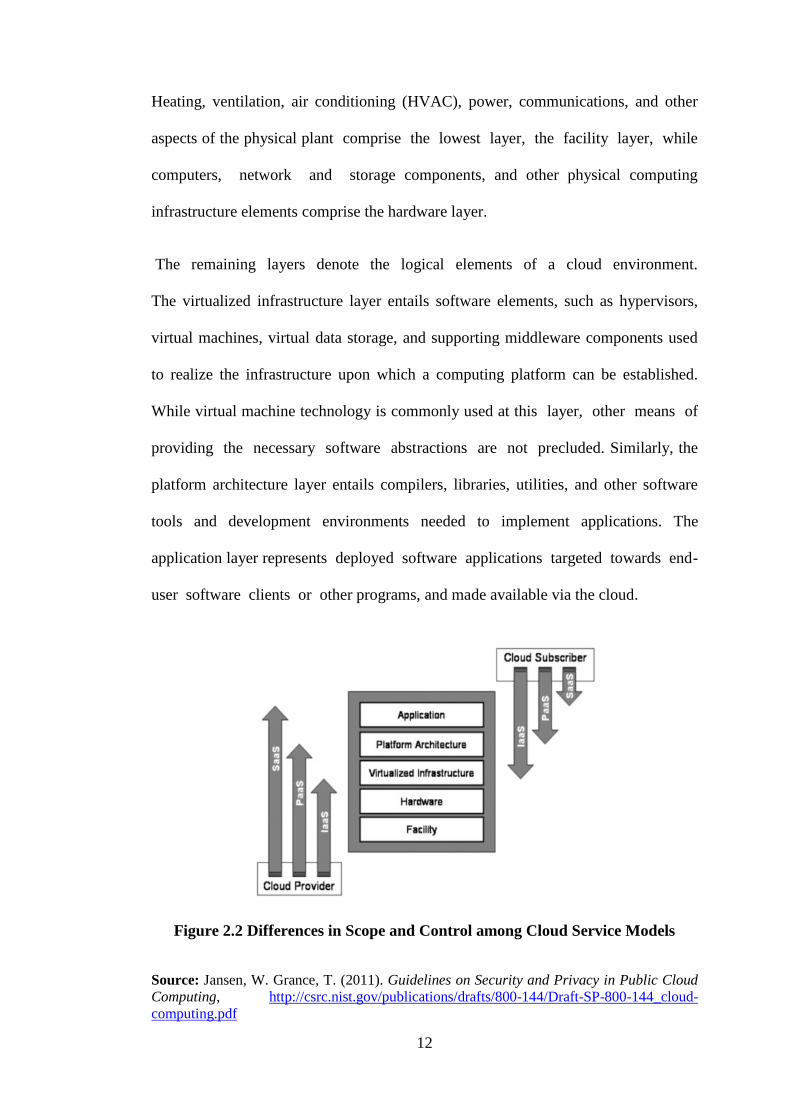
2.2.5 Differences in Scope and Control among Cloud Service
Models
The following Figure 2.2 illustrates the differences in scope and control between the
cloud subscriber and cloud provider, for each of the service models discussed above.
Five conceptual layers of a generalized cloud environment are identified in the
center diagram and apply to public clouds, as well as each of the other
deployment models. The arrows at the left and right of the diagram denote the
approximate range of the cloud provider’s and user’s scope and control over the
cloud environment for each service model. In general, the higher the level of support
available from a cloud provider, the more narrow the scope and control the cloud
subscriber has over the system (Jansen & Grance, 2011). The two lowest layers
shown denote the physical elements of a cloud environment, which are under
the full control of the cloud provider, regardless of the service model.
12
Heating, ventilation, air conditioning (HVAC), power, communications, and other
aspects of the physical plant comprise the lowest layer, the facility layer, while
computers, network and storage components, and other physical computing
infrastructure elements comprise the hardware layer.
The remaining layers denote the logical elements of a cloud environment.
The virtualized infrastructure layer entails software elements, such as hypervisors,
virtual machines, virtual data storage, and supporting middleware components used
to realize the infrastructure upon which a computing platform can be established.
While virtual machine technology is commonly used at this layer, other means of
providing the necessary software abstractions are not precluded. Similarly, the
platform architecture layer entails compilers, libraries, utilities, and other software
tools and development environments needed to implement applications. The
application layer represents deployed software applications targeted towards end-
user software clients or other programs, and made available via the cloud.
Figure 2.2 Differences in Scope and Control among Cloud Service Models
Source: Jansen, W. Grance, T. (2011). Guidelines on Security and Privacy in Public Cloud
Computing, http://csrc.nist.gov/publications/drafts/800-144/Draft-SP-800-144_cloud-
computing.pdf
13
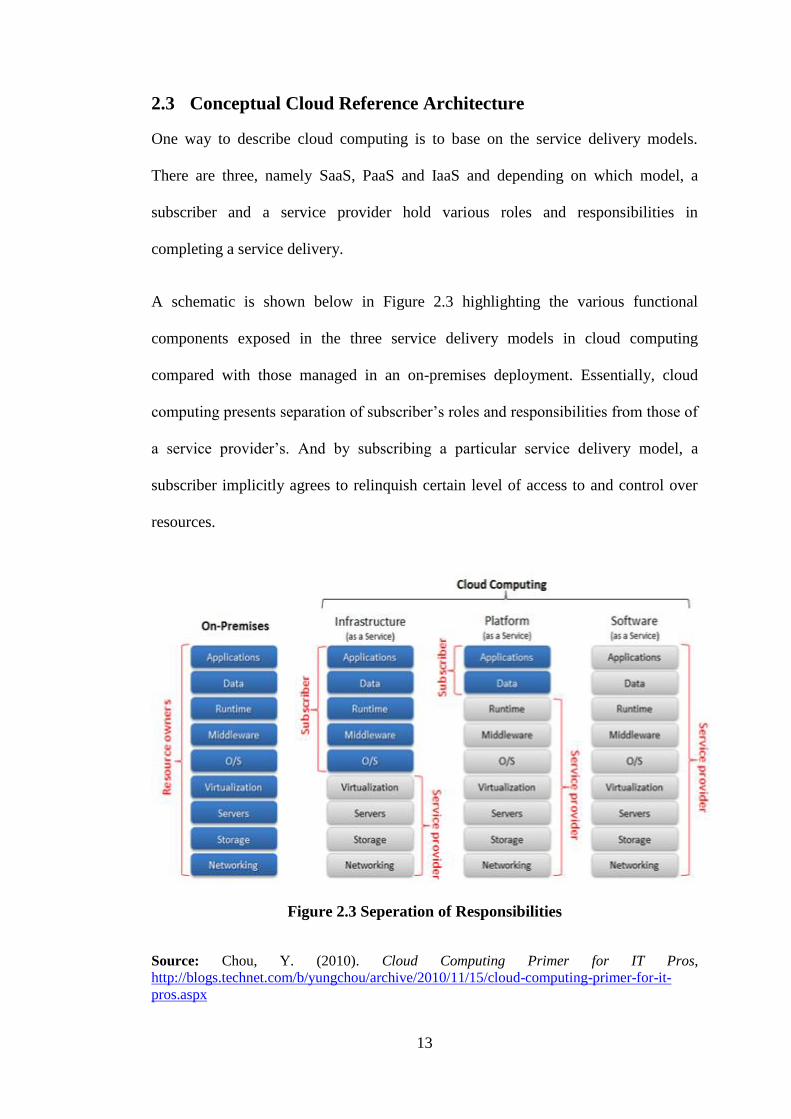
2.3 Conceptual Cloud Reference Architecture
One way to describe cloud computing is to base on the service delivery models.
There are three, namely SaaS, PaaS and IaaS and depending on which model, a
subscriber and a service provider hold various roles and responsibilities in
completing a service delivery.
A schematic is shown below in Figure 2.3 highlighting the various functional
components exposed in the three service delivery models in cloud computing
compared with those managed in an on-premises deployment. Essentially, cloud
computing presents separation of subscriber’s roles and responsibilities from those of
a service provider’s. And by subscribing a particular service delivery model, a
subscriber implicitly agrees to relinquish certain level of access to and control over
resources.
Figure 2.3 Seperation of Responsibilities
Source: Chou, Y. (2010). Cloud Computing Primer for IT Pros,
http://blogs.technet.com/b/yungchou/archive/2010/11/15/cloud-computing-primer-for-it-
pros.aspx
14
In SaaS, the entire deliveries are provided by a service provider through cloud. The
benefit to a subscriber is there is ultimately no maintenance needed, other than the
credentials to access the application, i.e. the software. At the same time, SaaS also
means there is little control a subscriber has on how the computing environment is
configured and administered outside of a subscribed application. This is the user
experience of, for example, some email offering or weather reports in Internet.
In PaaS, the offering is basically the middleware where the APIs exposed, the service
logic derived, the data manipulated, and the transactions formed. It is where most of
the magic happens.
A subscriber in this model can develop and deploy applications with much control
over the applied intellectual properties. Out of the three models, IaaS provides most
manageability to a subscriber. Form OS, runtime environment, to data and
applications all are managed and configurable. This model presents opportunities for
customizing operating procedures with the ability to on-demand provision IT
infrastructure delivered by virtual machines in cloud.
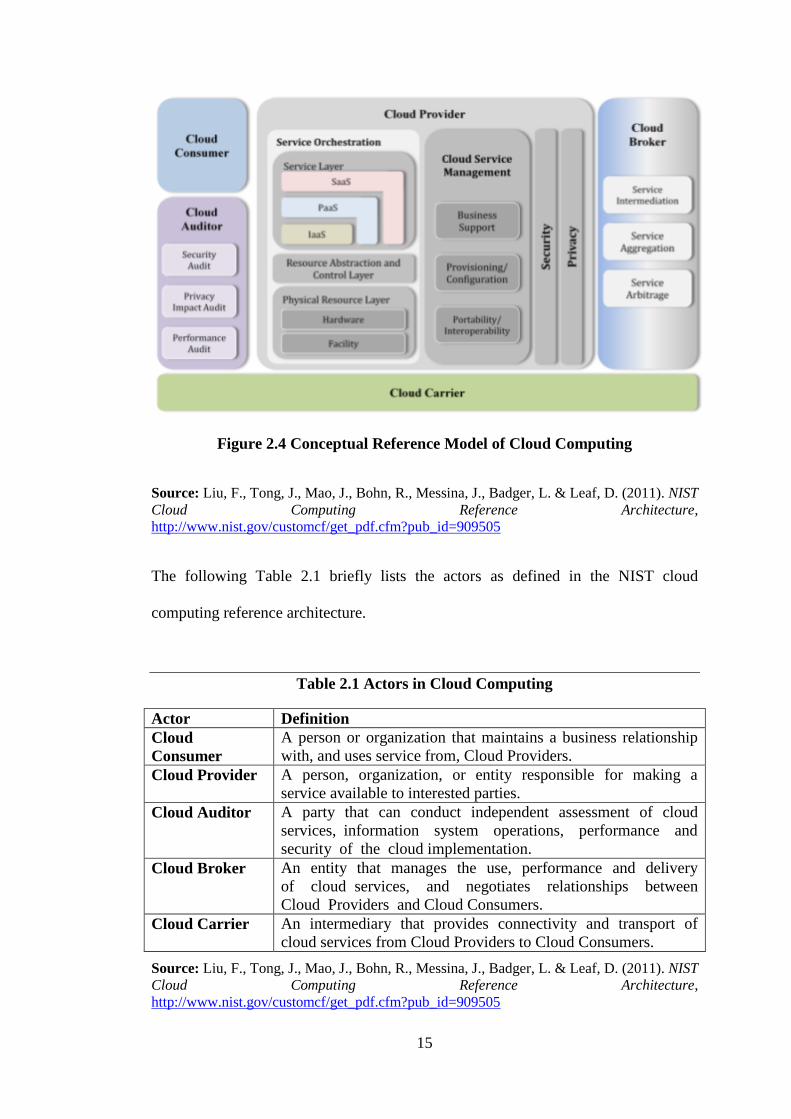
As shown in the Figure 2.4, the NIST cloud computing reference architecture defines
five major actors: cloud consumer, cloud provider, cloud carrier, cloud auditor and
cloud broker. Each actor is an entity (a person or an organization) that participates in
a transaction or process and/or performs tasks in cloud computing.
15
Figure 2.4 Conceptual Reference Model of Cloud Computing
Source: Liu, F., Tong, J., Mao, J., Bohn, R., Messina, J., Badger, L. & Leaf, D. (2011). NIST
Cloud Computing Reference Architecture,
http://www.nist.gov/customcf/get_pdf.cfm?pub_id=909505
The following Table 2.1 briefly lists the actors as defined in the NIST cloud
computing reference architecture.
Table 2.1 Actors in Cloud Computing
Actor Definition
Cloud
Consumer
A person or organization that maintains a business relationship
with, and uses service from, Cloud Providers.
Cloud Provider A person, organization, or entity responsible for making a
service available to interested parties.
Cloud Auditor A party that can conduct independent assessment of cloud
services, information system operations, performance and
security of the cloud implementation.
Cloud Broker
An entity that manages the use, performance and delivery
of cloud services, and negotiates relationships between
Cloud Providers and Cloud Consumers.
Cloud Carrier
An intermediary that provides connectivity and transport of
cloud services from Cloud Providers to Cloud Consumers.
Source: Liu, F., Tong, J., Mao, J., Bohn, R., Messina, J., Badger, L. & Leaf, D. (2011). NIST
Cloud Computing Reference Architecture,
http://www.nist.gov/customcf/get_pdf.cfm?pub_id=909505
16
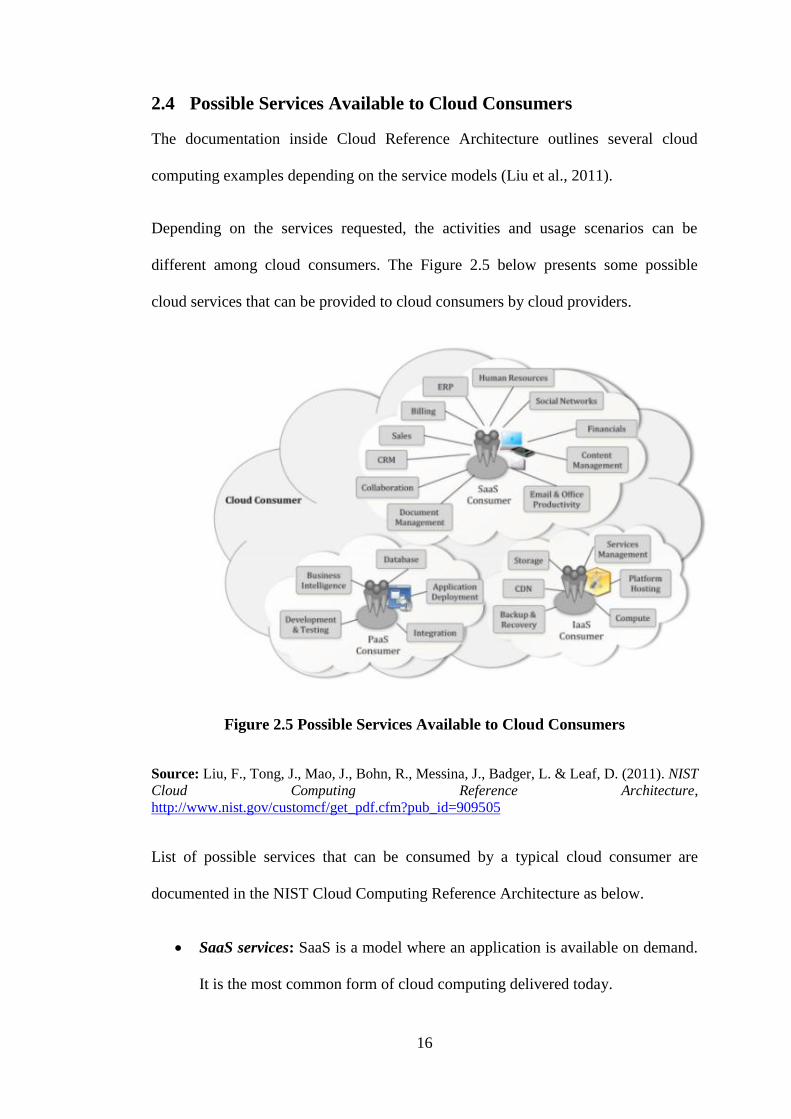
2.4 Possible Services Available to Cloud Consumers
The documentation inside Cloud Reference Architecture outlines several cloud
computing examples depending on the service models (Liu et al., 2011).
Depending on the services requested, the activities and usage scenarios can be
different among cloud consumers. The Figure 2.5 below presents some possible
cloud services that can be provided to cloud consumers by cloud providers.
Figure 2.5 Possible Services Available to Cloud Consumers
Source: Liu, F., Tong, J., Mao, J., Bohn, R., Messina, J., Badger, L. & Leaf, D. (2011). NIST
Cloud Computing Reference Architecture,
http://www.nist.gov/customcf/get_pdf.cfm?pub_id=909505
List of possible services that can be consumed by a typical cloud consumer are
documented in the NIST Cloud Computing Reference Architecture as below.
SaaS services: SaaS is a model where an application is available on demand.
It is the most common form of cloud computing delivered today.
17
o Email and Office Productivity: Applications for email, word
processing, spreadsheets, presentations, etc.
o Billing: Application services to manage customer billing based on
usage and subscriptions to products and services.
o Customer Relationship Management (CRM): CRM applications
that range from call center applications to sales force automation.
o Collaboration: Tools that allow users to collaborate in workgroups,
within enterprises, and across enterprises.
o Content Management: Services for managing the production of and
access to content for web-based applications.
o Document Management: Applications for managing documents,
enforcing document production workflows, and providing workspaces
for groups or enterprises to find and access documents.
o Financials: Applications for managing financial processes ranging
from expense processing and invoicing to tax management.
o Human Resources: Software for managing human resources
functions within companies.
o Sales: Applications that are specifically designed for sales functions
such as pricing, commission tracking, etc.
o Social Networks: Social software that establishes and maintains a
connection among users that are tied in one or more specific types of
interdependency.
o Enterprise Resource Planning (ERP): Integrated computer-based
system used to manage internal and external resources, including
tangible assets, financial resources, materials, and human resources.
18
PaaS Services: PaaS is a platform available on demand for development,
testing, deployment and on-going maintenance of applications without the
cost of buying the underlying infrastructure and software environments.
o Business Intelligence: Platforms for the creation of applications such
as dashboards, reporting systems, and data analysis.
o Database: Services offering scalable relational database solutions or
scalable non-SQL data stores.
o Development and Testing: Platforms for the development and testing
cycles of application development, which expand and contract as
needed.
o Integration: Development platforms for building integration
applications in the cloud and within the enterprise.
o Application Deployment: Platforms suited for general purpose
application development. These services provide databases, web
application runtime environments, etc.
IaaS Services: IaaS is an IT environment with ability for a subscriber to on
demand provision infrastructure. This infrastructure is, for example, delivered
with virtual machines in which a subscriber maintains the OS and installed
applications, while the underlying fabric is managed by a service provider.
o Backup and Recovery: Services for backup and recovery of file
systems and raw data stores on servers and desktop systems.
o Compute: Server resources for running cloud-based systems that can
be dynamically provisioned and configured as needed.

19
o Content Delivery Networks (CDNs): CDNs store content and files to
improve the performance and cost of delivering content for web-based
systems.
o Services Management: Services that manage cloud infrastructure
platforms. These tools often provide features that cloud providers do
not provide or specialize in managing certain application
technologies.
o Storage: Massively scalable storage capacity that can be used for
applications, backups, archival, and file storage.
20
3 PROBLEM DEFINITION
IT investment is still very risky for SMEs. The results of this research revealed that
SME owners or managers are quite dissatisfied with their existing IT investment and
IT infrastructure (Turan & Ürkmez, 2011). Many issues related to IT usage and
adoption in worldwide SMEs is also valid for Turkey. Findings of the study are as
follows (Kutlu & Ozturan, 2008):
Increased use of IT in SMEs is mainly for operational and administrative
tasks. Proof of this is the dominant use of accounting and office software.
Development of internal IT skills produce high levels of success with IT
adoption.
Evidence for this is the increase in usage of production applications
indicating a higher level of adoption in parallel with an increase in number of
program developers.
Business owners and managers with positive attitude are inclined to be more
successful in adopting and implementing new technology.
Verification of this is the positioning of SMEs in a higher level of adoption
among the ones that encouraged their employees for IT usage.
One of the factors affecting the usage and adoption of IT in SMEs is the
expected benefits of IT. The findings of this study, which is an indication of
this item, point out that, expected increase in the accuracy of information,
comfort level with technology and expected increase in the processing speed
are the major factors affecting IT implementation decisions.
21
We have analyzed the Comscore metrics reports and Email Tracker 2010 usage data
reports. We have identified the following problems for SMEs worldwide. We believe
the same issues apply to the Turkish SMEs as well.
Most of the SMEs are still running old servers in terms of hardware and
software.
One or two employees oversee whole IT operations for growing company, so
they don’t have the luxury to apply proven best practices timely.
The SMEs don’t have strong backup, restore, and disaster recovery
capability.
SMEs cannot provide high availability or reliability targets.
Performance issues such as delays in mail delivery and email not
downloading properly on smartphones.
Calendars not synchronizing correctly.
SMEs have distributed remote workforce to compete with other SMEs and
large companies.
SMEs can go global if they have new opportunities abroad.
SMEs can merge with other SMEs or can be acquired by large organizations.
SMEs don’t have enough IT resources to take on new projects.
If employees change their cell phones, then their directory of contacts do not
work properly sometimes.
SMEs need to share and collaborate with peers and partners over the internet
with fewer clicks in a secure way. For example, they need to share large files
with advertising agencies.
Companies spend a lot of time in custom reporting using old technology and
disintegrated enterprise applications.
22
Employees cannot collaborate over internet. For example, they need to edit
same documents simultaneously.
Most of the SMEs have not obtained ISO 20000 and ISO 27001 certifications
which are related to ICT. Therefore they lack security standards.
Internet facing servers are not patched timely which poses security risks.
As a consequence of these research studies, we can deduce that today most of SMEs
have some pains related to their ICT including Software Adequacy, Timeliness,
Software Maintenance, Security and Integrity, Information Content, Productivity,
Information Accuracy, Documentation, Information Format, Vendor Support, Ease
of Use, and Training and Education, which are related to new technology adoptions
and operational costs. SMEs need to focus on higher priority projects related to core
business instead of supporting IT capital investments. SMEs also need to pay only
for services used as they have limited ICT budget. The SMEs have limited
operational ICT employees so they need to reduce IT complexity. Most of the startup
companies and SMEs often try different business opportunities but very few of them
become successful, most of these initiatives fade away. Some of these new products
require extensive ICT spending due to the nature of technology. For SMEs it should
be possible to add computing resources without building new infrastructure for these
new initiatives and research efforts. SMEs mostly don’t have enough ICT budget to
apply or upgrade to the latest ICT technology so they lack competitiveness and have
relative poor productivity gains compared to large organizations. Access to leading-
edge technology for a decent cost and effort will allow SMEs to use the latest and
brightest ICT technology similar to large organizations without making huge capital
and operational expenses.
23
To alleviate these problems for SMEs, cloud computing is becoming very popular
every day because customers only pay for the computing infrastructure that they
actually use. In many cases users experience lower IT costs than if they had to buy
all the equipment, hire the technical staff to run it and maintain it, and purchase
software applications. This type of on-demand computing is beneficial to small and
medium-size companies since they can easily scale up and down their IT
requirements as the pace of their business demands it. Larger organizations however,
may not want their most sensitive data stored on servers which they don‘t control.
System reliability is also a special concern to all businesses. The unavailability of
business data and applications for even a few hours may be unacceptable. The SaaS
model means that SMEs can get the latest software and required infrastructure at a
low, monthly cost, rather than having to go through the headaches of upfront
investments, installation and upgrades themselves.
24
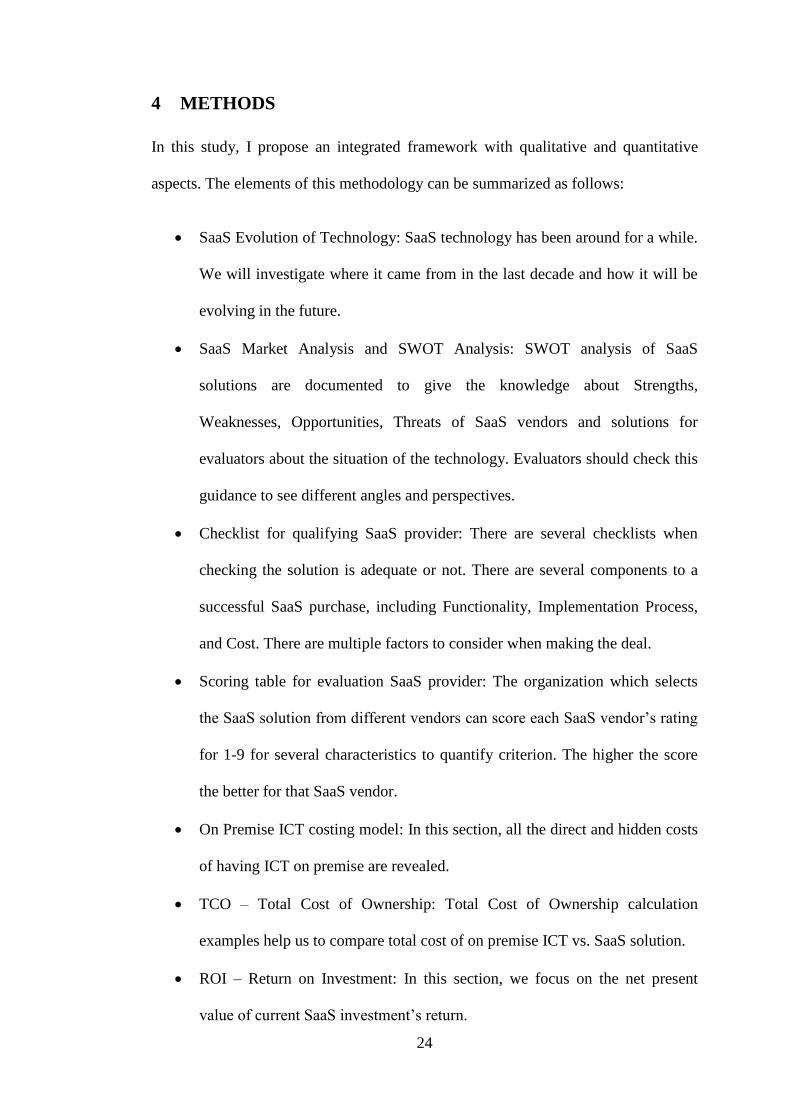
4 METHODS
In this study, I propose an integrated framework with qualitative and quantitative
aspects. The elements of this methodology can be summarized as follows:
SaaS Evolution of Technology: SaaS technology has been around for a while.
We will investigate where it came from in the last decade and how it will be
evolving in the future.
SaaS Market Analysis and SWOT Analysis: SWOT analysis of SaaS
solutions are documented to give the knowledge about Strengths,
Weaknesses, Opportunities, Threats of SaaS vendors and solutions for
evaluators about the situation of the technology. Evaluators should check this
guidance to see different angles and perspectives.
Checklist for qualifying SaaS provider: There are several checklists when
checking the solution is adequate or not. There are several components to a
successful SaaS purchase, including Functionality, Implementation Process,
and Cost. There are multiple factors to consider when making the deal.
Scoring table for evaluation SaaS provider: The organization which selects
the SaaS solution from different vendors can score each SaaS vendor’s rating
for 1-9 for several characteristics to quantify criterion. The higher the score
the better for that SaaS vendor.
On Premise ICT costing model: In this section, all the direct and hidden costs
of having ICT on premise are revealed.
TCO – Total Cost of Ownership: Total Cost of Ownership calculation
examples help us to compare total cost of on premise ICT vs. SaaS solution.
ROI – Return on Investment: In this section, we focus on the net present
value of current SaaS investment’s return.

25
Based on these methods, I have developed a simple SaaS Evaluation Framework for
SMEs as listed below:
Is SaaS the right technology for my company?
o SaaS Evolution today and future
o SaaS Market Analysis
o SaaS Maturity Model
o Advantages and Disadavantages of SaaS model
o SWOT Analysis of SaaS
How should I filter the SaaS providers?
o SaaS Provider Qualification checklist
How should I select the right SaaS providers?
o Multi Critearia Based SaaS Provider Scoring tool
How much do I spend for On Premise ICT Services? How much will I pay for
online SaaS solutions? How much will I save if go for SaaS over On Premise?
o Direct and Indirect Costs per ICT Service calculation model
o Simple TCO calculation models
o Complex TCO calculation models
Will my costs outweigh my benefits if I invest in SaaS solutions?
o Complex ROI calculation models
If we illustrate the workflow of this model using a flowchart, it can be designed as in
the following Figure 4.1:
26
Is SaaS the
right technology
for my company?
START
END
Will my costs
outweigh my benefits
if I invest
in SaaS solutions?
How should
I filter the
SaaS providers?
How should
I select the right SaaS
providers?
How much do I spend
for On Premise ICT Services?
How much will I pay for online SaaS
solutions?
How much will I save
if go for SaaS over
On Premise?
Qualitative Methods:
SaaS Evolution today and future
SaaS Market Analysis
SaaS Maturity Model
Advantages and Disadavantages of SaaS model
SWOT Analysis of SaaS
Qualitative Methods:
SaaS Provider Qualification checklist
Quantitative Methods:
Multi Critearia Based SaaS Provider Scoring
tool
Quantitative Methods:
Direct and Indirect Costs per ICT Service
calculation model
Simple TCO calculation models
Complex TCO calculation models
Quantitative Methods:
Complex ROI calculation models
Figure 4.1 Integrated Framework for Filtering and Selecting SaaS Providers

27
5 SaaS MARKET AND VENDOR ANALYSIS
The rapid adoption of all forms of Cloud IT, from IaaS to PaaS to SaaS, is changing
the way that organizations evaluate and manage the concerns related to the selection
of SaaS solutions for business operations and management. But most of all, it is
changing how firms of all sizes, and in all markets, see and manage IT. Software-as-
a-Service (sometimes referred to as “Cloud-based business solutions”) is a means of
acquiring and using software via the Internet. With SaaS, users do not need to buy,
install, and maintain applications. All maintenance and upgrades are performed by
the SaaS provider. As a result, the key benefits of SaaS center on reduced upfront
cost and simplified software management. These benefits are helping to drive very
rapid and widespread SaaS adoption in all aspects of business, from desktop
applications to departmental solutions (such as sales force automation) to core
business systems such as finance and human resources. SaaS may be acquired, used,
and paid for in a variety of ways. The provider may charge per-use or through a
periodic subscription fee. Most providers offer volume license discounts that reduce
the cost per-user significantly. As a result, the software cost is typically an operating
expense rather than a capital expense (this is of particular interest to firms who need
to conserve their capital) (Saugatuck Technology Inc Report, 2010).
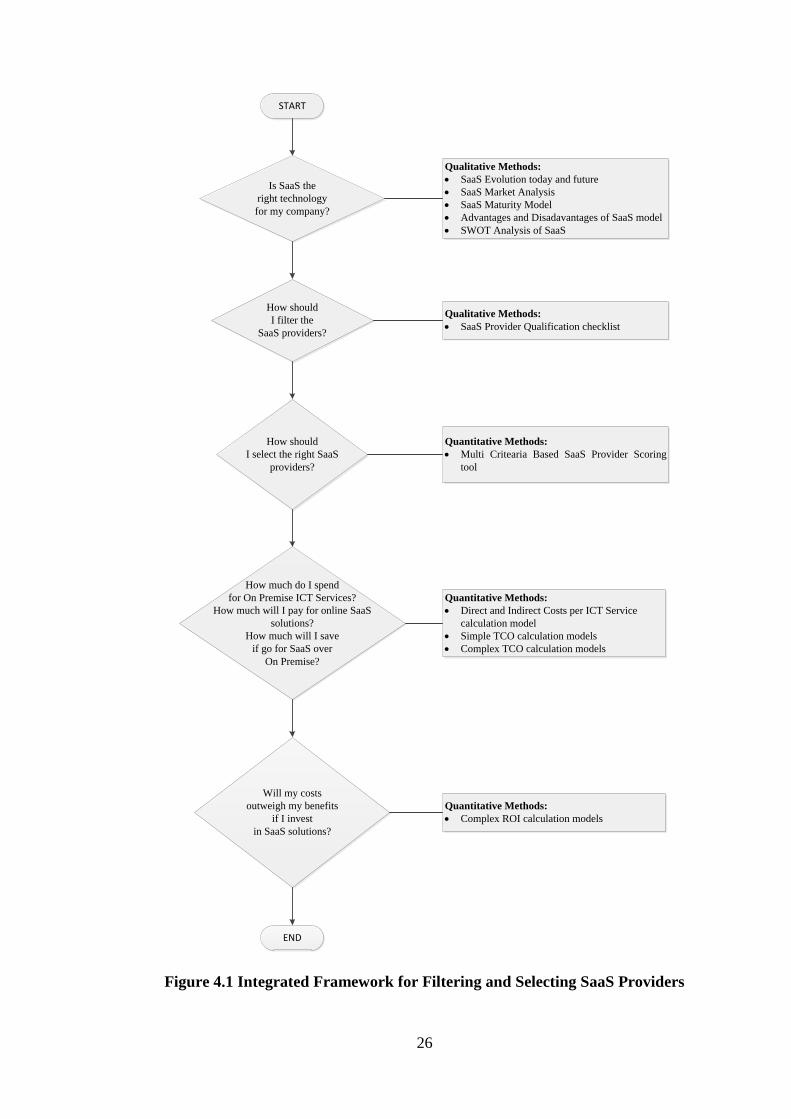
5.1 Changing Sources of Firm Software
Today many business firms continue to operate legacy systems that continue to meet
a business need and that would be extremely costly to replace. But they will purchase
or rent most of their new software applications from external sources. The following
Figure 5.1 illustrates the rapid growth in external sources of software for U.S. firms.
There are three external sources for software: software packages from a commercial
software vendor, outsourcing custom application development to an external vendor,
28
and cloud-based software services and tools. In 2010, U.S. firms will spend over
$291 billion on software. About 40 percent of that ($116 billion) will originate
outside the firm, either from enterprise software vendors selling firm wide
applications or individual application service providers leasing or selling software
modules. Another 10 percent ($29 billion) will be provided by SaaS vendors as an
online cloud-based service (Laudon & Laudon, 2011).
Figure 5.1 Sources of Software Expenditures
Source: Laudon, K.,& Laudon, J. (2011). MIS Managing the Digital Firm 12th Edition, New
Jersey: Prentice Hall, p. 192
5.2 Evolution of SaaS - Yesterday, Today, and Tomorrow
There is a dispute among analysts whether SaaS would displace standard on premise
software and hardware in the future or not. The classical software license model has
still a lot of strengths and will still find enough people that prefer this solution. But
the market share of SaaS applications will grow so that these two software
29
distribution models will complement each other. SaaS offer so many fundamental
advantages to the customer that it will not just become another IT hype that will not
last for a longer time. The strength of the one model is the weakness of the other
model and the other way round.
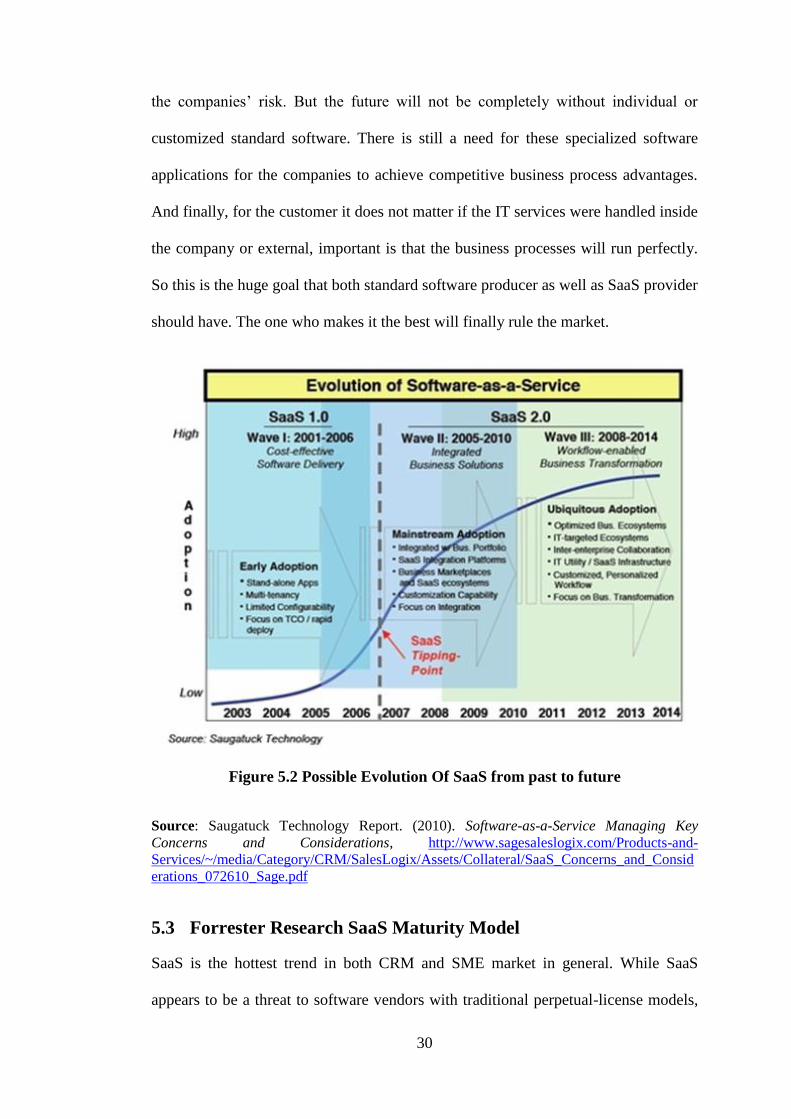
But SaaS is still just in the beginning of its evolution. The following Figure 5.2 whos
how SaasS evolved since 2003, and how it is expected to evolve by 2014. The huge
disadvantage of the SaaS model is the limited customizing. If the SaaS providers
make the provided software solutions more customizable to fit it to the special needs
of the customers -which will be quite possible - it will be much more interesting to
many companies. Many companies still do not see the potential of SaaS, especially
SMEs, or they just do not know what SaaS is at all. They often do not see that SaaS
has limited customizability. But every company that deals with the idea of using
SaaS must make itself clear what kind of restrictions - besides all advantages - SaaS
has got. So if the costs do not matter every company would get just the best
individual software solution. But in real the cost do matter so this is why standard
software is primary there and the logical continuation for the future would be SaaS.
But already today SaaS is at least an option that has to be checked before achieving
new software for a company.
All in all it will be a question of time when SaaS offers so many different add-ons
and customizing possibilities that it converges to the old application service provider
model without repeating the mistakes so that it could be called as real software
through the line. If this is done SaaS will be a very profitable business part and a
huge part of the current revenues for software implementation and integration will go
to the SaaS providers. Prospectively the customer will get the best software solution
for his company and can although source out operative IT services. That minimizes
30
the companies’ risk. But the future will not be completely without individual or
customized standard software. There is still a need for these specialized software
applications for the companies to achieve competitive business process advantages.
And finally, for the customer it does not matter if the IT services were handled inside
the company or external, important is that the business processes will run perfectly.
So this is the huge goal that both standard software producer as well as SaaS provider
should have. The one who makes it the best will finally rule the market.
Figure 5.2 Possible Evolution Of SaaS from past to future
Source: Saugatuck Technology Report. (2010). Software-as-a-Service Managing Key
Concerns and Considerations, http://www.sagesaleslogix.com/Products-and-
Services/~/media/Category/CRM/SalesLogix/Assets/Collateral/SaaS_Concerns_and_Consid
erations_072610_Sage.pdf
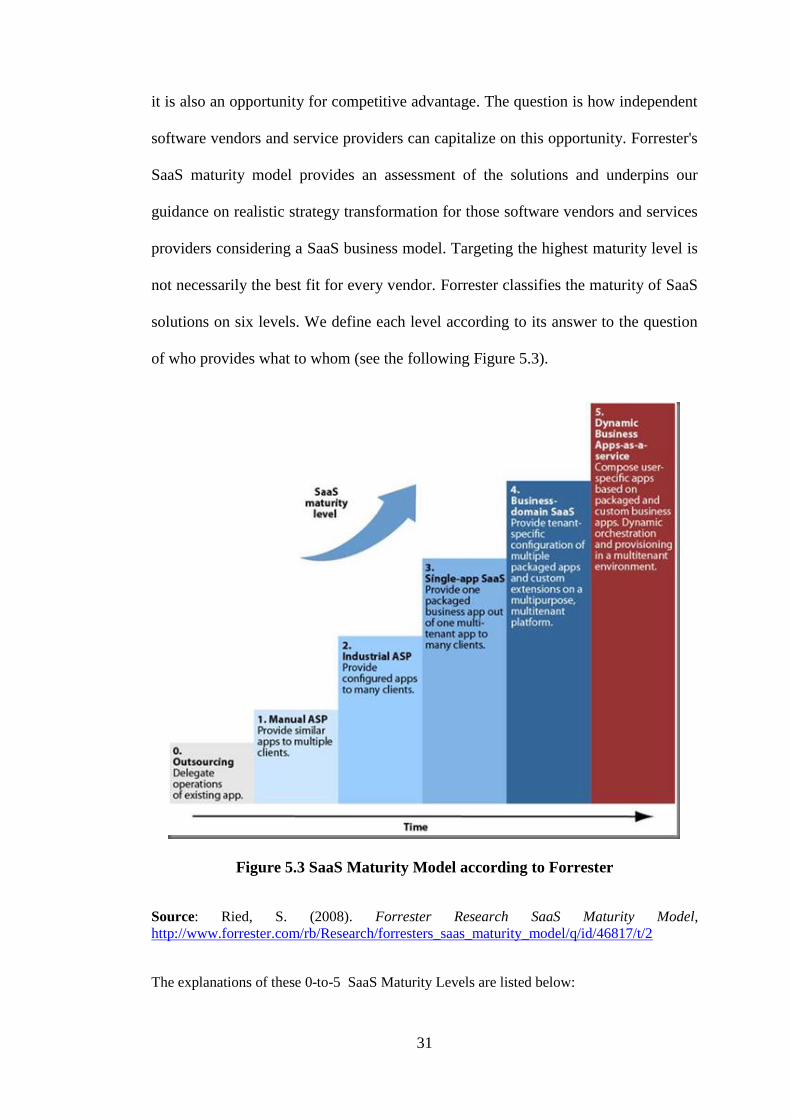
5.3 Forrester Research SaaS Maturity Model
SaaS is the hottest trend in both CRM and SME market in general. While SaaS
appears to be a threat to software vendors with traditional perpetual-license models,
31
it is also an opportunity for competitive advantage. The question is how independent
software vendors and service providers can capitalize on this opportunity. Forrester's
SaaS maturity model provides an assessment of the solutions and underpins our
guidance on realistic strategy transformation for those software vendors and services
providers considering a SaaS business model. Targeting the highest maturity level is
not necessarily the best fit for every vendor. Forrester classifies the maturity of SaaS
solutions on six levels. We define each level according to its answer to the question
of who provides what to whom (see the following Figure 5.3).
Figure 5.3 SaaS Maturity Model according to Forrester
Source: Ried, S. (2008). Forrester Research SaaS Maturity Model,
http://www.forrester.com/rb/Research/forresters_saas_maturity_model/q/id/46817/t/2
The explanations of these 0-to-5 SaaS Maturity Levels are listed below:
32
Level 0: Outsourcing is not SaaS. In outsourcing, a service provider operates
a major application or a unique application landscape for a large enterprise
customer. As the outsourcing company can't leverage this application for a
second customer, outsourcing does not qualify as SaaS.
Level 1: Manual application service provider business models target midsize
companies. At level 1, a hosting provider runs packaged applications like
SAP's ERP 6.0, which require significant IT skills, for multiple midsize
enterprises. Usually, each client has a dedicated server running its instance of
the application and is able to customize the installation in the same way as
self-hosted applications.
Level 2: Industrial ASPs cut the operating costs of packaged applications to a
minimum. At level 2, an application service provider uses sophisticated IT
management software to provide identical software packages with customer-
specific configurations to many SME customers. However, the software
package is still the same software that was originally created for self-hosted
deployment.
Level 3: Single-app SaaS is an alternative to traditional packaged
applications. At level 3, software vendors create new generations of business
applications that have SaaS capabilities built in. Web-based user interface
(UI) concepts and the ability to serve a huge number of tenants with one,
scalable infrastructure are typical characteristics. Customization is restricted
to configuration. Single-app SaaS adoption thus focuses on SMEs.
Salesforce.com's CRM application initially entered the market at this level.
Level 4: Business-domain SaaS provides all the applications for an entire
business domain. At level 4, an advanced SaaS vendor provides not only a
33
well-defined business application but also a platform for additional business
logic. This complements the original single application of the previous level
with third-party packaged SaaS solutions and even custom extensions. The
model even satisfies the requirements of large enterprises, which can migrate
a complete business domain like "customer care" toward SaaS.
Level 5: Dynamic Business Apps-as-a-service is the visionary target.
Forrester's Dynamic Business Application imperative embraces a new
paradigm of application development: "design for people, build for change."
At level 5, advanced SaaS vendors coming from level 4 will provide a
comprehensive application and integration platform on demand, which they
will prepopulate with business applications or business services. They can
compose tenant-specific and even user-specific business applications on
various levels. The resulting process agility will attract everyone, including
large enterprise customers.
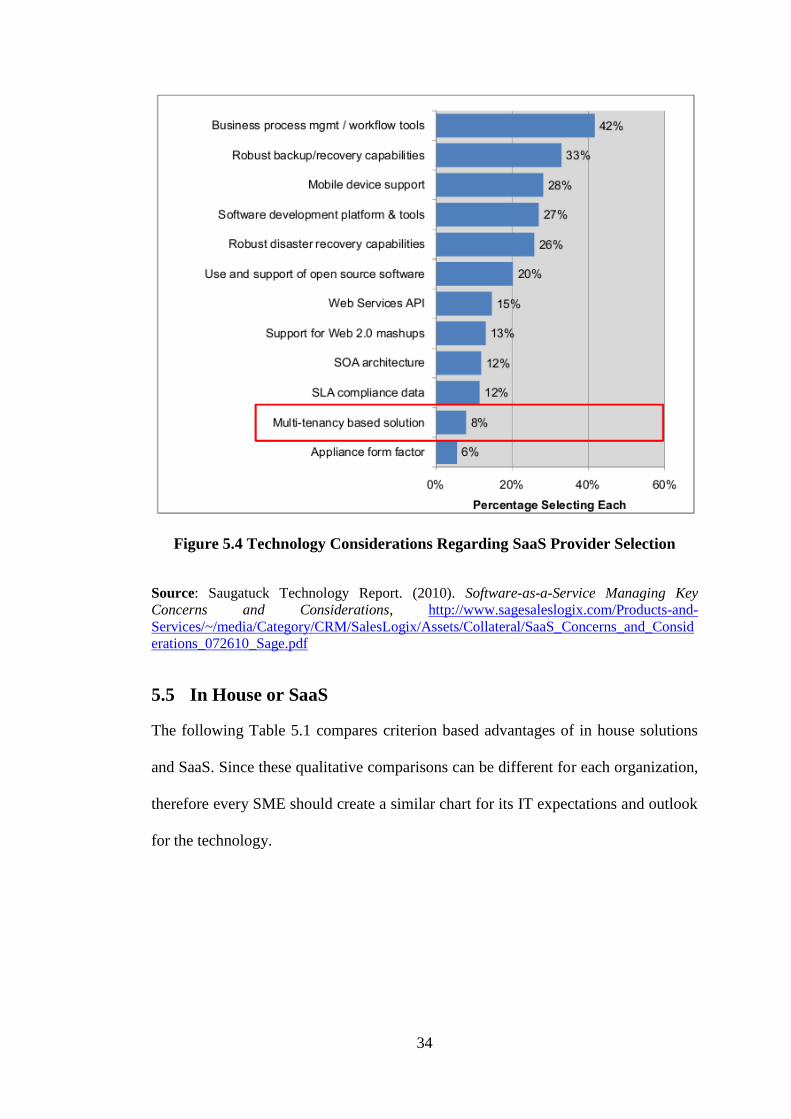
5.4 Key Technology Considerations for SaaS Providers
The following figure shows Global SMEs Executive SaaS Survey results from
Saugatuck Technology Inc. This survey results in Figure 5.4 illustrates top
technology considerations when selecting SaaS providers.
34
Figure 5.4 Technology Considerations Regarding SaaS Provider Selection
Source: Saugatuck Technology Report. (2010). Software-as-a-Service Managing Key
Concerns and Considerations, http://www.sagesaleslogix.com/Products-and-
Services/~/media/Category/CRM/SalesLogix/Assets/Collateral/SaaS_Concerns_and_Consid
erations_072610_Sage.pdf
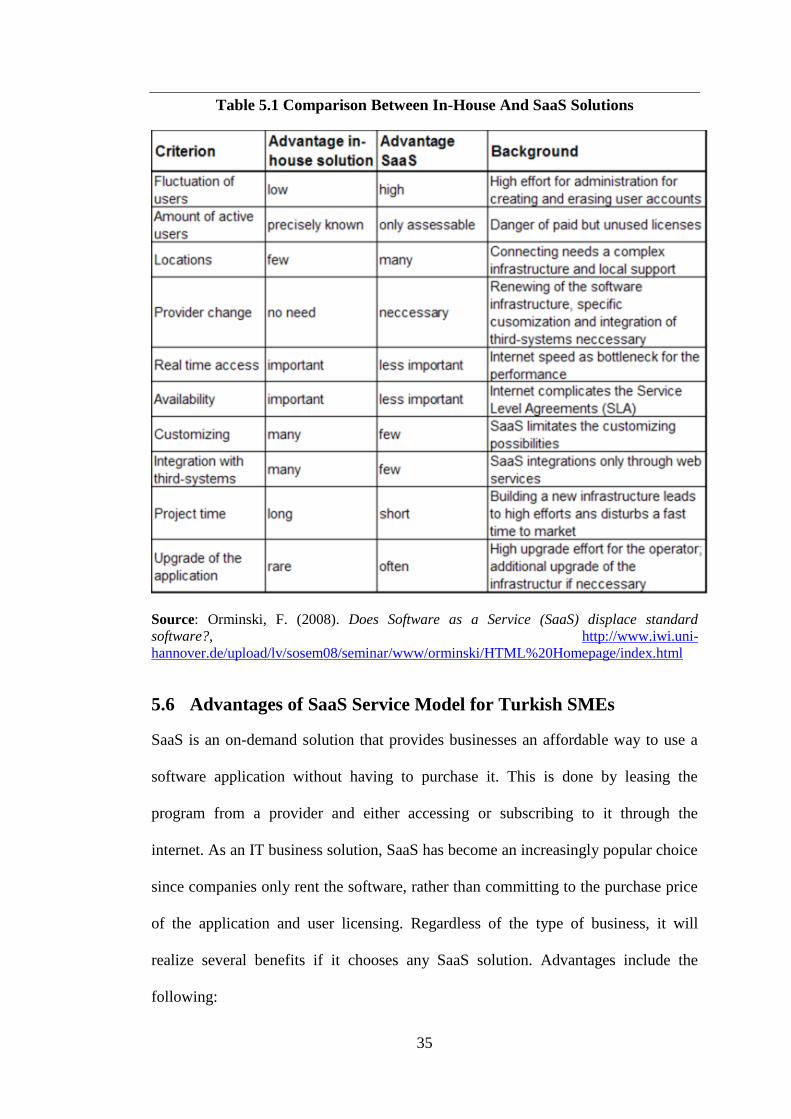
5.5 In House or SaaS
The following Table 5.1 compares criterion based advantages of in house solutions
and SaaS. Since these qualitative comparisons can be different for each organization,
therefore every SME should create a similar chart for its IT expectations and outlook
for the technology.
35
Table 5.1 Comparison Between In-House And SaaS Solutions
Source: Orminski, F. (2008). Does Software as a Service (SaaS) displace standard
software?, http://www.iwi.uni-
hannover.de/upload/lv/sosem08/seminar/www/orminski/HTML%20Homepage/index.html
5.6 Advantages of SaaS Service Model for Turkish SMEs
SaaS is an on-demand solution that provides businesses an affordable way to use a
software application without having to purchase it. This is done by leasing the
program from a provider and either accessing or subscribing to it through the
internet. As an IT business solution, SaaS has become an increasingly popular choice
since companies only rent the software, rather than committing to the purchase price
of the application and user licensing. Regardless of the type of business, it will
realize several benefits if it chooses any SaaS solution. Advantages include the
following:
36
Affordable: With SaaS, business won't have a large up-front capital expense as it
would if it chooses to purchase the software. A reasonable monthly fee is all
business will pay to have the latest version of the favorite software. Business
won't need to spend money purchasing and installing software. Business won't
have to worry about the cost of upgrading it, either. The SaaS provider will take
care of it so business doesn’t have to.
Flexible: Because SaaS is offered as an on-demand service, business can adjust
its contract to fit its staffing needs.
Stable: The SaaS applications are installed on more powerful, secure, and
redundant hardware infrastructure than business could afford to own.
Quick deployment: Because most SaaS solutions are web-based, deployment is
instantaneous, giving business immediate access to the business solutions it
needs.
Accessible: Regardless of where it does business, it will always have access to its
SaaS applications as long as it has access to the internet.
Compatible: Most SaaS applications are compatible with most systems and
smart phones.
Vendor’s Responsibility: SaaS providers are responsible for managing and
maintaining both the software and hardware components of the application. The
network issues such as data redundancy, data backup and recovery are also
planned and managed by the vendors. They upgrade the software on regular
intervals.
Ownership: Since SaaS vendors charge a set price per user per month, the firms
don’t have to pay extra money for modules they don’t even use. It literally
removes the maintenance, end user support, and administration costs of the
37
software. The implementation and customization costs of SaaS are also lower
than the traditional software. All this results in a very low TCO.
Scalability: Hosted software, another term for SaaS offers business more
scalability in using the software. By utilizing SaaS business is free to use as much
or as little part of any software as it needs. This gives business easy and
economical access to many programs.
Regular Upgrading: SaaS Vendors regularly upgrade their software, so that the
users don’t have to put any effort into installing and upgrading the applications.
Easy Access: A major advantage of SaaS is it can easily and quickly be accessed
from anywhere with a web browser. This gives users a great facility even when
they are at home or in another country. They can access real time synchronized
applications from Laptops and Smart Phones.
SLA adherence: reported bugs can be fixed minus any rollout overhead. Sure
the provider actually has to fix the issue, but assuming they’ve deployed a
moderately efficient SaaS application the rollout of a patch or fix should happen
in the blink of an eye.
Ease Internal IT Pains: SaaS offloads a great deal of IT pains incurred by
software consumers in the traditional client and server model. This leaves IT
personnel to focus on improving the day-to-day technical operations of the
company instead of being called upon to troubleshoot 3rd party software or
maintain aging infrastructure.
Redistribute IT Budget: by outsourcing software functionality to a provider, the
enterprise realizes a cost savings in infrastructure requirements and IT personnel
knowledge requirements. This allows the enterprise to focus on core
38
competencies. It also means that the cost savings from using SaaS applications
can be flat out saved, or reallocated to boost productivity through other services.
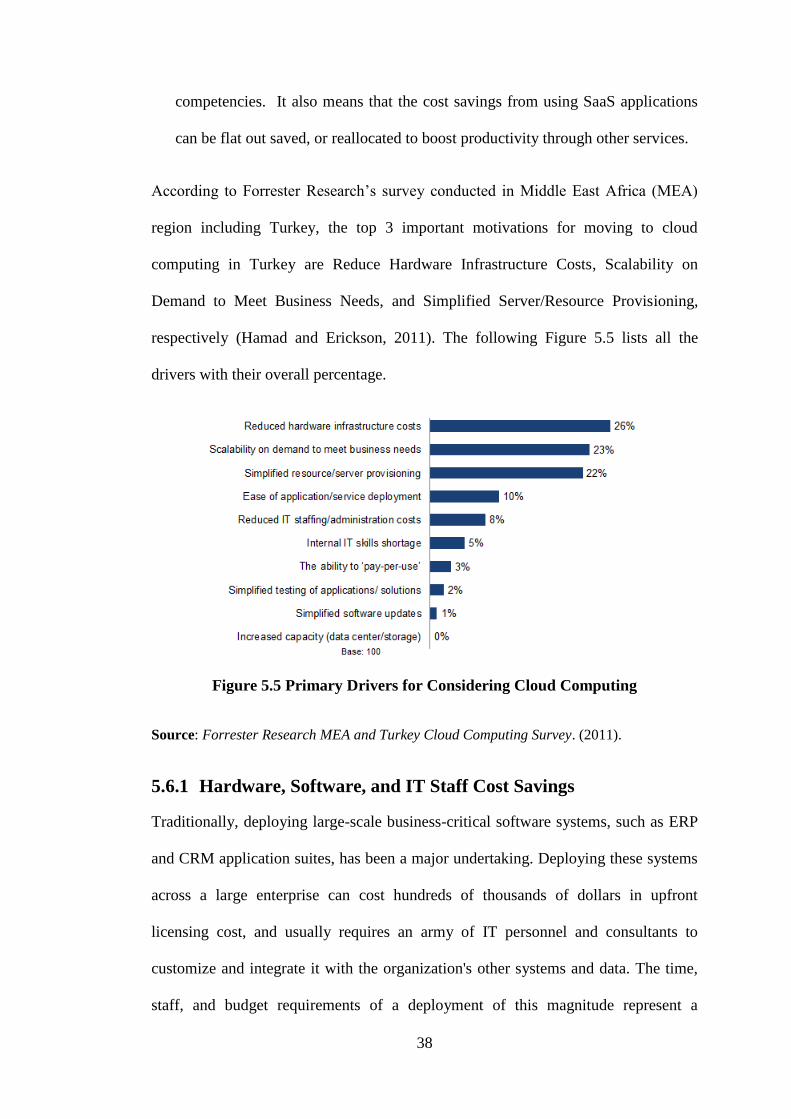
According to Forrester Research’s survey conducted in Middle East Africa (MEA)
region including Turkey, the top 3 important motivations for moving to cloud
computing in Turkey are Reduce Hardware Infrastructure Costs, Scalability on
Demand to Meet Business Needs, and Simplified Server/Resource Provisioning,
respectively (Hamad and Erickson, 2011). The following Figure 5.5 lists all the
drivers with their overall percentage.
Figure 5.5 Primary Drivers for Considering Cloud Computing
Source: Forrester Research MEA and Turkey Cloud Computing Survey. (2011).
5.6.1 Hardware, Software, and IT Staff Cost Savings
Traditionally, deploying large-scale business-critical software systems, such as ERP
and CRM application suites, has been a major undertaking. Deploying these systems
across a large enterprise can cost hundreds of thousands of dollars in upfront
licensing cost, and usually requires an army of IT personnel and consultants to
customize and integrate it with the organization's other systems and data. The time,
staff, and budget requirements of a deployment of this magnitude represent a
39
significant risk for an organization of any size, and often puts such software out of
the reach of smaller organizations that would otherwise be able to derive from it a
great deal of utility. The on-demand delivery model changes some of this. SaaS
applications don't require the deployment of a large infrastructure at the client's
location, which eliminates or drastically reduces the upfront commitment of
resources. With no significant initial investment to amortize, an enterprise that
deploys a SaaS application that turns out to produce disappointing results can walk
away and pursue a different direction, without having to abandon an expensive on-
premise infrastructure. Additionally, if custom integration is not required, SaaS
applications can be planned and executed with minimal effort and roll-out activities,
creating one of the shortest time-to-value intervals possible for a major IT
investment. This has also made it possible for a number of SaaS vendors to offer
risk-free "test drives" of their software for a limited period, such as 30 days. Giving
prospective customers a chance to try the software before they buy it helps eliminate
much of the risk surrounding software purchase.
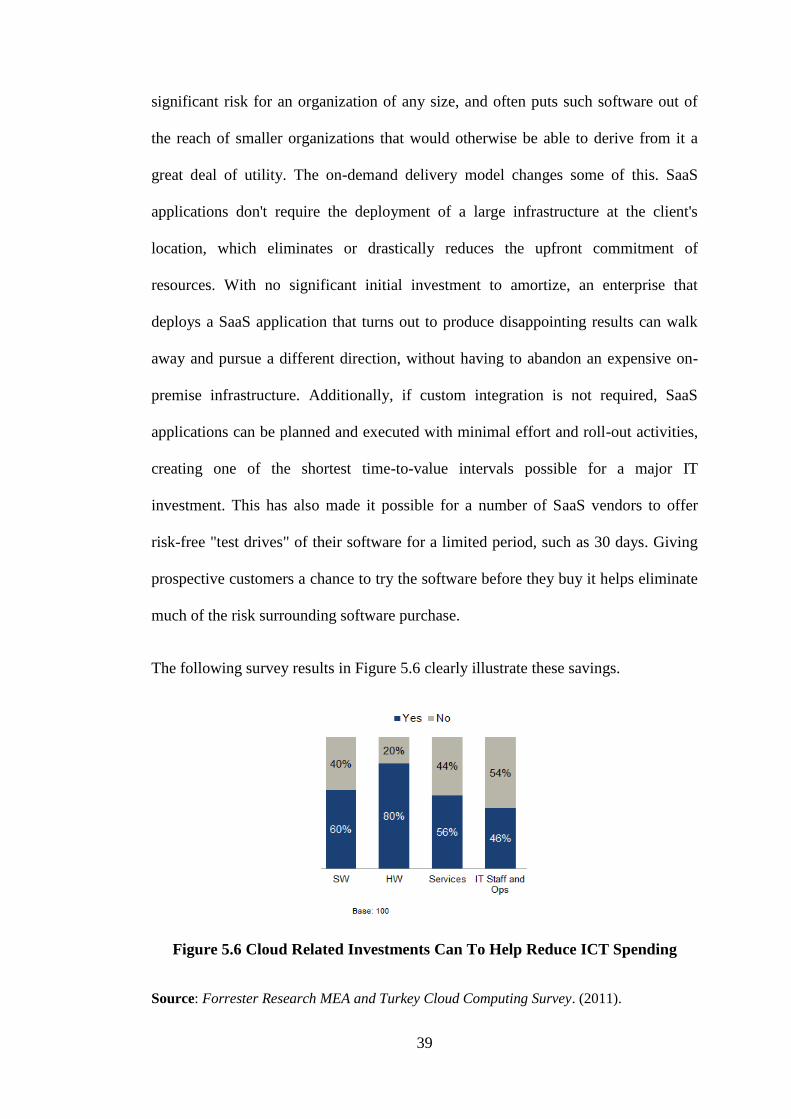
The following survey results in Figure 5.6 clearly illustrate these savings.
Figure 5.6 Cloud Related Investments Can To Help Reduce ICT Spending
Source: Forrester Research MEA and Turkey Cloud Computing Survey. (2011).
40
5.6.2 Easy To Adopt
SaaS applications are available from any computer or any device, anytime, and
anywhere. Because most people are familiar with using the Internet to find what they
need using MSN, Hotmail, or use FaceBook applications, SaaS apps tend to have
high adoption rates, with a lower learning curve.
5.6.3 Less Problematic Software Updates and Patches
Because the SaaS provider manages all updates and upgrades, there are no patches
for customers to download or install.
5.6.4 Scalability on Peak Times
The management burden of anticipating and building out excess capacity IT
infrastructure decreases. The result is less management, maintenance, and
deployment time, with the additional benefit of greater scalability to more easily
handle peaks in demand. The key observation is that Cloud Computing’s ability to
add or remove resources at a fine grain and with a lead time of minutes rather than
weeks allows matching resources to workload much more closely. Real world
estimates of server utilization in datacenters range from 5% to 20%. This may sound
shockingly low, but it is consistent with the observation that for many services the
peak workload exceeds the average by factors of 2 to 10. Few users deliberately
provision for less than the expected peak, and therefore they must provision for the
peak and allow the resources to remain idle at nonpeak times. The more pronounced
the variation, the more the waste (Armbrust et al., 2009).
Assume our service has a predictable daily demand where the peak requires 500
servers at noon but the trough requires only 100 servers at midnight, as shown in
Figure 5.7. As long as the average utilization over a whole day is 300 servers, the

41
actual utilization over the whole day (shaded area under the curve) is 300 x 24 =
7200 server-hours; but since we must provision to the peak of 500 servers, we pay
for 500 x 24 = 12000 server-hours, a factor of 1.7 more than what is needed.
Therefore, as long as the pay-as-you-go cost per server-hour over 3 years4 is less
than 1.7 times the cost of buying the server, we can save money using utility
computing (Armbrust et al., 2009).
Figure 5.7 Provisioning For Peak Load
Source: Armbrust, M., Fox, A., Griffith, R., Joseph, A.D., Katz, R.H., Konwinski, A., Lee,
G., Patterson, D.A., Rabkin, A., Stoica, I. & Zaharia, M. (2009). Above the Clouds: A
Berkeley View of Cloud Computing,
http://www.eecs.berkeley.edu/Pubs/TechRpts/2009/EECS-2009-28.html, p.13
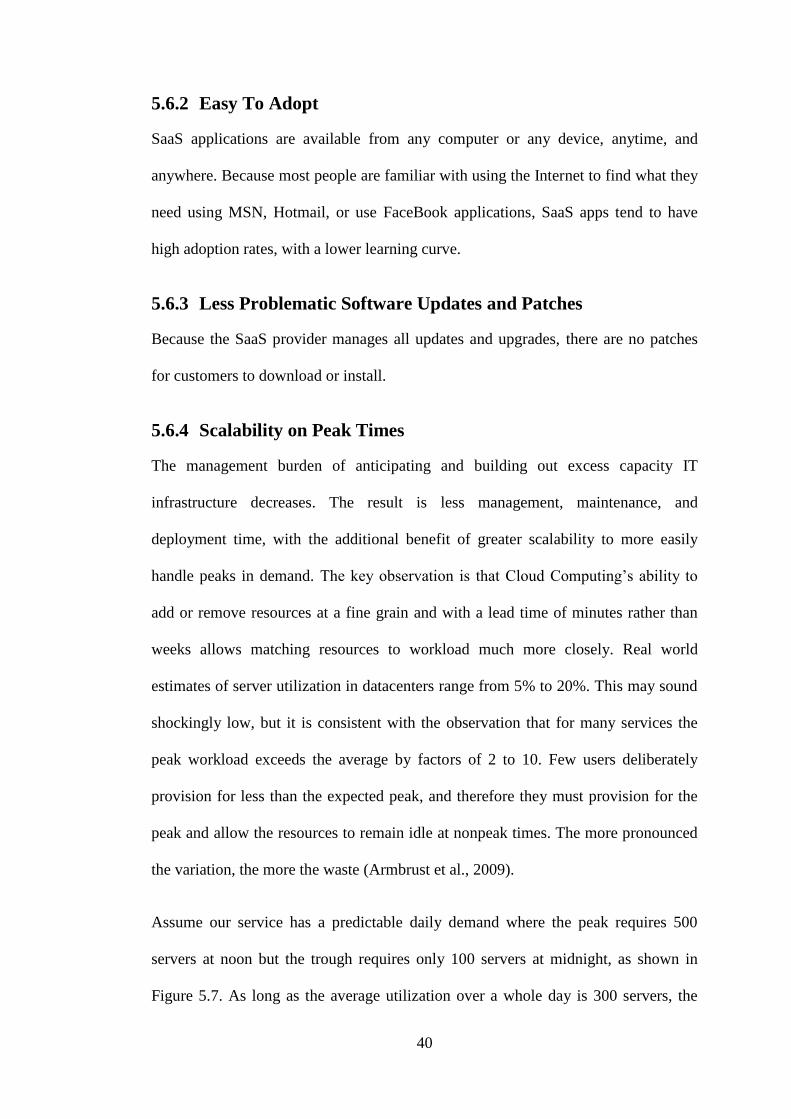
In addition to simple diurnal patterns, most nontrivial services also experience
seasonal or other periodic demand variation (e.g., e-commerce peaks in December
and photo sharing sites peak after holidays) as well as some unexpected demand
bursts due to external events (e.g., news events). Since it can take weeks to acquire
and rack new equipment, the only way to handle such spikes is to provision for them
in advance. Even if service operators predict the spike sizes correctly, capacity is
wasted, and if they overestimate the spike they provision for, it’s even worse. They
may also underestimate the spike as shown in the Figure 5.8, however, accidentally
turning away excess users (Armbrust et al., 2009).
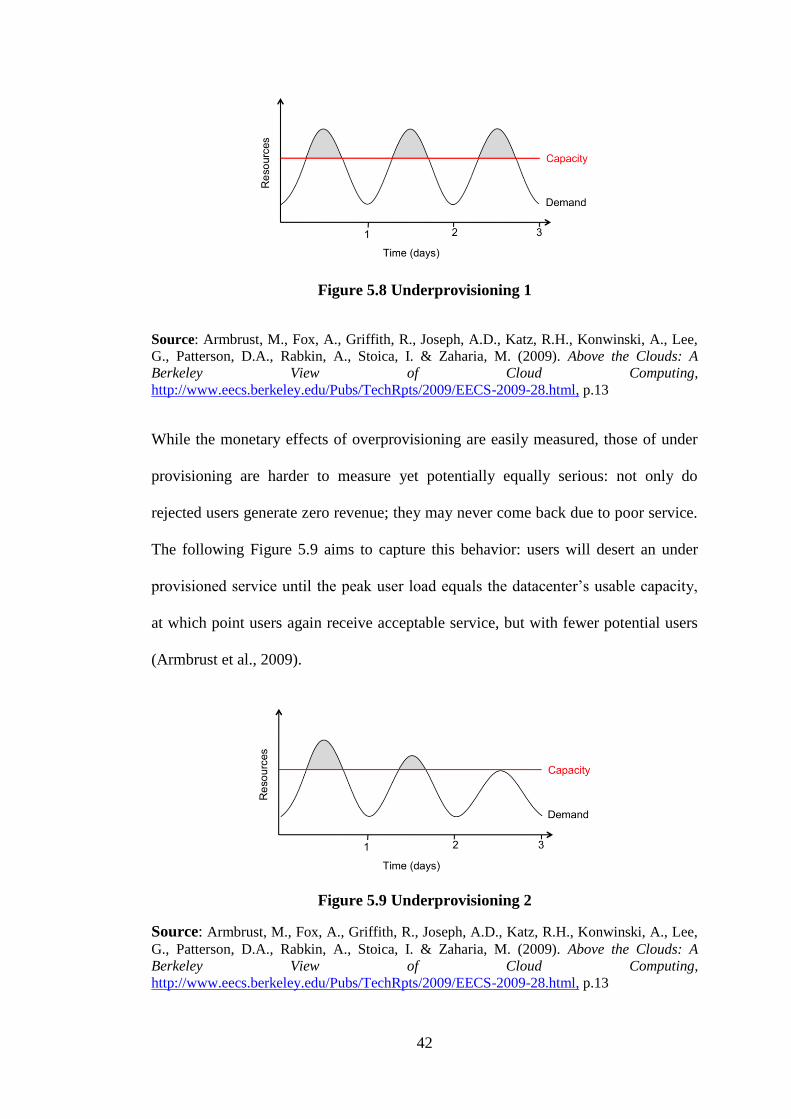
42
Figure 5.8 Underprovisioning 1
Source: Armbrust, M., Fox, A., Griffith, R., Joseph, A.D., Katz, R.H., Konwinski, A., Lee,
G., Patterson, D.A., Rabkin, A., Stoica, I. & Zaharia, M. (2009). Above the Clouds: A
Berkeley View of Cloud Computing,
http://www.eecs.berkeley.edu/Pubs/TechRpts/2009/EECS-2009-28.html, p.13
While the monetary effects of overprovisioning are easily measured, those of under
provisioning are harder to measure yet potentially equally serious: not only do
rejected users generate zero revenue; they may never come back due to poor service.
The following Figure 5.9 aims to capture this behavior: users will desert an under
provisioned service until the peak user load equals the datacenter’s usable capacity,
at which point users again receive acceptable service, but with fewer potential users
(Armbrust et al., 2009).
Figure 5.9 Underprovisioning 2
Source: Armbrust, M., Fox, A., Griffith, R., Joseph, A.D., Katz, R.H., Konwinski, A., Lee,
G., Patterson, D.A., Rabkin, A., Stoica, I. & Zaharia, M. (2009). Above the Clouds: A
Berkeley View of Cloud Computing,
http://www.eecs.berkeley.edu/Pubs/TechRpts/2009/EECS-2009-28.html, p.13
43
5.6.5 Pay per Use Financial Model
SaaS vendors are compensated by users for the use of the hosted software. Payments
can be either on a pay-per-use basis or as a monthly payment. Some SaaS
applications are available completely free of charge while others are open source (the
customer decided where to host the application). But the one thing all SaaS
applications have in common is that they are all delivered as web applications to the
browser.
5.6.6 Improved Release Management and Testing of New Releases
In the earliest stages of assessing the feasibility of a Cloud Computing solution it is
key for the business and Cloud delivery provider to understand the requirement
for a Cloud solution within that business’ context. The business must carefully
document what they require from such a solution clearly and unambiguously. As
with the development of any solution, business requirements are the key driver
to the success of the solution. As business look more and more often to third
parties to deliver these solutions, the foundations for the delivery must be solid.
Business requirements are these foundations. Static Testing on business
requirements will ensure that these are concise and complete. Undergoing the
process of reviews and workshops to understand what is being asked for in
business requirements will save time and money later in the development lifecycle
by removing potential software defects before they are built. Cloud Computing
solutions claim to be scalable on demand. How does the business verify that the
solution delivered is capable of coping with the workload which it is required to
undertake? Load or Stress testing can be used to prove that the developed solution
can scale as required. By using test techniques and tools which are capable of
applying huge amounts of load on the solution the Cloud can be accurately

44
measured and its capacity verified. Using a distributed Cloud Computing solution
should mean that the delivery will perform to a high standard. Performance
testing techniques allow the systems performance to be measured and verified
accurately. Using performance testing and load testing techniques in tandem allows
an accurate image of the solutions ability over the cloud to be created. This in turn
provides the comfort that the system is constructed so as to be capable of acting as
delivery mechanism for the business requirement. Security testing can provide
assurance that business critical data is stored and transported safely. Techniques such
as Penetration Testing can prove that the mechanisms, which have been developed to
maintain security, will remain intact during potential attempts to compromise the
Cloud solution (AppLabs Report, 2009).
5.6.7 Rapid Resource Provisioning
A cloud model gives business the ability to respond to business demands more
effectively and helps ensure employees have on-demand access to critical business
information, customers, partners, and each other, using nearly any device, from
virtually anywhere. The result is they can give priority to the most critical business
tasks first.
5.6.8 SLAs
Businesses must exercise caution when using software outsourcing or SaaS
providers. If things can go wrong, they likely will. Service level agreements (SLA)
help protect both customers and the service providers. Here are the main points of
SLAs (Laudon & Laudon, 2011).
Defines responsibilities of the service provider and level of service expected
by the customer
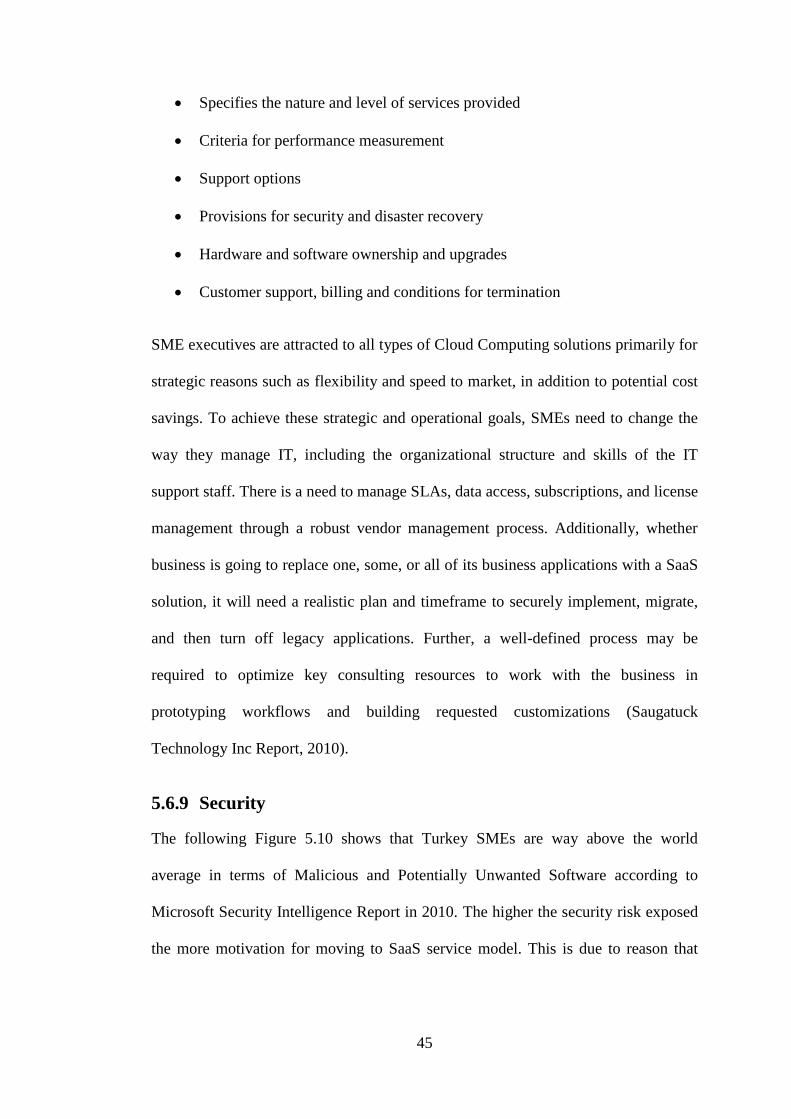
45
Specifies the nature and level of services provided
Criteria for performance measurement
Support options
Provisions for security and disaster recovery
Hardware and software ownership and upgrades
Customer support, billing and conditions for termination
SME executives are attracted to all types of Cloud Computing solutions primarily for
strategic reasons such as flexibility and speed to market, in addition to potential cost
savings. To achieve these strategic and operational goals, SMEs need to change the
way they manage IT, including the organizational structure and skills of the IT
support staff. There is a need to manage SLAs, data access, subscriptions, and license
management through a robust vendor management process. Additionally, whether
business is going to replace one, some, or all of its business applications with a SaaS
solution, it will need a realistic plan and timeframe to securely implement, migrate,
and then turn off legacy applications. Further, a well-defined process may be
required to optimize key consulting resources to work with the business in
prototyping workflows and building requested customizations (Saugatuck
Technology Inc Report, 2010).
5.6.9 Security
The following Figure 5.10 shows that Turkey SMEs are way above the world
average in terms of Malicious and Potentially Unwanted Software according to
Microsoft Security Intelligence Report in 2010. The higher the security risk exposed
the more motivation for moving to SaaS service model. This is due to reason that
46
high security risk is an indicator for SMEs not managing their ICT well in terms of
Security.
Figure 5.10 Malicious and Potentially Unwanted Software
Source: Microsoft Security Intelligence Report. (2010).
5.6.10 Few Technical Skills Required for New Technology
With SaaS, the job of deploying an application and keeping it running from day to
day such as testing and installing patches, managing upgrades, monitoring
performance, ensuring high availability, and so forth, is handled by the SaaS
provider. By transferring the responsibility for these "overhead" activities to a third
party, the IT department can focus more on high-value activities that align with and
support the business goals of the enterprise. Instead of being primarily reactive and
operations-focused, the chief information officer and IT staff can more effectively
function as technology strategists to the rest of the company, working with business
47
units to understand their business needs and advise them on how to use technology
best to accomplish their objectives. Far from being made obsolete by SaaS, the IT
department has an opportunity to contribute to the success of the enterprise more
directly than ever before.
5.7 Disadvantages of SaaS Service Model for Turkish SMEs
Some of the key disadvantages of SaaS are documented below:
Security and confidentiality: While working from anywhere / anytime is an
important aspect of SaaS this also implies that sensitive data has to be stored
online on third party servers. This can be an issue in some of the functions for
example, accounting, etc.
Risk of data loss: The SaaS provider has to be chosen wisely as there is an
inherent risk of losing valuable data if the vendor goes out of business.
Dependence on high speed internet: A high speed internet connection is
must for SaaS, while this is not a big challenge in developed nation, it can be
a serious limitation in developing nations with poor infrastructure and
unreliable connectivity. Thus firms should choose wisely understanding the
connectivity bottleneck.
Low predictability of cost: Based on a survey by Gartner, current customers
were least satisfied with the lack of predictability of cost in SaaS
implementation. This primarily is because of the unpredictability in post-sales
support and maintenance services.
Not all applications have SaaS versions yet: Many firms need very industry
specific business applications which do not have a SaaS version presently.
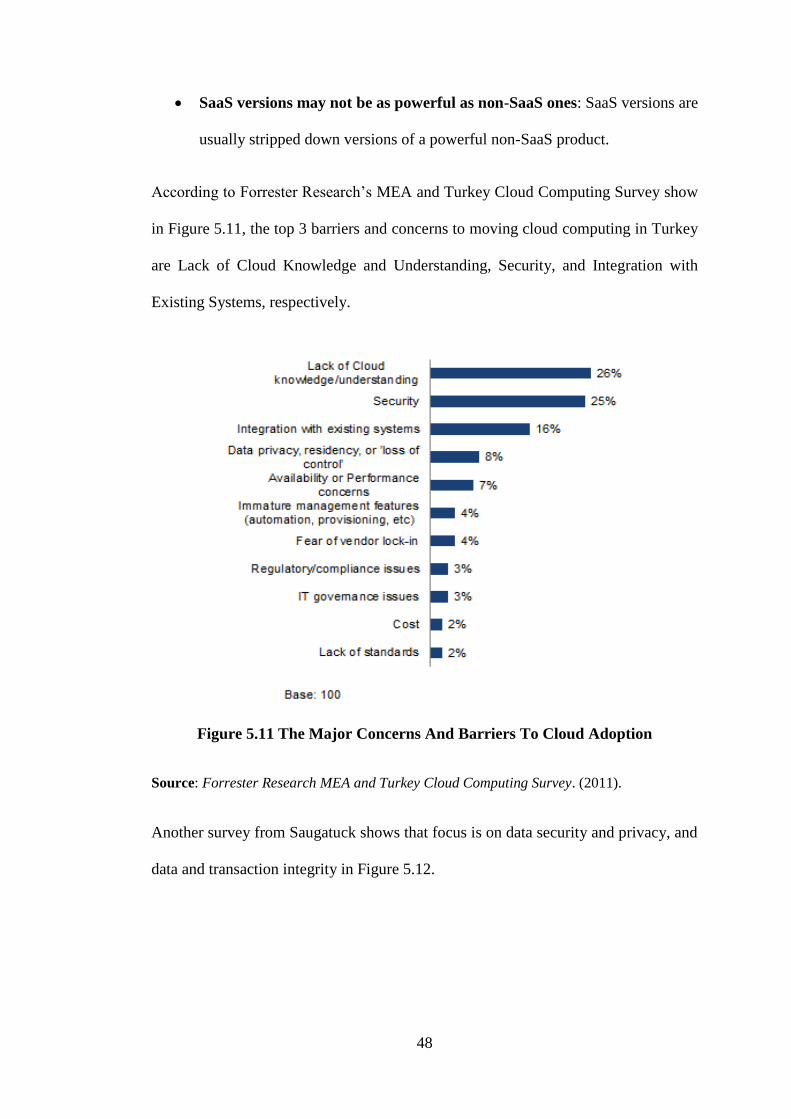
48
SaaS versions may not be as powerful as non-SaaS ones: SaaS versions are
usually stripped down versions of a powerful non-SaaS product.
According to Forrester Research’s MEA and Turkey Cloud Computing Survey show
in Figure 5.11, the top 3 barriers and concerns to moving cloud computing in Turkey
are Lack of Cloud Knowledge and Understanding, Security, and Integration with
Existing Systems, respectively.
Figure 5.11 The Major Concerns And Barriers To Cloud Adoption
Source: Forrester Research MEA and Turkey Cloud Computing Survey. (2011).
Another survey from Saugatuck shows that focus is on data security and privacy, and
data and transaction integrity in Figure 5.12.
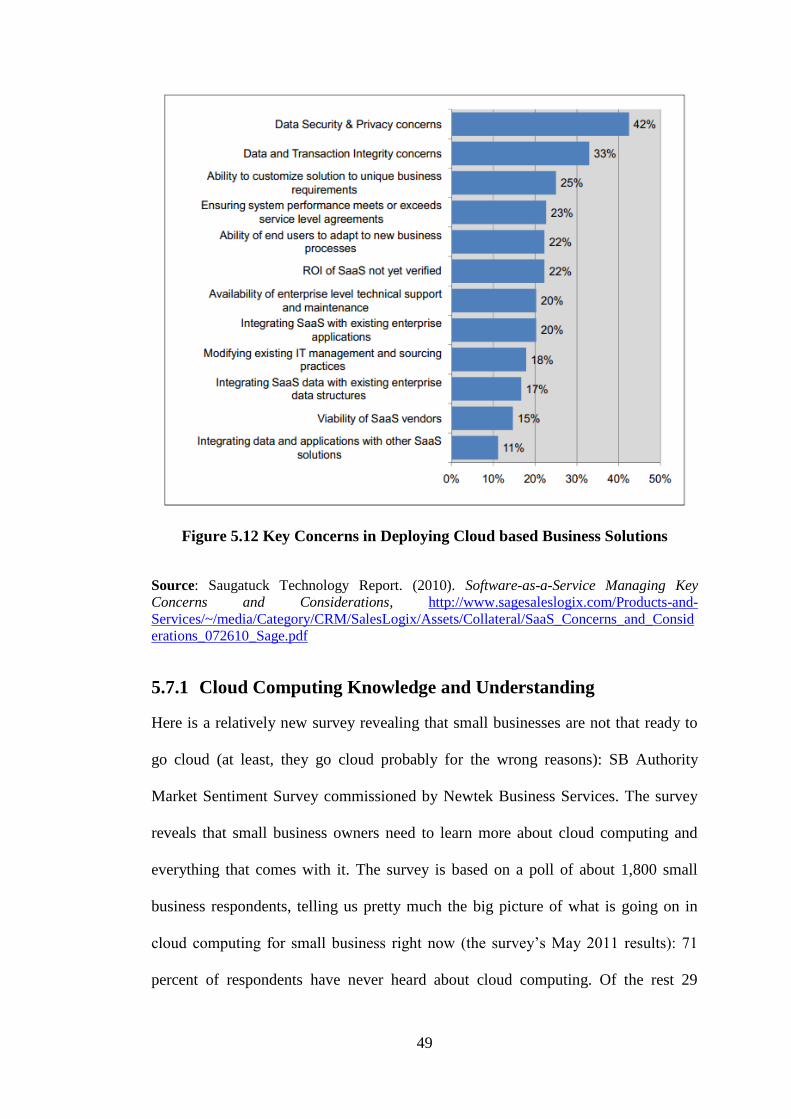
49
Figure 5.12 Key Concerns in Deploying Cloud based Business Solutions
Source: Saugatuck Technology Report. (2010). Software-as-a-Service Managing Key
Concerns and Considerations, http://www.sagesaleslogix.com/Products-and-
Services/~/media/Category/CRM/SalesLogix/Assets/Collateral/SaaS_Concerns_and_Consid
erations_072610_Sage.pdf
5.7.1 Cloud Computing Knowledge and Understanding
Here is a relatively new survey revealing that small businesses are not that ready to
go cloud (at least, they go cloud probably for the wrong reasons): SB Authority
Market Sentiment Survey commissioned by Newtek Business Services. The survey
reveals that small business owners need to learn more about cloud computing and
everything that comes with it. The survey is based on a poll of about 1,800 small
business respondents, telling us pretty much the big picture of what is going on in
cloud computing for small business right now (the survey’s May 2011 results): 71
percent of respondents have never heard about cloud computing. Of the rest 29

50
percent who have heard about cloud computing, 74 percent can’t describe what cloud
computing is. Regarding the knowledge about IT security, 78 percent of respondents
think that their data is secure; they don’t have complete documentation on critical
data, information, software and hardware that are stored on-premise IT system. In
relation to that, 71 percent of respondents confess that the important data, software
and hardware they have are not being backed up off-site. The question is, when
disaster strikes, will small business owners be able to recover the all important data?
What about if their system is hacked and get their important data and information
stolen? What if their entire business is going down because the cloud they adopt is
proven to be not as stable and/or secure as the think? It seems that small business
owners need to learn more about the cloud and collaborate with more cloud-savvy
and IT security-savvy people – including hiring one or two. The cloud computing –
with all the benefits and caveats that come with it – can help small businesses to
secure their important data, hardware and software – both off-site and on-site. That
being said, small business owners need to understand that they need to secure their
data on and off the cloud – typically done by creating backups on on-premise IT
system and vice versa (Ivan, 2011).
5.7.2 Security
Leveraging a SaaS solution does not exempt that organization from the required
regulatory controls of data compliance. SMEs need to manage compliance through
controls and audits, especially when data may be hosted in a different country and
with a different subcontractor like a hosting provider. Ensure that business is not
breaking any country laws related to transfer of customer data or access/sharing of
customer data. Also make certain that business has access to the data, and there is an
established medium for the distribution of data to its organization should it con-sider
51
moving to another solution. Ensure that the SaaS provider has demonstrated controls
and acceptable adherence to those controls has been attained. Anyone considering
SaaS must look closely at providers’ security and privacy services, and ask
specifically about Sarbanes Oxley or COBIT audit certification. Firms in the health-
care industry considering a SaaS solution should also ask about HIPAA compliance
in regard to the Privacy Rule (Saugatuck Technology Inc Report, 2010).
5.7.3 System Integration Capability
To maximize their benefit, SaaS solutions need to integrate with existing enterprise
systems. Depending on the business requirements and the integration capabilities of
the chosen SaaS product, the integration approach may not be trivial. While a
comprehensive API offered by SaaS is a must-have, in most cases a custom SaaS
integration layer will be needed to comply with SOA principles and to facilitate
integration with existing systems. SaaS integration projects are not much different
than typical integration projects. Unless the integration requirements are very simple,
it makes more sense to use an integration product as the foundation of the SaaS
integration layer, instead of custom-building such a layer. In most cases there may be
a standard integration product used within the organization and more than often, this
same product should be used for integrating the SaaS solution. An Enterprise Service
Bus (ESB) is often a good integration product that will address most of the
integration needs. In other cases, the SaaS Integration layer may be comprised of one
or more integration products.
5.7.4 Ability to Move Among SaaS Providers and Ability to Change
Deployment Models When Necessary
Given the amount of customization that the company has invested in, it is becoming
increasingly clear that there is no easy answer – and no free lunch. One of the
52
reasons that the company had decided to implement SaaS was the assumption that it
would be possible to migrate from one SaaS application to another. However, while
it might be possible to migrate basic data from a SaaS application, it is almost
impossible to migrate the process information. Switching from one SaaS solution to
another is not so different from switching from one on-site application to another.
The main issue regarding the SaaS vendor is to make sure that the data can be
transferred to the hands of the enterprise at any time. Today the most common
methods are to enable the export of reports in a CSV format and to download the full
database. Even in this simple case the actual migration in the SaaS case will be easier
because the company doesn’t need additional sets of hardware infrastructure for the
migration to take place. Furthermore SaaS vendors develop import tools so that a
new customer will can easily migrate the data, whether it is in a raw spreadsheet or
even in the format of other SaaS vendors. For example, moving documents and data
from one vendor’s application to another requires both applications to support
common formats. The file formats involved will depend on the type of application.
Standard APIs for different application types may also be required. However, this is
the same issue of on premise applications, so we can say that there is nothing cloud-
specific to these requirements.
5.7.5 Availability and Reliability
As SMEs)evaluate cloud computing solutions, vendors often tout availability, or up-
time, commitments. Understanding the metric, and how to compare vendor claims, is
critical when selecting a solution. Availability is generally expressed as a percentage
-- 99.9%, 99.99%, and so on. With 8760 hours in each year, 99.9% availability
equates to 8.75 hours (0.1%) downtime each year, or an average of 45 minutes per
month. Similarly, 99.99% availability equates to 45 minutes of downtime each year,
53
or about 5 minutes per month. Simple yes, but the devil is in the details. Most
vendors caveat availability commitments by excluding schedule maintenance
windows. For some vendors, this means regularly scheduled windows; for others this
means any non-emergency maintenance activities with advanced notice. When
comparing availability claims, business need to account how availability is
calculated.
The qualities that make SaaS an attractive model for acquiring and consuming
applications can introduce a host of new wrinkles for organizations that choose them.
A key issue revolves around application reliability, which includes ensuring both the
availability and sufficient performance of the applications on which organizations
depend. For one thing, SaaS vendors deliver their wares over the public Internet,
which means these applications perform differently from applications that run on
local clients or over an organization's internal network. What's more, the fact that
SaaS applications are hosted and maintained by external parties means that
companies have less visibility into the workings of these services than they do with
applications hosted on-premises. Because of the nontraditional delivery method and
relatively black box operation of SaaS applications, IT departments must approach
their responsibilities around ensuring application reliability a bit differently from
what they are probably accustomed to doing. A successful strategy for ensuring SaaS
reliability must include attention to users’ expectations and needs, the health of the
network, the architecture and practices of potential SaaS vendors, and the tools and
services that can be used to measure and monitor the SaaS applications that the
organization consumes.

54
5.7.6 Adaptability and Task Productivity
The following concerns should be addressed as part of SaaS evaluation. How easily
can business modify the application? This can be as simple as adding fields or
building dashboards, or as advanced as a programming platform. How effectively
can the users accomplish their goals? How many cases-per-minute or entries-per-day
can workers do, and how many errors do they make?
5.7.7 Regulatory and Compliance Issues
Some industries are subject to regulatory law in different parts of the world, which
imposes various reporting and recordkeeping requirements that the potential SaaS
solution candidates cannot satisfy. Consider the regulatory environments in all the
different jurisdictions in which the organization operates and how they affect its
application needs. Sometimes, technical and financial considerations also can have
legal ramifications, such as whether candidate SaaS providers will be able to meet
the internal and public standards for data security and privacy in order to avoid legal
exposure. Consider any legal obligations business has toward its customers or other
parties, and whether SaaS will allow it to continue to meet them.
5.7.8 Impact on IT Roles and Responsibilities
Adding SaaS to the enterprise IT mix can cause a fundamental shift in the IT
department's role as a provider of information services. Business units are sometimes
caricatured as being afraid of change, but IT departments are not immune to
organizational politics, either, and institutional resistance to SaaS can come from IT
itself, as easily as from elsewhere in the company. In the past, the nature of software
deployment has put chief information officers (CIOs) and their staffs into the role of
gatekeepers who could exercise a veto over any proposed software deployment by
55
simply declaring that they would not host it in the data center. With SaaS as an
option, control of the data center does not necessarily equal control over the entire
enterprise-computing environment and this can cause the gatekeepers to fear a loss of
control: A "rogue" vice president could just subscribe to a SaaS application for their
department, bypassing IT entirely. Of course, a CIO who relies upon control of the
data center to control the greater computing environment has governance problems,
anyway. Successful CIOs engage with business units, educate them about the impact
of certain purchases on their future agility, and work with them to determine whether
their needs would be best met by on-premise software or SaaS. By performing this
consulting role, as discussed above, the IT department can add value directly to the
business by matching up business units optimally with technology.
5.7.9 IT Governance Issues
Performing due diligence is a routine part of any successful IT infrastructure
deployment project, so the basics should already be familiar to business. Some
factors, however, deserve special consideration. Some areas to address in a typical
due-diligence checklist include the following items.
Data-security standards: Moving critical business data "outside the walls"
introduces a risk of data loss or inadvertent exposure of sensitive information.
Assess organization’s data-security needs, and ensure that the provider has
measures in place to meet the standards it set.
SLA guarantees: The management contract between business and the SaaS
provider takes the form of service-level agreements (SLAs) that guarantee the
level of performance, availability, and security that the SaaS vendor will
provide, and govern the actions the provider will take—or the compensation

56
it will provide—in the event that it fails to meet these guarantees. Ensure that
these SLAs are in place, that the guarantees they make are sufficient to meet
the business needs, and that they provide a sufficient level of mitigation in
even the worst-case scenario.
Migration strategies: At some point, business might want to migrate away
from a SaaS application to another solution, so it's important that business is
able to take its existing data out of the application and move it to another one.
Ask the prospective SaaS provider about any data-migration strategies and
procedures it uses, including any provisions for data and code escrow.
In-house integration requirements: Ensure that migrating to SaaS will meet
any functional and data-integration requirements the organization has in
place.
Reporting services: Because SaaS involves giving up direct control of some
of the organization data, accurate and useful reporting is especially important.
Determine what reporting services the provider offers, and whether they are
compatible with your business-intelligence requirements.
5.7.10 Different Cloud Computing Standards among Cloud
Providers
Cloud computing is at a relatively early stage of development, yet many standards
development organizations, consortia, and trade associations are busy creating cloud
computing standards. As a result, there are likely to be multiple standards in some
areas, while other areas are missing standards entirely. It is this challenge that the
IEEE Cloud Computing Initiatives, CPWG1 and ICWG
2, aim to address. “Cloud
computing” is an evolving term, with a variety of innovative approaches. Like other
1 http://standards.ieee.org/develop/wg/CPWG-2301_WG.html
2 http://standards.ieee.org/develop/wg/ICWG-2302_WG.html
57
rapidly evolving industries, the definition of cloud computing is also changing
rapidly. It is akin to saying that even today; the definition of a "TV" is still changing
with the advent of Internet-connected devices, new formats, and Stereo Video. Or
like asking what a "phone" is? The average answer today will look more like an
iPhone or Android mobile device, rather than the historic wired audio-only devices
made by Western Electric. And yet, all along in product lifecycles, standards for
elements of those products are very important. IEEE P2301 is a meta-standard, a set
of profiles consisting of other standards, publications, and guidelines, from many
organizations. It will provide profiles of existing and in-progress cloud computing
standards in critical areas such as application, portability, management, and
interoperability interfaces, as well as file formats and operation conventions. With
capabilities logically grouped so that it addresses different cloud audiences and
personalities, IEEE P2301 will provide an intuitive roadmap for cloud vendors,
service providers, and other key stakeholders. When completed, the standard will aid
users in procuring, developing, building, and using standards-based cloud computing
products and services, enabling better portability, increased commonality, and
greater interoperability across the industry. IEEE P2302 is like other standards,
except that it is focused on the Intercloud problem and there are no other efforts that
we know of focusing on this particular issue. IEEE P2302 defines essential topology,
protocols, functionality, and governance required for reliable cloud-to-cloud
interoperability and federation. The standard will help build an economy of scale
among cloud product and service providers that remains transparent to users and
applications. With a dynamic infrastructure that supports evolving cloud business
models, IEEE P2302 is an ideal platform for fostering growth and improving
competitiveness. It will also address fundamental, transparent interoperability and
58
federation much in the way SS7/IN did for the global telephony system, and naming
and routing protocols did for the Internet. “Cloud computing will change everything.
It is one of the three aspects of the 'perfect storm' of technology waves currently
sweeping across humanity, the other two being massive deployment of very smart
mobile devices, and ubiquitous high-speed connectivity. The cloud will tie all of
these coming advancements together. We’re truly embarking on a new age of
innovation.” says, David Bernstein, IEEE P2301 and IEEE P2302 WG chair, and
managing director, Cloud Strategy Partners. “Since its inception, the Internet has
gone through radical changes driven by the twin engines of continued technology
advancement and evolving user expectations. Cloud computing today is very much
akin to the nascent Internet – a disruptive technology and business model that is
primed for explosive growth and rapid transformation. But without a flexible,
common framework for interoperability, innovation could become stifled, leaving us
with a siloed ecosystem. By leveraging its uniquely deep and broad technological
resources and expertise, IEEE is helping to minimize fragmentation and ensure that
cloud computing realizes its full potential.” – Steve Diamond, chair, IEEE Cloud
Computing Initiative. Looking to the future, cloud computing standardization efforts
may well mirror what we saw for the standardization efforts around the Internet.
Some of the standards may be too early or too late and some may prove to be
inadequate, duplicative, or inappropriate. Ultimately however, standards will evolve
or be developed to address the key challenges of the market as it develops. There will
be bumps in the road, but cloud computing will be the fourth major computing
paradigm, and the development of standards will have a key role in facilitating the
development of the marketplace, just as it did for the Internet (Pushp, 2011).
59
6 TURKISH ICT MARKET ANALYSIS
In this section we will analyze Turkish ICT Market to understand market dynamics
for SMEs to get knowledge about pains and background.
6.1 Analysis of Current IT Usage, Risks, and Issues in Turkish ICT
Market
According World Bank Research study (Seker & Correa, 2010), in Turkey small and
medium size enterprises account for almost 77 percent of employment and play a
crucial role in the economy. However, the analysis of firm dynamics in Turkey
shows that medium-size firms (51–250 workers) are the slowest growing group in
the economy. Moreover, small and medium size enterprises grow at a slower rate in
Turkey than in several comparator countries in the Eastern Europe and Central Asia
region.
There are numerous factors that can affect firm growth. The levels of technology and
human capital, the development level of the country, or the environment in which the
firms operate are very crucial for growth. Especially for the developing countries
where infrastructure, financial, or regulatory services don’t function smoothly, firms
can be discouraged to grow. SMEs that may lack the capacity to cope with these
distortions could be severely affected.
6.1.1 ICT in Turkey and SWOT Analysis of the ICT Market
According to Invest-In-Turkey web site3 operated by The Republic of Turkey Prime
Ministry Investment Support and Promotion Agency -Invest in Turkey, between
2010 and 2013 ICT spending is forecasted to rise by 16% a year. The ICT sector has
become an essential part of the economy, in particular social life, since it is directly
3 http://www.invest.gov.tr
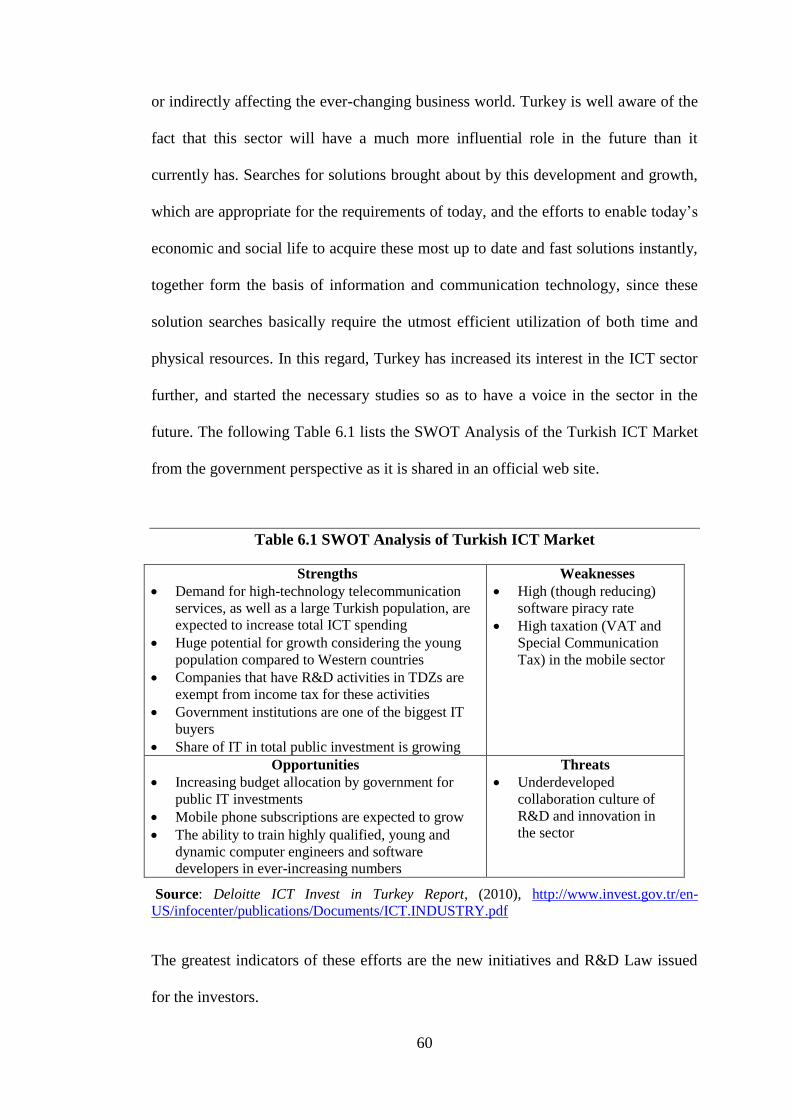
60
or indirectly affecting the ever-changing business world. Turkey is well aware of the
fact that this sector will have a much more influential role in the future than it
currently has. Searches for solutions brought about by this development and growth,
which are appropriate for the requirements of today, and the efforts to enable today’s
economic and social life to acquire these most up to date and fast solutions instantly,
together form the basis of information and communication technology, since these
solution searches basically require the utmost efficient utilization of both time and
physical resources. In this regard, Turkey has increased its interest in the ICT sector
further, and started the necessary studies so as to have a voice in the sector in the
future. The following Table 6.1 lists the SWOT Analysis of the Turkish ICT Market
from the government perspective as it is shared in an official web site.
Table 6.1 SWOT Analysis of Turkish ICT Market
Strengths
Demand for high-technology telecommunication
services, as well as a large Turkish population, are
expected to increase total ICT spending
Huge potential for growth considering the young
population compared to Western countries
Companies that have R&D activities in TDZs are
exempt from income tax for these activities
Government institutions are one of the biggest IT
buyers
Share of IT in total public investment is growing
Weaknesses
High (though reducing)
software piracy rate
High taxation (VAT and
Special Communication
Tax) in the mobile sector
Opportunities
Increasing budget allocation by government for
public IT investments
Mobile phone subscriptions are expected to grow
The ability to train highly qualified, young and
dynamic computer engineers and software
developers in ever-increasing numbers
Threats
Underdeveloped
collaboration culture of
R&D and innovation in
the sector
Source: Deloitte ICT Invest in Turkey Report, (2010), http://www.invest.gov.tr/en-
US/infocenter/publications/Documents/ICT.INDUSTRY.pdf
The greatest indicators of these efforts are the new initiatives and R&D Law issued
for the investors.
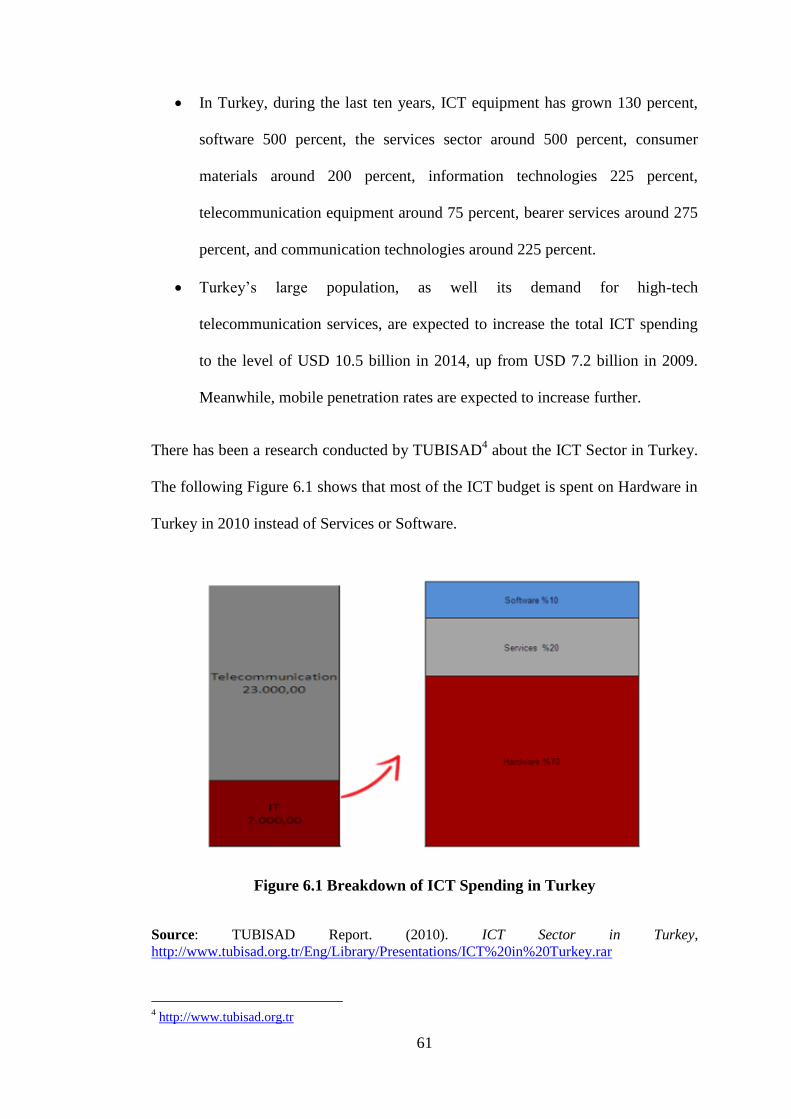
61
In Turkey, during the last ten years, ICT equipment has grown 130 percent,
software 500 percent, the services sector around 500 percent, consumer
materials around 200 percent, information technologies 225 percent,
telecommunication equipment around 75 percent, bearer services around 275
percent, and communication technologies around 225 percent.
Turkey’s large population, as well its demand for high-tech
telecommunication services, are expected to increase the total ICT spending
to the level of USD 10.5 billion in 2014, up from USD 7.2 billion in 2009.
Meanwhile, mobile penetration rates are expected to increase further.
There has been a research conducted by TUBISAD4 about the ICT Sector in Turkey.
The following Figure 6.1 shows that most of the ICT budget is spent on Hardware in
Turkey in 2010 instead of Services or Software.
Figure 6.1 Breakdown of ICT Spending in Turkey
Source: TUBISAD Report. (2010). ICT Sector in Turkey,
http://www.tubisad.org.tr/Eng/Library/Presentations/ICT%20in%20Turkey.rar
4 http://www.tubisad.org.tr
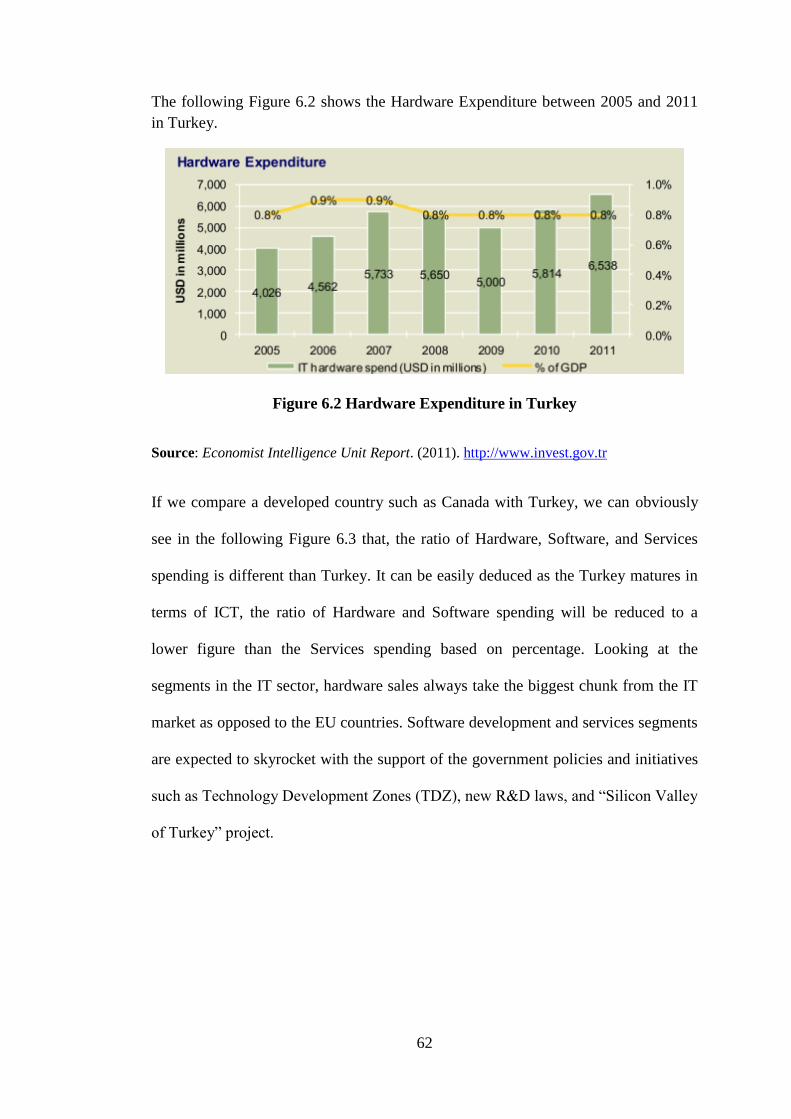
62
The following Figure 6.2 shows the Hardware Expenditure between 2005 and 2011
in Turkey.
Figure 6.2 Hardware Expenditure in Turkey
Source: Economist Intelligence Unit Report. (2011). http://www.invest.gov.tr
If we compare a developed country such as Canada with Turkey, we can obviously
see in the following Figure 6.3 that, the ratio of Hardware, Software, and Services
spending is different than Turkey. It can be easily deduced as the Turkey matures in
terms of ICT, the ratio of Hardware and Software spending will be reduced to a
lower figure than the Services spending based on percentage. Looking at the
segments in the IT sector, hardware sales always take the biggest chunk from the IT
market as opposed to the EU countries. Software development and services segments
are expected to skyrocket with the support of the government policies and initiatives
such as Technology Development Zones (TDZ), new R&D laws, and “Silicon Valley
of Turkey” project.

63
Figure 6.3 ICT Canada Projected Spending on Hardware, Software, Services
and Communications 2010 to 2013 (WITSA) Digital Plant, 2010, (Forecast in
US$)
Source: WITSA Digital Planet Report. (2010). http://www.ictc-
ctic.ca/Outlook_2011/trends_en.html
6.1.2 Internet and FaceBook Usage in Turkey and Europe
Broadband penetration is forecast to reach about 16%. Given the high percentage of
young people in Turkey's growing population, growth in Internet subscriptions and e-
commerce is likely to be strong. As with telecoms services, growth in 2009-13 will
be driven by rising incomes (in the second half of the forecast period) and sales of
personal computers (PCs), as well as the availability of online services through
cable-TV and wireless applications. The Internet and its many uses are becoming
increasingly familiar, and computer literacy is growing in Turkey. A major project
by the Ministry of Education to introduce computers and the Internet throughout the
school system is currently under way. The following Table 6.2 lists the internet
penetration between 2006 and 2013 (expected).
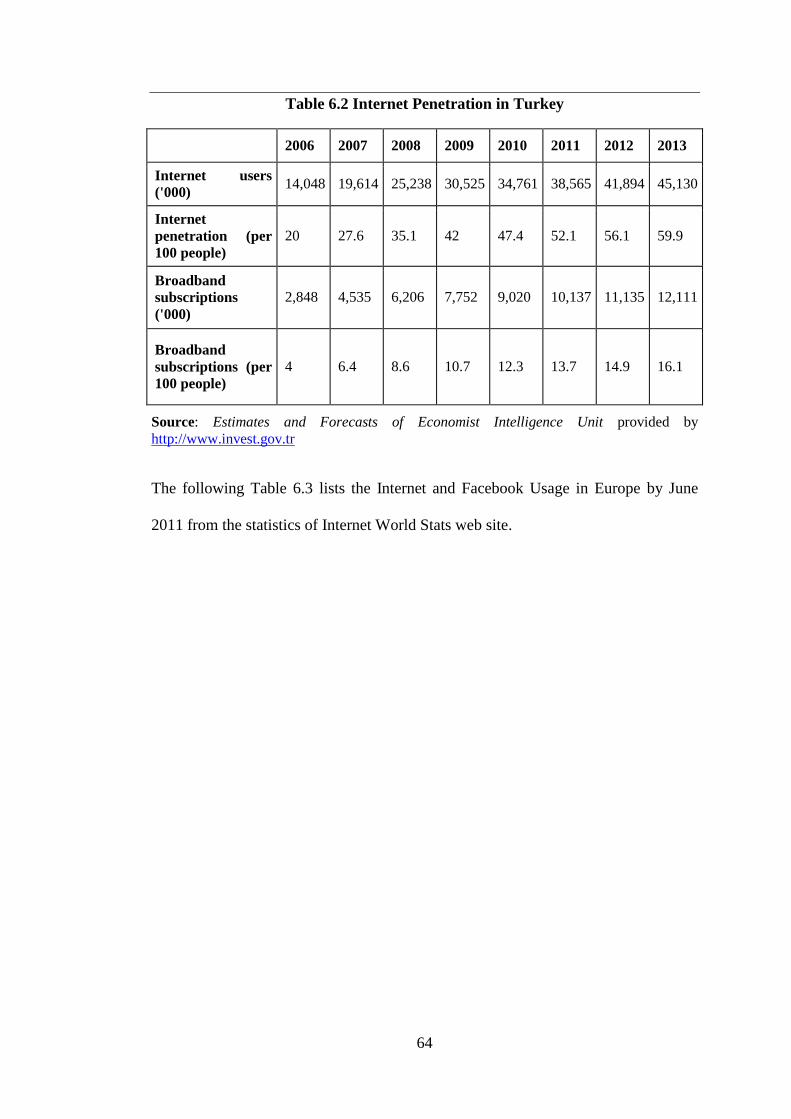
64
Table 6.2 Internet Penetration in Turkey
2006 2007 2008 2009 2010 2011 2012 2013
Internet users
('000) 14,048 19,614 25,238 30,525 34,761 38,565 41,894 45,130
Internet
penetration (per
100 people)
20 27.6 35.1 42 47.4 52.1 56.1 59.9
Broadband
subscriptions
('000)
2,848 4,535 6,206 7,752 9,020 10,137 11,135 12,111
Broadband
subscriptions (per
100 people)
4 6.4 8.6 10.7 12.3 13.7 14.9 16.1
Source: Estimates and Forecasts of Economist Intelligence Unit provided by
http://www.invest.gov.tr
The following Table 6.3 lists the Internet and Facebook Usage in Europe by June
2011 from the statistics of Internet World Stats web site.
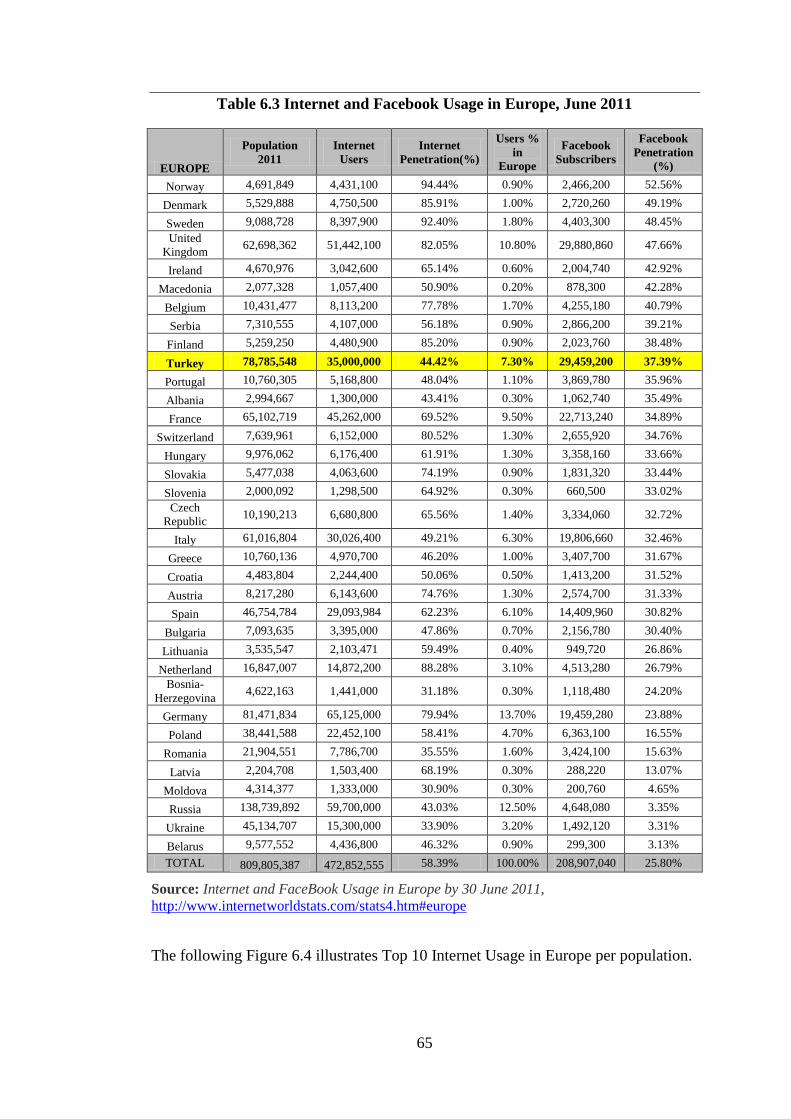
65
Table 6.3 Internet and Facebook Usage in Europe, June 2011
EUROPE
Population
2011
Internet
Users
Internet
Penetration(%)
Users %
in
Europe
Subscribers
Penetration
(%)
Norway 4,691,849 4,431,100 94.44% 0.90% 2,466,200 52.56%
Denmark 5,529,888 4,750,500 85.91% 1.00% 2,720,260 49.19%
Sweden 9,088,728 8,397,900 92.40% 1.80% 4,403,300 48.45%
United
Kingdom 62,698,362 51,442,100 82.05% 10.80% 29,880,860 47.66%
Ireland 4,670,976 3,042,600 65.14% 0.60% 2,004,740 42.92%
Macedonia 2,077,328 1,057,400 50.90% 0.20% 878,300 42.28%
Belgium 10,431,477 8,113,200 77.78% 1.70% 4,255,180 40.79%
Serbia 7,310,555 4,107,000 56.18% 0.90% 2,866,200 39.21%
Finland 5,259,250 4,480,900 85.20% 0.90% 2,023,760 38.48%
Turkey 78,785,548 35,000,000 44.42% 7.30% 29,459,200 37.39%
Portugal 10,760,305 5,168,800 48.04% 1.10% 3,869,780 35.96%
Albania 2,994,667 1,300,000 43.41% 0.30% 1,062,740 35.49%
France 65,102,719 45,262,000 69.52% 9.50% 22,713,240 34.89%
Switzerland 7,639,961 6,152,000 80.52% 1.30% 2,655,920 34.76%
Hungary 9,976,062 6,176,400 61.91% 1.30% 3,358,160 33.66%
Slovakia 5,477,038 4,063,600 74.19% 0.90% 1,831,320 33.44%
Slovenia 2,000,092 1,298,500 64.92% 0.30% 660,500 33.02%
Czech
Republic 10,190,213 6,680,800 65.56% 1.40% 3,334,060 32.72%
Italy 61,016,804 30,026,400 49.21% 6.30% 19,806,660 32.46%
Greece 10,760,136 4,970,700 46.20% 1.00% 3,407,700 31.67%
Croatia 4,483,804 2,244,400 50.06% 0.50% 1,413,200 31.52%
Austria 8,217,280 6,143,600 74.76% 1.30% 2,574,700 31.33%
Spain 46,754,784 29,093,984 62.23% 6.10% 14,409,960 30.82%
Bulgaria 7,093,635 3,395,000 47.86% 0.70% 2,156,780 30.40%
Lithuania 3,535,547 2,103,471 59.49% 0.40% 949,720 26.86%
Netherland 16,847,007 14,872,200 88.28% 3.10% 4,513,280 26.79%
Bosnia-
Herzegovina 4,622,163 1,441,000 31.18% 0.30% 1,118,480 24.20%
Germany 81,471,834 65,125,000 79.94% 13.70% 19,459,280 23.88%
Poland 38,441,588 22,452,100 58.41% 4.70% 6,363,100 16.55%
Romania 21,904,551 7,786,700 35.55% 1.60% 3,424,100 15.63%
Latvia 2,204,708 1,503,400 68.19% 0.30% 288,220 13.07%
Moldova 4,314,377 1,333,000 30.90% 0.30% 200,760 4.65%
Russia 138,739,892 59,700,000 43.03% 12.50% 4,648,080 3.35%
Ukraine 45,134,707 15,300,000 33.90% 3.20% 1,492,120 3.31%
Belarus 9,577,552 4,436,800 46.32% 0.90% 299,300 3.13%
TOTAL 809,805,387 472,852,555 58.39% 100.00% 208,907,040 25.80%
Source: Internet and FaceBook Usage in Europe by 30 June 2011,
http://www.internetworldstats.com/stats4.htm#europe
The following Figure 6.4 illustrates Top 10 Internet Usage in Europe per population.
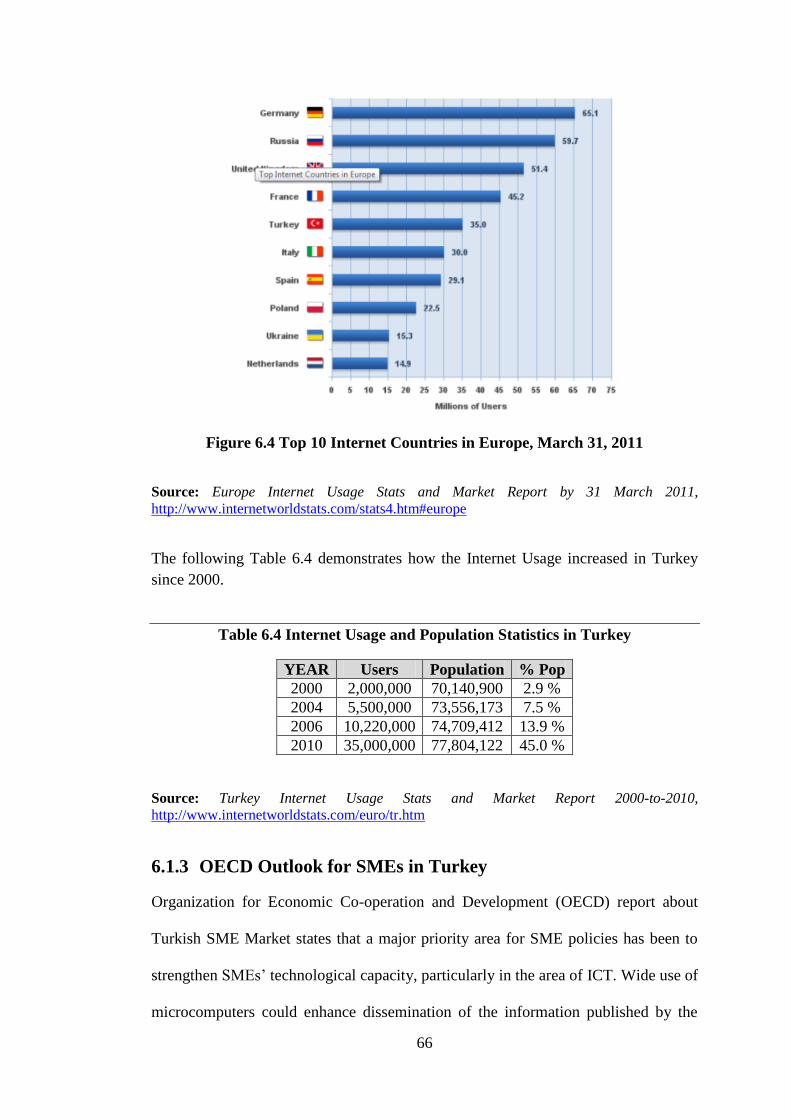
66
Figure 6.4 Top 10 Internet Countries in Europe, March 31, 2011
Source: Europe Internet Usage Stats and Market Report by 31 March 2011,
http://www.internetworldstats.com/stats4.htm#europe
The following Table 6.4 demonstrates how the Internet Usage increased in Turkey
since 2000.
Table 6.4 Internet Usage and Population Statistics in Turkey
YEAR Users Population % Pop
2000 2,000,000 70,140,900 2.9 %
2004 5,500,000 73,556,173 7.5 %
2006 10,220,000 74,709,412 13.9 %
2010 35,000,000 77,804,122 45.0 %
Source: Turkey Internet Usage Stats and Market Report 2000-to-2010,
http://www.internetworldstats.com/euro/tr.htm
6.1.3 OECD Outlook for SMEs in Turkey
Organization for Economic Co-operation and Development (OECD) report about
Turkish SME Market states that a major priority area for SME policies has been to
strengthen SMEs’ technological capacity, particularly in the area of ICT. Wide use of
microcomputers could enhance dissemination of the information published by the
67
government to promote exports. Increased Internet use could help industrial SMEs to
procure raw materials and capital goods more efficiently, thus trimming their costs
and boosting their productivity. These positive effects have been clearly
demonstrated in the North American and European markets. The Internet can also
help SMEs to advertise their products and simplify purchasing decisions for
businesses and consumers alike. Computers can also help SMEs control production
processes and manage inventory. After the customs union with the European Union
was put in place, Turkish SMEs faced pressure to raise their technical level and
acquire know-how in order to meet European competition and take advantage of
opportunities in the domestic market. However, they did not fully take advantage of
these opportunities for a number of reasons. First, even if rapid progress has been
made in recent years, investment in ICT remains low in Turkey. Second, the support
policies that would have been necessary for their technological development were
not available, owing to a lack of public funding. Moreover, to be fully effective,
technical standards should have been raised prior to the opening of the borders.
Furthermore, an unfavorable economic environment and the drop in domestic
demand following economic crises in a climate of heightened competition slowed
SMEs’ technological development. Their lack of technical skills keeps SMEs from
deriving the full benefit of any cost advantages they might have domestically or for
export, notably during periods of devaluation of the Turkish lira. Finally, businesses’
needs in terms of technology do not automatically result in demand on their part,
either because of a lack of resources, owing to their small size, an internal lack of
understanding of their requirements or a poorly functioning market. This obviously
has negative repercussions for technical consulting firms operating within Turkey
that are able to provide needed support. It should be noted that small manufacturing
68
business throughout the world are often reluctant to use technical consultants (OECD
Report, 2004).
6.1.4 Report Stating Turkey's SMEs Lag in IT
Nearly 60 percent of small and medium size enterprises in Turkey do not have an
email address while only one fourth of all SMEs have a corporate website, a new
research conducted in 2010 by TUBISAD (Turkish Informatics Industry
Association), found (TUBISAD Report, 2010).
The research, which was conducted in 25 provinces around Turkey and consists of
interviews with 1,645 managers, was published in Istanbul Wednesday.
Turgut Gürsoy, TUBISAD chairman said the results of the survey are significant and
indicate the lack of IT awareness among Turkish SMEs is a countrywide challenge.
"One of the most striking findings of the study is that more than half of Turkish
companies do not use email. At the same time, one fourth of the firms do not even
have a Web site. Today there are in fact still some listed companies in Turkey that do
not have a Web site. This is quite an important issue," Gürsoy said.
Özgür Erdem, director of TUBISAD’s SME development project, noted the
minuscule exposure of Turkish SMEs complicates Turkey’s economic growth.
”Turkey envisions exporting goods worth $500 billion and pulling in $50 billion
from tourism but half of the SMEs do not even have Internet pages. It is not possible
to realize these financial goals without information and communications technology.
SMEs here need to start using more IT solutions. Turkey needs to solve this issue,”
Erdem said.
69
According to the survey, 67 percent of all respondents said their companies do not
have regular needs for technology. Of the remaining 37 percent who are considered
to need technology, one third noted that, although they need technology, they do not
know how to use it. Ibrahim Özer, member of the TUBISAD board, said this again
shows information technology penetration is still at its infancy among Turkish
SMEs. “And this is actually not solely the problem of the ICT sector but of all of
Turkey. SMEs are investing in machines and other equipment but not IT.”
Turkey’s new commercial code, which has not yet been adopted into legislation,
requires all companies in Turkey to have Web sites. Gürsoy noted that the new
commercial code should be adopted into legislation. "In fact, 74 percent of the
companies researched were not even aware of this requirement… The new code
enables SMEs to grow. It will reduce the gray economy, increase transparency,
introduce e-signatures and e-bills, and also encourage mobile working.”
Nazım Özdemir, chairman of TUBISAD’s SME development project, said the lack
of IT use at Turkish SMEs is partly due to lack of resources. ”But there is also no
professional personnel for the purpose. The problem in Turkey is also employers do
not comprehend how useful computers are,” he said.
6.2 Turkey Cloud Computing Survey Results
The following survey results in Figure 6.5 shows the areas how the SMEs are
currently leveraging cloud based solutions.

70
Figure 6.5 Currently Leveraging Cloud Computing
Source: Forrester Research MEA and Turkey Cloud Computing Survey. (2011)
The following survey results in Figure 6.6 shows the areas how the SMEs are
currently leveraging cloud based solutions.
Figure 6.6 Leveraging Cloud Computing In These Areas Currently
Source: Forrester Research MEA and Turkey Cloud Computing Survey. (2011)
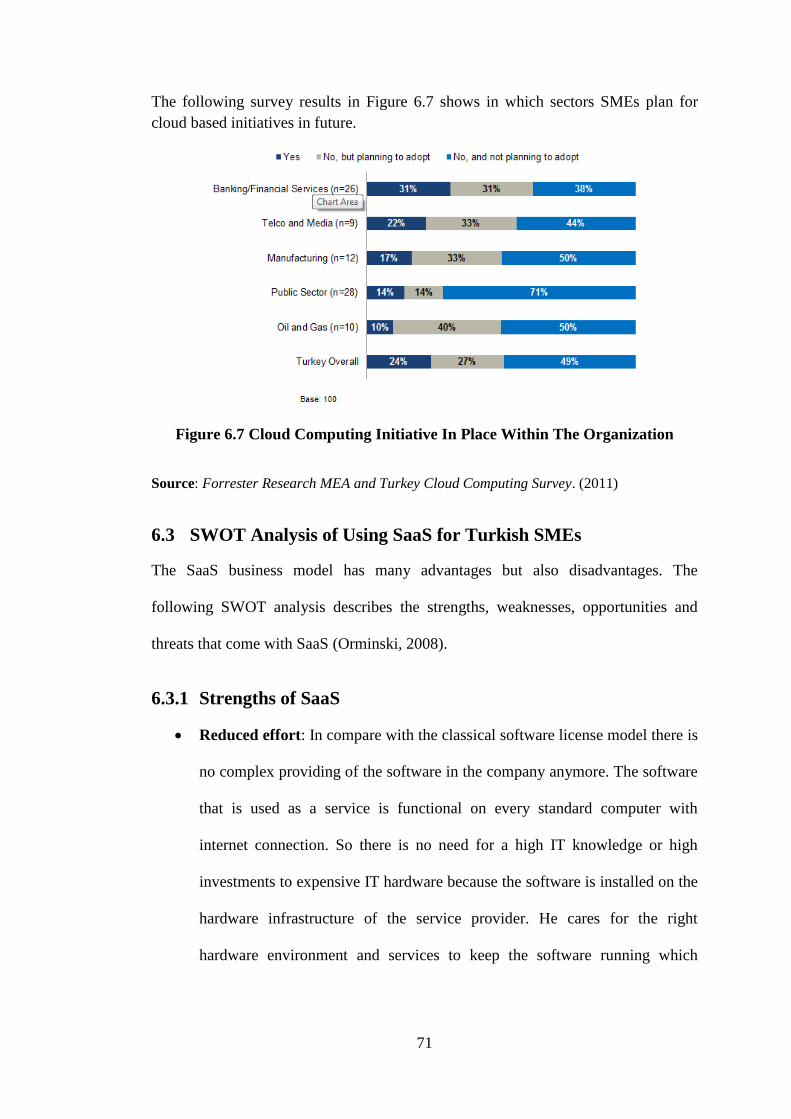
71
The following survey results in Figure 6.7 shows in which sectors SMEs plan for
cloud based initiatives in future.
Figure 6.7 Cloud Computing Initiative In Place Within The Organization
Source: Forrester Research MEA and Turkey Cloud Computing Survey. (2011)
6.3 SWOT Analysis of Using SaaS for Turkish SMEs
The SaaS business model has many advantages but also disadvantages. The
following SWOT analysis describes the strengths, weaknesses, opportunities and
threats that come with SaaS (Orminski, 2008).
6.3.1 Strengths of SaaS
Reduced effort: In compare with the classical software license model there is
no complex providing of the software in the company anymore. The software
that is used as a service is functional on every standard computer with
internet connection. So there is no need for a high IT knowledge or high
investments to expensive IT hardware because the software is installed on the
hardware infrastructure of the service provider. He cares for the right
hardware environment and services to keep the software running which

72
simplifies the software management so that the companies can keep
concentrating on their core businesses.
Reduced costs: Only the standard software that is really needed will be in
usage in the company. So there will only be paid a calculable monthly rent
that depends on the amount of usage of the software. In addition there are no
royalty-payments for the software. This avoids the problem of an under- or
over-licensing and with it a lower capital tie because of the high starting
investments for the software license. The included services lead to a lower tie
of important human resources of the IT department because the service
provider cares for everything that has to deal with the provided software. So
there is a double transfer of cost risk from the customer to the provider. But
the market researcher from IDC think that the cost advantages in the
beginning will be over after three till five years because a software that is
bought will be decreased anytime, rented software costs will run month for
moth. But in this calculation is missing the hidden costs of all the service
activities like maintenance that will be a huge part of the costs. Market
researchers from Gartner found out that with SaaS there is a saving potential
up to 30% in comparison to an on-premise software solution.
Always up to date: The SaaS customers will always be up to date with its
software products. The service provider will always offer the newest version
of the software product. This can lead to a strategic advantage towards the
market competitors because of a possible improvement of the business
processes.
Higher security: The service provider cares for the highest security of the
personal data that were given to him from the customer. Normally the
73
customers are not very high experienced concerning data security because it
is not their core business. A professional external IT service supporter has got
this experience so he can better care for the security so that nobody else than
the customer himself can reach his data. The danger of losing data is also
lower because of a professional backup solution that is a part of the integrated
service level agreement.
Fast implementation: The rented software could be implemented and used
in a very shorter time period that a classical in-house solution. This is because
SaaS is used in an internet browser as a web service so that there is only one
standardized web interface whereat the SaaS application is connected with
the existing IT infrastructure.
Worldwide use on the way: SaaS products can be used worldwide and not
only on the computer where the software is installed. The SaaS product runs
in the data center of the provider with all data that is central stored. So the
user is able to connect to the software and his data from every computer or
mobile terminal with an internet access. This makes the work much more
flexible and avoids the problem of redundant data on several computers that
regularly have to be synchronized.
6.3.2 Weaknesses of SaaS
Customizing restrictions: One single software product that is perfectly
suitable for everybody will hardly be to realize. That is why many customers
customize the used software or enlarge it with the help of add-ons. But the
most of these specialized add-ons and other customizations are not integrable
into SaaS because the formula for its success lies in the simplicity for a
general usage which stands in contrast to an ample customizing. This
74
limitation of customizing could be the biggest danger for the distribution of
SaaS but it avoids repeating the same mistake that was made with application
service provider.
Data availability: The advantage of using SaaS over the internet line is one
of its biggest disadvantages at the same time. SaaS is dependent of the
internet availability. If there is a server breakdown there will be no possibility
to run the software anymore in the company. This could mean a huge loss
because of a possible production or service default. Projectplace, Europes
leading SaaS provider, told that they had an excellent uptime in 2006 with an
availability of 99.998%. That meant that they were only 11 minutes offline in
the whole year. But also if there is just no possibility to connect to the
internet, then there is no chance to use the software or to get to the needed
data because the software and the data are not offline usable like a local
installed software product with local saved data.
Data security: If a corporate decides to use SaaS they save all their data that
is used with the application in an external data center that is run by the
service provider. So there must be a huge mutual trust between the customer
and the provider that must be arranged by the provider with a convincing
security concept against third-party access and data losses. But it must be also
guaranteed that the internet line is secure. Otherwise it would be possible to
intercept the data on the line. Projectplace tells that their internet connection
is multiple encrypted and since the company foundation in 1998 they have
never been hacked.
Performance: The performance of the provided software product is always
dependent and limited to the performance of the available internet
75
connection. This means that there will never be a real time access to the data.
This could become dangerously for a company if the internet connection is
not or just slowly responding and so critical business processes cannot be
done.
Business process support: SaaS is a kind of standard software. That means
that the specific organization of a company will not be reflected in the
software. That could denote that a company could lose its strategic advantage
in the market because their special business processes will not be perfectly
supported with the SaaS application.
Over or under-functionality: SaaS is a standardized product that is offered
in one form for many different users. Specific requirements cannot be
mapped because of the one-to-many principle. This leads often to over-
functionality or under-functionality for the most of the users affiliated with
payments for unused functions. The possibility of a perfect fitting SaaS
product is quite low.
6.3.3 Opportunities of SaaS
Better service quality: IT services are not the core business of companies.
That means that they are mostly not high experienced concerning IT services.
It is more a must for them. A specialized professional IT service provider is
high experienced and therewith able to offer a much better IT service quality
to the customers.
Always the newest software version: The SaaS customer normally gets the
newest software versions at first without extra payments for the updates
because they are a part of the service agreements of the SaaS providers that
are included in the monthly rent. This could mean an important strategic
76
advantage towards the market competitors because the SaaS customer has
access to newer functions that could advance his business processes.
Free cash flows: Using software as a service means that the customer only
pays a monthly rent. There are no expensive investments for a software
license, for the own IT service department or for a new hardware
infrastructure. So there are scalable payments that are not as high especially
at the beginning of the software introduction as in the classical license model.
These free cash flows can be used for improving the core business processes.
More flexibility: The customer has got only low starting investments for the
purchasing of the software so there is less fixed capital. With a short running
SaaS contract the customer is able to change the applications and the software
provider in a short period unlike with an on-premise software solution where
the purchased software must be used over a long period, at least until it is
depreciated. This aspect is supported by the easier integration in running
systems so it needs less time to implement a new SaaS product because of the
standardized web interface. So the software can be selected because of its
economic functionality and not because of its integration ability into the
running systems.
6.3.4 Threats of SaaS
Border-crossing data storage: Every company that uses SaaS must make
itself sure that the stored data possibly will not be saved in the same country
where the company is founded. So in legal questions there could be another
law in charge than the home law, so it could become very difficult to clarify
the question of guilt.
77
Data losses: All the user data are saved on an external server in the data
center of the software provider. If some data were lost the corporate is not
able to take the recovery of the data in its own hands. It is dependent of the
service provider. That is why the security level with the amount of backups
and the recovery time must be detailed fixed in the SLA.
Data synchronization: In a case of a change of the software provider to
another it must be ensured that all the data that is stored in the data center of
the provider will be at first synchronized to the server of the new provider
and that there will be no readable data left on the old server. Like in the case
of data losses there must be a huge mutual trust between the service provider
and the customer. The customer is doing good to check the service provider
well before responding a contract with him. The provider is doing good to do
everything to win the customers confidence, otherwise the customer could
change the provider.
Missing local IT support: The in-house IT department knows its internal
customers and supported IT normally as the best. In addition they are nearby
their customers and therewith able to offer their physical IT service in a very
shorter time than an external IT supporter, especially in an emergency case
when every second is important. In the SaaS business model the IT services
will be outsourced to an external IT service supporter that will often not be
nearby the company.
Dependency to the provider: If the SaaS provider goes suddenly bankrupt or
is not able to provide its software products anymore for any other reason it
must be ensured that the customer will still be able to run his business
normally. Otherwise could be a total dependency to the service provider in

78
such cases which could lead to the death of a company if the data have been
important for running the business.
Long contract terms: One huge advantage of SaaS is the flexibility that
SaaS offers to the customers. Long running contracts with the software
provider will take the flexibility out of the SaaS concept.
79
7 DECISION MODEL FOR SELECTING SaaS PROVIDER
In this section, the qualitative and quantitative methods will be explained and
demonstrated with fictitious or anonymous SMEs. A further research would be
helpful to measure how viable these methods are in different vertical businesses.
7.1 SaaS Provider Qualification Checklist
Software-as-a-service (SaaS) is rapidly gaining popularity as an alternative to on-
premise software. The key advantages that SaaS claims to offer are listed below
(Stevens, 2009).
Lower cost: For smaller companies or those anticipating rapid growth, the
pay-as-you-go model offered by SaaS is more cost-effective than an on-
premise solution, at least in the short term. Also, there are no maintenance
costs, and upgrades are almost always free.
Fast Implementation: The implementation time for SaaS applications is
typically shorter than it would be for an on-premise solution.
Less Hassle: With SaaS, the provider handles all the management and
maintenance (including hardware), which means no increase in IT head
count.
Less Risk: The risk of a failed implementation is extremely low.
For all these benefits, SaaS should not be an automatic choice for any organization of
any size. What follows is a check list of the important factors business should
evaluate before jumping on the SaaS bandwagon (Stevens, 2009).
TCO: Many companies are attracted to SaaS because of its presumed cost
advantage. However, at least for enterprise scale companies, the TCO of an on-
80
premise solution may be lower if the time frame of the calculation exceeds 6
years.
Functionality: The SaaS vs. on-premise comparison is almost never apples-to-
apples. Does the SaaS offering have exactly the same feature set as the on-
premise version? If not, are any important features absent from either choice?
Reliability: What SLAs can the SaaS provider offer? Are there penalty clauses in
the contract for failure to meet SLAs?
Ease of use: An application only has value if employees use it. Many CRM and
sales force automation initiatives have failed because of low acceptance rates
among users. If the potential SaaS initiative is in one of these areas, user
friendliness is a critical success factor.
Implementation time: Many companies consider SaaS because it promises a
quicker implementation than on-premise solutions. In most cases, this claim is
accurate, but not always.
Internal resource issues: Is the internal IT department resource-constrained? If
so, this is a major argument in favor of SaaS.
Integration: Does business need to integrate the SaaS offering with any internal
(on-premise) applications? If so, will this create problems? Will upgrades on
either side pose problems in the future? How easy, fast, and effective can they be
integrated?
Access to data: How easy will it be for business to access data in the SaaS
solution? Does it have strong import/export capabilities?
Data security: This is an issue that has several components:
81
Security against theft: How strong are the SaaS provider’s intrusion
detection and other theft-prevention measures? What legal commitments is
the provider willing to make?
Back-up: Does the SaaS provider offer off-site back-up? How frequently is
data backed up?
Disaster recovery: How fast can the SaaS provider recover from a
catastrophic failure?
Vendor viability: There are literally hundreds of SaaS companies now in
business. Some will surely go out of business, while others will be acquired by
larger vendors that may or may not provide the same level of service, product
road map and so on. Is that SaaS vendor being evaluated on a solid business
footing?
Exit strategy: Does the SaaS solution provide a painless exit strategy, both
technically and financially?
7.2 Multi Criteria Based Cloud Service Provider Selection Scoring
Model
The following Table 7.1 represents SaaS vendor service selection scoring based on
10 SaaS evaluation criteria. For each SaaS service to be outsourced to SaaS Cloud
Provider this table should be field for each SaaS Vendor Cloud Provider separately
based on Qualitative Criteria. Then decision should favor the SaaS Cloud Provider
having the highest rating. This multiple criteria based scoring model have been
adopted from Hurwitz, Bloor, Kaufman, & Halper (2009).
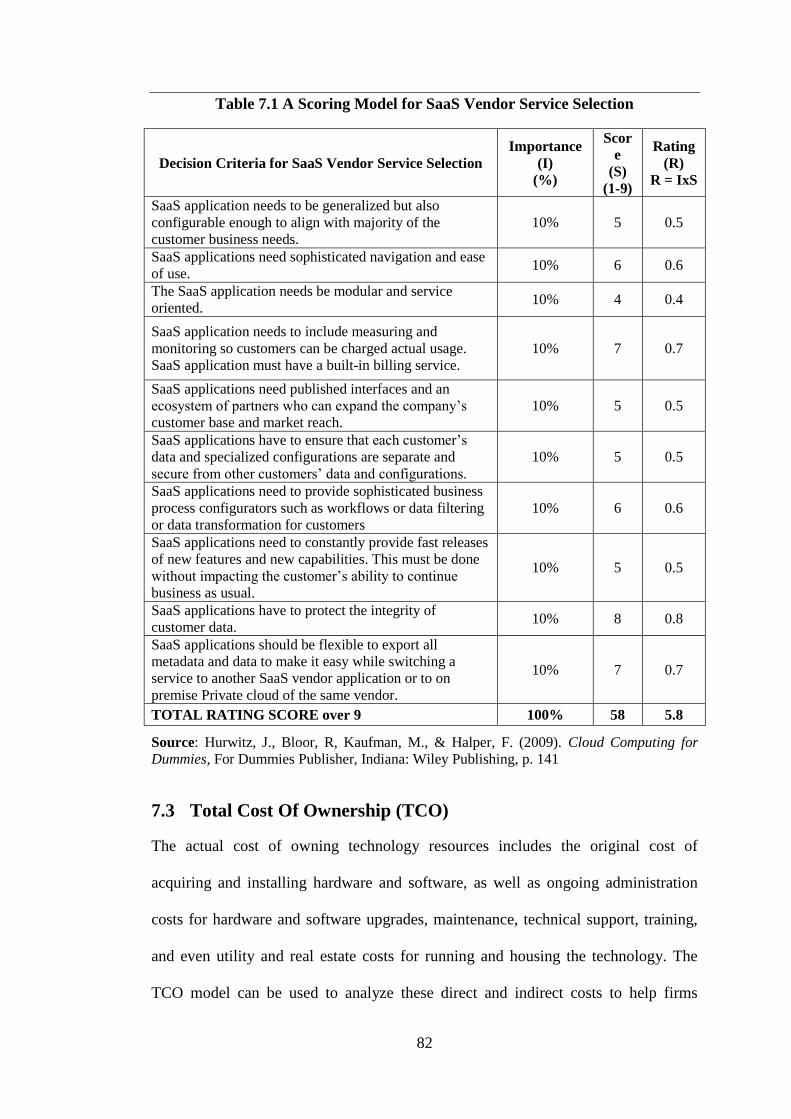
82
Table 7.1 A Scoring Model for SaaS Vendor Service Selection
Decision Criteria for SaaS Vendor Service Selection
Importance
(I)
(%)
Scor
e
(S)
(1-9)
Rating
(R)
R = IxS
SaaS application needs to be generalized but also
configurable enough to align with majority of the
customer business needs.
10% 5 0.5
SaaS applications need sophisticated navigation and ease
of use. 10% 6 0.6
The SaaS application needs be modular and service
oriented. 10% 4 0.4
SaaS application needs to include measuring and
monitoring so customers can be charged actual usage.
SaaS application must have a built-in billing service.
10% 7 0.7
SaaS applications need published interfaces and an
ecosystem of partners who can expand the company’s
customer base and market reach.
10% 5 0.5
SaaS applications have to ensure that each customer’s
data and specialized configurations are separate and
secure from other customers’ data and configurations.
10% 5 0.5
SaaS applications need to provide sophisticated business
process configurators such as workflows or data filtering
or data transformation for customers
10% 6 0.6
SaaS applications need to constantly provide fast releases
of new features and new capabilities. This must be done
without impacting the customer’s ability to continue
business as usual.
10% 5 0.5
SaaS applications have to protect the integrity of
customer data. 10% 8 0.8
SaaS applications should be flexible to export all
metadata and data to make it easy while switching a
service to another SaaS vendor application or to on
premise Private cloud of the same vendor.
10% 7 0.7
TOTAL RATING SCORE over 9 100% 58 5.8
Source: Hurwitz, J., Bloor, R, Kaufman, M., & Halper, F. (2009). Cloud Computing for
Dummies, For Dummies Publisher, Indiana: Wiley Publishing, p. 141
7.3 Total Cost Of Ownership (TCO)
The actual cost of owning technology resources includes the original cost of
acquiring and installing hardware and software, as well as ongoing administration
costs for hardware and software upgrades, maintenance, technical support, training,
and even utility and real estate costs for running and housing the technology. The
TCO model can be used to analyze these direct and indirect costs to help firms
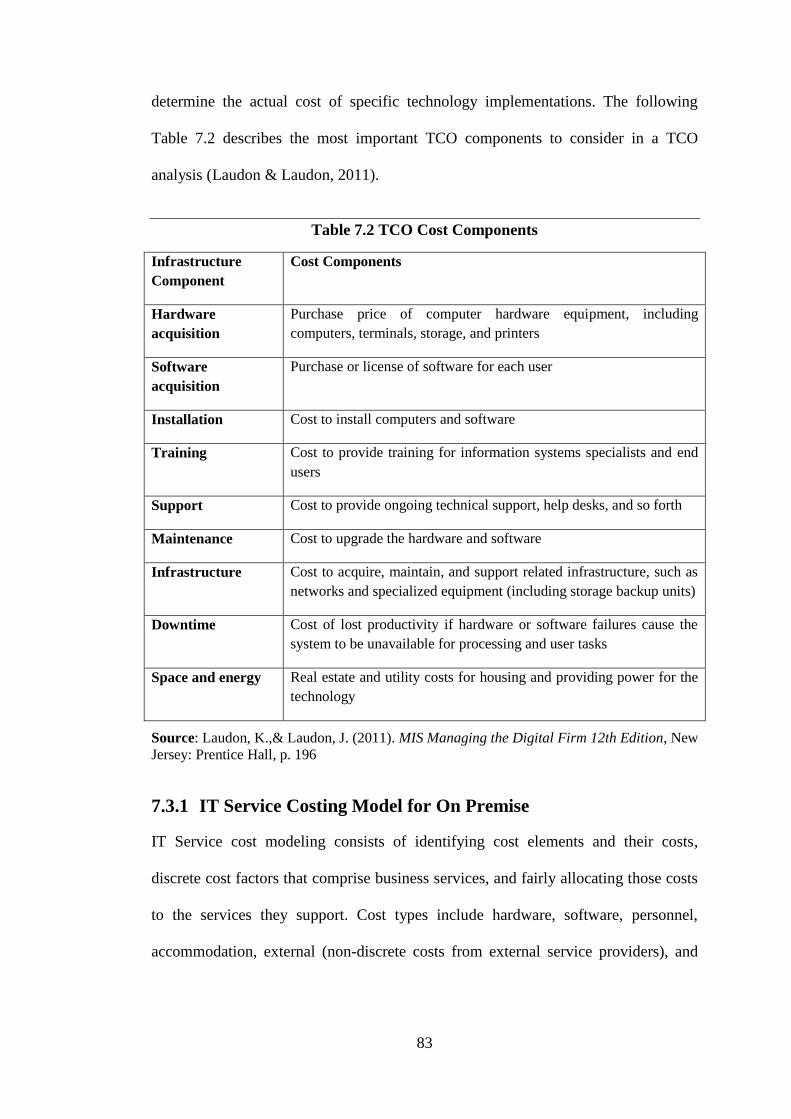
83
determine the actual cost of specific technology implementations. The following
Table 7.2 describes the most important TCO components to consider in a TCO
analysis (Laudon & Laudon, 2011).
Table 7.2 TCO Cost Components
Infrastructure
Component
Cost Components
Hardware
acquisition
Purchase price of computer hardware equipment, including
computers, terminals, storage, and printers
Software
acquisition
Purchase or license of software for each user
Installation Cost to install computers and software
Training Cost to provide training for information systems specialists and end
users
Support Cost to provide ongoing technical support, help desks, and so forth
Maintenance Cost to upgrade the hardware and software
Infrastructure Cost to acquire, maintain, and support related infrastructure, such as
networks and specialized equipment (including storage backup units)
Downtime Cost of lost productivity if hardware or software failures cause the
system to be unavailable for processing and user tasks
Space and energy Real estate and utility costs for housing and providing power for the
technology
Source: Laudon, K.,& Laudon, J. (2011). MIS Managing the Digital Firm 12th Edition, New
Jersey: Prentice Hall, p. 196
7.3.1 IT Service Costing Model for On Premise
IT Service cost modeling consists of identifying cost elements and their costs,
discrete cost factors that comprise business services, and fairly allocating those costs
to the services they support. Cost types include hardware, software, personnel,
accommodation, external (non-discrete costs from external service providers), and
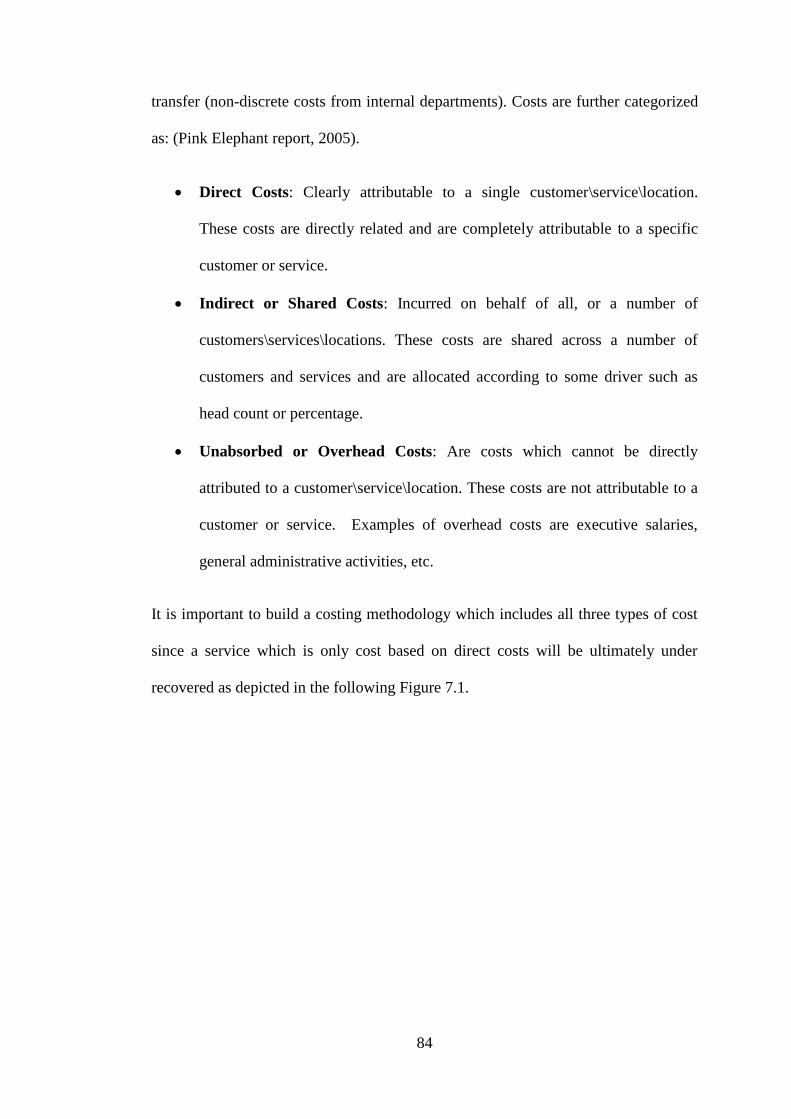
84
transfer (non-discrete costs from internal departments). Costs are further categorized
as: (Pink Elephant report, 2005).
Direct Costs: Clearly attributable to a single customer\service\location.
These costs are directly related and are completely attributable to a specific
customer or service.
Indirect or Shared Costs: Incurred on behalf of all, or a number of
customers\services\locations. These costs are shared across a number of
customers and services and are allocated according to some driver such as
head count or percentage.
Unabsorbed or Overhead Costs: Are costs which cannot be directly
attributed to a customer\service\location. These costs are not attributable to a
customer or service. Examples of overhead costs are executive salaries,
general administrative activities, etc.
It is important to build a costing methodology which includes all three types of cost
since a service which is only cost based on direct costs will be ultimately under
recovered as depicted in the following Figure 7.1.
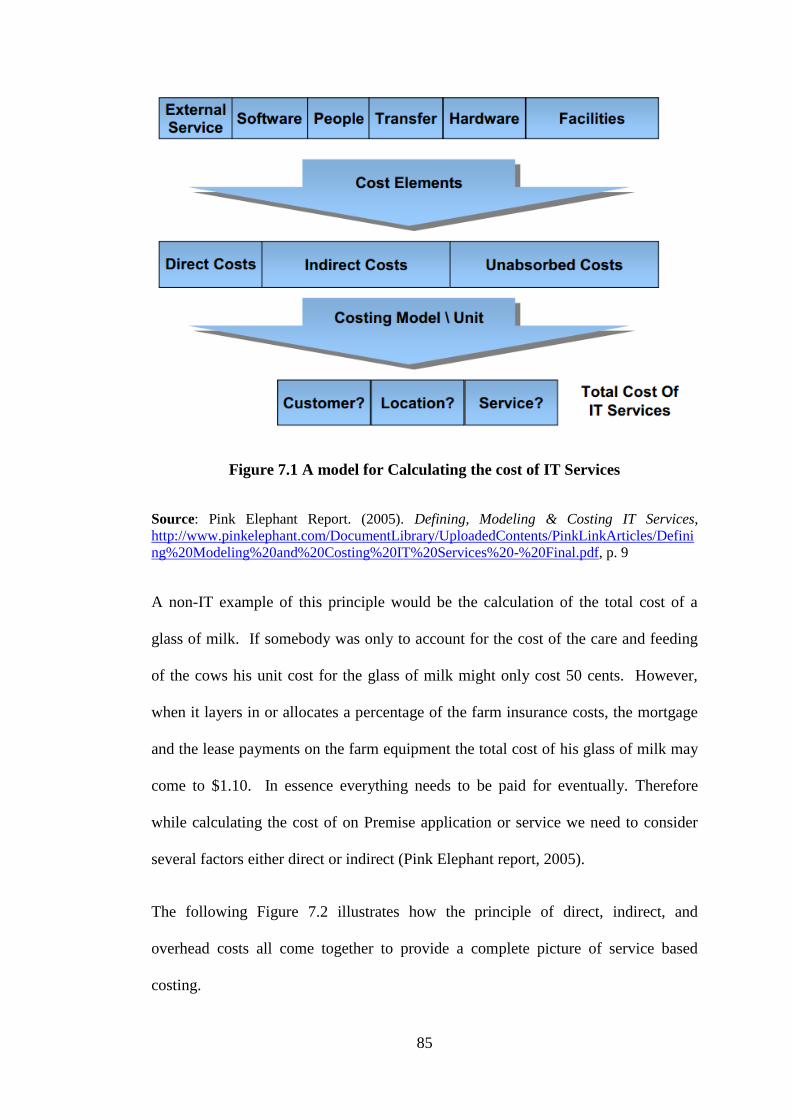
85
Figure 7.1 A model for Calculating the cost of IT Services
Source: Pink Elephant Report. (2005). Defining, Modeling & Costing IT Services,
http://www.pinkelephant.com/DocumentLibrary/UploadedContents/PinkLinkArticles/Defini
ng%20Modeling%20and%20Costing%20IT%20Services%20-%20Final.pdf, p. 9
A non-IT example of this principle would be the calculation of the total cost of a
glass of milk. If somebody was only to account for the cost of the care and feeding
of the cows his unit cost for the glass of milk might only cost 50 cents. However,
when it layers in or allocates a percentage of the farm insurance costs, the mortgage
and the lease payments on the farm equipment the total cost of his glass of milk may
come to $1.10. In essence everything needs to be paid for eventually. Therefore
while calculating the cost of on Premise application or service we need to consider
several factors either direct or indirect (Pink Elephant report, 2005).
The following Figure 7.2 illustrates how the principle of direct, indirect, and
overhead costs all come together to provide a complete picture of service based
costing.
86
Figure 7.2 IT Service Based Costing
Source: Pink Elephant Report. (2005). Defining, Modeling & Costing IT Services,
http://www.pinkelephant.com/DocumentLibrary/UploadedContents/PinkLinkArticles/Defini
ng%20Modeling%20and%20Costing%20IT%20Services%20-%20Final.pdf, p. 10
7.3.2 TCO Calculation Examples
In the following sections, there several TCO calculations for several SaaS solutions
as well as on premise solutions from many vendors and consulting companies. The
reason for providing many examples for TCO is that there is no perfect of calculation
TCO as parameters vary depending on the consultant’s background, perspective,
prejudices, understanding of cost items, and finally, knowledge of the tools.
Therefore, the results may differ from vendor to vendor, customer to customer, and
solution to solution.
7.3.3 TCO of SaaS vs. On Premise Using Simple Approach
The TCO advantage of SaaS is really around the ability to understand the differences
between leveraging a single traditional in-the-datacenter application, vs. leveraging a
similar or same application on-demand. Thus the math consists of understanding the
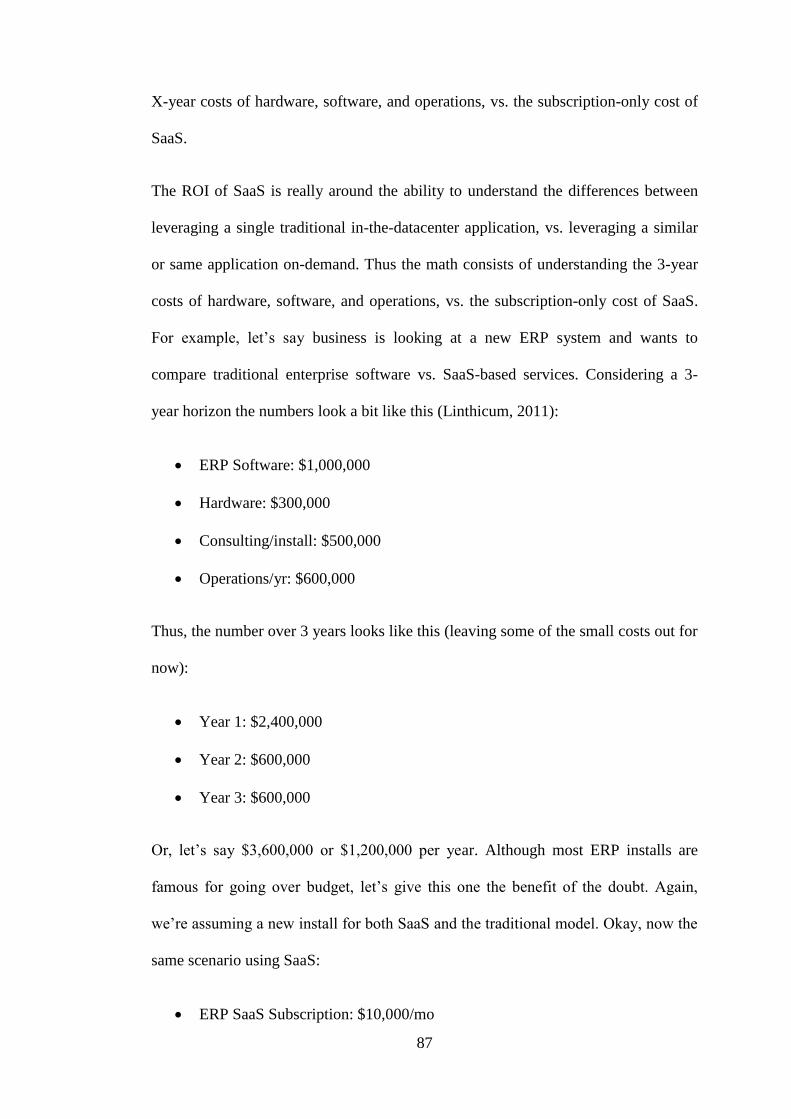
87
X-year costs of hardware, software, and operations, vs. the subscription-only cost of
SaaS.
The ROI of SaaS is really around the ability to understand the differences between
leveraging a single traditional in-the-datacenter application, vs. leveraging a similar
or same application on-demand. Thus the math consists of understanding the 3-year
costs of hardware, software, and operations, vs. the subscription-only cost of SaaS.
For example, let’s say business is looking at a new ERP system and wants to
compare traditional enterprise software vs. SaaS-based services. Considering a 3-
year horizon the numbers look a bit like this (Linthicum, 2011):
ERP Software: $1,000,000
Hardware: $300,000
Consulting/install: $500,000
Operations/yr: $600,000
Thus, the number over 3 years looks like this (leaving some of the small costs out for
now):
Year 1: $2,400,000
Year 2: $600,000
Year 3: $600,000
Or, let’s say $3,600,000 or $1,200,000 per year. Although most ERP installs are
famous for going over budget, let’s give this one the benefit of the doubt. Again,
we’re assuming a new install for both SaaS and the traditional model. Okay, now the
same scenario using SaaS:
ERP SaaS Subscription: $10,000/mo
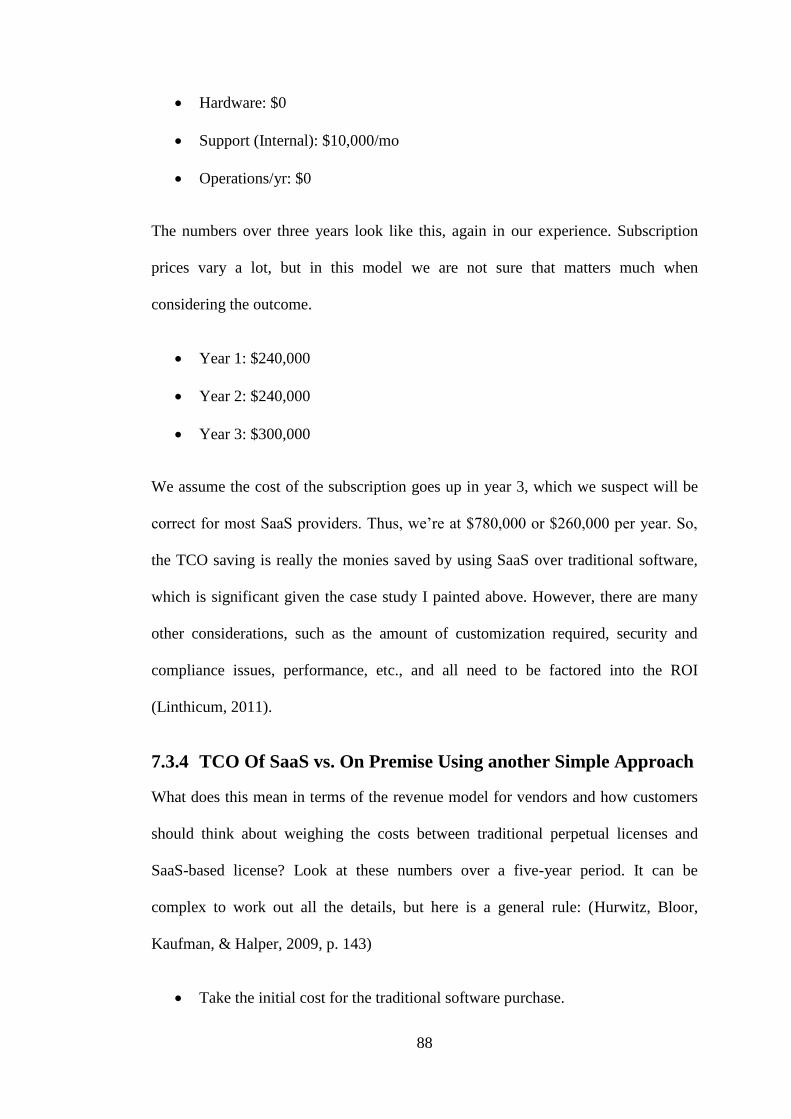
88
Hardware: $0
Support (Internal): $10,000/mo
Operations/yr: $0
The numbers over three years look like this, again in our experience. Subscription
prices vary a lot, but in this model we are not sure that matters much when
considering the outcome.
Year 1: $240,000
Year 2: $240,000
Year 3: $300,000
We assume the cost of the subscription goes up in year 3, which we suspect will be
correct for most SaaS providers. Thus, we’re at $780,000 or $260,000 per year. So,
the TCO saving is really the monies saved by using SaaS over traditional software,
which is significant given the case study I painted above. However, there are many
other considerations, such as the amount of customization required, security and
compliance issues, performance, etc., and all need to be factored into the ROI
(Linthicum, 2011).
7.3.4 TCO Of SaaS vs. On Premise Using another Simple Approach
What does this mean in terms of the revenue model for vendors and how customers
should think about weighing the costs between traditional perpetual licenses and
SaaS-based license? Look at these numbers over a five-year period. It can be
complex to work out all the details, but here is a general rule: (Hurwitz, Bloor,
Kaufman, & Halper, 2009, p. 143)
Take the initial cost for the traditional software purchase.

89
Add an annual fee of 20 percent for maintenance and support.
Consider IT costs (including support services and hardware renewal, and so
on. (For example, does the data center have enough room for the new CRM
application? Will business need to add support staff or new management
software?)
If business buys a traditional software product, it will cost organization a one-time
fee of $100,000. Now business has to add an annual fee of 20 percent for
maintenance and support. If business looks at the costs over five years, for example,
it may determine the following: Software will cost $100,000; maintenance expenses
will add another $100,000 over five years, for a total five-year cost of $200,000.
Business has to consider all the related infrastructure costs. Many SMEs lack or
don’t want the data centers that their larger counterparts have. Larger companies that
can calculate the long-term impact of adding applications are also looking seriously
at the SaaS cloud model. If business goes the SaaS route, here’s what it is looking at:
It determines that to support 50 users, it will cost the business between $10 and $150
per user, per month. That figure includes support, general training, and data center
services. Even if business takes the high-end estimate of $150 per user, the cost of
using the CRM SaaS application for those 50 users for 5 years will run about
$37,500 — far less than the $200,000 cost of on-premise software, even when
business adds other costs (such as customization of business processes within the
application and personnel training) (Hurwitz, Bloor, Kaufman, & Halper, 2009,
p.144).

90
7.3.5 The SaaS vs. On Premise TCO Calculator
Total Cost of Ownership is a key metric for maintaining software solutions. This
simple calculator presents rough TCO calculations for both Software-as-a-Service
and on-premise application implementations. The purpose of this calculator is to let
business quickly compare the total cost of ownership (TCO) of a software-as-a-
service (SaaS) solution to the TCO of an on-premise solution. The values this
calculator provides are approximations, and can in no way obviate the need for a
careful cost/benefit analysis. But they can serve as a first step in determining whether
the potential delta between the two approaches is large enough to warrant further
investigation. Costs are divided into two categories: up front and ongoing. While
SaaS marketing materials sometimes imply that there are no significant up front
expenses for SaaS, this is usually not the case, and these initial costs should be taken
into account. The calculator presents two results: TCO, and annual costs, which is
the sum of the annual licensing/subscription fees, annual management costs, and the
total cost of start-up and upgrades amortized over the number of years in the
calculation (Stevens, 2008).
In the following example in Figure 7.3, a fictious SaaS solution vs. on premise
solution is compared based on some assumptions for 250 users. For on premise
solution, the capital and operational expenses are much higher than the SaaS
solution. For the on premise solution, there are many direct and indirect costs
incurred such as hardware, software, maintenance, operations, backup, archive,
storage, datacenter. In the SaaS solution there are subscription costs plus an initial
startup cost such as migration and training if it could be.
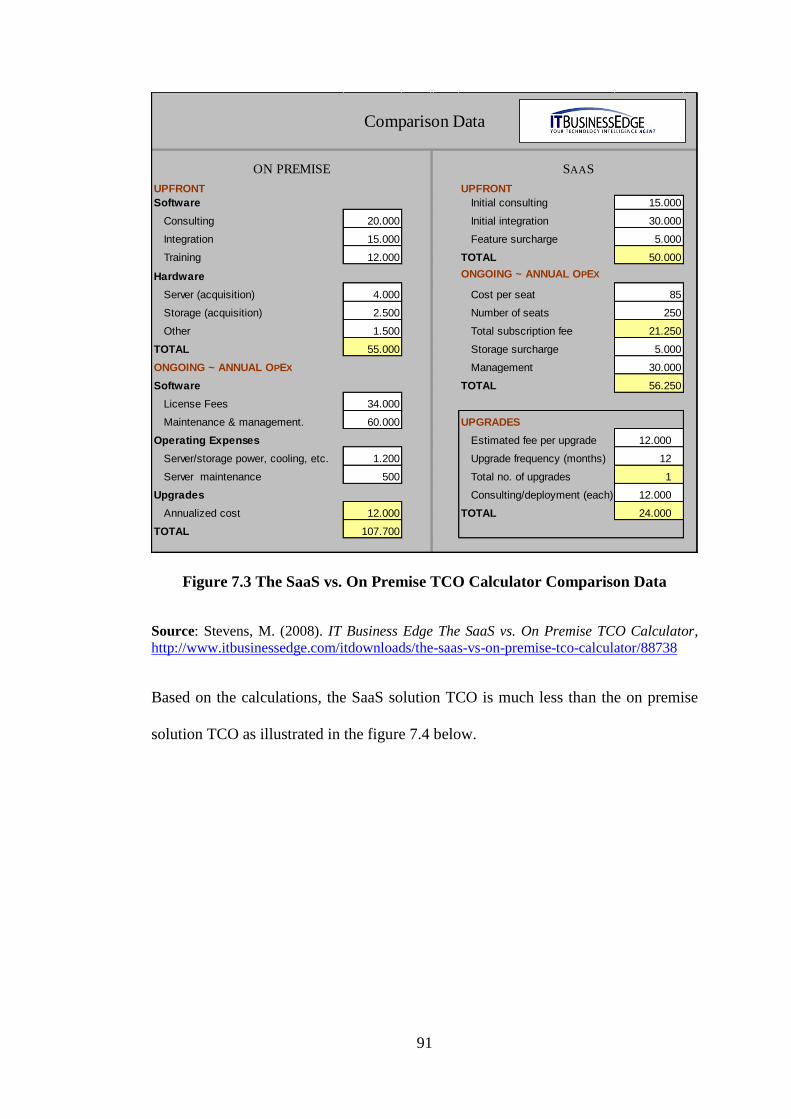
91
Figure 7.3 The SaaS vs. On Premise TCO Calculator Comparison Data
Source: Stevens, M. (2008). IT Business Edge The SaaS vs. On Premise TCO Calculator,
http://www.itbusinessedge.com/itdownloads/the-saas-vs-on-premise-tco-calculator/88738
Based on the calculations, the SaaS solution TCO is much less than the on premise
solution TCO as illustrated in the figure 7.4 below.
UPFRONT UPFRONT
Software Initial consulting 15.000
Consulting 20.000 Initial integration 30.000
Integration 15.000 Feature surcharge 5.000
Training 12.000 TOTAL 50.000
Hardware ONGOING ~ ANNUAL OPEX
Server (acquisition) 4.000 Cost per seat 85
Storage (acquisition) 2.500 Number of seats 250
Other 1.500 Total subscription fee 21.250
TOTAL 55.000 Storage surcharge 5.000
ONGOING ~ ANNUAL OPEX Management 30.000
Software TOTAL 56.250
License Fees 34.000
Maintenance & management. 60.000 UPGRADES
Operating Expenses Estimated fee per upgrade 12.000
Server/storage power, cooling, etc. 1.200 Upgrade frequency (months) 12
Server maintenance 500 Total no. of upgrades 1
Upgrades Consulting/deployment (each) 12.000
Annualized cost 12.000 TOTAL 24.000
TOTAL 107.700
Comparison Data
ON PREMISE SAAS
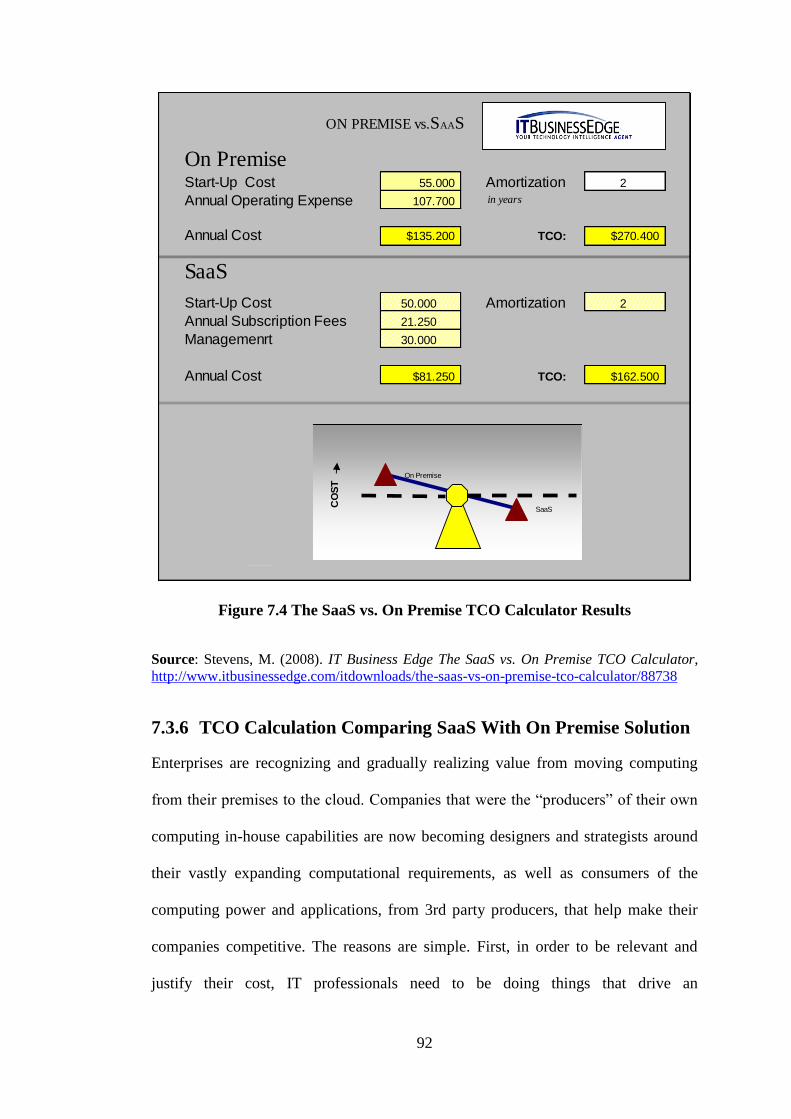
92
Figure 7.4 The SaaS vs. On Premise TCO Calculator Results
Source: Stevens, M. (2008). IT Business Edge The SaaS vs. On Premise TCO Calculator,
http://www.itbusinessedge.com/itdownloads/the-saas-vs-on-premise-tco-calculator/88738
7.3.6 TCO Calculation Comparing SaaS With On Premise Solution
Enterprises are recognizing and gradually realizing value from moving computing
from their premises to the cloud. Companies that were the “producers” of their own
computing in-house capabilities are now becoming designers and strategists around
their vastly expanding computational requirements, as well as consumers of the
computing power and applications, from 3rd party producers, that help make their
companies competitive. The reasons are simple. First, in order to be relevant and
justify their cost, IT professionals need to be doing things that drive an
ON PREMISE vs.SAAS
On PremiseStart-Up Cost 55.000 Amortization 2
Annual Operating Expense 107.700
Annual Cost $135.200 TCO: $270.400
SaaS
Start-Up Cost 50.000 Amortization 2
Annual Subscription Fees 21.250
Managemenrt 30.000
Annual Cost $81.250 TCO: $162.500
On Premise 0,62
SaaS 0,38
in years
On Premise
SaaS
CO
ST
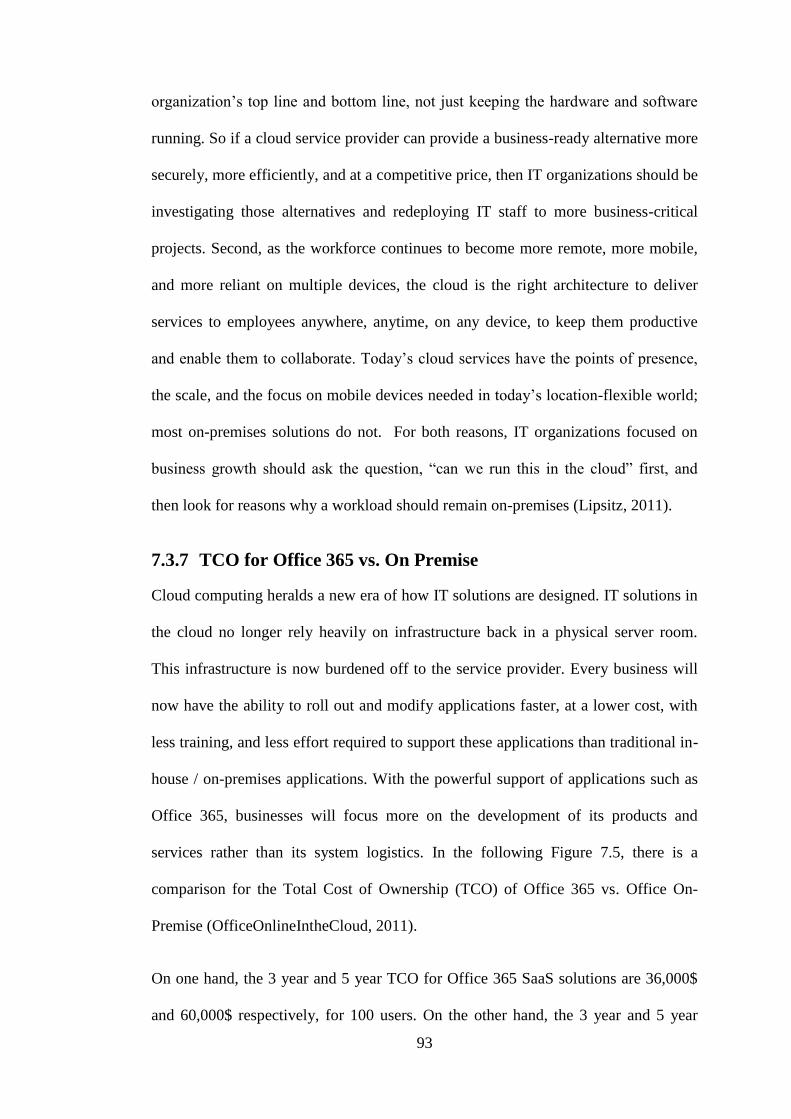
93
organization’s top line and bottom line, not just keeping the hardware and software
running. So if a cloud service provider can provide a business-ready alternative more
securely, more efficiently, and at a competitive price, then IT organizations should be
investigating those alternatives and redeploying IT staff to more business-critical
projects. Second, as the workforce continues to become more remote, more mobile,
and more reliant on multiple devices, the cloud is the right architecture to deliver
services to employees anywhere, anytime, on any device, to keep them productive
and enable them to collaborate. Today’s cloud services have the points of presence,
the scale, and the focus on mobile devices needed in today’s location-flexible world;
most on-premises solutions do not. For both reasons, IT organizations focused on
business growth should ask the question, “can we run this in the cloud” first, and
then look for reasons why a workload should remain on-premises (Lipsitz, 2011).
7.3.7 TCO for Office 365 vs. On Premise
Cloud computing heralds a new era of how IT solutions are designed. IT solutions in
the cloud no longer rely heavily on infrastructure back in a physical server room.
This infrastructure is now burdened off to the service provider. Every business will
now have the ability to roll out and modify applications faster, at a lower cost, with
less training, and less effort required to support these applications than traditional in-
house / on-premises applications. With the powerful support of applications such as
Office 365, businesses will focus more on the development of its products and
services rather than its system logistics. In the following Figure 7.5, there is a
comparison for the Total Cost of Ownership (TCO) of Office 365 vs. Office On-
Premise (OfficeOnlineIntheCloud, 2011).
On one hand, the 3 year and 5 year TCO for Office 365 SaaS solutions are 36,000$
and 60,000$ respectively, for 100 users. On the other hand, the 3 year and 5 year
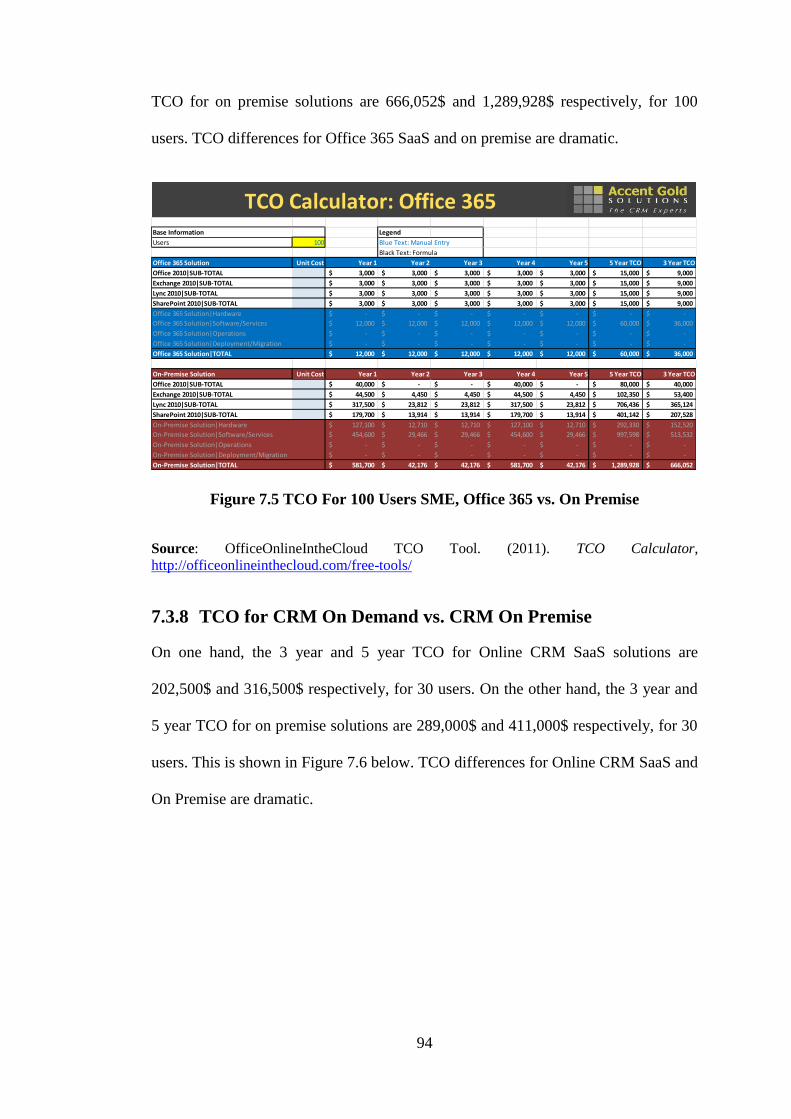
94
TCO for on premise solutions are 666,052$ and 1,289,928$ respectively, for 100
users. TCO differences for Office 365 SaaS and on premise are dramatic.
Figure 7.5 TCO For 100 Users SME, Office 365 vs. On Premise
Source: OfficeOnlineIntheCloud TCO Tool. (2011). TCO Calculator,
http://officeonlineinthecloud.com/free-tools/
7.3.8 TCO for CRM On Demand vs. CRM On Premise
On one hand, the 3 year and 5 year TCO for Online CRM SaaS solutions are
202,500$ and 316,500$ respectively, for 30 users. On the other hand, the 3 year and
5 year TCO for on premise solutions are 289,000$ and 411,000$ respectively, for 30
users. This is shown in Figure 7.6 below. TCO differences for Online CRM SaaS and
On Premise are dramatic.
Base Information Legend
Users 100 Blue Text: Manual Entry
Black Text: Formula
Office 365 Solution Unit Cost Year 1 Year 2 Year 3 Year 4 Year 5 5 Year TCO 3 Year TCO
Office 2010|SUB-TOTAL 3,000$ 3,000$ 3,000$ 3,000$ 3,000$ 15,000$ 9,000$
Exchange 2010|SUB-TOTAL 3,000$ 3,000$ 3,000$ 3,000$ 3,000$ 15,000$ 9,000$
Lync 2010|SUB-TOTAL 3,000$ 3,000$ 3,000$ 3,000$ 3,000$ 15,000$ 9,000$
SharePoint 2010|SUB-TOTAL 3,000$ 3,000$ 3,000$ 3,000$ 3,000$ 15,000$ 9,000$
Office 365 Solution|Hardware -$ -$ -$ -$ -$ -$ -$
Office 365 Solution|Software/Services 12,000$ 12,000$ 12,000$ 12,000$ 12,000$ 60,000$ 36,000$
Office 365 Solution|Operations -$ -$ -$ -$ -$ -$ -$
Office 365 Solution|Deployment/Migration -$ -$ -$ -$ -$ -$ -$
Office 365 Solution|TOTAL 12,000$ 12,000$ 12,000$ 12,000$ 12,000$ 60,000$ 36,000$
On-Premise Solution Unit Cost Year 1 Year 2 Year 3 Year 4 Year 5 5 Year TCO 3 Year TCO
Office 2010|SUB-TOTAL 40,000$ -$ -$ 40,000$ -$ 80,000$ 40,000$
Exchange 2010|SUB-TOTAL 44,500$ 4,450$ 4,450$ 44,500$ 4,450$ 102,350$ 53,400$
Lync 2010|SUB-TOTAL 317,500$ 23,812$ 23,812$ 317,500$ 23,812$ 706,436$ 365,124$
SharePoint 2010|SUB-TOTAL 179,700$ 13,914$ 13,914$ 179,700$ 13,914$ 401,142$ 207,528$
On-Premise Solution|Hardware 127,100$ 12,710$ 12,710$ 127,100$ 12,710$ 292,330$ 152,520$
On-Premise Solution|Software/Services 454,600$ 29,466$ 29,466$ 454,600$ 29,466$ 997,598$ 513,532$
On-Premise Solution|Operations -$ -$ -$ -$ -$ -$ -$
On-Premise Solution|Deployment/Migration -$ -$ -$ -$ -$ -$ -$
On-Premise Solution|TOTAL 581,700$ 42,176$ 42,176$ 581,700$ 42,176$ 1,289,928$ 666,052$
TCO Calculator: Office 365
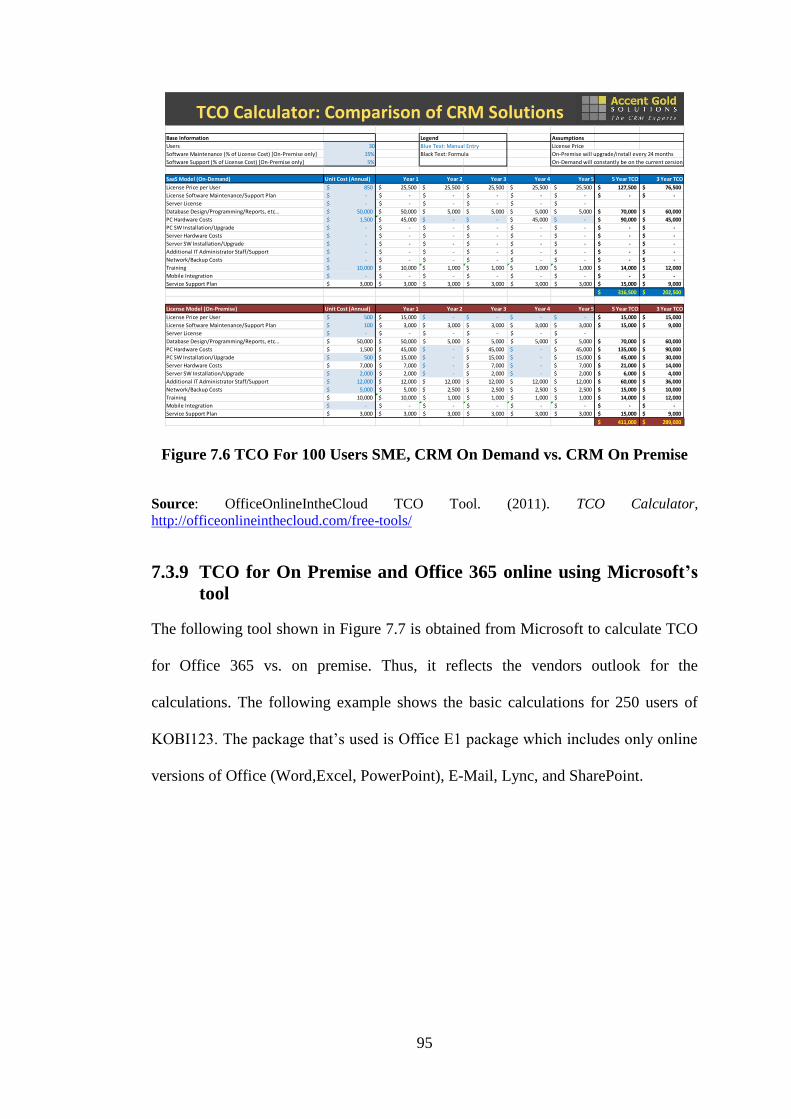
95
Figure 7.6 TCO For 100 Users SME, CRM On Demand vs. CRM On Premise
Source: OfficeOnlineIntheCloud TCO Tool. (2011). TCO Calculator,
http://officeonlineinthecloud.com/free-tools/
7.3.9 TCO for On Premise and Office 365 online using Microsoft’s
tool
The following tool shown in Figure 7.7 is obtained from Microsoft to calculate TCO
for Office 365 vs. on premise. Thus, it reflects the vendors outlook for the
calculations. The following example shows the basic calculations for 250 users of
KOBI123. The package that’s used is Office E1 package which includes only online
versions of Office (Word,Excel, PowerPoint), E-Mail, Lync, and SharePoint.
Base Information Legend Assumptions
Users 30 Blue Text: Manual Entry License Price
Software Maintenance (% of License Cost) [On-Premise only] 15% Black Text: Formula On-Premise will upgrade/install every 24 months
Software Support (% of License Cost) [On-Premise only] 5% On-Demand will constantly be on the current cersion
SaaS Model (On-Demand) Unit Cost (Annual) Year 1 Year 2 Year 3 Year 4 Year 5 5 Year TCO 3 Year TCO
License Price per User 850$ 25,500$ 25,500$ 25,500$ 25,500$ 25,500$ 127,500$ 76,500$
License Software Maintenance/Support Plan -$ -$ -$ -$ -$ -$ -$ -$
Server License -$ -$ -$ -$ -$ -$
Database Design/Programming/Reports, etc… 50,000$ 50,000$ 5,000$ 5,000$ 5,000$ 5,000$ 70,000$ 60,000$
PC Hardware Costs 1,500$ 45,000$ -$ -$ 45,000$ -$ 90,000$ 45,000$
PC SW Installation/Upgrade -$ -$ -$ -$ -$ -$ -$ -$
Server Hardware Costs -$ -$ -$ -$ -$ -$ -$ -$
Server SW Installation/Upgrade -$ -$ -$ -$ -$ -$ -$ -$
Additional IT Administrator Staff/Support -$ -$ -$ -$ -$ -$ -$ -$
Network/Backup Costs -$ -$ -$ -$ -$ -$ -$ -$
Training 10,000$ 10,000$ 1,000$ 1,000$ 1,000$ 1,000$ 14,000$ 12,000$
Mobile Integration -$ -$ -$ -$ -$ -$ -$ -$
Service Support Plan 3,000$ 3,000$ 3,000$ 3,000$ 3,000$ 3,000$ 15,000$ 9,000$
316,500$ 202,500$
License Model (On-Premise) Unit Cost (Annual) Year 1 Year 2 Year 3 Year 4 Year 5 5 Year TCO 3 Year TCO
License Price per User 500$ 15,000$ -$ -$ -$ -$ 15,000$ 15,000$
License Software Maintenance/Support Plan 100$ 3,000$ 3,000$ 3,000$ 3,000$ 3,000$ 15,000$ 9,000$
Server License -$ -$ -$ -$ -$ -$
Database Design/Programming/Reports, etc… 50,000$ 50,000$ 5,000$ 5,000$ 5,000$ 5,000$ 70,000$ 60,000$
PC Hardware Costs 1,500$ 45,000$ -$ 45,000$ -$ 45,000$ 135,000$ 90,000$
PC SW Installation/Upgrade 500$ 15,000$ -$ 15,000$ -$ 15,000$ 45,000$ 30,000$
Server Hardware Costs 7,000$ 7,000$ -$ 7,000$ -$ 7,000$ 21,000$ 14,000$
Server SW Installation/Upgrade 2,000$ 2,000$ -$ 2,000$ -$ 2,000$ 6,000$ 4,000$
Additional IT Administrator Staff/Support 12,000$ 12,000$ 12,000$ 12,000$ 12,000$ 12,000$ 60,000$ 36,000$
Network/Backup Costs 5,000$ 5,000$ 2,500$ 2,500$ 2,500$ 2,500$ 15,000$ 10,000$
Training 10,000$ 10,000$ 1,000$ 1,000$ 1,000$ 1,000$ 14,000$ 12,000$
Mobile Integration -$ -$ -$ -$ -$ -$ -$ -$
Service Support Plan 3,000$ 3,000$ 3,000$ 3,000$ 3,000$ 3,000$ 15,000$ 9,000$
411,000$ 289,000$
TCO Calculator: Comparison of CRM Solutions
96
Figure 7.7 Microsoft Office 365 TCO Tool, Initial Page
Source: www.office365.com web site of Microsoft. (2011).
Based on these calculations, there are some questions related to companies’ ongoing
ICT costs to collect more information from the company regarding on premise
solution costs. It also asks questions related what the currently has installed on
premise to calculate upgrade costs to the new versions of the software. This is shown
in Figure 7.8 below.
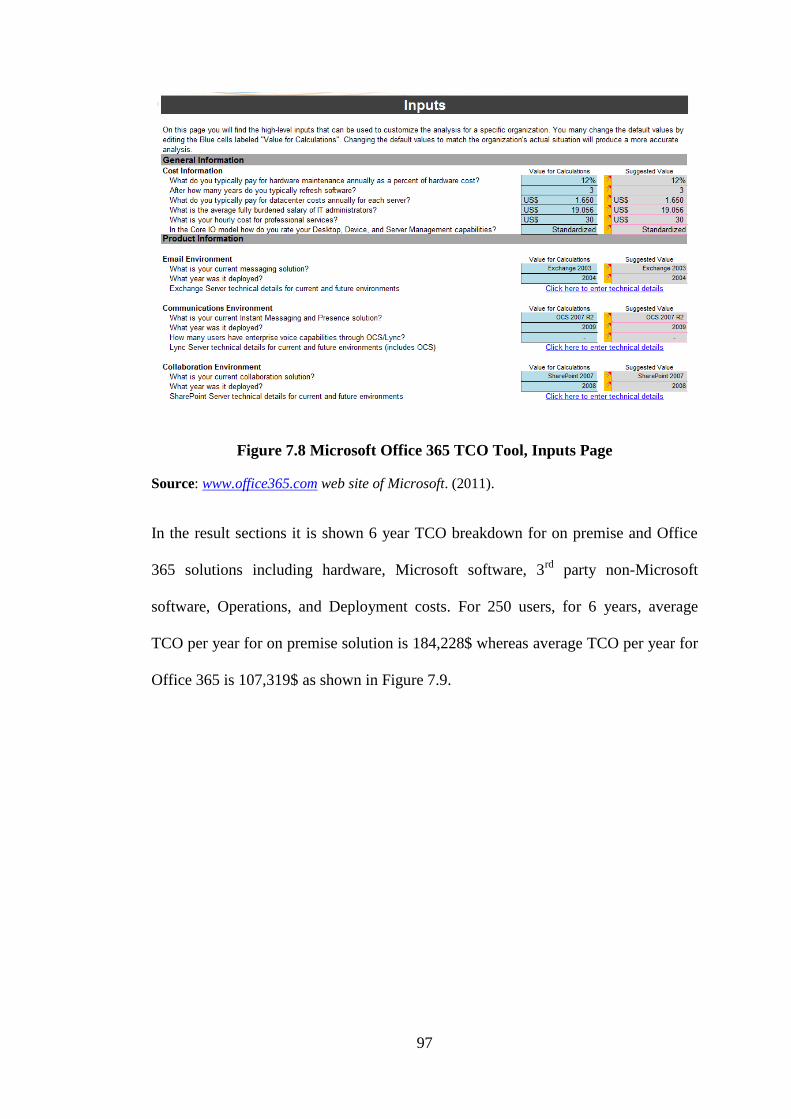
97
Figure 7.8 Microsoft Office 365 TCO Tool, Inputs Page
Source: www.office365.com web site of Microsoft. (2011).
In the result sections it is shown 6 year TCO breakdown for on premise and Office
365 solutions including hardware, Microsoft software, 3rd
party non-Microsoft
software, Operations, and Deployment costs. For 250 users, for 6 years, average
TCO per year for on premise solution is 184,228$ whereas average TCO per year for
Office 365 is 107,319$ as shown in Figure 7.9.

98
Figure 7.9 Microsoft Office 365 Tool, Results Page
Source: www.office365.com web site of Microsoft. (2011).
In the following Figure 7.10, breakdown for each year for all cost items both for on
premise and Office 365 are compared. The most highlighted difference is TCO per
user per month for on premise is 61.41$ whereas TCO per user per month for Office
365 is 35.77$ which means the SME will save more than %42 percent in terms of
cost if it uses Office 365 instead of using it on premise.
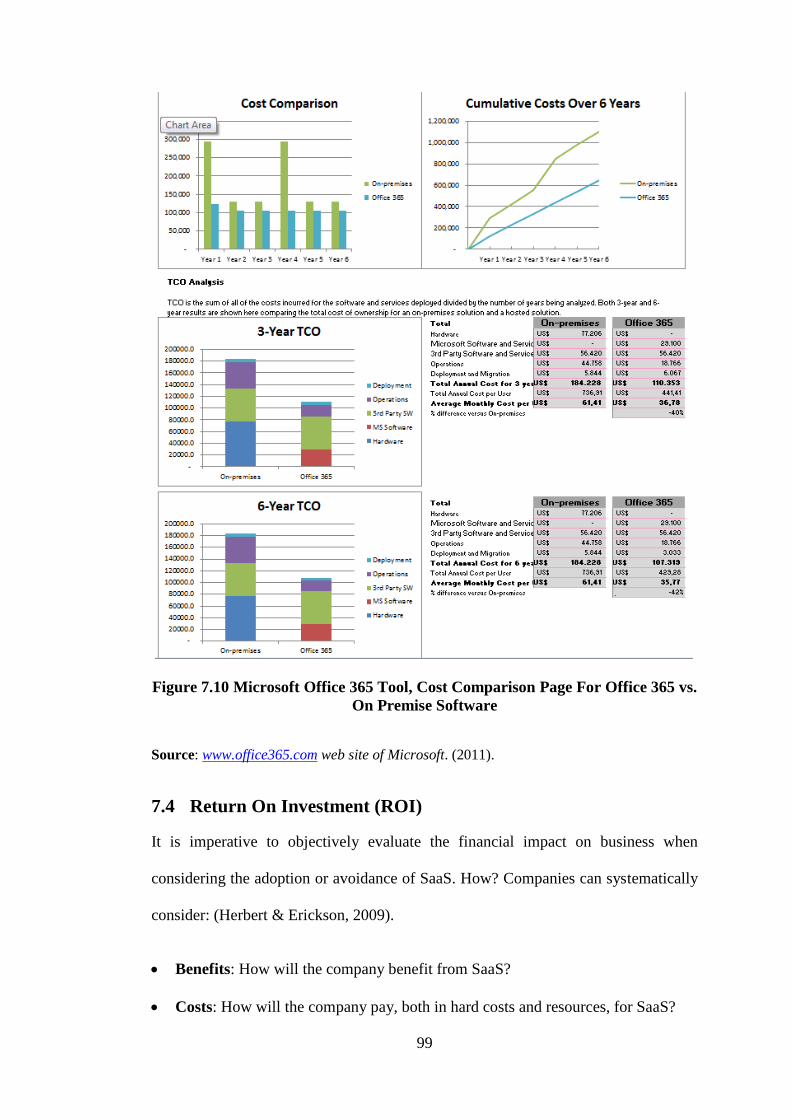
99
Figure 7.10 Microsoft Office 365 Tool, Cost Comparison Page For Office 365 vs.
On Premise Software
Source: www.office365.com web site of Microsoft. (2011).
7.4 Return On Investment (ROI)
It is imperative to objectively evaluate the financial impact on business when
considering the adoption or avoidance of SaaS. How? Companies can systematically
consider: (Herbert & Erickson, 2009).
Benefits: How will the company benefit from SaaS?
Costs: How will the company pay, both in hard costs and resources, for SaaS?
100
Risks: How do uncertainties change the total impact of SaaS on the business?
7.4.1 ROI Comparisons for Different SaaS Applications Using
Complex Approaches
To arrive at a quantitative assessment of the economic implications of SaaS
applications, Forrester Research evaluated the key drivers of benefits, costs, and risks
for an organization considering SaaS. Beyond considerations common to most types
of SaaS, firms must consider application-specific issues as well. For example, some
types of applications (e.g., employee-facing applications and CRM) have a high end
user population, so usability is a big factor that can significantly affect training time
and cost and user adoption of the solution - all of which heavily tie into ROI. See
Figures below for HR and CRM ROI as SaaS. In contrast, IT applications are likely
to have small end user populations and therefore are less likely to benefit from user
adoption and training cost reduction in a significant way (see the figure below).
Many of the firms that Forrester interviewed talked about the significant effect that
user adoption has on the usefulness of analytics and reporting on data contained in
solutions and therefore the ability to drive useful business decisions from solution
information. Other key considerations include breadth of application footprint, which
will determine hardware and IT staff that can be retired or redeployed (costs saved);
and some SaaS solutions will have heavier requirements in areas like storage (e.g.,
content management solutions), integration (e.g., order management), or mobile
(e.g., sales automation), which can have a significant impact on costs incurred. In
terms of upgrades, some categories of SaaS will benefit significantly from
feature/function enhancements that happen frequently, whereas other types of
applications are in areas where firms might be less inclined to care about new
functionality (e.g., accounting packages) (Herbert & Erickson, 2009).

101
The following calculations illustrate PV, NPV, and ROI calculation for 5 years for
SaaS CRM online solution. Payback is 12 to 24 months. ROI is %20 as shown in
Figure 7.11.
Figure 7.11 Model: Total Economic Impact Analysis Summary - SaaS CRM
Source: Herbert, L., & Erickson, J. (2009). Forrester Research Incorporation the ROI of
Software-As-A-Service, p. 7
The following calculations in Figure 7.12 illustrate PV, NPV, and ROI calculation
for 5 years for SaaS HR online solution. Payback is 12 to 24 months. ROI is %26.
Figure 7.12 Model: Total Economic Impact Analysis Summary - SaaS HR
Source: Herbert, L., & Erickson, J. (2009). Forrester Research Incorporation the ROI of
Software-As-A-Service, p. 8
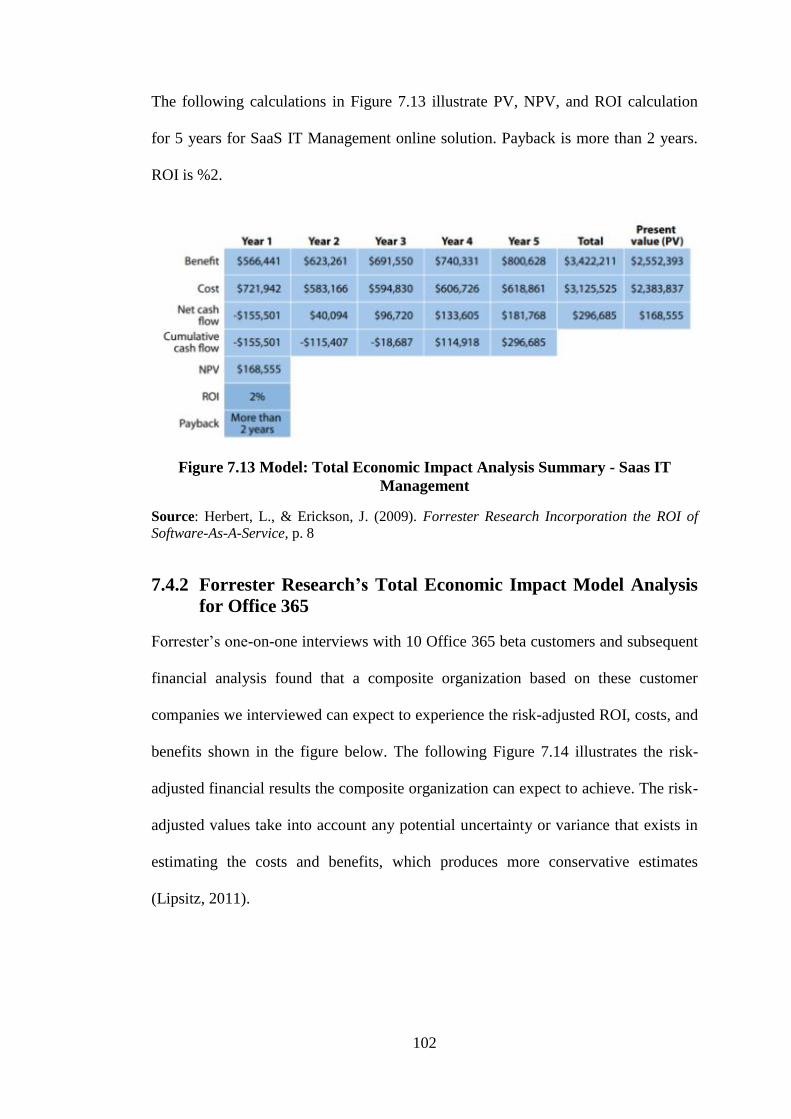
102
The following calculations in Figure 7.13 illustrate PV, NPV, and ROI calculation
for 5 years for SaaS IT Management online solution. Payback is more than 2 years.
ROI is %2.
Figure 7.13 Model: Total Economic Impact Analysis Summary - Saas IT
Management
Source: Herbert, L., & Erickson, J. (2009). Forrester Research Incorporation the ROI of
Software-As-A-Service, p. 8
7.4.2 Forrester Research’s Total Economic Impact Model Analysis
for Office 365
Forrester’s one-on-one interviews with 10 Office 365 beta customers and subsequent
financial analysis found that a composite organization based on these customer
companies we interviewed can expect to experience the risk-adjusted ROI, costs, and
benefits shown in the figure below. The following Figure 7.14 illustrates the risk-
adjusted financial results the composite organization can expect to achieve. The risk-
adjusted values take into account any potential uncertainty or variance that exists in
estimating the costs and benefits, which produces more conservative estimates
(Lipsitz, 2011).
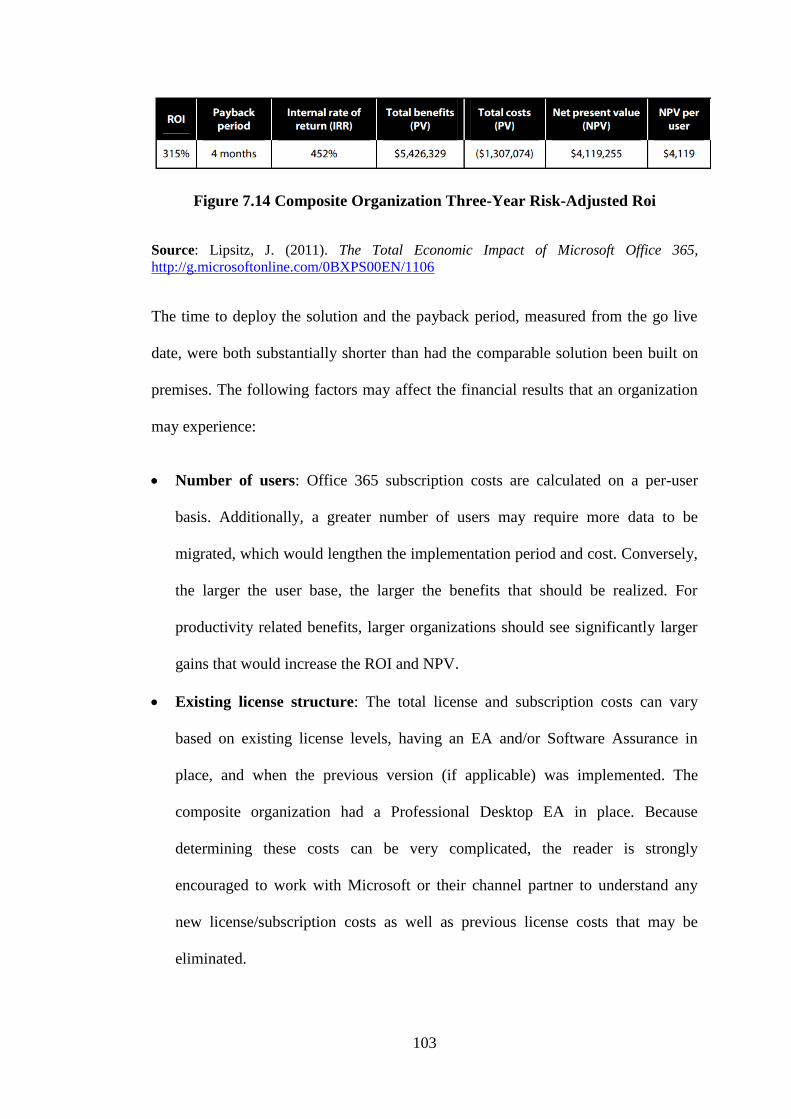
103
Figure 7.14 Composite Organization Three-Year Risk-Adjusted Roi
Source: Lipsitz, J. (2011). The Total Economic Impact of Microsoft Office 365,
http://g.microsoftonline.com/0BXPS00EN/1106
The time to deploy the solution and the payback period, measured from the go live
date, were both substantially shorter than had the comparable solution been built on
premises. The following factors may affect the financial results that an organization
may experience:
Number of users: Office 365 subscription costs are calculated on a per-user
basis. Additionally, a greater number of users may require more data to be
migrated, which would lengthen the implementation period and cost. Conversely,
the larger the user base, the larger the benefits that should be realized. For
productivity related benefits, larger organizations should see significantly larger
gains that would increase the ROI and NPV.
Existing license structure: The total license and subscription costs can vary
based on existing license levels, having an EA and/or Software Assurance in
place, and when the previous version (if applicable) was implemented. The
composite organization had a Professional Desktop EA in place. Because
determining these costs can be very complicated, the reader is strongly
encouraged to work with Microsoft or their channel partner to understand any
new license/subscription costs as well as previous license costs that may be
eliminated.
104
Office 365 solution components used: An organization may decide not to
implement all of the Office 365 solution components – Exchange Online with
Forefront Online Protection for Exchange, Office Professional Plus, Lync Online,
and SharePoint Online. This will reduce the monthly subscription cost, but can
also result in some of the benefit categories discussed in the study not being
realized. The reader should take into consideration which, if any, benefits would
not be realized if the entire suite is not being implemented.
The benefits and costs of Office 365 are documented below according to Forrester
Research’s report.
The composite organization experienced the following benefits (the first ten are
included in the ROI analysis) that represent benefits experienced by the interviewed
companies:
Eliminated hardware
Eliminated third party software
Web conferencing savings
Teleconferencing savings
Enterprise Agreement (EA) licenses substituted with Office 365 subscription
Avoided on premises implementation labor
Reduced IT support effort
Reduced travel costs and corresponding CO2 emissions
Knowledge worker productivity gain
Mobile worker incremental productivity gain
Improved/latest functionality and ease of upgrade (non-quantified)
Better user experience (non-quantified)

105
Improved IT security (non-quantified)
Improved archiving and compliance (non-quantified)
Improved availability and disaster recovery (non-quantified)
Enabled mixed on premises/cloud hybrid solutions (non-quantified)
The composite organization experienced the following costs:
Initial planning and pilot labor
Implementation/migration labor
Hardware
Microsoft subscription and licenses
Training
Ongoing administration
Additional bandwidth
Office 365 delivered a 315% return on investment with a four month payback period
for the composite enterprise organization. Office 365 has a lower TCO, and greatly
reduces implementation times compared to a similar on premises solution. Forrester
created a composite organization that reflects the characteristics of the ten
interviewed customers. The financial results are for the enterprise composite
organization as show in the following Figure 7.15.
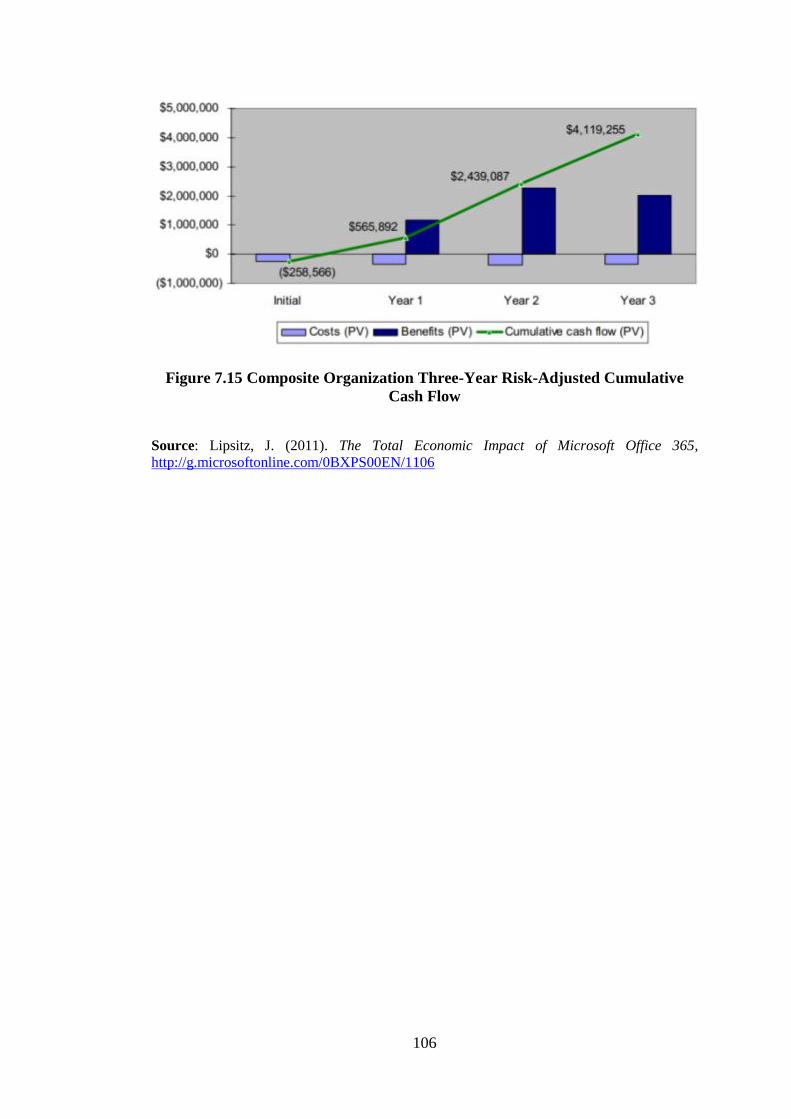
106
Figure 7.15 Composite Organization Three-Year Risk-Adjusted Cumulative
Cash Flow
Source: Lipsitz, J. (2011). The Total Economic Impact of Microsoft Office 365,
http://g.microsoftonline.com/0BXPS00EN/1106

107
8 DISCUSSIONS
There are some areas that are relative to the analyst perceptions which we discovered
during this study. These discussion points are:
Cost and Benefits: These calculations are parameter based. So each person
who makes calculations may or may not include some parameters for
objective numbers.
Security: It is relative to person who makes subjective judgments whether to
keeping data local is safer than putting it on the cloud.
Cloud Standards: SaaS vendors currently do not have any established
industry standard. There is some ongoing work in this area but SaaS vendors
have not yet agreed upon any public standards. There is also no established
standard for backup, restore, data export, and migration for SaaS solutions.
We expect some standards to emerge in the near future.
Laws, Regulations, and Compliance: Some countries require data to be
stored locally somewhere in that country’s premise. Some SaaS vendors have
certain datacenters in the world where they cannot cover all. It is not evident
yet how SaaS vendors will satisfy those government regulations if they have
been asked to.
SaaS software quality and features: Some SaaS applications are not as
strong as on-premise applications despite SaaS vendors claim that they are.
Hardware, Software, Service spending ratios: Turkish ICT services market
is currently developing and ratio of Service spending in the whole ICT costs
is relatively low. It is not obvious how these spending ratios will shape in the
future. Since SaaS subscriptions are part of service spending, it can be
guessed that Service spending ratio will increase comparably.
108
Facebook and SaaS solutions: SMEs can establish their business presence
and corporate portals in Facebook. SaaS vendors are also allowing FaceBook
to become a corporate hub for business application, corporate collaboration
environment, and even for customer relationship management. In Turkey,
Facebook usage is extremely high. Therefore, FaceBook using SMEs may
jump to the SaaS band wagon faster than others. This may be an advantage of
course. There are also some SaaS applications directly integrated into
FaceBook such as Zoho.
109
9 CONCLUSION
While it’s easy to declare that for small businesses without their own IT resources
there is no better option than SaaS, it is obvious that there are many tradeoffs and
there is no clear “winner” for large organizations indeed among SaaS vs. on premise
solution. Analysts debate the SaaS vs. On-premise war often forget that software
exist to resolve business problems. It’s the complexity of these business processes,
the need for customization, the number of user seats etc. that matters, and as we
move up on this scale, increasingly “traditional” Enterprise Software is the answer.
Eventually SaaS will possibly grow up to satisfy those requirements, but it will take
several years.
Basically, SMEs need solutions that enable them to meet their business goals, and
also help them to increase capital expenses for more profitable areas and reduce
operational expenses related to ICT. However, different SMEs need different
solutions; therefore one size does not fit all. For many SMEs, cloud computing
business solutions can help them to achieve low project startup requirements, and
provide added flexibility to scale as business demands require. SaaS vendors help
SMEs by packaging all of the application software, IT infrastructure and services
together in a Web-based, multi-tenant subscription model. SaaS vendors have the
ability to contain variable costs much more effectively than packaged software
vendors-and pass these savings along to SMEs. Additionally, SMEs won’t remain
small forever and SaaS can help prepare these businesses for serious competition, by
deploying world-class, high-quality software to run their processes without the hassle
of licensing, maintenance, and cost.
110
In this study, it is deduced that from the TCO, ROI, and operational qualitative
perspectives, it is wise for SMEs to move to the SaaS cloud computing after carefully
considering the right applications from the rights vendors. However, the checklists
and rating scorecards we provide shall be used during SaaS vendor selection and
evaluation of solutions. Objective evaluation is the key to reap the maximum benefits
from SaaS vendors in the long run.
As a result, it can be deduced that moving to efficient, effective, and proven SaaS
solutions from on premise IT can be extremely beneficial for SMEs in terms of cost,
security, agility, robustness, availability, and reliability. Definitely, SaaS is not a
remedy for all ICT pains of SMEs, therefore companies need to evaluate and
understand the trade-offs that SaaS presents.
111
10 REFERENCES
AppLabs Report, (2009). Testing the cloud,
http://www.qaguild.com/upload/app_whitepaper_testing_the_cloud_1v00.pdf , p. 3
Armbrust, M., Fox, A., Griffith, R., Joseph, A.D., Katz, R.H., Konwinski, A., Lee,
G., Patterson, D.A., Rabkin, A., Stoica, I. & Zaharia, M. (2009). Above the Clouds: A
Berkeley View of Cloud Computing,
http://www.eecs.berkeley.edu/Pubs/TechRpts/2009/EECS-2009-28.html
Banerjee, U., (2011). The Evolution of Cloud Computing,
https://cloudcomputing.sys-con.com/node/1744132
Chou, Y., (2011). Chou’s Theories of Cloud Computing: The 5-3-2 Principle,
http://blogs.technet.com/b/yungchou/archive/2011/03/03/chou-s-theories-of-cloud-
computing-the-5-3-2-principle.aspx
Chou, Y., (2010). Cloud Computing Primer for IT Pros,
http://blogs.technet.com/b/yungchou/archive/2010/11/15/cloud-computing-primer-
for-it-pros.aspx
Hamad, S., & Erickson, J. (2011). Forrester Research Cloud Computing Market
Dynamics in Turkey Presentation
Herbert, L., & Erickson, J. (2009). Forrester Research Incorporation The ROI Of
Software-As-A-Service, p. 3, p. 7, p. 8
Hurwitz, J., Bloor, R, Kaufman, M., & Halper, F. (2009). Cloud Computing for
Dummies, For Dummies Publisher, Indiana: Wiley Publishing
Ivan, I. (2011). Small business owners lack cloud computing knowledge,
http://www.cloudbusinessreview.com/2011/06/04/small-business-owners-lack-cloud-
computing-knowledge.html
Jansen, W., Grance, T. (2011). Guidelines on Security and Privacy in Public Cloud
Computing, http://csrc.nist.gov/publications/drafts/800-144/Draft-SP-800-
144_cloud-computing.pdf
Kutlu, B., & Ozturan, M. (2008). The Usage and Adoption of IT among SMEs in
Turkey: An Exploratory and Longitudinal Study, http://jitm.ubalt.edu/XIX-
1/article2.pdf
Laudon, K.,& Laudon, J. (2011). MIS Managing the Digital Firm 12th Edition, New
Jersey: Pearson Prentice Hall
Lipsitz, J. (2011). The Total Economic Impact of Microsoft Office 365,
http://g.microsoftonline.com/0BXPS00EN/1106
Linthicum, D., (2011), The Clear ROI of SaaS, FORBES,
http://www.forbes.com/sites/microsoft/2011/03/21/the-clear-roi-of-saas/
Liu, F., Tong, J., Mao, J., Bohn, R., Messina, J., Badger, L., & Leaf, D. (2011). NIST
Cloud Computing Reference Architecture,
http://www.nist.gov/customcf/get_pdf.cfm?pub_id=909505
Mell, P. & Grance, T. (2011). The NIST Definition of Cloud Computing,
http://csrc.nist.gov/publications/nistpubs/800-145/SP800-145.pdf
112
OECD Report. (2004). Small and Medium Sized Enterprises Issue and Policies,
http://www.oecd.org/dataoecd/5/11/31932173.pdf
OfficeOnlineIntheCloud TCO Tool. (2011). TCO Calculator,
http://officeonlineinthecloud.com/free-tools/
Orminski, F. (2008). Does Software as a Service (SaaS) displace standard software?,
http://www.iwi.uni-
hannover.de/upload/lv/sosem08/seminar/www/orminski/HTML%20Homepage/index
.html
Pink Elephant Report. (2005). Defining, Modeling & Costing IT Services,
http://www.pinkelephant.com/DocumentLibrary/UploadedContents/PinkLinkArticle
s/Defining%20Modeling%20and%20Costing%20IT%20Services%20-%20Final.pdf
Pushp, S. (2011). A Perspective On Cloud Computing Standards,
http://www.globalservicesmedia.com/Strategies-and-Best-Practices/Emerging-
Models/A-Perspective-On-Cloud-Computing-Standards/24/32/0/GS11060239678
Ried, S. (2008). Forrester's SaaS Maturity Model,
http://www.forrester.com/rb/Research/forresters_saas_maturity_model/q/id/46817/t/
2
Saugatuck Technology Report. (2010). Software-as-a-Service Managing Key
Concerns and Considerations, http://www.sagesaleslogix.com/Products-and-
Services/~/media/Category/CRM/SalesLogix/Assets/Collateral/SaaS_Concerns_and
_Considerations_072610_Sage.pdf
Seker, M. & Correa, P. (2010). Obstacles to Growth for Small and Medium
Enterprises in Turkey, http://www-
wds.worldbank.org/external/default/WDSContentServer/IW3P/IB/2010/05/27/00015
8349_20100527130349/Rendered/PDF/WPS5323.pdf
Skilton, M. (2010). Building Return on Investment from Cloud Computing,
http://www.opengroup.org/cloud/whitepapers/ccroi/index.htm
Stevens, M. (2009). IT Business Edge SaaS Checklist,
http://www.itbusinessedge.com/itdownloads/software-as-a-service-saas-
checklist/88731
Stevens, M. (2008). IT Business Edge The SaaS vs. On Premise TCO Calculator,
http://www.itbusinessedge.com/itdownloads/the-saas-vs-on-premise-tco-
calculator/88738
TUBISAD Report. (2010). Turkey's small and medium sized enterprises lag in IT,
http://www.tubisad.org.tr/Eng/News/Pages/enterpriseslaginIT.aspx
Turan, A. H., & Urkmez, T. (2010). Information Technology Satisfaction of Small
and Medium Sized Enterprises in Turkey,
http://www.eurojournals.com/ibba_9_04.pdf
113
CURRICULUM VITAE
S. Bülent Özkır
Work Experience:
Current: Principal Service Delivery Manager at Microsoft Turkey
Principal Presales Consultant - Regional Team Lead at CA
Senior Technical Account Manager at Microsoft Turkey
Senior Infrastructure Consultant at Microsoft Saudi Arabia
Project Manager at T-Systems Turkey
Lieutenant Consultant at Turkish Army Military Land Forces
Support Engineer at Microsoft Turkey
Application Development Manager at Vestel
Systems Engineer at Intertech
Specialties:
Microsoft Back Office Server Software
Microsoft Office suite and client Operating Systems
Project Management
IT Service Management
Contract Management
Problem Management
Active Certifications:
ITIL v3 Expert
Project Management Professional
Prince2 Practitioner
Microsoft Operations Framework Foundation
Education:
Maltepe Üniversitesi E-MBA English
İstanbul Üniversitesi Computer Science & Engineering
Gaziantep Anadolu Lisesi
Further information about the author can be obtained via LinkedIn web site5.
5 http://www.linkedin.com/profile/view?id=5656188