analysis of school and teacher level factors relating to ... · pdf file1 analysis of school...
TRANSCRIPT

1
Analysis of school and teacher level factors relating to teacher supply
September 2017

2
Executive summary
A school’s ability to achieve a supply of teachers is linked to a large range of factors,
varying from national level issues to teachers level characteristics. To support this,
the Department for Education (DfE) has moved towards more local analysis of the
teacher workforce. This compendium of teacher supply analysis follows on from two
previous publications: the local analysis of the teaching workforce1, which looked at
regional trends in certain teacher supply measures, and the first compendium of
teacher supply analysis2, which looked at entrants to the teaching profession,
teacher retention, and teacher mobility between jobs.
Given that detailed underlying data have already been published alongside each
SFR3; this report does not seek to provide an exhaustive or comprehensive set of
fine-grained data. Instead, it aims to generate new insights and is intended to be an
accessible resource to stimulate debate, improve the public understanding of our
data, and generate ideas for further research, rather than to provide authoritative
answers to research questions.
Section 1 presents the Supply Index, an experimental methodology designed
to identify schools which have significant teacher supply issues. When using
the Supply Index, we can see no clear geographic patterns in schools facing
teacher supply issues.
The Supply Index is an experimental methodology which attributes a score to each
school, depending on the severity of its teacher supply issues. It uses School
Workforce Census data: 7 measures of teacher movement for primary schools and 8
measures for secondary schools (7 measures of teacher movement and 1 measure
of teacher specialism) to calculate an overall score for each school.
The Supply Index methodology was tested through qualitative research with 150
schools. Seven out of every ten schools that were interviewed agreed with their
classification (either having or not having a significant issue) regarding teacher
supply. Schools did highlight that some of supply issues they experienced were not
captured in the Supply Index, such as the number or quality of applicants to a post,
as we did not collect this data in the School Workforce Census. When the Supply
Index scores are mapped (see Annex 1), we can see no strong geographic trends in
teacher supply issues, showing that it is a school level issue. We welcome user
1 https://www.gov.uk/government/statistics/local-analysis-of-teacher-workforce-2010-to-2015 2 https://www.gov.uk/government/statistics/teachers-analysis-compendium-2017 3 https://www.gov.uk/government/statistics/school-workforce-in-england-november-2016

3
feedback on how we can further develop/improve this approach – see page 14 for
how to get in touch.
Section 2 contains maps showing access to Initial Teacher Training (ITT)
providers and places, and shows regional variation in ease of access. Almost
90% of the country is within 5 miles of a school involved in ITT.
Three maps are presented. The approach in all these maps counts all trainees with
the provider – rather than viewing where they may be placed in schools, or where
they may end up in employment after training.
The first shows the number of trainees per teacher for each Local Authority District
(LADs) for 2016-17. Most LADs have at least some provision. High provision per
teacher is seen in urban areas, typically where Higher Education Institutions (HEI)
are located. The majority of rural LADs also have some provision, but of those LADs
with no provision, they are predominantly rural.
The second and third maps show the proximity to ITT providers and schools involved
with ITT respectively. Again, there are spatial variations in the distance to an ITT
provider, however over 80% of the country is within 10 miles of an HEI, School
Centred ITT provider (SCITT) or School Direct lead school.
Section 3 contains a review of the evidence of the factors which cause
teachers to leave the profession, as well as three infographics on factors
related to teacher supply.
There are a wide range of factors that influence teachers’ and schools’ decisions
relating to teacher supply, and factors affecting teachers’ decisions to leave the
profession are a particular important set of influences. Evidence shows that the
decision to leave teaching is a complex one influenced by numerous personal and
professional factors (Ávalos & Valenzuela, 2016; Borman & Dowling, 2008; Grissom,
Viano, & Selin, 2016b; Lindqvist & Nordänger, 2016). These factors also change
throughout a teacher’s career. However, in 2003 Smithers and Robinson found that
workload and accountability pressure, wanting a change or a challenge, the school
situation (including pupil behaviour and school leadership) and salary considerations
were the most prominent factors in leaving. Across studies, teachers in the US,
Canada, Europe and Australia report broadly similar factors for deciding to leave the
profession.
Following the review of evidence on teachers’ decisions to leave, this section
broadens to consider factors affecting teacher supply decisions more widely. The
three infographics detail the range of factors that affect individual agents’ (teachers
and schools) decisions relating to teacher supply, which demonstrate the vast range
of factors which influence decisions. These factors range from national level factors
such as the state of the economy to micro-level factors such as individual agent’s
characteristics: a school’s location or a teacher’s age for example.

4
Section 4, continues the theme of Section 3 – it is a survey of ex-teachers on
their reasons for leaving, which checks whether the main reasons given for
leaving are still consistent with the seminal but dated study in this area.
Workload, government policy, and lack of support from leadership were cited as the
three main reasons for leaving. These top three held when respondents were split by
a range of characteristics, including gender, subject taught, school’s Ofsted rating,
age, and working in London or the Rest of England. Pay was not a major factor,
however, of those who cited lack of progression as a factor for leaving, 38% left for a
higher salary, compared to 22% of those who did not cite lack of progression as
factor. As mentioned in Section 3, Smithers and Robinson (2003) found that a range
of factors influenced teachers’ decisions to leave, including the top 3 from this
survey. However, they did find that salary considerations were also a factor.
The survey found that 85% of respondents said that they didn’t plan to or were
undecided about going back into teaching. In terms of their next job, over 50% said
they left for a job that did not pay as well as their final teaching job, and 60% of those
who left remained in the education sector (the main destinations in the education
sector were independent schools or supply teaching). Of those who did move out of
the education sector, there were no clear industries which they moved into.
The final section, Section 5, details how changes in average teacher pay can
be deconstructed into two different effects – a ‘progression effect’ and a
‘workforce composition effect’.
The first effect is a ‘progression effect’: the change in average pay for teachers in the
workforce in two consecutive years – this includes the increases from promotions
and responsibility allowances. This has a positive effect on average teacher pay
changes. As a percentage of average gross pay for the 2015-16 academic year,
which was £39,0004, the average progression pay rise was 4% (£1,500).
The second effect is a ‘workforce composition effect’: the change in the overall pay
bill associated with reductions in the paybill of those teachers who leave (on average
older and higher paid teachers) and the increase in the paybill of those teachers who
join (on average younger and lower paid teachers). This has a negative effect on
average teacher pay changes. The average salary was £38,000 of those who left,
through wastage, retirement, or death, between 2015/16 and 2016/17. The average
salary of those joining the profession was £27,500. This change on the workforce
composition contributed a £420 million reduction to the pay bill for all teachers.
Overall, these effects combine to explain the change in average pay.
4 For teachers who were in service in that year and the previous year.

5
Contents
Executive summary 2
Contents 5
Introduction 6
Background and the School Workforce Census 6
Methodology 8
1. The Supply Index 9
Calculation of the Supply Index 10
Findings from the Supply Index verification work 14
2. Access to Initial Teacher Training provision 16
3. Factors related to teacher supply and retention 22
Factors influencing teachers’ decisions to leave – a review of international
literature 22
Terminology: Distinction between turnover, mobility and attrition/wastage 22
Key findings 23
Scope and methodological considerations 23
Teachers decide to leave the profession for a number of reasons 24
Limitations and evidence gaps 27
Visualisations of factors relating to teacher supply 27
4. Ex-teachers’ reasons for leaving 36
Aim of the analysis 36
Survey Methodology 37
Findings 38
5. Decomposition of teacher pay rises 44
Progression effect: rises for teachers in service consecutive years 44
Composition effect: change due to leavers and joiners 44
Annex 1: 2016 Supply Index Maps 47
Annex 2: References and overview of the main studies from Section 5 52

6
Introduction
Background and the School Workforce Census
The annual School Workforce Census was introduced in November 2010, replacing
a number of different workforce data collections. It collects information on school
staff from all state-funded schools in England, including local-authority-maintained
(LA-maintained) schools, academy schools (including free schools, studio schools
and university technology colleges) and city technology colleges, special schools
and pupil referral units (PRU)5.
The statistical first release (SFR) “School Workforce in England” provides the main
annual dissemination of statistics based on the data collected, as well as details of
the underlying methodology for those and the collection itself. The latest publication
was released in June 2017, with results from the November 2016 census6. Alongside
the SFRs, an underlying dataset is released, giving some of the workforce statistics
at school level alongside details of regions, local authorities, wards and
parliamentary constituencies. The information is used by the Department for
Education for analysis and modelling, including the Teacher Supply Model7, as well
as research purposes.
Aims of the report
The latest School Workforce Census covers November 2016, so this report does
not replace the SFR as the authoritative source of the latest school workforce
statistics.
The report is designed to look at some of the key questions around the school
workforce in order to improve our understanding of these areas. These sections are
designed to be standalone analyses to cover key themes, while the executive
summary pulls together some of the key findings into a brief overarching narrative.
5 It collects information from LAs on their centrally employed teachers but does not cover early years settings, non-maintained special schools, independent schools, sixth form colleges and other further education colleges. 6 ‘School workforce in England: November 2016’, Department for Education (2017). Available at: https://www.gov.uk/government/collections/statistics-school-workforce 7 More information on the Teacher Supply Model can be found at: Teacher Supply Model 2017 to 2018

7
Organisation of the report
There are five sections in the report:
The Supply Index: We have developed the Supply Index to help identify
schools that are most likely to have significant supply issues. This section
contains the methodology used to construct the Supply Index, the maps of the
results, and qualitative verification work, carried out with 150 schools to
confirm the accuracy of the Supply Index. The Supply Index is an
experimental methodology, so we would welcome feedback on the approach.
Access to initial teacher training maps: This contains two sets of maps,
one set showing proximity to Initial Teacher Training providers and one set
showing the number of trainees per teacher in each Local Authority District.
These maps show the variation in access to ITT provision across the country.
Infographics on factors affecting teacher supply and international
evidence on why teachers leave: This section provides additional context
on the factors related to teacher supply. Firstly, it focuses on the factors
influencing a teacher’s decision to leave the profession with a review of
international evidence on why teachers do leave. The review shows that the
decision to leave teaching is a complex one influenced by many factors. It
then presents a series of infographics showing factors linked to schools’ and
teachers’ decisions relating to teacher supply.
Survey with ex-teachers: These are survey findings of ex-teachers about
their reasons for leaving. This research has been done to support work on
teacher retention, to help design initiatives to encourage more teachers to
stay in the profession. The survey concludes that there are a range of factors
that influence a teacher’s decision to leave.
Decomposition of teacher pay rises: This section deals with teachers’
average pay and how it has changed since 2013. Any change between two
consecutive years can be decomposed into two effects: a ‘progression effect’
whereby teachers receive uplifts based on their performance, and a
‘workforce composition effect’ whereby higher-paid, older teachers leave and
are replaced by lower-paid, younger teachers.
A glossary of terms is available in the previous Teachers Analysis Compendium8.
8 ‘Teachers Analysis Compendium’, Department for Education (2017). Available at: https://www.gov.uk/government/statistics/teachers-analysis-compendium-2017

8
Methodology
This report uses data from a variety of sources to analyse the trends in teacher
supply, retention and mobility. This includes the School Workforce Census,
information on school characteristics and those of the local area. The School
Workforce Census is an annual collection of the composition of the schools
workforce in England employed in: local-authority-maintained nursery, primary,
secondary and special schools; all primary, secondary, and special academy
schools; and free schools. Data have been included from each of the censuses from
2010 to 2016.
For more information on how the School Workforce Census data is collected and
how the statistics are produced see the statistical first release (SFR):
https://www.gov.uk/government/collections/statistics-school-workforce.
These data have been supplemented with schools’ data collected from ‘Get
information about schools’, a register of educational establishments in England and
Wales, maintained by the Department for Education. It provides information on
establishments providing compulsory, higher and further education.
More information on ‘Get information about schools’ is available here:
https://www.get-information-schools.service.gov.uk/
This paper looks at local-authority-maintained nursery, primary and secondary
schools and all primary and secondary academy schools and free schools in
England. Special schools and pupil referral units have not been included in the
analysis. This is because the numbers of teachers are significantly smaller for these
schools, thus making comparisons across the different classifications much less
reliable.

9
1. The Supply Index
The national teacher vacancy rate has been stable at around 0.3% of the teacher
workforce for the last few years. This measure is based on census data from
November each year. There have been concerns that the vacancy rate, due to the
time in the year at which the data is taken, is not reflective of the reality of the
situation facing schools.
In September 2016, the DfE published new analysis9 looking at the local trends and
comparisons of data from the School Workforce Census. In this, we presented a new
way of looking at vacancies: the proportion of schools within a region, which
have at least one advertised vacancy or temporarily filled post on the census
day in November.
This analysis showed that:
1. Overall, the proportion of schools reporting classroom teacher vacancies has
increased since 2010, with London consistently reporting the highest level
2. The proportion of schools with vacancies and temporarily-filled posts
increased as school-to-school mobility increased
3. There were no noticeable trends in the proportion of schools reporting a head
teacher vacancy
In order to build on this further DfE is looking at a range of data related to teacher
recruitment and retention to construct a Supply Index. The index forms part of the
Department’s analysis of teacher supply at a sub-national level, and is being
considered as part of a process to identify schools, which are likely to be
experiencing significant supply issues, with a view to exploring these issues in more
detail with these schools and identifying possible solutions.
The Supply Index focuses predominantly on measures of supply issues that relate to
teacher movement (see further below for a list of measures which make up the
index). There are a number of other types of supply issue which were not included,
either because they did not fit with the focus of the index, or because data was not
held on them. Of particular note of supply issues not included are measures of the
length of time vacancies are open for, the number of applicants for vacancies, or the
perceived quality of applicants, which are not held by DfE.
9 https://www.gov.uk/government/statistics/local-analysis-of-teacher-workforce-2010-to-2015

10
Calculation of the Supply Index
All primary and secondary schools in England with a complete set of supply
variables (see below) are analysed. Because primary and secondary schools’ labour
markets have different characteristics, and London and the Rest of England’s10
labour markets are different, four subsets of data are created and analysed
separately:
Primary schools in London
Primary schools in the Rest of England
Secondary schools in London
Secondary schools in the Rest of England
It is important to note that data is not available for all schools. This is because
for the Supply Index to be accurately calculated, a school must have a
complete set of data, otherwise it would have a lower score when summed (see
below for methodology) suggesting that it was less likely to have supply issues. The
proportions of schools with complete data for the four subsets above is as follows:
Primary schools in London – 94.4%
Primary schools in the Rest of England - 91.4%
Secondary schools in London – 73.3%
Secondary schools in the Rest of England – 68.7%
The proportion of secondary schools included is lower than for primary schools
because the proportion of secondary schools providing curriculum data (data which
is required for one of the variables for the secondary school Supply Index) as part of
the School Workforce Census return is lower than other measures. The inclusion of
a measure which uses curriculum data reduces the percentage of secondary schools
with a Supply Index by 11.6 percentage points for London and 11.2 percentage
points for the Rest of England.
The index is comprised of seven variables for primary schools and eight variables for
secondary schools. The following steps are taken to derive the index:
1. For each variable, schools receive a normalised score between 0 and 5
a. A higher score indicating a characteristic of supply in that school
which is more likely to cause a supply issue
b. Each variable is normalised on the values for that variable for all
schools in that subset between 2011 and 2016
2. These scores are then summed up. This ranges from a minimum of 0
to a maximum of 35 for primary schools and 40 for secondary schools.
10 London has been separated due to the findings from the previous regional analysis that showed London behaved differently on a range of indicators.
11
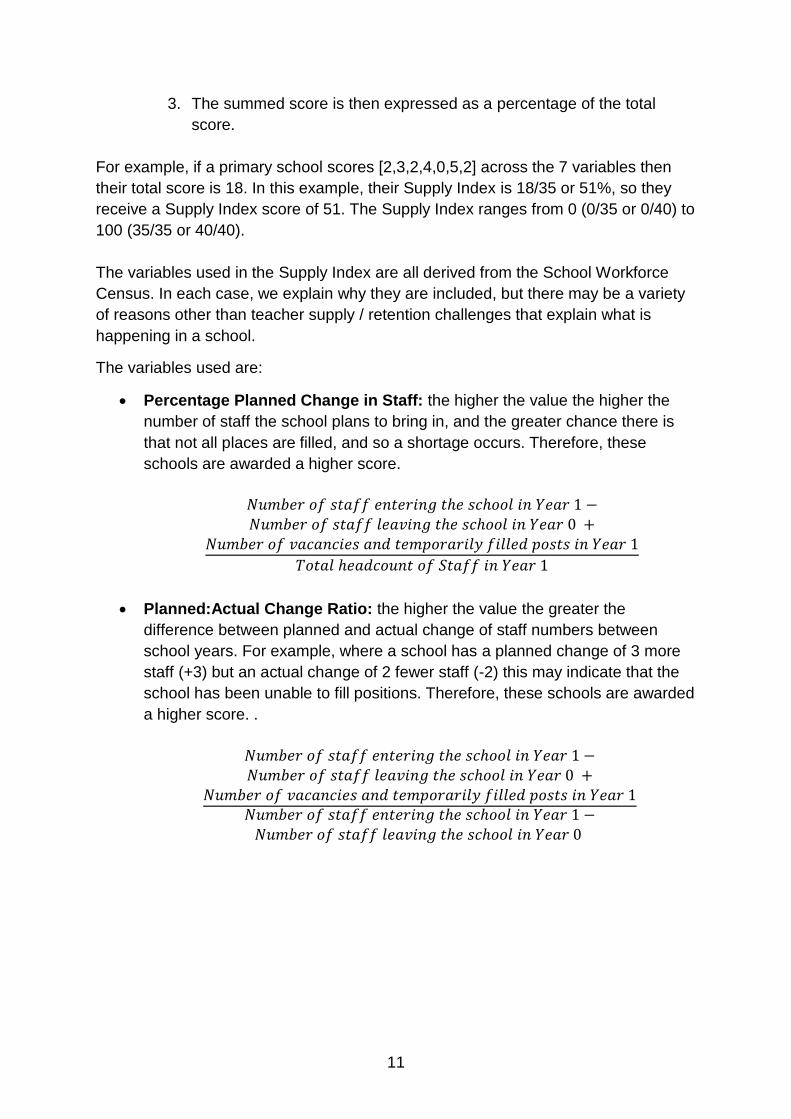
3. The summed score is then expressed as a percentage of the total
score.
For example, if a primary school scores [2,3,2,4,0,5,2] across the 7 variables then
their total score is 18. In this example, their Supply Index is 18/35 or 51%, so they
receive a Supply Index score of 51. The Supply Index ranges from 0 (0/35 or 0/40) to
100 (35/35 or 40/40).
The variables used in the Supply Index are all derived from the School Workforce
Census. In each case, we explain why they are included, but there may be a variety
of reasons other than teacher supply / retention challenges that explain what is
happening in a school.
The variables used are:
Percentage Planned Change in Staff: the higher the value the higher the
number of staff the school plans to bring in, and the greater chance there is
that not all places are filled, and so a shortage occurs. Therefore, these
schools are awarded a higher score.
𝑁𝑢𝑚𝑏𝑒𝑟 𝑜𝑓 𝑠𝑡𝑎𝑓𝑓 𝑒𝑛𝑡𝑒𝑟𝑖𝑛𝑔 𝑡ℎ𝑒 𝑠𝑐ℎ𝑜𝑜𝑙 𝑖𝑛 𝑌𝑒𝑎𝑟 1 −𝑁𝑢𝑚𝑏𝑒𝑟 𝑜𝑓 𝑠𝑡𝑎𝑓𝑓 𝑙𝑒𝑎𝑣𝑖𝑛𝑔 𝑡ℎ𝑒 𝑠𝑐ℎ𝑜𝑜𝑙 𝑖𝑛 𝑌𝑒𝑎𝑟 0 +
𝑁𝑢𝑚𝑏𝑒𝑟 𝑜𝑓 𝑣𝑎𝑐𝑎𝑛𝑐𝑖𝑒𝑠 𝑎𝑛𝑑 𝑡𝑒𝑚𝑝𝑜𝑟𝑎𝑟𝑖𝑙𝑦 𝑓𝑖𝑙𝑙𝑒𝑑 𝑝𝑜𝑠𝑡𝑠 𝑖𝑛 𝑌𝑒𝑎𝑟 1
𝑇𝑜𝑡𝑎𝑙 ℎ𝑒𝑎𝑑𝑐𝑜𝑢𝑛𝑡 𝑜𝑓 𝑆𝑡𝑎𝑓𝑓 𝑖𝑛 𝑌𝑒𝑎𝑟 1
Planned:Actual Change Ratio: the higher the value the greater the
difference between planned and actual change of staff numbers between
school years. For example, where a school has a planned change of 3 more
staff (+3) but an actual change of 2 fewer staff (-2) this may indicate that the
school has been unable to fill positions. Therefore, these schools are awarded
a higher score. .
𝑁𝑢𝑚𝑏𝑒𝑟 𝑜𝑓 𝑠𝑡𝑎𝑓𝑓 𝑒𝑛𝑡𝑒𝑟𝑖𝑛𝑔 𝑡ℎ𝑒 𝑠𝑐ℎ𝑜𝑜𝑙 𝑖𝑛 𝑌𝑒𝑎𝑟 1 −𝑁𝑢𝑚𝑏𝑒𝑟 𝑜𝑓 𝑠𝑡𝑎𝑓𝑓 𝑙𝑒𝑎𝑣𝑖𝑛𝑔 𝑡ℎ𝑒 𝑠𝑐ℎ𝑜𝑜𝑙 𝑖𝑛 𝑌𝑒𝑎𝑟 0 +
𝑁𝑢𝑚𝑏𝑒𝑟 𝑜𝑓 𝑣𝑎𝑐𝑎𝑛𝑐𝑖𝑒𝑠 𝑎𝑛𝑑 𝑡𝑒𝑚𝑝𝑜𝑟𝑎𝑟𝑖𝑙𝑦 𝑓𝑖𝑙𝑙𝑒𝑑 𝑝𝑜𝑠𝑡𝑠 𝑖𝑛 𝑌𝑒𝑎𝑟 1𝑁𝑢𝑚𝑏𝑒𝑟 𝑜𝑓 𝑠𝑡𝑎𝑓𝑓 𝑒𝑛𝑡𝑒𝑟𝑖𝑛𝑔 𝑡ℎ𝑒 𝑠𝑐ℎ𝑜𝑜𝑙 𝑖𝑛 𝑌𝑒𝑎𝑟 1 −
𝑁𝑢𝑚𝑏𝑒𝑟 𝑜𝑓 𝑠𝑡𝑎𝑓𝑓 𝑙𝑒𝑎𝑣𝑖𝑛𝑔 𝑡ℎ𝑒 𝑠𝑐ℎ𝑜𝑜𝑙 𝑖𝑛 𝑌𝑒𝑎𝑟 0

12
Percentage Shortage (vacancies and temporarily filled posts): The higher
the value (e.g. the more vacancies or temporarily filled posts), the higher the
score, as this may reflect the school being unable to fill positions.
𝑁𝑢𝑚𝑏𝑒𝑟 𝑜𝑓 𝑣𝑎𝑐𝑎𝑛𝑐𝑖𝑒𝑠 𝑎𝑛𝑑 𝑡𝑒𝑚𝑝𝑜𝑟𝑎𝑟𝑖𝑙𝑦 𝑓𝑖𝑙𝑙𝑒𝑑 𝑝𝑜𝑠𝑡𝑠 𝑖𝑛 𝑌𝑒𝑎𝑟 1
𝑇𝑜𝑡𝑎𝑙 ℎ𝑒𝑎𝑑𝑐𝑜𝑢𝑛𝑡 𝑜𝑓 𝑆𝑡𝑎𝑓𝑓 𝑖𝑛 𝑌𝑒𝑎𝑟 1 +𝑁𝑢𝑚𝑏𝑒𝑟 𝑜𝑓 𝑣𝑎𝑐𝑎𝑛𝑐𝑖𝑒𝑠 𝑖𝑛 𝑌𝑒𝑎𝑟 1
Staff In:Staff Out Ratio: The lower the value (e.g. the greater the number of
staff leaving relative to the number coming in), the higher the score, as this
may reflect the school being unable to either retain or recruit enough staff. A
ratio of 1 or over shows there is equal inflow and outflow or greater inflow than
outflow respectively, and so they score a zero on this measure.
𝑁𝑢𝑚𝑏𝑒𝑟 𝑜𝑓 𝑠𝑡𝑎𝑓𝑓 𝑒𝑛𝑡𝑒𝑟𝑖𝑛𝑔 𝑡ℎ𝑒 𝑠𝑐ℎ𝑜𝑜𝑙 𝑖𝑛 𝑌𝑒𝑎𝑟 1
𝑁𝑢𝑚𝑏𝑒𝑟 𝑜𝑓 𝑠𝑡𝑎𝑓𝑓 𝑙𝑒𝑎𝑣𝑖𝑛𝑔 𝑡ℎ𝑒 𝑠𝑐ℎ𝑜𝑜𝑙 𝑖𝑛 𝑌𝑒𝑎𝑟 0
Percentage of staff on permanent contract: The lower the value (e.g. the
lower the number of staff on permanent contracts), the higher the score, as a
higher proportion of staff on temporary contracts may reflect a challenge in
filling posts.
𝑁𝑢𝑚𝑏𝑒𝑟 𝑜𝑓 𝑠𝑡𝑎𝑓𝑓 𝑜𝑛 𝑝𝑒𝑟𝑚𝑎𝑛𝑒𝑛𝑡 𝑐𝑜𝑛𝑡𝑟𝑎𝑐𝑡𝑠 𝑖𝑛 𝑌𝑒𝑎𝑟 1
𝑇𝑜𝑡𝑎𝑙 ℎ𝑒𝑎𝑑𝑐𝑜𝑢𝑛𝑡 𝑜𝑓 𝑠𝑡𝑎𝑓𝑓 𝑖𝑛 𝑌𝑒𝑎𝑟 1
Total loss of experience through wastage: the higher the value (e.g. the
more staff leaving the state funded teaching profession, particularly with more
experience), the higher the score, as this may reflect the school having a
greater challenge in retaining staff. Experience is strongly correlated to a
teacher’s propensity to leave the profession (excluding retirement) or move
roles within the profession – more experienced teachers are less likely to
move. Therefore, the experience of teachers needs to be controlled for when
considering the number leaving a school.
1. For each member of a school, calculate the length of time they
have been qualified
2. Sum years of experience for all members of staff who left the
school as wastage or turnover, depending on which measure is
being calculated
3. To control for the size of the school, divide this number total
number of years of experience for the entire school
Not controlling for this would artificially inflate the Supply Index of schools
with larger numbers of less experienced teachers.

13
Total loss of experience through turnover: The higher the value (e.g. the
more staff moving between state funded schools, particularly with more
experience11), the higher the score, as this may reflect a more challenging
situation. The method for calculating this measure is the same as with total
loss of experience through wastage, except with teachers that have left but
remained within the state funded teaching profession.
Percentage of teaching hours by specialists: The lower the value (e.g. the
lower the number of hours taught by a teacher without a relevant post A-level
qualification), the higher the score.
𝑇𝑜𝑡𝑎𝑙 𝑁𝑢𝑚𝑏𝑒𝑟 𝑜𝑓 𝐻𝑜𝑢𝑟𝑠 𝑝𝑒𝑟 𝑊𝑒𝑒𝑘 𝑇𝑎𝑢𝑔ℎ𝑡 𝑏𝑦 𝑆𝑝𝑒𝑐𝑖𝑎𝑙𝑖𝑠𝑡𝑠12
𝑇𝑜𝑡𝑎𝑙 𝑁𝑢𝑚𝑏𝑒𝑟 𝑜𝑓 𝐻𝑜𝑢𝑟𝑠 𝑝𝑒𝑟 𝑊𝑒𝑒𝑘 𝑇𝑎𝑢𝑔ℎ𝑡
This is an experimental methodology, so we would welcome feedback on the
methodology. Please send comments to the Teachers Analysis Mailbox:
The results are not presented for individual schools at this stage whilst we develop the
measure, nor is the underlying data used to construct the Supply Index – the Supply
Index is designed to help target delivery of local supply initiatives and we are continuing
to work with schools to test out this approach. At the same time as we are keen to get
users’ views (see page 14 for contact details).
11 Teacher mobility amongst teachers who have qualified more recently is known to be higher than those who have been qualified a longer time, and so a large number of newly qualified teachers leaving a school is likely to be of less concern than a large number of those who have been qualified a while leaving. This excludes those retiring. 12 Specialists are those teachers with a post A-level qualification in the subject they are teaching

14
Findings from the Supply Index verification work
The analysis represented in this report is new and experimental; we are seeking to
verify them with schools through qualitative work. We have conducted initial survey
work with 90 schools who were ‘high’ on the Supply Index, with a further 60 to do with
schools who had ‘low’ scores. This was designed to see if the findings from the Supply
Index reflected schools’ experiences with recruitment and retention. A full report on the
research will be published later in the year. The key findings of this qualitiative work
were:
Over three quarters of the schools we identified as having high supply
problems in 2015 reported that they had significant problems with recruitment,
retention or both, most of the remaining schools who answered no to the initial
question indicated supply problems to some extent in the following discussion.
Seven out of every ten schools that were interviewed agreed with their
classification (either having or not having a significant issue) regarding
teacher supply
The level of agreement was highest for secondary schools in the rest of
England
The combination of factors listed was different for most schools, but some
commonalities in factors mentioned are listed below.
Some of the types of issues highlighted as contributing to supply challenges
were:
o Low response rates in relation to recruitment
o A lack of choice of quality applicants when making an appointment
decision
o Schools in deprived areas
o Schools being in Ofsted in level 3 or 4
o Schools with gaps in leadership or leadership perceived to be of poor
quality
o Location challenges around being in remote areas, areas where
property was unaffordable or where teachers could easily earn more
across a border.
The majority of the schools in the survey had reported they experienced
supply problems, some for multiple years. The Supply Index has mixed
findings on the consistency of supply issues across a number of years in any
particular school.

15
The initial research also identified some circumstances where this index
methodology does not work as well. For example where the school is very small so
the movement of staff would be exaggerated, where the school is shrinking, where
the school is or has been restructured, and where the school has or is currently
converting to an Academy.
Maps showing the results of the Supply Index for 2016 can be found in Annex 2.
Each schools has been placed in a band depending on its Supply Index score – the
number of schools in each of these bands is provided in the accompanying Excel
tables. The maps are constructed using the programming language R, using a
technique called ‘Voronoi polygons’. Each polygon corresponds to a school: at any
point within that polygon the school is the closest school by straight-line distance.
The boundaries do not represent any specific geographic boundary. Along a
boundary two schools are equidistant from that point. We chose Voronoi polygons
instead of just points showing the location of each school because they are far easier
to interpret visually for a large number of items. These show that there are no clear
geographic patterns to teacher supply issues when using this methodology.

16
2. Access to Initial Teacher Training provision
This section contains four maps showing access to Initial Teacher Training (ITT)
provision across England. It uses provider level data from the 2016 to 2017
academic year which was published in the Initial Teacher Training: Trainee Number
Census – 2016 to 2017:
https://www.gov.uk/government/statistics/initial-teacher-training-trainee-number-
census-2016-to-2017.
The approach in all these maps counts all trainees with the provider – rather than
viewing where they may be placed in schools, or where they may end up in
employment after training.
There are three maps included:
A map showing the number of trainee places per teacher in each Local
Authority District (LAD). This is designed to show the location of providers
across the country. The map shows a huge variation across different LADs.
However, it should be noted that because LADs are arbitrary boundaries,
whilst one LAD will have no provider, parts of it or all of it may be within the
sphere of influence of providers in an LAD close by.
A map showing the proximity to ITT providers: Higher Education Instutions
(HEIs), School Centred ITT providers (SCITTs), and School Direct providers.
These are broken down into concentric contours, showing distances between
0 and 60 miles, by 10 mile intervals. Table 2.1 below shows the proportion of
the country within a certain distance to an ITT provider.
A map showing the proximity to lead and partner schools involved in ITT13. As
there are a far higher number of lead and partner schools than ITT providers,
the gradations here are at 5 mile intervals.
Table 2.1: Proportion of country within a certain distance of an ITT provider
Band Percentage of Country Within Distance
0 to 10 miles 81.1%
10 to 20 miles 17.0%
20 to 30 miles 1.5%
30 to 40 miles 0.4%
40 to 50 miles 0.1%
13 This does not cover schools that may be involved in core HEI ITT provision
17
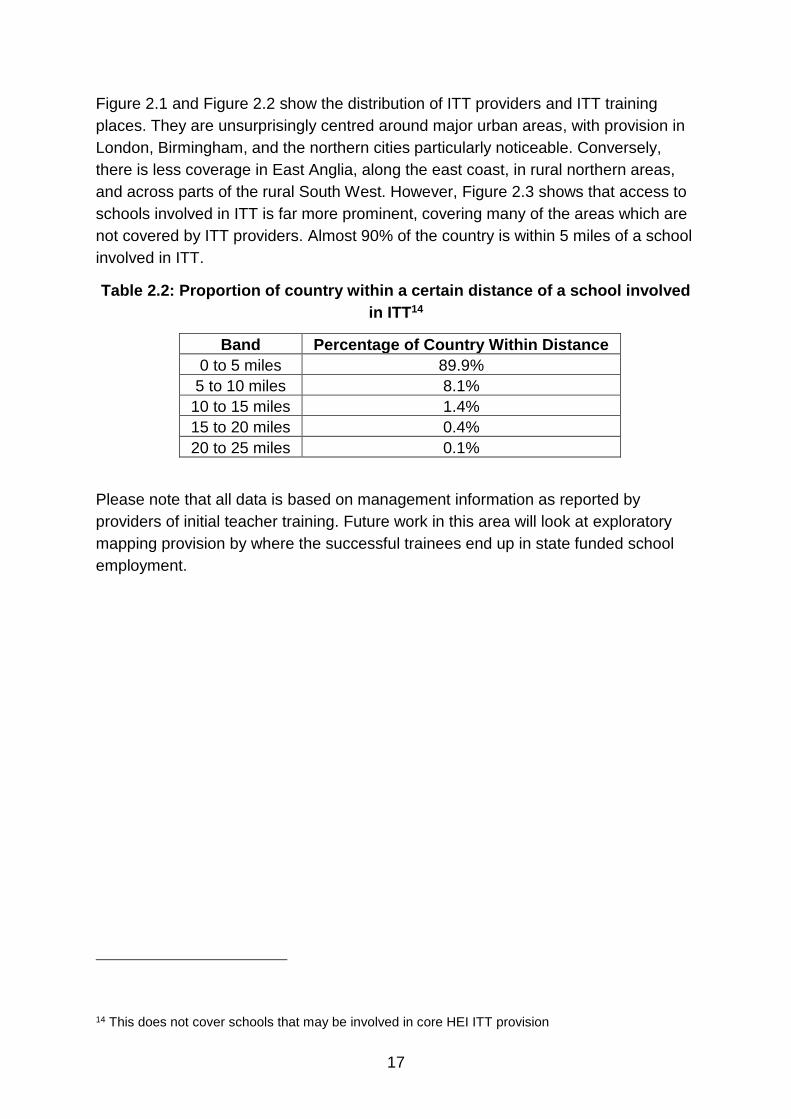
Figure 2.1 and Figure 2.2 show the distribution of ITT providers and ITT training
places. They are unsurprisingly centred around major urban areas, with provision in
London, Birmingham, and the northern cities particularly noticeable. Conversely,
there is less coverage in East Anglia, along the east coast, in rural northern areas,
and across parts of the rural South West. However, Figure 2.3 shows that access to
schools involved in ITT is far more prominent, covering many of the areas which are
not covered by ITT providers. Almost 90% of the country is within 5 miles of a school
involved in ITT.
Table 2.2: Proportion of country within a certain distance of a school involved
in ITT14
Band Percentage of Country Within Distance
0 to 5 miles 89.9%
5 to 10 miles 8.1%
10 to 15 miles 1.4%
15 to 20 miles 0.4%
20 to 25 miles 0.1%
Please note that all data is based on management information as reported by
providers of initial teacher training. Future work in this area will look at exploratory
mapping provision by where the successful trainees end up in state funded school
employment.
14 This does not cover schools that may be involved in core HEI ITT provision

18
Figure 2.1: Number of ITT trainee places per teacher, by Local Authority District

19
Figure 2.2: ITT Provider Proximity

20
Figure 2.3: Proximity to ITT lead and partner schools for those involved in school direct

21

22
3. Factors related to teacher supply and retention
This section considers the wide range of factors that are related to the supply and
retention of teachers. It first specifically explores the factors influencing teachers’
decisions to leave the profession with a review of international evidence on teacher
attrition. The section then presents three visualisations demonstrating the range of
factors that are linked to schools’ and teachers’ decisions around teacher supply.
Factors influencing teachers’ decisions to leave – a review of international literature
The Department’s Analysis of teacher supply, retention and mobility (Department for
Education, 2017) set out analyses of administrative data to explore geographical
factors, school characteristics and teacher characteristics that predict whether a
teacher remained within or left the profession. This section focusses on evidence of
personal and professional reasons that may influence a teacher’s decision to leave the
profession that cannot be captured through administrative data, summarising available
evidence on why teachers decide to leave the teaching profession, covering evidence
from the US, Canada, Europe and Australia. This section provides the wider context
for the findings from a recent study on the reasons for leaving the profession reported
by 1,023 former teachers in England, as presented in the next chapter.
Terminology: Distinction between turnover, mobility and attrition/wastage
When studying barriers to teacher retention, teacher labour market researchers often
distinguish between different pathways out of a given teaching position (Grissom,
Viano, & Selin, 2016a). Most commonly, turnover has been separated into mobility and
attrition or ‘wastage’. For teachers, mobility typically refers to moves to other teaching
positions, whereas attrition or ‘wastage’ refers to leaving the profession altogether.
Distinguishing between these two categories of turnover is important, because studies
have often found that predictors of teachers’ moves to new teaching jobs are not
necessarily the same factors that predict leaving the profession (Grissom et al., 2016).

23
Key findings
The decision to remain or to leave teaching is a complex one influenced by
numerous personal and professional factors that change throughout teachers’
careers (Ávalos & Valenzuela, 2016; Borman & Dowling, 2008; Grissom, Viano,
& Selin, 2016b; Lindqvist & Nordänger, 2016).
Research asking ex-teachers about their reasons to leave the profession has
identified a multitude of factors, most prominently workload and accountability
pressure, wanting a change or a challenge, the school situation (incl. pupil
behaviour and school leadership) and salary considerations (Smithers &
Robinson, 2003).
The reasons for intending to leave and actually leaving the profession might not
be the same (Grissom, Rodriguez, & Kern, 2017; Tye & O’Brien, 2002). Limited
evidence also suggests that the teachers who intend to leave the profession
might not be the same teachers who end up leaving the profession (Worth,
Bramford, & Durbin, 2015).
Across studies, teachers in the US, Canada, Europe and Australia report
broadly similar factors for deciding to leave the profession.
The variability of research methods, countries’ educational policies, and the
characteristics of teachers across studies warrants caution when drawing
general conclusions about teachers’ reasons for leaving.
Scope and methodological considerations
Given that ex-teachers have left the school system, researchers can no longer go
through their schools in order to recruit them for their research. This poses a difficulty
to reach the target group and often leads to low response rates, making it hard to draw
any general conclusions (Gu et al., 2015; Karsenti & Collin, 2013; Tye & O’Brien,
2002). Many researchers, therefore, revert to alternative approaches involving current
teachers who are thinking of leaving, and asking them, for example, about their
reasons for considering leaving the profession (Ryan et al., 2017; Vekeman, Devos,
Valcke, & Rosseel, 2016; Worth et al., 2015). Other researchers ask teachers to
identify aspects of their job that would have dissuaded them from going into teaching
if they had known about them before they started (Barmby, 2006), or factors that they
think drive teachers out of the profession in general (National Foundation for
Educational Research, 2008). However, this might be a problem for several reasons:
(1) it is unclear whether the teachers who report that they intend to leave are those
more likely to actually leave (Worth et al., 2015); (2) reasons for intending to leave
might differ from reasons for actually leaving (Grissom et al., 2016b; Tye & O’Brien,
2002), (3) compared to the proportion of teachers intending to leave the profession, a
smaller proportion actually leaves (Lynch, Bamford, & Wespieser, 2016). Thus, this
review focuses on research with teachers who actually left the teaching profession.
24
Most of the relevant research involved surveying ex-teachers and asking them to rank
a number of potential reasons according to how important they were for their decision
to leave. This section provides a summary of the key findings. A detailed overview of
recent studies and their main findings is provided in the appendix.
Teachers decide to leave the profession for a number of reasons
As teacher attrition seems to result from a combination of factors that accumulate
over time, researchers aim to capture multiple motives rather than asking teachers to
identify an individual reason for leaving the profession (e.g. Karsenti & Collin, 2013;
Lindqvist & Nordänger, 2016; Makela et al., 2014). The most robust and
comprehensive study on the reasons why teachers decide to leave was conducted in
England in 2002-2003 (Smithers and Robinson, 2003). The researchers asked
1,066 leavers to rate 16 possible reasons for how much they contributed to their
decision to leave. In a second step, they interviewed 306 of those respondents to
explore the factors around their decision to leave in more detail. The authors
identified five main factors: workload, new challenge, the school situation, personal
circumstances and salary. Of these, workload was by far the most important reason
cited, and salary the least. They also found that former secondary school teachers
more often referenced working conditions, particularly poor pupil behaviour, than
leavers from primary schools.
Workload. Other research supports these high-level findings. Overwhelmingly,
studies find workload to be one of the top reasons cited (e.g. Howes & Goodman-
Delahunty, 2015; Karsenti & Collin, 2013; Struyven & Vanthournout, 2014; Tye &
O’Brien, 2002). While some studies used a general ‘workload’ category, several
studies had a more detailed breakdown of related tasks, with ‘too much work out of
school hours’ (Buchanan, Prescott, Schuck, Aubusson, & Burke, 2013; Karsenti &
Collin, 2013; Struyven & Vanthournout, 2014), ‘accountability’ and ‘increased
paperwork’ (Tye & O’Brien, 2002) as main leaving factors. This is in line with findings
from the Teacher Workload Survey 2016 in England, that found that teachers
generally felt they spent too much time on lesson planning, marking and data
management rather than actually too much time on teaching (Higton et al., 2017). A
breakdown by phase suggests that workload might be a more decisive reason for
quitting for primary than secondary school teachers (Smithers & Robinson, 2003).
New challenge. Needing change or a challenge as well as personal reasons were
other motives for leaving the profession that played an important role in several
studies. There is limited evidence that this is more pronounced among younger and
early-career teachers (Smithers & Robinson, 2003; Struyven & Vanthournout, 2014)
as well as among PE teachers (Makela et al., 2014) compared to the general
population of ex-teachers. In their study of 235 newly qualified teachers who left

25
teaching within five years after graduating, Struyven & Vanthournout (2014)
identified a ‘lack of future prospects’ as main reason for teachers leaving the
profession early. Similarly, a survey of 230 former PE teachers in Finland identified
the ‘need for a better use of abilities’ and ‘Routinisation of work’ to be participants’
top motives for leaving.
School situation. Leavers in all reviewed studies cited working conditions, mainly
feeling undervalued or lacking support, pupils’ behaviour or attitudes and school
management, as factors that greatly contributed to their decision to leave (Howes &
Goodman-Delahunty, 2015; Karsenti & Collin, 2013; Smithers & Robinson, 2003;
Tye & O’Brien, 2002). Lacking support, feeling undervalued or lacking recognition
were prominent factors themes across several studies (Buchanan, 2009; Howes &
Goodman-Delahunty, 2015; Makela et al., 2014; Smithers & Robinson, 2003;
Struyven & Vanthournout, 2014; Tye & O’Brien, 2002). Mostly these factors were
linked to school management, but sometimes also to educational policy (Smithers &
Robinson, 2003; Struyven & Vanthournout, 2014) or parental support (Tye &
O’Brien, 2002). Overall, relations with parents and colleagues played a smaller role,
but were still found to contribute to teachers’ decision to leave (Buchanan, 2009;
Struyven & Vanthournout, 2014; Tye & O’Brien, 2002). A comparison across school
phases suggests that poor pupil behaviour and the way a school is run might be
more important in secondary school teachers’ decision to leave (Smithers &
Robinson, 2003). Furthermore, school factors were ranked as more influential by
men than by women (Smithers & Robinson, 2003).
Pay. Pay clearly plays a role in teachers’ decisions to leave (Buchanan et al., 2013;
Hancock, 2016; Makela et al., 2014; Smithers & Robinson, 2003; Tye & O’Brien,
2002), but there is mixed evidence on how important this factor is. On the one hand,
there is evidence that pay plays a comparably minor role in teachers’ decisions to
leave. For example, while low pay is one of the reasons that teachers cite for having
left the profession across studies, it consistently ranks fairly low compared to other
reasons (e.g. Hancock, 2016; Makela et al., 2014; Smithers & Robinson, 2003; Tye
& O’Brien, 2002). In line with this, destination research15 finds that teachers do not
leave for better paying jobs and in fact often accept a pay cut when changing careers
(Smithers & Robinson, 2003; Worth et al., 2015).
On the other hand, there is some limited evidence suggesting pay matters for
teacher retention. When asked about what would have made them stay in the
teaching profession, one study found many former teachers indicated that better pay
15 ‘Destination research’ refers to studies that explore what former teacher do upon leaving the teaching profession, i.e. their next destination (e.g. whether they take up a new job and what kind of new job they take up).

26
might have been a factor (Smithers & Robinson, 2003). The authors found pay was
ranked the third most frequently mentioned desirable change after workload
reduction and more support from school leadership. A smaller study of 116 current
and former teachers compared motives for leaving across the two groups (Tye &
O’Brien, 2002). The authors found salary considerations to be the top motive out of
seven for those considering leaving and the bottom motive for those who had
actually left (Tye & O’Brien, 2002). This finding would need to be verified by further
research directly comparing both groups. As both leavers and those intending to
leave ranked paperwork and accountability pressure high, the authors recommend
further research on whether current teachers feel that only higher pay could
compensate for the stress and alienation they are experiencing (Tye & O’Brien,
2002).
Personal reasons. Although working conditions, such as workload, needing a
challenge, the school situation and pay, matter a lot to teacher decision to stay or
leave, there is some evidence that the decision to leave the profession is also
strongly related to individuals’ personal lives outside of school (Lindqvist &
Nordänger, 2016; Schaefer, Long, & Jean Clandinin, 2012). While a range of
personal reasons for leaving the profession came up across studies (e.g. personal
circumstances, family responsibilities, desire to travel, and sometimes wanting
change), most studies did not explore them in detail. Smithers and Robinson (2003)
found women more likely to leave for personal reasons than men. Exploring personal
factors in more detail, a case study of five former teachers who have been part of a
larger longitudinal study of a group of teachers in Sweden, provides some tentative
evidence that suggests that teacher attrition is a process that starts long before
teachers actually leave the profession and is linked to individuals’ self-image
(Lindqvist & Nordänger, 2016). This fits the idea that there is no clear set of factors,
but a complex interplay that builds up over time (Karsenti & Collin, 2013; Makela et
al., 2014). The authors also conclude that teachers whose self-image does not fit
well with their professional identity might over time be more likely to quit (Lindqvist &
Nordänger, 2016).
The importance of identifying with intrinsic and altruistic reasons for staying teaching
(e.g. having a personal interest in one’s subject, wanting to make a difference to
pupils’ lives and a feeling of being good at teaching) is also highlighted in a recent
study of long-serving teachers’ motivations to stay within the profession. Chiong,
Menzies, & Parameshwaran (2017) conducted a survey of over 900 English teachers
and interviews with a subgroup of 14 teachers who have been in the profession for
over 30 years. They note the importance of identification with intrinsic and altruistic
reasons for teaching as decisive retention factors for long-serving teachers (Chiong
et al., 2017).
27
Limitations and evidence gaps
Overall, there is very limited evidence available on teachers’ self-reported reasons
for having left the profession and the data for the methodologically most rigorous
study was collected 15 years ago (Smithers and Robinson, 2003). Some of the
studies on this topic include only small samples or focus on very specific subgroups
of former teachers (e.g. music teachers or PE teachers), which might mean that
findings cannot be generalised to other groups of teachers. While tentative evidence
suggests similar reasons across subject groups (Smithers & Robinson, 2003), further
research would be needed to replicate this. Similarly it is unclear to what extend
cultural differences and countries’ educational policies might impact on teachers’
decisions to leave, so while the current evidence provides us with important insights
into why teachers are leaving the profession, these might not all translate into the
English context.
Depending on how long ago a teacher left the profession, reported reasons could be
biased, as participants’ comments might reflect their current perceptions of their
reasons for leaving rather than the ones that were present when they decided to quit
(Howes & Goodman-Delahunty, 2015). However, there is some evidence that
reasons remain rather stable over time. Re-contacting leavers six to 12 months after
they had decided to leave, Smithers and Robinson (2003) found that the structure of
the reported motive to leave was very similar when comparing the follow-up to the
time of leaving itself. However, more research would be needed on how reliable
these reports are when studies go beyond the one-year time span.
As previously described, research with ex-teachers has often proved difficult, so
further exploration of the validity of alternative approaches would be useful. This
could include research on whether the teachers who report that they intend to leave
are those more likely to actually leave and whether reasons for intending to leave
match reasons for actually leaving.
Visualisations of factors relating to teacher supply
Below are three visualisations which give an indication of the range of factors which
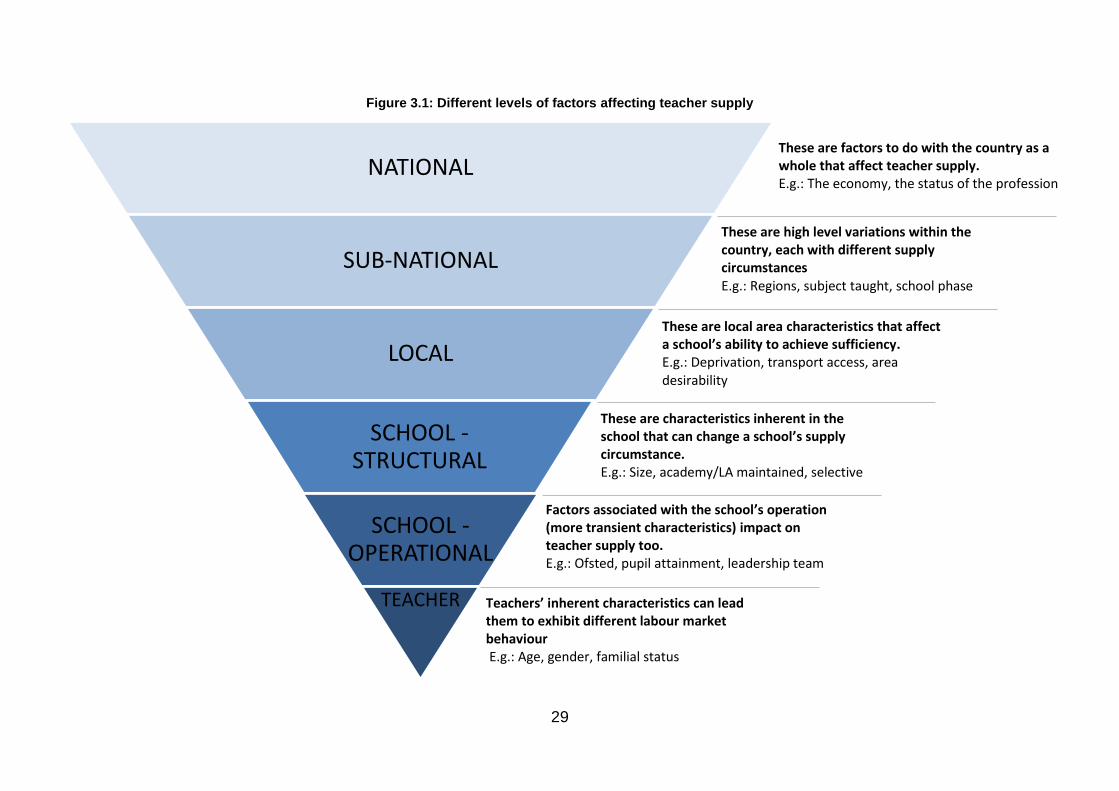
affect teacher supply. Figure 3.1 is a thematic visualisation to exemplify how different
‘levels’ of factors influence teacher supply – from national level issues right down to
teacher characteristics. Figure 3.2 is at a school level, and shows factors which
affect a school’s ability to recruit teachers or influencing their decision-making
around approaches to teacher supply. Figure 3.3 is at a teacher level, and shows the
factors which influence a teacher’s behaviour relating to job movement and retention.
The maps have been developed through literature reviews, conversations with a
range of stakeholders, including Department for Education staff and academics as
part of a workshop run in conjunction with the UK Data Service, and from interviews

28
conducted with 152 headteachers and senior staff as part of the Supply Index
verification work. They are meant to be comprehensive but are not exhaustive, as
they are designed to be indicative of the range of factors which influence the teacher
labour market, demonstrating how teacher supply can vary at a granular level.
In Figure 3.2 and Figure 3.3 influences and characteristics are listed as either factors
or sub-factors. Individual influences and characteristics (for example being a primary,
secondary, or special school) are listed as ‘sub-factors’, which then feed into a
common ‘factor’ (for example primary, secondary, or special school feeds into
‘phase’).
29
Figure 3.1: Different levels of factors affecting teacher supply
NATIONAL
SUB-NATIONAL
LOCAL
SCHOOL -STRUCTURAL
SCHOOL -OPERATIONAL
TEACHER
These are factors to do with the country as a whole that affect teacher supply. E.g.: The economy, the status of the profession
These are high level variations within the country, each with different supply circumstances E.g.: Regions, subject taught, school phase
These are local area characteristics that affect a school’s ability to achieve sufficiency. E.g.: Deprivation, transport access, area desirability
These are characteristics inherent in the school that can change a school’s supply circumstance. E.g.: Size, academy/LA maintained, selective
Factors associated with the school’s operation (more transient characteristics) impact on teacher supply too. E.g.: Ofsted, pupil attainment, leadership team
Teachers’ inherent characteristics can lead them to exhibit different labour market behaviour E.g.: Age, gender, familial status profession

30
Figure 3.2: School level factors that influence teacher supply

31

32

33
Figure 3.3: Teacher level factors that influence supply

34

35

36
4. Ex-teachers’ reasons for leaving
Aim of the analysis
Section 5 outlines some of the literature available on reasons for teachers leaving the
profession, showing that there are a number of reasons, and that these reasons are often
inter-related.
The aim of the analysis was to gather updated information about the reasons why
teachers had left the profession, specifically through asking those who had left as
opposed to those who planned to. This was timely as the seminal English study in this
area was over a decade ago, so this work was to test that the main factors quoted had
changed or were still the same16. In addition, previous analysis has shown that leaving
rates are particularly high for early-career teachers in science, maths and languages17 18.
The analysis presented here focuses on the teachers who have left since 2015.
The analysis was divided into a quantitative survey with teachers who had already left the
profession to understand their reasons for leaving. From these responses people were
asked if they were happy to be contacted for further follow up qualitative interviews to
understand the survey responses in more detail.
The quantitative survey ran from early February until late March 2017 and accrued 2,642
completed responses. However, as explained in the next section on the methodology,
this was stripped down to 1,023 responses to be used for analysis (the reasons for this
are detailed in the methodology below). The sample achieved in the survey is unlikely to
be fully representative of the overall population as:
the survey was distributed through subject specialist associations and other
organisations;
the sample is self-selecting;
whilst the sample reflects high level characteristics of the population, the full
degree of representativeness of the sample is impossible to quantify.
16 Smithers, A., & Robinson, P. (2003). Factors Affecting Teachers’ Decisions to Leave the Profession. Research Report RR430. Liverpool. https://doi.org/10.1016/S0742-051X(02)00101-4 17 https://www.nfer.ac.uk/publications/NUFS01/
18 https://www.gov.uk/government/statistics/teachers-analysis-compendium-2017

37
Survey Methodology
The questions were designed by analysts within DfE and are set out at the end of this
section. The survey was produced on SmartSurvey, with cognitive testing conducted with
a group of ex-teachers within the department. The survey ended automatically if a
respondent said they had not left yet and have not handed in their notice/accepted
another job. It also automatically ended early if they had left for retirement reasons as
these were out of scope of the survey’s aims.
The survey ran from early February until late March 2017, and it was distributed on
different dates by different organisations.
Table 3: Organisation and survey dissemination method
There were 3,347 responses to the survey. However, 705 were not complete, reducing
the sample to 2,642. For the purpose of the analysis the focus was on those who left
since 2015 (removing 1,539), as a) they were likely to best recall reasons for leaving, and
(b) we wanted to ensure the research was relevant to the most recent economic and
school sector factors. In additional those who reported being on the Teach First
programme were also removed (68) as they follow a different career progression model
and could bias the results. A further 12 were removed as they had incomplete
information. This resulted in having a sample of 1,023 cases for analysis. At the end of
the qualitative survey respondents were asked if they were prepared to provide details for
us to conduct follow up interviews – the findings from these interviews will be published
later in the year.
Organisation How survey sent out Date survey
sent
Institute of Physics Email to 13 ex-scholars 07/02/17
Education Support Partnership Newsletter 31/01/17
Association for Language Learning Newsletter 01/02/17
Geographical Association A bespoke email to retired
members & as an item in the
GA’s e-newsletter
02/03/17
TES Email to inactive users 18/02/17
Royal Society of Chemistry
Teachers
Facebook & Twitter 30/01/17 &
07/02/17
Council for Subject Associations Mailing list 01/02/17
STEM learning Newsletter 01/02/17
Teach First Community webpage 10/02/17
Royal Society of Biology Email to Policy Advisory Group
and Biology Education
Research Group & newsletter
07/03/17
(newsletter)

38
The sample used for analysis was found to be representative of the population in terms
of gender, but over-represents secondary teachers (representing nearly 70% of the
sample). This is unsurprising given the organisations that disseminated the survey.
Within this the sample over-represents MFL teachers and under-represents PE and
STEM teachers. The sample was also skewed towards older teachers.
Findings
Workload was the most important factor amongst ex-teachers’ for leaving the
profession
Respondents were asked to rank how important certain factors were in their decision to
leave, on a scale of 1 to 5 (1 not being a factor, 5 being a very important factor). Of those
surveyed, 75% stated that workload was the reason they left the profession, making it
most common reason for deciding to leave. This is in line with findings from research
conducted by the National Foundation for Education Research (NFER), which found that
workload was the central cause of teachers considering leaving the profession19.
Changes in policy or initiatives by Government was the second highest cause, with
feeling undervalued by their leadership or team being the third. Again, both of these are
notable reasons provided in the NFER research.
Conversely, only 17.1% of respondents said that earning a higher salary elsewhere was
a major factor in their decision to leave – in this cohort of teachers pay was not a major
driver for leaving the profession.
When questioned on the number of factors or events that influenced a decision to leave
the profession, 61% of respondents said that it was a single factor (from the list above or
other) or event that triggered their departure.
Reasons for leaving were compared between sub-groups with different characteristics.
There were 5 characteristics that respondents were compared on:
Gender
London/Rest of England
Teaches STEM subject/Teaches non-STEM subject
Ofsted rating
Age (20-30, 31-40, 41- 50, 51+)
The full results of this segmentation are available in the Excel files associated with this
report. However, across all splits by each characteristics, the top three reasons remained
as workload, government initiatives/policy changes, and feeling undervalued by their
19 Engaging Teachers: NFER Analysis of Teacher Retention. National Foundation for Education Research, 2016. https://www.nfer.ac.uk/publications/LFSB01/LFSB01.pdf.

39
leadership or team. In fact, there were no discernible differences between cohorts when
split by the top three characteristics.
Figure 4.1: Importance of reasons for leaving the profession
When split by Ofsted rating of school, there is a correlation between a poorer Ofsted
score and higher proportion of that split cohort claiming certain factors were a more
important factor. Those factors were:
Feeling undervalued by leadership or team
Ofsted inspection pressure
Lack of support from school leadership
Disagreeing with how the school was run
Poor pupil behaviour
When split by age, whilst low pay, no progression, and lack of ambition were still
relatively minor reasons for teachers aged between 20 and 30, compared to older age
groups they were far higher. The table below shows the average score on a 1 to 5 scale
for each age category and reason for leaving. It also shows how ‘pull’ factors from other
jobs are far higher for younger teachers too, which are linked to the previous three
factors.
Table 4: Average score (on 1-5 scale) for selected reasons to leave, by age group
Age 20-30 31-40 41-50 51+
Salary 2.4 1.9 1.7 1.5
No progression 2.1 2.1 2.0 1.9
Ambition 1.9 1.8 1.7 1.6
Other job attractive 2.1 1.9 1.7 1.5
Workload, pupil behaviour, Ofsted pressure, and flexible working were also higher factors
for younger teachers. However, older teachers were more affected by not feeling valued
or supported by leadership or a change in leadership.

40
Those who cited lack of progression as a reason for leaving were no more likely to
leave the education sector but were more likely to have a higher salary in their next
role.
Of those who answered the question ‘when you left the state-funded sector, did you
remain in the education sector?’, those who gave ‘lack of progression’ a score of 4 or 5
when asked about its importance as a contributory factor to leaving were 5 percentage
points more likely to stay in the education sector entirely than those who did not cite
progression as an important factor. Including those who did not answer, 25% of those
who cited lack of progression as an important factor stayed in the education sector,
compared to 20% for those who did not cite lack of progression as an important factor.
Figure 4.2: Answers to the question ‘did you remain in the education sector?’, dependent on citing
lack of progression as a factor for leaving
However, of those who cited lack of progression as a factor for leaving, 38% left for left
for a higher salary, compared to 22% of those who did not cite lack of progression as
factor.

41
Figure 4.3: Answers to the question ‘are you earning more than when you were in teaching in the
state-funded sector?’, dependent on citing lack of progression as a factor for leaving
85% of ex-teachers do not plan to or are undecided about returning to teaching
When asked whether they planned to return to teaching, 85% of respondents said they
did not plan to return or were undecided. Only 3% of respondents said they were
definitely planning to go back into teaching at some point.
Figure 4.4: Proportion of respondents planning on returning to state-funded teaching

42
Over 50% of teachers left for a job that paid less than their teaching role
Figure 4.4 shows that over 50% of respondents left teaching for a job that paid less than
their teaching job, which reinforces the findings in Figure 4.4, that salary was not a major
driver of respondents’ reasons for leaving.
Figure 4.5: Percentage of teachers that left for a higher paid job
Over 60% of leavers remained in the education sector, but of those who did not,
the destinations were hugely varied
In findings consistent with NFER’s20, over 60% of leavers remained in the education
sector after leaving their state-funded teaching post. The largest group within the
education sector was ‘other’, which encompassed a wide variety of roles, including TAs,
educational consultants, academia and public sector employment. As destination, the
independent education sector and supply teaching were the next largest defined groups,
with 12% of respondents stating these were their next job sectors.
20 Should I stay or should I go? National Foundation for Education Research, 2016. https://www.nfer.ac.uk/publications/LFSA01/LFSA01.pdf.

43
Figure 4.6: Destinations of leavers within the education sector
There was no standout sector outside education that respondents moved into. ‘Other’
and ‘self-employed’ were the highest group, which themselves comprise of a range of
jobs. Of actual sectors, the public and third sector were the most popular, however only
marginally, and the remaining sectors showed very little differentiation.
Figure 4.7: Destinations of leavers who did not stay within the education sector
44
5. Decomposition of teacher pay rises
To understand better how teachers’ pay has changed in recent years, we can analyse
trends that underlie the overall increases. Any change between two consecutive years
can be decomposed into two effects: a progression effect, whereby teachers who are in
service in consecutive years receive changes in pay, this includes promotions and
responsibility allowances; and a workforce composition effect, whereby on average,
higher-paid, older teachers leave and are replaced by lower-paid, younger teachers. The
total change in the average salary is a combination of these two effects.
The progression effect has a positive effect on the overall change in pay while the
workforce composition effect has a negative effect. This is explained below, and
summarised in tables 5-7.
This is experimental analysis, as we do not have the pay data for every teacher so some
weighting and grossing is used to match back to the published pay totals.
Progression effect: rises for teachers in service consecutive years
We can calculate total pay rise as the difference in the average gross pay between Year
1 and Year 2 for all individuals who were in service in both years21. This was £1,500
between 2014/15 and 2015/16, which is 3.9% as a percentage of 2014/15 gross pay for
the subset of teachers who were in service in both years.
Composition effect: change due to leavers and joiners
The other major effect is the change to the total pay bill from teachers leaving the
workforce and teachers entering the workforce.
We calculate the number of teachers leaving service and their average pay, giving the
total spend that would have gone on these teachers, but does not as they leave between
years. By multiplying the number of new teachers entering service and their average pay,
we obtain the total spend added to the pay bill. The total composition effect is the new
spend minus the spend on those that have left teaching.
Around 42,800 teachers left the profession through retirement, wastage or death
between 2015/16 and 2016/17. Their average pay is estimated at £38,00022, which by
21 This only considers teachers that have pay data in consecutive School Workforce Censuses. Please note this excludes those whose salary has been misreported. 22 We find the average proportions of those leaving voluntarily by age/gender characteristics and apportion these to the average teacher salaries for those groups (SWC Tables 9a and Teacher Supply Model).

45
itself would lead to a reduction in the paybill of around £1.63 billion. Around 43,800
teachers joined in the same period, earning an average of roughly £27,500, adding
around £1.20 billion to the overall pay bill. The net effect is to subtract some £420 million
from the total, which as a proportion of the entire paybill (net of on-costs, i.e. employers’
national insurance and pensions contributions) is 2.3%.
Combining the progression and composition effects gives the total average salary
change.23
Table 5.1: Change in teacher numbers and pay, 2015/16 to 2016/17
2015/16 2016/17
Teachers in service24 456,900 457,300
Average gross pay25 £37,800 £38,400
Rise in average gross pay on previous year £500 £600
Rise as % of gross pay in previous year 1.2% 1.6%
Table 5.2: Changes due to progression effect
2014/15 2015/16 2016/17
Number of teachers present in
this year and previous year NA 411,500 414,100
Average gross pay of teachers
in consecutive service in
2015/16
£37,400 £39,000 NA
Average gross pay of teachers
in consecutive service in
2016/17
NA £37,800 £39,600
Rise in gross pay of teachers in
consecutive service NA £1,500 £1,800
Rise as % of gross pay NA 3.9% 4.6%
23 There is a small discrepancy owing to issues in the collection of the SWC and simplifying assumptions in
the methodology. 24 Department for Education: School Workforce in England, Table 1, all state-funded schools. 25 Department for Education: School Workforce in England, Table 9a, all state-funded schools. Salaries and changes rounded to nearest £100.

46
Table 5.3: Changes due to workforce composition effect
2015/16 2016/17
Number leaving26 43,370 42,830
Average pay – leavers27 £38,000 £38,000
Number joining23 45,120 43,830
Average pay – joiners24 £27,000 £27,500
Net effect -£430m -£420m
% of paybill -2.4% -2.3%
Figure 5.1: Decomposition of changes to average teacher salary
We welcome comments on the experimental approach taken in this analysis, and any
suggestions for how the approach could be improved. This will inform any future analysis
including further breakdowns (such as the progression effect broken down between
promotion and within pay band increases). Please send comments to the Teachers
Analysis Mailbox: [email protected].
26 Department for Education: School Workforce in England, Table 7b, all state-funded schools. Teacher numbers rounded as published. 27 Constructed from Department for Education: School Workforce in England, Table 9a, all state-funded schools.

47
Annex 1: 2016 Supply Index Maps
In order to understand any geographic patterns using the new supply index the data was
mapped in R using Voronoi Polygons. This technique is designed to show how points, in
this case schools, relate to each other. In is not intended to be an accurate geographic
representation.
The advantage of this technique is that it allowed us to test the hypothesis about
geographic patterns without becoming distracted by the geographic units themselves. We
simply looked at schools in relation to other schools, not to pre-defined
geographic boundaries.
The supply index has been mapped in four groups:
Primary schools in London
Primary schools in the Rest of England
Secondary schools in London
Secondary schools in the Rest of England
London is defined as the Government Office Region. For the Rest of England maps there
is a grey space for London and it is marked as no data available.
For the purpose of the maps below, the ‘supply index’ is divided into bands. The overall
index is comprised of 7 variables for primary schools and 8 variables for secondary
schools. For each variable, a school receives a normalised score between 1 and 5 – a
higher score indicating a characteristic of supply in that school which is more likely to
cause a supply issue. These scores are then summed up and divided by the total
possible score (35 for primary schools and 40 for secondary schools) to give a
percentage. The higher ‘supply index’ scores correspond to a darker colour on the maps
below.
The maps below represent the results of the ‘supply index’ for 2016.

48
Figure A1.1: Supply Index for London primary schools for 2016, mapped by individual school.

49
Figure A1.2: Supply Index for London secondary schools for 2016, mapped by individual school

50
Figure A1.3: Supply Index for primary schools in the rest of England for 2016, mapped by
individual school

51
Figure A1.4: Supply Index for secondary schools in the rest of England for 2016, mapped by
individual school

52
Annex 2: References and overview of the main studies from Section 5
Ávalos, B., & Valenzuela, J. P. (2016). Education for all and attrition/retention of new teachers: A trajectory study in Chile. International Journal of Educational Development, 49, 279–290. https://doi.org/10.1016/j.ijedudev.2016.03.012
Barmby, P. (2006). Improving teacher recruitment and retention: the importance of workload and pupil behaviour. Educational Research, 48(3), 247–265. https://doi.org/10.1080/00131880600732314
Borman, G. D., & Dowling, N. M. (2008). Teacher attrition and retention: A meta-analytic and narrative review of the research. Review of Educational Research, 78(3), 367–409. https://doi.org/10.3102/0034654308321455
Buchanan, J. (2009). Where are they now? Ex-teachers tell their life-work stories. Issues in Educational Research, 19(1), 1–13.
Buchanan, J., Prescott, A., Schuck, S., Aubusson, P., & Burke, P. (2013). Teacher retention and attrition: Views of early career teachers. Australian Journal of Teacher Education, 38(3), 112–129. https://doi.org/10.14221/ajte.2013v38n3.9
Chiong, C., Menzies, L., & Parameshwaran, M. (2017). Why do long-serving teachers stay in the teaching profession? Analysing the motivations of teachers with 10 or more years’ experience in England. British Educational Research Journal. https://doi.org/10.1002/berj.3302
Department for Education. (2017). Analysis of teacher supply, retention and mobility. Retrieved from https://www.gov.uk/government/uploads/system/uploads/attachment_data/file/615729/SFR33_2017_Text.pdf
Grissom, J. A., Rodriguez, L. A., & Kern, E. C. (2017). Teacher and Principal Diversity and the Representation of Students of Color in Gifted Programs: Evidence from National Data. The Elementary School Journal, 117(3), 396–422. https://doi.org/10.1086/690274
Grissom, J. A., Viano, S. L., & Selin, J. L. (2016a). Understanding Employee Turnover in the Public Sector: Insights from Research on Teacher Mobility. Public Administration Review, 76(2), 241–251. https://doi.org/10.1111/puar.12435
Grissom, J. A., Viano, S. L., & Selin, J. L. (2016b). Understanding Employee Turnover in the Public Sector: Insights from Research on Teacher Mobility. Public Administration Review, 76(2), 241–251. https://doi.org/10.1111/puar.12435
Gu, Q., Day, C., Lamb, H., Leithwood, K., Sammons, P., Armstrong, P., & Hagger-, L. (2015). Why teachers leave and return. Report on the feasibility study. DfE. Retrieved from https://www.gov.uk/government/uploads/system/uploads/attachment_data/file/484761/DFE-RR496_Why_teachers_leave_and_return.pdf
Hancock, C. B. (2016). Is the Grass Greener? Current and Former Music Teachers Perceptions a Year After Moving to a Different School or Leaving the Classroom. Journal of Research in Music Education, 63(4), 421–438. https://doi.org/10.1177/0022429415612191
Higton, J., Leonardi, S., Richards, N., Choudhoury, A., Sofroniou, N., & Owen, D. (2017). Teacher Workload Survey 2016. Retrieved from https://www.gov.uk/government/uploads/system/uploads/attachment_data/file/592499/T

53
WS_2016_FINAL_Research_report_Feb_2017.pdf
Howes, L. M., & Goodman-Delahunty, J. (2015). Teachers’ career decisions: Perspectives on choosing teaching careers, and on staying or leaving. Issues in Educational Research, 25(1), 18–35. Retrieved from http://www.iier.org.au/iier25/howes.pdf
Karsenti, T., & Collin, S. (2013). Why are new teachers leaving the profession? Results of a Canada-wide survey. Education, 3(3), 141–149. https://doi.org/10.5923/j.edu.20130303.01
Lindqvist, P., & Nordänger, U. K. (2016). Already elsewhere – A study of (skilled) teachers’ choice to leave teaching. Teaching and Teacher Education, 54, 88–97. https://doi.org/10.1016/j.tate.2015.11.010
Lynch, S., Bamford, S., & Wespieser, K. (2016). Engaging Teachers : NFER Analysis of Teacher Retention. Slough. Retrieved from https://www.nfer.ac.uk/publications/LFSB01/LFSB01.pdf
Makela, K., Hirvensalo, M., Laakso, L., & Whipp, P. R. (2014). Physical education teachers in motion: an account of attrition and area transfer. Physical Education and Sport Pedagogy, 19(4), 418–435. https://doi.org/10.1080/17408989.2013.780590
National Foundation for Educational Research. (2008). Teacher Voice Omnibus. June 2008 Survey: pupil behaviour. Educational Research. Retrieved from https://www.nfer.ac.uk/what-we-offer/teacher-voice/pdfs/dcsf-rw069.pdf
Ryan, S. V, von der Embse, N. P., Pendergast, L. L., Saeki, E., Segool, N., & Schwing, S. (2017). Leaving the teaching profession: The role of teacher stress and educational accountability policies on turnover intent. Teaching and Teacher Education, 66, 1–11. https://doi.org/https://doi.org/10.1016/j.tate.2017.03.016
Schaefer, L., Long, J. S., & Jean Clandinin, D. (2012). Questioning the research on early career teacher attrition and retention. Alberta Journal of Educational Research, 58(1), 106–121. Retrieved from http://ajer.journalhosting.ucalgary.ca/index.php/ajer/article/download/980/863
Smithers, A., & Robinson, P. (2003). Factors Affecting Teachers’ Decisions to Leave the Profession. Research Report RR430. Liverpool. https://doi.org/10.1016/S0742-051X(02)00101-4
Struyven, K., & Vanthournout, G. (2014). Teachers’ exit decisions: An investigation into the reasons why newly qualified teachers fail to enter the teaching profession or why those who do enter do not continue teaching. Teaching and Teacher Education, 43, 37–45. https://doi.org/10.1016/j.tate.2014.06.002
Tye, B. B., & O’Brien, L. (2002). Why Are Experienced Teachers Leaving the Profession? Phi Delta Kappan, 84(1), 24–32. https://doi.org/10.1177/003172170208400108
Vekeman, E., Devos, G., Valcke, M., & Rosseel, Y. (2016). Do teachers leave the profession or move to another school when they don’t fit? Educational Review, 1911(September), 1–24. https://doi.org/10.1080/00131911.2016.1228610
Worth, J., Bramford, S., & Durbin, B. (2015). Should I stay or should I go? NFER Analysis of teachers joining and leaving the profession. Slough. Retrieved from https://www.nfer.ac.uk/publications/LFSA01/LFSA01.pdf

54
Table 6: Reported reasons contributing to teachers’ decision to leave (findings from the main
studies reviewed for this section)
Study Country Methods & sample Reported reasons for leaving the
profession28
Buchanan,
2009
USA Semi-structured
telephone interviews
with 22 ex-teachers on
how and why they
decided to leave or enter
school teaching; whether
their views have
changed since making
their decision to leave or
enter teaching, if so,
how and why
Interview themes:
- Lack of collegiality / isolation;
- Salary;
- Workload and responsibility;
- Working conditions including
support;
- Prestige;
- Security/ career path
Hancock,
2016
USA Survey of 270 music
teachers who had not
been teaching at their
current school in the
previous year (this
included both teachers
who moved schools and
who left the profession);
Data source: Nationally
representative data from
2004–2005 Teacher
Follow-up Survey and
2003–2004 Schools and
Staffing Survey
REASON FOR LEAVING
1. Personal reasons (51%)
(parenting/retirement/family/personal)
2. School staffing actions (11%)
3. Further education (9%),
4. Dissatisfaction with current post
(8%)
5. Other work (6%) & better salary/
benefits (5%)
REASON FOR MOVING
1. Being laid off/involuntary transfer
(21%)
2. Dissatisfied with admin support
(21%)
3. Dissatisfied in general (14%)
28 Where available from the sources, the reasons are ranked by reported importance (indicated by rankings or percentages of ex-teachers reporting the reason). Where no ranking exists, the order of reasons is not indicative of importance.
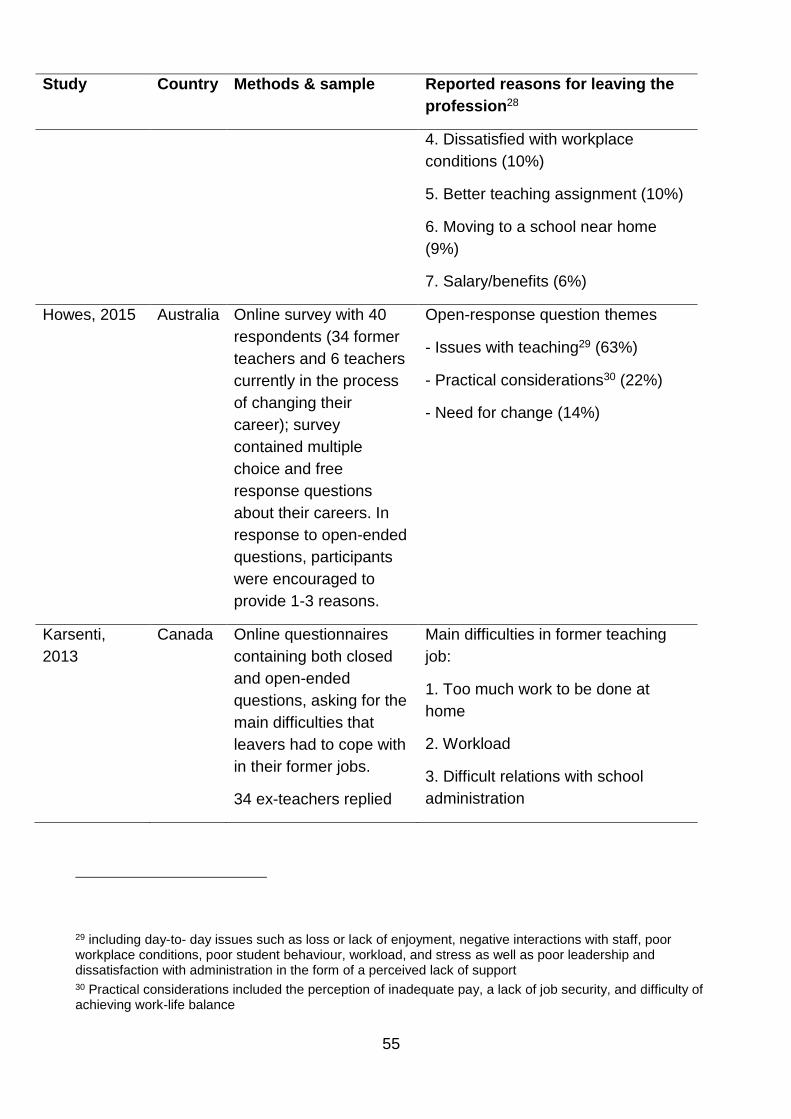
55
Study Country Methods & sample Reported reasons for leaving the
profession28
4. Dissatisfied with workplace
conditions (10%)
5. Better teaching assignment (10%)
6. Moving to a school near home
(9%)
7. Salary/benefits (6%)
Howes, 2015 Australia Online survey with 40
respondents (34 former
teachers and 6 teachers
currently in the process
of changing their
career); survey
contained multiple
choice and free
response questions
about their careers. In
response to open-ended
questions, participants
were encouraged to
provide 1-3 reasons.
Open-response question themes
- Issues with teaching29 (63%)
- Practical considerations30 (22%)
- Need for change (14%)
Karsenti,
2013
Canada
Online questionnaires
containing both closed
and open-ended
questions, asking for the
main difficulties that
leavers had to cope with
in their former jobs.
34 ex-teachers replied
Main difficulties in former teaching
job:
1. Too much work to be done at
home
2. Workload
3. Difficult relations with school
administration
29 including day-to- day issues such as loss or lack of enjoyment, negative interactions with staff, poor workplace conditions, poor student behaviour, workload, and stress as well as poor leadership and dissatisfaction with administration in the form of a perceived lack of support 30 Practical considerations included the perception of inadequate pay, a lack of job security, and difficulty of achieving work-life balance

56
Study Country Methods & sample Reported reasons for leaving the
profession28
(& 167 current teachers
who witnessed the
events surrounding the
teacher drop-outs)31
4. Problematic relations with
colleagues
Lindqvist &
Nordänger,
2016
Sweden;
Case study of 5 ex-
teachers who had been
part of a longitudinal
study that followed an
entire cohort of 87
teachers from their
graduation in 1993 and
through their following
22 years in working life,
up to the present
- Personal factors
- Identity formation
Mäkelä et al.,
2014
Finland Questionnaire sent by
post to PE teachers who
graduated between the
years 1980 and 2006
and moved out of PE
teaching. 230
respondents rated
prepared reasons for
leaving the teaching
profession according to
how much they
influenced their decision.
1. Need for a better use of abilities
(70%)
2. Routinization of work (36%)
3. Lack of promotion possibility (32%)
4. Workload (25%)
5. Poor working conditions (23%),
lack of facilities (23%) or equipment
(20%)
6. Misbehaviour of pupils (21%)
7. Low salary (20%)
8. Lack of recognition (20%)
9. lack of respect from admin (18%)
10. poor status of the profession
(16%)
31 The 167 current teachers’ information are excluded in this note, as they were not self-reported by the former teachers (the additional participants were included in the study to compensate for lack of target participants)

57
Study Country Methods & sample Reported reasons for leaving the
profession28
Smithers and
Robinson,
2003
England Mixed methods study of
1,066 leavers. A three-
layered approach was
adopted with a schools
survey followed by a
leavers survey and
interviews. In addition, a
follow-up survey was
conducted in January
2003 of those who had
left in the spring and
summer of 2002.
In the survey of leavers,
ex-teachers rated 16
possible reasons on how
much they contributed to
their decision to leave
Survey findings
1. Workload was too heavy (45%),
2. Government initiatives (36%)
3. Stress (35%)
4. Wanted change (34%)
5. Personal circumstances (34%)
6. Wanted new challenge (28%)
7. Felt undervalued (27%)
8. Poor pupil behaviour (23%)
9. Attracted by another job (22%)
10. Way the school is run (20%)
11. Travel (18%)
12. Better career prospects (14%)
13. School salary too low (11%)
14. Poor resources/facilities (9%)
15. Offered higher salary (7%)
16. Difficult parents (4%)
Struyven &
Vanthournout,
2014
Belgium Following telephone
contact, an online/postal
questionnaire survey
asking for reasons for
leaving was
administered to 235
teaching graduates who
did not teach five years
after graduation (81 of
them left after gaining
their degree and before
working as a teacher, so
had limited teaching
experience gained
1. Future prospect
2. Workload
3. Job satisfaction/ relations with
pupils
4. School management and support
5. Relations with parents/carers

58
Study Country Methods & sample Reported reasons for leaving the
profession28
during their three years
of study)
Tye &
O’Brien, 2002
USA Postal survey with
responses from 114
current and former
teachers who graduated
from a university in
California over a five-
year period.
Respondents question
that asked respondents
rank-order a list of
reasons why they had
already left the teaching
profession or would
consider leaving.
REASON FOR LEAVING
1. accountability
2. increased paperwork
3. student attitudes
4. no parent support
5. unresponsive administration
6. low status of the profession
7. salary considerations
REASON FOR CONSIDERING
LEAVING
1. salary considerations
2. increased paperwork
3. accountability
4. low status of the profession
5. unresponsive administration
6. student attitudes
7. no parent support
Annotations: 1 There is no ranking of reasons provided for this study, because the
authors did not specifically ask for reasons for leaving in their survey, but only found
significant correlations between leaving / early retirement and the self-reported factors on
the right-hand side

59
© Crown copyright 2017
You may re-use this document/publication (not including logos) free of charge in any
format or medium, under the terms of the Open Government Licence v2.0. Where we
have identified any third party copyright information you will need to obtain permission
from the copyright holders concerned.
To view this licence:
visit www.nationalarchives.gov.uk/doc/open-government-licence/version/2
email [email protected]
About this publication:
enquiries [email protected]
download www.gov.uk/government/publications
Reference: [SFR 86/2017]
Follow us on Twitter: @educationgovuk
Like us on Facebook: facebook.com/educationgovuk