analysis of simulation resultsjain/cse567-08/ftp/k_25asr.pdf · analysis of simulation results raj...
TRANSCRIPT

25-1©2008 Raj JainCSE574sWashington University in St. Louis
Analysis of Analysis of Simulation ResultsSimulation Results
Raj Jain Washington UniversitySaint Louis, MO 63130
[email protected]/Video recordings of this lecture are available at:
http://www.cse.wustl.edu/~jain/cse574-08/
25-2©2008 Raj JainCSE574sWashington University in St. Louis
OverviewOverview
! Analysis of Simulation Results ! Model Verification Techniques ! Model Validation Techniques ! Transient Removal ! Terminating Simulations ! Stopping Criteria: Variance Estimation ! Variance Reduction

25-3©2008 Raj JainCSE574sWashington University in St. Louis
Model Verification vs. ValidationModel Verification vs. Validation
! Verification ⇒ Debugging! Validation ⇒ Model = Real world
! Four Possibilities:1. Unverified, Invalid2. Unverified, Valid3. Verified, Invalid4. Verified, Valid

25-4©2008 Raj JainCSE574sWashington University in St. Louis
Model Verification TechniquesModel Verification Techniques1. Top Down Modular Design2. Anti-bugging3. Structured Walk-Through4. Deterministic Models5. Run Simplified Cases6. Trace7. On-Line Graphic Displays8. Continuity Test9. Degeneracy Tests10. Consistency Tests11. Seed Independence

25-5©2008 Raj JainCSE574sWashington University in St. Louis
Top Down Modular DesignTop Down Modular Design! Divide and Conquer! Modules = Subroutines, Subprograms, Procedures
" Modules have well defined interfaces" Can be independently developed, debugged, and maintained
! Top-down design ⇒ Hierarchical structure ⇒ Modules and sub-modules

25-6©2008 Raj JainCSE574sWashington University in St. Louis
Top Down Modular Design (Cont)Top Down Modular Design (Cont)

25-7©2008 Raj JainCSE574sWashington University in St. Louis
Top Down Modular Design (Cont)Top Down Modular Design (Cont)

25-8©2008 Raj JainCSE574sWashington University in St. Louis
Verification TechniquesVerification Techniques! Anti-bugging: Include self-checks:
∑ Probabilities = 1Jobs left = Generated - Serviced
! Structured Walk-Through:" Explain the code another person or group" Works even if the person is sleeping
! Deterministic Models: Use constant values! Run Simplified Cases:
" Only one packet" Only one source" Only one intermediate node

25-9©2008 Raj JainCSE574sWashington University in St. Louis
TraceTrace! Trace = Time-ordered list of events and variables! Several levels of detail:
" Events trace" Procedure trace" Variables trace
! User selects the detail" Include on and off
! See Fig 25.3 in the Text Book on page 418 for a sample trace

25-10©2008 Raj JainCSE574sWashington University in St. Louis
OnOn--Line Graphic DisplaysLine Graphic Displays! Make simulation interesting! Help selling the results! More comprehensive than trace
25-11©2008 Raj JainCSE574sWashington University in St. Louis
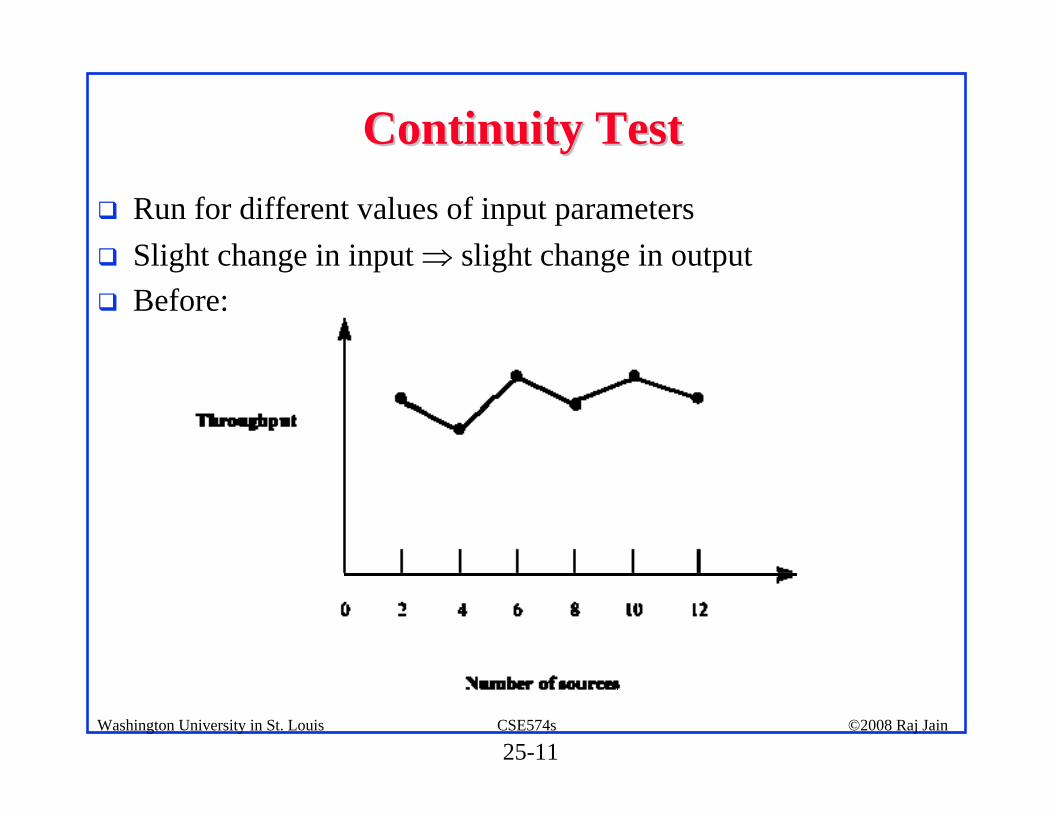
Continuity TestContinuity Test! Run for different values of input parameters! Slight change in input ⇒ slight change in output! Before:

25-12©2008 Raj JainCSE574sWashington University in St. Louis
Continuity Test (Cont)Continuity Test (Cont)! After:

25-13©2008 Raj JainCSE574sWashington University in St. Louis
More Verification TechniquesMore Verification Techniques! Degeneracy Tests: Try extreme configuration and workloads
! One CPU, Zero disk! Consistency Tests:
" Similar result for inputs that have same effect! Four users at 100 Mbps vs. Two at 200 Mbps
" Build a test library of continuity, degeneracy and consistency tests
! Seed Independence: Similar results for different seeds

25-14©2008 Raj JainCSE574sWashington University in St. Louis
Model Validation TechniquesModel Validation Techniques! Validation techniques for one problem may not apply to
another problem.! Aspects to Validate:
1. Assumptions2. Input parameter values and distributions3. Output values and conclusions
! Techniques:1. Expert intuition2. Real system measurements3. Theoretical results
⇒ 3 × 3 = 9 validation tests

25-15©2008 Raj JainCSE574sWashington University in St. Louis
Expert IntuitionExpert Intuition! Most practical and common way! Experts = Involved in design, architecture, implementation,
analysis, marketing, or maintenance of the system! Selection = fn of Life cycle stage ! Present assumption, input, output! Better to validate one at a time! See if the experts can distinguish simulation vs. measurement

25-16©2008 Raj JainCSE574sWashington University in St. Louis
Expert Intuition (Cont)Expert Intuition (Cont)

25-17©2008 Raj JainCSE574sWashington University in St. Louis
Real System MeasurementsReal System Measurements! Compare assumptions, input, output with the real world! Often infeasible or expensive! Even one or two measurements add to the validity

25-18©2008 Raj JainCSE574sWashington University in St. Louis
Theoretical ResultsTheoretical Results! Analysis = Simulation! Used to validate analysis also! Both may be invalid! Use theory in conjunction with experts' intuition
" E.g., Use theory for a large configuration" Can show that the model is not invalid

25-19©2008 Raj JainCSE574sWashington University in St. Louis
Transient RemovalTransient Removal! Generally steady state performance is interesting! Remove the initial part! No exact definition ⇒ Heuristics:
1. Long Runs2. Proper Initialization3. Truncation4. Initial Data Deletion5. Moving Average of Independent Replications6. Batch Means

25-20©2008 Raj JainCSE574sWashington University in St. Louis
Transient Removal TechniquesTransient Removal Techniques! Long Runs:
" Wastes resources" Difficult to insure that it is long enough
! Proper Initialization:" Start in a state close to expected steady state⇒ Reduces the length and effect of transient state
25-21©2008 Raj JainCSE574sWashington University in St. Louis
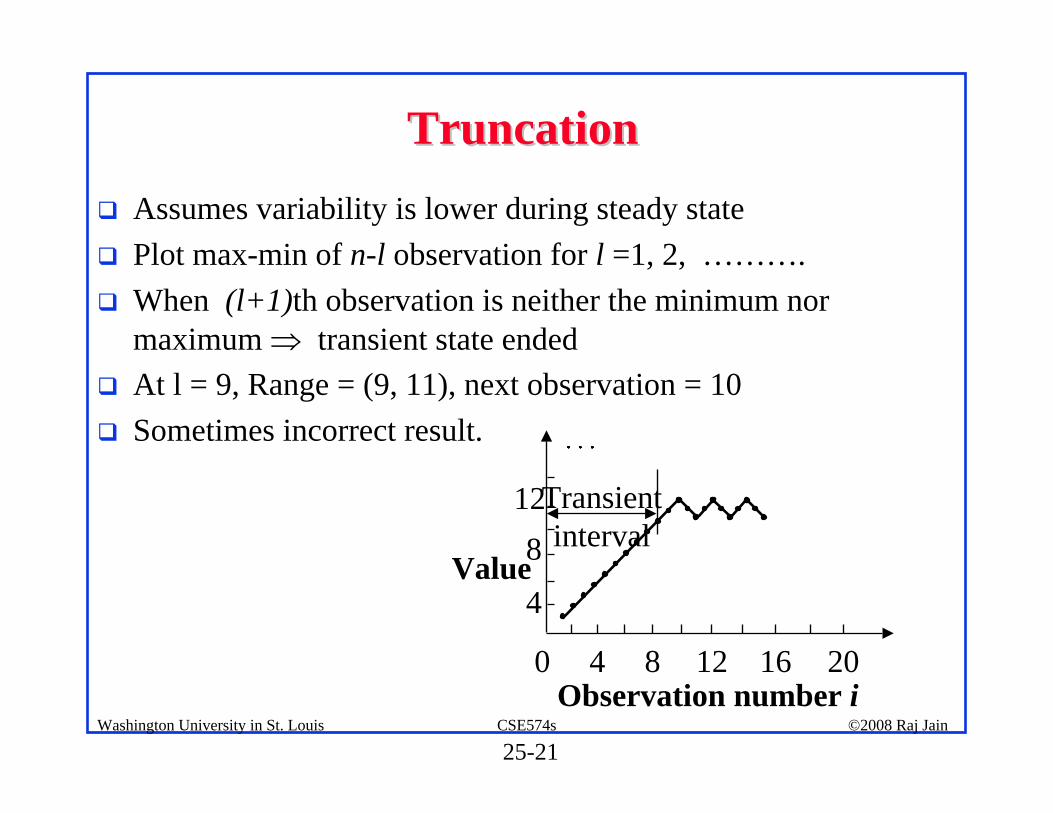
TruncationTruncation! Assumes variability is lower during steady state! Plot max-min of n-l observation for l =1, 2, ……….! When (l+1)th observation is neither the minimum nor
maximum ⇒ transient state ended! At l = 9, Range = (9, 11), next observation = 10 ! Sometimes incorrect result.
0 4 8 12 16 20
4
812
Value
Observation number i
Transientinterval

25-22©2008 Raj JainCSE574sWashington University in St. Louis
Initial Data DeletionInitial Data Deletion! Delete some initial observation! Compute average! No change ⇒ Steady state! Use several replications to smoothen the average! m replications of size n each
xij= jth observation in the ith replication

25-23©2008 Raj JainCSE574sWashington University in St. Louis
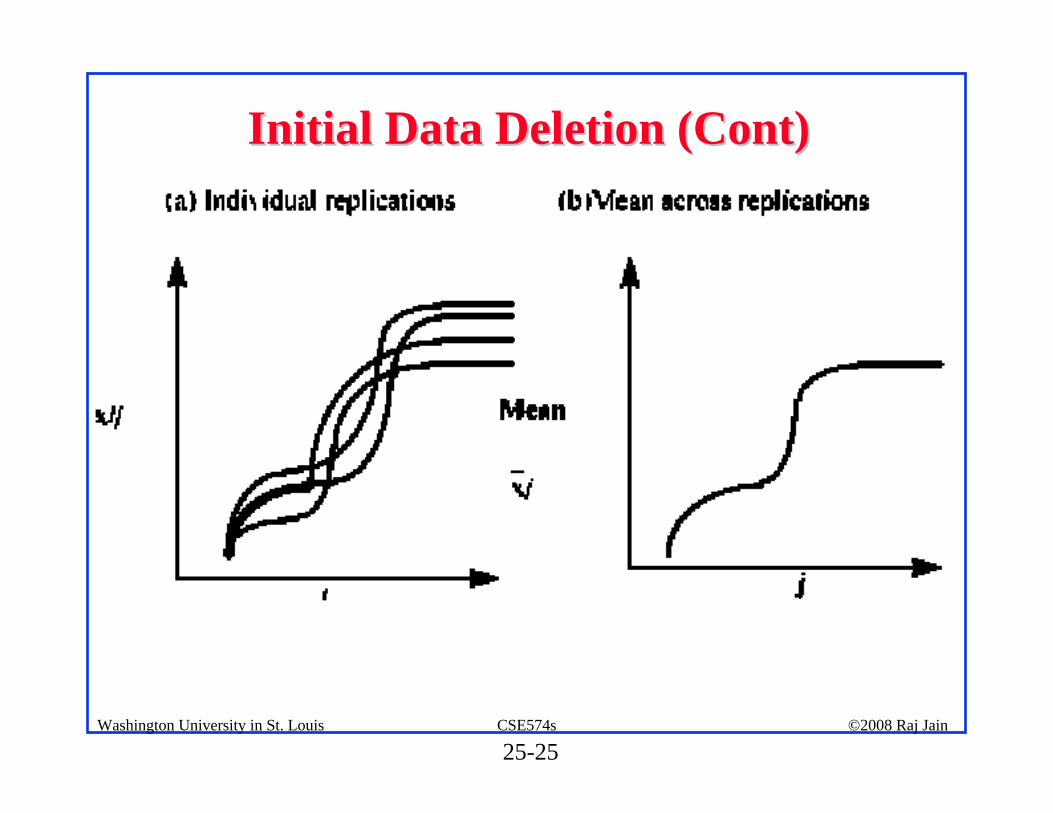
Initial Data Deletion (Cont)Initial Data Deletion (Cont)Steps:1. Get a mean trajectory by averaging across replications
2. Get the overall mean:
Set l=1 and proceed to the next step.

25-24©2008 Raj JainCSE574sWashington University in St. Louis
Initial Data Deletion (Cont)Initial Data Deletion (Cont)3. Delete the first l observations and get an overall mean from the
remaining n-l values:
4. Compute the relative change:
5. Repeat steps 3 and 4 by varying l from 1 to n-1. 6. Plot the overall mean and the relative change7. l at knee = length of the transient interval.
25-25©2008 Raj JainCSE574sWashington University in St. Louis
Initial Data Deletion (Cont)Initial Data Deletion (Cont)

25-26©2008 Raj JainCSE574sWashington University in St. Louis
Initial Data Deletion (Cont)Initial Data Deletion (Cont)

25-27©2008 Raj JainCSE574sWashington University in St. Louis
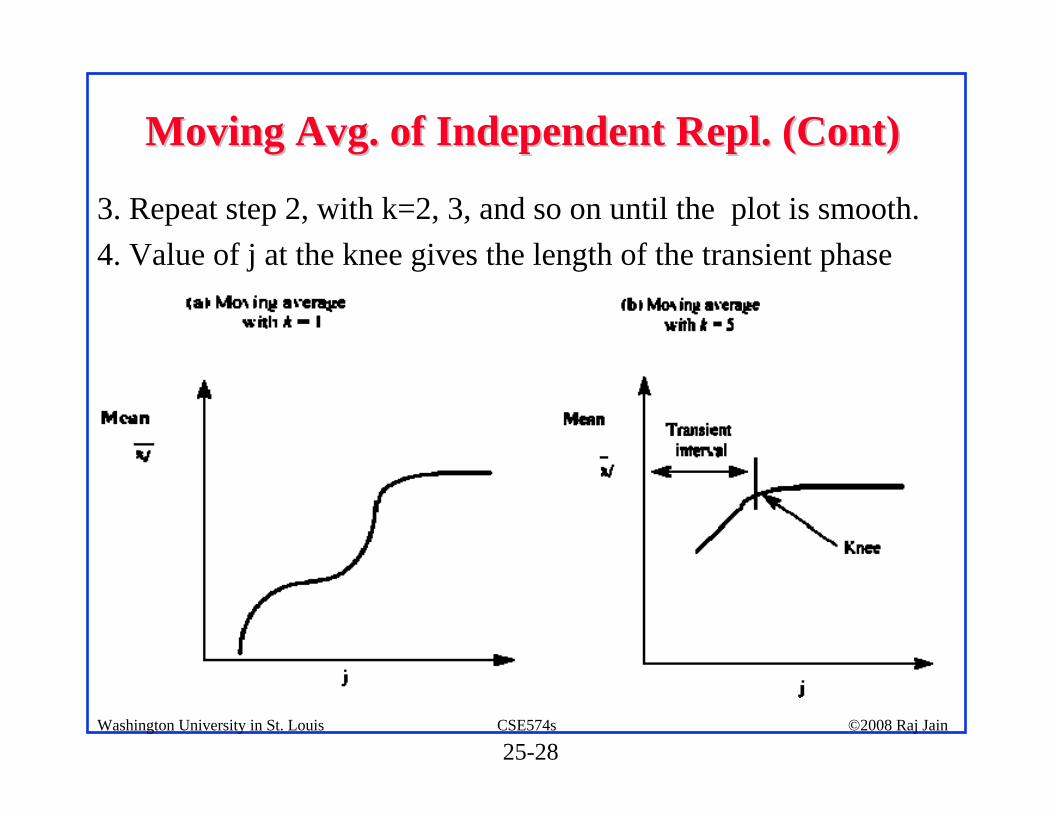
Moving Average of Independent ReplicationsMoving Average of Independent Replications
! Mean over a moving time interval window1. Get a mean trajectory by averaging across replications:
Set k = 1 and proceed to the next step.2. Plot a trajectory of the moving average of successive 2k+1
values:
25-28©2008 Raj JainCSE574sWashington University in St. Louis
Moving Avg. of Independent Repl. (Cont)Moving Avg. of Independent Repl. (Cont)
3. Repeat step 2, with k=2, 3, and so on until the plot is smooth.4. Value of j at the knee gives the length of the transient phase

25-29©2008 Raj JainCSE574sWashington University in St. Louis
Batch MeansBatch Means! Run a long simulation and divide into equal duration part! Part = Batch = Sub-sample! Study variance of batch means as a function of the batch size

25-30©2008 Raj JainCSE574sWashington University in St. Louis
Batch Means (cont)Batch Means (cont)Steps:1. For each batch, compute a batch mean:
2. Compute overall mean:
3. Compute the variance of the batch means:
4. Repeat steps 1 and 3, for n=3, 4, 5, and so on.

25-31©2008 Raj JainCSE574sWashington University in St. Louis
Batch Means (Cont)Batch Means (Cont)
5. Plot the variance as a function of batch size n.
6. Value of n at which the variance definitely starts decreasing
gives transient interval
7. Rationale:
-Batch size ¿ transient
⇒ overall mean = initial mean ⇒ Higher variance
-Batch size À transient
⇒ Overall mean = steady state mean ⇒ Lower variance

25-32©2008 Raj JainCSE574sWashington University in St. Louis
Batch Means (Cont)Batch Means (Cont)! Ignore peaks followed by an upswing

25-33©2008 Raj JainCSE574sWashington University in St. Louis
Terminating SimulationsTerminating Simulations! Transient performance is of interest
E.g., Network traffic ! System shuts down ⇒ Do not need transient removal. ! Final conditions:
" May need to exclude the final portion from results" Techniques similar to transient removal

25-34©2008 Raj JainCSE574sWashington University in St. Louis
Treatment of Leftover EntitiesTreatment of Leftover Entities! Mean service time
! Mean waiting time
! Mean Queue Length
25-35©2008 Raj JainCSE574sWashington University in St. Louis
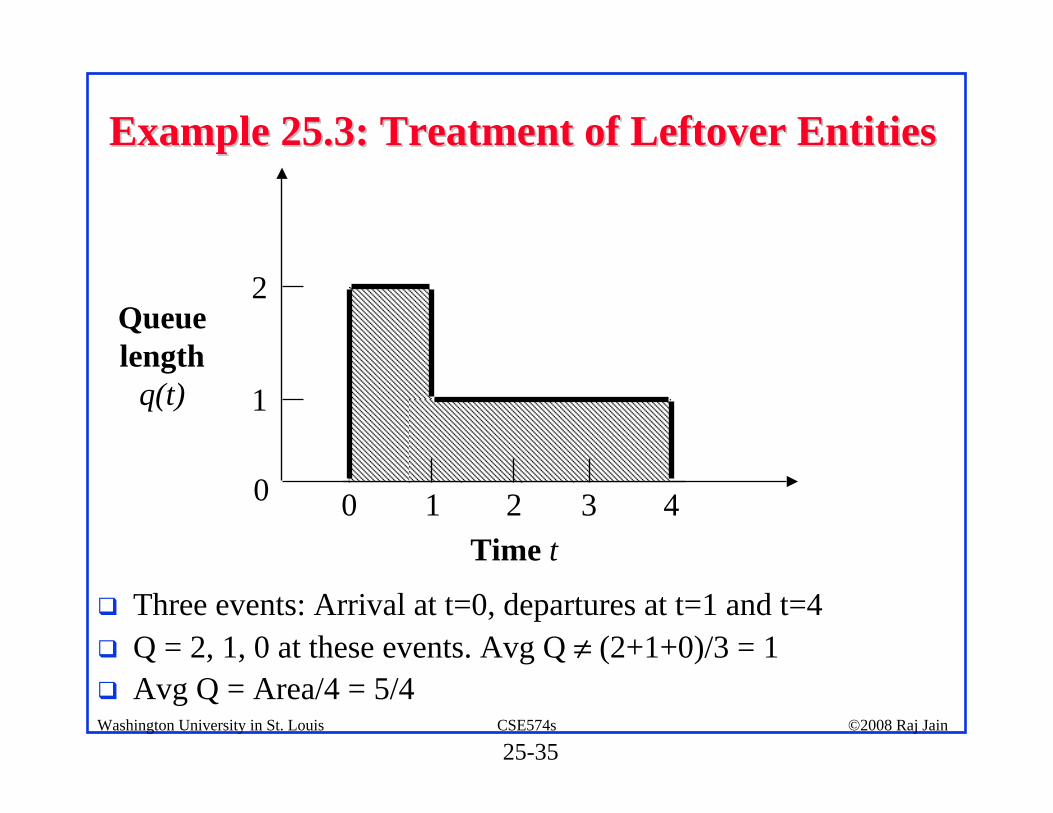
Example 25.3: Treatment of Leftover EntitiesExample 25.3: Treatment of Leftover Entities
! Three events: Arrival at t=0, departures at t=1 and t=4! Q = 2, 1, 0 at these events. Avg Q ≠ (2+1+0)/3 = 1! Avg Q = Area/4 = 5/4
0 1 2 3 4
2
1
0
Queuelength
q(t)
Time t

25-36©2008 Raj JainCSE574sWashington University in St. Louis
Stopping Criteria: Variance EstimationStopping Criteria: Variance Estimation! Run until confidence interval is narrow enough
! For Independent observations:
! Independence not applicable to most simulations.! Large waiting time for ith job ⇒ Large waiting time for (i+1)th job
! For correlated observations:

25-37©2008 Raj JainCSE574sWashington University in St. Louis
Variance Estimation MethodsVariance Estimation Methods1. Independent Replications2. Batch Means3. Method of Regeneration

25-38©2008 Raj JainCSE574sWashington University in St. Louis
Independent ReplicationsIndependent Replications! Assumes that means of independent replications are
independent! Conduct m replications of size n+n0 each
1. Compute a mean for each replication:
2. Compute an overall mean for all replications:

25-39©2008 Raj JainCSE574sWashington University in St. Louis
Independent Replications (Cont)Independent Replications (Cont)3. Calculate the variance of replicate means:
4. Confidence interval for the mean response is:
! Keep replications large to avoid waste! Ten replications generally sufficient

25-40©2008 Raj JainCSE574sWashington University in St. Louis
Batch MeansBatch Means! Also called method of sub-samples! Run a long simulation run! Discard initial transient interval, and Divide the remaining
observations run into several batches or sub-samples. 1. Compute means for each batch:
2. Compute an overall mean:

25-41©2008 Raj JainCSE574sWashington University in St. Louis
Batch Means (Cont)Batch Means (Cont)3. Calculate the variance of batch means:
4. Confidence interval for the mean response is:
! Less waste than independent replications! Keep batches long to avoid correlation! Check: Compute the auto-covariance of successive batch
means:
! Double n until autocovariance is small.

25-42©2008 Raj JainCSE574sWashington University in St. Louis
Case Study 25.1: Interconnection NetworksCase Study 25.1: Interconnection Networks
! Indirect binary n-cube networks: Used for processor-memory interconnection
! Two stage network with full fan out.! At 64, autocovariance
< 1% of sample variance
25-43©2008 Raj JainCSE574sWashington University in St. Louis
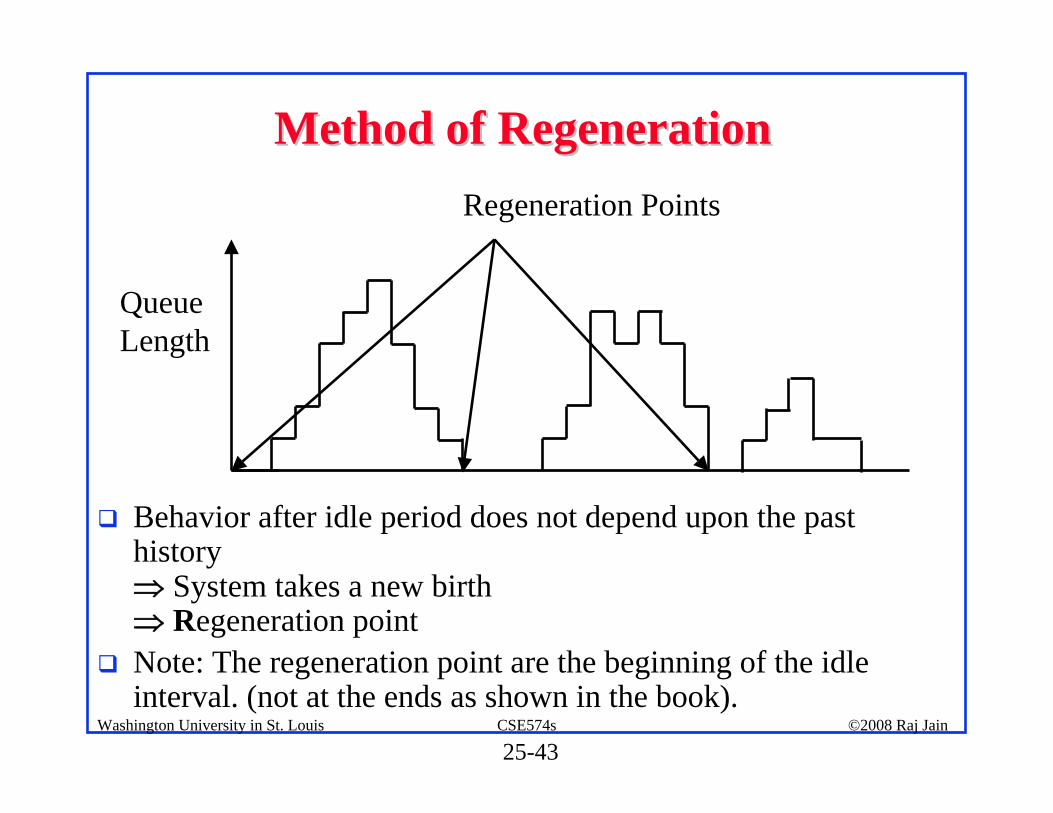
Method of Regeneration Method of Regeneration
! Behavior after idle period does not depend upon the past history ⇒ System takes a new birth⇒ Regeneration point
! Note: The regeneration point are the beginning of the idle interval. (not at the ends as shown in the book).
Regeneration Points
QueueLength
25-44©2008 Raj JainCSE574sWashington University in St. Louis
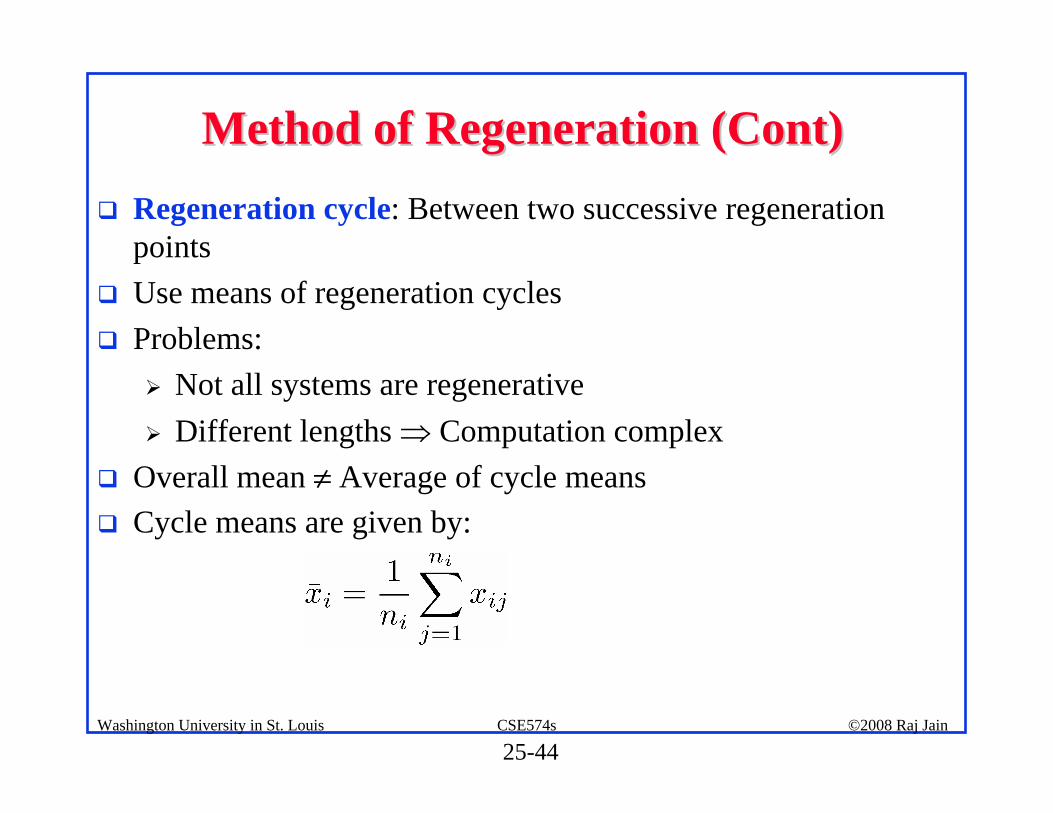
Method of Regeneration (Cont)Method of Regeneration (Cont)! Regeneration cycle: Between two successive regeneration
points! Use means of regeneration cycles! Problems:
" Not all systems are regenerative" Different lengths ⇒ Computation complex
! Overall mean ≠ Average of cycle means! Cycle means are given by:

25-45©2008 Raj JainCSE574sWashington University in St. Louis
Method of Regeneration (Cont)Method of Regeneration (Cont)
! Overall mean:
1. Compute cycle sums:
2. Compute overall mean:
3. Calculate the difference between expected and observed cycle sums:

25-46©2008 Raj JainCSE574sWashington University in St. Louis
Method of Regeneration (Cont)Method of Regeneration (Cont)4. Calculate the variance of the differences:
5. Compute mean cycle length:
6. Confidence interval for the mean response is given by:
7. No need to remove transient observations

25-47©2008 Raj JainCSE574sWashington University in St. Louis
Method of Regeneration: ProblemsMethod of Regeneration: Problems1. The cycle lengths are unpredictable. Can't plan the simulation
time beforehand.2. Finding the regeneration point may require a lot of checking
after every event.3. Many of the variance reduction techniques can not be used due
to variable length of the cycles. 4. The mean and variance estimators are biased

25-48©2008 Raj JainCSE574sWashington University in St. Louis
Variance ReductionVariance Reduction! Reduce variance by controlling random number streams! Introduce correlation in successive observations ! Problem: Careless use may backfire and lead to increased
variance. ! For statistically sophisticated analysts only! Not recommended for beginners
25-49©2008 Raj JainCSE574sWashington University in St. Louis
SummarySummary
1. Verification = Debugging ⇒ Software development techniques
2. Validation ⇒ Simulation = Real ⇒ Experts involvement3. Transient Removal: Initial data deletion, batch means4. Terminating Simulations = Transients are of interest 5. Stopping Criteria: Independent replications, batch means,
method of regeneration6. Variance reduction is not for novice

25-50©2008 Raj JainCSE574sWashington University in St. Louis
Exercise 25.1Exercise 25.1Imagine that you have been called as an expert to review a simulation study. Which of the following simulation results would you consider non-intuitive and would want it carefully validated:
1. The throughput of a system increases as its load increases.2. The throughput of a system decreases as its load increases.3. The response time increases as the load increases.4. The response time of a system decreases as its load increases.5. The loss rate of a system decreases as the load increases.

25-51©2008 Raj JainCSE574sWashington University in St. Louis
Exercise 25.2Exercise 25.2Find the duration of the transient interval for the following
sample: 11, 4, 2, 6, 5, 7, 10, 9, 10, 9, 10, 9, 10, …, Does themethod of truncation give the correct result in this case?

25-52©2008 Raj JainCSE574sWashington University in St. Louis
Homework 25Homework 25! The observed queue lengths at time t=0, 1, 2, …, 32 in a
simulation are: 0, 1, 2, 4, 5, 6, 7, 7, 5, 3, 3, 2, 1, 0, 0, 0, 1, 1, 3, 5, 4, 5, 4, 4, 2, 0, 0, 0, 1, 2, 3, 2, 0. A plot of this data is shown below. Apply method of regeneration to compute the confidence interval for the mean queue length.
0
2
4
6
8
0 5 10 15 20 25 30 35t
Q