analysis of statistics on child labour - · pdf file1 child labour in india: the promise and...
TRANSCRIPT
ANALYSIS OF STATISTICS RELATING TO CHILDLABOUR IN INDIA
ByHarsh Adithya PoddarRakhi Prasad Verma
Sharmistha RoyShradha Sancheti
Sudeshna Saha

1
CHILD LABOUR IN INDIA: THE PROMISE AND THE PRICE
“Bestow blessing on those little innocent lives bloomed on earth who have who have brought themessage of joy from heavenly garden”
-Rabindra Nath Tagore
Child labour is considered by the majority of researchers as a ‘necessary evil’ and economicasset for parents of poor families for parents of poor families’. Employment of children hascontinued to be a problem since the early days of industrialization. Child labour, says Homer Folk, is“any work by children that interferes with their full physical and mental developments. Theiropportunities for a desirable minimum of education or their needed recreation.” Child labour doesexist as an economic necessity and also as a social evil. Children working for a pittance of wageunder duress are deprived of love and care and remain under mental pressure. Circumstances thatcompel the children to work infringe on their basic rights. “Child labour is economically unsound,psychologically disastrous and physically as well as morally dangerous and harmful. It involves theuse of labour at its point of lowest productivity and is therefore an inefficient utilization of labourpower. Child labour precludes the full unfolding of a child’s protentialities.’ The WhitlecyCommission stated:1 in many cities large numbers of young boys are employed for long hours anddiscipline is strict. Indeed there is reason to believe that corporal punishment and other disciplinarymeasures of a reprehensible kind are sometimes resorted to in the case of small children. Workers asyoung as five years age may be found in some of these place working without adequate mealintervals or weekly rest days and 10 to 12 hours daily for sums as low as two annas. The commissionrecommended legislation to fix minimum age for employment at a higher level than that obtaining inmany industries. In the following years the minimum age for employment of children was fixed at12 years under the Factories Act and 15 years under the Mines Act. The Labour InvestigationCommittee, 1946,2 found that the legislative measures relating to child employment met with littlesuccess in ameliorating conditions of child labour.4 In later years the situations regarding childlabour comparatively cased in factories and industries, but it persisted to give anxiety in theorganization small industries. The Labour Bureau’s in 1940 showed that in small industries andcottage industries such as match manufacture, cashewanut processing, bidi making and carpetweaving employment on under-age children either uncertified or having false age certificatescontinued.5
Most countries have laws against child labour. Yet perhaps 100million or more children inthe world below the age of 15 participate in substantial economic activity at some point during theyear. The United Nation’s Internationals Children’s Education Fund (UNCIEF) calculates that in1991, 80 milion children between ten and fourteen years old were engaged in work so arduous for somuch of the day that it interfered with their development.3
TABLE 1STATE/SEX-WISE ESTIMATED NUMBER OF CHILD LABOUR IN INDIA(1996)
State/Sex-wise Estimated Number of Child Labour in India(1996)
1 S. K. Singh, Bonded Labour and the Law (New Delhi: Deep and Deep Publications, 1994) p. 232 Ibid.3 Ibid.

2
States/UTs Male Female
Andhra Pradesh 1065572 792187
Arunachal Pradesh N.A. N.A.
Assam N.A. N.A.
Bihar 877787 283448
Chhatisgarh N.A. N.A.
Goa 301428 133613
Gujarat 129391 31211
Haryana 23402 34463
Himachal Pradesh N.A. N.A.
Jammu & Kashmir 636591 383211
Karnataka 26509 26352
Kerala 947181 653450
Madhya Pradesh 693824 589712
Maharashtra N.A. N.A.
Manipur N.A. N.A.
Meghalaya N.A. N.A.
Mizoram N.A. N.A.
Nagaland 399622 N.A.
Orissa 1718710 136290
Punjab 501924 8538
Rajasthan N.A. 245494
Sikkim 539754 604835
Tamil Nadu N.A. N.A.
Tripura 1271610 237708
Uttar Pradesh 458310 108883
Uttaranchal N.A. N.A.
Andaman & Nicobar Island N.A. N.A.
Chandigarh N.A. N.A.
Dadra & Nagar Haveli N.A. N.A.
Daman & Diu N.A. N.A.
3
Delhi N.A. N.A.
Lakshadweep N.A. N.A.
Pondicherry N.A. N.A.
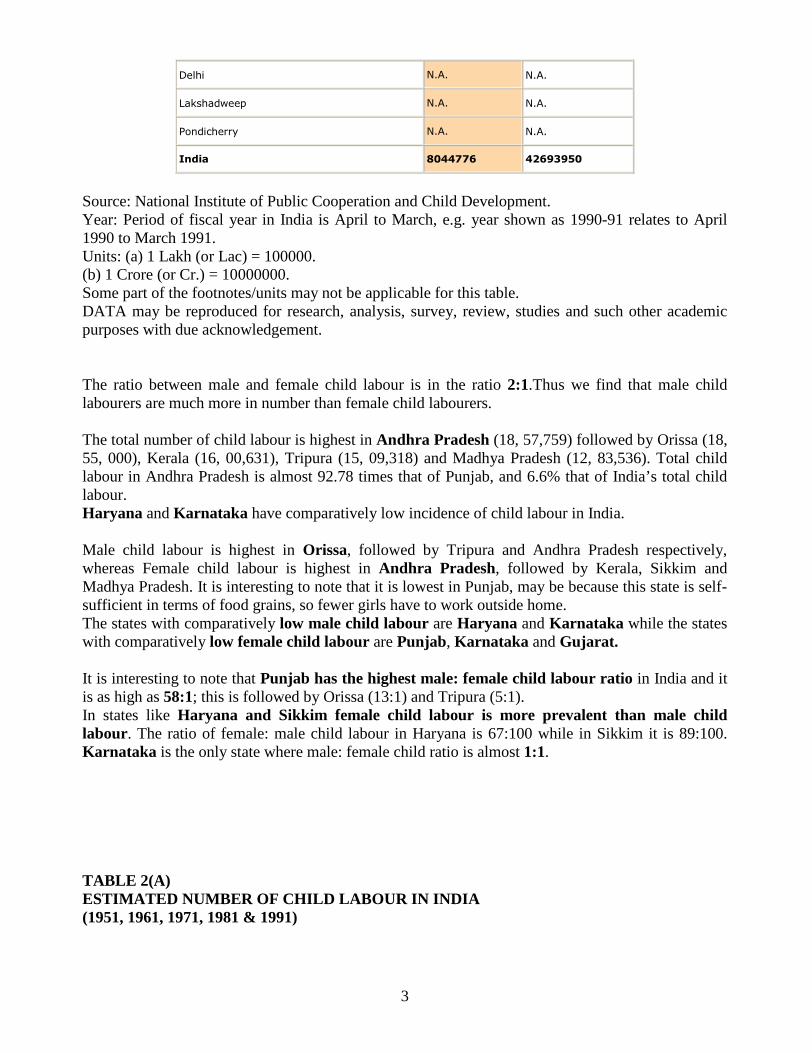
India 8044776 42693950
Source: National Institute of Public Cooperation and Child Development.Year: Period of fiscal year in India is April to March, e.g. year shown as 1990-91 relates to April1990 to March 1991.Units: (a) 1 Lakh (or Lac) = 100000.(b) 1 Crore (or Cr.) = 10000000.Some part of the footnotes/units may not be applicable for this table.DATA may be reproduced for research, analysis, survey, review, studies and such other academicpurposes with due acknowledgement.
The ratio between male and female child labour is in the ratio 2:1.Thus we find that male childlabourers are much more in number than female child labourers.
The total number of child labour is highest in Andhra Pradesh (18, 57,759) followed by Orissa (18,55, 000), Kerala (16, 00,631), Tripura (15, 09,318) and Madhya Pradesh (12, 83,536). Total childlabour in Andhra Pradesh is almost 92.78 times that of Punjab, and 6.6% that of India’s total childlabour.Haryana and Karnataka have comparatively low incidence of child labour in India.
Male child labour is highest in Orissa, followed by Tripura and Andhra Pradesh respectively,whereas Female child labour is highest in Andhra Pradesh, followed by Kerala, Sikkim andMadhya Pradesh. It is interesting to note that it is lowest in Punjab, may be because this state is self-sufficient in terms of food grains, so fewer girls have to work outside home.The states with comparatively low male child labour are Haryana and Karnataka while the stateswith comparatively low female child labour are Punjab, Karnataka and Gujarat.
It is interesting to note that Punjab has the highest male: female child labour ratio in India and itis as high as 58:1; this is followed by Orissa (13:1) and Tripura (5:1).In states like Haryana and Sikkim female child labour is more prevalent than male childlabour. The ratio of female: male child labour in Haryana is 67:100 while in Sikkim it is 89:100.Karnataka is the only state where male: female child ratio is almost 1:1.
TABLE 2(A)ESTIMATED NUMBER OF CHILD LABOUR IN INDIA(1951, 1961, 1971, 1981 & 1991)

4
Estimated Number of Child Labour in India(1951, 1961, 1971, 1981 & 1991)Full Time ChildWorkers 1951 1961 1971 1981 19911. Census data basedestimates (0-14 Yrs.) 13387144 14469775 10664018 11195544 12669909NSS data based estimates(5-14 Yrs.) 11339526 13777443 16330000 16166330 139502252. Non-workers & Non-students (5-14 Yrs.)Census data based estimates 49700129 64914609 89482123 89541313 97659410MHRD & NSS data basedestimates 52997224 41123492 64092259 77352410 575548333. Child Marginal workerscensus estimates 1981 &1991 NA NA NA 2445329 104988224. Estimates of total childworkersCensus data based estimates 13387144 14469775 10753985 13640873 23161013NSS data based estimates 11339526 13299910 16330000 18611659 24449047
Abbr.: NA : Not Available.Note: (i) : 1981 NSS Estimates of Full-time Child Workers is taken from 1983 Work
Participation Rates. (ii) : For 1991 NSS Estimates July to December, 1991 P. Work Participation
Rates from 47th Round have been used.(iii) : NSS based Child Workers estimates are calculated from NSS
Participation Rates. (iv) : 1971 NSS estimates of full time child workers is as given by NSS Table
for 1971-73. (v) : Full Time Child Workers Census data is approximated from MHRD data
& NSS estimates respectively.(vi) : 1951 NSS estimates of child workers are based on 1960-61 participation
rates because 8th Round Female child labour participation rates are high at 12.5% of the females for rural areas.
Causes of Child Labour in IndiaCormpelling circumstances and family mores and tradition cause child labour of varying characterand intensity. A high prevalence of child labour is linked to poverty and to poor quality oravailability of education. Children in poor families work because the family needs the extra income.Surveys in India indicate that poor households with no savings and assets and inability to borrowhave no choice but to send their children out to work. As parent’s income rise they are able to sendtheir children to school rather than to work. In Egypt 10 percent increase in mother’s wage wasfound result in a 15 percent decline in labour among children aged twelve to fourteen, and a 27percent decline among six to eleven year olds. In India the same in crease would lower girls labourforce participation by 9 to 10 percent. 4
4 Supra n. 48

5
Sometimes family tradition and profession induce children to work. The Children work andwhile working, slowly learn their traditional occupation and are socialized into their future. This isone of the ways of achieving upward social mobility in the family and social hierarchy.5
Vlaassoff maintains that household with lower standard of living expect to have greater needfor children’s contribution to generate extra income. The sensitivity to children’s maintenance cost ismore acute than perception of their utility. Child labour serves to strengthen the bonds betweenparents and child, it allows to release the energy in an environment where recreational facilities forchildren are almost non-existent. Casser says that the degree to which a child would contribute tohousehold income depends on its sex. In some societys marriage payments (dowry) could meanmajor drain on household income.6 Cross-sectional data of several countries established significantpositive correlation between the child labour participation and facility and proved that an economicstructure where child labour plays an important role is conducive to high fertility.7 Econometricanalysis based on data from Egypt, Chile, Thailand and Philippines indicate positive correlationbetween the child labour participation rate fertility. An interesting study made by Mead Cain in thevillage of Char Gopalpur of Bangladesh in 1976-77, reveals that male children become net producersat an early age and more than cancel the costs they incure by 15 years.8 Studies carried out inPhilippines by Bougier, Evenson and Lindert conclude that in as affluent setting children are neverassets.9 Lindert holds that the net costs 10 percents are always higher than the benefits.10
Notwithstanding the studies, it can not be conclusively proved that poor families need child labour tosurvive and child labour motivates high fertility in LDCs (less developed countries).
Brody and Bodner, in their study of the urban working class, have shown that childrenworked in a variety of settings to contribute to their families’ sustenance. 14 Grub and Hoganassumed that children’s employment precluded going to schools.15
Srikantan finds strong association between illiteracy and work participation. He finds threereasons for child work participation such as competing demand made on children’s time betweenschool attendance and work participation and income of the parents bearing the cost of schoolingand losing some income from the productive work of children.11
Jodha and Singh dealing with child labour in dry agricultural lands in India point out thatduring three or four months of the monsoon season, children play a key role in augmenting overallincome of the family without attending schools and in dry season they are engaged in animalgrazing, harvesting minor crops family consumption and consequently their schooling is severelyaffected and finally they dropout. Pati, in a micro-study of 125 sample child workers inBhubaneswar, points to the socio-economic aspects in relation to needs and aspiration and problemsof child labour and observes that parent’s attitude is very important in determining children’sattendance at school.12
The ILO has brought out a number of publications focusing on child labour. In onepublication edited by Mendelievich is observed that child labour persists in inverse relation to thedegree of economic development of a society and religion.13
In 1985, the United Nation’s seminar in Geneva recommended that states should review thelegislation in the field of child labour with a view to prohibiting employment of children before
5 Supra n. 366 Ibid.7 Ibid.8 Supra n. 429 Supra n. 4410 Supra n. 2211 Pradeep Mehta, "Cashing in on Child Labor," Multinational Monitor, April 1994 p. 34512 Ibid.13 Ibid.

6
normal age and completion of primary schooling and banning sexual exploitation of children, nightwork in dangerous or unhealthy conditions and work involving degrading and cruel treatment.14
The ILO study of 1963 observes that the greater the importance of agriculture and relatedactivities the greater is the use of child labor.15
The UNICEF, in 1966, period out that children are not only objects to be protected byappropriate social policies and developmental plans but also agents of future human resources whomust be carefully prepared so that they are ready to contribute one day to their country’sdevelopmental efforts.21
Another UNICEF study observes the obvious connection between well-being of children andthe social and economic development of their societies.16
A visual educational project sponsored by Family Planning Foundation and UNICEF bringout the glaring facts about child labor in India. According to the study, the major areas of concern fora social reformer on children should be in the field of poverty, illiteracy, school dropouts and socialbackwardness.17
The NCAER study conducted by Vijaygopalan, based on 500 children working in carpetindustry in Bhadati and Mirzapur belt of UP concludes, that a large family is the major cause ofchild labour (85% of the sample belong to large families and 50 percent to economically weakersections). The study suggests that along with legal steps, suitable welfare measures should beinitiated to ameliorate the economic conditions of the weaker sections of society.18 Child labour isbound to prevail until rural poverty is tackled, the study observes.
The operations Research Group (ORG) study reveals that 80 percent of the children work inrural sector and they work for seven hours or more without fixed working hours irrespective of jobs.It points out that the absence of leisure and recreation led to boredom among the working childrenleading the bad habits of smoking, drinking, gambling and addiction to drugs.19 Gupta prepared apedagogical course material on child labour for FES and AWDI giving all facts and figures on childlabour in India covering carpet industry, glass, bangles, match and firework industries in India.20
Singh and Pothen (1982) argue that millions of children live in the slums and they are unfortunatevictims of exploitation. They consider slums as the cancer of urban community. Children whomanage to survive often turn out to be social misfits and deviants.
However outrageous the presence of child labour might be to liberal sentiments, Indians willhave to live with the phenomenon as long as the lavel of the country’s economical developmentremains what it is now.”21
Sharma and Mitter (1990) study child labour in informal sector taking 110 households ofPatiala City. Their study shows that most of the children belong to landless families, most of thechildren work for 12 to 15 hours per day. The authors observe that child labour problem can hardlybe solved by prohibiting the employment of children unless the poor households are provided withbasic human needs.22
Singh, studying the socio-economic perspective of child labour in India and interviewing 309child workers and analyzing employer’s attitude to child labour, observes that the prevailing
14 Supra n. 3715 Supra n. 3516 Supra n. 6117 Ibid.18 Ibid.19 B.N. Juyal, Child Labour: The Twice Exploited (Varanasi: Gandhian Institute of Studies, 1985).20 Ibid.21 Ibid.22 Supra n. 54

7
unemployment conditions create a nature apprehensive about the further means of living among thepoor, and pleads for vocationalization of education for economic security.23
Tripathy studies the exploitations of children in tribal regions of India and observes that it isneither possible nor feasible to stop the menace altogether under the existing socio-economicconditions of India.24
Sinha (1991) studies the socio-economic geophysical conditions of Calcutta attractinginhabitants of surrounding districts, surveys 800 boy children working in various jobs in Calcuttacity and concludes that poverty is the major cause of child labour. About 91.25 percent of childrenleft their villages due poverty, 3.12 percent of children are abandoned.32
The study undertaken by Rath and Mahakud in western Orissan village comes to theconclusion that age and sex are the factors determining the nature of children’s engagement invarious mono-sexual and bisexual jobs rural India.25
Sengupta considers child labour as a complex social problem.26 Mohsini assets that poverty isthe breeding ground for child labour.27
The researchers and academicians in India abroad have produced excellent empirical andtheoretical studies on child labour. But most regrettably in India research findings have seldom beenutilized by those seeking to bring about legislative change and to improve the status of children inpoor families.
TABLE 2(B)INCREASE IN PERENTAGE OF THE NUMBER OF FULL TIME WORKERS[DERIVED FROM TABLE 2(A)]
% IncreaseFull Time Workers 1951-61 1961-71 1971-81 1981-91
Census Data based estimates(0-14yrs) 8.08 -26.3 4.98 13.17NSS Data based estimates(5-14yrs) 21.49 18.52 -1 -13.7Census Data based estimates(Non workers &non students 5-14yrs)
30.61 37.84 0.06 9.06
MHRD &NSS Data based estimates(Non workers &nonstudents 5-14yrs)
-22.4 55.85 20.68 -25
Census Data based estimates(total child workers) 8.09 -25.67 26.84 69.7NSS Data based estimates(total child workers) 17.29 22.78 13.97 23.87
According to the Census data based estimates (0-14yrs) number full time child workers increasedin 1951-61 by 8.08 % and in 1961-71 decreased by 26.3%.This may be due to increasing poverty,lack of proper planning and implementation on the part of government, But in the next census wenotice that it increases by 4.98 %.
23 Ibid.24 Ibid.25 Ibid.26 Ibid.27 Ibid.
8
Census data estimates of number of total child workers shows increased by 8.09% in 1951-61 andby 69.7% in 1981-91, nearly eight times. This shows how tremendously child labour has increased,indicating government’s inefficiency to tackle the problem of child labour.
Census data based estimates (Non workers &non students 5-14yrs) shows that it has increased by30.61% from 1951 to 1961; this may be the result of partition of India and Pakistan which caused alot of displacement leaving millions of the children homeless. It then increases by 7.23% from 1961-71, but then it starts decreasing and in 1961-71 and 1981-91 it has decreased to 0.06% and 9.06 %respectively.
NSS data based estimates (5-14yrs) shows a decreasing trend after 1961, from 1951 to 61, itincreased by 21% but then it went on decreasing and from 1981 to1991 it decreased by 13.7% .
NSS data based estimates of total child workers shows a mixed pattern, from 1951 to 61 it increasedby 17.29% , from 1961-71 by 22.78% but then it decreased by 13.97% from 1971-81 but againincreased by 22.87% from 1981 to1991.
Child marginal worker census estimates of 1981 to 1991 shows that the number of child labour hasincreased from by 8053493.The number of marginal child workers has increased drastically from 1981 to 1991 (By 3.29 times).
MHRD & NSS data based estimates of non workers & non students (5-14yrs) shows that itdecreased by 22.4% from 1951-61.but it increased tremendously from 1961-71 by 55.85%, therewas an increase of 25% from 1981to 1991.
According to the N.S.S. data there are 12, 80,316 more full time child workers in India than thecensus dataAccording to both the Census and the N.S.S data, the total number of child workers has increasedover the years since 1951 but their figures vary greatly. (N.S.S. figures are greater than the Censusfigures by 12, 88,034)
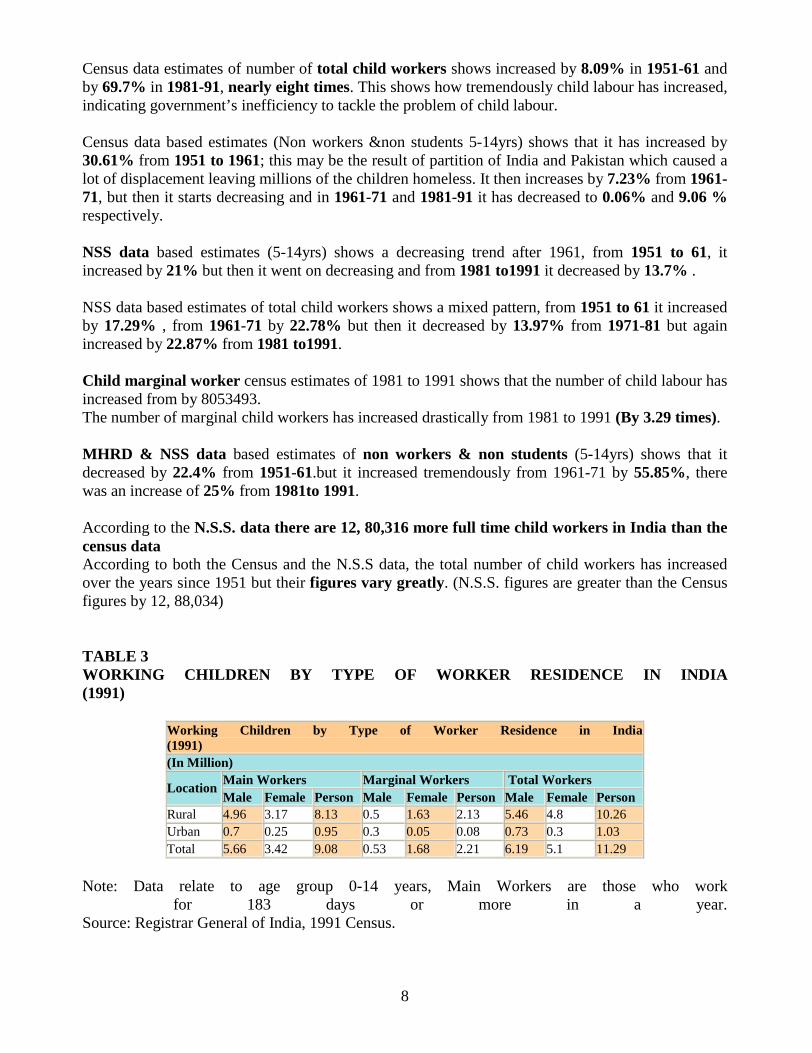
TABLE 3WORKING CHILDREN BY TYPE OF WORKER RESIDENCE IN INDIA(1991)
Working Children by Type of Worker Residence in India(1991)(In Million)
Main Workers Marginal Workers Total WorkersLocation
Male Female Person Male Female Person Male Female PersonRural 4.96 3.17 8.13 0.5 1.63 2.13 5.46 4.8 10.26Urban 0.7 0.25 0.95 0.3 0.05 0.08 0.73 0.3 1.03Total 5.66 3.42 9.08 0.53 1.68 2.21 6.19 5.1 11.29
Note: Data relate to age group 0-14 years, Main Workers are those who work for 183 days or more in a year.
Source: Registrar General of India, 1991 Census.

9
DATA may be reproduced for research, analysis, survey, review, studies and such other academicpurposes with due acknowledgement.
It was observed, from the above table, that nearly 83% of total main workers reside in ruralareas. The above table clearly indicates that 87.6% male child main workers & 92.7% of femalechild main workers belong to rural sectors.There are 2.13 million children working as a marginal worker, Out of 2.13 million, 23% were malechild & 77% were female child. The ratio between male and female marginal workers is 1: 3.There are more female in marginal sector, possibly, due to preference for male child labour in mainsector.But, after analyzing the total workers (main worker marginal) in rural areas, it was found that out of10.26 million child worker, 53% were male and 47% were female child, the ratio between both is1.14:1.
Similarly 88.2% & 94% of total male & female workers resides in rural sectors i.e. 91% of totalworkers in rural areas & only 9% of them belong to urban sector.The possible reason can be that India being an agricultural economy, 70% of population engagedwith agricultural jobs, though urban areas have more opportunity, but there is no job guarantee or jobstability. More over the child labourers in rural areas are so poor and illiterate that they can’t affordto go & adjust in urban set up.
After analyzing the given data it was found, in rural area there were 8.13 million people wereworking as main worker. Out of 8.13 million, 61% people are male and 39% are female. The ratiobetween male & female main worker is 1.56:1. So, the possible reason might be that female areengaged in household works or are not allowed to work outside.
It was found that, there were fewer children engaged as main workers than in rural areas. Out of 0.95million children, 73% were Male and 27% were female child. Ratio between main workers in ruralareas and main workers in urban areas is 8.56:1. Girls are not allowed to go for work in urbanareas.Same was the case with marginal workers also. 94.3% of total male marginal workers & 97% oftotal female marginal workers reside in rural sectors. In total, 96% of total Marginal workersreside in rural areas & only 4% in urban areas. Out of 0.08 million children engages in the urbanmarginal sector, 37% were male & 63% were females.
TABLE 4STATE-WISE PERCENTAGE OF CHILD LABOUR BY SEX IN INDIA (1961, 1971, 1981 & 1991)
State-wise Percentage of Child Labour by Sex in India(1961, 1971, 1981 & 1991)
1961 1971 1981 1991States
Male Female Male Female Male Female Male FemaleAndhra Pradesh 15.7 11.2 11.8 6.6 9.8 7.2 9.3 7.2Assam 7.8 6.4 6.0 0.1 - - - -Bihar 9.6 5.9 6.7 1.9 4.5 1.6 4.6 1.6Gujarat 7.3 6.6 6.2 2.6 4.7 2.2 4.6 2.2Haryana (9) (9) 5.0 0.6 4.0 1.1 4.0 1.1

10
Himachal Pradesh 12.1 18.1 4.3 5.8 2.9 4.3 3.0 4.6Jammu & Kashmir 1.7 6.3 6.1 0.9 6.8 1.9 - -Karnataka 11.9 8.2 9.3 3.7 8.3 4.9 8.1 5.1Kerala 2.2 1.9 1.4 1.2 0.8 0.8 0.8 0.8Madhya Pradesh 11.8 10.8 8.0 4.1 7.4 5.3 7.4 5.5Maharashtra 8.6 8.8 5.7 3.7 5.6 4.9 5.1 4.7Manipur 3.2 7.6 3.3 3.9 2.6 3.7 - -Meghalaya - - 8.0 5.8 8.0 5.8 - -Nagaland 13.9 16.6 6.1 8.0 4.5 5.8 - -Orissa 12.3 6.6 9.1 1.5 7.4 2.4 7.5 2.6Punjab 7.9 3.8 7.7 0.1 5.2 0.3 5.1 0.3Rajasthan 13.6 12.1 7.4 2.7 5.3 2.7 5.8 3.1Sikkim 23.1 25.4 19.5 19.3 5.3 7.4 - -Tamil Nadu 9.3 6.7 6.2 2.9 5.7 4.5 5.4 4.4Tripura 5.2 3.3 4.2 0.8 3.4 1.4 - -Uttar Pradesh 8.6 4.1 5.5 1.4 4.3 0.9 5.1 4.4West Bengal 5.0 1.2 4.7 0.7 4.0 0.9 3.9 1.0All India 9.4 6.6 6.6 2.6 5.5 2.8 2.9 1.6
Note: Percentage from total child population.Source: Census of India 1961, 1971, 1981 & 1991.DATA may be reproduced for research, analysis, survey, review, studies and such other academicpurposes with due acknowledgement.
The above table shows a decreasing trend in child labour in India. In the year 1961, 9.4% of thetotal male child population and 6.6% of total female child population was engaged in childlabour. This constituted 16% of the total child population. Over the years these figures havedecreased possibly because of the increased awareness, N.G.O’s initiatives and Government’sinteraction. According to the 1991 census, it was seen that only 4.5% of the total child populationwas engaged in child labour which was 2.9% of the total male child population and 1.6 of thetotal female child population.
From 1961 to 1971 the states where the total male child population engaged in child labourdecreased are Andhra Pradesh, Assam, Bihar, Gujarat, Harayana, Himachal Pradesh (it decreased bynearly 3 times), Karnataka, Madhya Pradesh, Maharashtra, Nagaland (nearly one-half), Orissa,Punjab, Rajasthan, Sikkim, Tamil Nadu, Tripura, Uttar Pradesh and West Bengal. In Nagaland, itdecreased by nearly 50 %. Manipur was the only state where we find that male child populationengaged in Child labour has increased in comparison to other states where it has decreased.
Similarly, from 1961 to 1971, we note that total female child population engaged in child labourdecreased .The states showing a decreasing trend are Andhra Pradesh, Assam (from 6.4 to 0.1),Bihar (from 5.9 to1.9), Gujarat, Hariyana (from 9 to0.6), Himachal Pradesh (it decreased by nearly 3times),Karnataka, Jammu & Kashmir (6.3 to0.9), Madhya Pradesh, Maharashtra, Nagaland (nearlyone half), Orissa, Punjab, Rajasthan, Sikkim, Tamil Nadu, Tripura, Uttar Pradesh and West Bengal.On comparing the data for the year 1971 and 1981, for total male child population engaged in childlabour, it was found that most of the states showed the same decreasing pattern. It was seen thatin Sikkim, child labour came down to 5.3 from 19.5. But in Jammu & Kashmir it increased from6.1 in 1971 to 6.8 in 1981. In Meghalaya it remained constant.
11
It is surprising to note that in many states total female child population engaged in child labourhad increased in the 1981 census as compared to 1971.These states are Andhra Pradesh,Hariyana, Jammu & Kashmir, Karnataka, Madhya Pradesh, Maharastra, Orissa, Tamil Nadu &Tripura. InMeghalaya it remained constant.On comparing the data for the year 1981 and 1991, for total male child population engaged in childlabour, it was found that in Bihar, Himachal Pradesh & Orissa it increased by 0.1 %. UttarPradesh and Rajasthan also showed an increasing trend, while West Bengal, Gujarat and Punjabregistered a decrease of 0.1%. Andhra Pradesh, Karnataka and Tamil Nadu also showed a decreasein the male child labour. It remained constant in the states of Hariyana, Kerala and Madhya Pradesh.
In case of the total female child population engaged in child labour, we find that from 1981 to 1991,it remained constant in the states of Kerala, Andhra Pradesh, Punjab, Bihar, Gujarat, Hariyana,Karnataka, Madhya Pradesh, Orissa, Rajasthan, West Bengal and Uttar Pradesh (by 3.5%) inparticular has registered an increase, while there was a reduction in the % of female child labourin the states of Maharastra and Tamil Nadu.
Currently, according to the available data, Andhra Pradesh has the highest % of female childlaborers in India. Since 1961 Sikkim has had the highest % of female child labourers followed byAndhra Pradesh in 1971 and H.P. in 1961 but 1991 figures for Sikkim are not available.
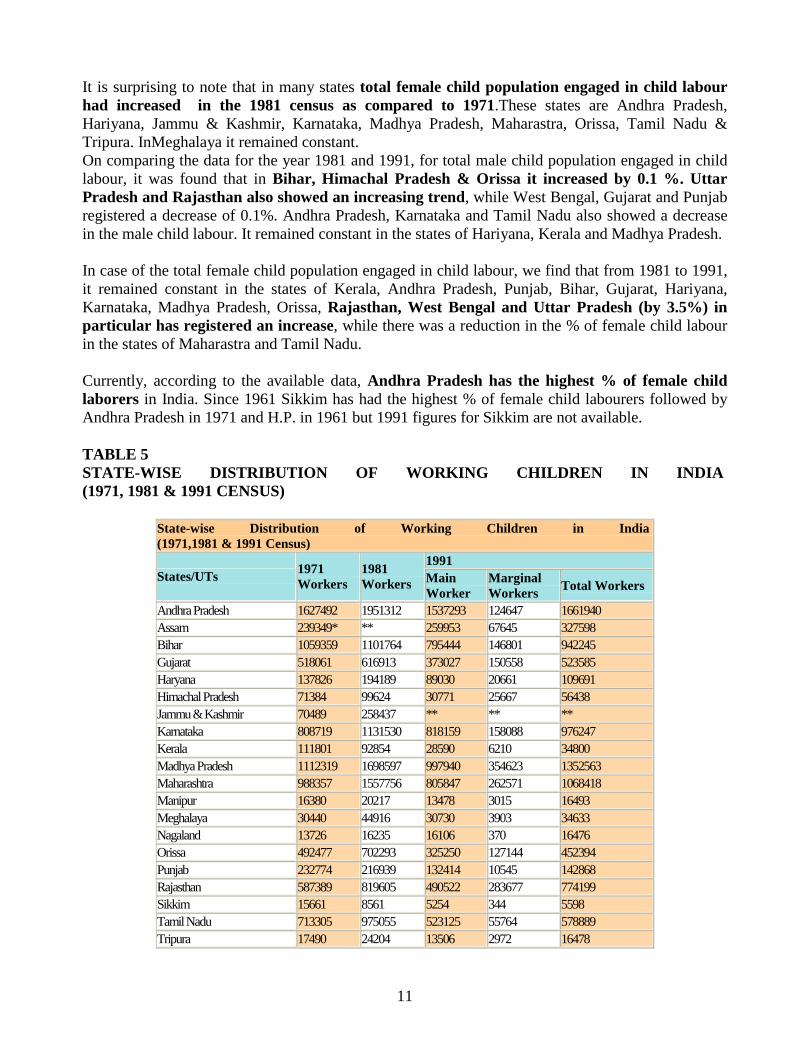
TABLE 5STATE-WISE DISTRIBUTION OF WORKING CHILDREN IN INDIA(1971, 1981 & 1991 CENSUS)
State-wise Distribution of Working Children in India(1971,1981 & 1991 Census)
1991States/UTs
1971Workers
1981Workers Main
WorkerMarginalWorkers
Total Workers
Andhra Pradesh 1627492 1951312 1537293 124647 1661940Assam 239349* ** 259953 67645 327598Bihar 1059359 1101764 795444 146801 942245Gujarat 518061 616913 373027 150558 523585Haryana 137826 194189 89030 20661 109691Himachal Pradesh 71384 99624 30771 25667 56438Jammu & Kashmir 70489 258437 ** ** **Karnataka 808719 1131530 818159 158088 976247Kerala 111801 92854 28590 6210 34800Madhya Pradesh 1112319 1698597 997940 354623 1352563Maharashtra 988357 1557756 805847 262571 1068418Manipur 16380 20217 13478 3015 16493Meghalaya 30440 44916 30730 3903 34633Nagaland 13726 16235 16106 370 16476Orissa 492477 702293 325250 127144 452394Punjab 232774 216939 132414 10545 142868Rajasthan 587389 819605 490522 283677 774199Sikkim 15661 8561 5254 344 5598Tamil Nadu 713305 975055 523125 55764 578889Tripura 17490 24204 13506 2972 16478
12
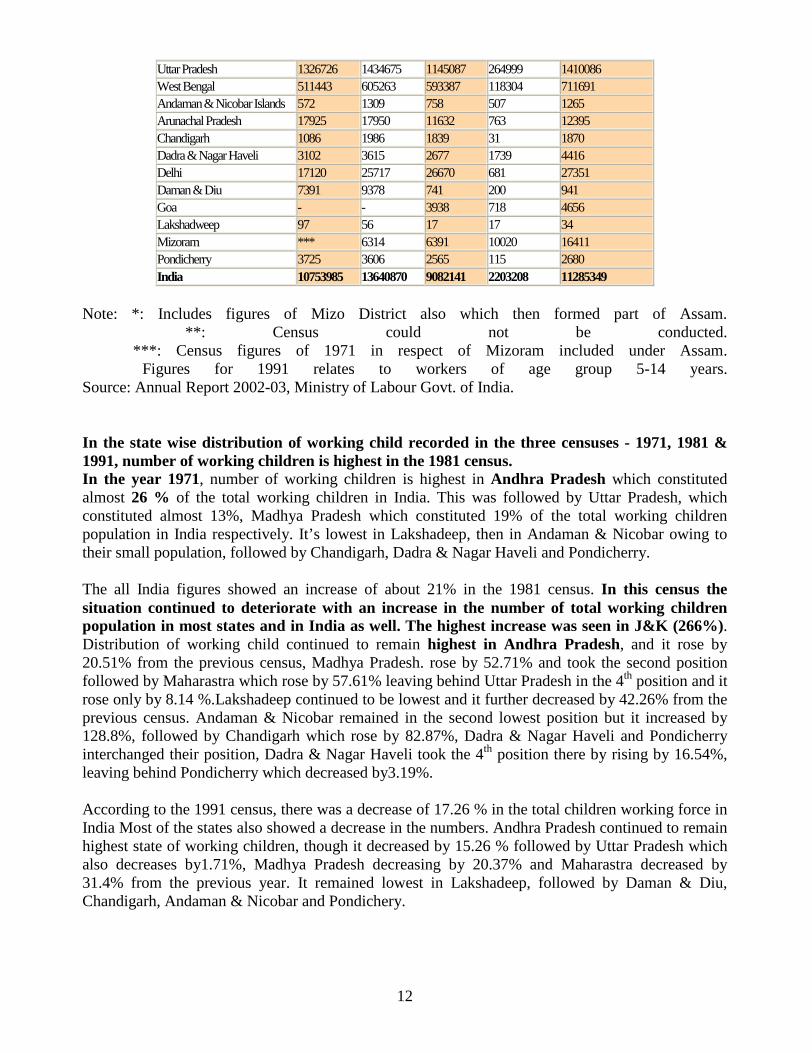
Uttar Pradesh 1326726 1434675 1145087 264999 1410086West Bengal 511443 605263 593387 118304 711691Andaman & Nicobar Islands 572 1309 758 507 1265Arunachal Pradesh 17925 17950 11632 763 12395Chandigarh 1086 1986 1839 31 1870Dadra & Nagar Haveli 3102 3615 2677 1739 4416Delhi 17120 25717 26670 681 27351Daman & Diu 7391 9378 741 200 941Goa - - 3938 718 4656Lakshadweep 97 56 17 17 34Mizoram *** 6314 6391 10020 16411Pondicherry 3725 3606 2565 115 2680India 10753985 13640870 9082141 2203208 11285349
Note: *: Includes figures of Mizo District also which then formed part of Assam. **: Census could not be conducted. ***: Census figures of 1971 in respect of Mizoram included under Assam. Figures for 1991 relates to workers of age group 5-14 years.
Source: Annual Report 2002-03, Ministry of Labour Govt. of India.
In the state wise distribution of working child recorded in the three censuses - 1971, 1981 &1991, number of working children is highest in the 1981 census.In the year 1971, number of working children is highest in Andhra Pradesh which constitutedalmost 26 % of the total working children in India. This was followed by Uttar Pradesh, whichconstituted almost 13%, Madhya Pradesh which constituted 19% of the total working childrenpopulation in India respectively. It’s lowest in Lakshadeep, then in Andaman & Nicobar owing totheir small population, followed by Chandigarh, Dadra & Nagar Haveli and Pondicherry.
The all India figures showed an increase of about 21% in the 1981 census. In this census thesituation continued to deteriorate with an increase in the number of total working childrenpopulation in most states and in India as well. The highest increase was seen in J&K (266%).Distribution of working child continued to remain highest in Andhra Pradesh, and it rose by20.51% from the previous census, Madhya Pradesh. rose by 52.71% and took the second positionfollowed by Maharastra which rose by 57.61% leaving behind Uttar Pradesh in the 4th position and itrose only by 8.14 %.Lakshadeep continued to be lowest and it further decreased by 42.26% from theprevious census. Andaman & Nicobar remained in the second lowest position but it increased by128.8%, followed by Chandigarh which rose by 82.87%, Dadra & Nagar Haveli and Pondicherryinterchanged their position, Dadra & Nagar Haveli took the 4th position there by rising by 16.54%,leaving behind Pondicherry which decreased by3.19%.
According to the 1991 census, there was a decrease of 17.26 % in the total children working force inIndia Most of the states also showed a decrease in the numbers. Andhra Pradesh continued to remainhighest state of working children, though it decreased by 15.26 % followed by Uttar Pradesh whichalso decreases by1.71%, Madhya Pradesh decreasing by 20.37% and Maharastra decreased by31.4% from the previous year. It remained lowest in Lakshadeep, followed by Daman & Diu,Chandigarh, Andaman & Nicobar and Pondichery.
13
West Bengal is the only state showing a steady rise since 1971.The figures show an increase ofabout 18% in 1981 and about 17% in 1991.
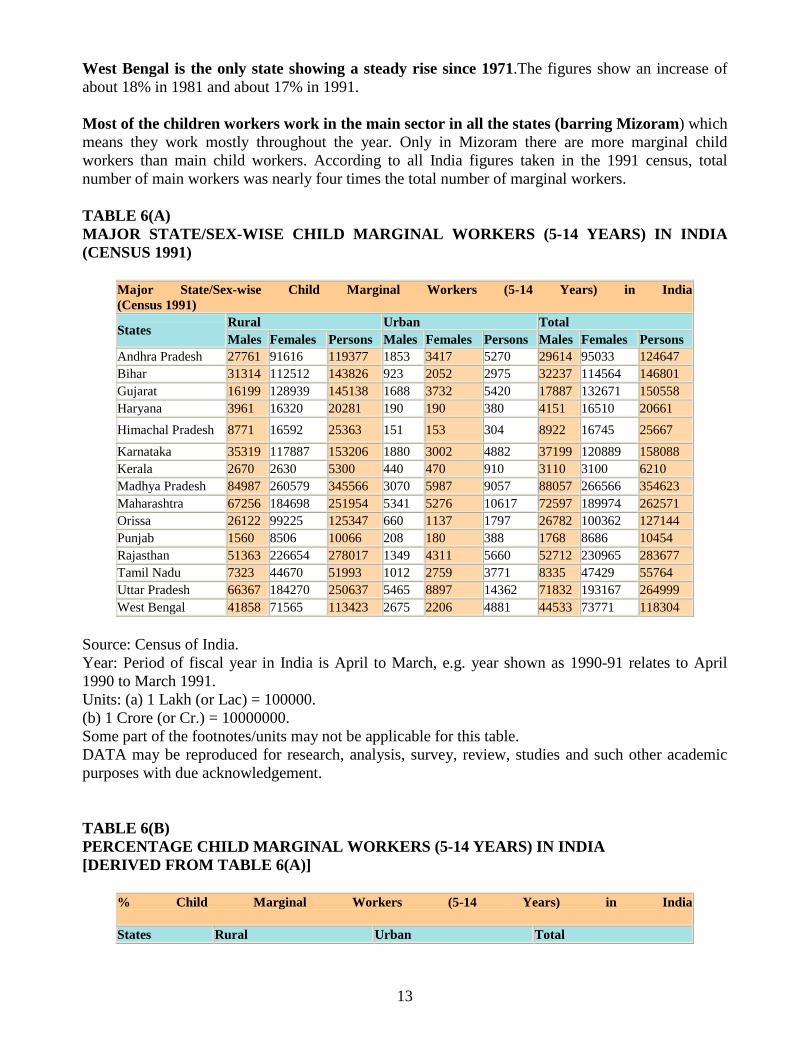
Most of the children workers work in the main sector in all the states (barring Mizoram) whichmeans they work mostly throughout the year. Only in Mizoram there are more marginal childworkers than main child workers. According to all India figures taken in the 1991 census, totalnumber of main workers was nearly four times the total number of marginal workers.
TABLE 6(A)MAJOR STATE/SEX-WISE CHILD MARGINAL WORKERS (5-14 YEARS) IN INDIA(CENSUS 1991)
Major State/Sex-wise Child Marginal Workers (5-14 Years) in India(Census 1991)
Rural Urban TotalStates
Males Females Persons Males Females Persons Males Females PersonsAndhra Pradesh 27761 91616 119377 1853 3417 5270 29614 95033 124647Bihar 31314 112512 143826 923 2052 2975 32237 114564 146801Gujarat 16199 128939 145138 1688 3732 5420 17887 132671 150558Haryana 3961 16320 20281 190 190 380 4151 16510 20661
Himachal Pradesh 8771 16592 25363 151 153 304 8922 16745 25667
Karnataka 35319 117887 153206 1880 3002 4882 37199 120889 158088Kerala 2670 2630 5300 440 470 910 3110 3100 6210Madhya Pradesh 84987 260579 345566 3070 5987 9057 88057 266566 354623Maharashtra 67256 184698 251954 5341 5276 10617 72597 189974 262571Orissa 26122 99225 125347 660 1137 1797 26782 100362 127144Punjab 1560 8506 10066 208 180 388 1768 8686 10454Rajasthan 51363 226654 278017 1349 4311 5660 52712 230965 283677Tamil Nadu 7323 44670 51993 1012 2759 3771 8335 47429 55764Uttar Pradesh 66367 184270 250637 5465 8897 14362 71832 193167 264999West Bengal 41858 71565 113423 2675 2206 4881 44533 73771 118304
Source: Census of India.Year: Period of fiscal year in India is April to March, e.g. year shown as 1990-91 relates to April1990 to March 1991.Units: (a) 1 Lakh (or Lac) = 100000.(b) 1 Crore (or Cr.) = 10000000.Some part of the footnotes/units may not be applicable for this table.DATA may be reproduced for research, analysis, survey, review, studies and such other academicpurposes with due acknowledgement.
TABLE 6(B)PERCENTAGE CHILD MARGINAL WORKERS (5-14 YEARS) IN INDIA[DERIVED FROM TABLE 6(A)]
% Child Marginal Workers (5-14 Years) in India
States Rural Urban Total
14
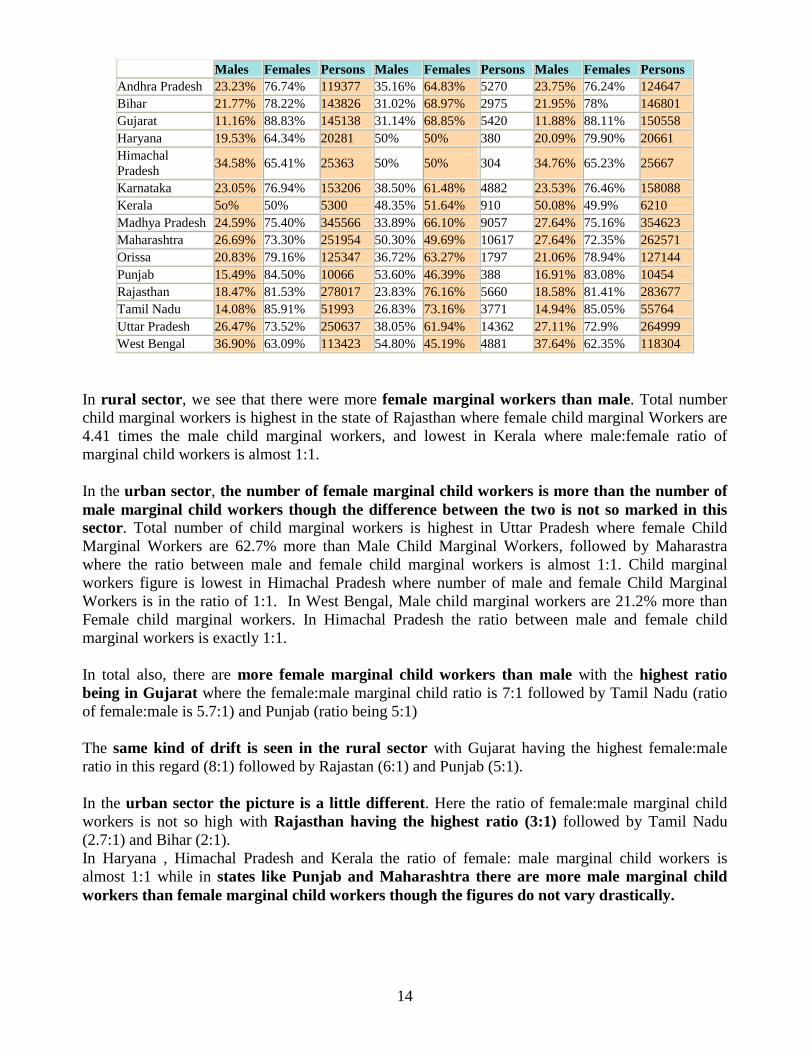
Males Females Persons Males Females Persons Males Females PersonsAndhra Pradesh 23.23% 76.74% 119377 35.16% 64.83% 5270 23.75% 76.24% 124647Bihar 21.77% 78.22% 143826 31.02% 68.97% 2975 21.95% 78% 146801Gujarat 11.16% 88.83% 145138 31.14% 68.85% 5420 11.88% 88.11% 150558Haryana 19.53% 64.34% 20281 50% 50% 380 20.09% 79.90% 20661HimachalPradesh
34.58% 65.41% 25363 50% 50% 304 34.76% 65.23% 25667
Karnataka 23.05% 76.94% 153206 38.50% 61.48% 4882 23.53% 76.46% 158088Kerala 5o% 50% 5300 48.35% 51.64% 910 50.08% 49.9% 6210Madhya Pradesh 24.59% 75.40% 345566 33.89% 66.10% 9057 27.64% 75.16% 354623Maharashtra 26.69% 73.30% 251954 50.30% 49.69% 10617 27.64% 72.35% 262571Orissa 20.83% 79.16% 125347 36.72% 63.27% 1797 21.06% 78.94% 127144Punjab 15.49% 84.50% 10066 53.60% 46.39% 388 16.91% 83.08% 10454Rajasthan 18.47% 81.53% 278017 23.83% 76.16% 5660 18.58% 81.41% 283677Tamil Nadu 14.08% 85.91% 51993 26.83% 73.16% 3771 14.94% 85.05% 55764Uttar Pradesh 26.47% 73.52% 250637 38.05% 61.94% 14362 27.11% 72.9% 264999West Bengal 36.90% 63.09% 113423 54.80% 45.19% 4881 37.64% 62.35% 118304
In rural sector, we see that there were more female marginal workers than male. Total numberchild marginal workers is highest in the state of Rajasthan where female child marginal Workers are4.41 times the male child marginal workers, and lowest in Kerala where male:female ratio ofmarginal child workers is almost 1:1.
In the urban sector, the number of female marginal child workers is more than the number ofmale marginal child workers though the difference between the two is not so marked in thissector. Total number of child marginal workers is highest in Uttar Pradesh where female ChildMarginal Workers are 62.7% more than Male Child Marginal Workers, followed by Maharastrawhere the ratio between male and female child marginal workers is almost 1:1. Child marginalworkers figure is lowest in Himachal Pradesh where number of male and female Child MarginalWorkers is in the ratio of 1:1. In West Bengal, Male child marginal workers are 21.2% more thanFemale child marginal workers. In Himachal Pradesh the ratio between male and female childmarginal workers is exactly 1:1.
In total also, there are more female marginal child workers than male with the highest ratiobeing in Gujarat where the female:male marginal child ratio is 7:1 followed by Tamil Nadu (ratioof female:male is 5.7:1) and Punjab (ratio being 5:1)
The same kind of drift is seen in the rural sector with Gujarat having the highest female:maleratio in this regard (8:1) followed by Rajastan (6:1) and Punjab (5:1).
In the urban sector the picture is a little different. Here the ratio of female:male marginal childworkers is not so high with Rajasthan having the highest ratio (3:1) followed by Tamil Nadu(2.7:1) and Bihar (2:1).In Haryana , Himachal Pradesh and Kerala the ratio of female: male marginal child workers isalmost 1:1 while in states like Punjab and Maharashtra there are more male marginal childworkers than female marginal child workers though the figures do not vary drastically.
15
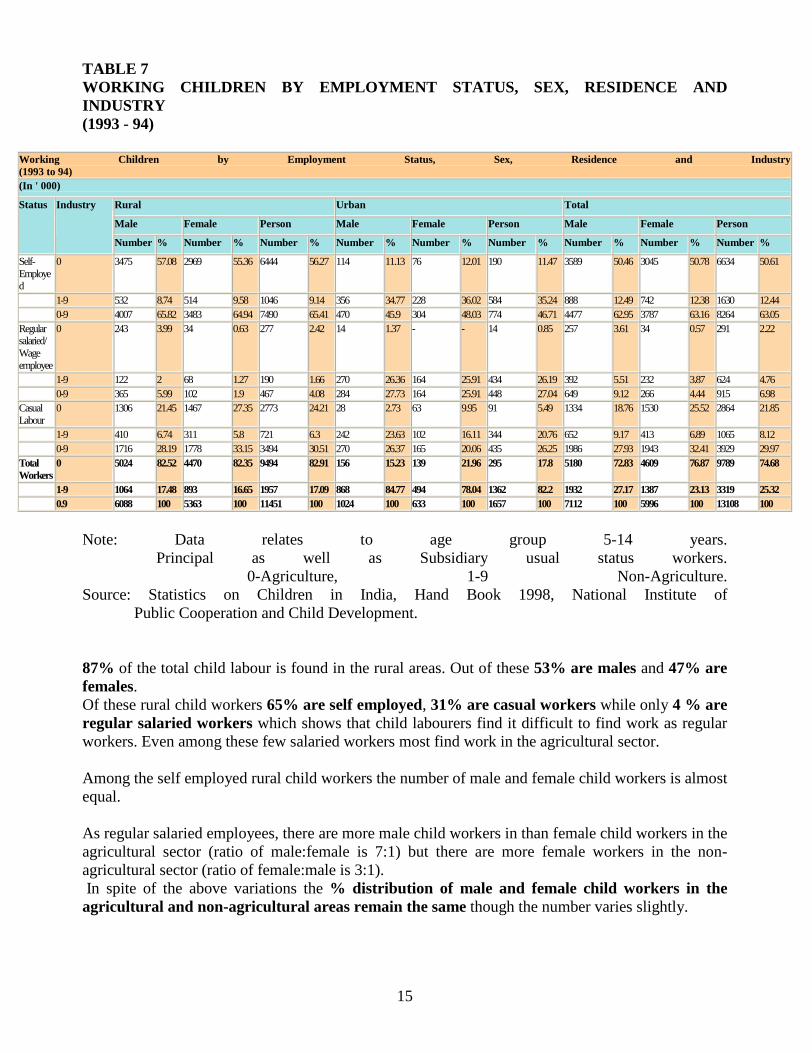
TABLE 7WORKING CHILDREN BY EMPLOYMENT STATUS, SEX, RESIDENCE ANDINDUSTRY(1993 - 94)
Working Children by Employment Status, Sex, Residence and Industry(1993 to 94)(In ' 000)
Rural Urban Total
Male Female Person Male Female Person Male Female Person
Status Industry
Number % Number % Number % Number % Number % Number % Number % Number % Number %
Self-Employed
0 3475 57.08 2969 55.36 6444 56.27 114 11.13 76 12.01 190 11.47 3589 50.46 3045 50.78 6634 50.61
1-9 532 8.74 514 9.58 1046 9.14 356 34.77 228 36.02 584 35.24 888 12.49 742 12.38 1630 12.440-9 4007 65.82 3483 64.94 7490 65.41 470 45.9 304 48.03 774 46.71 4477 62.95 3787 63.16 8264 63.05
Regularsalaried/Wageemployee
0 243 3.99 34 0.63 277 2.42 14 1.37 - - 14 0.85 257 3.61 34 0.57 291 2.22
1-9 122 2 68 1.27 190 1.66 270 26.36 164 25.91 434 26.19 392 5.51 232 3.87 624 4.760-9 365 5.99 102 1.9 467 4.08 284 27.73 164 25.91 448 27.04 649 9.12 266 4.44 915 6.98
CasualLabour
0 1306 21.45 1467 27.35 2773 24.21 28 2.73 63 9.95 91 5.49 1334 18.76 1530 25.52 2864 21.85
1-9 410 6.74 311 5.8 721 6.3 242 23.63 102 16.11 344 20.76 652 9.17 413 6.89 1065 8.120-9 1716 28.19 1778 33.15 3494 30.51 270 26.37 165 20.06 435 26.25 1986 27.93 1943 32.41 3929 29.97
TotalWorkers
0 5024 82.52 4470 82.35 9494 82.91 156 15.23 139 21.96 295 17.8 5180 72.83 4609 76.87 9789 74.68
1-9 1064 17.48 893 16.65 1957 17.09 868 84.77 494 78.04 1362 82.2 1932 27.17 1387 23.13 3319 25.320.9 6088 100 5363 100 11451 100 1024 100 633 100 1657 100 7112 100 5996 100 13108 100
Note: Data relates to age group 5-14 years. Principal as well as Subsidiary usual status workers. 0-Agriculture, 1-9 Non-Agriculture.
Source: Statistics on Children in India, Hand Book 1998, National Institute of Public Cooperation and Child Development.
87% of the total child labour is found in the rural areas. Out of these 53% are males and 47% arefemales.Of these rural child workers 65% are self employed, 31% are casual workers while only 4 % areregular salaried workers which shows that child labourers find it difficult to find work as regularworkers. Even among these few salaried workers most find work in the agricultural sector.
Among the self employed rural child workers the number of male and female child workers is almostequal.
As regular salaried employees, there are more male child workers in than female child workers in theagricultural sector (ratio of male:female is 7:1) but there are more female workers in the non-agricultural sector (ratio of female:male is 3:1). In spite of the above variations the % distribution of male and female child workers in theagricultural and non-agricultural areas remain the same though the number varies slightly.

16
Only 13% of the total child workers are employed in the urban areas. Out of these 62% aremales and 48% are females.Of these urban child workers 47% are self employed, 26% are casual workers while only 27 %are regular salaried workers showing that even in the urban sector most are self - employed.In the urban sector, in all the various divisions there are more male child workers than female childworkers showing that in all there is a predominance of male child workers in the urban section.There are 54% male and 46% female child workers in India.In total, we see than since most child workers are found in the rural areas, the general trend is alsosimilar to that of the rural areas. Thus, 63% of the total child workers are self-employed while30% are casual workers and the rest (7%) are regular salaried workers.In total, there are more female casual workers in the agricultural sector than males. This is theonly sector where we find more females than males.
TABLE 8(A)MAJOR STATE/SEX-WISE POPULATION, WORKERS AND PARTICIPATIONRATE OF CHILDREN (5-14 YEARS) IN RURAL AREAS OF INDIA(CENSUS 1991)
Major State/Sex-wise Population, Workers and ParticipationRate of Children (5-14 Years) in Rural Areas of India(Census 1991)
Child Population(5-14 yrs)
Child Workers(5-14 yrs)
Participation Rates(5-14 yrs)States
Males Females Persons Males Females Persons Males Females PersonsAndhraPradesh
6273802 5948525 12222327 689053 716469 1405522 10.98302114 12.04448162 11.49962687
Bihar 10963072 9622410 20585482 550281 201125 751406 5.019405145 2.090172836 3.650174429Gujarat 3437763 3179309 6617072 203672 119307 322979 5.924550354 3.752607878 4.880995703Haryana 1781647 1532705 3314352 60050 18003 78053 3.370476868 1.174590022 2.355000314HimachalPradesh
583296 563664 1146960 13113 16688 29801 2.248086735 2.960629027 2.598259748
Karnataka 3949839 3874901 7824740 387464 321543 709007 9.809615025 8.298095874 9.061093404Kerala 2263990 2225994 4489984 12560 9430 21990 0.554772768 0.423630971 0.489756756MadhyaPradesh
6740417 6244194 12984611 534732 405354 940086 7.933218375 6.491694525 7.24000126
Maharashtra 6098031 5736159 11834190 329540 381068 710608 5.404039435 6.64326076 6.004703321Orissa 3377217 3332862 6710079 206052 101882 307934 6.10123661 3.056892245 4.589126298Punjab 1762607 1557104 3319711 102636 8178 110814 5.822965641 0.525205767 3.338061657Rajasthan 4988679 4428950 9417629 247817 205011 452828 4.967587612 4.62888495 4.808301537Tamil Nadu 4113686 3926908 8040594 208875 215865 424740 5.077563042 5.497073015 5.282445551
Uttar Pradesh 16045346 13770695 29816041 782682 210672 993354 4.877937814 1.529857425 3.331609317
West Bengal 6680137 6432401 13112538 395695 127881 523576 5.92345636 1.988075681 3.992941717
Source: Census of India.Year: Period of fiscal year in India is April to March, e.g. year shown as 1990-91 relates to April1990 to March 1991.Units: (a) 1 Lakh (or Lac) = 100000.(b) 1 Crore (or Cr.) = 10000000.Some part of the footnotes/units may not be applicable for this table.

17
DATA may be reproduced for research, analysis, survey, review, studies and such other academicpurposes with due acknowledgement
TABLE 8(B)MAJOR STATE -WISE RATIO BETWEEN MALE AND FEMALE CHILDREN IN RURALAREAS[DERIVED FROM TABLE 8(A)]
Major State -wise Ratio Between Male (M) and Female (F) Children in Rural Areas
States Ratio between Total M andF Child Population
Ratio between Total M and F Child Workers
Andhra Pradesh 1.054682 0.961735Bihar 1.139327 2.736015Gujarat 1.081293 1.707125Haryana 1.16242 3.335555Himachal Pradesh 1.034829 0.785774Karnataka 1.019339 1.205015Kerala 1.017069 1.331919Madhya Pradesh 1.07947 1.319173Maharashtra 1.063086 0.86478Orissa 1.013308 2.022457Punjab 1.131978 12.55026Rajasthan 1.12638 1.208799Tamil Nadu 1.047564 0.967619Uttar Pradesh 1.165181 3.715169West Bengal 1.038514 3.094244
From the above table it was found that highest % of child labour in India is found in the state ofAndhra Pradesh where 11.5 % of the total population of children is child worker. This is followedby Karnataka which shows an incidence of 9% and Madhya Pradesh which shows an incidenceof 7%.The lowest incidence of child labour is found in Kerala with only 0.5% of the total child populationengaged in child labour followed by Haryana (2%) and Himachal Pradesh (2.6%).
Sex-wise, the state with the highest % of male child labourers is Andhra Pradesh again where 10%of the total male child population is child labour. This is followed by Karanataka where incidenceof child labour is 9.8% and Madhya Pradesh where it is 8%.The lowest is again in Kerala (0.5%) followed by Himachal Pradesh (2%) and Haryana (3%).
Sex-wise, the state with the highest % of female child labourers is Andhra Pradesh again where12% of the total female child population is child labour. This is followed by Karanataka whereincidence of child labour is 8.3% and Maharashtra where it is 7%.Kerala again shows the lowest % in this category with an incidence of 0.4% followed by Haryana(1%) and Punjab (0.5%).

18
According to the above table, the ratio between total male and female child population is highest inUttar Pradesh followed by Haryana, Bihar and Punjab. Ratio between total male and female childworkers is highest at Andhra Pradesh and lowest in Kerala.
TABLE 9(A)MAJOR STATE/SEX-WISE POPULATION, WORKERS AND PARTICIPATIONRATE OF CHILDREN IN URBAN AREAS OF INDIA(1993-94)
Major State/Sex-Wise Population, Workers and ParticipationRate of Children in Urban Areas Of India (1993-94)
Child Population(5-14 yrs)
Child Workers(5-14 yrs)
Participation Rates(5-14 yrs)States
Males Females Persons Males Females Persons Males Females PersonsAndhraPradesh
2263132 2170197 4433329 87835 43936 131771 3.881125803 2.024516668 2.972281101
Bihar 1583797 1416530 3000327 36560 7478 44038 2.308376642 0.527909751 1.467773346Gujarat 1738125 1597597 3335722 41448 8600 50048 2.384638619 0.538308472 1.500364839Haryana 530949 462922 993871 9346 1631 10977 1.760244393 0.352327174 1.104469292HimachalPradesh
49938 44785 94723 642 328 970 1.285594137 0.732388076 1.024038512
Karnataka 1652194 1606897 3259091 73978 35174 109152 4.477561352 2.188939304 5.761453117Kerala 760235 733707 1493942 3692 2908 6600 0.485639309 0.3963435 0.441784219MadhyaPradesh
1951703 1804333 3756036 40903 16951 57854 2.095759447 0.939460731 1.540294076
Maharashtra 3539568 3276307 6815875 69005 26234 95239 1.949531694 0.800718614 1.397311424Orissa 513304 481378 994682 12389 4927 17316 2.413579477 1.023519978 1.740857882Punjab 731559 651606 1383165 19502 2098 21600 2.665813694 0.321973708 1.561635814Rajasthan 1356455 1218237 2574692 28502 9192 37694 2.101212351 0.754532985 1.464019774Tamil Nadu 1998622 1940167 3938789 61974 36411 98385 3.100836476 1.87669412 2.497848958UttarPradesh
3792729 3412278 7205007 133068 18665 151733 3.508502717 0.546995292 2.105938273
West Bengal 2055049 1937936 3992985 47012 22799 69811 2.287634017 1.17645784 1.748341153
Source : Census of India.Year: Period of fiscal year in India is April to March, e.g. year shown as 1990-91 relates to April1990 to March 1991.Units: (a) 1 Lakh (or Lac) = 100000.(b) 1 Crore (or Cr.) = 10000000.Some part of the footnotes/units may not be applicable for this table.
TABLE 9(B)MAJOR STATE -WISE RATIO BETWEEN MALE AND FEMALE CHILDREN IN URBANAREAS[DERIVED FROM TABLE 9(A)]
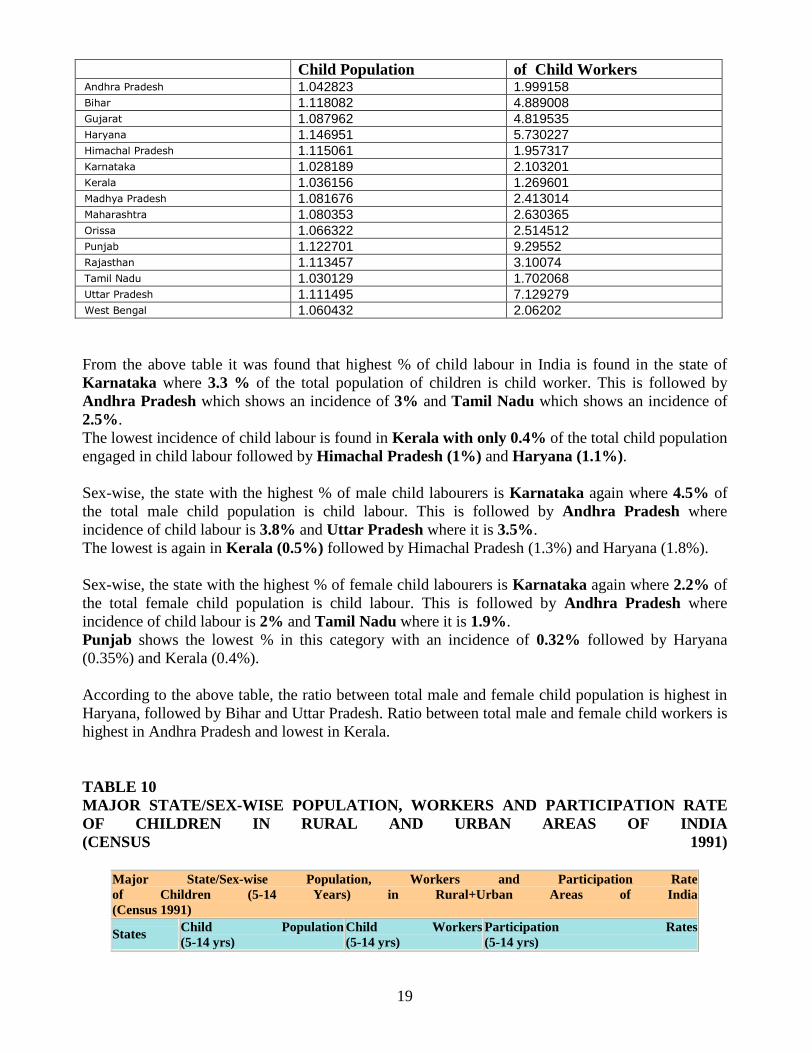
Major State/Sex-wise Ratio between Male(M) and Female (F)Child Population and ChildWorkers in Urban Areas of IndiaStates Ratio Between Total M and F Ratio Between Total M and F
19
Child Population of Child WorkersAndhra Pradesh 1.042823 1.999158Bihar 1.118082 4.889008Gujarat 1.087962 4.819535Haryana 1.146951 5.730227Himachal Pradesh 1.115061 1.957317Karnataka 1.028189 2.103201Kerala 1.036156 1.269601Madhya Pradesh 1.081676 2.413014Maharashtra 1.080353 2.630365Orissa 1.066322 2.514512Punjab 1.122701 9.29552Rajasthan 1.113457 3.10074Tamil Nadu 1.030129 1.702068Uttar Pradesh 1.111495 7.129279West Bengal 1.060432 2.06202
From the above table it was found that highest % of child labour in India is found in the state ofKarnataka where 3.3 % of the total population of children is child worker. This is followed byAndhra Pradesh which shows an incidence of 3% and Tamil Nadu which shows an incidence of2.5%.The lowest incidence of child labour is found in Kerala with only 0.4% of the total child populationengaged in child labour followed by Himachal Pradesh (1%) and Haryana (1.1%).
Sex-wise, the state with the highest % of male child labourers is Karnataka again where 4.5% ofthe total male child population is child labour. This is followed by Andhra Pradesh whereincidence of child labour is 3.8% and Uttar Pradesh where it is 3.5%.The lowest is again in Kerala (0.5%) followed by Himachal Pradesh (1.3%) and Haryana (1.8%).
Sex-wise, the state with the highest % of female child labourers is Karnataka again where 2.2% ofthe total female child population is child labour. This is followed by Andhra Pradesh whereincidence of child labour is 2% and Tamil Nadu where it is 1.9%.Punjab shows the lowest % in this category with an incidence of 0.32% followed by Haryana(0.35%) and Kerala (0.4%).
According to the above table, the ratio between total male and female child population is highest inHaryana, followed by Bihar and Uttar Pradesh. Ratio between total male and female child workers ishighest in Andhra Pradesh and lowest in Kerala.
TABLE 10MAJOR STATE/SEX-WISE POPULATION, WORKERS AND PARTICIPATION RATEOF CHILDREN IN RURAL AND URBAN AREAS OF INDIA(CENSUS 1991)
Major State/Sex-wise Population, Workers and Participation Rateof Children (5-14 Years) in Rural+Urban Areas of India(Census 1991)
States Child Population(5-14 yrs)
Child Workers(5-14 yrs)
Participation Rates(5-14 yrs)

20
Males Females Persons Males Females Persons Males Females PersonsAndhraPradesh
8536934 8118722 16655656 776888 760405 1537293 9.100316343 9.366067714 9.229855612
Bihar 12546869 11038940 23585809 586841 208603 795444 4.67719078 1.889701366 3.372553386Gujarat 5175888 4776906 9952794 245120 127907 373027 4.735805721 2.677611827 3.747962632Haryana 2312596 1995627 4308223 69396 19634 89030 3.000783535 0.983851191 2.06651327HimachalPradesh
633234 608449 1241683 13755 17016 30771 2.172182795 2.796618944 2.478168744
Karnataka 5602033 5481798 11083831 461442 356717 818159 8.237045373 6.507299247 7.381554266Kerala 3024225 2959701 5983926 16252 12338 28590 0.537393878 0.416866433 0.477779973MadhyaPradesh
8692120 8048527 16740647 575635 422305 997940 6.622492556 5.246984945 5.961179398
Maharashtra 9637599 9012466 18650065 398545 407302 805847 4.1353142 4.51931802 4.320880383Orissa 3890521 3814240 7704761 218441 106809 325250 5.614697877 2.800269516 4.221415823Punjab 2494166 2208710 4702876 122138 10276 132414 4.896947517 0.465248946 2.815596244Rajasthan 6345134 5647187 11992321 276319 214203 490522 4.354817408 3.79309203 4.090300785Tamil Nadu 6112308 5867075 11979383 270849 252276 523125 4.431206673 4.299859811 4.36687766UttarPradesh
19838075 17182973 37021048 915750 229337 1145087 4.616123288 1.334675903 3.093070191
WestBengal
8735186 8370337 17105523 442707 150680 593387 5.068088991 1.800166469 3.468978996
Source : Census of India.Year: Period of fiscal year in India is April to March, e.g. year shown as 1990-91 relates to April1990 to March 1991.Units: (a) 1 Lakh (or Lac) = 100000.(b) 1 Crore (or Cr.) = 10000000.Some part of the footnotes/units may not be applicable for this table.
TABLE 10(B)MAJOR STATE -WISE RATIO BETWEEN MALE AND FEMALE CHILDREN IN RURALAND URBAN AREAS[DERIVED FROM TABLE 10(A)]
Major State/Sex-wise Ratio between Male(M) and Female (F)Child Population and ChildWorkers in Rural +Urban Areas of IndiaStates Ratio Between Total M and F
Child PopoulationRatio Between Total M and FChild Workers
Andhra Pradesh 1.051512 1.021677Bihar 1.136601 2.813195Gujarat 1.083523 1.916392Haryana 1.158832 3.534481Himachal Pradesh 1.040735 0.808357Karnataka 1.021933 1.29358Kerala 1.021801 1.317231Madhya Pradesh 1.079964 1.363079Maharashtra 1.069363 0.9785Orissa 1.019999 2.045155Punjab 1.129241 11.88575Rajasthan 1.123592 1.289987Tamil Nadu 1.041798 1.073622Uttar Pradesh 1.154519 3.993032
21
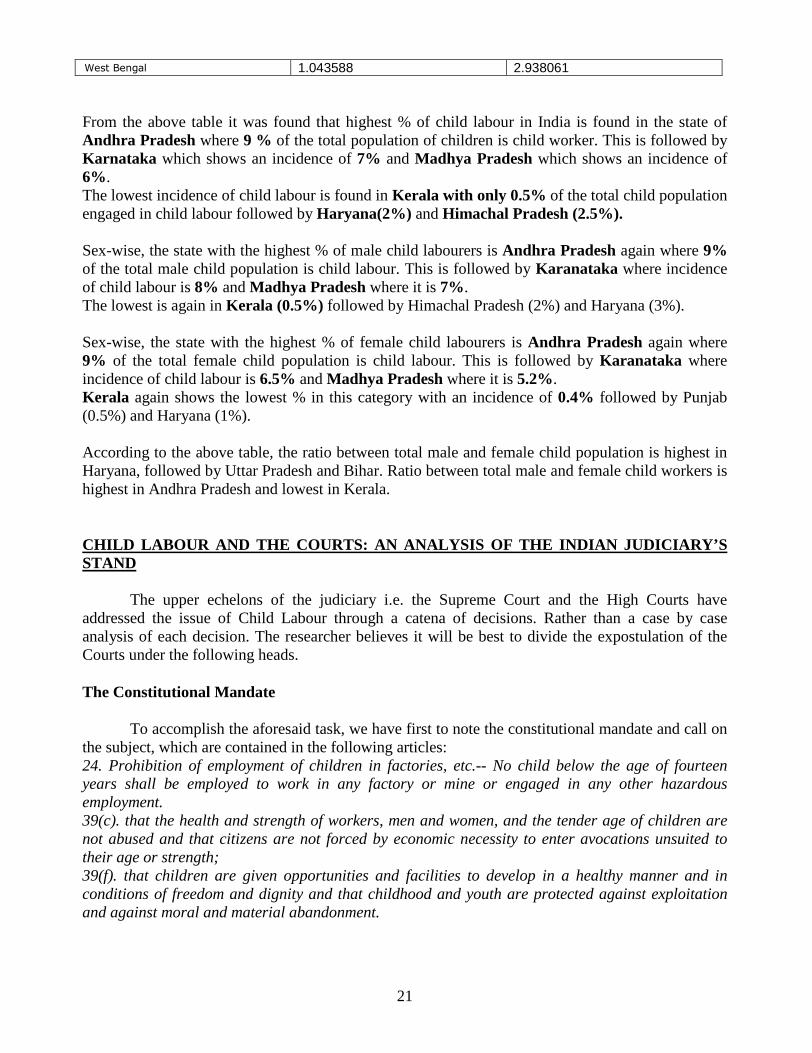
West Bengal 1.043588 2.938061
From the above table it was found that highest % of child labour in India is found in the state ofAndhra Pradesh where 9 % of the total population of children is child worker. This is followed byKarnataka which shows an incidence of 7% and Madhya Pradesh which shows an incidence of6%.The lowest incidence of child labour is found in Kerala with only 0.5% of the total child populationengaged in child labour followed by Haryana(2%) and Himachal Pradesh (2.5%).
Sex-wise, the state with the highest % of male child labourers is Andhra Pradesh again where 9%of the total male child population is child labour. This is followed by Karanataka where incidenceof child labour is 8% and Madhya Pradesh where it is 7%.The lowest is again in Kerala (0.5%) followed by Himachal Pradesh (2%) and Haryana (3%).
Sex-wise, the state with the highest % of female child labourers is Andhra Pradesh again where9% of the total female child population is child labour. This is followed by Karanataka whereincidence of child labour is 6.5% and Madhya Pradesh where it is 5.2%.Kerala again shows the lowest % in this category with an incidence of 0.4% followed by Punjab(0.5%) and Haryana (1%).
According to the above table, the ratio between total male and female child population is highest inHaryana, followed by Uttar Pradesh and Bihar. Ratio between total male and female child workers ishighest in Andhra Pradesh and lowest in Kerala.
CHILD LABOUR AND THE COURTS: AN ANALYSIS OF THE INDIAN JUDICIARY’SSTAND
The upper echelons of the judiciary i.e. the Supreme Court and the High Courts haveaddressed the issue of Child Labour through a catena of decisions. Rather than a case by caseanalysis of each decision. The researcher believes it will be best to divide the expostulation of theCourts under the following heads.
The Constitutional Mandate
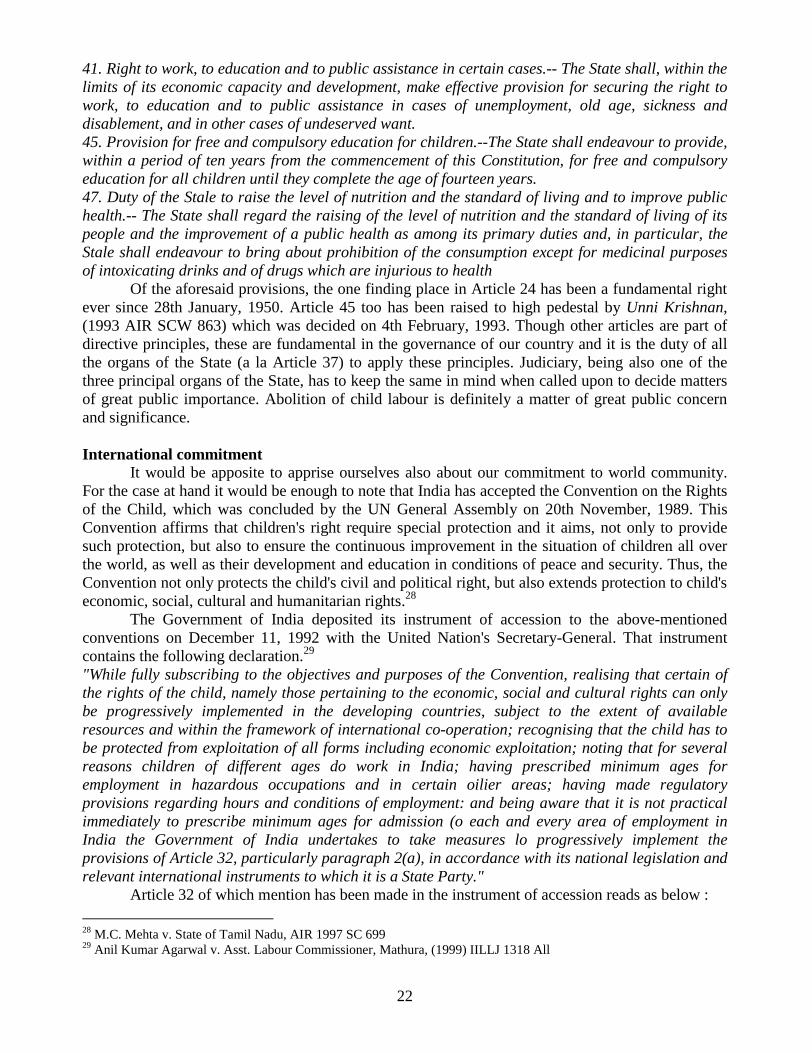
To accomplish the aforesaid task, we have first to note the constitutional mandate and call onthe subject, which are contained in the following articles:24. Prohibition of employment of children in factories, etc.-- No child below the age of fourteenyears shall be employed to work in any factory or mine or engaged in any other hazardousemployment.39(c). that the health and strength of workers, men and women, and the tender age of children arenot abused and that citizens are not forced by economic necessity to enter avocations unsuited totheir age or strength;39(f). that children are given opportunities and facilities to develop in a healthy manner and inconditions of freedom and dignity and that childhood and youth are protected against exploitationand against moral and material abandonment.
22
41. Right to work, to education and to public assistance in certain cases.-- The State shall, within thelimits of its economic capacity and development, make effective provision for securing the right towork, to education and to public assistance in cases of unemployment, old age, sickness anddisablement, and in other cases of undeserved want.45. Provision for free and compulsory education for children.--The State shall endeavour to provide,within a period of ten years from the commencement of this Constitution, for free and compulsoryeducation for all children until they complete the age of fourteen years.47. Duty of the Stale to raise the level of nutrition and the standard of living and to improve publichealth.-- The State shall regard the raising of the level of nutrition and the standard of living of itspeople and the improvement of a public health as among its primary duties and, in particular, theStale shall endeavour to bring about prohibition of the consumption except for medicinal purposesof intoxicating drinks and of drugs which are injurious to health
Of the aforesaid provisions, the one finding place in Article 24 has been a fundamental rightever since 28th January, 1950. Article 45 too has been raised to high pedestal by Unni Krishnan,(1993 AIR SCW 863) which was decided on 4th February, 1993. Though other articles are part ofdirective principles, these are fundamental in the governance of our country and it is the duty of allthe organs of the State (a la Article 37) to apply these principles. Judiciary, being also one of thethree principal organs of the State, has to keep the same in mind when called upon to decide mattersof great public importance. Abolition of child labour is definitely a matter of great public concernand significance.
International commitmentIt would be apposite to apprise ourselves also about our commitment to world community.
For the case at hand it would be enough to note that India has accepted the Convention on the Rightsof the Child, which was concluded by the UN General Assembly on 20th November, 1989. ThisConvention affirms that children's right require special protection and it aims, not only to providesuch protection, but also to ensure the continuous improvement in the situation of children all overthe world, as well as their development and education in conditions of peace and security. Thus, theConvention not only protects the child's civil and political right, but also extends protection to child'seconomic, social, cultural and humanitarian rights.28
The Government of India deposited its instrument of accession to the above-mentionedconventions on December 11, 1992 with the United Nation's Secretary-General. That instrumentcontains the following declaration.29
"While fully subscribing to the objectives and purposes of the Convention, realising that certain ofthe rights of the child, namely those pertaining to the economic, social and cultural rights can onlybe progressively implemented in the developing countries, subject to the extent of availableresources and within the framework of international co-operation; recognising that the child has tobe protected from exploitation of all forms including economic exploitation; noting that for severalreasons children of different ages do work in India; having prescribed minimum ages foremployment in hazardous occupations and in certain oilier areas; having made regulatoryprovisions regarding hours and conditions of employment: and being aware that it is not practicalimmediately to prescribe minimum ages for admission (o each and every area of employment inIndia the Government of India undertakes to take measures lo progressively implement theprovisions of Article 32, particularly paragraph 2(a), in accordance with its national legislation andrelevant international instruments to which it is a State Party."
Article 32 of which mention has been made in the instrument of accession reads as below :
28 M.C. Mehta v. State of Tamil Nadu, AIR 1997 SC 69929 Anil Kumar Agarwal v. Asst. Labour Commissioner, Mathura, (1999) IILLJ 1318 All

23
"1. States Parties recognise the right of the child to be protected from economic exploitation aridfrom performing any work that is likely to be hazardous or to interfere with the child's education, orto be harmful to the child's health or physical, mental, spiritual, moral or social development.2. States Parties shall lake legislative, administrative, social and educational measures to ensure theimplementation of the present article. To this end, and having regard to the relevant provisions ofother international instruments. States Parties shall in particular:(a) Provide for a minimum age or minimum ages for admission to employment;(b) Provide for appropriate regulation of the hours and conditions of employment;(c) Provide for appropriate penalties or oilier sanctions to ensure the effective enforcement of thepresent article."30
Statutory provisionsWe may now note as to how the problem of child labour has been viewed by cur policy
makers and what efforts have been made to take care of this evil. India has shown its concern in thissphere ever since the International Labour Organisation, set up in 1919 under the League of Nations,had felt that there should be international guidelines by which the employment of children under acertain age could be regulated in industrial undertakings. It, therefore, suggested that the minimumage of work be 12 years. The same required ratification by the Government of British India; andduring the Legislalive Assembly debates, the question of raising the minimum age from 9 to 12years had created a furore. The Hon'ble Sir Thomas Holland had said in the Legislative Assembly inFebruary 1921 that if the minimum age were raised, the same would upset the organisational set-upof most textile mills which were the principal employees of children. On the other hand, there werethose who felt that the answer to the problem lay in compulsory primary education. The Houseultimately was divided with 32 members voting for raising the minimum age to 12 and 40 votingagainst it. The Assembly, therefore, recommended to the Governor-General-in-Council that the DraftConvention should be ratified with certain observations.31
The International Labour Organisation has been playing an important role in the process ofgradual elimination of child labour and to protect child from industrial exploitation. It has focussedfive main issues:--1. Prohibition of children labour.2. Protecting child labour at work.3. Attacking the basic causes of child labour.4. Helping children to adopt to future work5. Protecting the children of working parents;Till now 18 Conventions and 16 recommendations have been adopted by the ILO in the interest ofworking children all over the world.32
Causes of Failure in India identified by the Supreme Court and High CourtsWe have, therefore, to see as to why is it that child labour has continued despite the aforesaid
statutory enactments. This has been a subject of study by a good number of authors. It would beenough to note what has been pointed out in 'Indian Child Labour" by Dr. J. C. Kulshreshtra. Thisaspect has been dealt in Chapter II. According to the author, the causes of failure are : (1) poverty;(2) low wages of the adult; (3) unemployment; (4) absence of schemes for family allowance; (5)migration to urban areas; (6) large families; (7) children being cheaply available; (8) non-existence
30 Art. 3231 M.C. Mehta v. State of Tamil Nadu, AIR 1997 SC 69932 Ibid.

24
of provisions for compulsory education; (9) illiteracy and ignorance of parents; and (10) traditionalaltitudes. Nazir Ahmad Shah has also expressed similar views in his book "Child Labour in India".In the article at pages 65 to 68 of 1993(3) SCJ (Journal Section) tilled "Causes of the exploitation ofchild labour in India", Dr. Amar Singh and Raghuvinder Singh, who are attached to HimachalPradesh University, have taken the same views.33
Of the aforesaid causes, it seems to us that the poverty is basic reason which compels parentsof a child, despite their unwillingness, to gel it employed. The Survey Report of the Ministry ofLabour (supra) had also so stated. Otherwise, no parents, specially no mother, would like that alender aged child should toil in a factory in a difficult condition, instead of it enjoying its childhoodat home under the paternal gaze.34
Models proposed by the Indian Judiciary to combat Child labour35
It may be that the problem would be taken care of to some extent by insisting on compulsoryeducation. Indeed, Ncera thinks that if there is at all a blueprint for tackling the problem of childlabour, it is education. Even if it were to be so, the child of a poor parent would not receiveeducation, if per force it has to earn to make the family meet both the ends. Therefore, unless thefamily is assured of income aliunde, problem of child labour would hardly get solved; and it is thisvital question which has remained almost unattended. The courts, however are of the view that till analternative income is assured to the family, the question of abolition of child labour would reallyremain a will-o-the wisp. Now, if employment of child below that age of 14 is a constitutionalindiction insofar as work in any factory or mine or engagement in other hazardous work, and if it hasto be seen that all children are given education till the age of 14 years in view of this being afundamental right now, and if the wish embodied in Article 39(e) that the tender age of children isnot abused and citizens are not forced by economic necessity to enter avocation unsuited to their age,and if children are to be given opportunities and facilities to develop in a healthy manner andchildhood is to be protected against exploitation as visualized by Article 39. It seems to the courtsthat the least we ought to do is see to the fulfilment of legislative intendment behind enactment ofthe Child Labour (Prohibition and Regulation) Act, 1986. Taking guidance there from, the Courtsare of the view that the offending employer must be asked to pay compensation for every childemployed in contravention of the provisions of the Act a sum of Rs. 20,000/-; and the Inspectors,whose appointment is visualised by Section 17 to secure compliance with the provisions of the Act,should do this job. The inspectors appointed under Section 17 would see that for each childemployed in violation of the provisions of the Act, the concerned employer pays Rs. 20,000/- whichsum could be deposited in a fund to be known as Child Labour Rehabilitation-cum-Welfare Fund.The liability of the employer would not cease even if he would desire to disengage the childpresently employed. It would perhaps be appropriate to have such a fund district wise or area wise.The fund so generated shall form corpus whose income shall be used only for the concerned child.The quantum could be the income earned on the corpus deposited qua the child. To generate greaterincome, fund can be deposited in high yielding scheme of any nationalised bank or other publicbody.
As the aforesaid income could not be enough to dissuade the parent/guardian to seekemployment of the child, the State owes a duty to come forward to discharge its obligation in thisregard. After all, the aforementioned constitutional provisions have to be implemented by theappropriate Government, which expression has been defined in Section 2(i) of the Act to mean, in
33 Raj Homes Pvt. Ltd. V. State of M.P., (2003) III LLJ 626 MP34 Chhota Bhai Munnu Bhai & Co. v. State of U.P., (1999) IILLJ 956 All35 M.C. Mehta v. State of Tamil Nadu, AIR 1997 SC 699

25
relation to establishment under the control of the Central Government or a railway administration ora major port or a mine or oilfield, the Central Government, and in all other cases the StateGovernment.
Now, strictly speaking a strong case exists to invoke the aid of an Article 41 of theConstitution regarding the right to work and to give meaning to what has been provided in Article 47relating to raising of standard of living of the population, and Articles 39(e) and (f) as to non-abuseof tender age of children and giving opportunities and facilities to them to develop in healthymanner, for asking the Slate to sec that an adult member of the family, whose child is in employmentin a factory or a mine or in other hazardous work, gets a job anywhere, in lieu of the child. Thiswould also see the fulfillment of the wish contained in Article 41 after about half a century of itsbeing in the paramount parchment, like primary education desired by Article 45, having been giventhe status of fundamental right by the decision in Unni Krishnan, (1993 AIR SCW 863J). The Courthowever refrains from asking the Stale at this stage to ensure alternative employment in every casecovered by Article 24, as Article 41 speaks about right to work “within the limits of the economiccapacity and development of the Slate”. The very large number of child-labour in the aforesaidoccupations would require giving of jobs to very large number of adults, if the Court were to ask theappropriable Government to assure alternative employment in every case, which would strain theresources of the State, in case it would not have been able to secure job for an adult in a privatesector establishment or, for that matter, in a public sector organisation. The Court does not issue anydirection to do so presently. Instead, it leaves the mailer to be sorted out by the appropriateGovernment. In those cases where it would not be possible to provide job as above-mentioned, theappropriate Government would, as its contribution/grant, deposit in the aforesaid fund a sum of Rs.5,000/- for each child employed in a factory or mine or in any other hazardous employment.
The aforesaid would either see an adult (whose name would be suggested by the parent/guardian of the concerned child) getting a job in lieu of the child, or deposit of a sum of Rs. 25,000/ -in the Child Labour Rehabilitation-cum-Welfare Fund. In case of getting employment for an adult,the parent/guardian shall have to withdraw their child from the job. Even if no employment would beprovided, the parent/guardian shall have to see that his child is spared from the requirement to do thejob, as an alternative source of income would have become available to him.
To give shape to the aforesaid directions, the Court requires the States to do the following:-(1) A survey would be made of the aforesaid type of child labour which would be completed withinsix months from today.(2) To start with, work could be taken up regarding those employments which have been mentionedin Article 24, which may be regarded as core sector, to determine which the hazardous aspect of theemployment would be taken as criterion. The most hazardous employment may rank first in priority,to be followed by comparatively less hazardours and so on. It may be mentioned here that theNational Child Labour Policy as announced by the Government of India has already identified someindustries forpriority action and the industries so idcnlificd are as below:--
The match industry in Sivakasi, Tamil Nadu. The diamond polishing industry in Surat, Gujarat. The precious stone polishing industry in Jaipur, Rajasthan. The glass industry in Firozabad, UttarPradesh. The brass-ware industry in Moradabad, Uttar Pradesh. The hand-made carpet industry in Mirzapur-Bhadchi, Uttar Pradcsh. The lock-making induslry in Aligarh, Uttar Pradesh. The slate industry in Markapur, Andhra Pradcsh. The slate industry in Mandsaur, Madhya Pradesh.
26
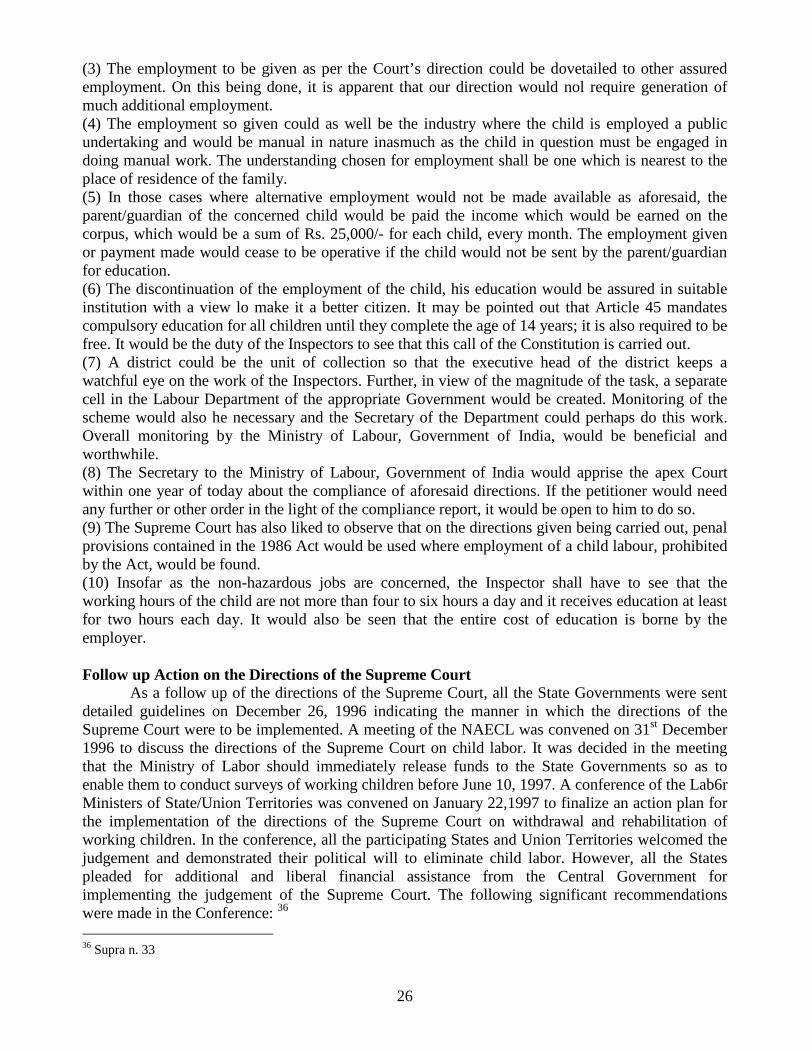
(3) The employment to be given as per the Court’s direction could be dovetailed to other assuredemployment. On this being done, it is apparent that our direction would nol require generation ofmuch additional employment.(4) The employment so given could as well be the industry where the child is employed a publicundertaking and would be manual in nature inasmuch as the child in question must be engaged indoing manual work. The understanding chosen for employment shall be one which is nearest to theplace of residence of the family.(5) In those cases where alternative employment would not be made available as aforesaid, theparent/guardian of the concerned child would be paid the income which would be earned on thecorpus, which would be a sum of Rs. 25,000/- for each child, every month. The employment givenor payment made would cease to be operative if the child would not be sent by the parent/guardianfor education.(6) The discontinuation of the employment of the child, his education would be assured in suitableinstitution with a view lo make it a better citizen. It may be pointed out that Article 45 mandatescompulsory education for all children until they complete the age of 14 years; it is also required to befree. It would be the duty of the Inspectors to see that this call of the Constitution is carried out.(7) A district could be the unit of collection so that the executive head of the district keeps awatchful eye on the work of the Inspectors. Further, in view of the magnitude of the task, a separatecell in the Labour Department of the appropriate Government would be created. Monitoring of thescheme would also he necessary and the Secretary of the Department could perhaps do this work.Overall monitoring by the Ministry of Labour, Government of India, would be beneficial andworthwhile.(8) The Secretary to the Ministry of Labour, Government of India would apprise the apex Courtwithin one year of today about the compliance of aforesaid directions. If the petitioner would needany further or other order in the light of the compliance report, it would be open to him to do so.(9) The Supreme Court has also liked to observe that on the directions given being carried out, penalprovisions contained in the 1986 Act would be used where employment of a child labour, prohibitedby the Act, would be found.(10) Insofar as the non-hazardous jobs are concerned, the Inspector shall have to see that theworking hours of the child are not more than four to six hours a day and it receives education at leastfor two hours each day. It would also be seen that the entire cost of education is borne by theemployer.
Follow up Action on the Directions of the Supreme CourtAs a follow up of the directions of the Supreme Court, all the State Governments were sent
detailed guidelines on December 26, 1996 indicating the manner in which the directions of theSupreme Court were to be implemented. A meeting of the NAECL was convened on 31st December1996 to discuss the directions of the Supreme Court on child labor. It was decided in the meetingthat the Ministry of Labor should immediately release funds to the State Governments so as toenable them to conduct surveys of working children before June 10, 1997. A conference of the Lab6rMinisters of State/Union Territories was convened on January 22,1997 to finalize an action plan forthe implementation of the directions of the Supreme Court on withdrawal and rehabilitation ofworking children. In the conference, all the participating States and Union Territories welcomed thejudgement and demonstrated their political will to eliminate child labor. However, all the Statespleaded for additional and liberal financial assistance from the Central Government forimplementing the judgement of the Supreme Court. The following significant recommendationswere made in the Conference: 36
36 Supra n. 33
27
The survey envisaged in the judgement of the Supreme Court would be in two phases. In thefirst phase the survey would be conducted in all industries, establishments, shops, work places inurban and semi-urban catchment areas where hazardous processes will be identified. In the event ofany child labor being found employed in any such process, simultaneous action would be taken torecover an amount of R.20, 000/ from the offending employer. Hazardous establishments in the ruralareas would also be fully covered by the survey in the first phase. The door-to-door survey for thepurpose of identification and enumeration of working children will be taken up in the second phase.While primarily it is the responsibility of the State Governments to provide necessary funds fortaking up activities in compliance of the directions of the Supreme Court, funds for conducting thesurvey will be released by the Central Government to the agencies at the district level immediately.If the funds released for the first phase of survey fall short of the actual requirement in any district,the State Governments will provide the additional funds for this purpose. Since this first phase of thesurvey is concentrated on industrial establishments, the requirement of funds would be worked outby the Central Government and the same would be released immediately.
Immediate action will be initiated by the State Governments for strengthening theenforcement machinery at various levels and for creation of a separate cell at the State level tomonitor and coordinate the activities to be taken up in compliance of the directions of the SupremeCourt. They will also send their requirements of funds in this regard, if any, to the PlanningCommission at the earliest.
If the State Governments are not in a position to complete the survey by 10th June, they willapprise the Hon'ble Supreme Court about the reasons for delay and seek extension of time from theHon'ble Supreme Court well in advance.
If for some reason, the State Governments find it difficult to give effect to any one or moredirections of the Supreme Court, they will seek necessary clarification/directions from the Hon'bleSupreme Court well in time.
As a follow-up of the decision taken in the State Labor Ministers' Conference, the ChiefSecretaries of State and Union Territories have been sent detailed guidelines for carrying out thesurvey as per the directions of the Supreme Court. A copy of the child labor survey form has alsobeen sent to the Governments of State and Union Territories. Funds have been released to all theState and Union Territories governments for the purpose of conducting the surveys. The ChiefSecretaries were specifically instructed that if the State Governments could not complete the surveysin time, they should apprise the Supreme Court through an affidavit about the reasons for delay andseek extension of time from the Supreme Court well in advance. 37
37 Supra n. 43 at p. 62