analysis of stockholm’s publicly accessible charging ... · 1 stockholms stad, 2016, erfarenheter...
TRANSCRIPT

Analysis of Stockholm’s publicly accessible charging infrastructure for electric cars April 2018
stockholm.se


Analysis of Stockholm’s publicly accessible charging infrastructure of electric cars April 2018 Dnr: 2018-13075 Publication date: August 2018 Publisher: Miljöförvaltningen Stockholms stad Contact person: Eva Sunnerstedt, Miljöförvaltningen Consultant: Trivector Traffic

Analysis of Stockholm’s publicly accessible charging infrastructure for electric cars 4 (34)
Summary
The City of Stockholm is working to improve the availability of charging stations. Several new charging stations have been installed in the past few years in collaboration with other actors. The charging stations are operated by four companies in Stockholm, namely Stockholm Parkering AB, E.ON, Fortum and Vattenfall. This report contains an evaluation of the City of Stockholm’s publicly accessible charging infrastructure based on data from all charging sessions from the beginning of quarter 4 2016 until the end of quarter 4 2017. A qualitative assessment of the infrastructure is made based on responses to a survey sent to Fortum and Vattenfall’s customers, of which 106 answered. The ability to fast charge at charging stations on the street or normal charging in parking garages was already established before the study period in Stockholm, however during 2017 the ability to normal charge electric cars was introduced to roadside charging stations. The number of electrically chargeable vehicles in Stockholm increase by 60 % between 2016 and 2017. During the same period the number of roadside charging points in Stockholm increased by 98 and the number of charging points in Stockholm Parkering’s garages increased by approximately 140. The quantitative assessment of the charging data shows the number of charging sessions more than doubled from quarter 4 2016 to quarter 4 2017. The majority of the charging sessions occur as normal charging sessions in garages, accounting for 56 % of all sessions during the study period, and often charging took place during the daytime of weekdays. However, more energy is transferred to charging cars by fast charging points available roadside. Normal charging sessions often transfer less than 10 kWh per session whilst fast charging sessions are most often less than 25 kWh per session. The survey results show that most respondents have access to charging at home, 77 % in total, whilst only 47 % have access to charging at their primary workplace. The respondents generally highlight that both normal and fast roadside charging are important to them.

Analysis of Stockholm’s publicly accessible charging infrastructure for electric cars
5 (34)
Contents Summary 4
Introduction 6 Background and objectives 6 Charging Infrastructure in Stockholm 7 Data Sources 8
Quantitative Analysis of Charging Sessions 9 Type of Charging 9 Charging over different time periods 10 Occupancy 14 Charging duration 17 Locational differences 22 Energy transferred 23
Customer Survey 26 Respondents 26 Type of charging 27 Opinions 29
Conclusion 33

Analysis of Stockholm’s publicly accessible charging infrastructure for electric cars 6 (34)
Introduction
Background and objectives The City of Stockholm is working to improve the accessibility to electric charging infrastructure. In collaboration with other actors, several charging points have been established over past few years. This report presents an analysis of how these charging points in Stockholm were utilised during 2017. The objective of the analysis is to understand how the charging infrastructure is used and consequently gain insights which can be used to continue the expansion of the charging infrastructure. The following main aspects have been analysed:
• Time during the day when charging sessions begin • Charging over the days of the week and months of the year • Energy transfer and charging time • General differences between charging locations (only
consider charging in garages) • Difference between different categories of charging
The analysis is based on the charging sessions for the period of quarter 4 of 2016 to quarter 4 of 2017. The data includes normal charging points both roadside and in parking garages and roadside fast charging points. The data includes charging sessions from all four providers of charging points in Stockholm, namely Stockholm Parking, EON, Fortum and Vattenfall. Stockholm’s publicly available charging infrastructure has even been evaluated through an online survey in which customers of Fortum and Vattenfall were invited to respond to. The qualitative analysis gives insight into how customer use and perceive the charging infrastructure in Stockholm. Two previous reports have been published by the City of Stockholm on this subject1. Compared with these two studies this report includes an analysis over a greater number of charging points as well as an additional category of charging point, namely roadside normal charging points.
1 Stockholms Stad, 2016, Erfarenheter från etablering av publik laddning för elbilar i Stockholm, KTH, Kvantitativ analys av nyttjandet av publika laddplatser i Stockholm stad un-der perioden 4Q2015- 3Q2016

Analysis of Stockholm’s publicly accessible charging infrastructure for electric cars
7 (34)
This report is part of a project that has received funding from the European Union’s Horizon 2020 research and innovation programme under grant agreement No 690699. This report is part of the EU project Civitas Eccentric. The City of Stockholm is testing and evaluating new technology and concepts for sustainable trips and means of transport for the period of 2016 to 2020 in order to develop new markets and spread knowledge. The project facilitates cooperation with the cities of Madrid (Spain), Munich (Germany), Åbo (Finland) and Ruse (Bulgaria)2.
Charging Infrastructure in Stockholm The number of chargeable vehicles has increased by over 60 % from 2016 to 2017. By the end of 2017 there were 12,100 chargeable vehicles in Stockholm, of which 9,700 were hybrid vehicles and 2,400 were electric cars. There were normal charging stations in 38 different parking garages in Stockholm during 2017, shown in Figure 1 below.
Figure 1 Location of Stockholm Parkering’s garages where normal charging points are found, April 20183
2 More information can be found here: http://civitas.eu/eccentric/stockholm 3 Hämtat från Stockholm Parkerings portal https://stockholmparkering.oamportal.com

Analysis of Stockholm’s publicly accessible charging infrastructure for electric cars 8 (34)
During 2017, 10 new roadside fast charging points were installed, which was a doubling compared with the year before. There were also around 90 roadside normal charging points installed in 2017. The map below shows the location of 15 roadside charging stations which were introduced in central Stockholm in 2017. Charging stations had previously been installed in the following six locations in 2014 and 2015, which are not shown on the map:
• Valhallavägen 1, Roslagstull • Sockengränd 1, Årsta • Nybohovsbacken 17, Liljeholmen • Bobergsgatan 12, Hjorthagen • Ringvägen 35, Södermalm • Sandhamnsgatan 72, Gärdet
Figure 2 The location of fast and normal roadside charging stations in Stockholm which were established during 2017
The duration in which a vehicle may use a normal charging point is limited to 3 hours between 07:00 and 19:00 and the use of fast charging points is always limited to 30 minutes.
Data Sources Data on charging sessions was provided in spreadsheets from the from EON, Fortum and Vattenfall. Data from the charging sessions at Stockholm Parkering’s charging points was retrieved from the Chargestorm portal online. In total, data on 80,000 charging sessions were collected from these sources for the five quarter of quarter 4 of 2016 to quarter 4 of 2017. After the data set was cleaned for entries without any recorded energy transfer and duplicates in the data, the total number

Analysis of Stockholm’s publicly accessible charging infrastructure for electric cars
9 (34)
of charging sessions stood at 74, 000. This forms the basis of the quantitative analysis in the following chapter. The qualitative section builds upon the results from the online survey which Fortum and Vattenfall sent to their customers. The survey was open between 16th February and 15th March. One reminder email was sent out during this period. The qualitative analysis is based on the 106 responses received.
Quantitative Analysis of Charging Sessions
Type of Charging Most charging sessions occurred at normal charging points in parking garages, see Figure 3. Roadside fast charging sessions accounted for 38 % and the remaining 7 % were normal roadside charging sessions.
Figure 3 Distribution of charging sessions between the three categories of charge, Q4 2016-Q4 2017.
55 % of charging sessions in Stockholm during the study period took place at Stockholm Parkering’s garages, the largest share of the four charging point providers.
Normal charging, roadside
7%
Normal charging,
parking garage55%
Fast charging (50kW), roadside
38%

Analysis of Stockholm’s publicly accessible charging infrastructure for electric cars 10 (34)
Figure 4 Stockholm Parkering’s share of charging sessions, Q4 2016 to Q4 2017.
Charging over different time periods
Doubling of the number of charging sessions During 2017, the total number of charging sessions increased in each successive quarter. The fourth quarter of 2017 had twice as many charging sessions as the same quarter in 2016, see Figure 5. A larger increase can be seen between the final two quarters of 2017.
Figure 5 Number of charging sessions per category per quarter.
Stockholm parkering
55%
Other providers45%

Analysis of Stockholm’s publicly accessible charging infrastructure for electric cars
11 (34)
Charging over 2017 The number of charging sessions per month during 2017 is shown in Figure 6. The total number of sessions, displayed by the grey line, shows there was a small increase during the first half of 2017, followed by a dip in the summer months. However, after the summer the number of charging sessions increased significantly. The maximum number of recorded charging sessions occurred during October when 8,500 sessions occurred. Normal charging in parking garages and fast roadside charging both have their highest number of sessions during October, whilst the high point for normal roadside charging is in December after a steady increase over the year.
Figure 6 Number of charging sessions per charging category during 2017
Analysis of Stockholm’s publicly accessible charging infrastructure for electric cars 12 (34)
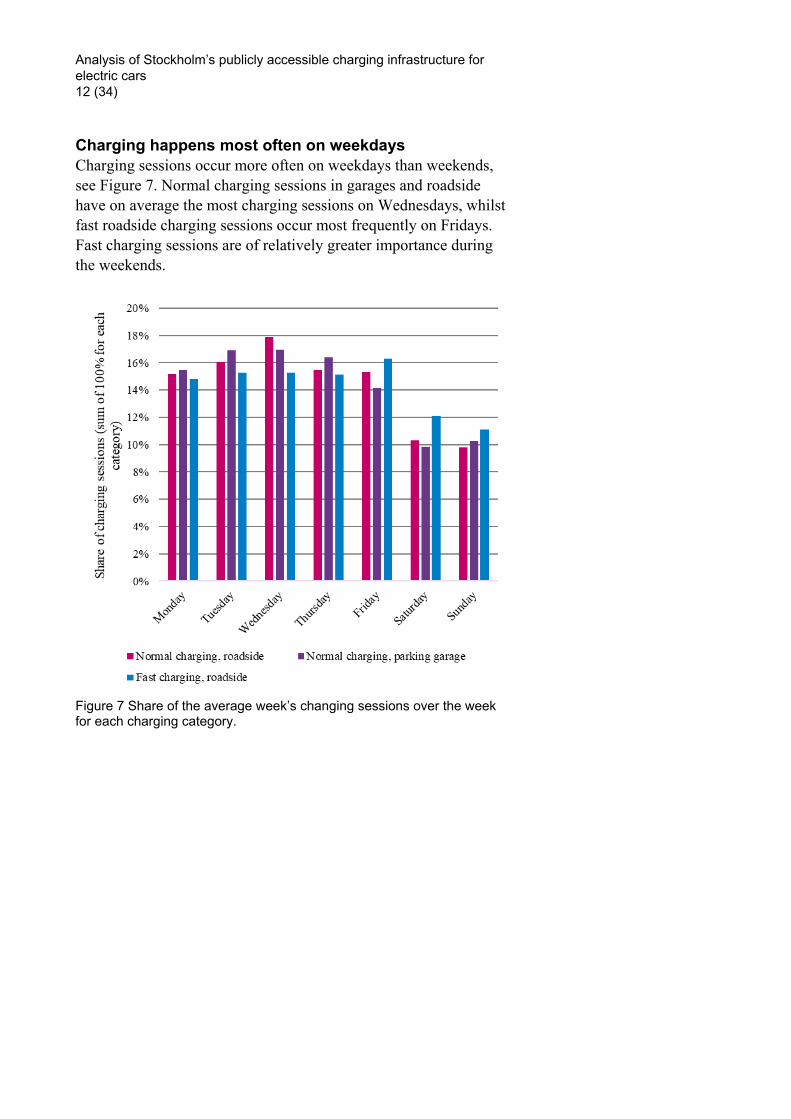
Charging happens most often on weekdays Charging sessions occur more often on weekdays than weekends, see Figure 7. Normal charging sessions in garages and roadside have on average the most charging sessions on Wednesdays, whilst fast roadside charging sessions occur most frequently on Fridays. Fast charging sessions are of relatively greater importance during the weekends.
Figure 7 Share of the average week’s changing sessions over the week for each charging category.
Analysis of Stockholm’s publicly accessible charging infrastructure for electric cars
13 (34)
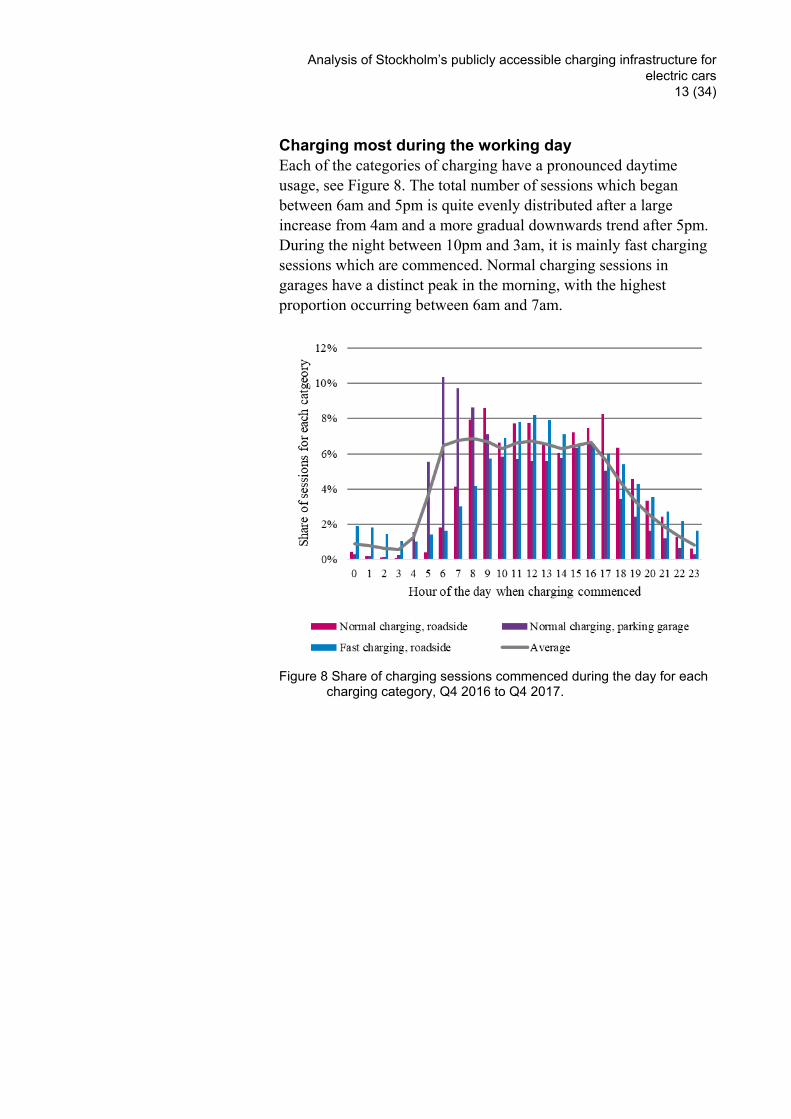
Charging most during the working day Each of the categories of charging have a pronounced daytime usage, see Figure 8. The total number of sessions which began between 6am and 5pm is quite evenly distributed after a large increase from 4am and a more gradual downwards trend after 5pm. During the night between 10pm and 3am, it is mainly fast charging sessions which are commenced. Normal charging sessions in garages have a distinct peak in the morning, with the highest proportion occurring between 6am and 7am.
Figure 8 Share of charging sessions commenced during the day for each
charging category, Q4 2016 to Q4 2017.

Analysis of Stockholm’s publicly accessible charging infrastructure for electric cars 14 (34)
Occupancy The total number of concurrent charging sessions for an average day during the final quarter of 2017 is shown in Figure 9. The highest occupancy of charging points occurs on average between 10am and 1pm with approximately 70 vehicles charging. Normal charging sessions in parking garages accounts for the greatest number of charging vehicles and has a large variation over the day.
Figure 9 Number of vehicles charging per charging category over an
average day for Q4 2017.
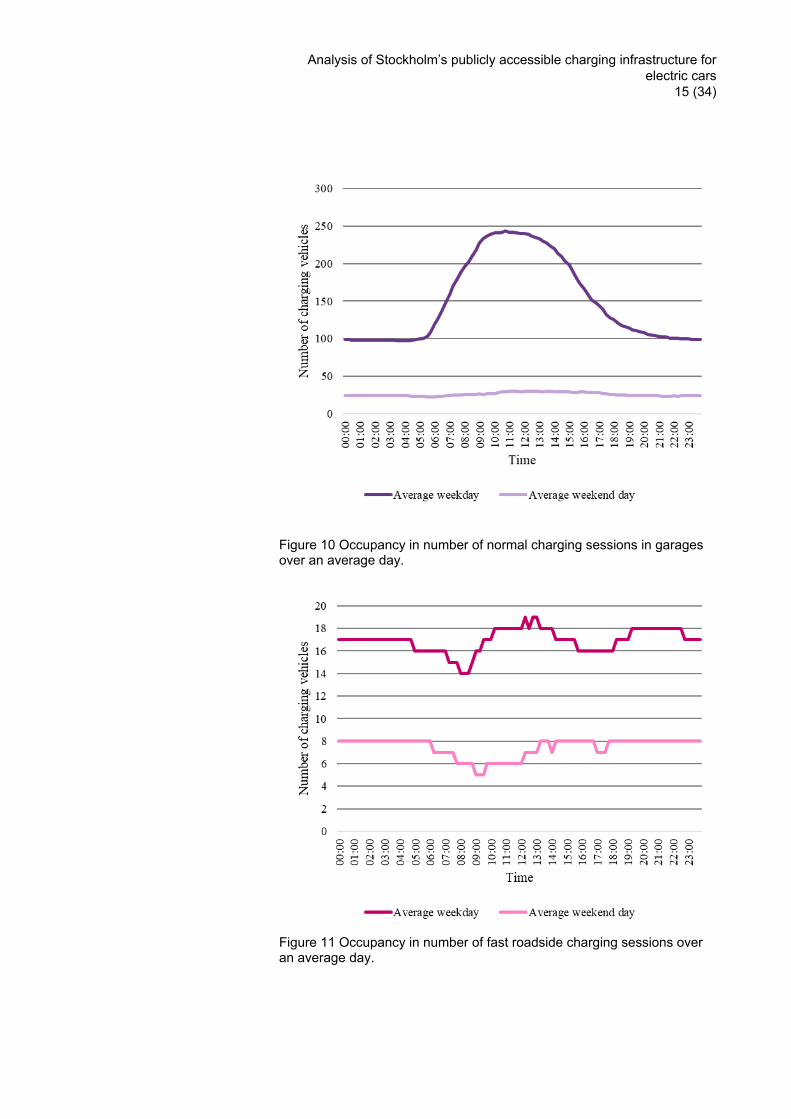
Figures 10 to 12 show the number of sessions for each charging category for an average weekend day and weekend day. In each charging category, more charging sessions occur during weekdays than on the weekend. The highest occupancy of charging points in garages and roadside fast charging occur during office hours on weekdays.
Analysis of Stockholm’s publicly accessible charging infrastructure for electric cars
15 (34)
Figure 10 Occupancy in number of normal charging sessions in garages over an average day.
Figure 11 Occupancy in number of fast roadside charging sessions over an average day.

Analysis of Stockholm’s publicly accessible charging infrastructure for electric cars 16 (34)
Figure 12 Occupancy in number of fast roadside charging sessions over an average day

Analysis of Stockholm’s publicly accessible charging infrastructure for electric cars
17 (34)
Charging duration The duration of charging sessions varies from 10 minutes up to over 24 hours. A significant majority of charging sessions (43 %) last less than an hour, see Figure 13, which is due in part to the 90 % share of fast charging sessions lasting less than an hour. This large share of short charging durations for fast charging is due to the 30 minutes limit for using the fast charging points in Stockholm. Three quarters of charging sessions take place for less than 3 hours, which is the time limit for roadside normal charging points between the hours of 7am and 7pm.
Figure 13 Distribution of charge session durations in hours for each
charging category, Q4 2016 to Q4 2017.

Analysis of Stockholm’s publicly accessible charging infrastructure for electric cars 18 (34)
Charging duration of fast charging sessions 65 % of fast charging sessions take 30 minutes or less, which is the time limit allowed. The duration of the fast charging session does not vary over the day, see Figure 15.
Figure 14 Share of charging sessions over 10 minute duration intervals
for fast charging sessions, Q4 2016 to Q4 2017.
Figure 15 Average duration of fast charging session based on the time
when the session begins, Q4 2016 to Q4 20174
4 Cars that charged for longer than a day were not included to prevent extreme values effecting the mean value

Analysis of Stockholm’s publicly accessible charging infrastructure for electric cars
19 (34)
Approximately 35 % of fast charging session lasted longer than the permitted 30 minutes. Figure 16 shows the charging time for those sessions which lasted longer than 30 minutes.
Figure 16 Share of all fast charging sessions which lasted longer than 30 minutes.

Analysis of Stockholm’s publicly accessible charging infrastructure for electric cars 20 (34)
Charging duration, normal charging Normal charging has a similar pattern of charging duration in both parking garages and roadside. Approximately 45 % of normal charging sessions are under 3 hours in duration, see Figure 17.
Figure 17 Accumulated share of sessions for normal charging in hours, Q4 2016 to Q4 2017.
Normal roadside charging sessions are limited to 3 hours during the daytime, 7am to 7pm. 55 % of normal charging sessions roadside were longer than 3 hours and 37 % were longer than 3 hours during the period the time restriction is in effect. Figure 18 shows the distribution of charging durations for those vehicles that charged long than 3 hours during the daytime period.

Analysis of Stockholm’s publicly accessible charging infrastructure for electric cars
21 (34)
Figure 18 Andel av alla normalladdningar på gatumark som sker längre än 3 timmar på dagtid.
Figure 19 Average charging durations for normal charging sessions
based on the hour of the day when the session began with extreme values removed, Q4 2016-Q4 20175
5 Vehicles which were connected for longer than 2 days were excluded from the calculation. Extremely long charging durations were concentrated at Stigbergsgaraget with 34 % of these values, Högalidsgaraget at 15 % and Gallerian Herkulesgatan at 10 %, Kölnan parking garage at 9 % and Vartofta at 8 %.
0
2
4
6
8
10
12
14
0 1 2 3 4 5 6 7 8 9 10 11 12 13 14 15 16 17 18 19 20 21 22 23
Ave
rage
dur
atio
n (h
ours
)
Hour that the session commenced
Normal charging, roadside Normal charging, parking garage

Analysis of Stockholm’s publicly accessible charging infrastructure for electric cars 22 (34)
Locational differences The average charging duration at each of Stockholm Parkering’s garages are shown in Figure 19. The garage called Parkeringshuset Viking accounts for the longest average charging time, followed by Vartofta parkeringshus and Stigbergsgaraget.
Figure 20 Average charging times for Stockholm Parkering’s garages Q4 2016- Q4 2017.

Analysis of Stockholm’s publicly accessible charging infrastructure for electric cars
23 (34)
Energy transferred The recorded energy transfer from the publicly accessible charging infrastructure in Stockholm was a total of 746,000 kWh for the period of quarter 4 2016 to quarter 4 2017. This is equivalent to 720 tons of reduced carbon dioxide emissions as compared to the average emissions for diesel cars. The total energy transfer for each quarter is displayed in Figure 21.
Figure 21 Energy transferred from Stockholm’s public charging stations for each quarter.
For each type of charging, the most common amount of energy transferred per session lies in the 0 to 10 kWh interval, shown in Figure 22. Approximately 80 % of normal charging sessions transferred less than 10 kWh, whilst the equivalent share for fast charging sessions was 40 %. Around 80 % of fast charging sessions transferred 25 kWh or less. The 668 charging points that Stockholm Parkering had available during 2017 and there is charging data available for accounted for approximately 159,5 tons of reduced in carbon dioxide emissions.

Analysis of Stockholm’s publicly accessible charging infrastructure for electric cars 24 (34)
Figure 22 Share of vehicles in each energy interval per session (kWh).

Analysis of Stockholm’s publicly accessible charging infrastructure for electric cars
25 (34)
The average energy transfer per session for each of Stockholm Parkering’s garages is presented in Figure 23. The order of the bars is the same order as those in Figure 20 over charge duration. Viking parkeringshus has the highest value at 16 kWh on average. Thereafter follows Humlegårdens parkeringshus and St Eriksplans parkeringshus.
Figure 23 Average energy transfer per session (kWh) for Stockholm Parkering’s charging points for each garage, Q4 2016 to Q4 2017

Analysis of Stockholm’s publicly accessible charging infrastructure for electric cars 26 (34)
The three most used normal charging stations in a parking garage are Galleriangaraget, which accounts for 21 % of the energy transferred, Högalidsgatan (8 %) and Stigbergsgaraget (7 %). The difference in transferred energy in parking garages between the most and least used is a factor of around 300.
Customer Survey
To identify the customers who make use of the public charging infrastructure in Stockholm as well as when and why they do so, a customer survey was undertaken during February and March 2018. The survey was sent to the customers of Fortum and Vattenfall and the results are based on the 106 answers received. Note that the answers to certain questions, especially when broken down to subcategories, have very few observations which limits the certainty of the conclusions.
Respondents Of the 106 who responded to the survey, 86 % were men. People who drive electric cars accounted for 60 % of the respondents and the other 40 % hybrid cars. A majority at 59 % use their car for both private and business purposes, see Figure 25.
Figure 24 Share of people who use their electric car or hybrid car for work and/or private. N = 106
Only private use40%
Only for business
1%
Both private and business
59%
How do you use your chargable vehicle?

Analysis of Stockholm’s publicly accessible charging infrastructure for electric cars
27 (34)
Type of charging Most respondents, 77 %, have access to charging at home, however a significant minority, 23 %, do not. Approximately half of respondents reported using both fast and normal charging, see Figure 25.
Figure 25 Share of people who use fast and/or normal charging. N=106
Fast Charging There is a very small share of respondents who only use fast charging and the number of respondents is too few to be able to analyse their usage of fast charging.
Normal Charging There is a clear pattern of daily home use of charging amongst those who use normal charging. A large share of respondents, 74 %, report charging at their place of work. However only 47 % of respondents have access to charging at their main workplace, which therefore indicates that they charge at nearby publicly available charging stations. The largest share of these people (29 % of the total) charge every day, followed by those who charge a few times during a week. 75 % of respondents have charged their vehicle whilst shopping at least once. The majority of those that have charged whilst shopping, do so once or twice a month. There are some however who report doing so every day.
Fast charging (50 kWh)8%
Normal Charging40%
Both fast and normal charging
52%

Analysis of Stockholm’s publicly accessible charging infrastructure for electric cars 28 (34)
75 % of respondents said they have also charged their vehicle somewhere other than home, work and whilst shopping. Note that the number of answers above were very few in certain answers and there are consequently uncertainties in the results.
Finding a charging station 60 % of respondents have used mobile applications to find charging stations, see Figure 26. Half of those who reported using mobile applications were searching for fast charging points.
Figure 26 Primary method of finding a roadside charging point in Stockholm. N=104

Analysis of Stockholm’s publicly accessible charging infrastructure for electric cars
29 (34)
Opinions
Importance of roadside charging Most respondents believe that normal and fast roadside charging is important, see Figure 27. A greater share believe that fast charging is very important compared to normal charging, however the differences are minor, especially considering the small sample size.
Figure 27 Respondents answers to the question: How important is roadside charging in Stockholm for you? N = 103 for normal charging & N = 104 for fast charging
Analysis of Stockholm’s publicly accessible charging infrastructure for electric cars 30 (34)
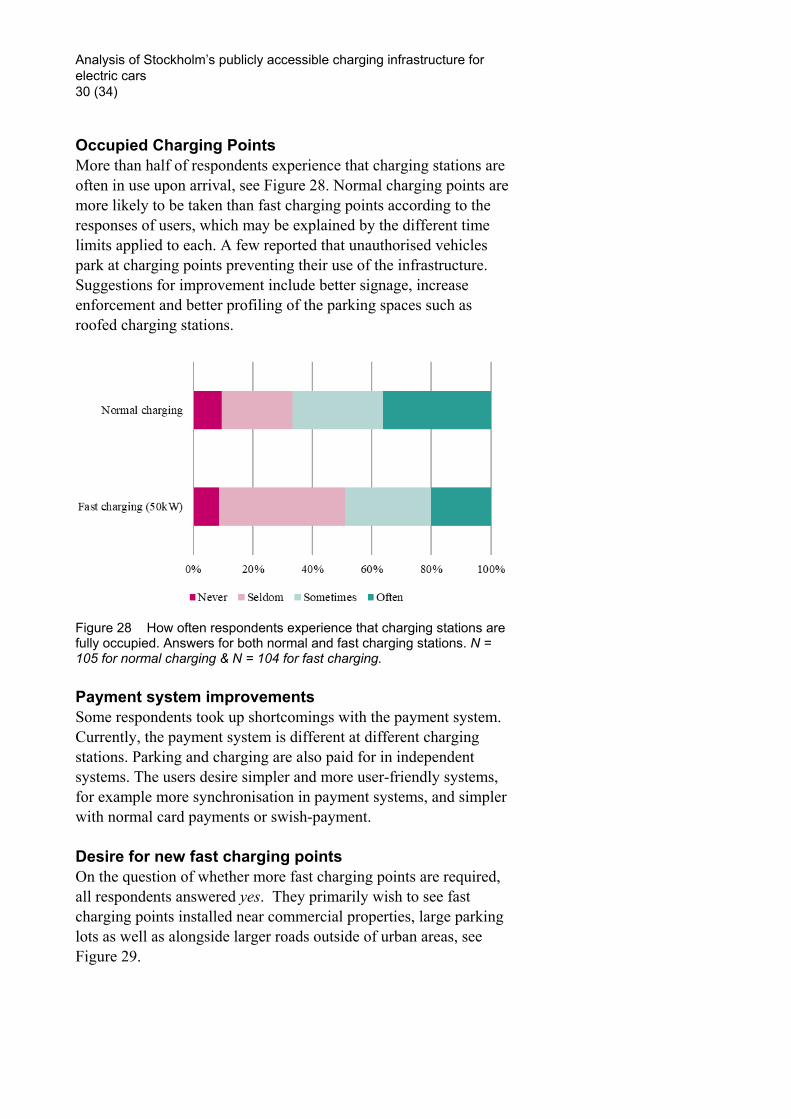
Occupied Charging Points More than half of respondents experience that charging stations are often in use upon arrival, see Figure 28. Normal charging points are more likely to be taken than fast charging points according to the responses of users, which may be explained by the different time limits applied to each. A few reported that unauthorised vehicles park at charging points preventing their use of the infrastructure. Suggestions for improvement include better signage, increase enforcement and better profiling of the parking spaces such as roofed charging stations.
Figure 28 How often respondents experience that charging stations are fully occupied. Answers for both normal and fast charging stations. N = 105 for normal charging & N = 104 for fast charging.
Payment system improvements Some respondents took up shortcomings with the payment system. Currently, the payment system is different at different charging stations. Parking and charging are also paid for in independent systems. The users desire simpler and more user-friendly systems, for example more synchronisation in payment systems, and simpler with normal card payments or swish-payment.
Desire for new fast charging points On the question of whether more fast charging points are required, all respondents answered yes. They primarily wish to see fast charging points installed near commercial properties, large parking lots as well as alongside larger roads outside of urban areas, see Figure 29.

Analysis of Stockholm’s publicly accessible charging infrastructure for electric cars
31 (34)
Figure 29 Share of respondents who desire more fast charging points at various locations. N = 106
Experience of the usage regulations Just over half of the respondents who use fast charging have experienced the need to use the charging point longer than the time limit of 30 minutes, however almost equally as many have not had problems with the time limit, see Figure 30. 18 % of all respondents have not used public fast charging points. The reasons given for experiencing difficulty with the 30 minute time limit were that it was not long enough to have time to rest and that it was not possible to sufficiently charge their vehicle in 30 minutes (these views likely come from taxi driver who drive Tesla cars). Some of those who view the 30 minute time limit as reasonable believe the rule could be better enforced with a surveillance system.
Figure 30 Respondents answer to the question: Today, publicly available fast charging points are restricted to 30 minutes use, do you have time to adequately charge your vehicle within this time? N = 87
0% 10% 20% 30% 40% 50% 60% 70% 80%
Shopping centres
Alongside larger roads outside urbanareas
Larger parking lots
Petrol/Service stations
Central Stockholm
Roadside generally
Travel hubs

Analysis of Stockholm’s publicly accessible charging infrastructure for electric cars 32 (34)
Barely a third of respondents view the time limit for normal charging as good (limited to 3 hours during the period of 7am to 7pm). The remaining respondents desire an extension to the charging time, see Figure 31.
Figure 31 Respondents answer to the question: What do you think about the time limit of 3 hours for normal charging? N = 106.

Analysis of Stockholm’s publicly accessible charging infrastructure for electric cars
33 (34)
Conclusion
The quantitative analysis shows that the number of charging sessions has more than doubled in total over the analysed period of quarter 4 of 2016 to quarter 4 of 2017. The increase can be explained by the expansion in both the number of charging points available as well as the increased number of chargeable vehicles on the streets of Stockholm. The number of chargeable vehicles in Stockholm have increase by 60 % from 2016 to 2017. The number of publicly available roadside charging points in Stockholm has increased by 98 points (of which 10 are fast charging points) and 140 further charging points were installed in Stockholm Parkering’s garages during 2017. Most of the charging sessions in Stockholm occur in parking garages with normal charging and most often during weekdays during working hours. However, most energy is transferred by fast charging points in Stockholm, which stood for 56 % of energy transferred during quarter 4 of 2017. The usage of the charging infrastructure is higher on weekdays than during the weekend for all three charging categories. The occupancy of charging points is highest between 10am and 1pm on an average weekday, when around 70 vehicles are simultaneous charging on average. Most fast charging sessions are shorter than 1 hour long, which is partially explained by the time limit of 30 minutes. According to the survey responses, 44 % of people do not feel the 30 minutes is long enough to charge the vehicles and this is reflected in the quantitative analysis where 31 % of all sessions break the 30 minute rule during the working day. In terms of energy transfer, charging sessions most often transfer less than 10 kWh of energy per session for normal charging and often less than 25 kWh for fast charging. For an average fast charging session, double the amount of energy is transferred as compared to normal charging in parking garages. The survey shows that most respondents have access to charging at home, at 77 %. Most use both fast and normal charging. For those who normal charge their vehicles, most do this daily at home, however a large share also charge their vehicle whilst at work. However, a significant number of respondents do not have access to

Analysis of Stockholm’s publicly accessible charging infrastructure for electric cars 34 (34)
charging at their main workplace which makes the availability of public charging infrastructure important. Mobile applications are the most common method of finding charging stations. The majority of respondents view both normal and fast charging opportunities in public spaces as important. There were some suggestions for improvements from the survey respondents:
• Profiling and signage at charging stations can be improved in order to ensure that only chargeable vehicles park there.
• Time restrictions are often not followed, which can lead to many who have trouble finding an available charging point, however many also view the 30 minutes as too short a period for fast charging sessions.
• A simple and user-friendly payment system is requests, as each provider has a separate system of payment.