analysis of taxi supply and demand matching degree based
TRANSCRIPT
Analysis of Taxi Supply and Demand Matching Degree Based on BP Neural Network
Li Yajing 1, a
1Department of Survey and Control Technology & Instrument, North China Electric Power University (Baoding), Baoding, 071000, China
aemail: [email protected]
Keywords: BP neural network, Wuhan taxi, supply and demand matching degree
Abstract. To analyze supply and demand matching degree of taxi resources in different periods in the long span, namely, with year as its measuring unit, this paper selects Wuhan city whose taxi ordering volume ranks in forefront [1] in China, analyzes the change law and development trend of supply and demand matching index as time goes on by using BP neural network algorithm, and concludes that the demand and supply matching degree of taxi before 2011 in Wuhan was high, the supply and demand matching ratio and matching index of taxi in Wuhan after 2012 significantly increased, the relationship between supply and demand was increasingly intense, and the supply of taxi in Wuhan would be difficult to meet the demand in future 5 years.
Introduction With the improvement of living standards of people in China in recent years, the travelling
demand of the majority of people is sharply increasing, which directly stimulates the rapid development of taxi industry in China, and meanwhile results in uneven distribution of taxi resources in time and space. On the one hand, there is a higher empty-loading ratio among part of taxi; on the other hand, many passengers face the difficulty of taking a taxi. By using BP neural network, this paper analyzes the taxi supply and demand matching relationship in Chinese cities, expecting to play a certain positive role in solving above problems in the taxi industry.
Establishment of Demand and Supply Matching Model In order to analyze the change law of supply and demand relationship degree as time goes on,
this paper selects Wuhan as the sample city. It should be noted that though the results given in this paper are only for Wuhan, the methods used in this paper are universal for all cities.
Consider using the ratio of taxi supply and demand at the same time in the same place to measure the original supply and demand matching degree. Define the supply and demand matching ratio:
(1)
Wherein, is taxi demand, is the taxi supply in the same time at the same place Define using supply and demand matching index to measure the final supply and demand
matching degree. When the taxi supply is greater than taxi demand, the supply and demand
matching index is positive; when the taxi supply is smaller than the taxi demand, the supply and demand matching index is negative. The supply and demand matching index is:
(2)
Wherein, for selection of specific numerical values of and , this paper selected the ratios of number of taxi drivers and passengers from 2004 to 2013 to determine the numerical values of
and . The specific process is as follows:
3rd International Conference on Machinery, Materials and Information Technology Applications (ICMMITA 2015)
© 2015. The authors - Published by Atlantis Press 497

(3)
Wherein, sj is the number of taxi drivers, and ck is the number of passengers taking a taxi in the same time.
Take the number of taxi drivers and passengers from 2004 to 2013 in the statistical yearbook [2,3] in the above equation and obtain and .
The numerical value of the supply and demand matching index indicates the degree of supply and demand relationship deviating from the optimal supply and demand relationship. The numerical value is closer to zero, indicating the taxi supply and demand matching degree is higher. The symbol of matching index represents the direction of supply and demand relationship. When the symbol of is positive, the urban taxi supply is greater than demand; when the symbol of is negative, the urban taxi supply is smaller than demand. The quantification of supply and demand matching degree below is based on the supply and demand matching index in this model. This model is important for measuring the taxi supply and demand matching degree.
Determination and Prediction of Annual Taxi Supply Quantity The total number of urban in-service taxi is considered to be taken as the taxi supply quantity.
The total number of in-service taxi from 2004 to 2013 in the urban statistical yearbook [1-2] is used as the taxi supply quantity in the ten years.
By observing the scatter diagram of relationship between taxi supply quantity and time in the same city (see Figure 2), that the relationship curve was close to quadratic curve is found. Therefore,
use the quadratic polynomial as the fitting polynomial, and fit and predict the data. The change of taxi supply quantity in recent 10 years and future 5 years in Wuhan can be concluded.
Table 1 Taxi Predicted Supply Quantity in Wuhan (unit: vehicle) Year 2014 2015 2016 2017 2018
Predicted supply quantity 17850 18899 19983 21104 22261
Fig. 1. Fitting result of taxi supply quantity in Wuhan
By analyzing the fitting result of taxi supply quantity in Wuhan, it can be seem that the original curve shape is close to quadratic polynomial and the taxi supply quantity in Wuhan shows a rising trend year by year, and the supply quantity in future years will increase.
498

Determination and Predication of Annual Taxi Demand Quantity Based on BP Neural Network
Affected by multiple factors, the taxi demand shows strong dynamic and uncertainty. The direct measurement will result in lower accuracy. Therefore, this paper considered selecting the major factors that affected the taxi demand quantity to establish its prediction model based on BP artificial neural network, and to study the dynamic change law of urban taxi demand, and to effectively predict the urban taxi demand quantity [4].
In the majority of cities in China, citizens’ main public transport means are taxi and bus. Therefore, consider the factors affecting taxi demand quantity from these two aspects. Meanwhile, the urban taxi demand comes from the need of social life, which is affected by factors such as population, economic development level, resident’s consumption level and urbanization size. Fully consider the feedback relationship and causal relationship between influence factors and urban taxi demand. The specific relationships are shown in Figure 3.
Urban GDP Transportation shortage
Residents’ consumption
level
Urban bus investment
Urban bus supply
Number of urban buses
Urban taxi share ratio
Taxi demand quantity
Urban population
Taxi demand quantity
+
+
- +
+
++
+
-
+
+
-
-
Fig. 2. Relations diagram of influence factors of taxi demand quantity
By analyzing the relations between factors affecting taxi demand quantity in Fig.2, that from the angle of causal relationship between factors, the Urban GDP, population, residents’ consumption level and number of urban buses are the main factors affecting taxi demand quantity can be seen. Other factors are indirect influence factors.
BP neural network is a typical learning algorithm under the guidance of instructors. Its basic idea is to learn the sample groups with a certain quantity (input and expected output), namely, deliver the sample input to the nerve cells of network input layer. After calculation at the hidden layer and output layer, the nerve cells at the output layer output corresponding predicted values. If the error between predicted and expected values cannot meet the accuracy requirements, then this error is reversely propagated at the output layer. Thus, adjust the weight and threshold to gradually reduce the error between network output and expected output, until the accuracy requirement is met. The essence of BP network is attributing the error of network output and expected output to the “mistakes” of weight and threshold, and through reverse propagation, “sharing” error to the weight and threshold of each nerve cell. The guiding ideology of BP network learning algorithm is that the adjustment of weight and threshold should follow the fastest decline of error function, namely the negative gradient direction.
Take four main influence factors, namely GDP, population, residents’ consumption level and number of urban buses as the input information. Thus, the number of nodes at the input layer of BP network is 4. Select the double-hidden-layer network structure. To speed up the convergence, select 11 hidden nodes at each layer. The network output layer has 1 node, namely the network output is the taxi demand quantity in the same year affected by 4 factors. The hidden layer and input layer use the sigmoid function as the transfer function to form the neural network with the topological structure of 4-11-11-1. The specific structure is shown in Fig.3.
499

Fig. 3 Structure of neural network
To ensure network mapping accuracy and self-learning convergence, and avoid the larger order
error between network weight coefficients and caused by larger difference in numerical values in calculation from affecting the network mapping accuracy and self-learning convergence, in accordance with the continuous function representation theorem, the range of network input variable is required to be [0,1]. To this end, consider “normalization” of input of all samples. The
standardized method of input parameter used is . Wherein, and respectively represent the maximum and minimum of this group of variables.
Use the data from 2004 to 2013 as the training set of the network, namely, four influence factors in n years are used as the input set. The taxi demand quantity in the same year is used as the tutor set based on BP neural network algorithm to predict the taxi demand quantity. After the network is stable through training, it can predict the taxi demand quantity in future five years.
Combine the algorithm design of BP neural network and use the MATLAB software to determine the taxi demand quantity from 2004 to 2013 in Wuhan, and predict the taxi demand quantity from 2014 to 2018. The results are shown in Table 3.
Fig.4 Taxi demand quantity in Wuhan (unit: vehicle)
The above table shows that the taxi demand quantity from 2004 to 2018 in Wuhan shows a rising trend year by year, but the increase is slowing, and in the future years, the demand quantity tends to be stable.
Analysis of Result After the taxi supply quantity and demand quantity from 2004 to 2018 are obtained, the taxi
matching index of Wuhan (as shown in Table 3) from 2004 to 2018 is got with the Eq. 4 of supply and demand matching degree model.
500
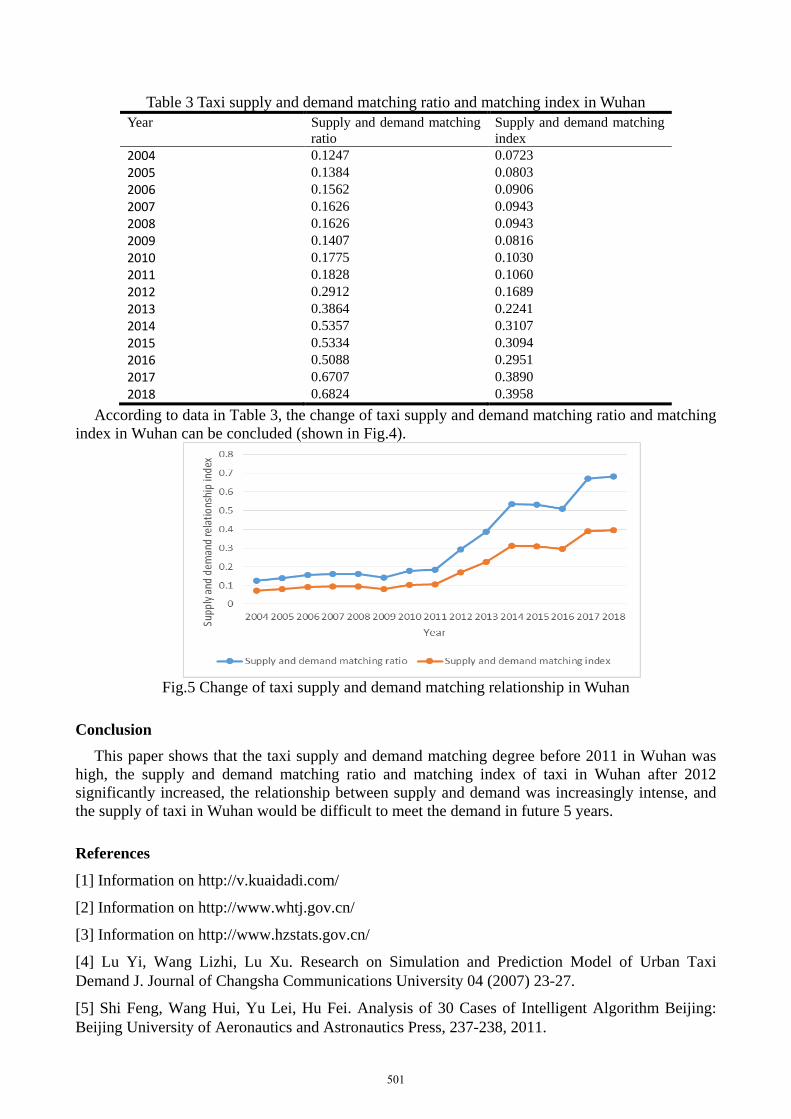
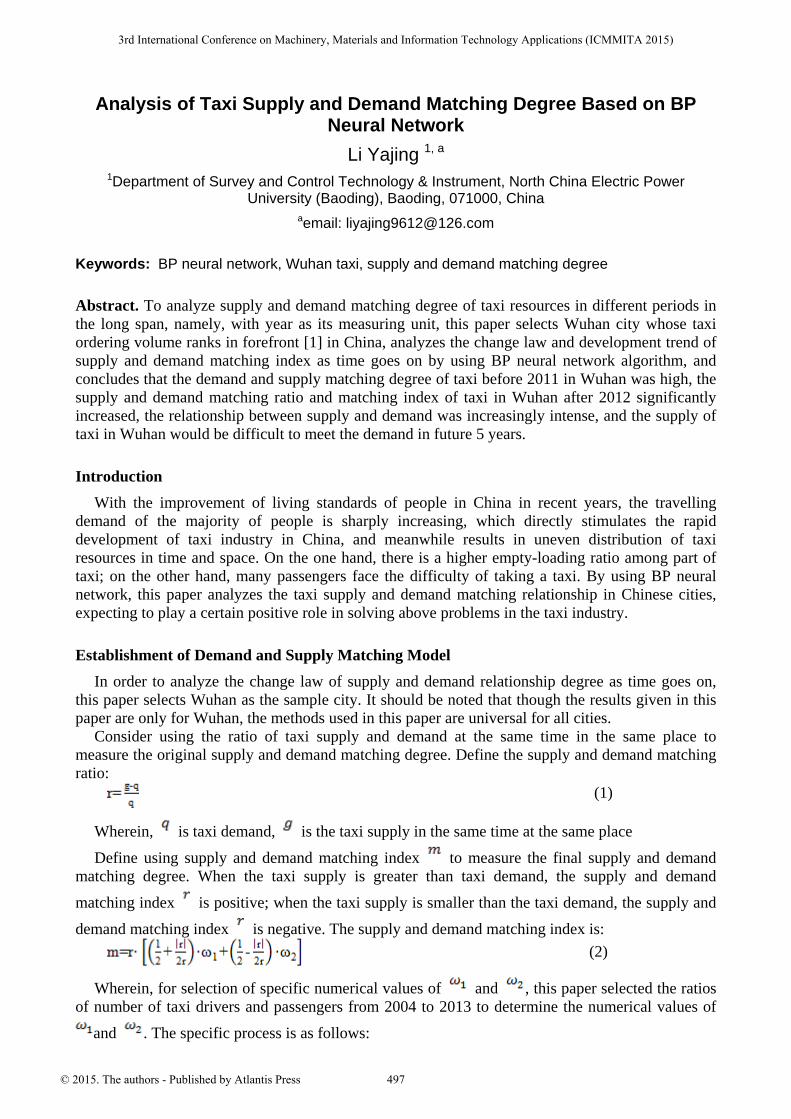
Table 3 Taxi supply and demand matching ratio and matching index in Wuhan Year Supply and demand matching
ratio Supply and demand matching index
2004 0.1247 0.0723 2005 0.1384 0.0803 2006 0.1562 0.0906 2007 0.1626 0.0943 2008 0.1626 0.0943 2009 0.1407 0.0816 2010 0.1775 0.1030 2011 0.1828 0.1060 2012 0.2912 0.1689 2013 0.3864 0.2241 2014 0.5357 0.3107 2015 0.5334 0.3094 2016 0.5088 0.2951 2017 0.6707 0.3890 2018 0.6824 0.3958
According to data in Table 3, the change of taxi supply and demand matching ratio and matching index in Wuhan can be concluded (shown in Fig.4).
Fig.5 Change of taxi supply and demand matching relationship in Wuhan
Conclusion This paper shows that the taxi supply and demand matching degree before 2011 in Wuhan was
high, the supply and demand matching ratio and matching index of taxi in Wuhan after 2012 significantly increased, the relationship between supply and demand was increasingly intense, and the supply of taxi in Wuhan would be difficult to meet the demand in future 5 years.
References
[1] Information on http://v.kuaidadi.com/
[2] Information on http://www.whtj.gov.cn/
[3] Information on http://www.hzstats.gov.cn/
[4] Lu Yi, Wang Lizhi, Lu Xu. Research on Simulation and Prediction Model of Urban Taxi Demand J. Journal of Changsha Communications University 04 (2007) 23-27.
[5] Shi Feng, Wang Hui, Yu Lei, Hu Fei. Analysis of 30 Cases of Intelligent Algorithm Beijing: Beijing University of Aeronautics and Astronautics Press, 237-238, 2011.
501