analysis of tempered bricks: from raw material and
TRANSCRIPT

Analysis of tempered bricks: from raw material and additives to fired bricksfor use in construction and heritage conservation
Natalie SAENZ1, Eduardo SEBASTIÁN2 and Giuseppe CULTRONE2,*
1Department of Chemistry, Columbia University, New York, NY 10027, USA*Corresponding author, e-mail: [email protected]
2Departamento de Mineralogía y Petrología, Universidad de Granada, Avenida Fuentenueva, s/n, 18002 Granada, Spain
Abstract:Throughout history, human civilizations have combined clay soils with additives to produce better brick building material.Recently, bricks have been used as a method of eliminating industrial and agricultural wastes by incorporating the waste into brickraw mixtures. In this paper, the effects of three additives on the clay mixture and the fired bricks have been studied. Clayey soil fromJun (Granada, Spain) was combined with fly-ash, household glass and spent beer grain in manually made bricks fired at 800 �C,950 �C and 1100 �C. Differences in mineral composition, porosity, water behavior, mechanical resistance and color were analyzedthrough chemical, mineralogical, textural and physical analyses. The presence of carbonates in the clayey soil favored the formationof Ca (–Mg) silicates such as gehlenite, diopside and anorthite in the fired bricks. Only bricks with fly ash displayed growth ofsecondary acicular calcite crystals. Overall, the additives altered brick porosity and compactness. Bricks made with added glass werefound to be the most compact and resistant bricks while those made with spent beer grain were the most porous and fragile. Theseresults have important implications for the construction industry and for the conservation of architectural heritage.
Key-words: solid bricks; fly ash; household glass; spent beer grain; mineralogy; texture; physical properties.
1. Introduction
Though humans have been firing clays since the Neolithicperiod about 13 000 BCE, the use of bricks in constructiondeveloped more slowly (Warren, 1999). The resistance offired clay to water was a serious advantage over mud-brick,and the technology spread quickly. For a brief review relat-ing the mechanical and thermal properties of archaeologicaland ethnographic pottery with additives see Tite et al.(2001).Fired bricks are made from clay-rich soils and tend to be
extremely porous, though texture and pore shape depend onthe firing temperature and the mineral composition of thesoil (Hill, 1960; Delbrouck et al., 1993; Cultrone et al.,2004; Karaman et al., 2006). The firing process causeschanges in mineral phases and vitrification of the matrix(Orts et al., 1993; Papargyris et al., 2001). These changesat high temperatures give bricks their characteristic hardnessand strength (Karaman et al., 2006; Johari et al., 2010;Fabbri, 2012). In addition to firing temperature, bricktexture is also heavily dependent on the raw mixture andthe method of production (Dondi et al., 1999a; Sveda,2000; Freyburg & Schwarz, 2007; Murmu & Patel, 2018).Color can depend on the iron content, the presence of impu-rities and the firing atmosphere (Kreimeyer, 1987; Hendry,2001; Fabbri, 2012).Although some brick structures can survive without
restoration for thousands of years, others deteriorate very
quickly. This depends largely on the quality of the brick(Binda & Baronio, 1984; Robinson, 1984). Because claysoil is produced by rock erosion, transport and sedimenta-tion, it lacks homogeneity, and thus different clays vary inplasticity, workability and shrinkage upon drying. Producinggood bricks requires expert knowledge of clay soil compo-sition, tempering agents, production methods, firing temper-ature, and oven technology (Singer & Singer, 1963;Carretero et al., 2002). For example, calcareous clay worksjust as well as non-calcareous clay but the manufacturermust be aware of the simple procedures required to preventlime-blowing, which causes cracks in the bricks after firing(Laird & Worcester, 1956). From a chemical point of view,bricks are practically inert to dissolution processes becausethey are silicate materials (Warren, 1999). In the presenceof water, in liquid or vapor state, the main problem comesfrom carbonates such as calcite, which is a very commonmineral in the clayey soils used as raw materials for brick-making. After firing, any calcite grains that have not reactedwith silicates to form new mineral phases turn into lime(CaO). This is a very reactive oxide and when brick isexposed to humidity, the lime reacts with the water formingportlandite (Ca(OH)2). The increase in volume caused bythis phase change and by the subsequent carbonation ofportlandite into calcite cause the bricks to crack (Laird &Worcester, 1956; Elert et al., 2003).Brick production today generates huge amounts of waste
from quarrying, which also destroys landscapes, and from
Mineral reactivity:from biomineralization and Earth’s climate evolution
to CO2 capture and monument conservation
Eur. J. Mineral.2019, 31, 301–312Published online 9 January 2019
https://doi.org/10.1127/ejm/2019/0031-28320935-1221/19/0031-2832 $ 5.40
� 2019 E. Schweizerbart'sche Verlagsbuchhandlung, 70176 Stuttgart, Germany
2019
0530
-114
853
A48
471/
3030
6/96
D6C
0D4

firing, which consumes energy and can release greenhousegases (Ahmari & Zhang, 2012). These factors explain theincreasing interest in making brick production more envi-ronmentally friendly (Coletti et al., 2016). The use of wasteproducts as additives can reduce the need for quarrying andsolve another environmental problem, the accumulation ofindustrial and agricultural wastes (Bories et al., 2014).Bricks are ideal because they require the same high firingtemperatures many wastes need for safe disposal. Over thelast 20 years, several reviews (Dondi et al., 1997; Rautet al., 2011; Zhang, 2013, Muñoz Velasco et al., 2014) haveanalyzed the use of different toxic waste, sludge, quarry/metallic dust (Shakir et al., 2013), fly ash (Eliche Quesadaet al., 2017), and organic wastes in the manufacture ofnew bricks. The ultimate goal in this line of research wouldbe to incorporate substantial amounts of otherwise burden-some waste products into bricks to make them harder andmore porous. Ideally, additives could also improve raw mix-ture plasticity, reducing the amount of water needed, orincrease local temperatures within the brick, so reducingthe firing temperature required for vitrification (MuñozVelasco et al., 2014).The purpose of this study is to analyze the influences of
certain tempering agents on brick characteristics. This studyquantifies the impact of additives on the clay mixture andthe mineralogical and physical transformations broughtabout by firing, such as changes in mineral phases, thedegree of vitrification, mechanical resistance, water behaviorand color change. In addition to solving an environmentalproblem, these results can enable bricks with specific char-acteristics to be used in new constructions and in restorationwork.
2. Materials and methods
2.1. Materials and additives
The bricks were made out of a clayey soil quarried in Jun(Granada, Spain). Geologically, Jun is situated on the con-tact limit between the Internal and External Zones of theGranada Basin. The Granada Basin occupies the centralportion of the Baetic Cordillera. The area contains Pliocenelacustrine sediments and continental sands and conglomer-ates deposited over Miocene formations characterized bygrayish sediments made up of lime, sands and gravel(Günster & Skowronek, 2001; Vera, 2004). The gray soilwas sieved to remove centimetric rock grains, especiallygypsum. Large clumps of clay were manually broken upand ground.Three types of additives were selected for addition to the
raw material: fly ash, household glass and spent beer grain.They represent common types of industrial, domestic andagricultural waste products. Fly ash was obtained from athermoelectric plant in Cadiz (Spain). Fly ash is the finestfraction of ash produced by coal combustion. It is removedfrom the gases emitted through an electrostatic precipitationprocess (Eliche Quesada et al., 2017). Most studies of flyash have focused on its addition to cement and mortars.Previous research into the use of fly ash as an additive in
bricks has had mixed results, especially regarding brickstrength (Lingling et al., 2005; Fernández-Pereira et al.,2011; Shakir et al., 2013; Abbas et al., 2017). The fly ashused in our research was a soft, dark gray powder with asmall amount of white powder clumps. Common householdglass jars were broken and ground into powder using an ironmortar. Little research has so far been done on the use ofrecyclable household glass as an additive in brick produc-tion. Lin (2007), Phonphuak et al. (2016), Jimenez Millanet al. (2018) and Kazmi et al. (2018) have demonstrated thatbricks with waste glass had enhanced physical–mechanicalproperties. Spent beer grain was obtained from a Granadabeer factory (Spain). This type of residue, also known asbagasse, requires the addition of vitamins when it is recycledas animal feed, soil or fertilizer. Studies with similar wasteproducts such as wheat-straw, corn cob, olive mill solidwaste, rice husk, and sugarcane bagasse have all beenshown to increase the porosity of bricks (Bories et al.,2014, 2015). Though these additives appear to have similareffects on the resulting bricks, Bories et al. (2015) makeclear that the expected mineral content, shrinkage, porosityand water absorption should not be overgeneralized to alltypes of organic wastes. The spent beer grain was dried,manually broken apart and sifted to obtain powder andfibers of less than 1.5 mm. Ideally, if the objective is touse brick production as a means of eliminating waste, thebricks should have a high percentage of added waste. Allthree additives were dosed at a 20 wt%, a value chosenfor comparison purposes because this was the averageamount used in previous research (Bories et al., 2014),and also because 20 wt% was a sufficiently high concentra-tion to make changes in the physical characteristics of thebricks more obvious.
2.2. Preparation of the mixture and firing
The raw mixture was prepared by mixing clay soil and theadditives, both measured by weight. Although measuringthe amount of additive as a percentage of the weight ofthe mixture facilitates comparison with the literature (Zhang,2013; Murmu & Patel, 2018), it made comparison of thedifferent additives studied in this paper more difficult. Forfly ash and glass additions, there were only minimal differ-ences between weight percent and volume percent added.However, calculating the addition of spent beer grain byweight resulted in adding a volume of grain that was twicethat of the clay soil. Water was added after obtaining ahomogenous dry mixture which was then mixed by handuntil the clay was sufficiently plastic to be put into a woodenmold (4� 18� 13 cm). The raw mixture was pressed downfirmly by hand into the interior of the mold to cover thebottom, and the rest of the mixture was added with similarforce until the mold was filled. The top was scraped toobtain a smooth surface. The raw mixture was allowed todry within the mold for approximately one hour before themold was removed. A cotton thread was used to slice theunfired brick into smaller cubes of approximately 4 cm eachside and into rectangular prisms of 4 � 1 � 10 cm. Thecubes and prisms were separated from one another after
302 N. Saenz et al.
2019
0530
-114
853
A48
471/
3030
6/96
D6C
0D4
one day of drying to prevent deformation. Before dryingwas complete, some of the samples were smoothed with afile to remove rough edges. Twelve types of bricks weretested: they were labeled as BN, BA, BG and BS to distin-guish bricks with no additives from those with fly ash,household glass and spent beer grain, respectively. Eachof these labels is followed by the numbers 8, 9 or 1 in ref-erence to the temperatures at which we decided to fire thebricks: 800 �C, 950 �C and 1100 �C. Bricks factories nor-mally fire at approximately 950 �C. The other temperatureswere chosen to enable us to study the mineralogical andphysical evolution of the bricks over a range of 300 �C.Firing was carried out in oxidizing conditions in a HerotecCR-35 electric oven. Unfired bricks were placed inside theoven without touching the sides or other bricks. The temper-ature was first set to 100 �C to rid the bricks of any residualdampness which might cause them to crack due to rapidevaporation. After one hour, the temperature was increasedfrom 100 �C to 400 �C at a rate of approximately 30 �C/min.From 400 �C onwards, the temperature was increased moreslowly at approximately 5 �C/min until the desired firingtemperature was reached. The oven was then turned off.After firing, bricks were immersed in water for over halfan hour to prevent cracking from lime-blowing in casecarbonates were present (Laird & Worcester, 1956).
2.3. Analytical techniques
The chemistry of the raw material, the fly ash and the firedsamples was studied using X-ray fluorescence. A PhilipsMagix Pro PW-2440 spectrometer with an ultrafine Rhanode and a 4 kV X-ray generator was used to analyzemajor and trace elements. Prior to the analysis, 5 g persample was ground into powder. The accuracy of analyticalresults was evaluated by comparison with certified valuesfor analyzed reference materials (Govindaraju, 1994). Typi-cal accuracy is higher than 1.5% relative to a concentrationof 10%. Loss on ignition was determined gravimetrically asthe weight loss was recorded between 110 �C and 1000 �C.The De Jongh model (1973) was followed to convert theintensities into concentrations using Alpha-coefficients.The identification of the mineral phases in the raw mate-
rial and the fired bricks with and without additives was car-ried out by powder X-ray diffraction (PXRD). Samples wereanalyzed by a Philips X’Pert PRO diffractometer with CuKaradiation (k = 1.5405 Å), 45 kV voltage, 40 mA current,3–60� 2h explored area and 0.1� 2h s�1 goniometer speed.The interpretation of results was performed using theXPowderX computer program (Martin, 2016). Quantitativeanalysis of the mineral phases was performed using thenon-linear least square method to fit full-profile diffrac-tograms and the results were compared with standard valuesin the database. The Deradifdata database (University ofArizona) (http://www.geo.arizona.edu/~downs/xtal/InXitu/Deradifdata.txt) and the Pattern Intensity Ratio (PIR) factormethod were used to identify and quantify the mineralphases and to obtain the amorphous versus crystallinephases (a/c) ratio. This ratio is based on the mean value of
the intensities, standard deviation and area of the crystalreflection (Martin, 2016).A FEI high-resolution environmental scanning electron
microscope (FEG-ESEM) with QUEMSCAN 650F oper-ated at 5 kV was used to analyze carbon-coated brickfragments. Energy dispersive X-ray (EDX) analysis wasused for elemental analysis of crystals within the fragments.A detailed mineralogical study was performed by means
of a transmission electron microscope (TEM) PhilipsCM20 operating at 200 kV and equipped with an EDAXsolid-state energy-dispersive X-ray detector. Powder sam-ples were deposited on carbon-coated Cu grids. Quantitativechemical analyses were obtained in STEM mode using ascan window of 20 � 100 nm. Muscovite, albite, biotite,spessartine, olivine and titanite standards were used toobtain k-factors for the transformation of intensity ratios toconcentration ratios according to Cliff & Lorimer (1975).Physical assays with water were performed using three
bricks from each sample group under controlled temperatureand hygrometric conditions (22 �C and relative humidity of35%). Free and forced water absorption (UNE-EN 13755,2008), drying (NORMAL 29/88, 1988) and capillarity tests(UNE-EN 1925, 2000) were carried out, enabling us toascertain the degree of pore interconnection (Cultroneet al., 2003), the drying index, the saturation coefficient,apparent and real densities, the open porosity and the capil-lary coefficient (RILEM, 1980). Cubic samples were usedfor absorption-drying tests and prism-shaped samples forthe capillarity test.The compactness of the bricks was measured using a
Control 58-E4800 ultrasonic pulse velocity tester with54 kHz transducers and a contact surface of 3 cm in diam-eter. A viscoelastic gel was used to obtain a good couplingbetween the transducers and brick surfaces. The speed ofP waves was measured on three bricks from each samplegroup. The transmission method was used in accordancewith the ASTM D2845 standard (2005) on dry cubicsamples in three orthogonal directions: VP1 is the velocityperpendicular to the compaction plane of the raw materialin the wooden box and VP2 and VP3 are the velocities parallelto it. The total and relative anisotropies (DM and Dm,Guydader & Denis, 1986) were also calculated.A SINT Technology DRMS (Drilling Resistance
Measurement System) Cordless was used to measure brickresistance by microdrilling. The drill (5 mm in diameter, withflat diamond head) was set to bore 10 mm at 300 r/min with apenetration speed of 20 mm/min. Samples from each groupwere drilled a minimum of three times for each face.Finally, the color of the bricks was measured by spec-
trophotometry in accordance with the UNE-EN 15886standard (2011) in order to quantify any changes producedby additives or firing temperatures. A Konica-MinoltaCM-700d spectrophotometer was used for this purposeand the results were analyzed with SpectraMagic NXsoftware. The working conditions were: circular measure-ment area of 8 mm diameter, D65 illuminant, 10� visionangle, SCI/SCE mode and light radiation range between400 nm and 700 nm. The CIELab space color was used.
Mineralogy and physical properties of bricks with wastes 303
2019
0530
-114
853
A48
471/
3030
6/96
D6C
0D4

Three measurements per brick type were performed. To com-pare the color of the samples with additives to those withoutadditives, the color difference (DE) was determined accord-ing to the following equation:
E ¼ffiffiffiffiffiffiffiffiffiffiffiffiffiffiffiffiffiffiffiffiffiffiffiffiffiffiffiffiffiffiffiffiffiffiffiffiffiffiffiffiffiffiffiffiffiffiffiffiffiffiffiffiffiffiffiffiffiffiffiffiffiffiffiffiffiffiffiffiffiffiffiffiffi
L�1 � L�
2
� �2 þ a�1 � a�2ð Þ2 þ b�1 � b�2� �2
q
; ð1Þ
where L�1, a
�1, b
�1 are the lightness and chromaticity values
for the bricks without additives and L�2, a
�2, b
�2 are those for
bricks with additives.
3. Results
3.1. Macroscopic observations of unfiredand fired bricks
The mixture with fly-ash was very sticky, as was the clayeysoil with no additives. The addition of fly ash resulted in avery dense mixture with fairly good plasticity, whichdecreased the workability. Linear drying shrinkage wasbetween 3% and 6%. Because the spent beer grain was verylight (and added by wt%) and the fibers readily absorbedwater, a comparatively larger volume of water was neededfor mixing. The grain fibers made slicing the clay mixturewith thread more difficult. Linear drying shrinkage wasapproximately 2%. Some of the glass was not fullypowdered which made the raw material rougher. The mix-ture with glass was very dense though not overly difficultto work with. Tiny reflective bits of glass could be seen inthe unfired bricks. Linear drying shrinkage for bricks withglass was between 2% and 6%.Fired bricks were distinguishable by the change in color
from gray to pink-red and almost yellow. When soaked inwater, a small amount of precipitate was released whichwas later identified with PXRD as calcite. The expansiondue to firing was minimal, approximately 1% for most sam-ples. Bricks tempered with fly ash (BA) and fired at 800 �Cand 950 �C were covered on all faces by a thin light-graylayer identified by PXRD as calcite. The spent grain withinthe bricks burnt away as could be verified both by the smellemitted from the oven during firing and visually by the holesleft in the bricks (BS). The surfaces of the spent grain bricksturned out to be very delicate and in particular those fired atlower temperature, which suffered a loss of material whenpicked up. In the bricks made with added glass (BG), thelarger bits of glass visible in the mixture remained visibleafter firing.All the bricks, especially those made with spent-grain
(BS), were noticeably lighter after firing. Figure 1 showsthe percentage weight loss of the bricks after firing. Thespent-grain bricks lost much more weight than any othertype of brick because of the burnt organic matter. Regardlessof their firing temperature, the bricks with spent grain lostapproximately 21–22% of their initial mass. The bricksmade with ash (BA) or glass (BG) lost less weight thanthe bricks without any additives (BN). Weight loss in thesebricks is due to the decomposition of carbonates and thedehydroxylation of phyllosilicates, minerals that appear insmaller quantities in the bricks containing fly ash or glass.
The additives had a greater impact on weight loss than thefiring temperature, since higher firing temperatures did notalways result in greater weight loss.
3.2. Chemistry and mineralogy of bricks
Bulk chemical analysis of clay soil, fly ash and fired samplesshows that the major compound present is SiO2 followed byAl2O3 (Table 1). The presence of CaO in amounts greaterthan 6% means that the clay soil can be classified as calcare-ous (Tite et al., 2001). The fly ash is very similar in chem-ical terms to the clay soil, which is why the fly ash bricks(BA) have a similar mineral composition to those madewithout additives. The bricks made with glass have slightlylower percentages of Al2O3 and higher percentages ofNa2O. The chemical analysis of trace elements shows thatthe fly ash has many more trace metals, which explainwhy the bricks made with fly ash have a higher metal con-tent. In this sense, the bricks made with glass or spent beergrain are more similar to the bricks without additives.The PXRD analysis reveals that the clay soil is rich in
quartz and also contains gypsum, calcite and lesser amountsof dolomite, both alkali feldspar and plagioclase, andphyllosilicates. The phyllosilicates are composed of illite/muscovite, chlorite and paragonite. Many of these mineralsunderwent pyrometamorphism during the firing process.Overall, the additives did not have a huge influence on the
mineral phase changes, as the percentages of each mineraldid not vary significantly between samples with differentadditives fired at the same temperature (Table 2). Quartz isthe most common mineral phase. Its concentration decreasesas the firing temperature increases because the grain bound-aries of this tectosilicate react to form new mineral phases.It has been demonstrated that this reduction is usually morepronounced in bricks made with carbonate-rich soils(Dondi et al., 1999b; El Ouahabi et al., 2015). For bricksfired at 800 �C and 950 �C, quartz continues to be the mostcommon mineral. For samples fired at 1100 �C, anorthiteand diopside are just as or more abundant than quartz(Table 2). Chlorite and paragonite disappear completely with
Fig. 1. Average weight loss (in %) of bricks without additives (BN)and with added fly ash (BA), household glass (BG) and spent beergrain (BG) after firing. Error bars indicate maximum and minimumvalues.
304 N. Saenz et al.
2019
0530
-114
853
A48
471/
3030
6/96
D6C
0D4

firing. The illite/muscovite phase diminishes in concentra-tion with increased firing temperature and is not present at1100 �C. After firing at 800 �C, dolomite had already disap-peared except in the bricks made with glass (BG), probablybecause of large crystals that did not decompose completely.Calcite remains present, albeit at a lower concentrationcompared to the clay soil. Above 800 �C, calcium carbonate
decomposes into CaO and CO2 and is not present in bricksfired at 950 �C. Instead, new calcium-rich silicate mineralsappear, such as gehlenite (Ca2Al2SiO7), which developsfrom the reaction between calcite and silicates (either illiteor K-feldspar) (Cultrone et al., 2001). At 1100 �C, diopside(CaMgSi2O6) also develops from the reaction between dolo-mite and quartz (Cultrone et al., 2001). The bricks made
Table 1. X-ray fluorescence bulk chemical analysis of clay soil, fly-ash, and fired brick samples without additives (BN), and with added flyash (BA), glass (BG) and spent beer grain (BS) fired at 800 �C (8), 950 �C (9) and 1100 �C (1). Major elements are expressed in percentages(%), trace elements in ppm. LOI is the percent weight lost on ignition. Data are normalized to 100% (LOI free).
Clay soil Fly ash BN8 BN9 BN1 BA8 BA9 BA1 BG8 BG9 BG1 BS8 BS9 BS1
SiO2 50.66 57.23 48.77 48.76 48.26 50.56 49.29 49.60 50.83 50.20 56.31 47.62 46.96 47.33Al2O3 20.62 20.27 19.43 18.89 18.60 20.17 19.46 19.54 18.29 17.34 13.08 19.28 18.67 18.99Fe2O3 6.29 7.26 6.47 6.57 6.66 6.55 6.70 6.77 5.92 5.83 5.65 6.46 6.58 6.67MnO 0.08 0.07 0.09 0.10 0.10 0.09 0.08 0.09 0.08 0.09 0.08 0.10 0.09 0.10MgO 4.31 1.51 5.63 6.01 6.55 4.53 5.56 5.71 5.06 5.90 4.60 5.87 6.44 6.40CaO 13.01 9.24 14.79 14.86 15.22 13.33 14.37 13.91 14.32 14.81 13.94 15.09 15.86 15.15Na2O 0.81 0.96 0.64 0.73 0.73 0.71 0.74 0.82 1.58 2.59 2.98 0.65 0.74 0.75K2O 3.28 2.30 3.27 3.17 2.94 3.13 2.83 2.59 3.06 2.42 2.56 3.29 3.07 2.88TiO2 0.85 1.01 0.81 0.82 0.83 0.84 0.86 0.87 0.77 0.74 0.73 0.79 0.79 0.82P2O5 0.09 0.15 0.10 0.10 0.11 0.11 0.11 0.12 0.09 0.09 0.07 0.85 0.78 0.91
V 152.2 306.8 144.8 145.6 134.1 156.6 162.6 149.6 187.1 189.4 192.2 157.1 162.4 162.5Cr 83.4 113.5 76.2 78.3 79.4 78.4 79.9 84.8 87.7 89.6 91.1 80.8 84.3 84.4Co 20.0 25.3 17.9 21.0 10.5 20.2 17.2 21.6 24.6 14.2 22.2 16.4 25.7 18.6Ni 39.3 63.0 35.9 36.9 37.1 43.8 44.3 44.1 47.7 49.3 50.1 42.2 44.6 46.1Cu 20.1 54.9 21.5 19.4 21.2 25.8 25.7 26.7 34.2 33.7 33.6 31.0 33.6 32.1Zn 74.5 150.7 69.7 71.2 71.5 83.8 84.7 84.2 100.4 104.6 103.2 98.5 97.4 76.3Ga 16.0 19.1 14.9 15.1 14.8 18.7 18.5 18.5 18.7 19.2 19.1 17.9 18.4 19.1As 22.4 26.6 19.4 20.8 21.5 25.3 23.7 24.9 25.3 26.8 25.5 23.5 26.0 12.2Cd 0.3 0.6 0.6 0.7 0.8 0.8 0.9 0.8 0.7 1.0 0.9 0.8 0.9 1.0Zr 172.6 187.0 190.9 205.1 208.5 194.1 212.8 208.7 171.6 186.9 187.5 188.5 203.7 206.1Nb 13.4 12.7 11.8 12.2 12.4 15.6 15.6 16.0 15.4 16.0 15.6 15.1 16.0 16.1Mo 1.5 8.1 1.3 1.4 1.5 1.8 1.6 1.9 3.0 3.2 3.0 2.0 2.3 1.8Ba 409.5 703.8 406.5 415.6 425.3 436.3 467.1 438.4 484.1 530.1 518.9 422.8 453.8 475.3Pb 16.6 22.7 18.5 18.1 18.4 19.2 20.2 19.9 20.8 22.4 22.0 19.9 11.3 4.7LOI 14.30 5.14 4.54 1.43 0.34 3.81 1.03 0.13 5.07 0.75 0.16 5.84 0.50 0.08
Table 2. Mineralogical composition by PXRD of the brick samples with and without additives. Qtz = quartz (789), Ill/Ms = illite/muscovite(2013), Cal = calcite (98), Dol = dolomite (86), Anh = anhydrite (5117), Hem = hematite (143), Mc = microcline (5216), Or = orthoclase(313), Sa = sanidine (18062), Ab = albite (536), An = anorthite (370), Geh = gehlenite (5090), Di = diopside (1334), a/c = amorphous-crystalline ratio. AMCSD codes are indicated in brackets after each mineral name. Mineral abbreviations after Whitney & Evans (2010).
BN8 BN9 BN1 BA8 BA9 BA1 BG8 BG9 BG1 BS8 BS9 BS1
Qtz 39.6 35.6 24.0 41.7 37.6 26.3 31.4 36.2 13.1 37.0 36.4 17.2Ill/Ms 8.8 7.9 10.0 8.0 10.5 6.7 12.9 5.7Cal 2.6 3.3 7.4 6.0Dol 4.9Anh 6.0 6.5 7.1 6.2 4.0 2.6 6.9 9.8 7.0 5.6 6.8 5.0Hem 1.2 1.5 1.6 1.7 1.9 1.1 1.2 1.6 0.8 1.4 1.6 1.1Mc 14.8 18.8 8.8 15.1Or 17.6 11.4 7.5 18.3 11.2 11.1 5.9Sa 9.2 7.0 7.0 6.6 7.5 4.7 5.3 8.5Ab 9.4 10.7 10.5 11.0An 21.4 40.8 24.5 47.2 24.3 45.8 26.5 50.0Geh 6.5 11.0 8.7 7.4 10.2 4.3 11.8 6.7Di 8.6 9.0 24.3 11.5a/c 0.067 0.073 0.124 0.075 0.095 0.104 0.081 0.100 0.320 0.062 0.091 0.181
Mineralogy and physical properties of bricks with wastes 305
2019
0530
-114
853
A48
471/
3030
6/96
D6C
0D4

with glass (BG) had larger amounts of diopside than theother groups. Glass seems to enhance a carbonate–silicatereaction. In fact, BG1 has the lowest quartz content (Table 2).Feldspars also undergo transformation upon firing. Potas-sium feldspars display notable structural changes frommicrocline (triclinic), present before firing and in bricks firedat 800 �C, to orthoclase (monoclinic), present in bricks firedat 800 �C and 950 �C, and finally to sanidine (monoclinic)present in bricks fired at 950 �C and 1100 �C. Plagioclasesalso change composition from Na-rich crystals (albite) at800 �C to a Ca-rich phase (anorthite) at 950 �C and1100 �C. As mentioned previously, anorthite is the mostabundant phase detected by PXRD at 1100 �C. The gypsumpresent in the clay soil was converted into anhydrite, thedehydrated phase, in the fired bricks. Hematite was detectedin all samples. Calcareous clays are known to start to vitrifyat lower temperatures than non-calcareous soils since calciteand dolomite act as melting agents (Cultrone et al., 2001;Trindade et al., 2009; Fabbri et al., 2014). Interestingly, inall the samples the ratio between amorphous and crystallinephases increased with higher temperatures, which suggests agradual increase of matrix vitrification. Bricks with addedglass had the highest ratio values (Table 2).
3.3. Texture
Secondary-electron ESEM images show the morphology ofthe bricks at the microscopic level, the degree of vitrifica-tion, and the development of new mineral phases. Thepresence of (or reliefs from in the case of spent beer grain)additives can clearly be recognized in the samples. In gen-eral, lower temperature samples have rougher surfaces withmany small laminar sheets of clay. These phyllosilicatesheets fuse at higher temperatures, which means that thebricks fired at 950 �C and 1100 �C have smoother, glassiertextures and show the development of new crystal phases.Bricks without additives clearly demonstrate the process
of phyllosilicate melting and vitrification. BN8 and BN9 con-tain small spherical particles (Fig. 2a) which, when analyzedby EDX, were identified as Mg. These particles probablyresulted from decomposed dolomite grains. These bricks alsocontain phyllosilicate laminae that have fanned out from theiroriginal stacked formation due to the heat. The formation ofsecondary porosity by bubbles of escaping gases can clearlybe seen in BN1 (Fig. 2b). In the top left-hand corner of thisimage we can see melted phyllosilicates, a common occur-rence in the samples fired at 950 �C and 1100 �C.In the samples made with fly ash (BA), the ash particles
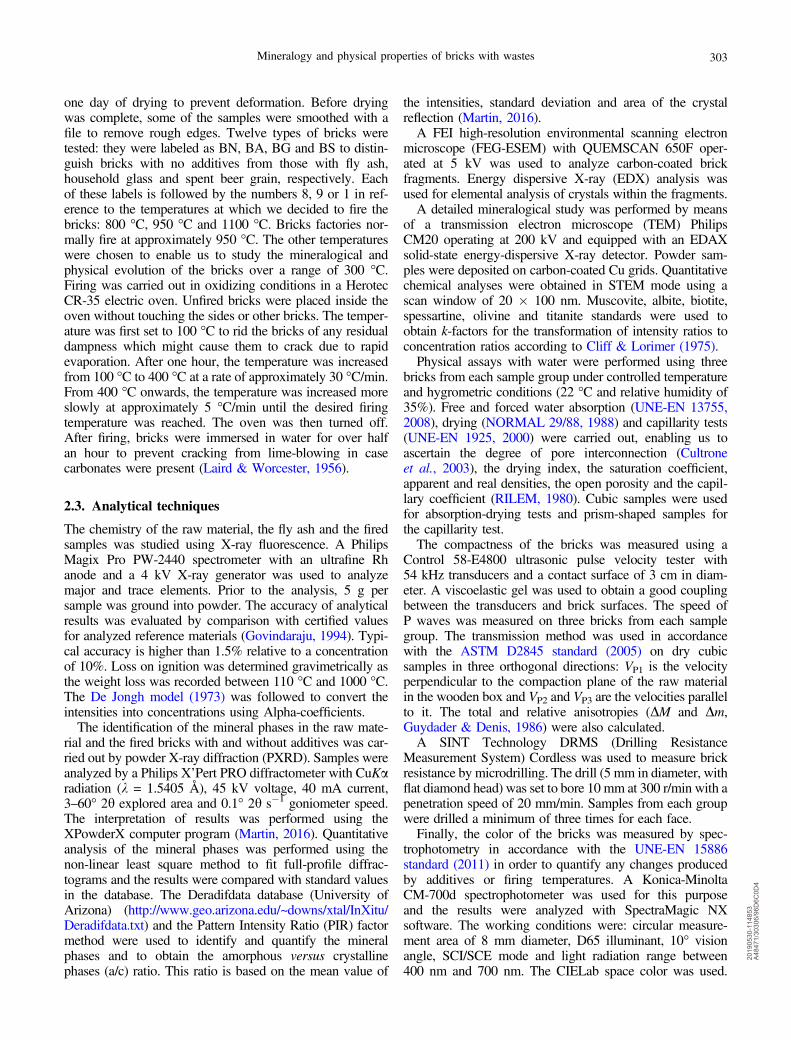
appear as spheres that vary in size from approximately 1 to10 lm in diameter. In bricks fired at 800 �C and 950 �C,fly ash spheres and elongated crystals with prismatic trigonalhabits are interspersed throughout the clay matrix (Fig. 2c).At 950 �C these crystals show an irregular morphology withrougher surfaces still maintaining a strong developmentalong their ternary axis (Fig. 3a). The ESEM-EDX analysiswas unable to define the chemical composition of thesecrystals due to their size. These crystals are no longer presentin bricks fired at 1100 �C (Fig. 2d) and the clay matrix hasfused with the spheres. BA was the only brick group in
which these acicular crystals appeared, which means thatfly ash was involved in their formation. TEM-AEM wasimplemented to identify the mineralogy and compositionof these crystals and explain their formation. Figure 3b showstwo acicular crystals of about 500 nm observed under theTEM. The AEM analysis indicates that these crystals arecalcium-rich (Fig. 3c) and electron diffraction demonstratesthat they are calcite (Fig. 3d). The ESEM images showed thatthese crystals grew with their c-axis normal to the (001) basalplane of partially melted phyllosilicate platelets (Fig. 3a,inset). These observations, suggesting an oriented crystalliza-tion of calcite onto phyllosilicates, are consistent with theresults by Stephens et al. (2010), who demonstrated theepitactic growth of calcite on the (001) plane of partiallyweathered muscovite crystals at ambient humidity. In ourcase, illite/muscovite crystals are clearly much moredamaged since they are dehydroxylated and partially melted,but it is significant that calcite grew on the tetrahedral layersof mica crystals that underwent firing at 800 �C and 950 �C.Considering that calcite decomposition begins around 600 �C and is completed at ~850 �C (Rodriguez Navarro et al.,2009), its formation most likely took place after firing,i.e. during cooling or when samples were soaked in waterto prevent lime blowing. It is possible that not all Ca presentin fly ash was involved in phase reactions (i.e., formation ofhigh-T Ca-silicates) since ash spheres appear intact at 800 �Cand 950 �C (Fig. 2c). During cooling or, more probably,during water immersion when a large amount of water comesinto contact with the bricks, it seems that the Ca presenteither as CaO or Ca(OH)2 is released, so enabling the growthof calcite as acicular crystals. In fact, we observed a rapidincrease in pH from 7.87 to 9.70 when fly ash was addedto the kneading water. The irregular morphology with roughsurfaces of calcite is similar to the dendritic morphologydescribed by Tiller (1991) and suggests that calcite growthtook place quickly. At 1100 �C ash spheres lose their smoothmorphology and begin to fuse to the matrix. At this temper-ature, the ions are highly mobile which favors the incorpora-tion of all available Ca in the BA bricks to form new silicates(gehlenite, diopside and, above all, anorthite), thus prevent-ing secondary calcite crystallization after firing. This wouldalso explain why the grayish layer develops at 800 �C and950 �C but not at 1100 �C.In the bricks made with glass fired at 800 �C (samples
BG8), angular fragments of glass were identified. At950 �C, the vitrification of the matrix begins as manifestedin a melted “dripping” appearance (Fig. 2e). The vitrificationprovokes the formation of rounded pores with smoothsurfaces seen in the samples fired at 1100 �C. The highesttemperature spurs the formation of new crystals that grow“frame” first, i.e. skeletal-growth (Fig. 2f), which suggests arapid growth and high degrees of supersaturation. The EDXanalysis of these crystals identified a combination of Si, Mgand Ca, which suggests that the crystals are most likelydiopside.The ESEM images of the samples prepared with spent
beer grain show how the organic material has been burntaway, leaving enormous pores with the imprint of the beergrain vegetable-like fiber (Fig. 2g). For bricks fired at
306 N. Saenz et al.
2019
0530
-114
853
A48
471/
3030
6/96
D6C
0D4

950 �C, macropores with plant reliefs are still visible, but inthe bricks fired at 1100 �C the surface is smooth and con-tains micropores from crystals that have melted together.Moreover, at 1100 �C, the surface shows signs of newprismatic crystal formation (Fig. 2h). The EDX analysis(detection of Si, Mg and Ca) indicates that these crystalsare again diopside. In the beer grain bricks, diopside crystalsvary in size according to their position. On the inner sectionof the surface in Fig. 2h, a few large crystals can be seen,while large numbers of small crystals form on the outside.This difference in growth probably depends on the mineralconcentrations at the crystal nucleation phase. The smallercrystals on the outside were formed due to the many nucle-
ation points available because of the abundance of ions. Theinner section has fewer nucleation sites and larger crystalsare formed by ions that slowly seep into and enlarge thecrystals.
3.4. Physical tests
Hydric assays are a basic way to measure brick density,porosity and degree of connection, among other standardcoefficients shown in Table 3. Bricks without additives pre-sent fairly high ranges of water absorption (Ab and Af,Table 3), absorbing approximately a quarter of their weightin water. The addition of fly ash results in more absorbent
Fig. 2. Secondary-electron ESEM images of bricks with and without additives fired between 800 �C and 1100 �C. (a) BN9 general viewwith deformed phyllosilicate sheets and decomposition of carbonate grains; (b) BN1 smooth surface and rounded pores from bubbles.A partially-melted phyllosilicate can be seen in the top left-hand corner; (c) BA9 general view with ash spheres and acicular crystals;(d) BA1 brick has a smooth surface and newly formed rounded pores. The matrix fusing to ash spheres with rough surfaces can also be seen;(e) BG9 smooth texture with the presence of secondary pores and melting of the matrix; (f) BG1 close-up of randomly oriented prismaticcrystals; (g) BS8 general view of macropore and fiber plant relief; (h) BS1 detail of smooth surface and new mineral formation.
Mineralogy and physical properties of bricks with wastes 307
2019
0530
-114
853
A48
471/
3030
6/96
D6C
0D4
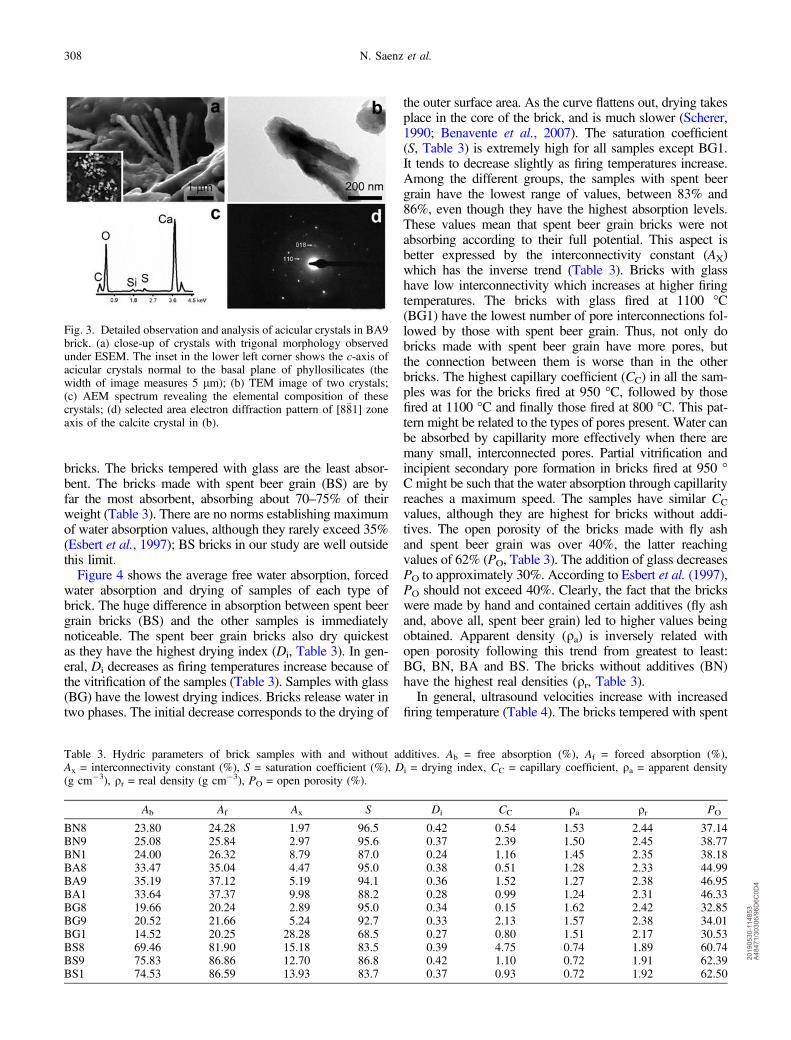
bricks. The bricks tempered with glass are the least absor-bent. The bricks made with spent beer grain (BS) are byfar the most absorbent, absorbing about 70–75% of theirweight (Table 3). There are no norms establishing maximumof water absorption values, although they rarely exceed 35%(Esbert et al., 1997); BS bricks in our study are well outsidethis limit.Figure 4 shows the average free water absorption, forced
water absorption and drying of samples of each type ofbrick. The huge difference in absorption between spent beergrain bricks (BS) and the other samples is immediatelynoticeable. The spent beer grain bricks also dry quickestas they have the highest drying index (Di, Table 3). In gen-eral, Di decreases as firing temperatures increase because ofthe vitrification of the samples (Table 3). Samples with glass(BG) have the lowest drying indices. Bricks release water intwo phases. The initial decrease corresponds to the drying of
the outer surface area. As the curve flattens out, drying takesplace in the core of the brick, and is much slower (Scherer,1990; Benavente et al., 2007). The saturation coefficient(S, Table 3) is extremely high for all samples except BG1.It tends to decrease slightly as firing temperatures increase.Among the different groups, the samples with spent beergrain have the lowest range of values, between 83% and86%, even though they have the highest absorption levels.These values mean that spent beer grain bricks were notabsorbing according to their full potential. This aspect isbetter expressed by the interconnectivity constant (AX)which has the inverse trend (Table 3). Bricks with glasshave low interconnectivity which increases at higher firingtemperatures. The bricks with glass fired at 1100 �C(BG1) have the lowest number of pore interconnections fol-lowed by those with spent beer grain. Thus, not only dobricks made with spent beer grain have more pores, butthe connection between them is worse than in the otherbricks. The highest capillary coefficient (CC) in all the sam-ples was for the bricks fired at 950 �C, followed by thosefired at 1100 �C and finally those fired at 800 �C. This pat-tern might be related to the types of pores present. Water canbe absorbed by capillarity more effectively when there aremany small, interconnected pores. Partial vitrification andincipient secondary pore formation in bricks fired at 950 �C might be such that the water absorption through capillarityreaches a maximum speed. The samples have similar CCvalues, although they are highest for bricks without addi-tives. The open porosity of the bricks made with fly ashand spent beer grain was over 40%, the latter reachingvalues of 62% (PO, Table 3). The addition of glass decreasesPO to approximately 30%. According to Esbert et al. (1997),PO should not exceed 40%. Clearly, the fact that the brickswere made by hand and contained certain additives (fly ashand, above all, spent beer grain) led to higher values beingobtained. Apparent density (qa) is inversely related withopen porosity following this trend from greatest to least:BG, BN, BA and BS. The bricks without additives (BN)have the highest real densities (qr, Table 3).In general, ultrasound velocities increase with increased
firing temperature (Table 4). The bricks tempered with spent
Fig. 3. Detailed observation and analysis of acicular crystals in BA9brick. (a) close-up of crystals with trigonal morphology observedunder ESEM. The inset in the lower left corner shows the c-axis ofacicular crystals normal to the basal plane of phyllosilicates (thewidth of image measures 5 lm); (b) TEM image of two crystals;(c) AEM spectrum revealing the elemental composition of thesecrystals; (d) selected area electron diffraction pattern of [8�81] zoneaxis of the calcite crystal in (b).
Table 3. Hydric parameters of brick samples with and without additives. Ab = free absorption (%), Af = forced absorption (%),Ax = interconnectivity constant (%), S = saturation coefficient (%), Di = drying index, CC = capillary coefficient, qa = apparent density(g cm�3), qr = real density (g cm�3), PO = open porosity (%).
Ab Af Ax S Di CC qa qr PO
BN8 23.80 24.28 1.97 96.5 0.42 0.54 1.53 2.44 37.14BN9 25.08 25.84 2.97 95.6 0.37 2.39 1.50 2.45 38.77BN1 24.00 26.32 8.79 87.0 0.24 1.16 1.45 2.35 38.18BA8 33.47 35.04 4.47 95.0 0.38 0.51 1.28 2.33 44.99BA9 35.19 37.12 5.19 94.1 0.36 1.52 1.27 2.38 46.95BA1 33.64 37.37 9.98 88.2 0.28 0.99 1.24 2.31 46.33BG8 19.66 20.24 2.89 95.0 0.34 0.15 1.62 2.42 32.85BG9 20.52 21.66 5.24 92.7 0.33 2.13 1.57 2.38 34.01BG1 14.52 20.25 28.28 68.5 0.27 0.80 1.51 2.17 30.53BS8 69.46 81.90 15.18 83.5 0.39 4.75 0.74 1.89 60.74BS9 75.83 86.86 12.70 86.8 0.42 1.10 0.72 1.91 62.39BS1 74.53 86.59 13.93 83.7 0.37 0.93 0.72 1.92 62.50
308 N. Saenz et al.
2019
0530
-114
853
A48
471/
3030
6/96
D6C
0D4
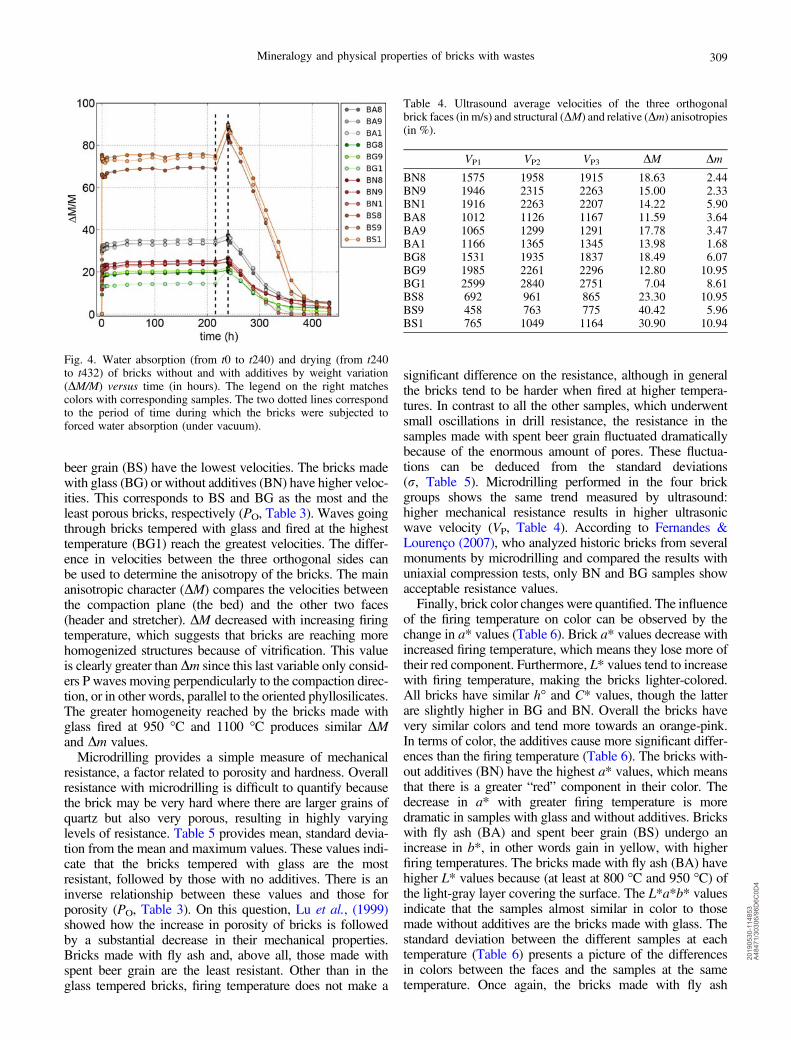
beer grain (BS) have the lowest velocities. The bricks madewith glass (BG) or without additives (BN) have higher veloc-ities. This corresponds to BS and BG as the most and theleast porous bricks, respectively (PO, Table 3). Waves goingthrough bricks tempered with glass and fired at the highesttemperature (BG1) reach the greatest velocities. The differ-ence in velocities between the three orthogonal sides canbe used to determine the anisotropy of the bricks. The mainanisotropic character (DM) compares the velocities betweenthe compaction plane (the bed) and the other two faces(header and stretcher). DM decreased with increasing firingtemperature, which suggests that bricks are reaching morehomogenized structures because of vitrification. This valueis clearly greater thanDm since this last variable only consid-ers P waves moving perpendicularly to the compaction direc-tion, or in other words, parallel to the oriented phyllosilicates.The greater homogeneity reached by the bricks made withglass fired at 950 �C and 1100 �C produces similar DMand Dm values.Microdrilling provides a simple measure of mechanical
resistance, a factor related to porosity and hardness. Overallresistance with microdrilling is difficult to quantify becausethe brick may be very hard where there are larger grains ofquartz but also very porous, resulting in highly varyinglevels of resistance. Table 5 provides mean, standard devia-tion from the mean and maximum values. These values indi-cate that the bricks tempered with glass are the mostresistant, followed by those with no additives. There is aninverse relationship between these values and those forporosity (PO, Table 3). On this question, Lu et al., (1999)showed how the increase in porosity of bricks is followedby a substantial decrease in their mechanical properties.Bricks made with fly ash and, above all, those made withspent beer grain are the least resistant. Other than in theglass tempered bricks, firing temperature does not make a
significant difference on the resistance, although in generalthe bricks tend to be harder when fired at higher tempera-tures. In contrast to all the other samples, which underwentsmall oscillations in drill resistance, the resistance in thesamples made with spent beer grain fluctuated dramaticallybecause of the enormous amount of pores. These fluctua-tions can be deduced from the standard deviations(r, Table 5). Microdrilling performed in the four brickgroups shows the same trend measured by ultrasound:higher mechanical resistance results in higher ultrasonicwave velocity (VP, Table 4). According to Fernandes &Lourenço (2007), who analyzed historic bricks from severalmonuments by microdrilling and compared the results withuniaxial compression tests, only BN and BG samples showacceptable resistance values.Finally, brick color changes were quantified. The influence
of the firing temperature on color can be observed by thechange in a* values (Table 6). Brick a* values decrease withincreased firing temperature, which means they lose more oftheir red component. Furthermore, L* values tend to increasewith firing temperature, making the bricks lighter-colored.All bricks have similar h� and C* values, though the latterare slightly higher in BG and BN. Overall the bricks havevery similar colors and tend more towards an orange-pink.In terms of color, the additives cause more significant differ-ences than the firing temperature (Table 6). The bricks with-out additives (BN) have the highest a* values, which meansthat there is a greater “red” component in their color. Thedecrease in a* with greater firing temperature is moredramatic in samples with glass and without additives. Brickswith fly ash (BA) and spent beer grain (BS) undergo anincrease in b*, in other words gain in yellow, with higherfiring temperatures. The bricks made with fly ash (BA) havehigher L* values because (at least at 800 �C and 950 �C) ofthe light-gray layer covering the surface. The L*a*b* valuesindicate that the samples almost similar in color to thosemade without additives are the bricks made with glass. Thestandard deviation between the different samples at eachtemperature (Table 6) presents a picture of the differencesin colors between the faces and the samples at the sametemperature. Once again, the bricks made with fly ash
Table 4. Ultrasound average velocities of the three orthogonalbrick faces (in m/s) and structural (DM) and relative (Dm) anisotropies(in %).
VP1 VP2 VP3 DM Dm
BN8 1575 1958 1915 18.63 2.44BN9 1946 2315 2263 15.00 2.33BN1 1916 2263 2207 14.22 5.90BA8 1012 1126 1167 11.59 3.64BA9 1065 1299 1291 17.78 3.47BA1 1166 1365 1345 13.98 1.68BG8 1531 1935 1837 18.49 6.07BG9 1985 2261 2296 12.80 10.95BG1 2599 2840 2751 7.04 8.61BS8 692 961 865 23.30 10.95BS9 458 763 775 40.42 5.96BS1 765 1049 1164 30.90 10.94
Fig. 4. Water absorption (from t0 to t240) and drying (from t240to t432) of bricks without and with additives by weight variation(DM/M) versus time (in hours). The legend on the right matchescolors with corresponding samples. The two dotted lines correspondto the period of time during which the bricks were subjected toforced water absorption (under vacuum).
Mineralogy and physical properties of bricks with wastes 309
2019
0530
-114
853
A48
471/
3030
6/96
D6C
0D4
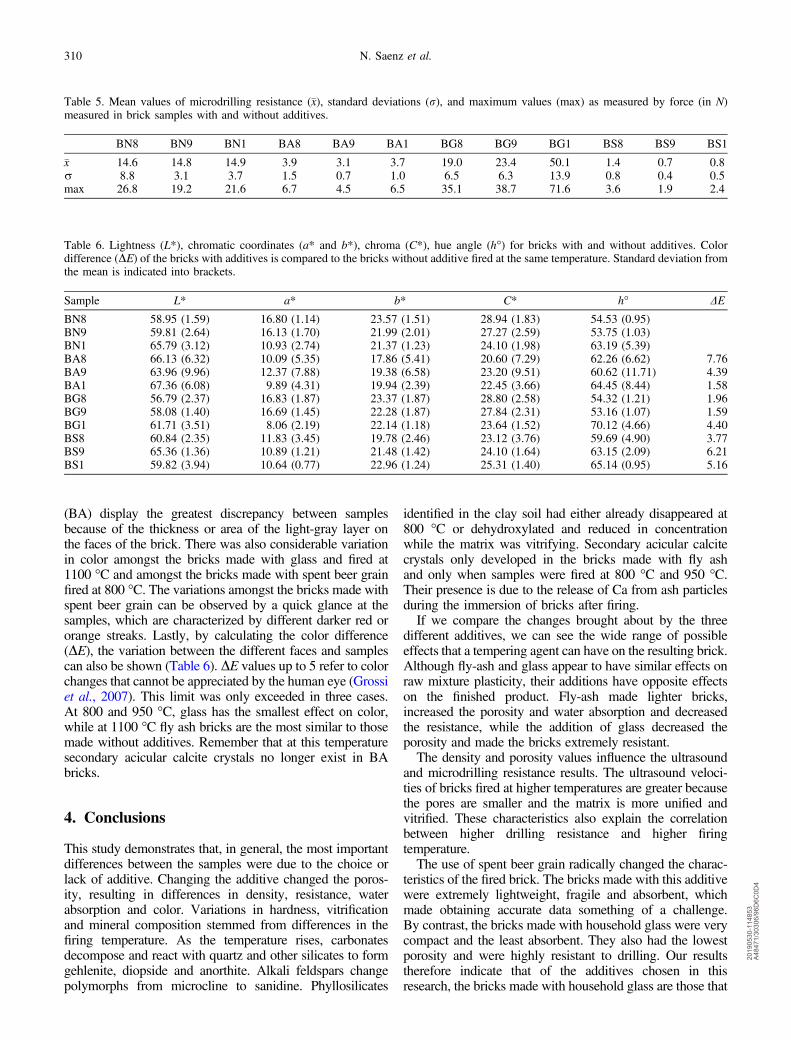
(BA) display the greatest discrepancy between samplesbecause of the thickness or area of the light-gray layer onthe faces of the brick. There was also considerable variationin color amongst the bricks made with glass and fired at1100 �C and amongst the bricks made with spent beer grainfired at 800 �C. The variations amongst the bricks made withspent beer grain can be observed by a quick glance at thesamples, which are characterized by different darker red ororange streaks. Lastly, by calculating the color difference(DE), the variation between the different faces and samplescan also be shown (Table 6). DE values up to 5 refer to colorchanges that cannot be appreciated by the human eye (Grossiet al., 2007). This limit was only exceeded in three cases.At 800 and 950 �C, glass has the smallest effect on color,while at 1100 �C fly ash bricks are the most similar to thosemade without additives. Remember that at this temperaturesecondary acicular calcite crystals no longer exist in BAbricks.
4. Conclusions
This study demonstrates that, in general, the most importantdifferences between the samples were due to the choice orlack of additive. Changing the additive changed the poros-ity, resulting in differences in density, resistance, waterabsorption and color. Variations in hardness, vitrificationand mineral composition stemmed from differences in thefiring temperature. As the temperature rises, carbonatesdecompose and react with quartz and other silicates to formgehlenite, diopside and anorthite. Alkali feldspars changepolymorphs from microcline to sanidine. Phyllosilicates
identified in the clay soil had either already disappeared at800 �C or dehydroxylated and reduced in concentrationwhile the matrix was vitrifying. Secondary acicular calcitecrystals only developed in the bricks made with fly ashand only when samples were fired at 800 �C and 950 �C.Their presence is due to the release of Ca from ash particlesduring the immersion of bricks after firing.If we compare the changes brought about by the three
different additives, we can see the wide range of possibleeffects that a tempering agent can have on the resulting brick.Although fly-ash and glass appear to have similar effects onraw mixture plasticity, their additions have opposite effectson the finished product. Fly-ash made lighter bricks,increased the porosity and water absorption and decreasedthe resistance, while the addition of glass decreased theporosity and made the bricks extremely resistant.The density and porosity values influence the ultrasound
and microdrilling resistance results. The ultrasound veloci-ties of bricks fired at higher temperatures are greater becausethe pores are smaller and the matrix is more unified andvitrified. These characteristics also explain the correlationbetween higher drilling resistance and higher firingtemperature.The use of spent beer grain radically changed the charac-
teristics of the fired brick. The bricks made with this additivewere extremely lightweight, fragile and absorbent, whichmade obtaining accurate data something of a challenge.By contrast, the bricks made with household glass were verycompact and the least absorbent. They also had the lowestporosity and were highly resistant to drilling. Our resultstherefore indicate that of the additives chosen in thisresearch, the bricks made with household glass are those that
Table 6. Lightness (L*), chromatic coordinates (a* and b*), chroma (C*), hue angle (h�) for bricks with and without additives. Colordifference (DE) of the bricks with additives is compared to the bricks without additive fired at the same temperature. Standard deviation fromthe mean is indicated into brackets.
Sample L* a* b* C* h� DE
BN8 58.95 (1.59) 16.80 (1.14) 23.57 (1.51) 28.94 (1.83) 54.53 (0.95)BN9 59.81 (2.64) 16.13 (1.70) 21.99 (2.01) 27.27 (2.59) 53.75 (1.03)BN1 65.79 (3.12) 10.93 (2.74) 21.37 (1.23) 24.10 (1.98) 63.19 (5.39)BA8 66.13 (6.32) 10.09 (5.35) 17.86 (5.41) 20.60 (7.29) 62.26 (6.62) 7.76BA9 63.96 (9.96) 12.37 (7.88) 19.38 (6.58) 23.20 (9.51) 60.62 (11.71) 4.39BA1 67.36 (6.08) 9.89 (4.31) 19.94 (2.39) 22.45 (3.66) 64.45 (8.44) 1.58BG8 56.79 (2.37) 16.83 (1.87) 23.37 (1.87) 28.80 (2.58) 54.32 (1.21) 1.96BG9 58.08 (1.40) 16.69 (1.45) 22.28 (1.87) 27.84 (2.31) 53.16 (1.07) 1.59BG1 61.71 (3.51) 8.06 (2.19) 22.14 (1.18) 23.64 (1.52) 70.12 (4.66) 4.40BS8 60.84 (2.35) 11.83 (3.45) 19.78 (2.46) 23.12 (3.76) 59.69 (4.90) 3.77BS9 65.36 (1.36) 10.89 (1.21) 21.48 (1.42) 24.10 (1.64) 63.15 (2.09) 6.21BS1 59.82 (3.94) 10.64 (0.77) 22.96 (1.24) 25.31 (1.40) 65.14 (0.95) 5.16
Table 5. Mean values of microdrilling resistance (�x), standard deviations (r), and maximum values (max) as measured by force (in N)measured in brick samples with and without additives.
BN8 BN9 BN1 BA8 BA9 BA1 BG8 BG9 BG1 BS8 BS9 BS1
�x 14.6 14.8 14.9 3.9 3.1 3.7 19.0 23.4 50.1 1.4 0.7 0.8r 8.8 3.1 3.7 1.5 0.7 1.0 6.5 6.3 13.9 0.8 0.4 0.5max 26.8 19.2 21.6 6.7 4.5 6.5 35.1 38.7 71.6 3.6 1.9 2.4
310 N. Saenz et al.
2019
0530
-114
853
A48
471/
3030
6/96
D6C
0D4

best meet the criteria for use in either conservation orconstruction.The combination of mineralogical and physical tests
applied during this study has provided new data on howwaste products used as additives in brick production caninfluence the quality of the fired product. These findingsrelate to various possible options for new and replacementmaterials of interest for both the brick industry and for thoseresponsible for restoring historical buildings. When bricks ofthis kind are used in restoration work to replace originalbrickwork, the aesthetic appearance (i.e., size, color, surfacefinish) are of crucial importance. The use of bricks made withwaste product additives is not a priori harmful for old build-ings provided that the aesthetics and physical–mechanicalproperties are similar to those of the original bricks, andthe reuse of these waste products is beneficial for the environ-ment. Though promising results have been obtained, futureexperiments with different concentrations of additives wouldprovide useful complementary information. For example, thelow resistance of bricks made with spent beer grain indicatesthat 20 wt% is too high for making viable bricks. Moreover,potential problems associated with the possible leaching oftoxic elements (i.e., present in fly ash) and/or additionalpotential drawbacks associated with the use of waste materialin brick making should require further research and testingprior to the widespread use of these bricks in constructionand monument conservation. Finally, exploring other meth-ods of brick production (i.e., preparing the unfired samplesby extrusion) would have more industrial applications sincethe method applied in this study has more in common withtraditional methods than with those used in modern brickfactories.
Acknowledgements: This study was funded by Junta deAndalucía Research Group RNM179 and by ResearchProject MAT2016-75889-R. We thank Cerámica CastilloSiles (Granada) for providing the raw material used to pre-pare and fire the bricks, Cervezas Alhambra S.L. (Granada)for providing the spent beer grain and Los Barrios thermo-electric plant (Cadiz) for providing the fly ash. We are grate-ful to K. Elert and C. Rodríguez Navarro for their valuableassistance in TEM study. The paper also benefited from thehelpful suggestions and comments of two anonymousreviewers.
References
Abbas, S., Saleem, M.A., Kazmi, S.M.S., Munir, M.J. (2017):Production of sustainable clay bricks using waste fly ash:mechanical and durability properties. J. Build. Eng., 14, 7–14.
Ahmari, S. & Zhang, L. (2012): Production of eco-friendly bricksfrom copper mine tailings through geopolymerization. Constr.Build. Mater., 29, 323–331.
ASTM D2845 (2005): Standard test method for laboratory deter-mination of pulse velocities and ultrasonic elastic constant ofrock. ASTM, USA.
Benavente, D., Linares-Fernández, L., Cultrone, G., Sebastián, E.(2007): Influence of microstructure on the resistance to saltcrystallisation damage in brick. Mater. Struct., 39, 105–113.
Binda, L. & Baronio, G. (1984): Measurement of the resistance todeterioration of old and new bricks by means of acceleratedaging tests. Durability Build Mater., 2, 139–154.
Bories, C., Borredon, M.E., Vedrenne, E., Vilarem, G. (2014):Development of eco-friendly porous fired clay bricks using pore-forming agents: a review. J. Environ. Manag., 143, 186–196.
Bories, C., Aouba, L., Vedrenne, E., Vilarem, G. (2015): Fired claybricks using agricultural biomass wastes: study and character-ization. Constr. Build. Mater., 91, 158–163.
Carretero, M.I., Dondi, M., Fabbri, B., Raimondo, M. (2002): Theinfluence of shaping and firing technology on ceramic propertiesof calcareous and non-calcareous illitic-chloritic clays. Appl.Clay Sci., 20, 301–306.
Cliff, G. & Lorimer, G.W. (1975): The quantitative analysis of thinspecimens. J. Microsc., 103, 203–207.
Coletti, C., Cultrone, G., Maritan, L., Mazzoli, C (2016): How toface the new industrial challenge of compatible, sustainablebrick production: study of various types of commerciallyavailable bricks. Appl. Clay Sci., 124–125, 219–226.
Cultrone, G., de la Torre, M.J., Sebastián, E., Cazalla, O. (2003):Evaluation of bricks durability using destructive and non-destructive methods (DT and NDT). Mater. Construct., 53,41–59.
Cultrone, G., Rodriguez-Navarro, C., Sebastian, E., Cazalla, O.,de La Torre, M.J. (2001): Carbonate and silicate phase reactionsduring ceramic firing. Eur. J. Mineral., 13, 621–634.
Cultrone, G., Sebastián, E., Elert, K., de la Torre, M.J., Cazalla, O.,Rodriguez Navarro, C. (2004): Influence of mineralogy andfiring temperature on the porosity of bricks. J. Eur. Ceram. Soc.,24, 547–564.
De Jongh, W.K. (1973): X-ray fluorescence analysis applyingtheoretical matrix corrections. Stainless steel. X-Ray Spectrom.,2, 151–158.
Delbrouck, O., Janssen, J., Ottenburgs, R., Van Oyen, P., Viaene, W.(1993): Evolution of porosity in extruded stoneware as a functionof firing temperature. Appl. Clay Sci., 7, 187–192.
Dondi, M., Marsigli, M., Fabbri, B. (1997): Recycling of industrialand urban wastes in brick production – a review. Tile Brick Int.,13, 218–225.
Dondi, M., Marsigli, M., Venturi, I. (1999a): Microstructure andmechanical properties of clay bricks: comparison between fastfiring and traditional firing. Brit. Ceram. Trans., 98, 12–18.
Dondi, M., Guarini, G., Raimondo, M. (1999b): Trends in theformation of crystalline and amorphous phases during the firingof clay bricks. Tile Brick Int., 15, 176–183.
El Ouahabi, M., Daoudi, L., Hatert, F., Fagel, N. (2015): Modifiedmineral phases during clay ceramic firing. Clay Clay Minerals,63, 404–413.
Elert, K., Cultrone, G., Rodriguez Navarro, C., Sebastián Pardo, E.(2003): Durability of bricks used in the conservation of historicbuildings. Influence of composition and microstructure. J. Cult.Herit., 4, 91–99.
Eliche Quesada, D., Felipe Sesé, M.A., Moreno Molina, A.J.,Franco, F., Infantes Molina, A. (2017): Investigation of usingbottom or fly pine-olive pruning ash to produce environmentalfriendly ceramic materials. Appl. Clay Sci., 135, 333–346.
Esbert, R.M., Ordaz, J., Alonso, F.J., Montoto, M. (1997): Manual dediagnosis y tratamiento de materiales pétreos y cerámicos. Col-legi d’Aparelladors i Arquitectes Tècnics de Barcelona, Spain.
Fabbri, B. (2012): Science and Conservation for Museum Collec-tions. Kermes Quaderni. Nardini Editore, Firenze, Italy.
Fabbri, B., Gualtieri, S., Shoval, S. (2014): The presence ofcalcite in archaeological ceramics. J. Eur. Ceram. Soc., 34,1899–1911.
Fernandes, F. & Lourenço, P.B. (2007): Evaluation of thecompressive strength of ancient clay bricks using microdrilling.J. Mater. Civ. Eng., 19, 791–800.
Mineralogy and physical properties of bricks with wastes 311
2019
0530
-114
853
A48
471/
3030
6/96
D6C
0D4

Fernández-Pereira, C., de la Casa, J.A., Gómez-Barea, A., Arroyo, F.,Leiva, C., Luna, Y. (2011): Application of biomass gasificationfly ash for brick manufacturing. Fuel, 90, 220–232.
Freyburg, S. & Schwarz, A. (2007): Influence of the clay type on thepore structure of structural ceramics. J. Eur. Ceram. Soc., 27,1727–1733.
Govindaraju, K. (1994): Compilation of working values and sampledescription for 383 geostandards. Geostandards Newslett., 18,1–158.
Grossi, C.M., Brimblecombe, P., Esbert, R.M., Alonso, F.J. (2007):Colour changes in architectural limestones from pollution andcleaning. Colour Res. Appl., 32, 320–331.
Günster, N. & Skowronek, A. (2001): Sediment-soil sequences inthe Granada Basin as evidence for long-and short-term climaticchanges during the Pliocene and Quaternary in the WesternMediterranean. Quatern. Int., 78, 17–32.
Guydader, J. & Denis, A. (1986): Propagation des ondes dans lesroches, anisotropies sous contrainte, évaluation de la qualité desschistes ardoisiers. Bull. Eng. Geol., 33, 49–55.
Hendry, H.A.W. (2001): Masonry walls: materials and construction.Constr. Build. Mater., 15, 323–330.
Hill, R.D. (1960): A study of pore size distribution of fired claybodies. The effect of clay mineralogy on the distribution. Trans.Brit. Ceram. Soc., 59, 189–197.
Jimenez Millan, J., Abad, I., Jimenez Espinosa, R., YebraRodriguez, A. (2018): Assessment of solar panel waste glassin the manufacture of sepiolite based clay bricks. Mater. Lett.,218, 346–348.
Johari, I., Said, S., Hisham, B., Bakar, A., Ahmad, Z.A. (2010):Effect of the change of firing temperature on the microstructureand physical properties of clay bricks from Beruas (Malaysia).Sci. Sinter., 42, 245–254.
Karaman, S., Ersahin, S., Gunal, H. (2006): Firing temperature andfiring time influence on mechanical and physical properties ofclay bricks. J. Sci. Ind. Res., 65, 153–159.
Kazmi, S.M.S., Munir, M.J., Wu, J.F., Hanif, A., Patnaikuni, I.(2018): Thermal performance evaluation of eco-friendly bricksincorporating waste glass sludge. J. Clean. Prod., 172,1867–1880.
Kreimeyer, R. (1987): Some notes on the firing colour of claybricks. Appl. Clay Sci., 2, 175–183.
Laird, R.T. & Worcester, M. (1956): The inhibition of lime blowing.Trans. Br. Ceram. Soc., 55, 545–563.
Lin, K.L. (2007): The effect of heating temperature of thin filmtransistor-liquid crystal display (TFT-LCD) optical waste glassas a partial substitute for clay in eco-brick. J. Clean. Prod., 15,1755–1759.
Lingling, X., Wei, G., Tao, W., Nanru, Y. (2005): Study on firedbricks with replacing clay by fly ash in high volume ratio.Constr. Build. Mater., 19, 243–247.
Lu, G., Lu, G.Q., Xiao, Z.M. (1999): Mechanical properties ofporous materials. J. Porous Mat., 6, 359–368.
Martin, J.D. (2016): XPowder, XPowder12, XPowderXTM. ASoftware Package for Powder X-ray Diffraction Analysis, Lgl.Dp. GR-780-2016.
Muñoz Velasco, P., Morales Ortíz, M.P., Mendívil Giró, M.A.,Muñoz Velasco, L. (2014): Fired clay bricks manufactured byadding wastes as sustainable construction material - A review.Constr. Build. Mater., 63, 97–107.
Murmu, A.L. & Patel, A. (2018): Towards sustainable brickproduction: an overview. Constr. Build. Mater., 165, 112–125.
NORMAL 29/88 S. (1988): Misura dell’indice di asciugamento(drying index). CNR-ICR, Rome, Italy,
Orts, M.J., Escardino, A., Amoros, J.L., Negre, F. (1993):Microstructural changes during the firing of stoneware floortiles. Appl. Clay Sci., 7, 193–205.
Papargyris, A.D., Cooke, R.G., Papargyri, S.A., Botis, A.I. (2001):The acoustic behaviour of bricks in relation to their mechanicalbehaviour. Constr. Build. Mater., 15, 361–369.
Phonphuak, N., Kanyakam, S., Chindaprasirt, P. (2016): Utilizationof waste glass to enhance physical-mechanical properties offired clay bricks. J. Clean. Prod., 112, 3057–3062.
Raut, S.P., Ralegaonkar, R.V., Mandavgane, S.A. (2011): Devel-opment of sustainable construction material using industrial andagricultural solid waste: a review of waste-create bricks. Constr.Build. Mater., 25, 4037–4042.
RILEM (1980): Recommended test to measure the deterioration ofstone and to assess the differences of treatment methods. Mater.Struct., 13, 175–253.
Robinson, G.C. (1984): The relationship between pore structure anddurability of brick. Ceram. Bull., 63, 295–300.
Rodriguez Navarro, C., Ruiz Agudo, E., Luque, A., RodriguezNavarro, A.B., Ortega Huertas, M. (2009): Thermal decompo-sition of calcite: mechanisms of formation and textural evolutionof CaO nanocrystals. Am. Mineral., 94, 578–593.
Scherer, G.W. (1990): Theory of drying. J. Am. Ceram. Soc., 73,3–14.
Shakir, A.A., Naganathan, S., Nasharuddin Mustapha, K. (2013):Properties of bricks made using fly ash, quarry dust and billetscale. Constr. Build. Mater., 41, 131–138.
Singer, F. & Singer, S.S. (1963): Industrial Ceramics. Chapman &Hall, London, UK.
Stephens, C.J., Mouhamad, Y., Meldrum, F.C., Christenson, H.K.(2010): Epitaxy of calcite on mica. Cryst. Growth Des., 10,734–738.
Sveda, M. (2000): New look at mathematical relationships amongphysical properties of brick products. Brit. Ceram. Trans., 99,181–186.
Tiller, W.A. (1991): The science of crystallization. macroscopicphenomena and defect generation. Cambridge University Press,Cambridge, UK.
Tite, M.S., Kilikoglou, V., Vekinis, G. (2001): Strength, toughnessand thermal shock resistance of ancient ceramics, and theirinfluence on technological choice. Archaeometry, 43, 301–324.
Trindade, M., Dias, M., Coroado, J., Rocha, F. (2009): Mineralog-ical transformations of calcareous rich clays with firing: acomparative study between calcite and dolomite rich clays fromAlgarve, Portugal. Appl. Clay Sci., 42, 345–355.
UNE-EN 1925 (2000): Natural stone test methods. Determination ofwater absorption coefficient by capillarity. AENOR, Madrid,Spain.
UNE-EN 13755 (2008): Natural Stone Test Methods. Determinationof Water Absorption at Atmospheric Pressure. AENOR,Madrid, Spain.
UNE-EN 15886 (2011): Conservation of Cultural Property. Testmethods. Colour Measurement of Surfaces. AENOR, Madrid,Spain.
Vera, J.A. (2004): Geología de España. SGE-IGME, Madrid,Spain.
Warren, J. (1999): Conservation of Brick. Butterworth-HeinemannSeries in Conservation and Museology, Butterworth Heine-mann, Oxford and Boston, UK.
Whitney, D.L. & Evans, B.W. (2010): Abbreviations for names ofrock-forming minerals. Am. Mineral., 95, 185–187.
Zhang, L. (2013): Production of bricks from waste materials – areview. Constr. Build. Mater., 47, 643–655.
Received 2 March 2018Modified version received 22 October 2018Accepted 22 October 2018
312 N. Saenz et al.
2019
0530
-114
853
A48
471/
3030
6/96
D6C
0D4