analysis of the aashto lrfd horizontal · pdf fileanalysis of the aashto lrfd horizontal shear...
TRANSCRIPT
ANALYSIS OF THE AASHTO LRFD HORIZONTAL SHEAR
STRENGTH EQUATION
Maria Lang
Thesis submitted to the faculty of the
Virginia Polytechnic Institute and State University
in partial fulfillment of the requirements for the degree of
MASTER OF SCIENCE
IN
CIVIL ENGINEERING
Carin Roberts-Wollmann, Co-Chairperson
Kamal B. Rojiani, Co-Chairperson
Cristopher D. Moen
September 8, 2011
Blacksburg, VA
Keywords: Horizontal Shear, Shear Friction
ANALYSIS OF THE AASHTO LRFD HORIZONTAL SHEAR STRENGTH EQUATION
Maria Lang
ABSTRACT
The composite action of a bridge deck and girder is essential to the optimization of the
superstructure. The transfer of forces in the deck to the girders is done across a shear interface
between the two elements. The transfer occurs through the cohesion of the concrete at the
interface and then through the shear reinforcement across the interface. Adequate shear strength
is essential to the success of the superstructure.
A collection of 537 horizontal shear tests comprised the database for the study of various
concrete types and interface surface treatments. The predicted horizontal shear strength
calculated from the AASHTO LFRD bridge design code was compared to the measured shear
strength. The professional bias was computed for each specimen. The professional biases,
standard deviations, and coefficients of variation for each category were calculated. The material
properties factor along with fabrication factor was researched. The loading factors were
researched and calculated for use in calculating the reliability index. The final step was to
compute the reliability index for each category. The process was repeated to learn the reliability
of the equation proposed by Wallenfelsz. The results showed that the reliability index for the
AASHTO LRFD horizontal shear strength equation wash much lower than the desired target
reliability index of 3.5. The reliability index for the Wallenfelsz equation was higher but still not
close to the target reliability index.

ACKNOWLEDGEMENTS
I would like to thank Dr. Carin Roberts-Wollmann and Dr. Kamal Rojiani for their
guidance and help throughout this research. It was a pleasure to work with them. I found them
truly understanding and willing to assist in my goals for my graduate degree. I would also like to
thank Dr. Moen for his guidance and for serving on my committee.
I would like to express my enormous amount of gratitude towards my family. Their
support was essential to my success throughout my undergraduate and graduate school. Their
calming reassurances and answers to my need for assistance helped me stay grounded and know
that I would make it through and go far. I could never be where I am without them.
I would also like to thank my fellow graduate students who made my graduate school
process more enjoyable. It was a delight sharing classes and an office with you.
iii
TABLE OF CONTENTS
ABSTRACT………………………………………………………………………………………ii
ACKNOWLEDGEMENTS………………………………………………………………………iii
TABLE OF CONTENTS………………………………………………………………………....iv
LIST OF FIGURES………………………………………………………………………………vi
LIST OF TABLES……………………………………………………………………….............vii
CHAPTER 1: INTRODUCTION…………………………………………………………………1
1.1 Horizontal Shear Transfer....…………………………………………………………..1
1.2 Research Objective and Scope………………………………………………………...3
1.3 Thesis Organization…………………………………………………………………...5
CHAPTER 2: LITERATURE REVIEW……………………………………….…………………6
2.1 Horizontal Shear…………………………………………………………...………….6
2.2 Research on Horizontal Shear…………………………………………………………7
2.2.1 Banta…………………………………………………………………………….7
2.2.2 Bass, Carrasquillo, & Jirsa………………………………………………………8
2.2.3 Choi………………………………………………..…………………………….9
2.2.4 Hanson…………………………………………………..………………………9
2.2.5 Hofbeck, Ibrahim, & Mattock………………………………...………………..10
2.2.6 Kahn & Mitchell…………………………………………………...…………..10
2.2.7 Kahn & Slapkus………………………………………………………..………11
2.2.8 Kamel…………………………………………………………………………..12
2.2.9 Loov & Patnaik…………………………………………..…………………….12
2.2.10 Mattock, Johal, & Chow……………………………………………………….13
2.2.11 Mattock, Li, & Wang………………………………………...………………...14
2.2.12 Patnaik………………………………………………………….………………15
2.2.13 Saemann & Washa……………………………………………………………..16
2.2.14 Scott……………………………………………………………………………17
2.2.15 Valluvan, Kreger, & Jirsa………………………………………..…………….17
2.2.16 Walraven & Reinhardt……………………………………………..…………..18
2.3 AASHTO LRFD Bridge Design Specifications……………………………………..19
2.4 Reliability Analysis…………………………………………………………………..21
2.4.1 Reliability Index………………………………………………………………..22
2.4.2 Resistance Statistics...………………………………………………………….23
2.4.3 Load Statistics…………………………………………………………………..24
2.5 Summary of Literature Review…………………………………………..…………..25
iv
CHAPTER 3: DATABASE AND CALCULATION METHODS…………………………..….26
3.1 Selection of Data…………………………………………………………………….26
3.2 Calculation of Predicted Horizontal Shear…………………………………………..27
3.3 Reliability Analysis Procedures……………………………………………………..27
CHAPTER 4: PRESENTATION OF RESULTS AND ANALYSIS…………………………...31
4.1 Typical Results……………………………………………………………………….31
4.1.1 Rough Interface………………………………………………………………...31
4.1.1.1 Normal Weight Concrete………………………………………………...35
4.1.1.2 Lightweight Concrete…………………………………………………….36
4.1.1.3 High Strength Concrete…………………………………………………..36
4.1.2 Smooth Interface……………………………………………………………….37
4.1.2.1 Normal Weight Concrete………………………………………………...41
4.1.2.2 Lightweight Concrete…………………………………………………….42
4.1.2.3 High Strength Concrete………………………………………………..…42
4.1.3 Monolythic Interface…………………………………………………………...42
4.1.3.1 Normal Weight Concrete………………………………………………...46
4.1.3.2 Lightweight Concrete………………………………………….…………46
4.1.3.3 High Strength Concrete…………………………………………..………47
4.2 Reliability Analysis……………………………………………………………..……47
4.2.1 Bias and Coefficient of Variation………………………………………….…..48
4.2.2 Reliability Indices……………...……………………………………………....50
4.2.3 Comparison to Wallenfelsz………………………………………………….....52
CHAPTER 5: SUMMARY, CONCLUSIONS AND RECOMMENDATIONS………………..56
5.1 Summary……………………………………………………………………………..56
5.2 Conclusions……………………………………………………………………….....57
5.3 Design Recommendations…………………………………………………………...58
5.4 Recommendations for Future Research……………………………………………...59
REFERENCES…………………………………………………………………………………..60
APPENDIX A…………………………………………………………………………………...62
APPENDIX B…………………………………………………………………………………...89
APPENDIX C…………………………………………………………………………………..103
APPENDIX D…………………………………………………………………………………..126
v
LIST OF FIGURES
Figure 1.1 Cracking at interface resulting in horizontal shear friction……………………………1
Figure 1.2 Tensile forces in reinforcing steel after cohesion failure……………………………...2
Figure 1.3 Deflected non-composite beam under loading………………………………………...2
Figure 1.4 Deflected composite beam under loading……………………………………………..3
Figure 1.5 Typical push-off test…………………………………………………………………...4
Figure 2.1 Horizontal shear forces in composite section………………………………………….6
Figure 3.1 Rough interface normal variable distributions..……………………………………...29
Figure 3.2 Smooth interface normal variable distributions.……………………………………..29
Figure 3.3 Monolithic interface normal variable distributions..…………………………………30
Figure 4.1 Clamping stress versus actual horizontal shear stress for rough interface and normal
strength concrete …………………………………..………………………………...32
Figure 4.2 Clamping stress versus actual horizontal shear stress for rough interface and
lightweight concrete ……………………………………………………………...….33
Figure 4.3 Clamping stress versus actual horizontal shear stress for rough interface and high
strength concrete ………………………………………………………………...…..34
Figure 4.4 Clamping stress versus actual horizontal shear stress for smooth interface and normal
weight concrete …………………………………………………………………..….38
Figure 4.5 Clamping stress versus actual horizontal shear stress for smooth interface and
lightweight concrete ……………………………………………………...………….39
Figure 4.6 Clamping stress versus actual horizontal shear stress for smooth interface and high
strength concrete……………………………………………………………………..40
Figure 4.7 Clamping stress versus actual horizontal shear stress for monolithic interface and
normal weight concrete………………………………………………………………43
Figure 4.8 Clamping stress versus actual horizontal shear stress for monolithic interface and
lightweight concrete………………………………………………………………….44
Figure 4.9 Clamping stress versus actual horizontal shear stress for monolithic interface and high
strength concrete……………………………………………………………………..45
Figure 4.10 Reliability indices for AASHTO LRFD for normal weight concrete………………50
Figure 4.11 Reliability indices for AASHTO LRFD for lightweight concrete………………….51
Figure 4.12 Reliability indices for AASHTO LRFD for high strength concrete………………..51
Figure 4.13 Reliability indices for D+L load combination for Wallenfelsz equation for normal
weight concrete………………………………………………………………………54
Figure 4.14 : Reliability indices for D+L load combination for Wallenfelsz equation for normal
weight concrete………………………………………………………………………54
Figure 4.15 Reliability indices for D+L load combination for Wallenfelsz equation for normal
weight concrete………………………………………………………………………55
vi
LIST OF TABLES
Table 4.1 Statistics of the Professional Factor…………………………………………………...48
Table 4.2 Statistical Parameters of Resistance…………………………………………………..49
Table 4.3 Statistics of Professional Factor for Wallenfelsz Equation...…………………………53
Table 4.4 Resistance Statistics for Wallenfelsz Equation…………………………….………….53
vii
CHAPTER 1: INTRODUCTION
1.1 Horizontal Shear Transfer
It is common practice for a bridge’s superstructure to be constructed in two phases. The
first phase is the erection of the girders. The second phase is the construction of the bridge deck.
In order for the superstructure to work at optimal load-carrying capacity, it is necessary that there
is an adequate transfer of the horizontal shear force due to the dead and live loads from the deck
to the girders. A part of the shear force is transferred through interface friction resulting from
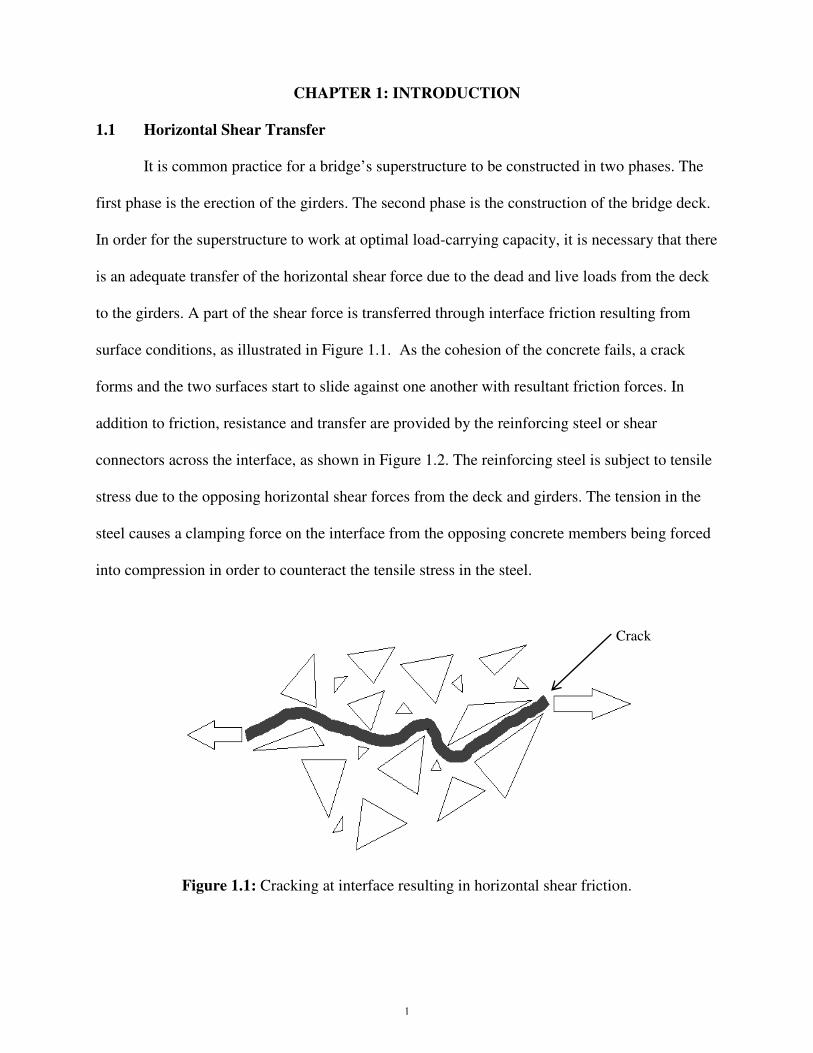
surface conditions, as illustrated in Figure 1.1. As the cohesion of the concrete fails, a crack
forms and the two surfaces start to slide against one another with resultant friction forces. In
addition to friction, resistance and transfer are provided by the reinforcing steel or shear
connectors across the interface, as shown in Figure 1.2. The reinforcing steel is subject to tensile
stress due to the opposing horizontal shear forces from the deck and girders. The tension in the
steel causes a clamping force on the interface from the opposing concrete members being forced
into compression in order to counteract the tensile stress in the steel.
Figure 1.1: Cracking at interface resulting in horizontal shear friction.
Crack
1
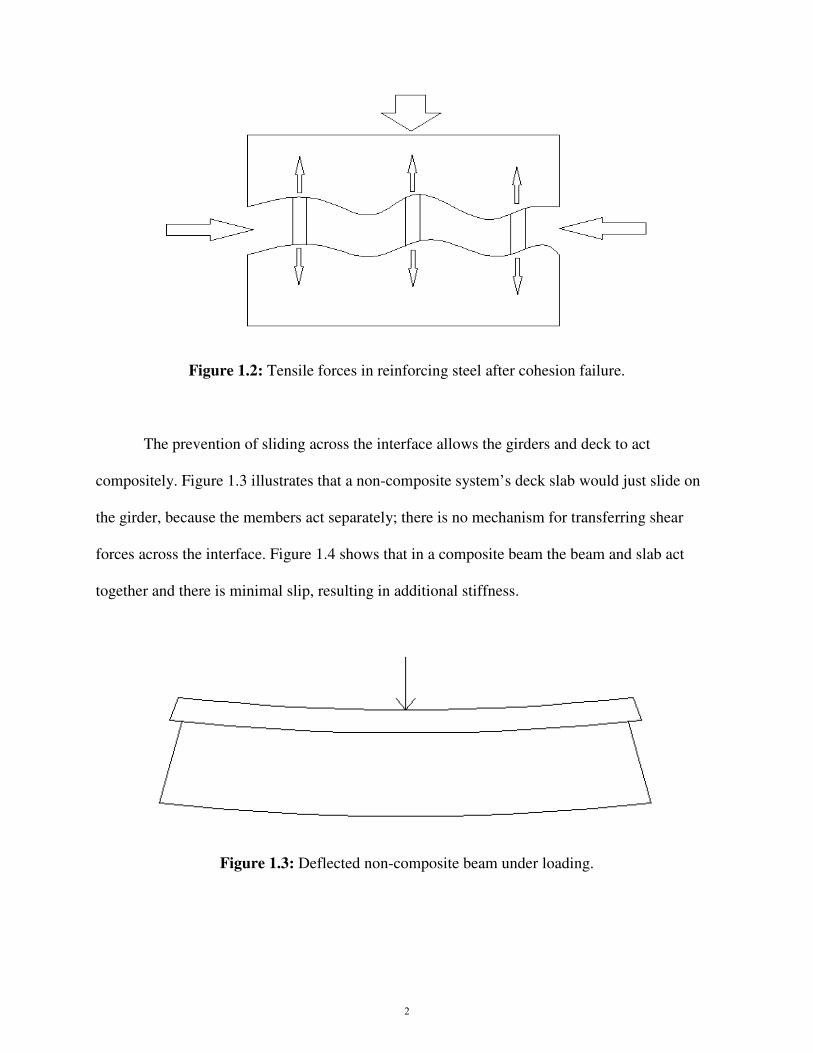
Figure 1.2: Tensile forces in reinforcing steel after cohesion failure.
The prevention of sliding across the interface allows the girders and deck to act
compositely. Figure 1.3 illustrates that a non-composite system’s deck slab would just slide on
the girder, because the members act separately; there is no mechanism for transferring shear
forces across the interface. Figure 1.4 shows that in a composite beam the beam and slab act
together and there is minimal slip, resulting in additional stiffness.
Figure 1.3: Deflected non-composite beam under loading.
2

Figure 1.4: Deflected composite beam under loading.
In a typical composite concrete beam the interface between the beam and deck is either
smooth or intentionally roughened by raking the surface to a minimum height of 0.25 in. If the
deck and girders are to be cast at different times, all interfaces should be clean and free of
laitance, which could reduce the friction force. The members may have different types of
concrete and different concrete strengths. Normal weight, lightweight, and high performance
concretes are the most commonly found concrete types. There are several equations for
calculating the horizontal shear force transferred between composite members. These equations
depend upon the researcher or the appropriate design code. The factors considered in these
equations for predicting the horizontal shear include the amount of reinforcement, reinforcement
strength, spacing of reinforcement, concrete type, concrete strength, applied normal force,
surface treatment, and interface area.
1.2 Research Objective and Scope
The objective of this research is to ascertain the level of reliability of the equation for
predicting the nominal shear resistance of an interface plane in the American Association of
3

State Highway and Transportation Officials (AASHTO) Load and Resistance Factor Design
(LRFD) bridge design specifications. The steps needed to accomplish this objective include:
1. Develop a database of experimental test results on horizontal shear strength
2. Determine statistics of horizontal shear strength
3. Evaluate the inherent reliability of the AASHTO horizontal shear equation by
computing the reliability index for horizontal shear strength.
An important objective of the study was to compile a database of experimental test results on
horizontal shear strength available in the literature. The database comprised of a total of 537 test
results from either push-off tests, as illustrated in Figure 1.5, or full beam tests, as illustrated
earlier in Figure 1.4. The specimens had either a rough interface, or a smooth interface, or were
cast monolithically. The database includes specimens made with normal weight, lightweight, or
high strength concrete of varying strength. Some of the experiments had shear reinforcement
across the interface, while others had none at all. The applied clamping stress also fluctuated
depending on the researcher.
Figure 1.5: Typical push-off test.
In order to access the reliability of the AASHTO horizontal shear equation it is necessary
to obtain the statistics of the load and resistance. The factors that affect resistance statistics are
the professional factor, the material factor and the fabrication factor. The professional factor is
4
the ratio of actual to predicted strength. Statistics of the professional factor were determined
from an analysis of the test results. Statistics of the material and fabrication factors and statistics
of loads were determined from available literature. The measure of reliability used in this study
is the reliability index obtained from a first-order second-moment reliability analysis. The third
objective of the study was to determine the reliability index for a range of interface types,
concrete strengths, reinforcement amounts and clamping force. The reliability study will
highlight the need for a review of the current equation.
1.3 Thesis Organization
Chapter 2 reviews the results of experimental studies on horizontal shear strength
available in literature. An overview of the AASHTO LRFD specifications for horizontal shear
strength is also presented. An explanation of how the data was selected and analyzed is discussed
in Chapter 3. Results from the study and a discussion of these results are presented in Chapter 4.
Chapter 5 contains a summary, conclusions, and recommendations from the research.
5
CHAPTER 2: LITERATURE REVIEW
2.1 Horizontal Shear
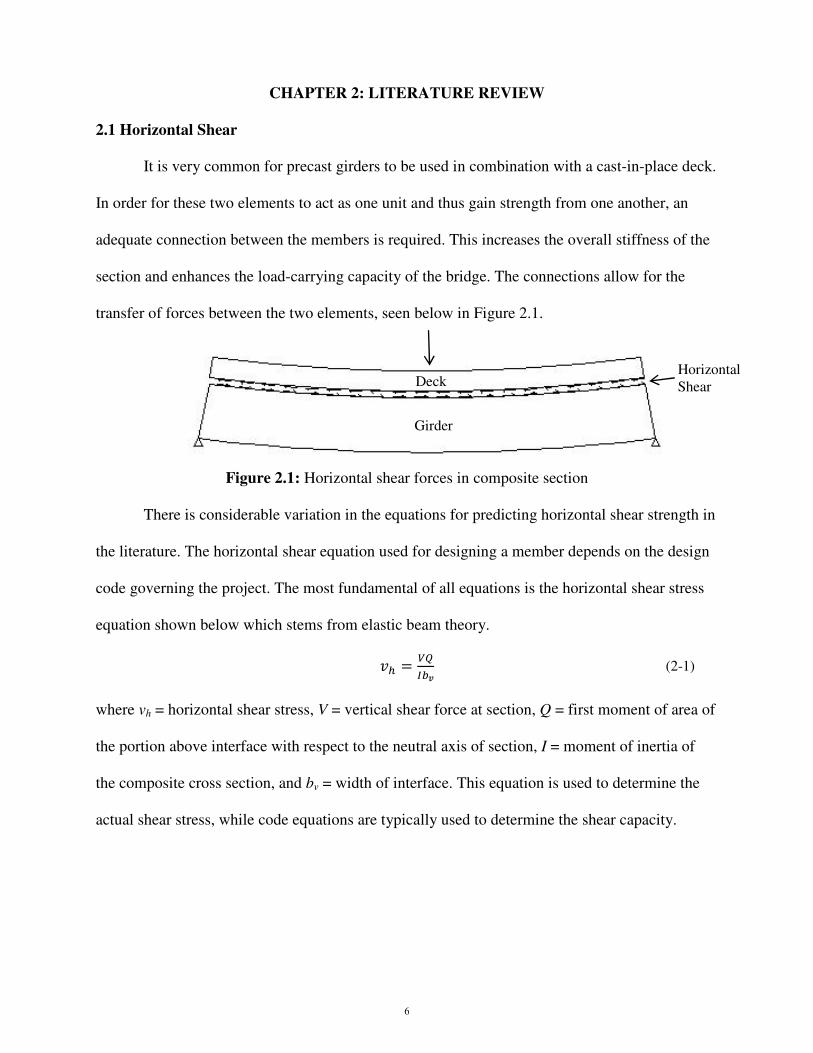
It is very common for precast girders to be used in combination with a cast-in-place deck.
In order for these two elements to act as one unit and thus gain strength from one another, an
adequate connection between the members is required. This increases the overall stiffness of the
section and enhances the load-carrying capacity of the bridge. The connections allow for the
transfer of forces between the two elements, seen below in Figure 2.1.
Figure 2.1: Horizontal shear forces in composite section
There is considerable variation in the equations for predicting horizontal shear strength in
the literature. The horizontal shear equation used for designing a member depends on the design
code governing the project. The most fundamental of all equations is the horizontal shear stress
equation shown below which stems from elastic beam theory.
�� = �����
where vh = horizontal shear stress, V = vertical shear force at section, Q = first moment of area of
the portion above interface with respect to the neutral axis of section, I = moment of inertia of
the composite cross section, and bv = width of interface. This equation is used to determine the
actual shear stress, while code equations are typically used to determine the shear capacity.
Deck
Girder
Horizontal
Shear
(2-1)
6
2.2 Research on Horizontal Shear
Transfer of the horizontal shear force is critical in a composite section. The researchers
below were all in pursuit of an understanding of how horizontal shear transfer occurs. They
performed experimental tests with different types of concrete, surface treatments, reinforcement
ratios, and loading processes in order to learn how the shear strength of a specimen changes in
accordance with these variables. The researchers evaluated the different horizontal shear strength
equations from various design codes. Some of the researchers proposed different equations for
predicting horizontal shear strength. The following sections discuss details of the different
experimental studies, how the tests were set up and what conclusions were drawn from the
experiments.
2.2.1 Banta
Banta (2005) completed 24 push-off tests on ultra high performance and lightweight
concrete. The ultra high performance Ductal® concrete block acted as the base or beam for the
push-off tests, while the lightweight concrete was the top slab. A concrete block was placed on
top of the specimen in order to produce an imposed normal force. Each Ductal® block was six
inches high and ten inches wide with lengths measuring 12 in., 18 in., or 24 in. Banta studied
four different interface treatments – smooth, keyed, deformed, and chipped. The horizontal shear
reinforcement varied from one to six legs of No. 3 reinforcing bars. The samples were loaded
monolithically while the applied load increased.
As with other push-off tests, the general behavior observed from Banta’s tests was that
the horizontal shear resistance increased until an initial crack formed, after which there was a
drop in strength to zero when no reinforcement was present. When reinforcement was present,
the increase in resistance continued until the steel leg ruptured. Banta found that current design
7

practices were conservative in predicting the horizontal shear with the AASHTO design equation
being the most conservative. He concluded that the best surface treatment was the chipped
surface so long as the chipping process did not cause stress on the beam.
2.2.2 Bass, Carrasquillo, and Jirsa
Bass, Carrasquillo, and Jirsa (1989) studied shear transfer of an interface with new and
old concrete under repeated cyclic loading. They performed 33 full scale push-off tests. The
specimens differed in the surface treatment, amount and embedment depth of the steel, amount
of normal reinforcement within each side of the specimen, and concrete strength of each side.
The base blocks were constructed vertically as if they were a column, which acted as the old
concrete. The base blocks were 24 in. wide and 24 in. deep for a length of 42 in. Almost all of
the new walls were 10 in. wide and cast alongside the columns with a length of 42 in. A “bond
breaker” was in place causing the shear interface length to be only 36 in. The new walls were
cast in an overhead, vertical, or horizontal manner. The various surface treatments used between
the old and new walls were untreated, heavily sandblasted, chipped, shear keys, and epoxy
bonding. The reinforcement crossing the shear interface varied from two to six No. 6
reinforcement dowels spaced between six to twelve inches.
The specimens underwent ten different load cycles. The first six load cycles were to a
specified load level. The next three load cycles aimed for a displacement of 0.1 in., and the last
load induced a displacement of 0.5 in. Bass, Carrasquillo, and Jirsa observed that the shear
capacity was greater when the shear reinforcement is embedded deeper. They also found that the
surface treatment did not have a clear effect on the shear strength when displacements were
greater than 0.2 inch. Deeper embedment and a greater amount of reinforcement both increase
the shear capacity.
8
2.2.3 Choi
Choi (1996) studied the shear strength when powder-driven nails were used across the
interface. Choi completed several different tests to understand the use of powder-driven nails,
including nail pullout strength tests and interface shear tests. Four large slabs measuring 4 m
(157.5 in.) by 1.4 m (55.1 in.) with a depth of 0.2 m (7.9 in.) were used as the base of the test
specimens. The surface of the slab was sandblasted to various degrees for the experiments. Shear
faces varied between 230 and 700 cm2 (35.65 and 108.5 in
2). The top pieces of the specimen had
a depth of 145 mm (5.7 in.). The number of powder-driven nails varied from zero to two nails in
a specimen. Choi found that the different levels of sandblasting did not seem to make a
difference in the horizontal shear strength. Specimens with nails had greater shear resistance than
those without nails.
2.2.4 Hanson
Hanson (1960) studied the horizontal shear strength between precast girders and cast-in-
place slabs. Hanson performed 62 push-off tests. He also conducted full beam tests on ten T-
shaped girders. He varied the use of adhesive bond agents, keys, stirrups, and surface roughness.
The precast base of the specimen was eight inches wide with a depth of twelve inches. The cast-
in-place top piece was 24 in. wide by 7 in. deep. The length of surface interface was 6, 12, or 24
inches. The surface treatments used were smooth, rough, bonded, unbonded, keyed, bare smooth
aggregate, and bare rough aggregate.
The push-off tests were performed vertically with the applied load acting parallel to the
interface. Hanson found that there was a base shear strength value depending on the interface
treatment. Reinforcement steel across the interface added strength to the base shear strength.
Keys did not add to or increase the strength of the shear resistance. Hanson suggested that
9

connections that are “a combination of a rough, bonded contact surface and stirrups extending
from the precast girders into the situ-cast deck slab” are of greatest concern for future research.
2.2.5 Hofbeck, Ibrahim and Mattock
Hofbeck, Ibrahim, and Mattock (1969) also studied the shear transfer across an interface.
They performed 38 push-off tests in order to understand the shear transfer behavior in interfaces
where a crack exists before shear transfer. The effects of shear reinforcement and concrete
strength on shear resistance were also studied. The typical specimens had a shear interface of 50
square inches with an overall depth of 10 inches. The amount of steel reinforcement varied from
zero to six stirrups with sizes varying from 1/8 in. diameter to No. 5. reinforcing bars. Concrete
strengths ranged from 2385 psi to 4510 psi.
The push-off specimens were axially loaded in the vertical position. Some of the
specimens were initially cracked and others were initially uncracked. The testing of the shear
specimens occurred with incremental loads. As the specimens were being tested, diagonal cracks
formed across the interface for both cracked and uncracked specimens. Hofbeck, Ibrahim, and
Mattock found that the precracked specimens produced lower ultimate shear strength. They also
reported that concrete strength had no effect on the shear strength, and that the shear strength
was a function of the reinforcement ratio. The shear-friction theory gave conservative answers,
so the researchers suggested imposing limits on the theory.
2.2.6 Kahn and Mitchell
Kahn and Mitchell (2002) performed fifty push-off tests in order to determine if the
American Concrete Institute (ACI) building code shear friction equation was adequate for high-
strength concrete. The specimens varied between a pre-cracked, uncracked, and cold joint. The
10
cold joints were treated as smooth or roughened. Concrete strengths ranged between 6,800 psi
and 17,900 psi, and reinforcement ranged between zero and four two-leg stirrups of No. 3 bars.
The shear interface was five inches by twelve inches long.
The specimens were tested four months after being cast. The specimens were placed
vertically while being axially loaded. Kahn and Mitchell found that the ACI code provided a
conservative estimate of the shear strength for high strength concrete. The researchers proposed
using the following equation for the horizontal shear stress capacity:
� = 0.05 �� + 1.4�� � ≤ 0.2 ��[���] where vu = ultimate experimental shear stress capacity, f’c = concrete compressive strength, ρv =
shear friction reinforcement ratio (area of reinforcing steel to the product of interface width and
reinforcement spacing), and fy = yield stress of reinforcement. The equation is limited to
reinforcing steel having a yield strength fy of less than 60 ksi.
2.2.7 Kahn and Slapkus
Kahn and Slapkus (2004) studied shear transfer in high strength composite T-beams.
They tested six T-beams with precast webs and cast-in-place flanges. The concrete strength of
the webs was 12,000 psi, while the flanges were either 11,000 psi or 7,000 psi. The interface had
aggregate exposed to a height of 0.25 in. or greater. The test beams had five, seven, or nine No. 3
U-shape reinforcement across the surface.
The beams with 7,000 psi concrete flanges all failed in shear, while the beams with the
11,000 psi concrete flanges failed in flexure. Monolithic loading was applied at two points both
4.5 inches from the center of the beam. The shear interface area was 6 in. wide and 39.5 in. long.
Kahn and Slapkus found that the current AASHTO equation could be upwards of six times over
(2-2)
11
conservative for interface shear. They surmised that the equation proposed by Loov and Patnaik
(1994) was the best predictor of horizontal shear.
2.2.8 Kamel
Kamel (1996) conducted a study on composite bridge systems. A part of his research was
focused on the transfer of forces across an interface. He looked at 63 push-off tests to understand
the significance of shear interface type and connector type. The interface types considered in this
study included a debonded key, rough bonded, rough unbonded, smooth debonded, and smooth
bonded surfaces. The connectors were high strength threaded rods, reinforcement stirrups, or no
connectors. Several series of tests were conducted with various types of specimens. The shear
interface areas varied depending on the series, along with the type and amount of connectors and
number of interfaces.
The specimens were loaded in different ways according to the type of test. The double
shear specimens were placed vertically in the testing machine and the center slab was loaded.
Single shear tests were laid horizontally and a varying horizontal load was applied in addition to
a possible constant vertical load. Kamel found that the debonding sealant provided some extra
adhesion between the interfaces. He also found that extended reinforcement bars were more
effective than high strength threaded rods.
2.2.9 Loov and Patnaik
Loov and Patnaik (1994) completed sixteen beam tests in order to determine if the current
ACI horizontal shear stress equations could be simplified. The researchers varied two parameters
in their tests – the clamping stress and concrete strength. Clamping stresses ranged between 58
and 1120 psi when the concrete strength was 5000 psi. The concrete strength was also varied
12
between 6400 psi and 7000 psi with a constant clamping stress of 120 psi. Two groups of full
beam samples were tested: one with the flange running the entire length of the beam and the
other with flanges stopping short of the ends. The overall web length was 10 feet 6 inches. The
beam with short flanges stopped 3 feet 11 inches from the center on each side. The amount of
steel in addition to the web width was adjusted in order to gain a certain amount of clamping
stress. The beams were designed to mimic a precast beam with a cast-in-place deck. Almost all
of the beams were considered to have a rough interface.
The beams were loaded at a single point in the center of the beam. The beams were
supported three inches in from the end of each beam. Beams that had the full length flanges had
diagonal, flexure cracking before gaining horizontal cracking, thus the need for the shorter flange
span specimens. Some beams did end up failing in flexure, but most failed in horizontal shear.
Loov and Patnaik recommended using the following equation for predicting shear capacity:
�� = � !"15 + �� �# �� ≤ 0.25 ��(���)
where vn = the nominal shear strength, k = a constant, λ = a constant used to account for the
effect of concrete density, ρvfy = the clamping stress, and f’c = the concrete strength. The
researchers noticed that there is minimal slip and stress before horizontal shear stress starts to
act.
2.2.10 Mattock, Johal and Chow
Mattock, Johal, and Chow (1975) performed 27 push-off tests in order to understand the
effects of moment on a shear plane, placement of reinforcement across the shear interface, and
tension across the shear plane. Six groups of specimens were tested, including four groups of
corbel type push-off tests and two groups of standard push-off tests. The corbel tests had a shear
(2-3)
13
interface measuring ten inches by six inches with each side ten inches deep. The standard push-
off tests had a shear interface of twelve inches by seven inches with an overall depth of fourteen
inches.
Eccentric loads were applied in the corbel push-off tests to study the effect of a moment
across a shear plane. The corbel specimens were incrementally loaded. For the standard push-off
tests, a tensile force was applied concentrically across the shear face. After analyzing the data
collected, Mattock, Johal, and Chow found that an applied moment does not affect the transfer of
shear force. It was essential for reinforcement to be in the tension region in order to ensure shear
transfer. The researchers believed that the equations below by Birkeland (1968) and Mattock
(1974), respectively, most accurately predicted the shear transfer, and that both equations should
be limited to 0.3f’c.
�� = 33.5'� �
�� = 400 + 0.8� �
2.2.11 Mattock, Li and Wang
Mattock, Li, and Wang (1976) studied the use of lightweight concrete and the effects it
has on horizontal shear. They performed 66 push-off tests in which they varied the type of
aggregate used in the lightweight concrete. The four types of aggregate used were naturally
occurring sand and gravel, rounded lightweight aggregate, angular lightweight aggregate, and
“sanded lightweight” aggregate. Concrete strength, the amount of shear reinforcement, and
precracking of an interface were three other variables studied. All of the push-off specimens had
an interface of ten inches by five inches with each side having a depth of six inches.
The specimens were loaded vertically on the testing machine. Uncracked specimens did
not display cracking until after tension cracks appeared at the shear interface. Mattock, Li, and
(2-5)
(2-4)
14
Wang discovered that the shear capacity for lightweight concretes is less than the shear capacity
for normal weight concretes. They found that the type of lightweight aggregate does not have a
significant effect on shear strength. Most current equations for shear friction needed to be
adjusted for lightweight concrete. The researchers suggested using the following equations for
sanded lightweight and all-lightweight respectively with both having � � at a minimum of 200
psi.
� = 0.8� � + 250��� ≤ 0.2 ��)*1000��� � = 0.8� � + 200��� ≤ 0.2 ��)*800���
2.2.12 Patnaik
Patnaik (2001) performed 24 test beam tests in order to study the adequacy of the ACI
building code provisions for horizontal shear with a smooth interface. Two types of beams were
considered in the study – rectangular shaped sections and T-shaped sections. All of the T-beams
had flanges that were shorter than the length of the beams. The width of the interface varied for
the rectangular beams, while the T-beams had a set interface width of six inches. The concrete
strength ranged from 2500 psi to 5225 psi, while the clamping stress from the reinforcement
varied between 45 psi and 525 psi. The beams were all designed to fail in horizontal shear before
flexure or diagonal shear.
All of the beams were loaded in the center of the beam in increments. All beams
displayed horizontal shear slipping. Patnaik did not see a clear correlation between concrete
strength and horizontal shear strength, but he did realize that the clamping stress did have an
impact on the shear strength. All of the ACI design equations considered provided very
conservative predictions of horizontal shear. Patnaik recommended the use of the following
equations.
(2-7)
(2-6)
15
� = 0.6 + ��, �, ≤ 0.2 ��-./5.501-[798���] � = 0 )*��, �, < 0.3501-[50���]
where vu = the horizontal shear strength, ρvfy = the clamping stress in MPa, and f’c = the concrete
strength in MPa.
2.2.13 Saemann and Washa
Saemann and Washa (1964) tested 42 beams in order to better understand the influence of
the connections between precast and cast-in-place concrete. They were trying to gain a better
understanding of the effects of the level of roughness, position of joint in relation to the neutral
axis, length of the beam, reinforcement ratio across the interface, shear keys, and concrete
strength. The neutral axis was designed to be two inches above or below the shear interface. The
reinforcement ratio varied between 0 and 1.07 percent. The actual compressive strength of the
webs varied between 2530 psi and 3800 psi, while the compressive strength of the slabs ranged
from 2680 psi to 3870 psi.
The beams were statically loaded at two points each one foot from the center of the beam.
The beams were all designed to fail in shear before failing in flexure. Saemann and Washa
observed three types of failure: tension, tension-shear, and shear. Tension failures tended to
occur with the long beam specimens. The intermediate and short length beams tended towards
shear failures unless they had a reinforcement ratio greater than 1.0 percent. For a reinforcement
ratio greater than 1.0%, the intermediate and short beams experienced the tension-shear failure.
The shear strength went up for the short and intermediate beams with increased roughness and
increased reinforcement. The long beams did not seem as influenced by roughness or
reinforcement. Keys had about equal effectiveness to that of intermediate roughness. Increased
(2-9)
(2-8)
16
concrete strength did not have a significant effect on the strength. The joints with interfaces
below the neutral axis had greater strength than those above the neutral axis.
2.2.14 Scott
Scott (2010) performed 36 push-off tests in order to determine if there is significance in
having two different types of concrete at the shear interface. The shear interface of the specimens
was 24 in. by 16 in. with an overall depth of 18 in. The test specimens had three different
combinations of concrete type at the interface: lightweight-lightweight, lightweight-normal
weight, and normal weight-normal weight. The reinforcement ratio also varied between 0 and 1.2
percent. All of the specimens were raked to create a rough interface. The precast section that
acted as the girder was designed to have a strength of 8000 psi regardless of the type of concrete.
The deck cast-in-place section was designed for 4000 psi.
During testing, the push-off specimens were placed horizontally with a normal weight of
2.5 kips applied. The loading was applied to be concentric with the shear plane. Scott learned
from the experiments that the AASHTO LRFD horizontal shear equation was conservative,
especially for lightweight elements. Lightweight-normal weight specimens acted very similar to
the lightweight-lightweight sections. Normal weight-normal weight specimens provided greater
shear strength in comparison to those with lightweight concrete. There was greater variation in
shear strength for the lightweight concrete specimens than the normal weight specimens.
2.2.15 Valluvan, Kreger and Jirsa
Valluvan, Kreger, and Jirsa (1999) assessed the validity of the horizontal shear equation
in ACI 318-95 for concretes placed at different times. They performed 16 push-off tests, where
the effect of amount of reinforcing across the interface, amount of permanent compressive stress
17

on the interface, strength of the concrete, and construction procedure was considered. The
specimens were designed to have a shear interface of 4 in. by 32 in. The interface surfaces were
sandblasted in order to achieve a roughened interface. The existing concrete side had a concrete
strength of 3500 psi or 1750 psi. The new concrete section’s strength was either 6000 psi or 5100
psi.
The specimens were placed horizontally and a concentric load was applied along the
shear interface. The loads were either applied monotonically or in reversed cycles. Valluvan,
Kreger, and Jirsa found that the ACI code provided very conservative results, so they proposed
the following equations.
5� = "6�, � + 7#8 ≤ 0.25 ��6�)*8006� 9:;ℎ=.7 ≤ 8006�
5� = 78 ≤ 0.6 ��6� )*21006� 9:;ℎ=.7 > 8006�
where Vn = nominal shear capacity of the shear plane in lb, Avf = area of shear-friction
reinforcement across the shear plane in in.2, fy = yield strength of shear-friction reinforcement in
psi, N = permanent net compression across the shear plane in lb, μ = coefficient of friction, and
Ac = area of concrete section resisting shear transfer in square inches. The researchers claimed
that the ACI code equations were extremely conservative when there was a sustained
compression force.
2.2.16 Walraven and Reinhardt
Walraven and Reinhardt (1981) conducted a series of experimental tests to gain a better
understanding of horizontal shear transfer in order to create a more complete finite element
model. The objective of the study was to determine the effect of reinforcement ratio, bar size,
concrete strength, roughness of the interface, angle of the reinforcement, and dowel action on
horizontal shear strength. The reinforcement ratio varied between 0.14 and 3.35 percent with bar
(2-11)
(2-10)
18
sizes between 4 mm (0.16 in.) and 16 mm (0.63 in.). The concrete strengths were 20 N/mm2
(2900 psi), 30/35 N/mm2
(4350/5075 psi) and 56 N/mm2 (8120 psi). The specimens had an
interface length of 300 mm (11.8 in.) with a width of 120 mm (4.7 in.) and overall depth of 400
mm (15.7 in.). The researchers also performed tests with external reinforcement. All of the
specimens were pre-cracked before testing.
The specimens were placed vertically for loading across the shear plane. Walraven and
Reinhardt did not find any significance in the size of the bar used; it seemed that the most
influential factor was reinforcement ratio. The angle of the shear reinforcement was not
significant unless inclined to 135 degrees. The quality of concrete had an effect on the pattern of
cracking. Hysteresis was observed when the specimens were unloaded and reloaded.
2.3 AASHTO LRFD Bridge Design Specifications
The purpose of this study is to evaluate the AASHTO LRFD (2010) horizontal shear
strength equations. The equation for horizontal shear strength as given in the AASHTO
specifications is:
5?@ = A5�@ 5?@ ≥ 5@
where Vri = factored interface shear resistance (kip), φ = resistance factor for shear (0.90 for
normal weight concrete and 0.70 for lightweight concrete), Vni = nominal interface shear
interface (kip), and Vui = factored interface shear force due to total load based on the applicable
strength and extreme event load combinations (kip). The nominal shear resistance of the
interface plane shall be taken as:
5�@ = C6�� + 8"6�, � + 1�# ≤ D�. EFG ��6��FH6��
(2-13)
(2-12)
(2-14)
19
where c = cohesion factor, Acv = area of concrete considered to be engaged in interface shear
transfer (in2), μ = friction factor, Avf = area of interface shear reinforcement crossing the shear
plane within the area Acv (in2), fy = yield stress of reinforcement (not to exceed 60 ksi), Pc =
permanent net compressive force normal to the shear plane; if the force is tensile then Pc=0.0
(kip), K1 = fraction of concrete strength available to resist interface shear, f’c = specified 28-day
compressive strength of the weaker concrete on either side of the interface (ksi), and K2 =
limiting interface shear resistance (ksi). The values for c, μ, K1, and K2 depend on the type of
concrete and the condition of the interface surface. These values are listed below:
For normal-weight concrete placed monolithically:
c = 0.40 ksi
μ = 1.4
K1 = 0.25
K2 = 1.5 ksi
For lightweight concrete placed monolithically, or nonmonolithically, against a clean
concrete surface, free of laitance with surface intentionally roughened to amplitude of
0.25 in.:
c = 0.24 ksi
μ = 1.0
K1 = 0.25
K2 = 1.0 ksi
For normal-weight concrete placed against a clean concrete surface, free of laitance, with
surface intentionally roughened to amplitude of 0.25 in.:
c = 0.24 ksi
μ = 1.0
20
K1 = 0.25
K2 = 1.5 ksi
For concrete placed against a clean concrete surface, free of laitance, but not intentionally
roughened:
c = 0.075
μ = 0.6
K1 = 0.2
K2 = 0.8 ksi
These equations were determined from data obtained from tests on horizontal shear
conducted by various researchers. The normal weight, non-monolithic concrete strength data
ranged between 2.5 ksi and 16.5 ksi. The normal weight, monolithic concrete data varied from
3.5 ksi to 28.0 ksi. Sand-lightweight concrete strengths were between 2.0 ksi and 6.0 ksi, while
all-lightweight concrete strength data was between 4.0 ksi and 5.2 ksi.
2.4 Reliability Analysis
The assurance of structural safety and reliability is one of the key objectives in
engineering design. Such designs are normally formulated under inherent conditions of
uncertainty. These uncertainties result from the random nature of loading and the structural
resistance, as well as imperfections in the load and resistance models. Through the applications
of reliability theory it is possible to quantify some of the uncertainties involved in design, and to
incorporate consideration of these uncertainties in design codes.
Reliability is a measure of the likelihood of a failure. In structural reliability analysis
failure is defined within the context of a limit state. A limit state is the boundary between desired
and undesired performance. The two types of limit states in structural design are strength limit
21

states and serviceability limit states. In the fundamental reliability model, the load, Q, and the
resistance, R, are considered to be random variables which can be described by their respective
probability density functions. The quantitative measure of safety or reliability is the probability
of survival, ps, which is given by
ps = P(R > Q)
or its complement measure, the probability of failure pf
pf = P(R < Q)
In general the probability density functions for the resistance fR(r) and the load effect fQ(q) are
required to evaluate the probability of failure. In practice, the density functions of the load and
resistance are seldom available. Thus, for practical application, approximate methods of
reliability evaluation are necessary. Most of these methods are based on characterizing the load
and resistance by their first two moments, that is, their means and standard deviations and the
measure of reliability is the reliability index.
2.4.1 Reliability Index
Various formats for calculating the reliability index β have been developed. These are
described in Nowak and Collins (2000). In general, reliability can be expressed through the use
of a limit state function g() such as
g(R,Q) = R – Q
where R – Q represents the safety margin. Failure occurs when R – Q < 0 or when g() < 0. The
probability of failure pf can be expressed as
pf = P(R-Q) < 0 = P(g() <0)
If R and Q are normally distributed random variables the reliability index can be
calculated from the following equation:
22
I = JKLJMNOKPQOMPR
S.T
where mR = mean value of resistance, mQ = mean value of the total load effect, σR = standard
deviation of resistance, and σQ = standard deviation of the total load effect. The reliability index
is directly related to the probability of failure, pf, by
I = ALG(�,) where φ
-1() is the inverse standard normal distribution function.
2.4.2 Resistance Statistics
The resistance structure can be represented as the product of the nominal resistance and
three factors:
U = U� ×0 × W × 1
where Rn = nominal resistance, M = material factor (reflecting variations in material properties
such as concrete strength, yield strength of reinforcing steel and modulus of elasticity), F=
fabrication factor (representing variations in member dimensions, moment of inertia and
placement of reinforcement), and P = professional factor (reflecting the accuracy of the
analytical model for predicting the resistance). The mean value of the resistance is given by:
DX = U� Y Z [
where λM = mean value (or bias factor) of M, λF = mean value (or bias factor) of F, and λP =
mean value (or bias factor) for P. The coefficient of variation of the resistance, R, is:
5X = (5YH + 5ZH + 5[H)G/H
where VR = coefficient of variation for nominal resistance, VM = coefficient of variation of M,
VF = coefficient of variation of F, and VP = coefficient of variation of P.
(2-19)
(2-17)
(2-15)
(2-18)
(2-16)
23
For the purposes of the study, the bias and coefficient of variation of the material and
fabrication factors were taken from previous research. Nowak and Szerszen (2001) listed
statistics of the fabrication factor for dimensions of concrete components, steel reinforcing bars
and prestressing strands. For example, it was suggested that for the width of a beam that is cast-
in-place the mean value of the fabrication factor is 1.01and the coefficient of variation is 0.04.
Nowak and Szerszen (2001) computed statistics of concrete strength from test data
obtained from industry. The test data included normal strength concrete in the range of 3,000 psi
to 6,500 psi, high strength concrete with strengths varying between 7,000 psi and 12,000 psi, and
lightweight concrete with strengths ranging between 3,000 psi and 5,000 psi. They determined
that the bias factor depends on the concrete strength. There is variation in the bias value if the
concrete strength is below about 5,000 psi. The bias at 3,000 psi is 1.4 and the bias curves down
to 1.15 at 5,000 psi. If the concrete strength is greater than 5,000 psi, the bias levels out to 1.15.
According to Nowak and Szerszen (2001) the coefficient of variation of concrete strength is 0.10
due to the uniformity of the data.
2.4.3 Load Statistics
For short and medium span girder bridges the most important load combination is a dead
load and live load. Thus, the loads considered in this study were limited to dead load and live
load. The statistical parameters for the dead and live load were obtained from previous research.
According to Nowak (1999) bias factor (ratio of mean to nominal) for cast-in-place concrete is
1.05 with a coefficient of variation of 0.10. For precast concrete the bias factor is 1.03 and the
coefficient of variation is 0.08. The variation in dead load comes from the weight of materials,
the dimensions, and the idealization in analytical models. For live loads Nowak (1999)
24
determined that the bias factor for a 75 year live load is 1.28 with a coefficient of variation of
0.18.
For the dead and live load combination the AASHTO LRFD standard specifies a dead
load factor of 1.25 for structural and attached nonstructural components and live load factor of
1.75 for vehicular load.
The mean and standard deviation of the combined load are obtained from the mean and
standard deviations of the individual loading components. The mean load is given by
D� = ] ^_ + ` __
where mQ = mean load, D = dead load, λDL = dead load bias factor, L = live load, and λLL = live
load bias factor. The standard deviation of the load is calculated from the following equation:
a� = '(] ^_5̂ _)H + (` __5__)H
where σQ = standard deviation of the combined load, D = dead load, λDL = dead load bias factor,
VDL = coefficient of variation of the dead load, L = live load, λLL = live load bias factor, and VLL
= coefficient of variation of the live load.
2.5 Summary of Literature Review
This literature review has shown that there is a considerable variability in the prediction
of horizontal shear strength based on the test results from the various studies. Research results
indicated that the reinforcement ratio, treatment of the interface, and the type of concrete are the
most important factors in predicting horizontal shear strength. The strength of the concrete did
not seem to play a significant role. The study of horizontal shear strength equation in the 5th
edition of the AASHTO LRFD bridge design will utilize the data obtained from the literature
review in order to assess the reliability of the AASHTO horizontal shear equation.
(2-20)
(2-21)
25
CHAPTER 3: DATABASE AND CALCULATION METHODS
3.1 Selection of Data
When considering the results of the researchers discussed in the literature review, not all
data was applicable to the current study. The primary types of data desired were data from tests
on interface types of smooth, rough, or monolithic where a failure had occurred in shear. Data
from Loov and Patnaik (1994); Kahn and Slapkus (2004); and Mattock, Johal, and Chow (1975)
was excluded for the cases where the specimens failed in flexure. Two of the specimens from
Valluvan, Kreger, and Jirsa (1999) were not included in the database because of failure in the
grout. Several of the specimens from Saemann and Washa (1964) failed in tension and tension-
shear and so they were excluded from the study. Data from Banta (2005) was not considered
because the interface consisted of deformed (a wavy deformation of 0.5 in. on 2 in. intervals),
keyed, and chipped (the jackhammered surface exposed steel fibers which added to the strength)
surfaces. Some of the specimens from Saemann and Washa (1964) and Hanson (1960) were also
excluded because the specimens had a keyed interface. Some specimens from Bass, Carrasquillo,
and Jirsa (1989) were excluded because of shear keys or because the specimens were cast
overhead. Several specimen groups from Kamel (1996) were excluded because of the double
shear interface and shear keys. Walraven and Reinhardt’s (1981) specimens with external
reinforcement were also excluded in this study.
Most of the tests for horizontal shear consisted of either a standard push-off test or a full
beam test. The interface area for the full beam tests was taken as the interface width multiplied
by the standard spacing of one unit of shear reinforcement. One exception to this was for Kahn
and Slapkus (2004), since they specified an interface area in their article. The interface area for
the push-off tests was taken as the product of the given width and contact length.
26
3.2 Calculation of Predicted Horizontal Shear
The AASHTO LRFD Bridge Design horizontal shear strength equation (2-14) was the
primary equation under consideration for this study. The information collected from the
experimental test results for the database consisted of the surface type, the concrete type, the
shear interface area, the amount of reinforcement across the interface, the yield strength of the
reinforcement, the applied normal force, the strength of the concrete, and the actual measured
shear strength. The surface was considered smooth if the intentional amplitude of an interface
surface did not reach 0.25 inch. For specimens made with two different types of concrete, the
concrete type that produced the most conservative results, which was lightweight, was taken as
the type of concrete. If the test was a full beam test where the interface area was taken as the
width of the interface multiplied by the spacing of the reinforcement, the area of the
reinforcement was taken as one unit of reinforcement whether that was one or two legs. The
yield strength of the reinforcing steel was taken as whatever was supplied by the researcher; no
limitations were used in the equation. If the concrete members were not cast monolithically, the
lesser concrete strength was used in the equation. The values of the applied shear were divided
by two to satisfy equilibrium for full beams tests for the cases where the load was applied at one
point in the center of the beam. The horizontal shear predicted by the AASHTO horizontal shear
equation using all of the measured properties from the experimental tests were then compared to
the actual measured horizontal shear values.
3.3 Reliability Analysis Procedures
Once the predicted horizontal shear values using measured parameters were calculated,
an analysis of the reliability of the AASHTO LRFD equation was performed. In order to
determine the reliability index, β, it is necessary to determine the statistics of the load and
27
resistance. The resistance as given in Equation (2-17) is the product of the nominal resistance
and the professional, material, and fabrication factors. The professional factor, P, is the ratio of
the measured shear strength to the shear strength predicted by the AASHTO LRFD horizontal
shear equation. Statistics of the professional factors such as the bias (or mean), standard
deviation and coefficient of variation for each category of concrete type (normal, lightweight,
high performance) and interface type (rough, smooth, monolithic) were computed using the
information collected in the database. The nominal resistance was obtained from the AASHTO
horizontal shear equation (Equation 2-14) using actual measured values for all of the variables in
the equation. The standard normal variable, Z, was calculated and plotted in order to determine if
P was normally distributed. The equation for the standard normal variable is:
� = ������������� ����� ��
���
where Vtest = the measured strength of the specimen, Vcalc = the predicted strength, Vmean = the
average measured strength of the all the specimens in category, and σ = the standard deviation
for the category. If the data set is normally distributed, the standard normal variables should form
an approximate straight line when plotted. Figures 3.1, 3.2, and 3.3 show the plotted distributions
of the standard normal variables. Since the charts showed a straight line in each category, this
indicates that P is normally distributed.
(3-1)
28

Figure 3.1: Rough interface normal variable distributions
Figure 3.2: Smooth interface normal variable distributions
-2
-1
0
1
2
3
4
0 1 2 3 4 5
Sta
nd
ard
No
rm
al
Va
ria
ble
Professional Bias
HIGH PERFORMANCE
LIGHTWEIGHT CONCRETE
NORMAL WEIGHT CONCRETE
-2
-1
0
1
2
3
4
0 2 4 6 8
Sta
nd
ard
No
rm
al
Va
ria
ble
Professional Bias
HIGH PERFORMANCE CONCRETE
LIGHTWEIGHT CONCRETE
NORMAL WEIGHT CONCRETE
29

Figure 3.3: Monolithic interface normal variable distributions
The resistance statistics (mean and standard deviation) for the load and resistance were
then calculated. The mean resistance was computed by multiplying the nominal resistance by the
professional, material and fabrication bias factors as given in Equation (2-18) and the coefficient
of variation of R was computed from the Equation (2-19) using the coefficients of variation of P,
M, and F presented in Section 2.4.2. The mean value and standard deviation of the load were
determined from Equations (2-20) and (2-21) using load statistics given by Novak (1999). The
reliability index was calculated from Equation (2-15) for a wide range of D/(D+L) (dead to total
load) ratios.
-3
-2
-1
0
1
2
3
4
0 0.5 1 1.5 2 2.5 3
Sta
nd
ard
No
rm
al
Va
ria
ble
Professional Bias
HIGH PERFORMANCE CONCRETE
LIGHTWEIGHT CONCRETE
NORMAL WEIGHT CONCRETE
30
CHAPTER 4: PRESENTATION OF RESULTS AND ANALYSIS
4.1 Typical Results
When considering the data presented, the necessity of separating the data for more
accurate results was apparent. The data was separated into three interface categories, namely,
rough, smooth, and monolithic. Within these three categories the data was further subdivided by
concrete type into normal weight, lightweight, and high strength concrete. In general the values
for horizontal shear obtained from the experimental studies were significantly higher than those
predicted by the AASHTO horizontal shear equation indicating that the AASHTO equation is
overly conservative. The average value of the professional factor, which is the ratio of the
measured strength to the calculated horizontal shear strength, for the different categories ranged
from 0.65 to 3.18. Also, the coefficients of variation of the professional factor tended to be quite
high indicating that there is considerable variability in the data. The higher coefficients of
variation were typically obtained for the studies in which there were a large number of
specimens. Since most of the research had been done with normal weight concrete of a rough or
smooth interface, the greatest variation between samples was found in this category.
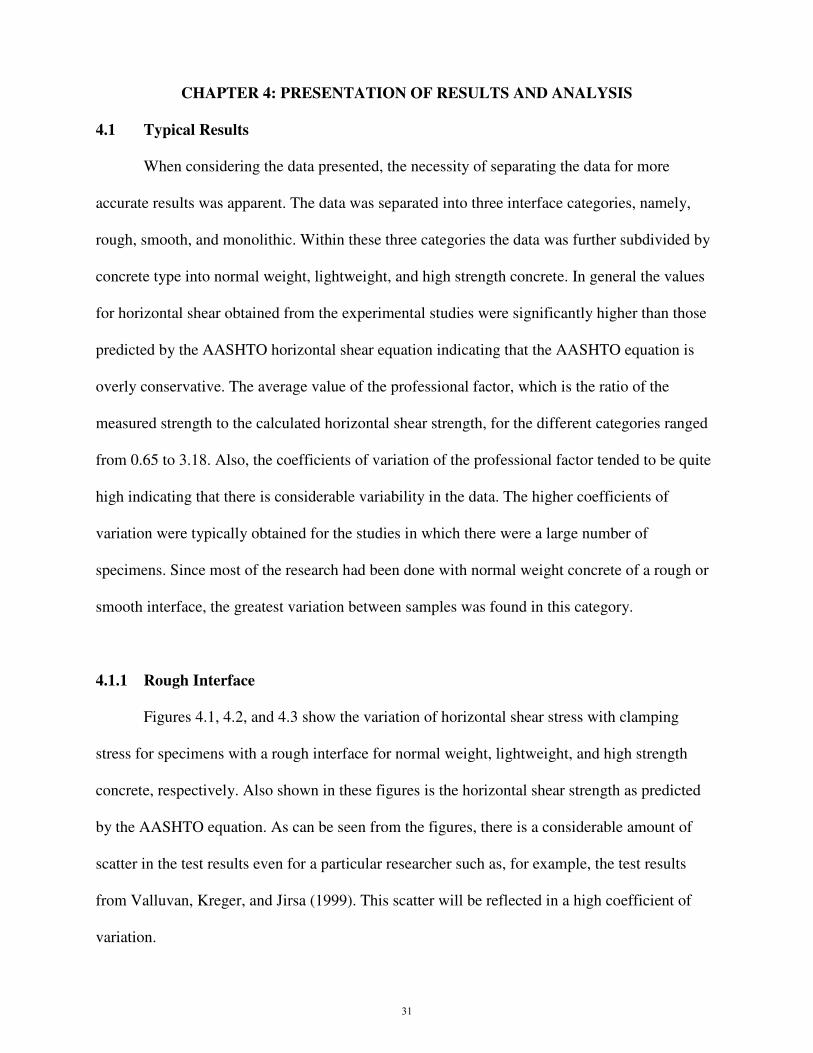
4.1.1 Rough Interface
Figures 4.1, 4.2, and 4.3 show the variation of horizontal shear stress with clamping
stress for specimens with a rough interface for normal weight, lightweight, and high strength
concrete, respectively. Also shown in these figures is the horizontal shear strength as predicted
by the AASHTO equation. As can be seen from the figures, there is a considerable amount of
scatter in the test results even for a particular researcher such as, for example, the test results
from Valluvan, Kreger, and Jirsa (1999). This scatter will be reflected in a high coefficient of
variation.
31
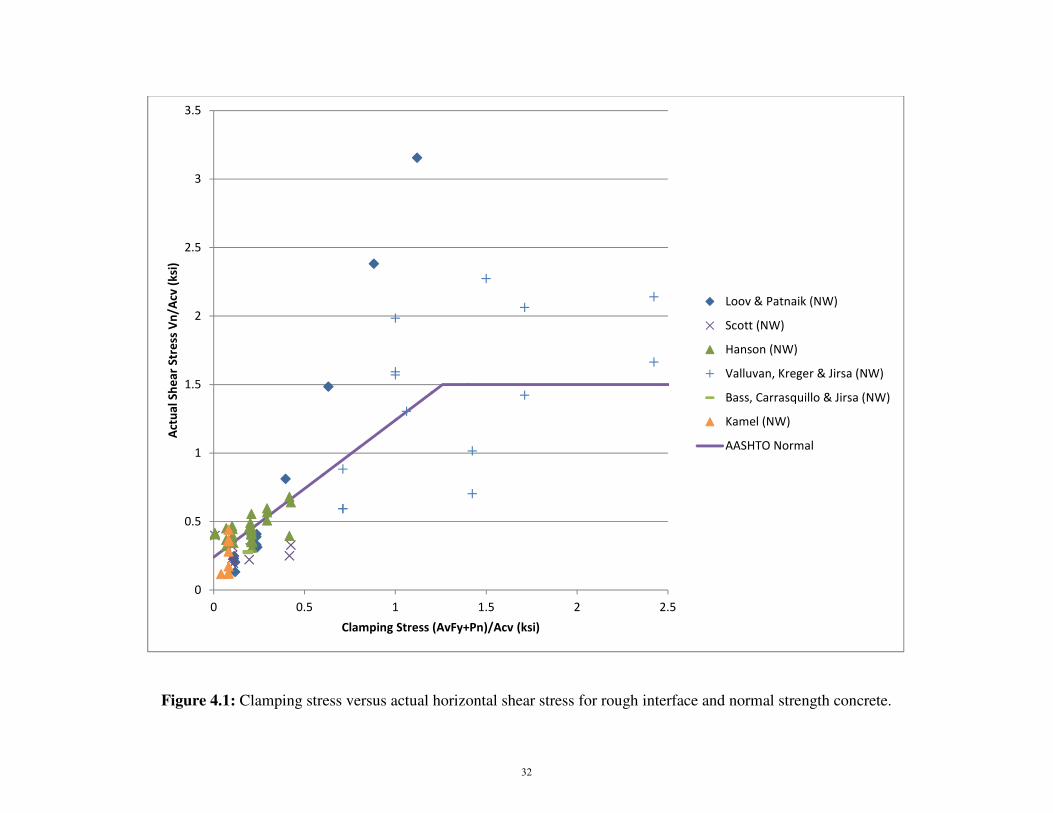
Figure 4.1: Clamping stress versus actual horizontal shear stress for rough interface and normal strength concrete.
0
0.5
1
1.5
2
2.5
3
3.5
0 0.5 1 1.5 2 2.5
Act
ua
l S
he
ar
Str
ess
Vn
/Acv
(k
si)
Clamping Stress (AvFy+Pn)/Acv (ksi)
Loov & Patnaik (NW)
Scott (NW)
Hanson (NW)
Valluvan, Kreger & Jirsa (NW)
Bass, Carrasquillo & Jirsa (NW)
Kamel (NW)
AASHTO Normal
32
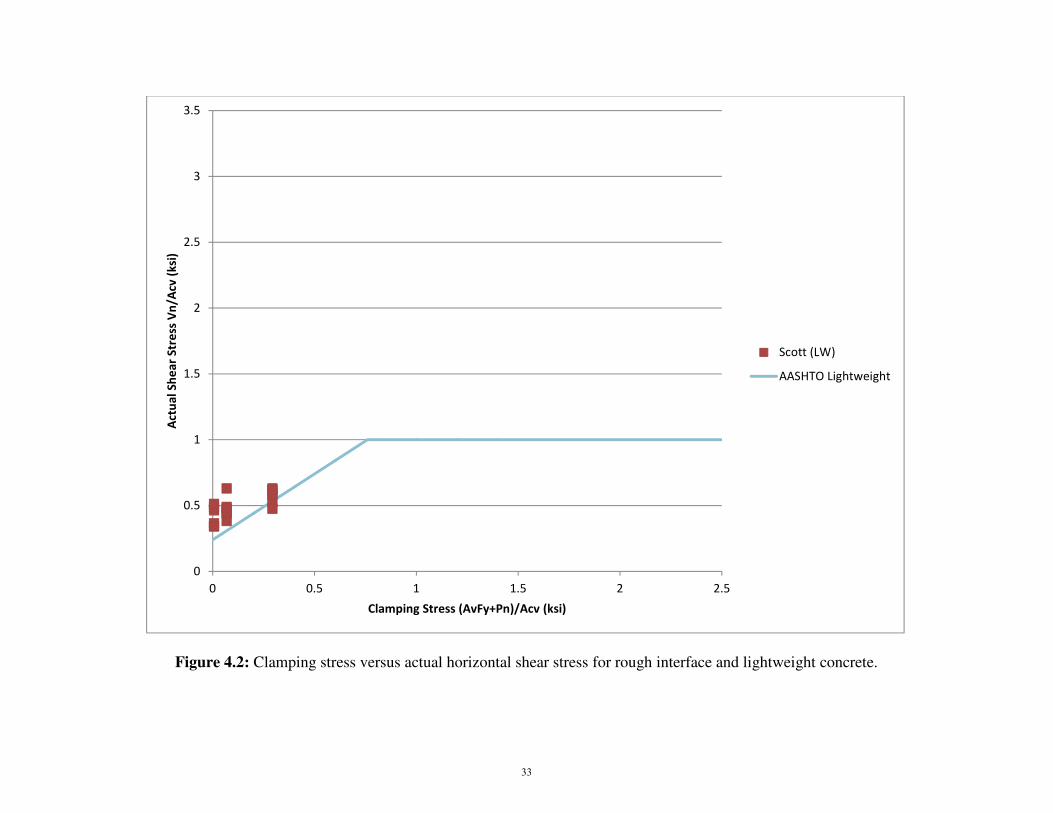
Figure 4.2: Clamping stress versus actual horizontal shear stress for rough interface and lightweight concrete.
0
0.5
1
1.5
2
2.5
3
3.5
0 0.5 1 1.5 2 2.5
Act
ua
l S
he
ar
Str
ess
Vn
/Acv
(k
si)
Clamping Stress (AvFy+Pn)/Acv (ksi)
Scott (LW)
AASHTO Lightweight
33
Figure 4.3: Clamping stress versus actual horizontal shear stress for rough interface and high strength concrete.
0
0.5
1
1.5
2
2.5
3
0 0.5 1 1.5 2 2.5
Act
ua
l S
he
ar
Str
ess
Vn
/Acv
(k
si)
Clamping Stress (AvFy+Pn)/Acv (ksi)
Kahn & Mitchell (HS)
Kahn & Slapkus (HS)
AASHTO Normal
34
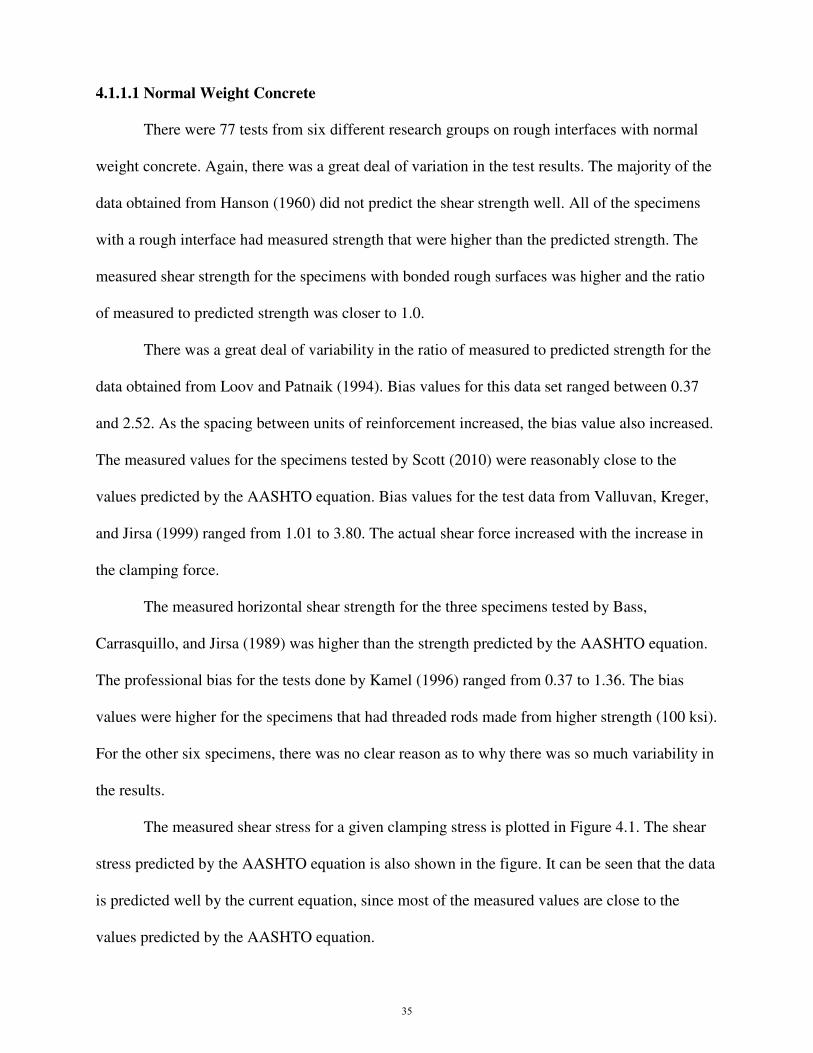
4.1.1.1 Normal Weight Concrete
There were 77 tests from six different research groups on rough interfaces with normal
weight concrete. Again, there was a great deal of variation in the test results. The majority of the
data obtained from Hanson (1960) did not predict the shear strength well. All of the specimens
with a rough interface had measured strength that were higher than the predicted strength. The
measured shear strength for the specimens with bonded rough surfaces was higher and the ratio
of measured to predicted strength was closer to 1.0.
There was a great deal of variability in the ratio of measured to predicted strength for the
data obtained from Loov and Patnaik (1994). Bias values for this data set ranged between 0.37
and 2.52. As the spacing between units of reinforcement increased, the bias value also increased.
The measured values for the specimens tested by Scott (2010) were reasonably close to the
values predicted by the AASHTO equation. Bias values for the test data from Valluvan, Kreger,
and Jirsa (1999) ranged from 1.01 to 3.80. The actual shear force increased with the increase in
the clamping force.
The measured horizontal shear strength for the three specimens tested by Bass,
Carrasquillo, and Jirsa (1989) was higher than the strength predicted by the AASHTO equation.
The professional bias for the tests done by Kamel (1996) ranged from 0.37 to 1.36. The bias
values were higher for the specimens that had threaded rods made from higher strength (100 ksi).
For the other six specimens, there was no clear reason as to why there was so much variability in
the results.
The measured shear stress for a given clamping stress is plotted in Figure 4.1. The shear
stress predicted by the AASHTO equation is also shown in the figure. It can be seen that the data
is predicted well by the current equation, since most of the measured values are close to the
values predicted by the AASHTO equation.
35
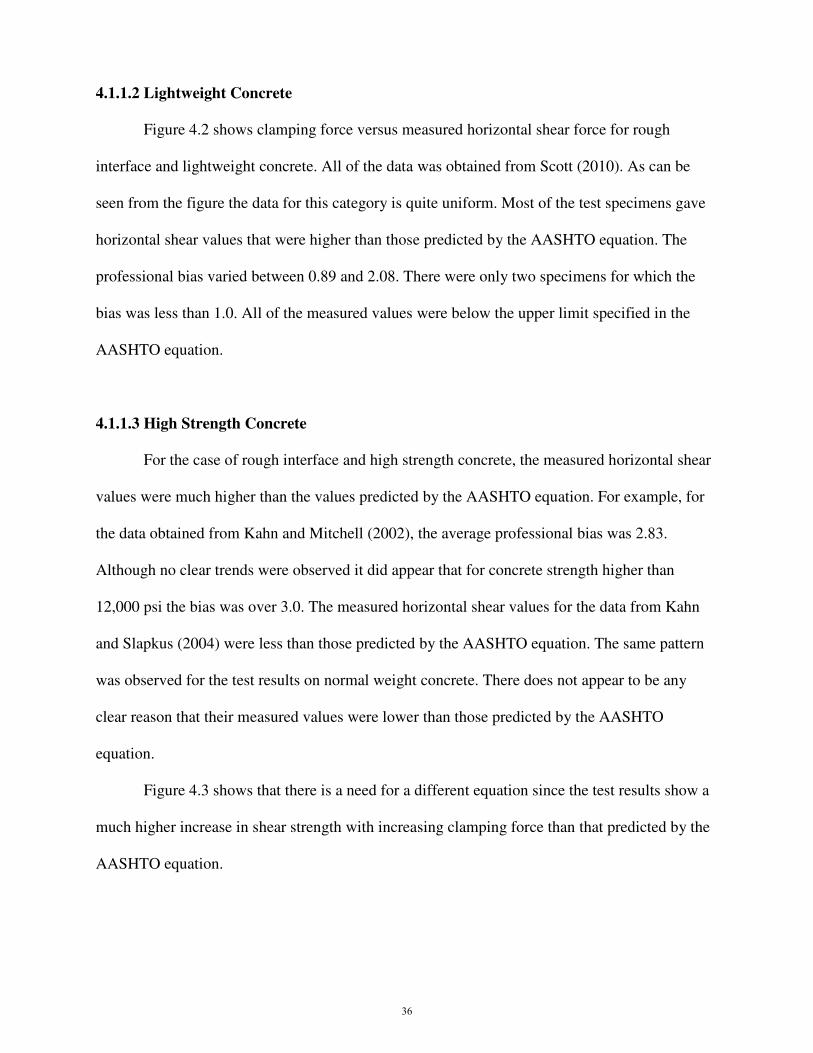
4.1.1.2 Lightweight Concrete
Figure 4.2 shows clamping force versus measured horizontal shear force for rough
interface and lightweight concrete. All of the data was obtained from Scott (2010). As can be
seen from the figure the data for this category is quite uniform. Most of the test specimens gave
horizontal shear values that were higher than those predicted by the AASHTO equation. The
professional bias varied between 0.89 and 2.08. There were only two specimens for which the
bias was less than 1.0. All of the measured values were below the upper limit specified in the
AASHTO equation.
4.1.1.3 High Strength Concrete
For the case of rough interface and high strength concrete, the measured horizontal shear
values were much higher than the values predicted by the AASHTO equation. For example, for
the data obtained from Kahn and Mitchell (2002), the average professional bias was 2.83.
Although no clear trends were observed it did appear that for concrete strength higher than
12,000 psi the bias was over 3.0. The measured horizontal shear values for the data from Kahn
and Slapkus (2004) were less than those predicted by the AASHTO equation. The same pattern
was observed for the test results on normal weight concrete. There does not appear to be any
clear reason that their measured values were lower than those predicted by the AASHTO
equation.
Figure 4.3 shows that there is a need for a different equation since the test results show a
much higher increase in shear strength with increasing clamping force than that predicted by the
AASHTO equation.
36

4.1.2 Smooth Interface
There were 220 test specimens that had a smooth interface. In general the measured shear
strength of the smooth interface specimens was higher than that predicted by the AASHTO
equation. There was only one set of test results (Hanson, 1960) for which the measured shear
strength values were less than those predicted by the AASHTO equation. Figures 4.4, 4.5, and
4.6 show the variation of measured shear stress with clamping stress. Also shown in the figures
is the shear strength predicted by the AASHTO equation.
37
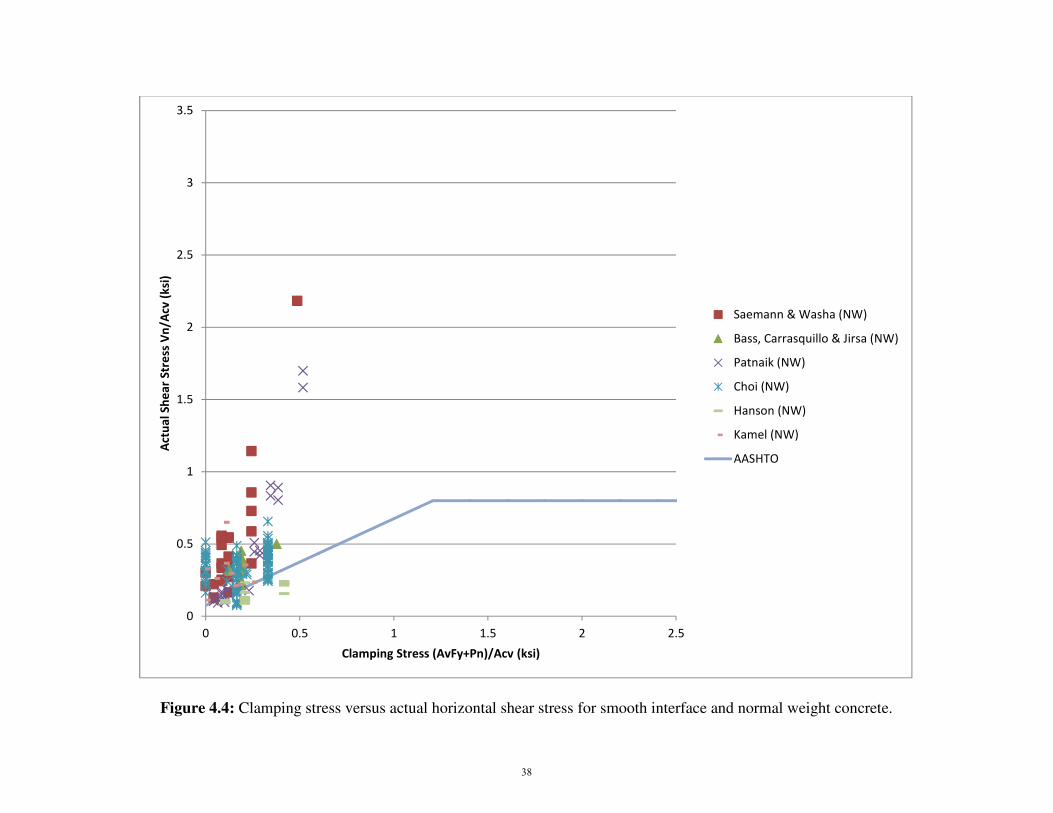
Figure 4.4: Clamping stress versus actual horizontal shear stress for smooth interface and normal weight concrete.
0
0.5
1
1.5
2
2.5
3
3.5
0 0.5 1 1.5 2 2.5
Act
ua
l S
he
ar
Str
ess
Vn
/Acv
(k
si)
Clamping Stress (AvFy+Pn)/Acv (ksi)
Saemann & Washa (NW)
Bass, Carrasquillo & Jirsa (NW)
Patnaik (NW)
Choi (NW)
Hanson (NW)
Kamel (NW)
AASHTO
38
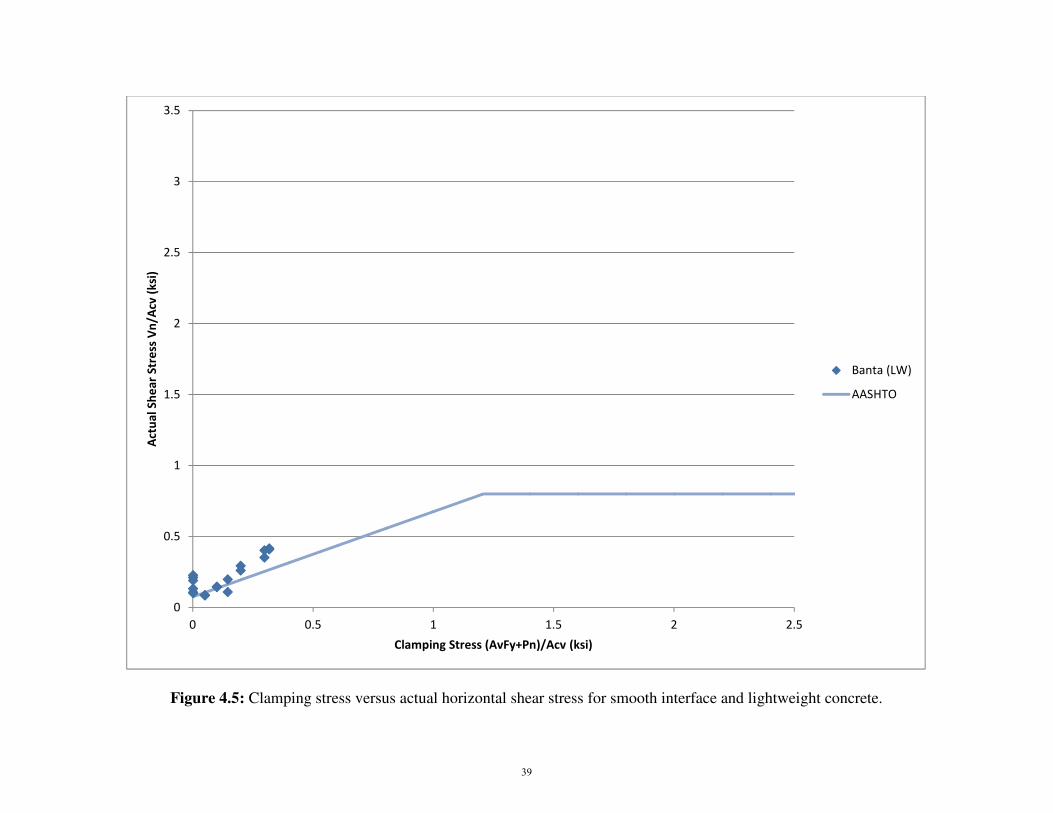
Figure 4.5: Clamping stress versus actual horizontal shear stress for smooth interface and lightweight concrete.
0
0.5
1
1.5
2
2.5
3
3.5
0 0.5 1 1.5 2 2.5
Act
ua
l S
he
ar
Str
ess
Vn
/Acv
(k
si)
Clamping Stress (AvFy+Pn)/Acv (ksi)
Banta (LW)
AASHTO
39

Figure 4.6: Clamping stress versus actual horizontal shear stress for smooth interface and high strength concrete.
0
0.5
1
1.5
2
2.5
3
3.5
0 0.5 1 1.5 2 2.5
Act
ua
l S
he
ar
Str
ess
Vn
/Acv
(k
si)
Clamping Stress (AvFy+Pn)/Acv (ksi)
Kahn & Mitchell (HS)
AASHTO
40

4.1.2.1 Normal Weight Concrete
There were a total of two hundred tests performed on specimens with smooth interfaces
made from normal weight concrete. The ratio of measured to predicted shear strength ranged
from 1.1 to 5.17 for the tests conducted by Saemann and Washa (1964). This ratio was higher for
specimens with intermediate roughness, that is, specimens that did not meet the roughness
amplitude of 0.25 in. It also appeared that specimens with similar conditions but had smaller
interface areas had higher measured to predicted strength ratios. The test data obtained from
Bass, Carrasquillo, and Jirsa (1989) also gave ratios of measured to predicted horizontal shear
strength greater than 1.0. For this set of tests the ratio ranged from 1.14 to 2.40. The lowest ratio
of 1.14 was obtained for the only specimen that was smooth, while the other specimens were
sandblasted but not to the required roughness amplitude. There did not seem to be a clear
difference beyond the level of roughness as to why some specimens had higher or lower
measured to predicted strength ratios. The professional bias for the tests by Patnaik (2001) was
1.80. The ratios of test to predicted shear strength varied from 0.71 to 4.41.
The highest actual to predicted ratios were found for test specimens that had the greatest
amount of reinforcement in the smallest amount of interface area. Choi (1996) performed 103
push-off tests. The overall professional bias factor for this set of tests was 2.16 and the values
ranged from 0.43 to 6.83. There was a clear increase in the bias when there was no reinforcement
across the shear interface in the push-off specimens. Other than the lack of reinforcement, there
were no other factors that could account for the variation in the bias values. For the specimens
tested by Hanson (1960), there was no effort made to prevent bonding to the precast girder.
These tests produced a mean actual to calculated shear strength ratio of 0.69. The measured to
predicted ratios varied between 0.45 and 1.15. There was no clear reasoning for the variation.
The mean value of test to predicted shear strength ratios for the specimens tested by Kamel
41
(1996) was 2.32 with individual values of the ratio ranging from 1.05 to 4.37. There were two
specimens that were bonded, and these two specimens gave ratios greater than four. All of the
other specimens were smooth, unbonded that all had ratios of test to predicted shear strength
below 2.75. Figure 4.4 shows that the current AASHTO equation is quite conservative, since
most of the measured shear strength values lie above the line.
4.1.2.2 Lightweight Concrete
Banta (2005) was the only researcher in this database that considered a smooth interface
for lightweight concrete. The ratio of actual shear strength to predicted shear strength varied
between 0.66 and 2.99. When no reinforcement steel was present, the ratio was higher. The bias
was lower when there was less steel area relative to the interface area. There were only three
push-off tests out of a total of eighteen for which the bias was less than 1.0. Figure 4.5 illustrates
that the current AASHTO equation is a good fit for the results presented by Banta.
4.1.2.3 High Strength Concrete
There were only two specimens which had a smooth interface and were made with high
strength concrete. These two specimens were tested by Kahn and Mitchell (2002). The
professional bias values for the two specimens were 3.18 and 3.19. Since there were only two
specimens, no conclusions can be made with any confidence as seen in Figure 4.6.
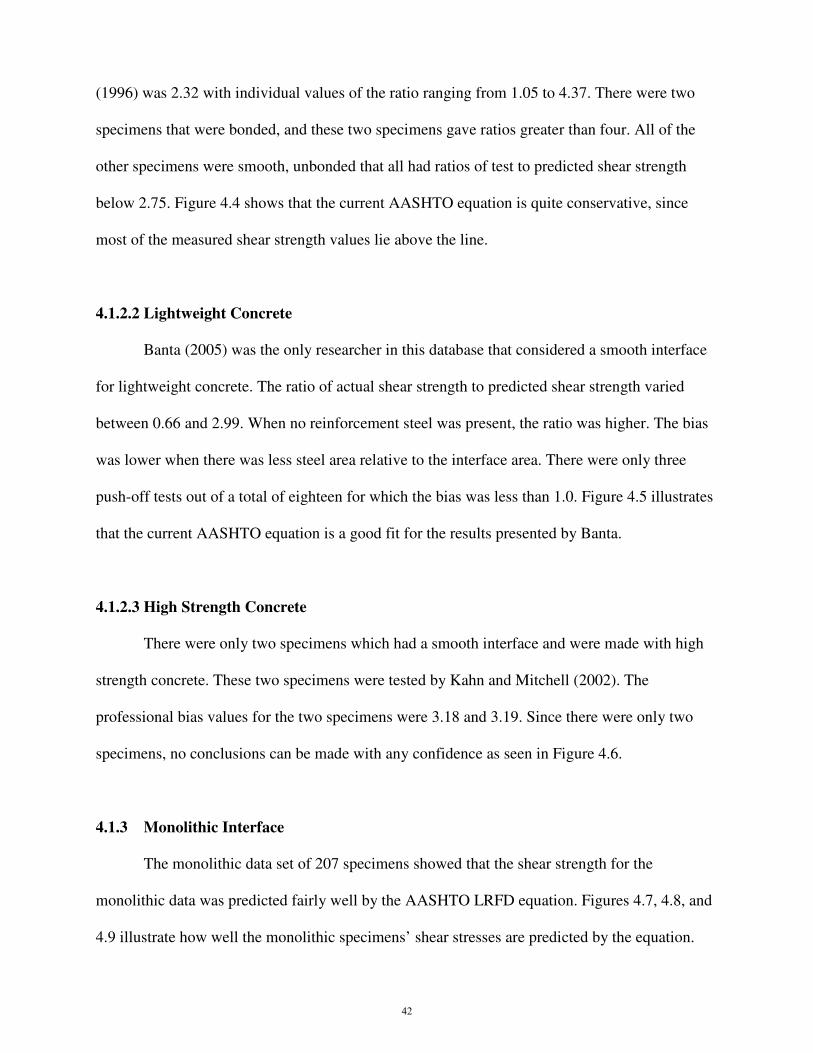
4.1.3 Monolithic Interface
The monolithic data set of 207 specimens showed that the shear strength for the
monolithic data was predicted fairly well by the AASHTO LRFD equation. Figures 4.7, 4.8, and
4.9 illustrate how well the monolithic specimens’ shear stresses are predicted by the equation.
42
Figure 4.7: Clamping stress versus actual horizontal shear stress for monolithic interface and normal weight concrete.
0
0.5
1
1.5
2
2.5
3
3.5
0 0.5 1 1.5 2 2.5
Act
ua
l S
he
ar
Str
ess
Vn
/Acv
(k
si)
Clamping Stress (AvFy+Pn)/Acv (ksi)
Hofbeck, Ibrahim & Mattock (NW)
Mattock, Johal & Chow (NW)
Mattock, Li, & Wang (NW)
Walraven & Reinhardt (NW)
AASHTO - Norm. Wt.
43

Figure 4.8: Clamping stress versus actual horizontal shear stress for monolithic interface and lightweight concrete.
0
0.5
1
1.5
2
2.5
3
3.5
0 0.5 1 1.5 2 2.5
Act
ua
l S
he
ar
Str
ess
Vn
/Acv
(k
si)
Clamping Stress (AvFy+Pn)/Acv (ksi)
Mattock, Li, & Wang (LW)
Walraven & Reinhardt (LW)
AASHTO - Lightweight
44

Figure 4.9: Clamping stress versus actual horizontal shear stress for monolithic interface and high strength concrete.
0
0.5
1
1.5
2
2.5
3
3.5
0 0.5 1 1.5 2 2.5
Act
ua
l S
he
ar
Str
ess
Vn
/Acv
(k
si)
Clamping Stress (AvFy+Pn)/Acv (ksi)
Kahn & Mitchell (HS)
AASHTO - Norm. Wt.
45

4.1.3.1 Normal Weight Concrete
The data for monolithically cast specimens made from normal weight concrete was
obtained from tests performed by four research groups. The bias values for the tests by Hofbeck,
Ibrahim, and Mattock (1969) ranged from 0.55 to 1.57 with a mean of 1.20. The AASHTO
equation under predicted the strength of all the uncracked specimens. There was a slight trend
that if there was a very low amount of reinforcement across the interface, the shear equation did
not do an adequate job of predicting the horizontal shear strength. The ratio of actual to
calculated horizontal shear strength for the results from Mattock, Johal, and Chow (1975) were
less than or equal to 1.0. The professional bias was 0.92 and the ratio of measured to predicted
strength ranged from 0.63 to 1.36. A general trend that was observed was that for a constant
interface shear area, the ratio of actual to measured strength decreased as the shear reinforcement
decreased. Test results from Mattock, Li, and Wang (1976) in comparison to the AASHTO
equation produced a mean professional factor of 1.09 with values of the ratio of measured to
predicted shear strength being between 0.64 and 1.48. The highest ratio of 1.48 was found when
there was no shear reinforcement across the interface. Walraven and Reinhardt (1981) data was
predicted well by the current equation through the mean professional factor of 1.21 with a
minimum ratio of 0.89 and maximum ratio of 1.79. There was a higher ratio when the concrete
mix did not include quartz powder in the concrete mix. Figure 4.7 shows that the current
equation has an even variation around the predicted value, which means the current equation
works well for normal weight monolithic concrete.
4.1.3.2 Lightweight Concrete
Mattock, Li, and Wang (1976) also performed shear tests for lightweight concrete in
monolithic placements. The average professional factor was 1.13 in a range of 0.76 to 2.33.
46

When there was no reinforcement across the interface, the bias was above 2.0, while all other
ratios were below. Walraven and Reinhardt (1981) performed a series of shear strength test on a
set of lightweight concrete. The data presented confidence in the AASHTO equation with a mean
actual to predicted ratio of 1.81 within the range of 1.40 to 2.30. It seemed that as the clamping
stress increased, the actual to predicted horizontal shear ratio came closer to 1.0. Figure 4.8
illustrates that there may be a need to change the inclination of the clamping stress.
4.1.3.3 High Strength Concrete
The only tests on horizontal shear strength of high strength concrete specimens formed
monolithically were done by Kahn and Mitchell (2002). The results of the 38 push-off tests when
compared with the AASHTO equation resulted in mean actual shear strength to predicted shear
strength ratio of 1.61. The range of ratios was 0.68 to 2.72. It was apparent that uncracked
specimens were under predicted as seen through a higher ratio of actual to theoretical where the
minimum ratio is 1.53. Values of the professional factor for the cracked specimens ranged
between 0.68 and 1.39. This clearly indicates that the importance of whether or not a surface has
been precracked. There is a high amount of variation as illustrated in Figure 4.9, and the data is
mostly conservative.
4.2 Reliability Analysis
After all of the ratios of actual to predicted horizontal shear strengths were calculated, the
distribution of the data was confirmed to have a normal distribution as shown in Figures 3.1, 3.2,
and 3.3. All of the data categories within each group were normally distributed, since the
standard normal variables were in a straight line. Since there is insufficient data on cohesion and
friction factors to perform a Monte Carlo simulation, a simple reliability analysis was performed
47
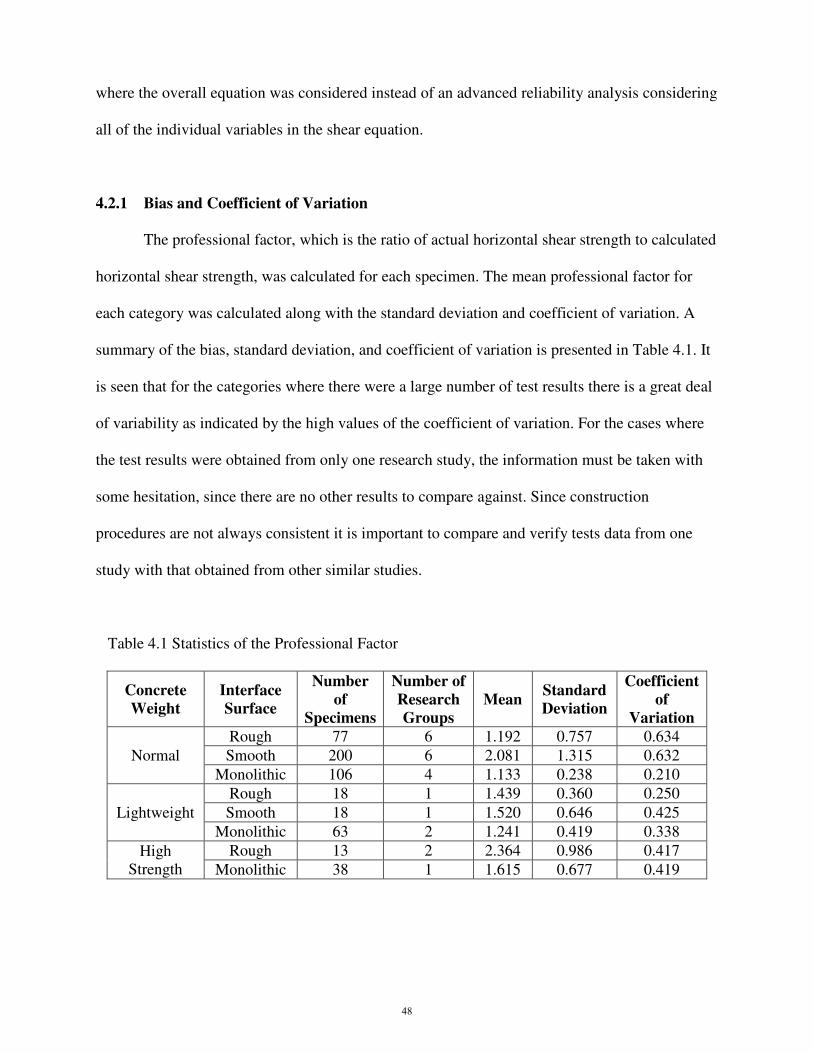
where the overall equation was considered instead of an advanced reliability analysis considering
all of the individual variables in the shear equation.
4.2.1 Bias and Coefficient of Variation
The professional factor, which is the ratio of actual horizontal shear strength to calculated
horizontal shear strength, was calculated for each specimen. The mean professional factor for
each category was calculated along with the standard deviation and coefficient of variation. A
summary of the bias, standard deviation, and coefficient of variation is presented in Table 4.1. It
is seen that for the categories where there were a large number of test results there is a great deal
of variability as indicated by the high values of the coefficient of variation. For the cases where
the test results were obtained from only one research study, the information must be taken with
some hesitation, since there are no other results to compare against. Since construction
procedures are not always consistent it is important to compare and verify tests data from one
study with that obtained from other similar studies.
Table 4.1 Statistics of the Professional Factor
Concrete
Weight
Interface
Surface
Number
of
Specimens
Number of
Research
Groups
Mean Standard
Deviation
Coefficient
of
Variation
Normal
Rough 77 6 1.192 0.757 0.634
Smooth 200 6 2.081 1.315 0.632
Monolithic 106 4 1.133 0.238 0.210
Lightweight
Rough 18 1 1.439 0.360 0.250
Smooth 18 1 1.520 0.646 0.425
Monolithic 63 2 1.241 0.419 0.338
High
Strength
Rough 13 2 2.364 0.986 0.417
Monolithic 38 1 1.615 0.677 0.419
48

Statistical parameters of the resistance (mean and coefficient of variation) were then
computed using the statistics of the professional factor listed in Table 4.1 and the statistics of the
material and fabrication factors obtained from previous research as described in Section 2.4.2.
The statistical parameters of the horizontal shear resistance are summarized below in Table 4.2.
Table 4.2 Statistical Parameters of Resistance
Concrete
Weight
Interface
Surface
Bias
Factor
Coefficient
of Variation
Normal
Rough 1.482 0.643
Smooth 2.690 0.641
Monolithic 1.396 0.236
Lightweight
Rough 1.686 0.272
Smooth 1.765 0.438
Monolithic 1.529 0.355
High
Strength
Rough 2.746 0.431
Monolithic 1.876 0.433
49

4.2.2 Reliability Indices
Reliability indices were calculated for the dead plus live (D+L) load combination for the
different categories of interface and concrete type using Equations (2-20) and (2-21). Reliability
indices for a range of dead to dead plus live load (D/(D+L)) ratios are shown in Figures 4.10,
4.11, and 4.12.
Figure 4.10: Reliability indices for AASHTO LRFD for normal weight concrete
0.0
0.5
1.0
1.5
2.0
2.5
3.0
3.5
4.0
0.2 0.3 0.4 0.5 0.6 0.7 0.8
Re
lia
bil
ity
In
de
x
D/(D+L)
NW -
Smooth
NW- Rough
NW - Mono
50
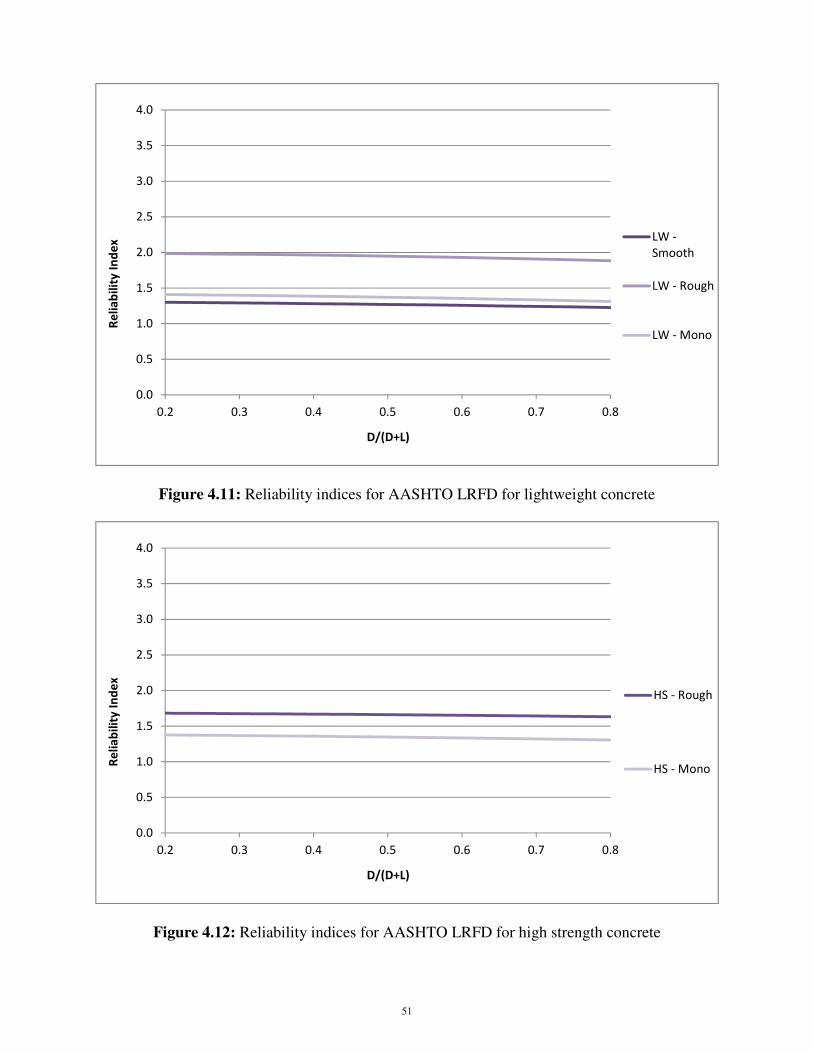
Figure 4.11: Reliability indices for AASHTO LRFD for lightweight concrete
Figure 4.12: Reliability indices for AASHTO LRFD for high strength concrete
0.0
0.5
1.0
1.5
2.0
2.5
3.0
3.5
4.0
0.2 0.3 0.4 0.5 0.6 0.7 0.8
Re
lia
bil
ity
In
de
x
D/(D+L)
LW -
Smooth
LW - Rough
LW - Mono
0.0
0.5
1.0
1.5
2.0
2.5
3.0
3.5
4.0
0.2 0.3 0.4 0.5 0.6 0.7 0.8
Re
lia
bil
ity
In
de
x
D/(D+L)
HS - Rough
HS - Mono
51

Since there were only two test specimens with high strength concrete and smooth
interface, the reliability analysis was not performed for this category because of a lack of data.
The specimens with normal weight concrete monolithically placed had the highest reliability
indices followed by specimens with lightweight concrete and a rough interface. It is important to
remember that the results for categories for which the test data was obtained from one research
group should be considered with reservation since the variation in results due to different
construction methods and concrete mixes cannot be observed.
4.2.3 Comparison to Wallenfelsz
Wallenfelsz (2006) studied the horizontal shear strength of precast on precast sections. At
the conclusion of this research, Wallenfelsz proposed the following equation for predicting the
horizontal shear strength:
�� = ��� � ��� ��� + ��� Cohesion is considered separately from the clamping stress under the belief that the cohesive
bond fails before the clamping of the reinforcement occurs. The cohesion factor and friction
factors were taken to be the same as those in the current AASHTO LRFD equation. In order to
compare the horizontal shear strength predicted by AASHTO LRFD equation and the
Wallenfelsz equation, the reliability analysis was repeated using the nominal resistance as
predicted by the Wallenfelsz equation. A summary of the statistical parameters of the
professional factor for the Wallenfelsz equation is given in Table 4.2. The mean value of the
professional factor was higher than expected, since the two elements of the AASHTO equation
are considered separately in the Wallenfelsz equation. Also, the coefficient of variation for most
of the categories was lower.
(4-1)
52
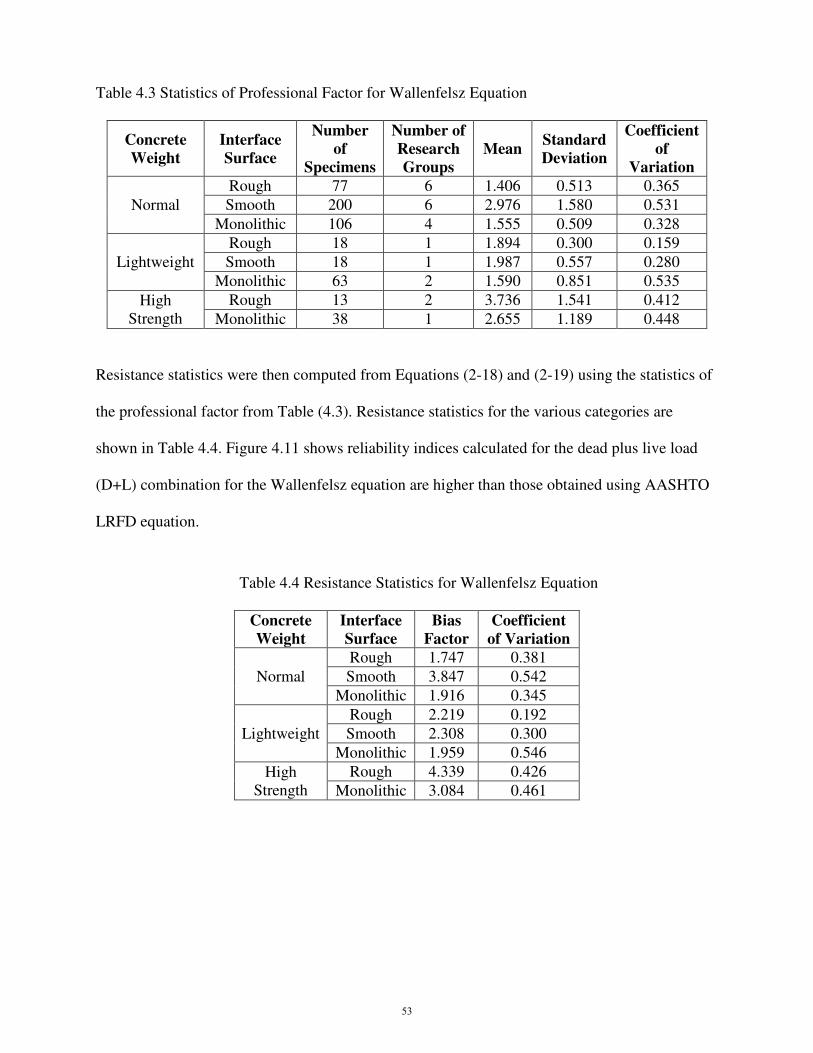
Table 4.3 Statistics of Professional Factor for Wallenfelsz Equation
Concrete
Weight
Interface
Surface
Number
of
Specimens
Number of
Research
Groups
Mean Standard
Deviation
Coefficient
of
Variation
Normal
Rough 77 6 1.406 0.513 0.365
Smooth 200 6 2.976 1.580 0.531
Monolithic 106 4 1.555 0.509 0.328
Lightweight
Rough 18 1 1.894 0.300 0.159
Smooth 18 1 1.987 0.557 0.280
Monolithic 63 2 1.590 0.851 0.535
High
Strength
Rough 13 2 3.736 1.541 0.412
Monolithic 38 1 2.655 1.189 0.448
Resistance statistics were then computed from Equations (2-18) and (2-19) using the statistics of
the professional factor from Table (4.3). Resistance statistics for the various categories are
shown in Table 4.4. Figure 4.11 shows reliability indices calculated for the dead plus live load
(D+L) combination for the Wallenfelsz equation are higher than those obtained using AASHTO
LRFD equation.
Table 4.4 Resistance Statistics for Wallenfelsz Equation
Concrete
Weight
Interface
Surface
Bias
Factor
Coefficient
of Variation
Normal
Rough 1.747 0.381
Smooth 3.847 0.542
Monolithic 1.916 0.345
Lightweight
Rough 2.219 0.192
Smooth 2.308 0.300
Monolithic 1.959 0.546
High
Strength
Rough 4.339 0.426
Monolithic 3.084 0.461
53
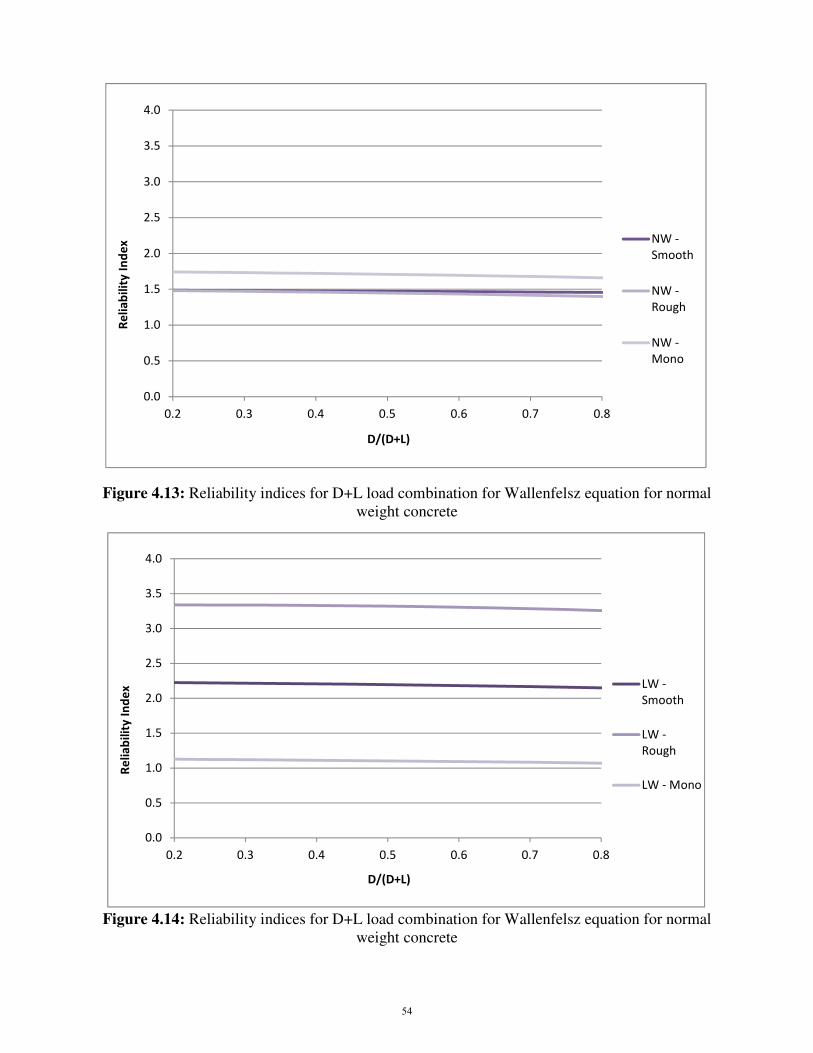
Figure 4.13: Reliability indices for D+L load combination for Wallenfelsz equation for normal
weight concrete
Figure 4.14: Reliability indices for D+L load combination for Wallenfelsz equation for normal
weight concrete
0.0
0.5
1.0
1.5
2.0
2.5
3.0
3.5
4.0
0.2 0.3 0.4 0.5 0.6 0.7 0.8
Re
lia
bil
ity
In
de
x
D/(D+L)
NW -
Smooth
NW -
Rough
NW -
Mono
0.0
0.5
1.0
1.5
2.0
2.5
3.0
3.5
4.0
0.2 0.3 0.4 0.5 0.6 0.7 0.8
Re
lia
bil
ity
In
de
x
D/(D+L)
LW -
Smooth
LW -
Rough
LW - Mono
54
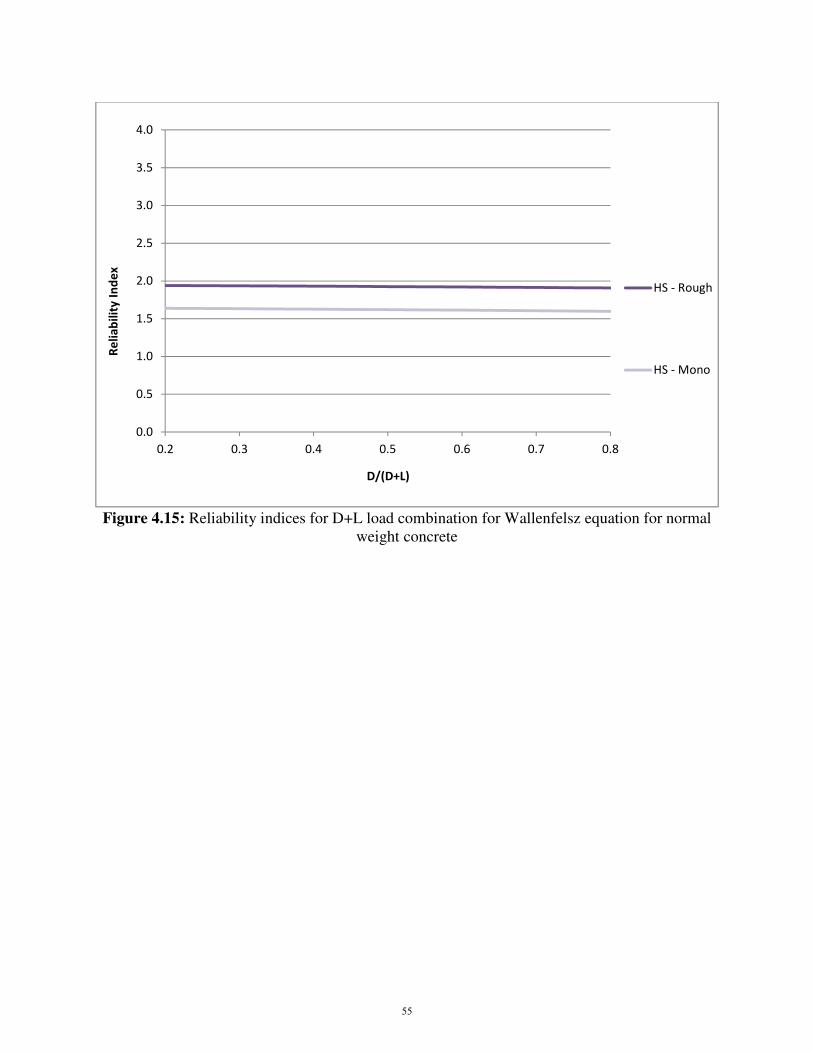
Figure 4.15: Reliability indices for D+L load combination for Wallenfelsz equation for normal
weight concrete
0.0
0.5
1.0
1.5
2.0
2.5
3.0
3.5
4.0
0.2 0.3 0.4 0.5 0.6 0.7 0.8
Re
lia
bil
ity
In
de
x
D/(D+L)
HS - Rough
HS - Mono
55
CHAPTER 5: SUMMARY, CONCLUSIONS AND RECOMMENDATIONS
5.1 Summary
Composite action of a bridge’s deck and girder system is essential in producing an
efficient superstructure. The combination of the deck and girder increases the moment of inertia
so a stiffer cross section is produced to resist the moment. Applied forces on the deck are
transferred through to the girders by the cohesive action between the interface of the deck and
the girder, in addition to the tensile forces in the reinforcement crossing the interface. The
transfer of forces allows for the girder and deck to act as one to resist the applied load.
The objective of this research was to study the reliability of the provisions for horizontal
shear strength in the AASHTO LRFD bridge design specifications. A database of applicable
horizontal shear tests was created from previous research done in this area. The database
contains the essential equation variables for each specimen. The horizontal shear strength
predicted by the AASHTO equation was computed using the actual measured values of all of the
variables in the equation. The professional factor is the ratio of the measured horizontal shear
strength from the tests to the shear strength predicted by the AASHTO equation. Statistics of the
professional factor namely the professional bias which is the mean value of this ratio and the
coefficient of variation of the professional factor were determined for various categories based
on the interface surface and concrete type.
In order to determine the level of reliability, the statistics of the material properties factor
and the fabrication factor were also needed. The statistics of these factors were determined by
Nowak (1999) from the results of his research and were used for the purposes of this study. The
mean and coefficient of variation of the resistance were then determined using the statistics of
the professional factor, P, the material factor, M, and the fabrication factor, F. The mean and
56
coefficient of variation of the load effect were computed for a range of dead to total (dead plus
live) load ratios. The reliability index for the AASHTO LRFD horizontal shear equation was
then computed using the means and coefficients of variation of the resistance and loading. The
process was repeated for the equation proposed by Wallenfelsz (2006) to determine if that
equation was a better predictor of horizontal shear strength.
5.2 Conclusions
In most of the experimental cases considered, the AASHTO LRFD horizontal shear
equation provided a conservative prediction of the horizontal shear strength provided by the
specimen. This was evident by the fact that the professional bias factors were above 1.0. The
professional bias factor was influenced by the shear reinforcement ratio for some of the
experimental studies. However, there were other studies in which the reinforcement ratio did not
have an influence on the professional bias.
The reliability of the AASHTO horizontal shear equation was found to be well below the
target value of 3.5 due to the fact that there was considerable variability in the test data as
evidenced by the high coefficients of variation for the professional factor. Reliability indices for
normal strength concrete were low for the rough (0.95) and smooth (1.20) interface conditions.
The monolithic interface fared better with an average reliability index of 2.45. The variation in
the reliability index due to interface type was greater for lightweight concrete, with values of
reliability index ranging from 2.40 for rough interface, 1.50 for smooth interface and 1.75 for
monolithic respectively. The average reliability index for high strength concrete was 1.75.
Wallenfelsz’s equation resulted in the reliability indices that were closer to the target
value of 3.5. The resistance bias factors for Wallenfelsz’s equation were higher than those for the
AASHTO equation while the loading factors remained the same. For normal weight concrete the
57

average reliability index was 1.55 for smooth surfaces, 1.75 for rough surfaces, and 2.00 for
monolithic. For lightweight concrete the average reliability index was 2.50 for smooth surfaces,
3.30 for rough surfaces, and 1.30 for monolithic. The reliability index for high strength concrete
was 2.05 for rough surfaces and 1.75 for monolithic.
The reliability indices for both equations were not close to the target reliability index of
3.5 which clearly shows that a better equation is needed for predicting horizontal shear stress.
5.3 Design Recommendations
The reliability of the current AASHTO LRFD horizontal shear equation is suboptimum,
which is a cause for concern. It is recommended that a lower resistance factor (φ) should be used
in order to increase the reliability. With the current equation, all of the φ factors for horizontal
shear strength should be made equal to the minimum 0.60. Even with the low φ factor, there is
still a level of concern over the low reliability indices.
Based on these findings, there is a need for a new equation for predicting horizontal
shear. As recommended below, the factors that influence horizontal shear capacity need to be
fully understood in order to develop a better horizontal shear equation. Since the reliability of
Wallenfelsz’s equation is higher than that of the current AASTHO LRFD equation, utilization of
Wallenfelsz’s equation is recommended until a better equation has been developed. The current
AASHTO cohesion and friction factors may be used in conjunction with the Wallenfelsz’s
equation as shown below:
�� = ��� � ��� ��� + ��� where c = cohesion factor, Acv = area of concrete considered to be engaged in interface shear
transfer (in2), μ = friction factor, Avf = area of interface shear reinforcement crossing the shear
58

plane within the area Acv (in2), fy = yield stress of reinforcement (ksi), and Pn = permanent net
compressive force normal to the shear plane. If this equation is implemented, the recommended
φ factors would be 0.7 for the lightweight concrete and 0.6 for normal weight and high strength
concrete. However, it is important to remember that test data for each of the different categories
of surface interface for high strength and lightweight concrete was quite limited as compared
with normal weight concrete and so the recommendations for high strength and lightweight
concrete should be reevaluated when additional test data becomes available.
5.4 Recommendations for Future Research
Based on the on the results of this study some suggestions for future research are as
follows:
• Additional experimental tests of horizontal shear strength of lightweight and high strength
concrete specimens of various interface types should be conducted.
• Research with a focus on identifying the most important factors influencing horizontal shear
strength must be completed in order to develop an equation that more accurately predicts the
shear strength.
• For a more advanced reliability analysis, further research into the statistical parameters of the
cohesion and friction factors must be done in order to perform Monte Carlo simulation for
the horizontal shear equation.
59

REFERENCES
Banta, T. E. (2005). Horizontal Shear Transfer Between Ultra High Performance Concrete and
Lightweight Concrete. Via Department of Civil & Environmental Engineering. Blacksburg, VA,
Virginia Polytechnic Institute & State University. Masters of Science: 138.
Bass, R. A., R. L. Carrasquillo, et al. (1989). "Shear Transfer across New and Existing Concrete
Interfaces." ACI Structural Journal 86(4): 383-393.
Choi, D. (1996). An Experimental Investigation of Interface Bond Strength of Concrete Using
Large Powder-Driven Nails. Department of Civil Engineering. Austin, TX, The University of
Texas at Austin. Doctor of Philosophy: 340.
Hanson, N. W. (1960). "Precast-Prestressed Concrete Bridges 2. Horizontal Shear Connections."
Journal of the PCA Research and Development Laboratories 2(2): 38-60.
Hofbeck, J. A., I. O. Ibrahim, et al. (1969). "Shear Transfer in Reinforced Concrete." Journal of
the American Concrete Institute 66(1): 119-128.
Kahn, L. F. and A. D. Mitchell (2002). "Shear Friction Tests with High-Strength Concrete." ACI
Structural Journal 99(1): 98-103.
Kahn, L. F. and A. Slapkus (2004). "Interface Shear in High Strength Composite T-Beams." PCI
Journal 49(4): 102-110.
Kamel, M. R. (1996). Innovative Precast Concrete Composite Bridge Systems. Civil
Engineering. Lincoln, Nebraska, University of Nebraska. Doctor of Philosophy: 246.
Loov, R. E. and A. K. Patnaik (1994). "Horizontal Shear Strength of Composite Concrete Beams
With a Rough Interface." PCI Journal 39(1): 48-69.
Mattock, A. H., L. Johal, et al. (1975). "Shear transfer in reinforced concrete with moment or
tension acting across the shear plane." PCI Journal 20(4): 76-93.
Mattock, A. H., W. K. Li, et al. (1976). "Shear transfer in lightweight reinforced concrete." PCI
Journal 21(1): 20-39.
Nowak, A. S. (1999). Calibration of LRFD Bridge Design Code. Washington, D.C., National
Cooperative Highway Research Program: 37.
Nowak, A. S. and M. M. Szerszen (2003). "Calibration of Design Code for Buildings (ACI 318):
Part 1 - Statistical Models for Resistance." ACI Structural Journal 100(3): 6.
Nowak, A. S. and K. R. Collins (2000). Reliability of Structures. Boston, McGraw-Hill.
Nowak, A. S. and M. M. Szerszen (2001). Reliability-Based Calibration for Structural Concrete,
Portland Cement Association: 188.
60
Officials, A. A. o. S. H. a. T. (2010). AASHTO LRFD bridge design specifications. Interface
Shear Transfer - Shear Friction. Washington, D.C.: 7.
Patnaik, A. K. (2001). "Behavior of Composite Concrete Beams with Smooth Interface." Journal
of Structural Engineering 127(4): 359-366.
Saemann, J. C. and G. W. Washa (1964). "Horizontal Shear Connections Between Precast
Beams and Cast-in-Place Slabs." Journal of the American Concrete Institute 61(11): 1383-1408.
Scott, J. (2010). Interface Shear Strength in Lightweight Concrete Bridge Girders. Via
Department of Civil & Environmental Engineering. Blacksburg, VA, Virginia Polytechnic
Institute and State University. Masters of Science: 147.
Valluvan, R., M. E. Kreger, et al. (1999). "Evaluation of ACI 318-95 Shear-Friction Provisions."
ACI Structural Journal 96(4): 473-481.
Wallenfelsz, J. A. (2006). Horizontal Shear Transfer for Full-Depth Precast Concrete Bridge
Deck Panels. Via Department of Civil & Environmental Engineering. Blacksburg, VA, Virginia
Polytechnic Institute & State University. Masters of Science: 118.
Walraven, J. C. and H. W. Reinhardt (1981). "Theory and Experiments on the Mechincal
Behaviour of Cracks in Plain and Reinforced Concrete Subjected to Shear Loading." Heron
26(1a): 68.
61

APPENDIX A
Database Values
62
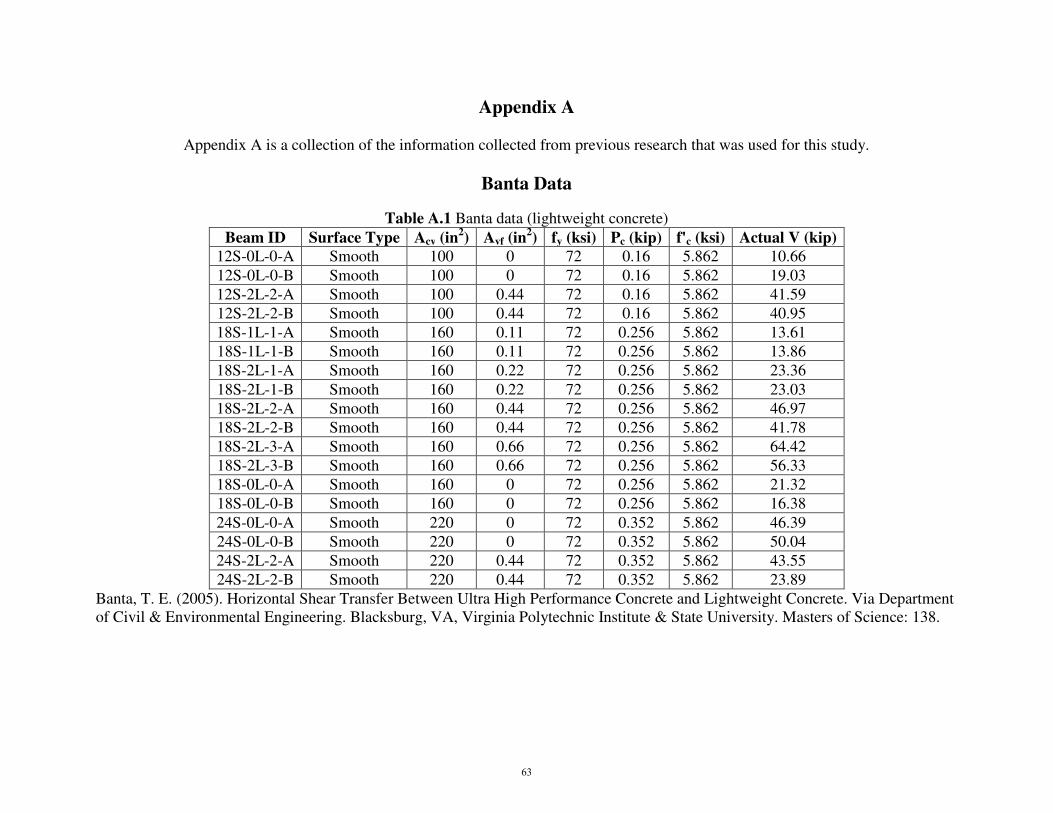
Appendix A
Appendix A is a collection of the information collected from previous research that was used for this study.
Banta Data
Table A.1 Banta data (lightweight concrete)
Beam ID Surface Type Acv (in2) Avf (in
2) fy (ksi) Pc (kip) f'c (ksi) Actual V (kip)
12S-0L-0-A Smooth 100 0 72 0.16 5.862 10.66
12S-0L-0-B Smooth 100 0 72 0.16 5.862 19.03
12S-2L-2-A Smooth 100 0.44 72 0.16 5.862 41.59
12S-2L-2-B Smooth 100 0.44 72 0.16 5.862 40.95
18S-1L-1-A Smooth 160 0.11 72 0.256 5.862 13.61
18S-1L-1-B Smooth 160 0.11 72 0.256 5.862 13.86
18S-2L-1-A Smooth 160 0.22 72 0.256 5.862 23.36
18S-2L-1-B Smooth 160 0.22 72 0.256 5.862 23.03
18S-2L-2-A Smooth 160 0.44 72 0.256 5.862 46.97
18S-2L-2-B Smooth 160 0.44 72 0.256 5.862 41.78
18S-2L-3-A Smooth 160 0.66 72 0.256 5.862 64.42
18S-2L-3-B Smooth 160 0.66 72 0.256 5.862 56.33
18S-0L-0-A Smooth 160 0 72 0.256 5.862 21.32
18S-0L-0-B Smooth 160 0 72 0.256 5.862 16.38
24S-0L-0-A Smooth 220 0 72 0.352 5.862 46.39
24S-0L-0-B Smooth 220 0 72 0.352 5.862 50.04
24S-2L-2-A Smooth 220 0.44 72 0.352 5.862 43.55
24S-2L-2-B Smooth 220 0.44 72 0.352 5.862 23.89
Banta, T. E. (2005). Horizontal Shear Transfer Between Ultra High Performance Concrete and Lightweight Concrete. Via Department
of Civil & Environmental Engineering. Blacksburg, VA, Virginia Polytechnic Institute & State University. Masters of Science: 138.
63

Bass, Carrasquillo, & Jirsa Data
Table A.2 Bass, Carrasquillo, and Jirsa data (normal weight concrete)
Beam ID Surface Type Acv (in2) Avf (in
2) fy (ksi) Pc (kip) f'c (ksi) Actual V (kip)
12A 1/4" chip 420 1.32 60 0 2.75 118
18A 1/4" chip 420 1.32 60 0 2.75 118
21A 1/4" chip 420 1.32 60 0 3.7 115
14A Smooth 420 1.32 60 0 2.75 90
1A Sandblasted 420 1.32 60 0 3.1 145
2A Sandblasted 420 1.32 60 0 3.1 153
3A Sandblasted 420 1.32 60 0 3.1 152
4A Sandblasted 420 1.32 60 0 3.1 165
5A Sandblasted 420 1.32 60 0 3.1 150
6A Sandblasted 420 1.32 60 0 3.1 165
7A Sandblasted 420 0.88 60 0 3.1 132
8A Sandblasted 420 2.64 60 0 3.1 210
9A Sandblasted 420 1.32 60 0 3.1 190
10A Sandblasted 420 1.32 60 0 3.1 130
11A Sandblasted, cast vert. 420 1.32 60 0 2.7 104
17A Sandblasted 420 1.32 60 0 2.7 125
20A Sandblasted 420 1.32 60 0 2.87 134
23A Sandblasted 420 1.32 60 0 3.95 135
24A Sandblasted 420 1.32 60 0 3.95 160
1B Sandblasted 420 1.32 60 0 3.21 102
2B Sandblasted 420 1.32 60 0 3.21 150
3B Sandblasted 420 1.32 60 0 3.21 162
4B Sandblasted 420 0.88 60 0 3.21 137
5B Sandblasted 420 1.32 60 0 3.21 166
6B Sandblasted 420 1.32 60 0 3.21 172
17B Sandblasted 420 1.32 60 0 2.87 151
21B Sandblasted 420 1.32 60 0 3.57 132
Bass, R. A., R. L. Carrasquillo, et al. (1989). "Shear Transfer across New and Existing Concrete Interfaces." ACI Structural Journal
86(4): 383-393.
64
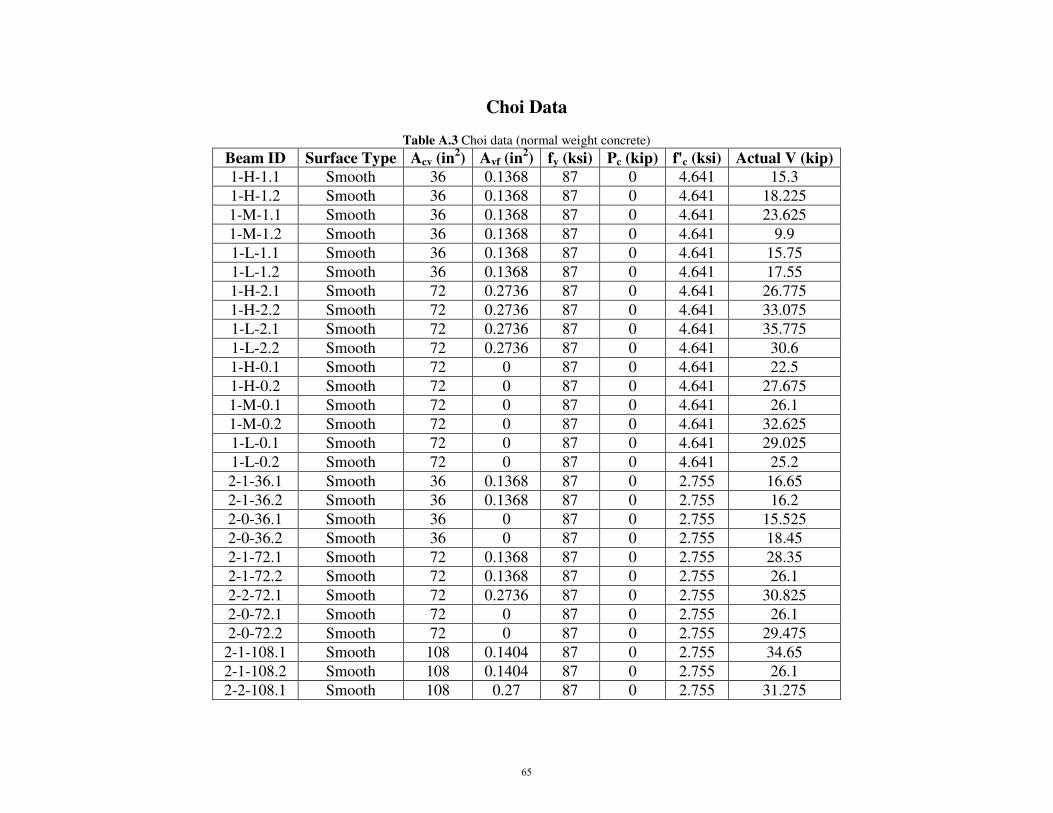
Choi Data
Table A.3 Choi data (normal weight concrete)
Beam ID Surface Type Acv (in2) Avf (in
2) fy (ksi) Pc (kip) f'c (ksi) Actual V (kip)
1-H-1.1 Smooth 36 0.1368 87 0 4.641 15.3
1-H-1.2 Smooth 36 0.1368 87 0 4.641 18.225
1-M-1.1 Smooth 36 0.1368 87 0 4.641 23.625
1-M-1.2 Smooth 36 0.1368 87 0 4.641 9.9
1-L-1.1 Smooth 36 0.1368 87 0 4.641 15.75
1-L-1.2 Smooth 36 0.1368 87 0 4.641 17.55
1-H-2.1 Smooth 72 0.2736 87 0 4.641 26.775
1-H-2.2 Smooth 72 0.2736 87 0 4.641 33.075
1-L-2.1 Smooth 72 0.2736 87 0 4.641 35.775
1-L-2.2 Smooth 72 0.2736 87 0 4.641 30.6
1-H-0.1 Smooth 72 0 87 0 4.641 22.5
1-H-0.2 Smooth 72 0 87 0 4.641 27.675
1-M-0.1 Smooth 72 0 87 0 4.641 26.1
1-M-0.2 Smooth 72 0 87 0 4.641 32.625
1-L-0.1 Smooth 72 0 87 0 4.641 29.025
1-L-0.2 Smooth 72 0 87 0 4.641 25.2
2-1-36.1 Smooth 36 0.1368 87 0 2.755 16.65
2-1-36.2 Smooth 36 0.1368 87 0 2.755 16.2
2-0-36.1 Smooth 36 0 87 0 2.755 15.525
2-0-36.2 Smooth 36 0 87 0 2.755 18.45
2-1-72.1 Smooth 72 0.1368 87 0 2.755 28.35
2-1-72.2 Smooth 72 0.1368 87 0 2.755 26.1
2-2-72.1 Smooth 72 0.2736 87 0 2.755 30.825
2-0-72.1 Smooth 72 0 87 0 2.755 26.1
2-0-72.2 Smooth 72 0 87 0 2.755 29.475
2-1-108.1 Smooth 108 0.1404 87 0 2.755 34.65
2-1-108.2 Smooth 108 0.1404 87 0 2.755 26.1
2-2-108.1 Smooth 108 0.27 87 0 2.755 31.275
65
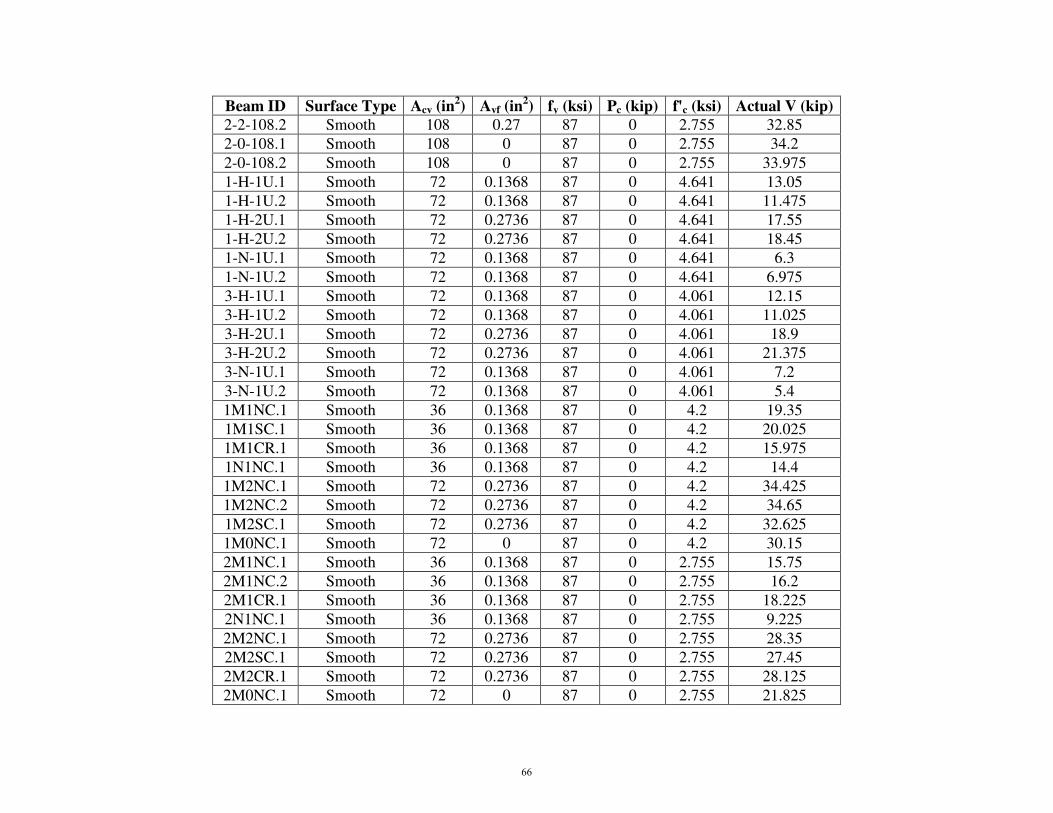
Beam ID Surface Type Acv (in2) Avf (in
2) fy (ksi) Pc (kip) f'c (ksi) Actual V (kip)
2-2-108.2 Smooth 108 0.27 87 0 2.755 32.85
2-0-108.1 Smooth 108 0 87 0 2.755 34.2
2-0-108.2 Smooth 108 0 87 0 2.755 33.975
1-H-1U.1 Smooth 72 0.1368 87 0 4.641 13.05
1-H-1U.2 Smooth 72 0.1368 87 0 4.641 11.475
1-H-2U.1 Smooth 72 0.2736 87 0 4.641 17.55
1-H-2U.2 Smooth 72 0.2736 87 0 4.641 18.45
1-N-1U.1 Smooth 72 0.1368 87 0 4.641 6.3
1-N-1U.2 Smooth 72 0.1368 87 0 4.641 6.975
3-H-1U.1 Smooth 72 0.1368 87 0 4.061 12.15
3-H-1U.2 Smooth 72 0.1368 87 0 4.061 11.025
3-H-2U.1 Smooth 72 0.2736 87 0 4.061 18.9
3-H-2U.2 Smooth 72 0.2736 87 0 4.061 21.375
3-N-1U.1 Smooth 72 0.1368 87 0 4.061 7.2
3-N-1U.2 Smooth 72 0.1368 87 0 4.061 5.4
1M1NC.1 Smooth 36 0.1368 87 0 4.2 19.35
1M1SC.1 Smooth 36 0.1368 87 0 4.2 20.025
1M1CR.1 Smooth 36 0.1368 87 0 4.2 15.975
1N1NC.1 Smooth 36 0.1368 87 0 4.2 14.4
1M2NC.1 Smooth 72 0.2736 87 0 4.2 34.425
1M2NC.2 Smooth 72 0.2736 87 0 4.2 34.65
1M2SC.1 Smooth 72 0.2736 87 0 4.2 32.625
1M0NC.1 Smooth 72 0 87 0 4.2 30.15
2M1NC.1 Smooth 36 0.1368 87 0 2.755 15.75
2M1NC.2 Smooth 36 0.1368 87 0 2.755 16.2
2M1CR.1 Smooth 36 0.1368 87 0 2.755 18.225
2N1NC.1 Smooth 36 0.1368 87 0 2.755 9.225
2M2NC.1 Smooth 72 0.2736 87 0 2.755 28.35
2M2SC.1 Smooth 72 0.2736 87 0 2.755 27.45
2M2CR.1 Smooth 72 0.2736 87 0 2.755 28.125
2M0NC.1 Smooth 72 0 87 0 2.755 21.825
66
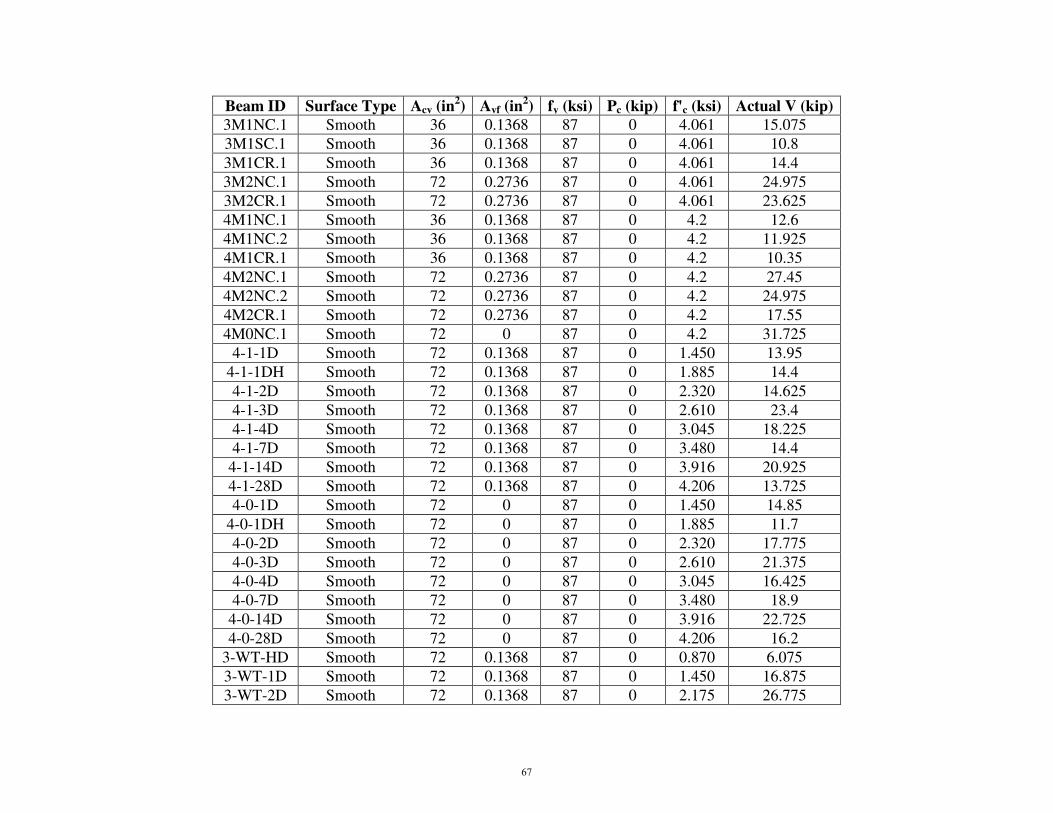
Beam ID Surface Type Acv (in2) Avf (in
2) fy (ksi) Pc (kip) f'c (ksi) Actual V (kip)
3M1NC.1 Smooth 36 0.1368 87 0 4.061 15.075
3M1SC.1 Smooth 36 0.1368 87 0 4.061 10.8
3M1CR.1 Smooth 36 0.1368 87 0 4.061 14.4
3M2NC.1 Smooth 72 0.2736 87 0 4.061 24.975
3M2CR.1 Smooth 72 0.2736 87 0 4.061 23.625
4M1NC.1 Smooth 36 0.1368 87 0 4.2 12.6
4M1NC.2 Smooth 36 0.1368 87 0 4.2 11.925
4M1CR.1 Smooth 36 0.1368 87 0 4.2 10.35
4M2NC.1 Smooth 72 0.2736 87 0 4.2 27.45
4M2NC.2 Smooth 72 0.2736 87 0 4.2 24.975
4M2CR.1 Smooth 72 0.2736 87 0 4.2 17.55
4M0NC.1 Smooth 72 0 87 0 4.2 31.725
4-1-1D Smooth 72 0.1368 87 0 1.450 13.95
4-1-1DH Smooth 72 0.1368 87 0 1.885 14.4
4-1-2D Smooth 72 0.1368 87 0 2.320 14.625
4-1-3D Smooth 72 0.1368 87 0 2.610 23.4
4-1-4D Smooth 72 0.1368 87 0 3.045 18.225
4-1-7D Smooth 72 0.1368 87 0 3.480 14.4
4-1-14D Smooth 72 0.1368 87 0 3.916 20.925
4-1-28D Smooth 72 0.1368 87 0 4.206 13.725
4-0-1D Smooth 72 0 87 0 1.450 14.85
4-0-1DH Smooth 72 0 87 0 1.885 11.7
4-0-2D Smooth 72 0 87 0 2.320 17.775
4-0-3D Smooth 72 0 87 0 2.610 21.375
4-0-4D Smooth 72 0 87 0 3.045 16.425
4-0-7D Smooth 72 0 87 0 3.480 18.9
4-0-14D Smooth 72 0 87 0 3.916 22.725
4-0-28D Smooth 72 0 87 0 4.206 16.2
3-WT-HD Smooth 72 0.1368 87 0 0.870 6.075
3-WT-1D Smooth 72 0.1368 87 0 1.450 16.875
3-WT-2D Smooth 72 0.1368 87 0 2.175 26.775
67
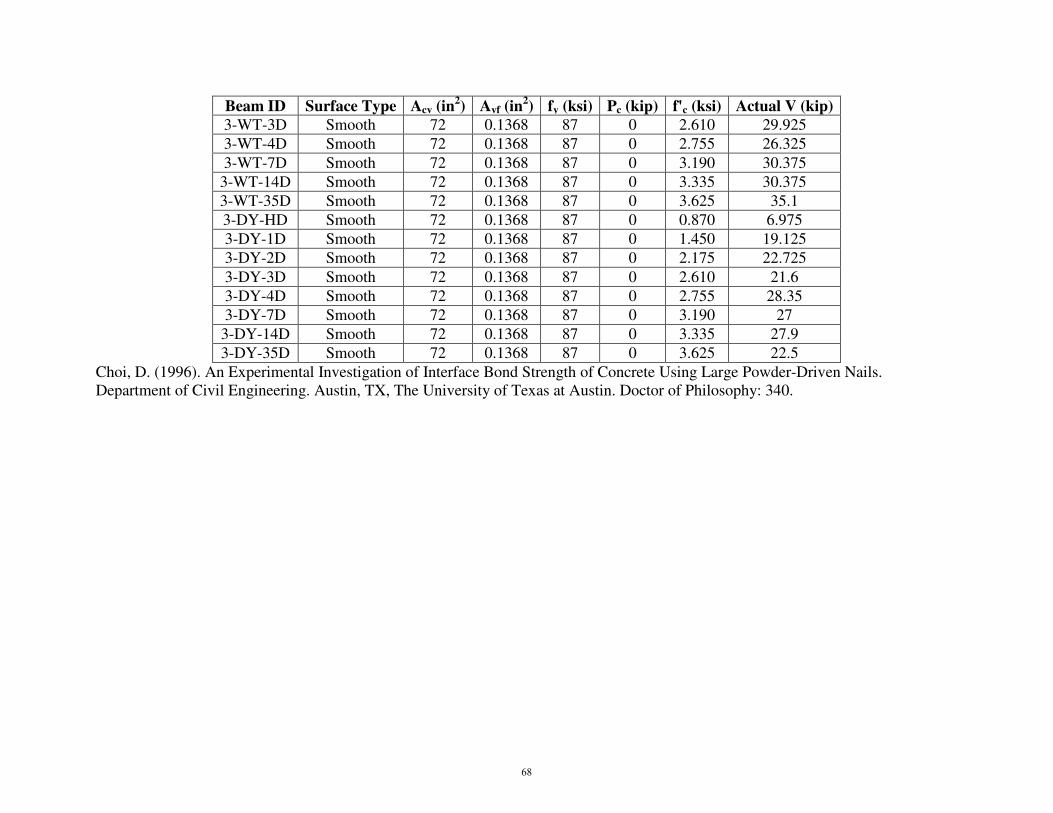
Beam ID Surface Type Acv (in2) Avf (in
2) fy (ksi) Pc (kip) f'c (ksi) Actual V (kip)
3-WT-3D Smooth 72 0.1368 87 0 2.610 29.925
3-WT-4D Smooth 72 0.1368 87 0 2.755 26.325
3-WT-7D Smooth 72 0.1368 87 0 3.190 30.375
3-WT-14D Smooth 72 0.1368 87 0 3.335 30.375
3-WT-35D Smooth 72 0.1368 87 0 3.625 35.1
3-DY-HD Smooth 72 0.1368 87 0 0.870 6.975
3-DY-1D Smooth 72 0.1368 87 0 1.450 19.125
3-DY-2D Smooth 72 0.1368 87 0 2.175 22.725
3-DY-3D Smooth 72 0.1368 87 0 2.610 21.6
3-DY-4D Smooth 72 0.1368 87 0 2.755 28.35
3-DY-7D Smooth 72 0.1368 87 0 3.190 27
3-DY-14D Smooth 72 0.1368 87 0 3.335 27.9
3-DY-35D Smooth 72 0.1368 87 0 3.625 22.5
Choi, D. (1996). An Experimental Investigation of Interface Bond Strength of Concrete Using Large Powder-Driven Nails.
Department of Civil Engineering. Austin, TX, The University of Texas at Austin. Doctor of Philosophy: 340.
68
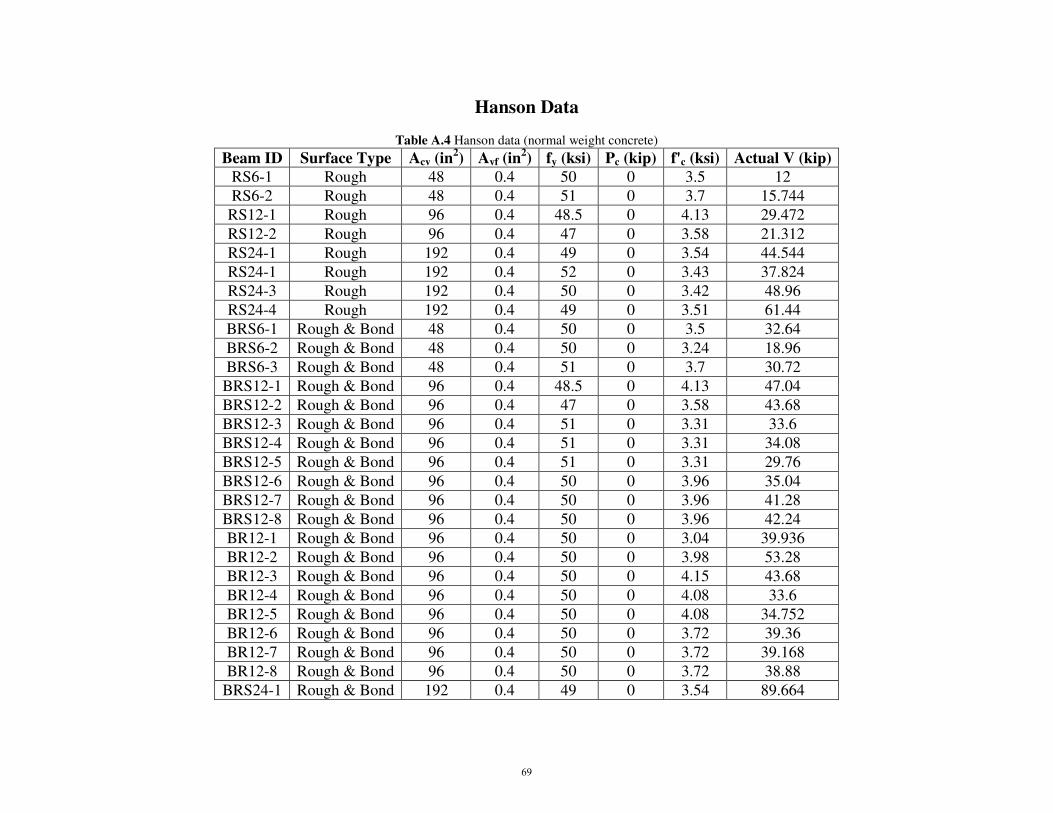
Hanson Data
Table A.4 Hanson data (normal weight concrete)
Beam ID Surface Type Acv (in2) Avf (in
2) fy (ksi) Pc (kip) f'c (ksi) Actual V (kip)
RS6-1 Rough 48 0.4 50 0 3.5 12
RS6-2 Rough 48 0.4 51 0 3.7 15.744
RS12-1 Rough 96 0.4 48.5 0 4.13 29.472
RS12-2 Rough 96 0.4 47 0 3.58 21.312
RS24-1 Rough 192 0.4 49 0 3.54 44.544
RS24-1 Rough 192 0.4 52 0 3.43 37.824
RS24-3 Rough 192 0.4 50 0 3.42 48.96
RS24-4 Rough 192 0.4 49 0 3.51 61.44
BRS6-1 Rough & Bond 48 0.4 50 0 3.5 32.64
BRS6-2 Rough & Bond 48 0.4 50 0 3.24 18.96
BRS6-3 Rough & Bond 48 0.4 51 0 3.7 30.72
BRS12-1 Rough & Bond 96 0.4 48.5 0 4.13 47.04
BRS12-2 Rough & Bond 96 0.4 47 0 3.58 43.68
BRS12-3 Rough & Bond 96 0.4 51 0 3.31 33.6
BRS12-4 Rough & Bond 96 0.4 51 0 3.31 34.08
BRS12-5 Rough & Bond 96 0.4 51 0 3.31 29.76
BRS12-6 Rough & Bond 96 0.4 50 0 3.96 35.04
BRS12-7 Rough & Bond 96 0.4 50 0 3.96 41.28
BRS12-8 Rough & Bond 96 0.4 50 0 3.96 42.24
BR12-1 Rough & Bond 96 0.4 50 0 3.04 39.936
BR12-2 Rough & Bond 96 0.4 50 0 3.98 53.28
BR12-3 Rough & Bond 96 0.4 50 0 4.15 43.68
BR12-4 Rough & Bond 96 0.4 50 0 4.08 33.6
BR12-5 Rough & Bond 96 0.4 50 0 4.08 34.752
BR12-6 Rough & Bond 96 0.4 50 0 3.72 39.36
BR12-7 Rough & Bond 96 0.4 50 0 3.72 39.168
BR12-8 Rough & Bond 96 0.4 50 0 3.72 38.88
BRS24-1 Rough & Bond 192 0.4 49 0 3.54 89.664
69
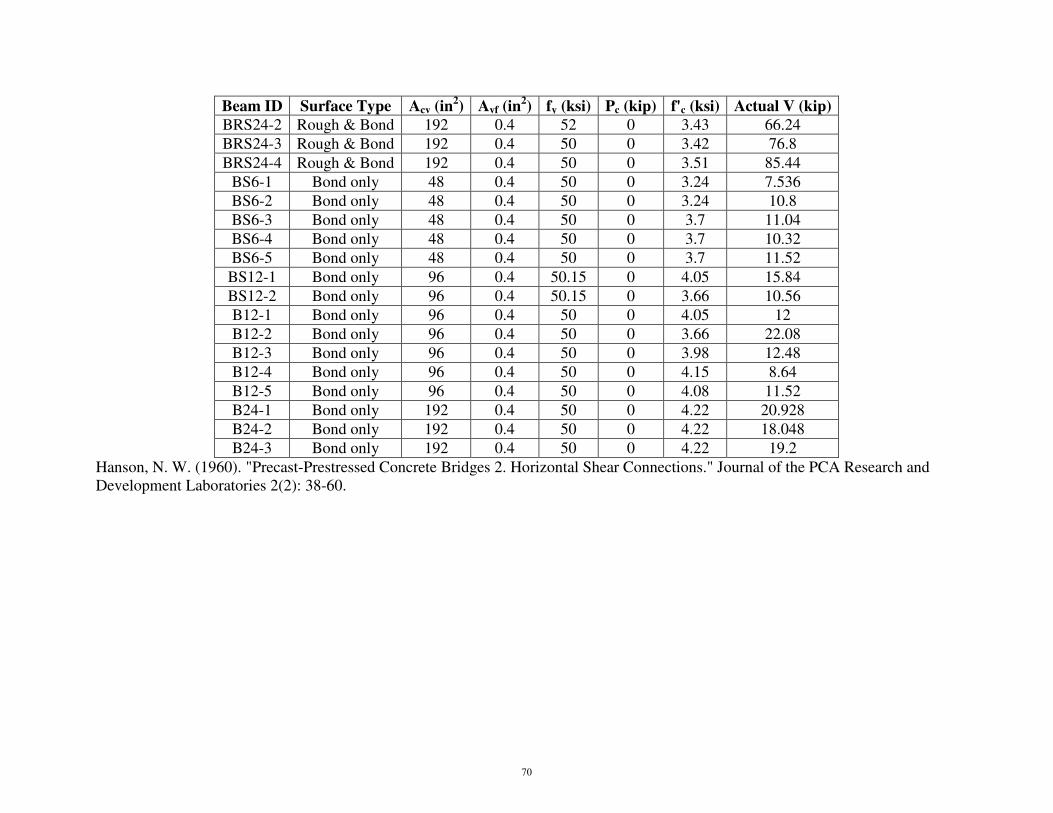
Beam ID Surface Type Acv (in2) Avf (in
2) fy (ksi) Pc (kip) f'c (ksi) Actual V (kip)
BRS24-2 Rough & Bond 192 0.4 52 0 3.43 66.24
BRS24-3 Rough & Bond 192 0.4 50 0 3.42 76.8
BRS24-4 Rough & Bond 192 0.4 50 0 3.51 85.44
BS6-1 Bond only 48 0.4 50 0 3.24 7.536
BS6-2 Bond only 48 0.4 50 0 3.24 10.8
BS6-3 Bond only 48 0.4 50 0 3.7 11.04
BS6-4 Bond only 48 0.4 50 0 3.7 10.32
BS6-5 Bond only 48 0.4 50 0 3.7 11.52
BS12-1 Bond only 96 0.4 50.15 0 4.05 15.84
BS12-2 Bond only 96 0.4 50.15 0 3.66 10.56
B12-1 Bond only 96 0.4 50 0 4.05 12
B12-2 Bond only 96 0.4 50 0 3.66 22.08
B12-3 Bond only 96 0.4 50 0 3.98 12.48
B12-4 Bond only 96 0.4 50 0 4.15 8.64
B12-5 Bond only 96 0.4 50 0 4.08 11.52
B24-1 Bond only 192 0.4 50 0 4.22 20.928
B24-2 Bond only 192 0.4 50 0 4.22 18.048
B24-3 Bond only 192 0.4 50 0 4.22 19.2
Hanson, N. W. (1960). "Precast-Prestressed Concrete Bridges 2. Horizontal Shear Connections." Journal of the PCA Research and
Development Laboratories 2(2): 38-60.
70
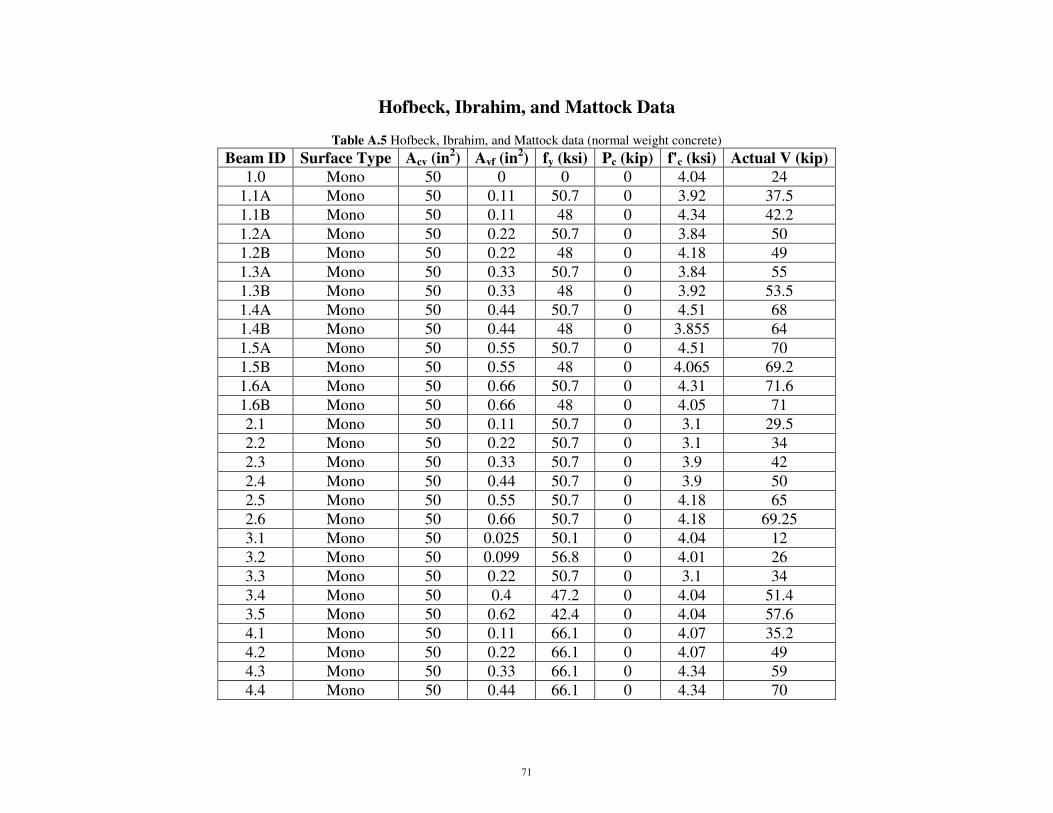
Hofbeck, Ibrahim, and Mattock Data
Table A.5 Hofbeck, Ibrahim, and Mattock data (normal weight concrete)
Beam ID Surface Type Acv (in2) Avf (in
2) fy (ksi) Pc (kip) f'c (ksi) Actual V (kip)
1.0 Mono 50 0 0 0 4.04 24
1.1A Mono 50 0.11 50.7 0 3.92 37.5
1.1B Mono 50 0.11 48 0 4.34 42.2
1.2A Mono 50 0.22 50.7 0 3.84 50
1.2B Mono 50 0.22 48 0 4.18 49
1.3A Mono 50 0.33 50.7 0 3.84 55
1.3B Mono 50 0.33 48 0 3.92 53.5
1.4A Mono 50 0.44 50.7 0 4.51 68
1.4B Mono 50 0.44 48 0 3.855 64
1.5A Mono 50 0.55 50.7 0 4.51 70
1.5B Mono 50 0.55 48 0 4.065 69.2
1.6A Mono 50 0.66 50.7 0 4.31 71.6
1.6B Mono 50 0.66 48 0 4.05 71
2.1 Mono 50 0.11 50.7 0 3.1 29.5
2.2 Mono 50 0.22 50.7 0 3.1 34
2.3 Mono 50 0.33 50.7 0 3.9 42
2.4 Mono 50 0.44 50.7 0 3.9 50
2.5 Mono 50 0.55 50.7 0 4.18 65
2.6 Mono 50 0.66 50.7 0 4.18 69.25
3.1 Mono 50 0.025 50.1 0 4.04 12
3.2 Mono 50 0.099 56.8 0 4.01 26
3.3 Mono 50 0.22 50.7 0 3.1 34
3.4 Mono 50 0.4 47.2 0 4.04 51.4
3.5 Mono 50 0.62 42.4 0 4.04 57.6
4.1 Mono 50 0.11 66.1 0 4.07 35.2
4.2 Mono 50 0.22 66.1 0 4.07 49
4.3 Mono 50 0.33 66.1 0 4.34 59
4.4 Mono 50 0.44 66.1 0 4.34 70
71
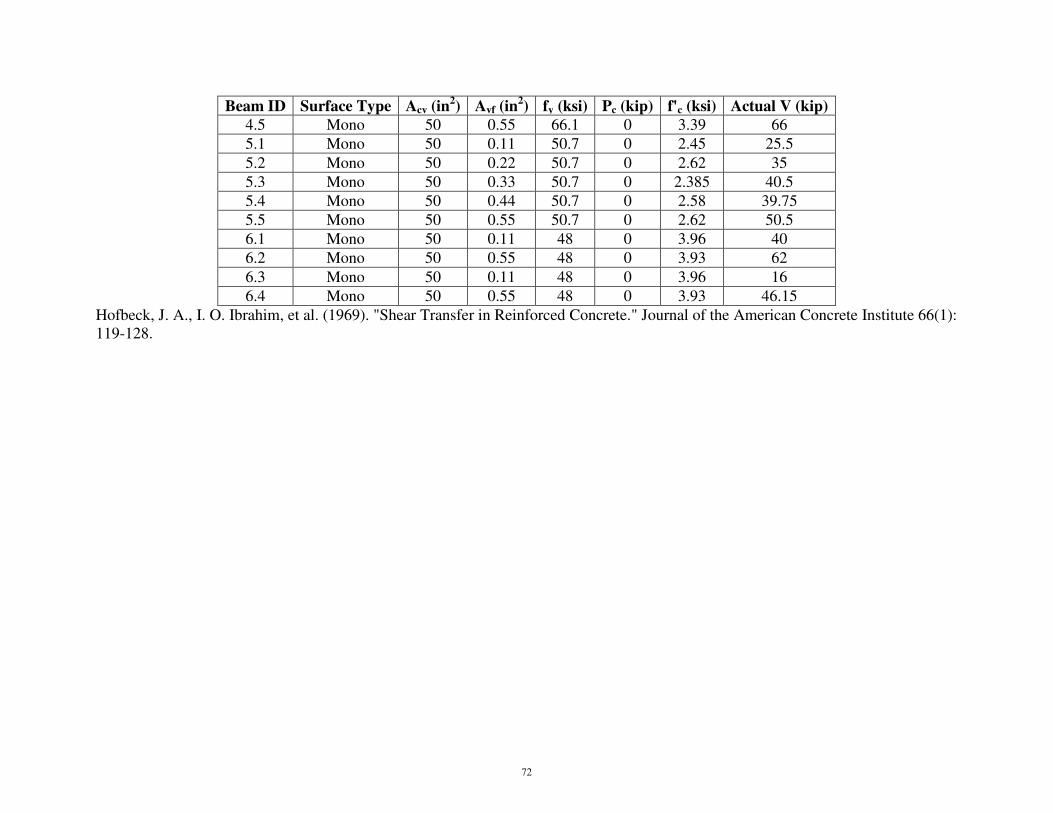
Beam ID Surface Type Acv (in2) Avf (in
2) fy (ksi) Pc (kip) f'c (ksi) Actual V (kip)
4.5 Mono 50 0.55 66.1 0 3.39 66
5.1 Mono 50 0.11 50.7 0 2.45 25.5
5.2 Mono 50 0.22 50.7 0 2.62 35
5.3 Mono 50 0.33 50.7 0 2.385 40.5
5.4 Mono 50 0.44 50.7 0 2.58 39.75
5.5 Mono 50 0.55 50.7 0 2.62 50.5
6.1 Mono 50 0.11 48 0 3.96 40
6.2 Mono 50 0.55 48 0 3.93 62
6.3 Mono 50 0.11 48 0 3.96 16
6.4 Mono 50 0.55 48 0 3.93 46.15
Hofbeck, J. A., I. O. Ibrahim, et al. (1969). "Shear Transfer in Reinforced Concrete." Journal of the American Concrete Institute 66(1):
119-128.
72
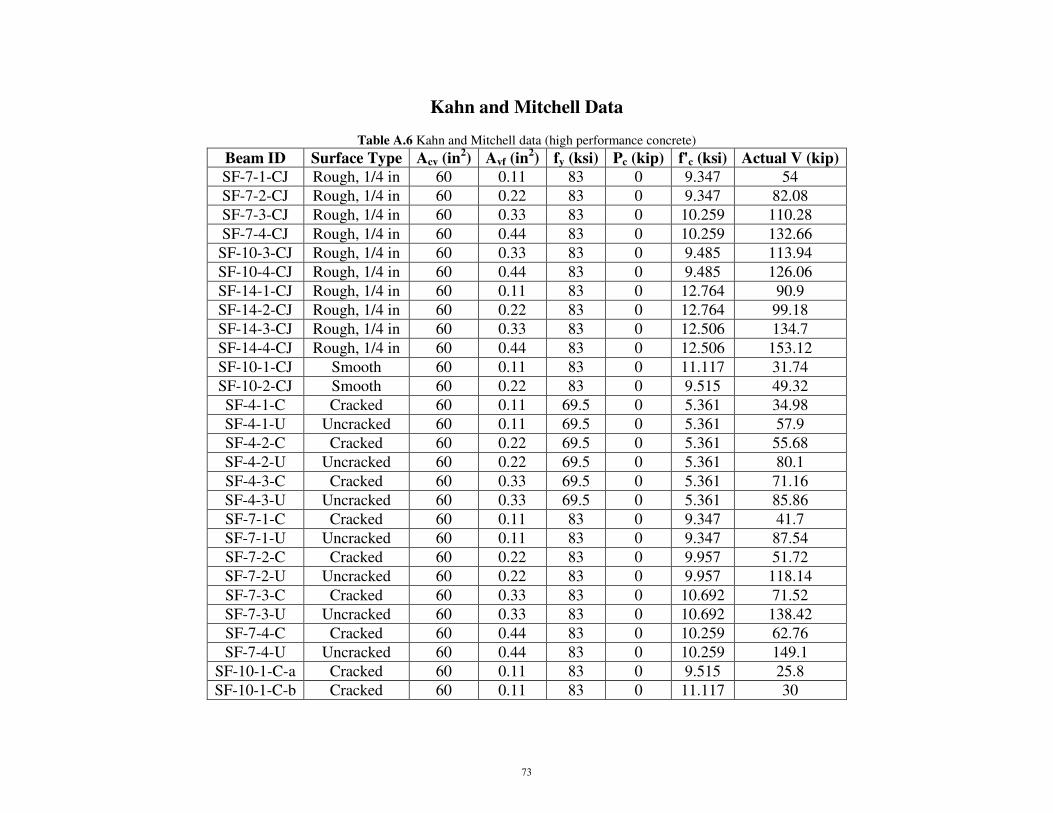
Kahn and Mitchell Data
Table A.6 Kahn and Mitchell data (high performance concrete)
Beam ID Surface Type Acv (in2) Avf (in
2) fy (ksi) Pc (kip) f'c (ksi) Actual V (kip)
SF-7-1-CJ Rough, 1/4 in 60 0.11 83 0 9.347 54
SF-7-2-CJ Rough, 1/4 in 60 0.22 83 0 9.347 82.08
SF-7-3-CJ Rough, 1/4 in 60 0.33 83 0 10.259 110.28
SF-7-4-CJ Rough, 1/4 in 60 0.44 83 0 10.259 132.66
SF-10-3-CJ Rough, 1/4 in 60 0.33 83 0 9.485 113.94
SF-10-4-CJ Rough, 1/4 in 60 0.44 83 0 9.485 126.06
SF-14-1-CJ Rough, 1/4 in 60 0.11 83 0 12.764 90.9
SF-14-2-CJ Rough, 1/4 in 60 0.22 83 0 12.764 99.18
SF-14-3-CJ Rough, 1/4 in 60 0.33 83 0 12.506 134.7
SF-14-4-CJ Rough, 1/4 in 60 0.44 83 0 12.506 153.12
SF-10-1-CJ Smooth 60 0.11 83 0 11.117 31.74
SF-10-2-CJ Smooth 60 0.22 83 0 9.515 49.32
SF-4-1-C Cracked 60 0.11 69.5 0 5.361 34.98
SF-4-1-U Uncracked 60 0.11 69.5 0 5.361 57.9
SF-4-2-C Cracked 60 0.22 69.5 0 5.361 55.68
SF-4-2-U Uncracked 60 0.22 69.5 0 5.361 80.1
SF-4-3-C Cracked 60 0.33 69.5 0 5.361 71.16
SF-4-3-U Uncracked 60 0.33 69.5 0 5.361 85.86
SF-7-1-C Cracked 60 0.11 83 0 9.347 41.7
SF-7-1-U Uncracked 60 0.11 83 0 9.347 87.54
SF-7-2-C Cracked 60 0.22 83 0 9.957 51.72
SF-7-2-U Uncracked 60 0.22 83 0 9.957 118.14
SF-7-3-C Cracked 60 0.33 83 0 10.692 71.52
SF-7-3-U Uncracked 60 0.33 83 0 10.692 138.42
SF-7-4-C Cracked 60 0.44 83 0 10.259 62.76
SF-7-4-U Uncracked 60 0.44 83 0 10.259 149.1
SF-10-1-C-a Cracked 60 0.11 83 0 9.515 25.8
SF-10-1-C-b Cracked 60 0.11 83 0 11.117 30
73

Beam ID Surface Type Acv (in2) Avf (in
2) fy (ksi) Pc (kip) f'c (ksi) Actual V (kip)
SF-10-1-U-a Uncracked 60 0.11 83 0 9.515 100.08
SF-10-1-U-b Uncracked 60 0.11 83 0 11.117 91.86
SF-10-2-C-a Cracked 60 0.22 83 0 12.158 50.76
SF-10-2-C-b Cracked 60 0.22 83 0 11.775 48.12
SF-10-2-U-a Uncracked 60 0.22 83 0 12.158 130.68
SF-10-2-U-b Uncracked 60 0.22 83 0 11.775 124.08
SF-10-3-C-a Cracked 60 0.33 83 0 12.71 64.68
SF-10-3-C-b Cracked 60 0.33 83 0 11.333 63.36
SF-10-3-U-a Uncracked 60 0.33 83 0 12.71 144.84
SF-10-3-U-b Uncracked 60 0.33 83 0 11.333 147.9
SF-10-4-C-a Cracked 60 0.44 83 0 12.429 74.16
SF-10-4-C-b Cracked 60 0.44 83 0 12.256 76.26
SF-10-4-U-a Uncracked 60 0.44 83 0 12.429 156.06
SF-10-4-U-b Uncracked 60 0.44 83 0 12.256 160.02
SF-14-1-C Cracked 60 0.11 83 0 14.095 24.9
SF-14-1-U Uncracked 60 0.11 83 0 14.948 94.98
SF-14-2-C Cracked 60 0.22 83 0 13.408 40.2
SF-14-2-U Uncracked 60 0.22 83 0 13.735 108.48
SF-14-3-C Cracked 60 0.33 83 0 12.91 55.5
SF-14-3-U Uncracked 60 0.33 83 0 13.185 146.22
SF-14-4-C Cracked 60 0.44 83 0 13.881 73.26
SF-14-4-U Uncracked 60 0.44 83 0 13.767 156
Kahn, L. F. and A. D. Mitchell (2002). "Shear Friction Tests with High-Strength Concrete." ACI Structural Journal 99(1): 98-103.
74
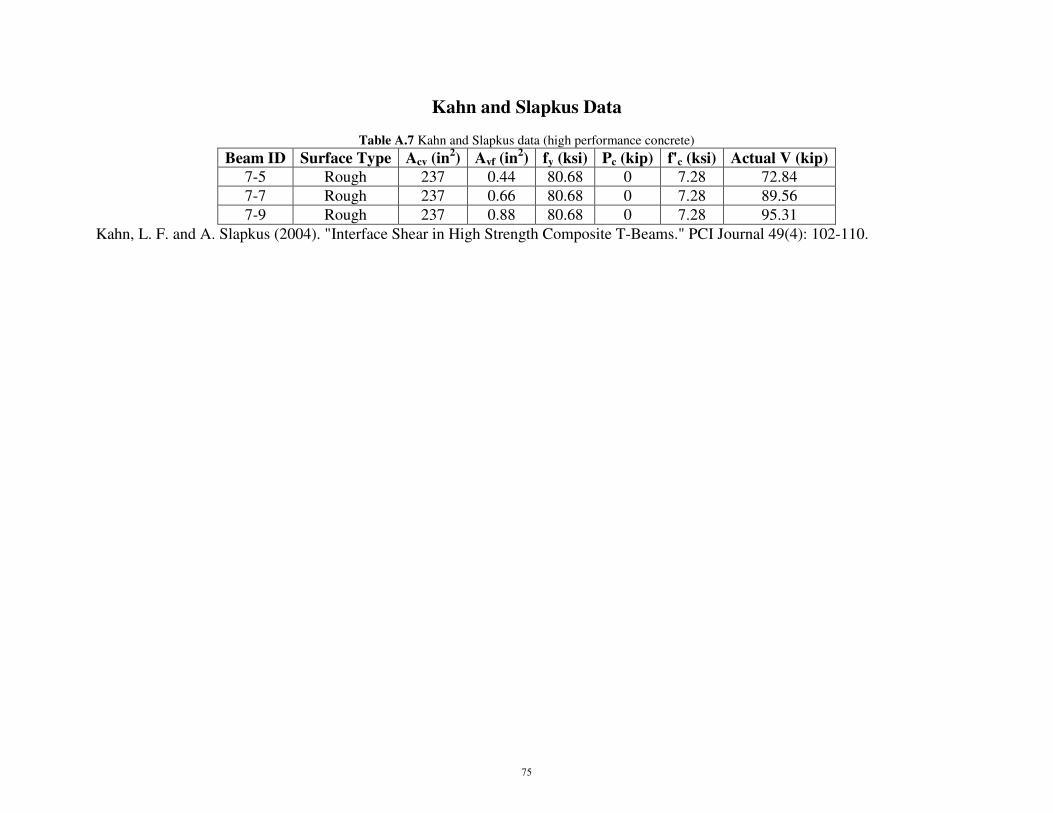
Kahn and Slapkus Data
Table A.7 Kahn and Slapkus data (high performance concrete)
Beam ID Surface Type Acv (in2) Avf (in
2) fy (ksi) Pc (kip) f'c (ksi) Actual V (kip)
7-5 Rough 237 0.44 80.68 0 7.28 72.84
7-7 Rough 237 0.66 80.68 0 7.28 89.56
7-9 Rough 237 0.88 80.68 0 7.28 95.31
Kahn, L. F. and A. Slapkus (2004). "Interface Shear in High Strength Composite T-Beams." PCI Journal 49(4): 102-110.
75
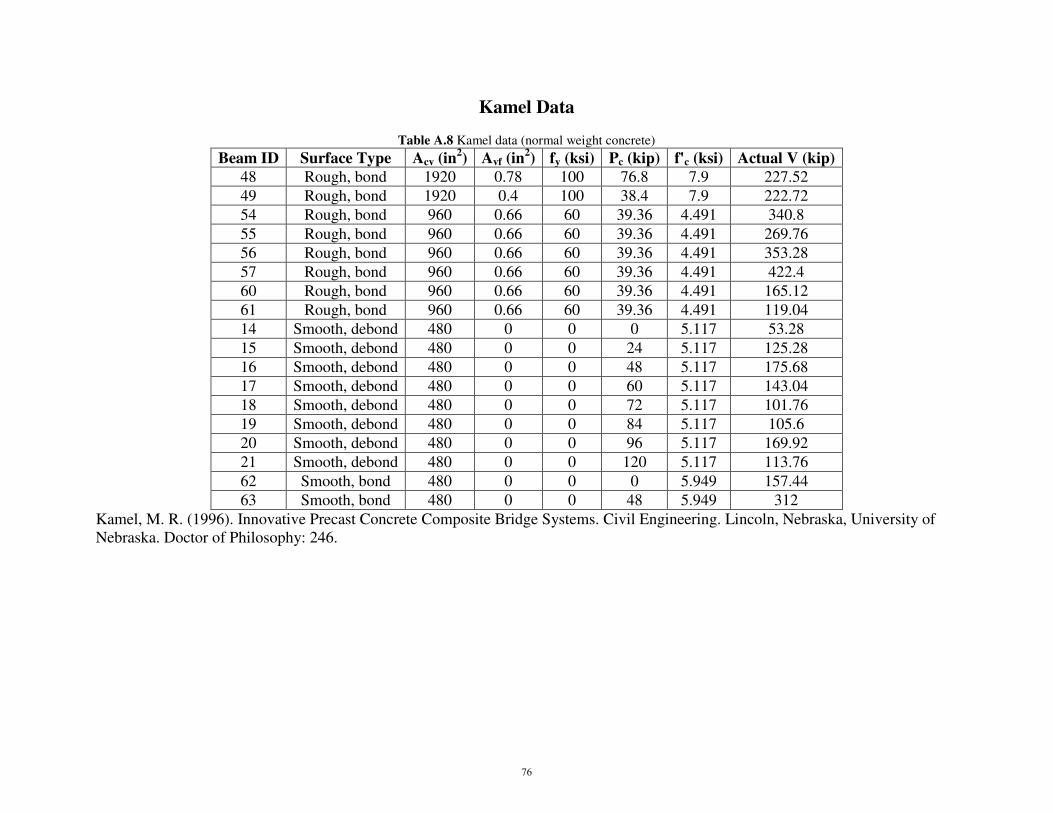
Kamel Data
Table A.8 Kamel data (normal weight concrete)
Beam ID Surface Type Acv (in2) Avf (in
2) fy (ksi) Pc (kip) f'c (ksi) Actual V (kip)
48 Rough, bond 1920 0.78 100 76.8 7.9 227.52
49 Rough, bond 1920 0.4 100 38.4 7.9 222.72
54 Rough, bond 960 0.66 60 39.36 4.491 340.8
55 Rough, bond 960 0.66 60 39.36 4.491 269.76
56 Rough, bond 960 0.66 60 39.36 4.491 353.28
57 Rough, bond 960 0.66 60 39.36 4.491 422.4
60 Rough, bond 960 0.66 60 39.36 4.491 165.12
61 Rough, bond 960 0.66 60 39.36 4.491 119.04
14 Smooth, debond 480 0 0 0 5.117 53.28
15 Smooth, debond 480 0 0 24 5.117 125.28
16 Smooth, debond 480 0 0 48 5.117 175.68
17 Smooth, debond 480 0 0 60 5.117 143.04
18 Smooth, debond 480 0 0 72 5.117 101.76
19 Smooth, debond 480 0 0 84 5.117 105.6
20 Smooth, debond 480 0 0 96 5.117 169.92
21 Smooth, debond 480 0 0 120 5.117 113.76
62 Smooth, bond 480 0 0 0 5.949 157.44
63 Smooth, bond 480 0 0 48 5.949 312
Kamel, M. R. (1996). Innovative Precast Concrete Composite Bridge Systems. Civil Engineering. Lincoln, Nebraska, University of
Nebraska. Doctor of Philosophy: 246.
76
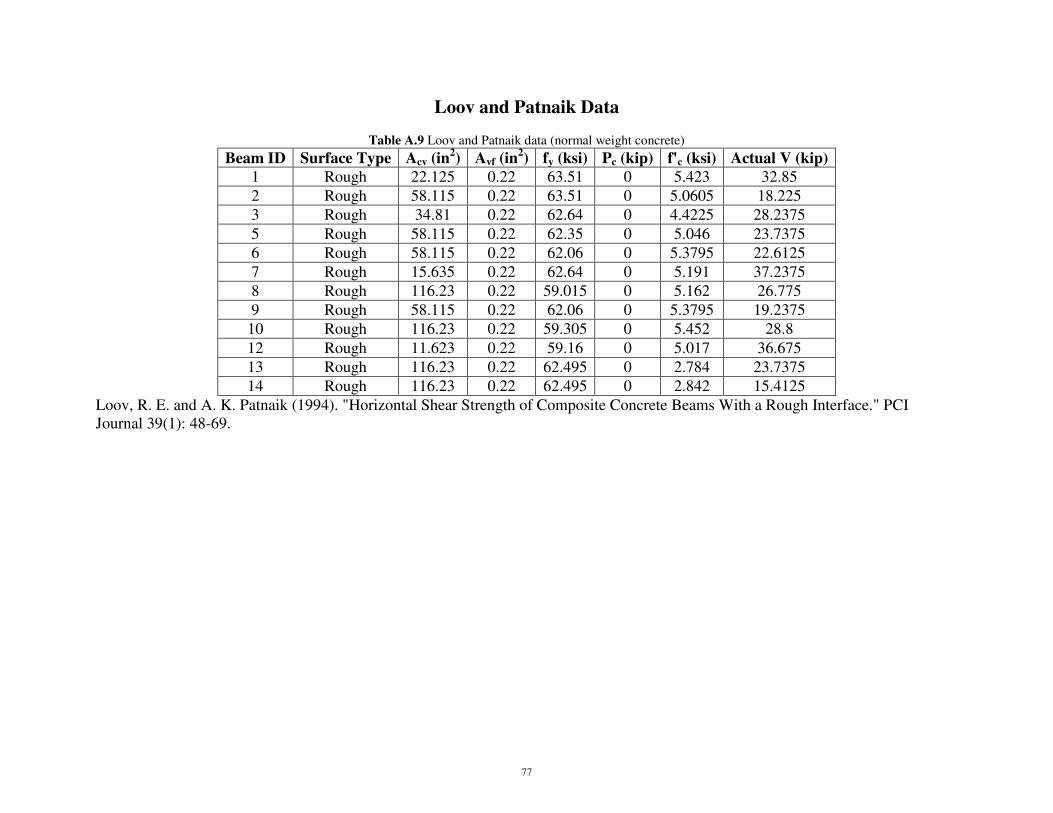
Loov and Patnaik Data
Table A.9 Loov and Patnaik data (normal weight concrete)
Beam ID Surface Type Acv (in2) Avf (in
2) fy (ksi) Pc (kip) f'c (ksi) Actual V (kip)
1 Rough 22.125 0.22 63.51 0 5.423 32.85
2 Rough 58.115 0.22 63.51 0 5.0605 18.225
3 Rough 34.81 0.22 62.64 0 4.4225 28.2375
5 Rough 58.115 0.22 62.35 0 5.046 23.7375
6 Rough 58.115 0.22 62.06 0 5.3795 22.6125
7 Rough 15.635 0.22 62.64 0 5.191 37.2375
8 Rough 116.23 0.22 59.015 0 5.162 26.775
9 Rough 58.115 0.22 62.06 0 5.3795 19.2375
10 Rough 116.23 0.22 59.305 0 5.452 28.8
12 Rough 11.623 0.22 59.16 0 5.017 36.675
13 Rough 116.23 0.22 62.495 0 2.784 23.7375
14 Rough 116.23 0.22 62.495 0 2.842 15.4125
Loov, R. E. and A. K. Patnaik (1994). "Horizontal Shear Strength of Composite Concrete Beams With a Rough Interface." PCI
Journal 39(1): 48-69.
77

Mattock, Johal, and Chow Data
Table A.10 Mattock, Johal and Chow data (normal weight concrete)
Beam ID Surface Type Acv (in2) Avf (in
2) fy (ksi) Pc (kip) f'c (ksi) Actual V (kip)
A1 Mono 60 0.66 53 0 3.975 60
A2 Mono 60 0.66 53 0 4.13 60
B1 Mono 60 0.66 53 0 3.89 52
C1 Mono 60 0.66 53 0 3.98 50.5
C2 Mono 60 0.66 53 0 3.915 53
C3 Mono 60 0.66 53 0 3.805 51
D1 Mono 60 0.4 53 0 3.92 39
E1C Mono 84 0.88 51.8 0 3.855 74
E2C Mono 84 0.88 52.1 -8.4 4.22 78.04
E3C Mono 84 0.88 52.7 -13.692 3.96 59.98
E4C Mono 84 0.88 50.5 -16.8 3.82 56.53
E5C Mono 84 0.88 52.3 -25.2 4.02 44.27
E6C Mono 84 0.88 50.9 -33.6 3.985 31
E1U Mono 84 0.88 52.7 0 4.06 91.48
E4U Mono 84 0.88 49.1 -16.8 3.86 79.46
E6U Mono 84 0.88 50.8 -33.6 4.12 50.99
F1C Mono 84 1.32 50.1 0 4.22 82.99
F4C Mono 84 1.32 51.3 -16.8 3.89 70.48
F6C Mono 84 1.32 51.7 -33.6 4.15 67.54
F1U Mono 84 1.32 52.2 0 4.035 115
F4U Mono 84 1.32 53.2 -16.8 4.175 96.01
F6U Mono 84 1.32 51 -33.6 4.245 89.54
Mattock, A. H., L. Johal, et al. (1975). "Shear transfer in reinforced concrete with moment or tension acting across the shear plane."
PCI Journal 20(4): 76-93.
78
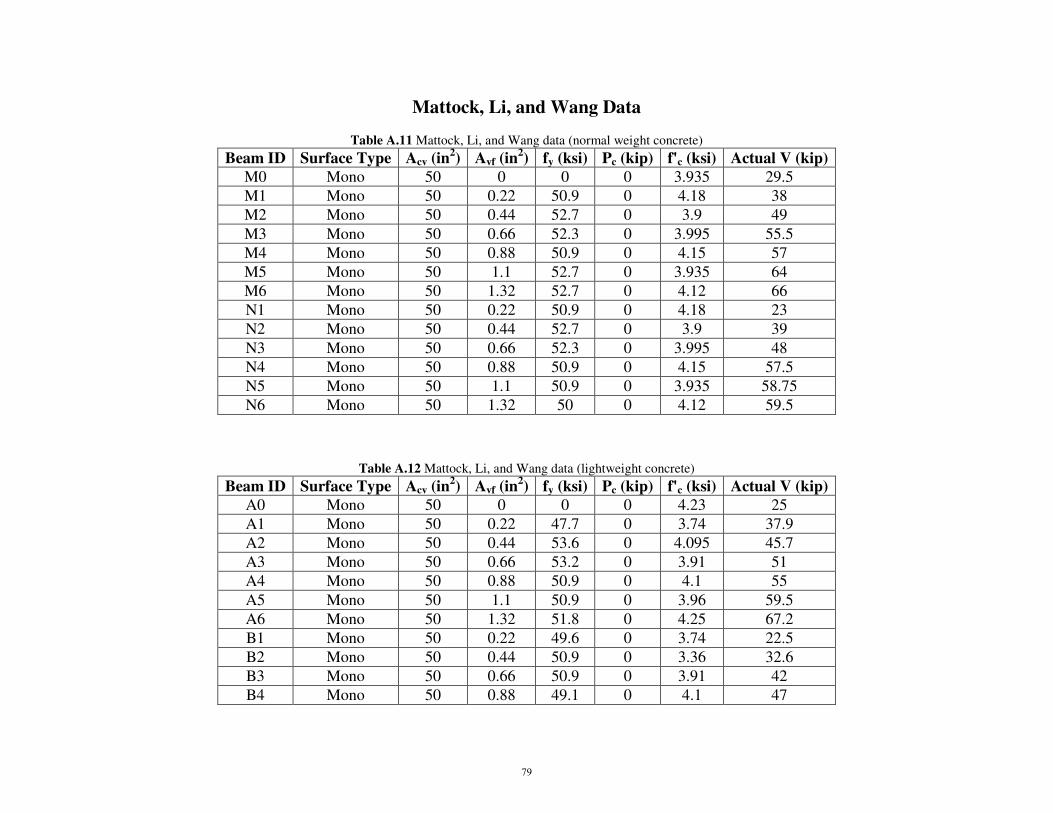
Mattock, Li, and Wang Data
Table A.11 Mattock, Li, and Wang data (normal weight concrete)
Beam ID Surface Type Acv (in2) Avf (in
2) fy (ksi) Pc (kip) f'c (ksi) Actual V (kip)
M0 Mono 50 0 0 0 3.935 29.5
M1 Mono 50 0.22 50.9 0 4.18 38
M2 Mono 50 0.44 52.7 0 3.9 49
M3 Mono 50 0.66 52.3 0 3.995 55.5
M4 Mono 50 0.88 50.9 0 4.15 57
M5 Mono 50 1.1 52.7 0 3.935 64
M6 Mono 50 1.32 52.7 0 4.12 66
N1 Mono 50 0.22 50.9 0 4.18 23
N2 Mono 50 0.44 52.7 0 3.9 39
N3 Mono 50 0.66 52.3 0 3.995 48
N4 Mono 50 0.88 50.9 0 4.15 57.5
N5 Mono 50 1.1 50.9 0 3.935 58.75
N6 Mono 50 1.32 50 0 4.12 59.5
Table A.12 Mattock, Li, and Wang data (lightweight concrete)
Beam ID Surface Type Acv (in2) Avf (in
2) fy (ksi) Pc (kip) f'c (ksi) Actual V (kip)
A0 Mono 50 0 0 0 4.23 25
A1 Mono 50 0.22 47.7 0 3.74 37.9
A2 Mono 50 0.44 53.6 0 4.095 45.7
A3 Mono 50 0.66 53.2 0 3.91 51
A4 Mono 50 0.88 50.9 0 4.1 55
A5 Mono 50 1.1 50.9 0 3.96 59.5
A6 Mono 50 1.32 51.8 0 4.25 67.2
B1 Mono 50 0.22 49.6 0 3.74 22.5
B2 Mono 50 0.44 50.9 0 3.36 32.6
B3 Mono 50 0.66 50.9 0 3.91 42
B4 Mono 50 0.88 49.1 0 4.1 47
79

Beam ID Surface Type Acv (in2) Avf (in
2) fy (ksi) Pc (kip) f'c (ksi) Actual V (kip)
B5 Mono 50 1.1 50.5 0 3.96 50
B6 Mono 50 1.32 51.8 0 4.25 57.7
C1 Mono 50 0.22 49.6 0 2.33 18.2
C2 Mono 50 0.44 53.6 0 2.33 25.7
C3 Mono 50 0.66 50.9 0 2 26.3
C4 Mono 50 0.88 52.3 0 2.05 28
C5 Mono 50 1.1 53.6 0 2.33 32
C6 Mono 50 1.32 49.6 0 2.33 37
D1 Mono 50 0.22 51.8 0 5.995 18.5
D2 Mono 50 0.44 52.3 0 5.995 33.4
D3 Mono 50 0.66 52.3 0 5.71 38.6
D4 Mono 50 0.88 52.3 0 5.71 51.1
D5 Mono 50 1.1 52.3 0 5.6 54.1
D6 Mono 50 1.32 51.8 0 5.6 61
E0 Mono 50 0 0 0 3.96 28
E1 Mono 50 0.22 52.3 0 4.15 39
E2 Mono 50 0.44 52.3 0 4.03 43.6
E3 Mono 50 0.66 52.3 0 4.065 48
E4 Mono 50 0.88 53.2 0 4.04 57.5
E5 Mono 50 1.1 50.5 0 4.115 60
E6 Mono 50 1.32 52.3 0 4.05 62.5
F1 Mono 50 0.22 53.2 0 4.15 22.5
F2 Mono 50 0.44 52.3 0 4.03 26.5
F2A Mono 50 0.44 50.9 0 3.97 31
F3 Mono 50 0.66 52.3 0 4.065 36.7
F3A Mono 50 0.66 51.4 0 3.97 35.1
F4 Mono 50 0.88 50.9 0 4.04 43.5
F5 Mono 50 1.1 51.8 0 4.115 46
F6 Mono 50 1.32 53.2 0 4.05 49.1
G0 Mono 50 0 0 0 4.03 26.5
G1 Mono 50 0.22 52.3 0 4.145 41
80

Beam ID Surface Type Acv (in2) Avf (in
2) fy (ksi) Pc (kip) f'c (ksi) Actual V (kip)
G2 Mono 50 0.44 50.5 0 3.88 42.3
G3 Mono 50 0.66 51.8 0 4.1 53
G4 Mono 50 0.88 53.2 0 4.42 57.5
G5 Mono 50 1.1 51.8 0 4.005 57
G6 Mono 50 1.32 51.8 0 4.005 59.5
H1 Mono 50 0.22 49.8 0 4.145 20
H2 Mono 50 0.44 51.8 0 3.88 31
H3 Mono 50 0.66 51.8 0 4.1 43.3
H4 Mono 50 0.88 51.8 0 4.42 47
H5 Mono 50 1.1 50.5 0 3.95 49.5
H6 Mono 50 1.32 49.8 0 4.08 52.1
Mattock, A. H., W. K. Li, et al. (1976). "Shear transfer in lightweight reinforced concrete." PCI Journal 21(1): 20-39.
81
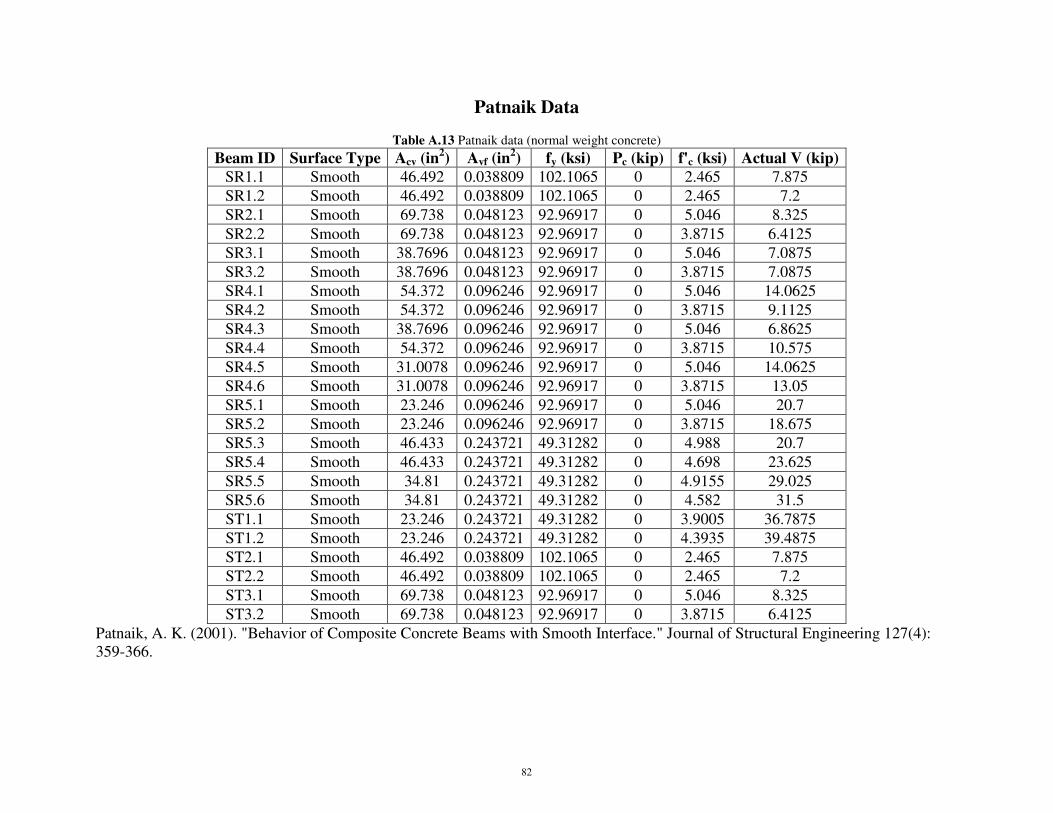
Patnaik Data
Table A.13 Patnaik data (normal weight concrete)
Beam ID Surface Type Acv (in2) Avf (in
2) fy (ksi) Pc (kip) f'c (ksi) Actual V (kip)
SR1.1 Smooth 46.492 0.038809 102.1065 0 2.465 7.875
SR1.2 Smooth 46.492 0.038809 102.1065 0 2.465 7.2
SR2.1 Smooth 69.738 0.048123 92.96917 0 5.046 8.325
SR2.2 Smooth 69.738 0.048123 92.96917 0 3.8715 6.4125
SR3.1 Smooth 38.7696 0.048123 92.96917 0 5.046 7.0875
SR3.2 Smooth 38.7696 0.048123 92.96917 0 3.8715 7.0875
SR4.1 Smooth 54.372 0.096246 92.96917 0 5.046 14.0625
SR4.2 Smooth 54.372 0.096246 92.96917 0 3.8715 9.1125
SR4.3 Smooth 38.7696 0.096246 92.96917 0 5.046 6.8625
SR4.4 Smooth 54.372 0.096246 92.96917 0 3.8715 10.575
SR4.5 Smooth 31.0078 0.096246 92.96917 0 5.046 14.0625
SR4.6 Smooth 31.0078 0.096246 92.96917 0 3.8715 13.05
SR5.1 Smooth 23.246 0.096246 92.96917 0 5.046 20.7
SR5.2 Smooth 23.246 0.096246 92.96917 0 3.8715 18.675
SR5.3 Smooth 46.433 0.243721 49.31282 0 4.988 20.7
SR5.4 Smooth 46.433 0.243721 49.31282 0 4.698 23.625
SR5.5 Smooth 34.81 0.243721 49.31282 0 4.9155 29.025
SR5.6 Smooth 34.81 0.243721 49.31282 0 4.582 31.5
ST1.1 Smooth 23.246 0.243721 49.31282 0 3.9005 36.7875
ST1.2 Smooth 23.246 0.243721 49.31282 0 4.3935 39.4875
ST2.1 Smooth 46.492 0.038809 102.1065 0 2.465 7.875
ST2.2 Smooth 46.492 0.038809 102.1065 0 2.465 7.2
ST3.1 Smooth 69.738 0.048123 92.96917 0 5.046 8.325
ST3.2 Smooth 69.738 0.048123 92.96917 0 3.8715 6.4125
Patnaik, A. K. (2001). "Behavior of Composite Concrete Beams with Smooth Interface." Journal of Structural Engineering 127(4):
359-366.
82

Saemann and Washa Data
Table A.14 Saemann and Washa data (normal weight concrete)
Beam ID Surface Type Acv (in2) Avf (in
2) fy (ksi) Pc (kip) f'c (ksi) Actual V (kip)
1C Smooth 35 0.2 42.6 0 2.95 12.8
6C Smooth 70 0.2 42.6 0 2.87 11.5
2C Smooth 35 0.2 42.6 0 2.97 20.55
7C Smooth 70 0.2 42.6 0 2.81 19
3D Smooth 70 0.11 53.7 0 3.59 17.65
1A Smooth 17.5 0.2 42.6 0 2.71 38.2
4C Smooth 35 0.2 42.6 0 3.17 30
9C Smooth 70 0.2 42.6 0 3.09 24
7D Smooth 70 0.11 53.7 0 3.75 25.6
3C Intermediate 35 0.2 42.6 0 3.07 25.5
8C Intermediate 70 0.2 42.6 0 2.79 23.5
11C Intermediate 70 0.11 53.7 0 2.87 17
2D Intermediate 70 0.11 53.7 0 3.55 23.5
13C Intermediate 140 0.11 53.7 0 3.42 18
15C Intermediate 86 0 0 0 3.03 18
5C Intermediate 35 0.2 42.6 0 3.02 40
10C Intermediate 70 0.2 42.6 0 3.12 28.9
5D Intermediate 70 0.2 42.6 0 3.39 38.2
6D Intermediate 70 0.2 42.6 0 3.68 38
12C Intermediate 70 0.11 53.7 0 2.98 34.5
8D Intermediate 70 0.11 53.7 0 4.61 38
9D Intermediate 70 0.11 53.7 0 4.9 39
14C Intermediate 140 0.11 53.7 0 2.87 31
16C Intermediate 86 0 0 0 3.03 26
Saemann, J. C. and G. W. Washa (1964). "Horizontal Shear Connections Between Precast Beams and Cast-in-Place Slabs." Journal of
the American Concrete Institute 61(11): 1383-1408.
83
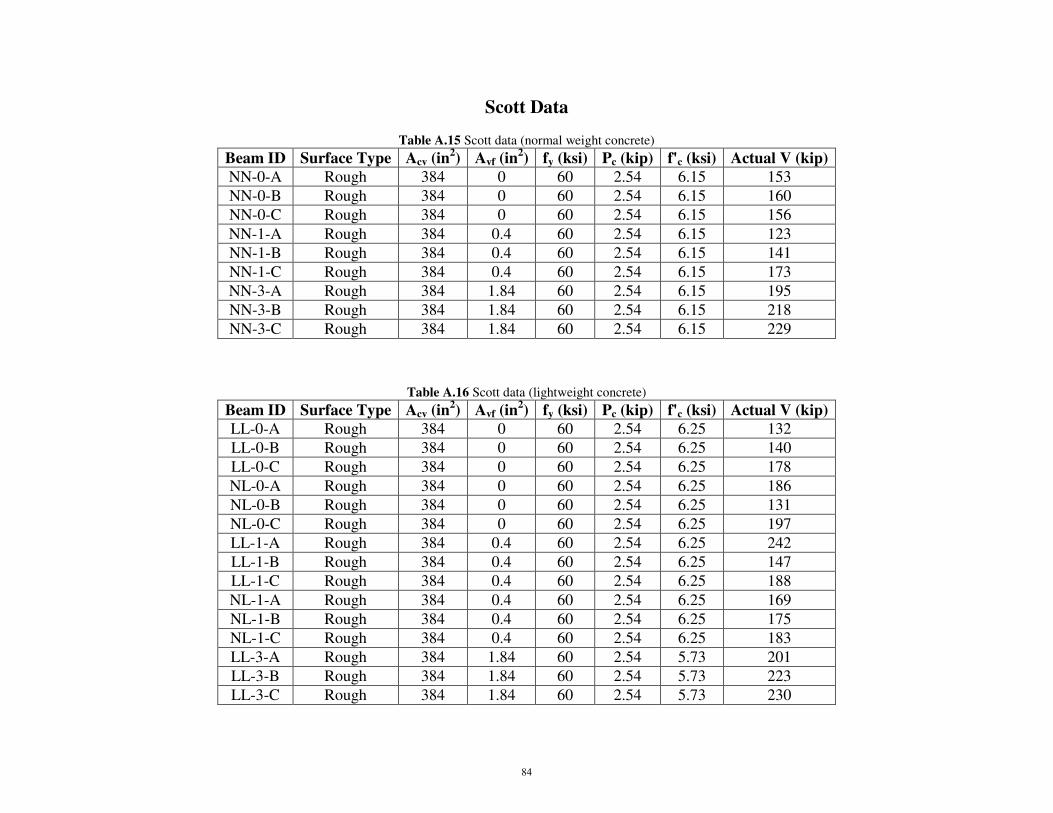
Scott Data
Table A.15 Scott data (normal weight concrete)
Beam ID Surface Type Acv (in2) Avf (in
2) fy (ksi) Pc (kip) f'c (ksi) Actual V (kip)
NN-0-A Rough 384 0 60 2.54 6.15 153
NN-0-B Rough 384 0 60 2.54 6.15 160
NN-0-C Rough 384 0 60 2.54 6.15 156
NN-1-A Rough 384 0.4 60 2.54 6.15 123
NN-1-B Rough 384 0.4 60 2.54 6.15 141
NN-1-C Rough 384 0.4 60 2.54 6.15 173
NN-3-A Rough 384 1.84 60 2.54 6.15 195
NN-3-B Rough 384 1.84 60 2.54 6.15 218
NN-3-C Rough 384 1.84 60 2.54 6.15 229
Table A.16 Scott data (lightweight concrete)
Beam ID Surface Type Acv (in2) Avf (in
2) fy (ksi) Pc (kip) f'c (ksi) Actual V (kip)
LL-0-A Rough 384 0 60 2.54 6.25 132
LL-0-B Rough 384 0 60 2.54 6.25 140
LL-0-C Rough 384 0 60 2.54 6.25 178
NL-0-A Rough 384 0 60 2.54 6.25 186
NL-0-B Rough 384 0 60 2.54 6.25 131
NL-0-C Rough 384 0 60 2.54 6.25 197
LL-1-A Rough 384 0.4 60 2.54 6.25 242
LL-1-B Rough 384 0.4 60 2.54 6.25 147
LL-1-C Rough 384 0.4 60 2.54 6.25 188
NL-1-A Rough 384 0.4 60 2.54 6.25 169
NL-1-B Rough 384 0.4 60 2.54 6.25 175
NL-1-C Rough 384 0.4 60 2.54 6.25 183
LL-3-A Rough 384 1.84 60 2.54 5.73 201
LL-3-B Rough 384 1.84 60 2.54 5.73 223
LL-3-C Rough 384 1.84 60 2.54 5.73 230
84
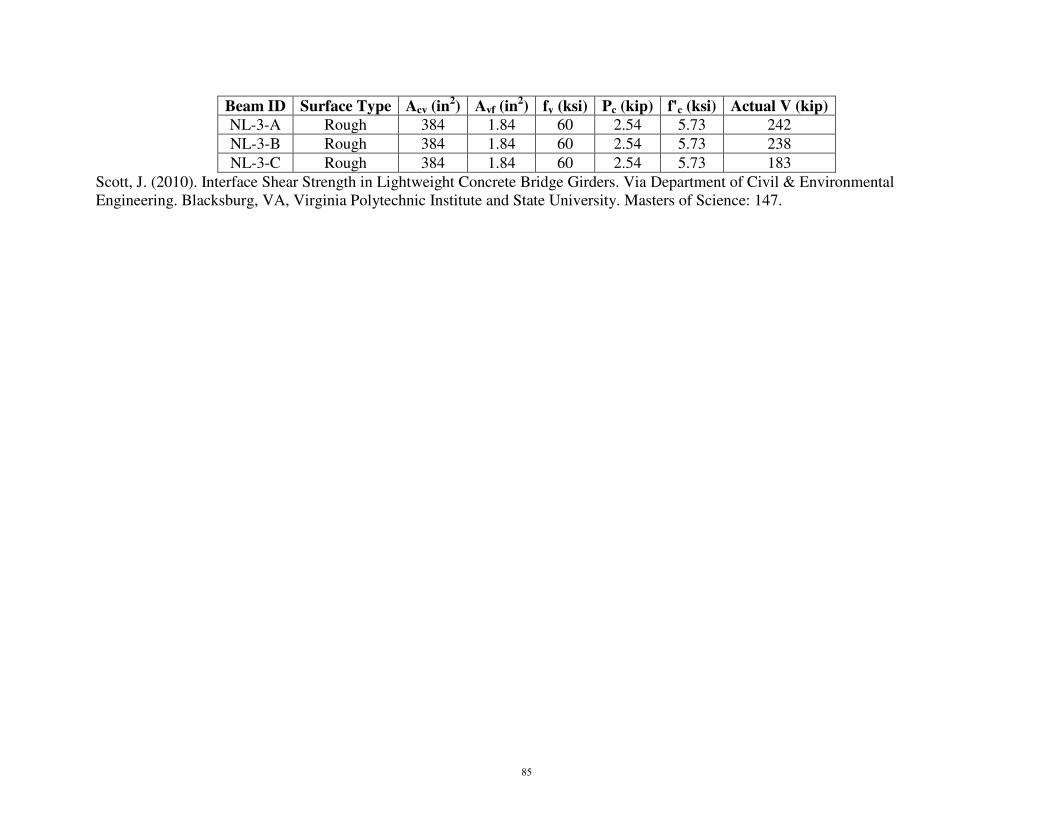
Beam ID Surface Type Acv (in2) Avf (in
2) fy (ksi) Pc (kip) f'c (ksi) Actual V (kip)
NL-3-A Rough 384 1.84 60 2.54 5.73 242
NL-3-B Rough 384 1.84 60 2.54 5.73 238
NL-3-C Rough 384 1.84 60 2.54 5.73 183
Scott, J. (2010). Interface Shear Strength in Lightweight Concrete Bridge Girders. Via Department of Civil & Environmental
Engineering. Blacksburg, VA, Virginia Polytechnic Institute and State University. Masters of Science: 147.
85
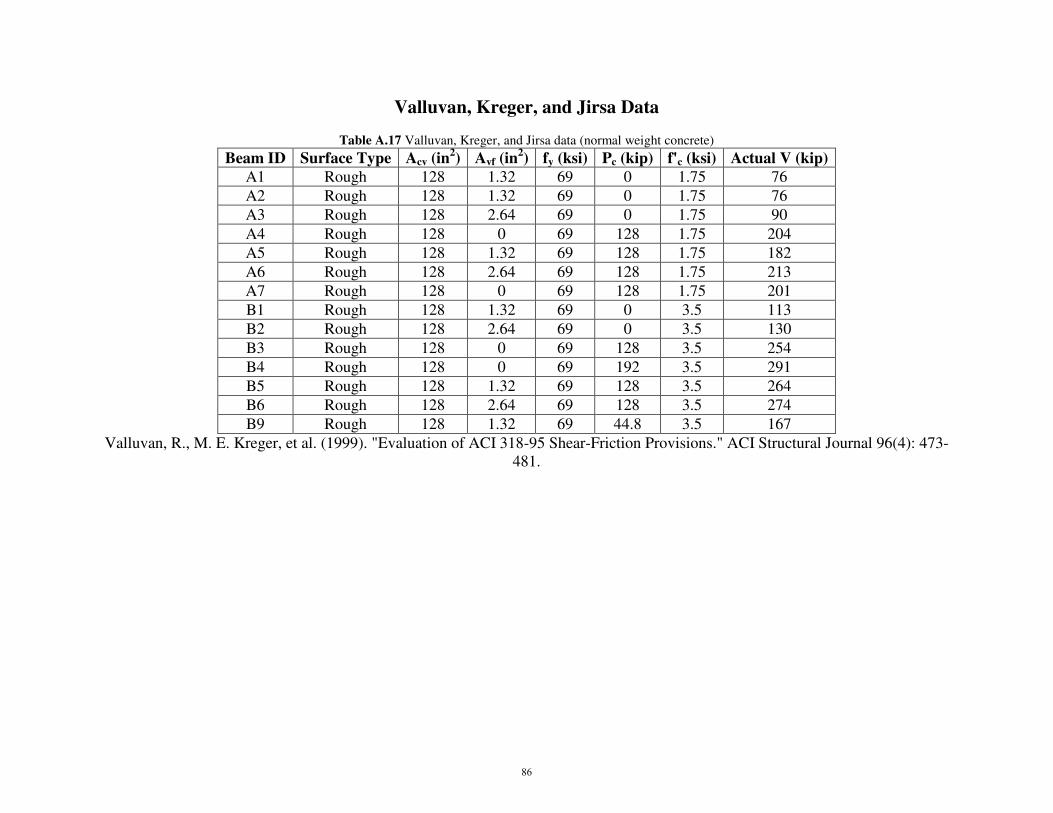
Valluvan, Kreger, and Jirsa Data
Table A.17 Valluvan, Kreger, and Jirsa data (normal weight concrete)
Beam ID Surface Type Acv (in2) Avf (in
2) fy (ksi) Pc (kip) f'c (ksi) Actual V (kip)
A1 Rough 128 1.32 69 0 1.75 76
A2 Rough 128 1.32 69 0 1.75 76
A3 Rough 128 2.64 69 0 1.75 90
A4 Rough 128 0 69 128 1.75 204
A5 Rough 128 1.32 69 128 1.75 182
A6 Rough 128 2.64 69 128 1.75 213
A7 Rough 128 0 69 128 1.75 201
B1 Rough 128 1.32 69 0 3.5 113
B2 Rough 128 2.64 69 0 3.5 130
B3 Rough 128 0 69 128 3.5 254
B4 Rough 128 0 69 192 3.5 291
B5 Rough 128 1.32 69 128 3.5 264
B6 Rough 128 2.64 69 128 3.5 274
B9 Rough 128 1.32 69 44.8 3.5 167
Valluvan, R., M. E. Kreger, et al. (1999). "Evaluation of ACI 318-95 Shear-Friction Provisions." ACI Structural Journal 96(4): 473-
481.
86
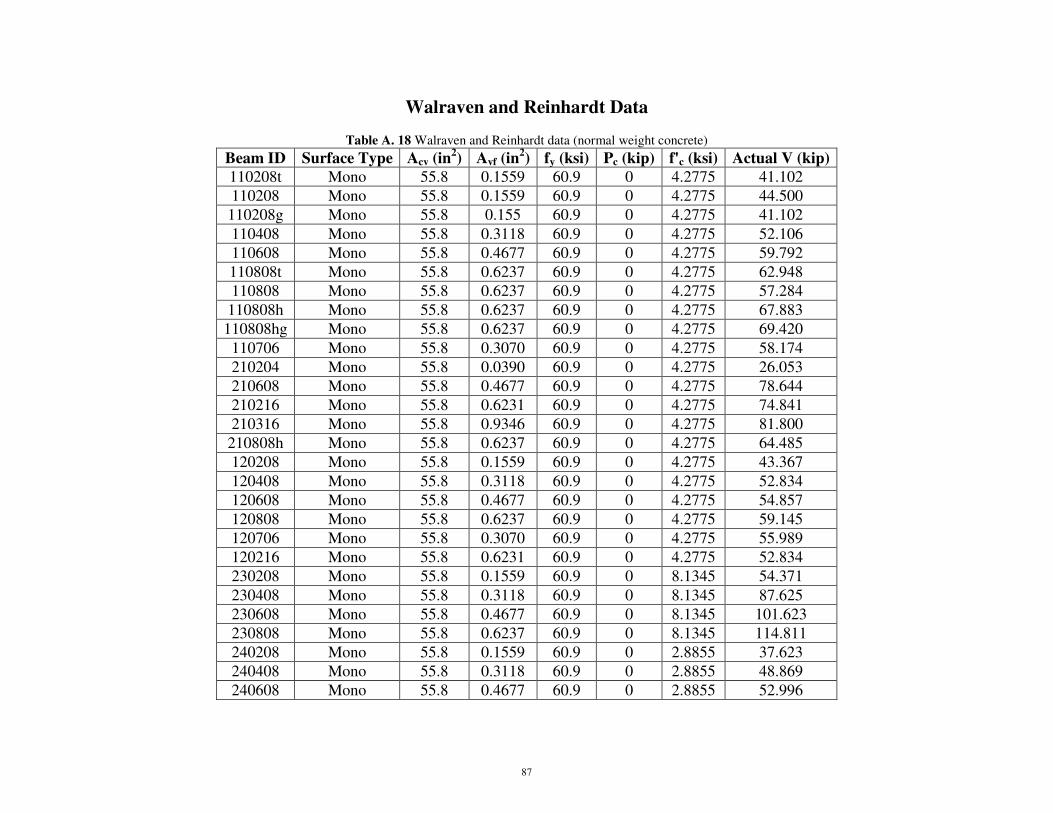
Walraven and Reinhardt Data
Table A. 18 Walraven and Reinhardt data (normal weight concrete)
Beam ID Surface Type Acv (in2) Avf (in
2) fy (ksi) Pc (kip) f'c (ksi) Actual V (kip)
110208t Mono 55.8 0.1559 60.9 0 4.2775 41.102
110208 Mono 55.8 0.1559 60.9 0 4.2775 44.500
110208g Mono 55.8 0.155 60.9 0 4.2775 41.102
110408 Mono 55.8 0.3118 60.9 0 4.2775 52.106
110608 Mono 55.8 0.4677 60.9 0 4.2775 59.792
110808t Mono 55.8 0.6237 60.9 0 4.2775 62.948
110808 Mono 55.8 0.6237 60.9 0 4.2775 57.284
110808h Mono 55.8 0.6237 60.9 0 4.2775 67.883
110808hg Mono 55.8 0.6237 60.9 0 4.2775 69.420
110706 Mono 55.8 0.3070 60.9 0 4.2775 58.174
210204 Mono 55.8 0.0390 60.9 0 4.2775 26.053
210608 Mono 55.8 0.4677 60.9 0 4.2775 78.644
210216 Mono 55.8 0.6231 60.9 0 4.2775 74.841
210316 Mono 55.8 0.9346 60.9 0 4.2775 81.800
210808h Mono 55.8 0.6237 60.9 0 4.2775 64.485
120208 Mono 55.8 0.1559 60.9 0 4.2775 43.367
120408 Mono 55.8 0.3118 60.9 0 4.2775 52.834
120608 Mono 55.8 0.4677 60.9 0 4.2775 54.857
120808 Mono 55.8 0.6237 60.9 0 4.2775 59.145
120706 Mono 55.8 0.3070 60.9 0 4.2775 55.989
120216 Mono 55.8 0.6231 60.9 0 4.2775 52.834
230208 Mono 55.8 0.1559 60.9 0 8.1345 54.371
230408 Mono 55.8 0.3118 60.9 0 8.1345 87.625
230608 Mono 55.8 0.4677 60.9 0 8.1345 101.623
230808 Mono 55.8 0.6237 60.9 0 8.1345 114.811
240208 Mono 55.8 0.1559 60.9 0 2.8855 37.623
240408 Mono 55.8 0.3118 60.9 0 2.8855 48.869
240608 Mono 55.8 0.4677 60.9 0 2.8855 52.996
87
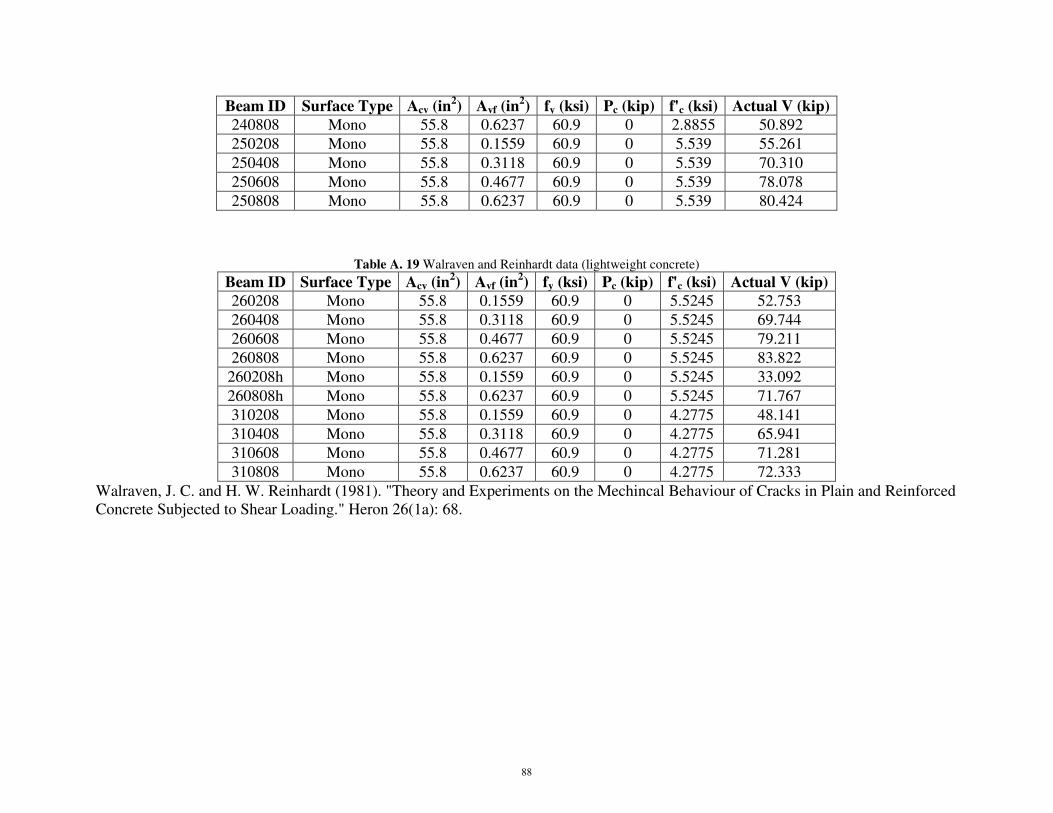
Beam ID Surface Type Acv (in2) Avf (in
2) fy (ksi) Pc (kip) f'c (ksi) Actual V (kip)
240808 Mono 55.8 0.6237 60.9 0 2.8855 50.892
250208 Mono 55.8 0.1559 60.9 0 5.539 55.261
250408 Mono 55.8 0.3118 60.9 0 5.539 70.310
250608 Mono 55.8 0.4677 60.9 0 5.539 78.078
250808 Mono 55.8 0.6237 60.9 0 5.539 80.424
Table A. 19 Walraven and Reinhardt data (lightweight concrete)
Beam ID Surface Type Acv (in2) Avf (in
2) fy (ksi) Pc (kip) f'c (ksi) Actual V (kip)
260208 Mono 55.8 0.1559 60.9 0 5.5245 52.753
260408 Mono 55.8 0.3118 60.9 0 5.5245 69.744
260608 Mono 55.8 0.4677 60.9 0 5.5245 79.211
260808 Mono 55.8 0.6237 60.9 0 5.5245 83.822
260208h Mono 55.8 0.1559 60.9 0 5.5245 33.092
260808h Mono 55.8 0.6237 60.9 0 5.5245 71.767
310208 Mono 55.8 0.1559 60.9 0 4.2775 48.141
310408 Mono 55.8 0.3118 60.9 0 4.2775 65.941
310608 Mono 55.8 0.4677 60.9 0 4.2775 71.281
310808 Mono 55.8 0.6237 60.9 0 4.2775 72.333
Walraven, J. C. and H. W. Reinhardt (1981). "Theory and Experiments on the Mechincal Behaviour of Cracks in Plain and Reinforced
Concrete Subjected to Shear Loading." Heron 26(1a): 68.
88

APPENDIX B
Professional Factors
89

Appendix B
Appendix B presents the calculated biases of the professional factor for each test result. The biases were calculated for both the
AASHTO LRFD horizontal shear equation and the proposed horizontal shear equation by Wallenfelsz.
Banta
Table B.1 Professional factors for Banta data (lightweight concrete)
Beam ID AASHTO
λP
Wallenfelsz
λP Beam ID
AASHTO
λP
Wallenfelsz
λP Beam ID
AASHTO
λP
Wallenfelsz
λP
12S-0L-0-A 1.403 1.421 18S-2L-1-A 1.079 1.947 18S-0L-0-A 1.754 1.777
12S-0L-0-B 2.505 2.537 18S-2L-1-B 1.063 1.919 18S-0L-0-B 1.348 1.365
12S-2L-2-A 1.563 2.177 18S-2L-2-A 1.507 2.451 24S-0L-0-A 2.776 2.812
12S-2L-2-B 1.539 2.144 18S-2L-2-B 1.341 2.180 24S-0L-0-B 2.994 3.033
18S-1L-1-A 0.805 1.134 18S-2L-3-A 1.584 2.247 24S-2L-2-A 1.219 2.266
18S-1L-1-B 0.820 1.155 18S-2L-3-B 1.385 1.965 24S-2L-2-B 0.669 1.243
90
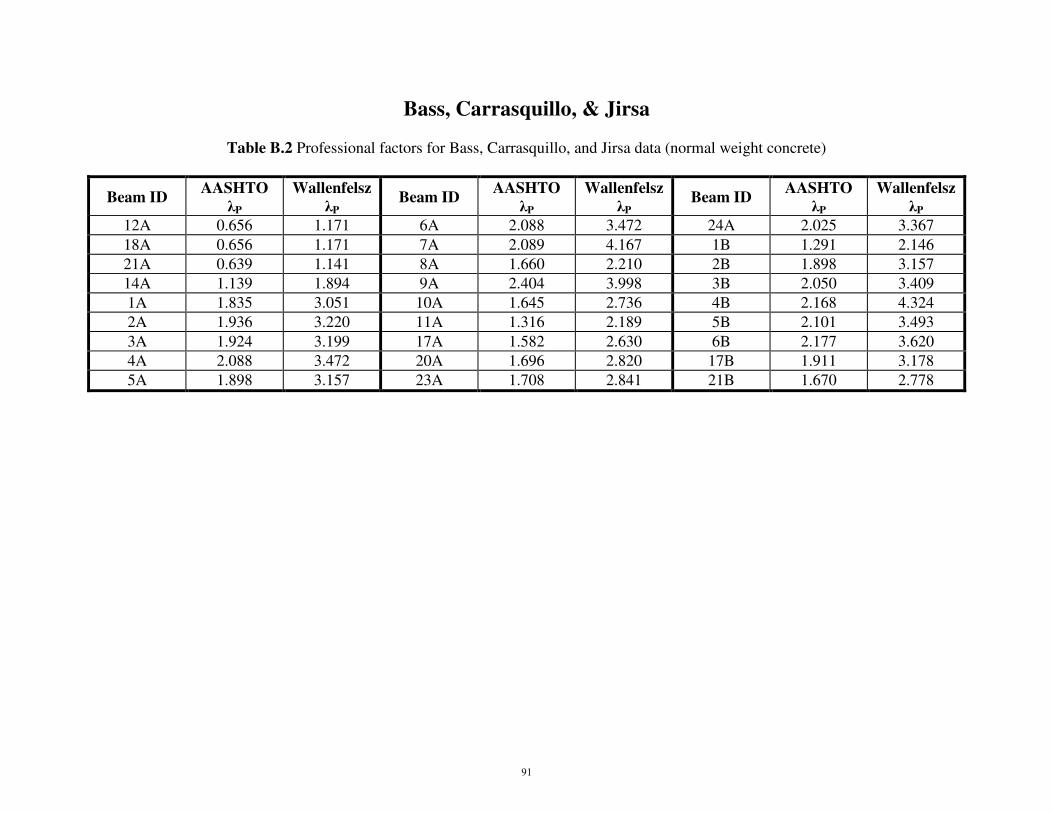
Bass, Carrasquillo, & Jirsa
Table B.2 Professional factors for Bass, Carrasquillo, and Jirsa data (normal weight concrete)
Beam ID AASHTO
λP
Wallenfelsz
λP Beam ID
AASHTO
λP
Wallenfelsz
λP Beam ID
AASHTO
λP
Wallenfelsz
λP
12A 0.656 1.171 6A 2.088 3.472 24A 2.025 3.367
18A 0.656 1.171 7A 2.089 4.167 1B 1.291 2.146
21A 0.639 1.141 8A 1.660 2.210 2B 1.898 3.157
14A 1.139 1.894 9A 2.404 3.998 3B 2.050 3.409
1A 1.835 3.051 10A 1.645 2.736 4B 2.168 4.324
2A 1.936 3.220 11A 1.316 2.189 5B 2.101 3.493
3A 1.924 3.199 17A 1.582 2.630 6B 2.177 3.620
4A 2.088 3.472 20A 1.696 2.820 17B 1.911 3.178
5A 1.898 3.157 23A 1.708 2.841 21B 1.670 2.778
91
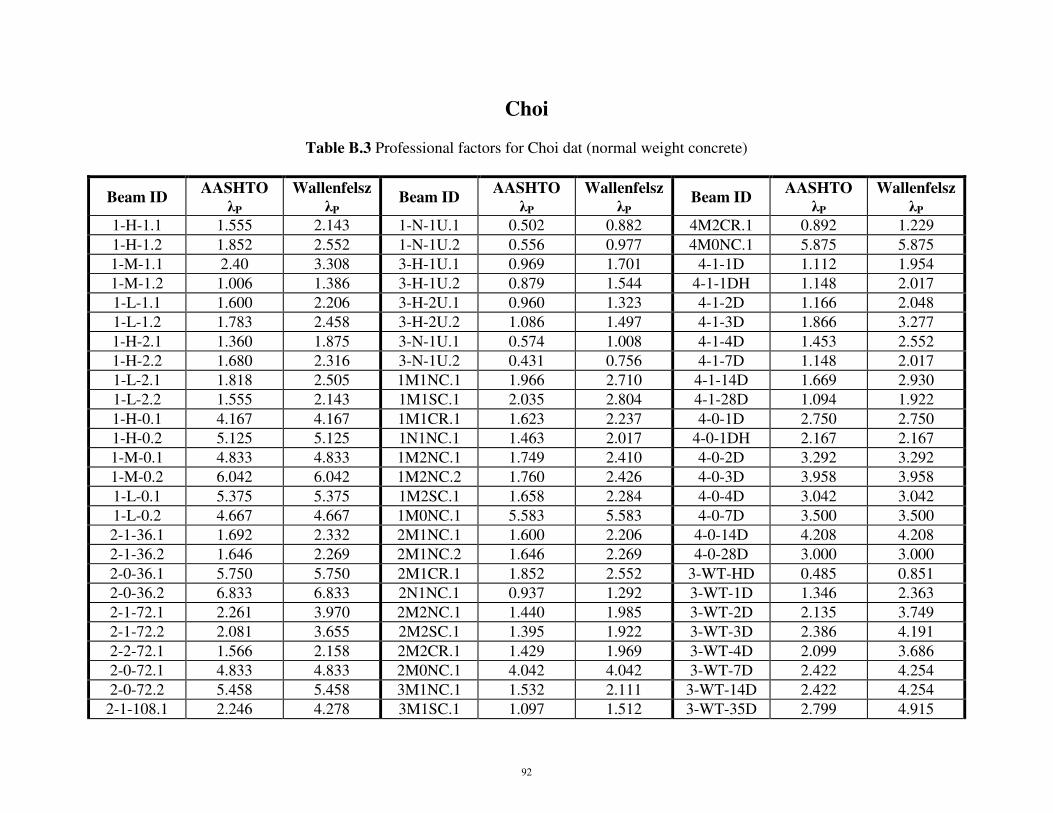
Choi
Table B.3 Professional factors for Choi dat (normal weight concrete)
Beam ID AASHTO
λP
Wallenfelsz
λP Beam ID
AASHTO
λP
Wallenfelsz
λP Beam ID
AASHTO
λP
Wallenfelsz
λP
1-H-1.1 1.555 2.143 1-N-1U.1 0.502 0.882 4M2CR.1 0.892 1.229
1-H-1.2 1.852 2.552 1-N-1U.2 0.556 0.977 4M0NC.1 5.875 5.875
1-M-1.1 2.40 3.308 3-H-1U.1 0.969 1.701 4-1-1D 1.112 1.954
1-M-1.2 1.006 1.386 3-H-1U.2 0.879 1.544 4-1-1DH 1.148 2.017
1-L-1.1 1.600 2.206 3-H-2U.1 0.960 1.323 4-1-2D 1.166 2.048
1-L-1.2 1.783 2.458 3-H-2U.2 1.086 1.497 4-1-3D 1.866 3.277
1-H-2.1 1.360 1.875 3-N-1U.1 0.574 1.008 4-1-4D 1.453 2.552
1-H-2.2 1.680 2.316 3-N-1U.2 0.431 0.756 4-1-7D 1.148 2.017
1-L-2.1 1.818 2.505 1M1NC.1 1.966 2.710 4-1-14D 1.669 2.930
1-L-2.2 1.555 2.143 1M1SC.1 2.035 2.804 4-1-28D 1.094 1.922
1-H-0.1 4.167 4.167 1M1CR.1 1.623 2.237 4-0-1D 2.750 2.750
1-H-0.2 5.125 5.125 1N1NC.1 1.463 2.017 4-0-1DH 2.167 2.167
1-M-0.1 4.833 4.833 1M2NC.1 1.749 2.410 4-0-2D 3.292 3.292
1-M-0.2 6.042 6.042 1M2NC.2 1.760 2.426 4-0-3D 3.958 3.958
1-L-0.1 5.375 5.375 1M2SC.1 1.658 2.284 4-0-4D 3.042 3.042
1-L-0.2 4.667 4.667 1M0NC.1 5.583 5.583 4-0-7D 3.500 3.500
2-1-36.1 1.692 2.332 2M1NC.1 1.600 2.206 4-0-14D 4.208 4.208
2-1-36.2 1.646 2.269 2M1NC.2 1.646 2.269 4-0-28D 3.000 3.000
2-0-36.1 5.750 5.750 2M1CR.1 1.852 2.552 3-WT-HD 0.485 0.851
2-0-36.2 6.833 6.833 2N1NC.1 0.937 1.292 3-WT-1D 1.346 2.363
2-1-72.1 2.261 3.970 2M2NC.1 1.440 1.985 3-WT-2D 2.135 3.749
2-1-72.2 2.081 3.655 2M2SC.1 1.395 1.922 3-WT-3D 2.386 4.191
2-2-72.1 1.566 2.158 2M2CR.1 1.429 1.969 3-WT-4D 2.099 3.686
2-0-72.1 4.833 4.833 2M0NC.1 4.042 4.042 3-WT-7D 2.422 4.254
2-0-72.2 5.458 5.458 3M1NC.1 1.532 2.111 3-WT-14D 2.422 4.254
2-1-108.1 2.246 4.278 3M1SC.1 1.097 1.512 3-WT-35D 2.799 4.915
92

2-1-108.2 1.692 3.222 3M1CR.1 0.502 2.017 3-DY-HD 0.892 0.977
2-2-108.1 1.409 2.219 3M2NC.1 0.556 1.749 3-DY-1D 5.875 2.678
2-2-108.2 1.480 2.331 3M2CR.1 0.969 1.654 3-DY-2D 1.112 3.182
2-0-108.1 4.222 4.222 4M1NC.1 0.879 1.764 3-DY-3D 1.148 3.025
2-0-108.2 4.194 4.194 4M1NC.2 0.960 1.670 3-DY-4D 1.166 3.970
1-H-1U.1 1.041 1.827 4M1CR.1 1.086 1.449 3-DY-7D 1.866 3.781
1-H-1U.2 0.915 1.607 4M2NC.1 0.574 1.922 3-DY-14D 1.453 3.907
1-H-2U.1 0.892 1.229 4M2NC.2 0.431 1.749 3-DY-35D 1.148 3.151
1-H-2U.2 0.937 1.292
93
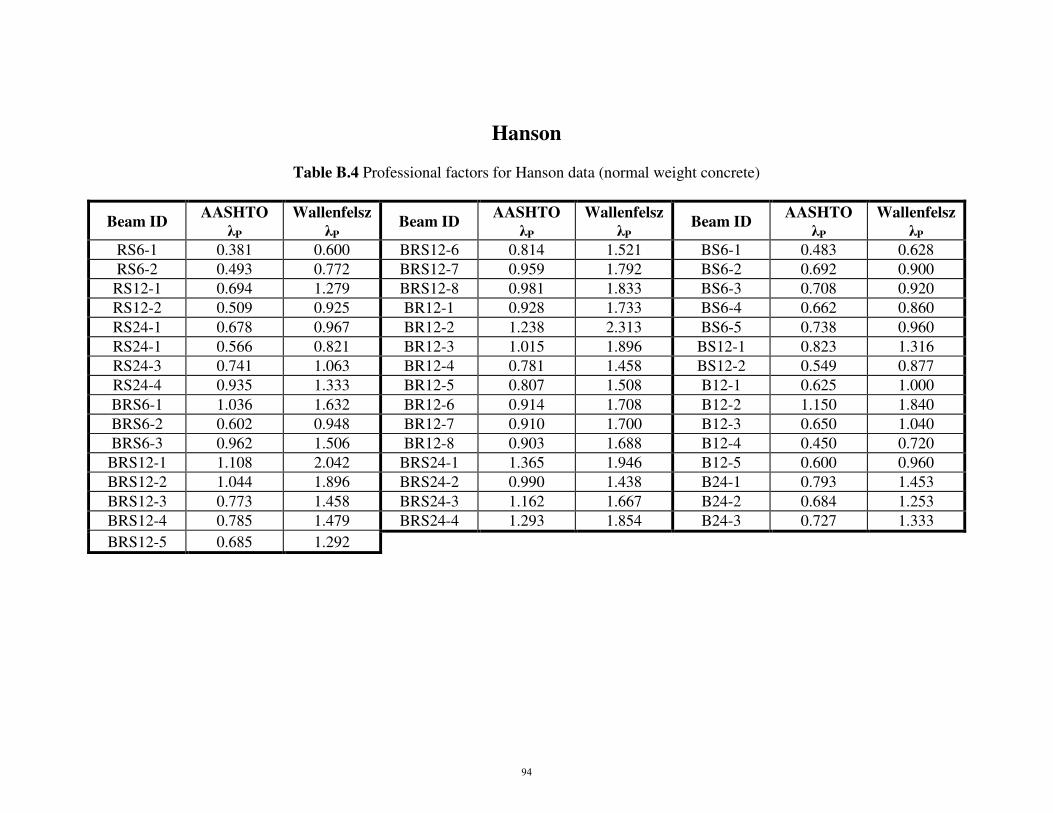
Hanson
Table B.4 Professional factors for Hanson data (normal weight concrete)
Beam ID AASHTO
λP
Wallenfelsz
λP Beam ID
AASHTO
λP
Wallenfelsz
λP Beam ID
AASHTO
λP
Wallenfelsz
λP
RS6-1 0.381 0.600 BRS12-6 0.814 1.521 BS6-1 0.483 0.628
RS6-2 0.493 0.772 BRS12-7 0.959 1.792 BS6-2 0.692 0.900
RS12-1 0.694 1.279 BRS12-8 0.981 1.833 BS6-3 0.708 0.920
RS12-2 0.509 0.925 BR12-1 0.928 1.733 BS6-4 0.662 0.860
RS24-1 0.678 0.967 BR12-2 1.238 2.313 BS6-5 0.738 0.960
RS24-1 0.566 0.821 BR12-3 1.015 1.896 BS12-1 0.823 1.316
RS24-3 0.741 1.063 BR12-4 0.781 1.458 BS12-2 0.549 0.877
RS24-4 0.935 1.333 BR12-5 0.807 1.508 B12-1 0.625 1.000
BRS6-1 1.036 1.632 BR12-6 0.914 1.708 B12-2 1.150 1.840
BRS6-2 0.602 0.948 BR12-7 0.910 1.700 B12-3 0.650 1.040
BRS6-3 0.962 1.506 BR12-8 0.903 1.688 B12-4 0.450 0.720
BRS12-1 1.108 2.042 BRS24-1 1.365 1.946 B12-5 0.600 0.960
BRS12-2 1.044 1.896 BRS24-2 0.990 1.438 B24-1 0.793 1.453
BRS12-3 0.773 1.458 BRS24-3 1.162 1.667 B24-2 0.684 1.253
BRS12-4 0.785 1.479 BRS24-4 1.293 1.854 B24-3 0.727 1.333
BRS12-5 0.685 1.292
94
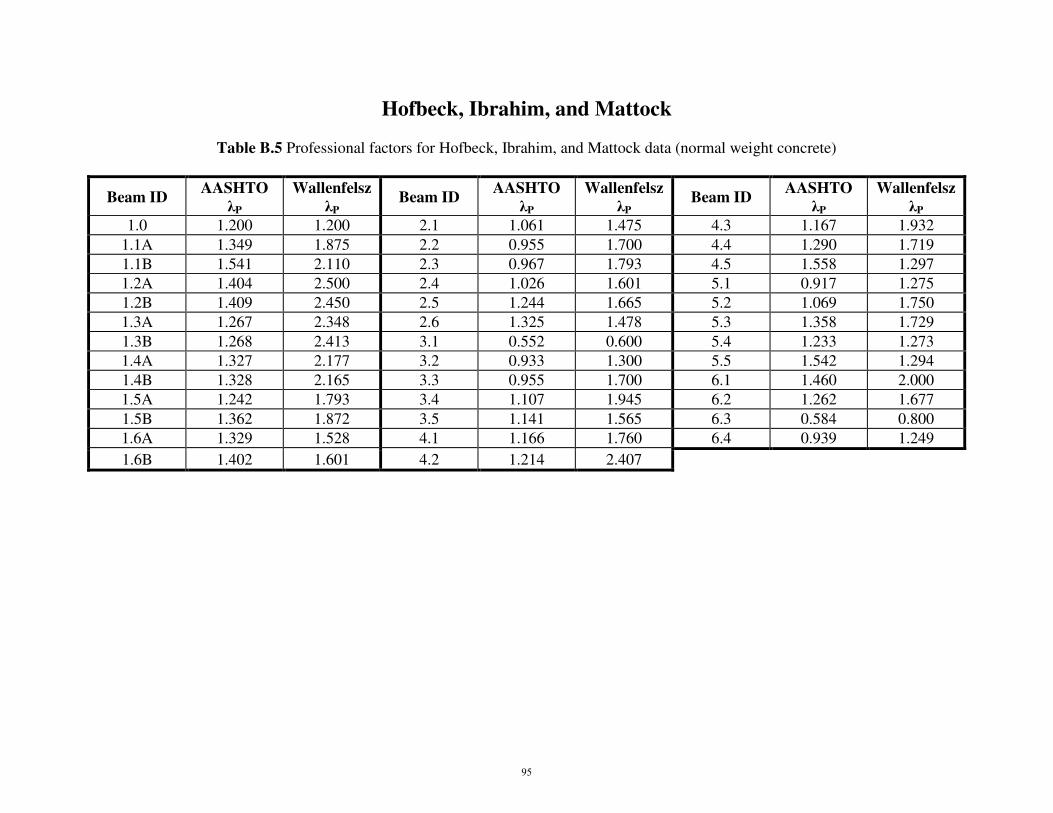
Hofbeck, Ibrahim, and Mattock
Table B.5 Professional factors for Hofbeck, Ibrahim, and Mattock data (normal weight concrete)
Beam ID AASHTO
λP
Wallenfelsz
λP Beam ID
AASHTO
λP
Wallenfelsz
λP Beam ID
AASHTO
λP
Wallenfelsz
λP
1.0 1.200 1.200 2.1 1.061 1.475 4.3 1.167 1.932
1.1A 1.349 1.875 2.2 0.955 1.700 4.4 1.290 1.719
1.1B 1.541 2.110 2.3 0.967 1.793 4.5 1.558 1.297
1.2A 1.404 2.500 2.4 1.026 1.601 5.1 0.917 1.275
1.2B 1.409 2.450 2.5 1.244 1.665 5.2 1.069 1.750
1.3A 1.267 2.348 2.6 1.325 1.478 5.3 1.358 1.729
1.3B 1.268 2.413 3.1 0.552 0.600 5.4 1.233 1.273
1.4A 1.327 2.177 3.2 0.933 1.300 5.5 1.542 1.294
1.4B 1.328 2.165 3.3 0.955 1.700 6.1 1.460 2.000
1.5A 1.242 1.793 3.4 1.107 1.945 6.2 1.262 1.677
1.5B 1.362 1.872 3.5 1.141 1.565 6.3 0.584 0.800
1.6A 1.329 1.528 4.1 1.166 1.760 6.4 0.939 1.249
1.6B 1.402 1.601 4.2 1.214 2.407
95
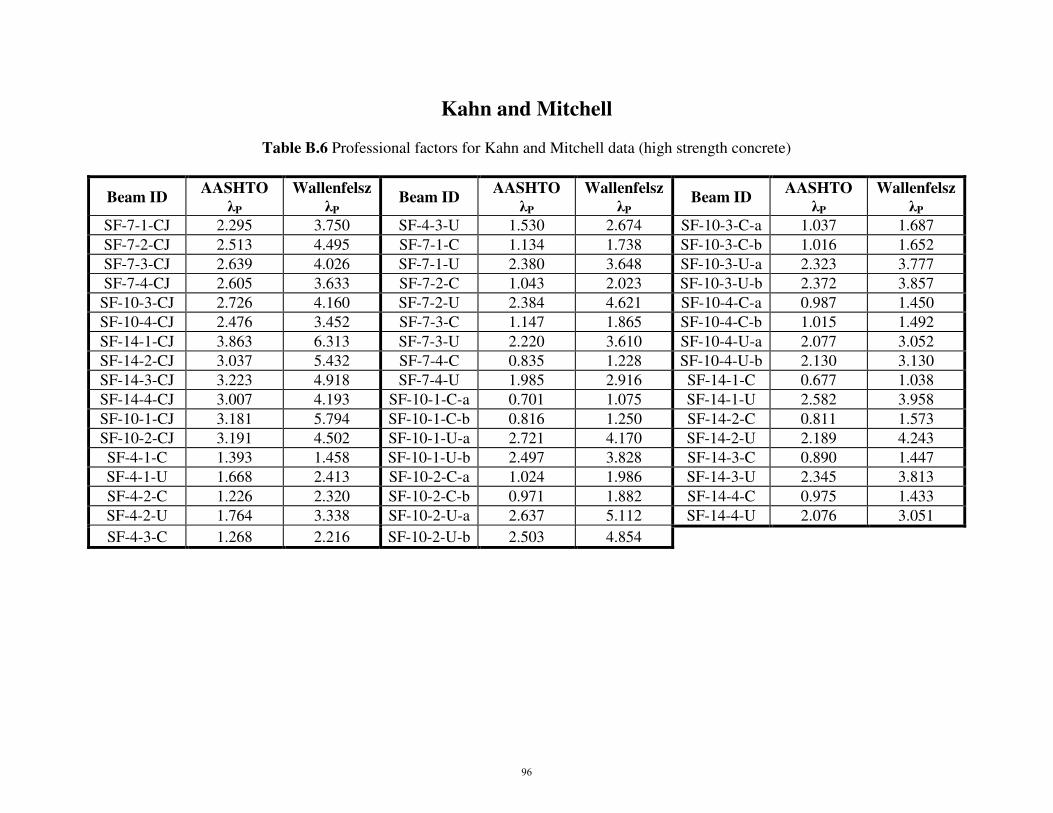
Kahn and Mitchell
Table B.6 Professional factors for Kahn and Mitchell data (high strength concrete)
Beam ID AASHTO
λP
Wallenfelsz
λP Beam ID
AASHTO
λP
Wallenfelsz
λP Beam ID
AASHTO
λP
Wallenfelsz
λP
SF-7-1-CJ 2.295 3.750 SF-4-3-U 1.530 2.674 SF-10-3-C-a 1.037 1.687
SF-7-2-CJ 2.513 4.495 SF-7-1-C 1.134 1.738 SF-10-3-C-b 1.016 1.652
SF-7-3-CJ 2.639 4.026 SF-7-1-U 2.380 3.648 SF-10-3-U-a 2.323 3.777
SF-7-4-CJ 2.605 3.633 SF-7-2-C 1.043 2.023 SF-10-3-U-b 2.372 3.857
SF-10-3-CJ 2.726 4.160 SF-7-2-U 2.384 4.621 SF-10-4-C-a 0.987 1.450
SF-10-4-CJ 2.476 3.452 SF-7-3-C 1.147 1.865 SF-10-4-C-b 1.015 1.492
SF-14-1-CJ 3.863 6.313 SF-7-3-U 2.220 3.610 SF-10-4-U-a 2.077 3.052
SF-14-2-CJ 3.037 5.432 SF-7-4-C 0.835 1.228 SF-10-4-U-b 2.130 3.130
SF-14-3-CJ 3.223 4.918 SF-7-4-U 1.985 2.916 SF-14-1-C 0.677 1.038
SF-14-4-CJ 3.007 4.193 SF-10-1-C-a 0.701 1.075 SF-14-1-U 2.582 3.958
SF-10-1-CJ 3.181 5.794 SF-10-1-C-b 0.816 1.250 SF-14-2-C 0.811 1.573
SF-10-2-CJ 3.191 4.502 SF-10-1-U-a 2.721 4.170 SF-14-2-U 2.189 4.243
SF-4-1-C 1.393 1.458 SF-10-1-U-b 2.497 3.828 SF-14-3-C 0.890 1.447
SF-4-1-U 1.668 2.413 SF-10-2-C-a 1.024 1.986 SF-14-3-U 2.345 3.813
SF-4-2-C 1.226 2.320 SF-10-2-C-b 0.971 1.882 SF-14-4-C 0.975 1.433
SF-4-2-U 1.764 3.338 SF-10-2-U-a 2.637 5.112 SF-14-4-U 2.076 3.051
SF-4-3-C 1.268 2.216 SF-10-2-U-b 2.503 4.854
96
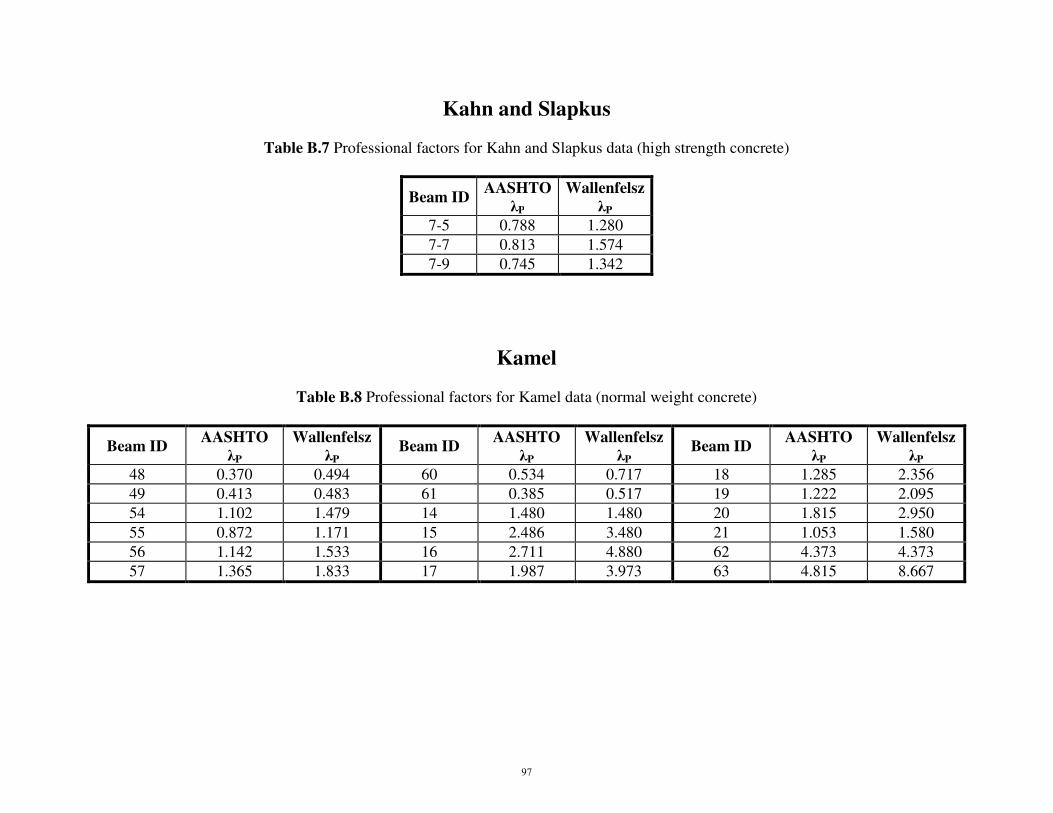
Kahn and Slapkus
Table B.7 Professional factors for Kahn and Slapkus data (high strength concrete)
Beam ID AASHTO
λP
Wallenfelsz
λP
7-5 0.788 1.280
7-7 0.813 1.574
7-9 0.745 1.342
Kamel
Table B.8 Professional factors for Kamel data (normal weight concrete)
Beam ID AASHTO
λP
Wallenfelsz
λP Beam ID
AASHTO
λP
Wallenfelsz
λP Beam ID
AASHTO
λP
Wallenfelsz
λP
48 0.370 0.494 60 0.534 0.717 18 1.285 2.356
49 0.413 0.483 61 0.385 0.517 19 1.222 2.095
54 1.102 1.479 14 1.480 1.480 20 1.815 2.950
55 0.872 1.171 15 2.486 3.480 21 1.053 1.580
56 1.142 1.533 16 2.711 4.880 62 4.373 4.373
57 1.365 1.833 17 1.987 3.973 63 4.815 8.667
97
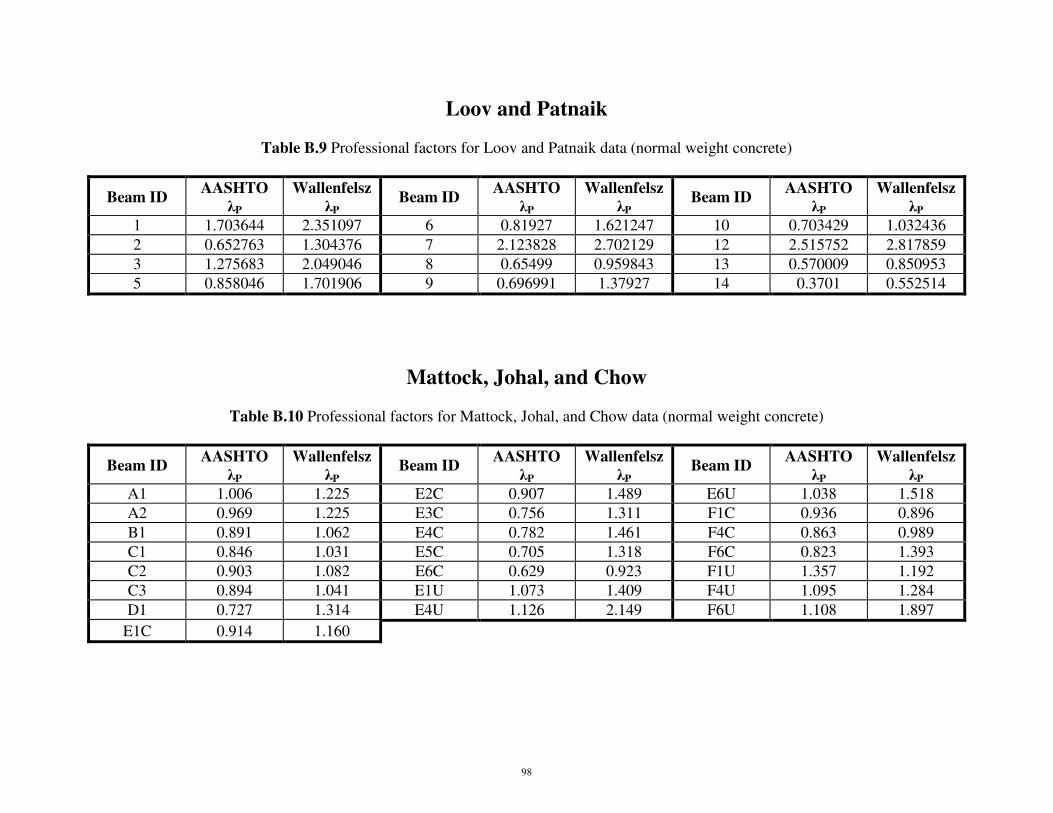
Loov and Patnaik
Table B.9 Professional factors for Loov and Patnaik data (normal weight concrete)
Beam ID AASHTO
λP
Wallenfelsz
λP Beam ID
AASHTO
λP
Wallenfelsz
λP Beam ID
AASHTO
λP
Wallenfelsz
λP
1 1.703644 2.351097 6 0.81927 1.621247 10 0.703429 1.032436
2 0.652763 1.304376 7 2.123828 2.702129 12 2.515752 2.817859
3 1.275683 2.049046 8 0.65499 0.959843 13 0.570009 0.850953
5 0.858046 1.701906 9 0.696991 1.37927 14 0.3701 0.552514
Mattock, Johal, and Chow
Table B.10 Professional factors for Mattock, Johal, and Chow data (normal weight concrete)
Beam ID AASHTO
λP
Wallenfelsz
λP Beam ID
AASHTO
λP
Wallenfelsz
λP Beam ID
AASHTO
λP
Wallenfelsz
λP
A1 1.006 1.225 E2C 0.907 1.489 E6U 1.038 1.518
A2 0.969 1.225 E3C 0.756 1.311 F1C 0.936 0.896
B1 0.891 1.062 E4C 0.782 1.461 F4C 0.863 0.989
C1 0.846 1.031 E5C 0.705 1.318 F6C 0.823 1.393
C2 0.903 1.082 E6C 0.629 0.923 F1U 1.357 1.192
C3 0.894 1.041 E1U 1.073 1.409 F4U 1.095 1.284
D1 0.727 1.314 E4U 1.126 2.149 F6U 1.108 1.897
E1C 0.914 1.160
98
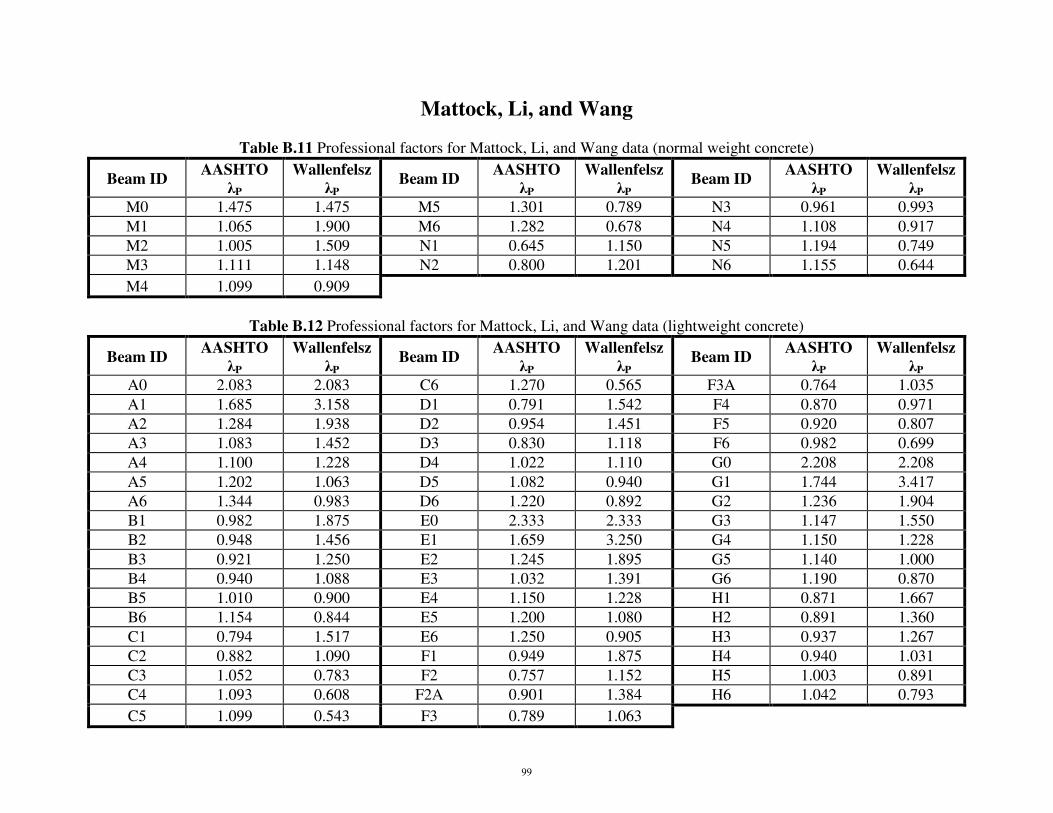
Mattock, Li, and Wang
Table B.11 Professional factors for Mattock, Li, and Wang data (normal weight concrete)
Beam ID AASHTO
λP
Wallenfelsz
λP Beam ID
AASHTO
λP
Wallenfelsz
λP Beam ID
AASHTO
λP
Wallenfelsz
λP
M0 1.475 1.475 M5 1.301 0.789 N3 0.961 0.993
M1 1.065 1.900 M6 1.282 0.678 N4 1.108 0.917
M2 1.005 1.509 N1 0.645 1.150 N5 1.194 0.749
M3 1.111 1.148 N2 0.800 1.201 N6 1.155 0.644
M4 1.099 0.909
Table B.12 Professional factors for Mattock, Li, and Wang data (lightweight concrete)
Beam ID AASHTO
λP
Wallenfelsz
λP Beam ID
AASHTO
λP
Wallenfelsz
λP Beam ID
AASHTO
λP
Wallenfelsz
λP
A0 2.083 2.083 C6 1.270 0.565 F3A 0.764 1.035
A1 1.685 3.158 D1 0.791 1.542 F4 0.870 0.971
A2 1.284 1.938 D2 0.954 1.451 F5 0.920 0.807
A3 1.083 1.452 D3 0.830 1.118 F6 0.982 0.699
A4 1.100 1.228 D4 1.022 1.110 G0 2.208 2.208
A5 1.202 1.063 D5 1.082 0.940 G1 1.744 3.417
A6 1.344 0.983 D6 1.220 0.892 G2 1.236 1.904
B1 0.982 1.875 E0 2.333 2.333 G3 1.147 1.550
B2 0.948 1.456 E1 1.659 3.250 G4 1.150 1.228
B3 0.921 1.250 E2 1.245 1.895 G5 1.140 1.000
B4 0.940 1.088 E3 1.032 1.391 G6 1.190 0.870
B5 1.010 0.900 E4 1.150 1.228 H1 0.871 1.667
B6 1.154 0.844 E5 1.200 1.080 H2 0.891 1.360
C1 0.794 1.517 E6 1.250 0.905 H3 0.937 1.267
C2 0.882 1.090 F1 0.949 1.875 H4 0.940 1.031
C3 1.052 0.783 F2 0.757 1.152 H5 1.003 0.891
C4 1.093 0.608 F2A 0.901 1.384 H6 1.042 0.793
C5 1.099 0.543 F3 0.789 1.063
99

Patnaik
Table B.13 Professional factors for Patnaik data (normal weight concrete)
Beam ID AASHTO
λP
Wallenfelsz
λP Beam ID
AASHTO
λP
Wallenfelsz
λP Beam ID
AASHTO
λP
Wallenfelsz
λP
SR1.1 1.042767 1.403817 SR4.3 1.267412 2.437477 SR5.5 2.910486 3.855636
SR1.2 1.375429 1.85166 SR4.4 1.267412 2.437477 SR5.6 2.625765 3.478454
SR2.1 0.84567 1.527144 SR4.5 1.488621 2.619318 ST1.1 1.935737 2.870564
SR2.2 0.714651 1.290545 SR4.6 0.964626 1.697318 ST1.2 2.209265 3.276187
SR3.1 1.342827 2.258453 SR5.1 0.829156 1.278227 ST2.1 2.955138 4.025029
SR3.2 1.227728 2.064871 SR5.2 1.119443 1.969727 ST2.2 3.207126 4.368249
SR4.1 1.051836 1.591672 SR5.3 1.82764 2.619318 ST3.1 4.108234 5.101491
SR4.2 0.810198 1.226017 SR5.4 1.69605 2.430727 ST3.2 4.409756 5.475912
Saemann and Washa
Table B.14 Professional factors for Saemann and Washa data (normal weight concrete)
Beam ID AASHTO
λP
Wallenfelsz
λP Beam ID
AASHTO
λP
Wallenfelsz
λP Beam ID
AASHTO
λP
Wallenfelsz
λP
1C 1.654 2.504 7D 2.911 4.876 10C 2.789 5.505
6C 1.110 2.190 3C 3.296 4.988 5D 3.687 7.276
2C 2.656 4.020 8C 2.268 4.476 6D 3.667 7.238
7C 1.834 3.619 11C 1.933 3.238 12C 3.923 6.571
3D 2.007 3.362 2D 2.672 4.476 8D 4.321 7.238
1A 5.946 7.473 13C 1.282 1.714 9D 4.435 7.429
4C 3.877 5.869 15C 2.791 2.791 14C 2.207 2.952
9C 2.316 4.571 5C 5.170 7.825 16C 4.031 4.031
100
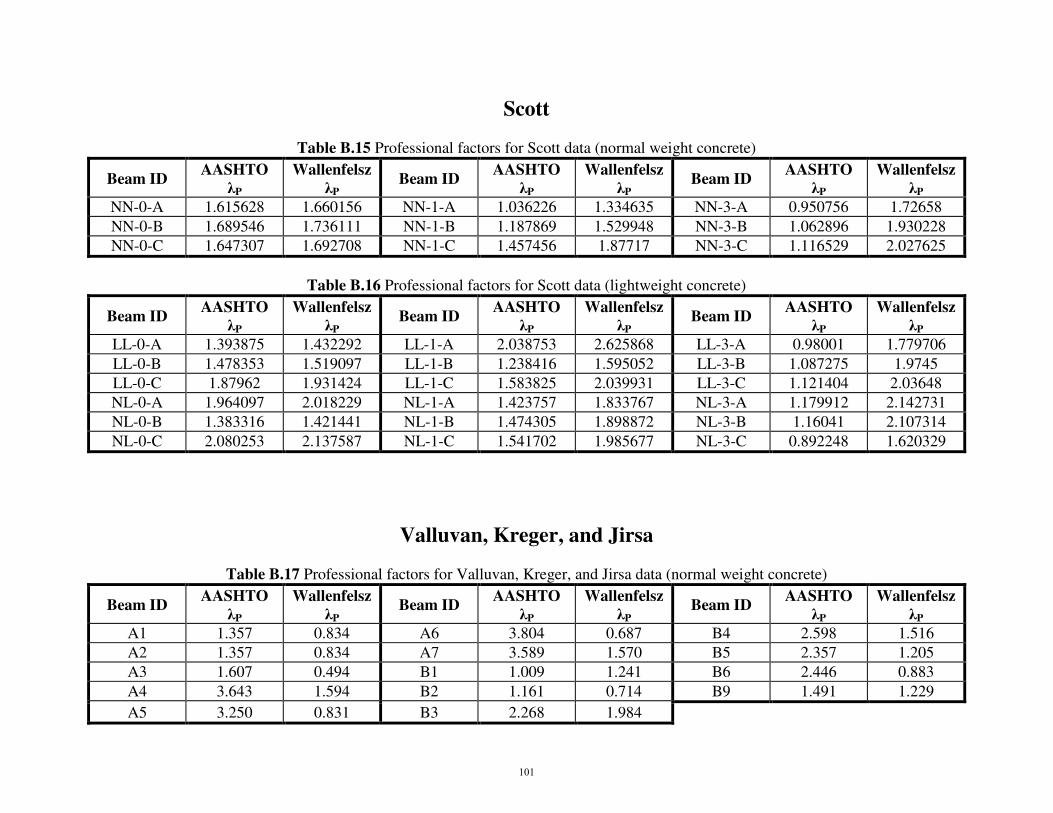
Scott
Table B.15 Professional factors for Scott data (normal weight concrete)
Beam ID AASHTO
λP
Wallenfelsz
λP Beam ID
AASHTO
λP
Wallenfelsz
λP Beam ID
AASHTO
λP
Wallenfelsz
λP
NN-0-A 1.615628 1.660156 NN-1-A 1.036226 1.334635 NN-3-A 0.950756 1.72658
NN-0-B 1.689546 1.736111 NN-1-B 1.187869 1.529948 NN-3-B 1.062896 1.930228
NN-0-C 1.647307 1.692708 NN-1-C 1.457456 1.87717 NN-3-C 1.116529 2.027625
Table B.16 Professional factors for Scott data (lightweight concrete)
Beam ID AASHTO
λP
Wallenfelsz
λP Beam ID
AASHTO
λP
Wallenfelsz
λP Beam ID
AASHTO
λP
Wallenfelsz
λP
LL-0-A 1.393875 1.432292 LL-1-A 2.038753 2.625868 LL-3-A 0.98001 1.779706
LL-0-B 1.478353 1.519097 LL-1-B 1.238416 1.595052 LL-3-B 1.087275 1.9745
LL-0-C 1.87962 1.931424 LL-1-C 1.583825 2.039931 LL-3-C 1.121404 2.03648
NL-0-A 1.964097 2.018229 NL-1-A 1.423757 1.833767 NL-3-A 1.179912 2.142731
NL-0-B 1.383316 1.421441 NL-1-B 1.474305 1.898872 NL-3-B 1.16041 2.107314
NL-0-C 2.080253 2.137587 NL-1-C 1.541702 1.985677 NL-3-C 0.892248 1.620329
Valluvan, Kreger, and Jirsa
Table B.17 Professional factors for Valluvan, Kreger, and Jirsa data (normal weight concrete)
Beam ID AASHTO
λP
Wallenfelsz
λP Beam ID
AASHTO
λP
Wallenfelsz
λP Beam ID
AASHTO
λP
Wallenfelsz
λP
A1 1.357 0.834 A6 3.804 0.687 B4 2.598 1.516
A2 1.357 0.834 A7 3.589 1.570 B5 2.357 1.205
A3 1.607 0.494 B1 1.009 1.241 B6 2.446 0.883
A4 3.643 1.594 B2 1.161 0.714 B9 1.491 1.229
A5 3.250 0.831 B3 2.268 1.984
101
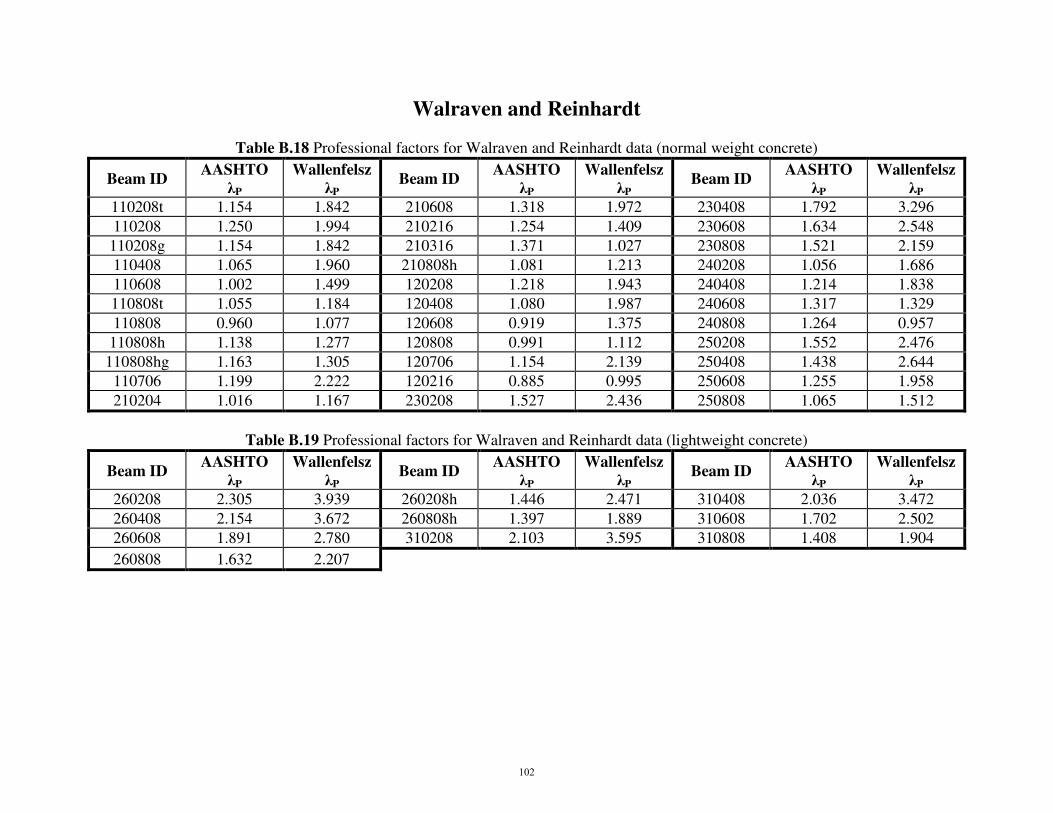
Walraven and Reinhardt
Table B.18 Professional factors for Walraven and Reinhardt data (normal weight concrete)
Beam ID AASHTO
λP
Wallenfelsz
λP Beam ID
AASHTO
λP
Wallenfelsz
λP Beam ID
AASHTO
λP
Wallenfelsz
λP
110208t 1.154 1.842 210608 1.318 1.972 230408 1.792 3.296
110208 1.250 1.994 210216 1.254 1.409 230608 1.634 2.548
110208g 1.154 1.842 210316 1.371 1.027 230808 1.521 2.159
110408 1.065 1.960 210808h 1.081 1.213 240208 1.056 1.686
110608 1.002 1.499 120208 1.218 1.943 240408 1.214 1.838
110808t 1.055 1.184 120408 1.080 1.987 240608 1.317 1.329
110808 0.960 1.077 120608 0.919 1.375 240808 1.264 0.957
110808h 1.138 1.277 120808 0.991 1.112 250208 1.552 2.476
110808hg 1.163 1.305 120706 1.154 2.139 250408 1.438 2.644
110706 1.199 2.222 120216 0.885 0.995 250608 1.255 1.958
210204 1.016 1.167 230208 1.527 2.436 250808 1.065 1.512
Table B.19 Professional factors for Walraven and Reinhardt data (lightweight concrete)
Beam ID AASHTO
λP
Wallenfelsz
λP Beam ID
AASHTO
λP
Wallenfelsz
λP Beam ID
AASHTO
λP
Wallenfelsz
λP
260208 2.305 3.939 260208h 1.446 2.471 310408 2.036 3.472
260408 2.154 3.672 260808h 1.397 1.889 310608 1.702 2.502
260608 1.891 2.780 310208 2.103 3.595 310808 1.408 1.904
260808 1.632 2.207
102

APPENDIX C
Reliability Indices
103
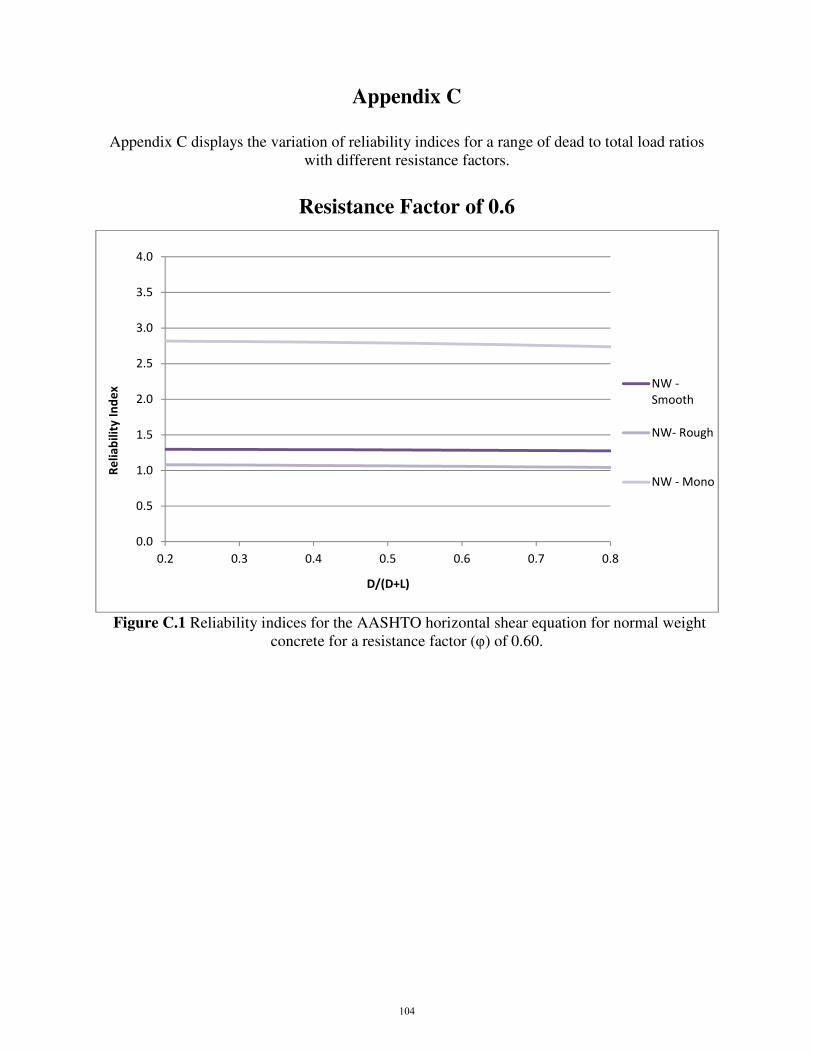
Appendix C
Appendix C displays the variation of reliability indices for a range of dead to total load ratios
with different resistance factors.
Resistance Factor of 0.6
Figure C.1 Reliability indices for the AASHTO horizontal shear equation for normal weight
concrete for a resistance factor (φ) of 0.60.
0.0
0.5
1.0
1.5
2.0
2.5
3.0
3.5
4.0
0.2 0.3 0.4 0.5 0.6 0.7 0.8
Re
lia
bil
ity
In
de
x
D/(D+L)
NW -
Smooth
NW- Rough
NW - Mono
104
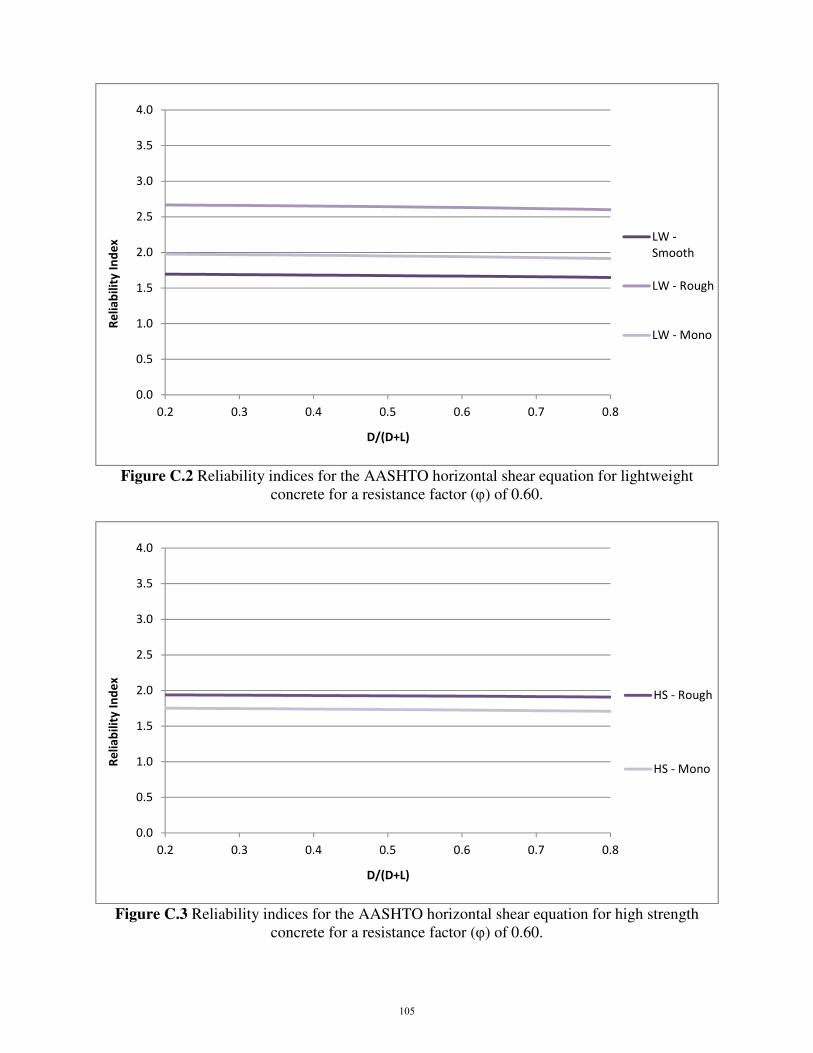
Figure C.2 Reliability indices for the AASHTO horizontal shear equation for lightweight
concrete for a resistance factor (φ) of 0.60.
Figure C.3 Reliability indices for the AASHTO horizontal shear equation for high strength
concrete for a resistance factor (φ) of 0.60.
0.0
0.5
1.0
1.5
2.0
2.5
3.0
3.5
4.0
0.2 0.3 0.4 0.5 0.6 0.7 0.8
Re
lia
bil
ity
In
de
x
D/(D+L)
LW -
Smooth
LW - Rough
LW - Mono
0.0
0.5
1.0
1.5
2.0
2.5
3.0
3.5
4.0
0.2 0.3 0.4 0.5 0.6 0.7 0.8
Re
lia
bil
ity
In
de
x
D/(D+L)
HS - Rough
HS - Mono
105
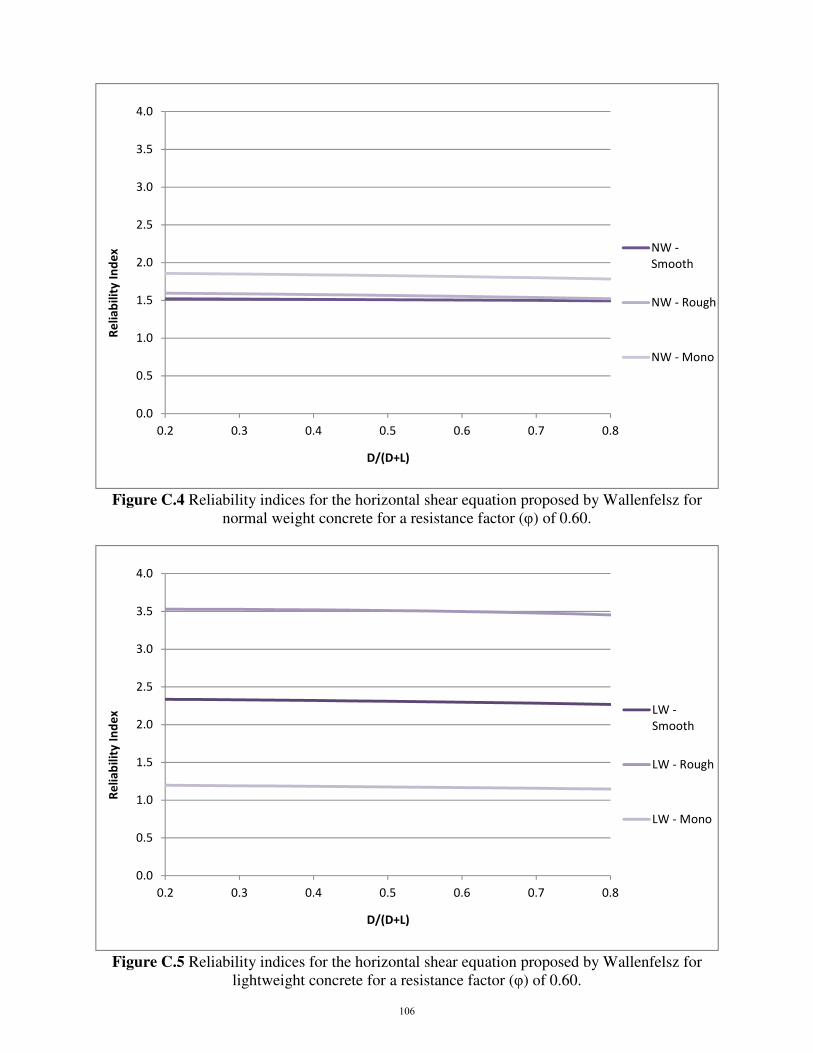
Figure C.4 Reliability indices for the horizontal shear equation proposed by Wallenfelsz for
normal weight concrete for a resistance factor (φ) of 0.60.
Figure C.5 Reliability indices for the horizontal shear equation proposed by Wallenfelsz for
lightweight concrete for a resistance factor (φ) of 0.60.
0.0
0.5
1.0
1.5
2.0
2.5
3.0
3.5
4.0
0.2 0.3 0.4 0.5 0.6 0.7 0.8
Re
lia
bil
ity
In
de
x
D/(D+L)
NW -
Smooth
NW - Rough
NW - Mono
0.0
0.5
1.0
1.5
2.0
2.5
3.0
3.5
4.0
0.2 0.3 0.4 0.5 0.6 0.7 0.8
Re
lia
bil
ity
In
de
x
D/(D+L)
LW -
Smooth
LW - Rough
LW - Mono
106

Figure C.6 Reliability indices for the horizontal shear equation proposed by Wallenfelsz for high
strength concrete for a resistance factor (φ) of 0.60.
0.0
0.5
1.0
1.5
2.0
2.5
3.0
3.5
4.0
0.2 0.3 0.4 0.5 0.6 0.7 0.8
Re
lia
bil
ity
In
de
x
D/(D+L)
HS - Rough
HS - Mono
107
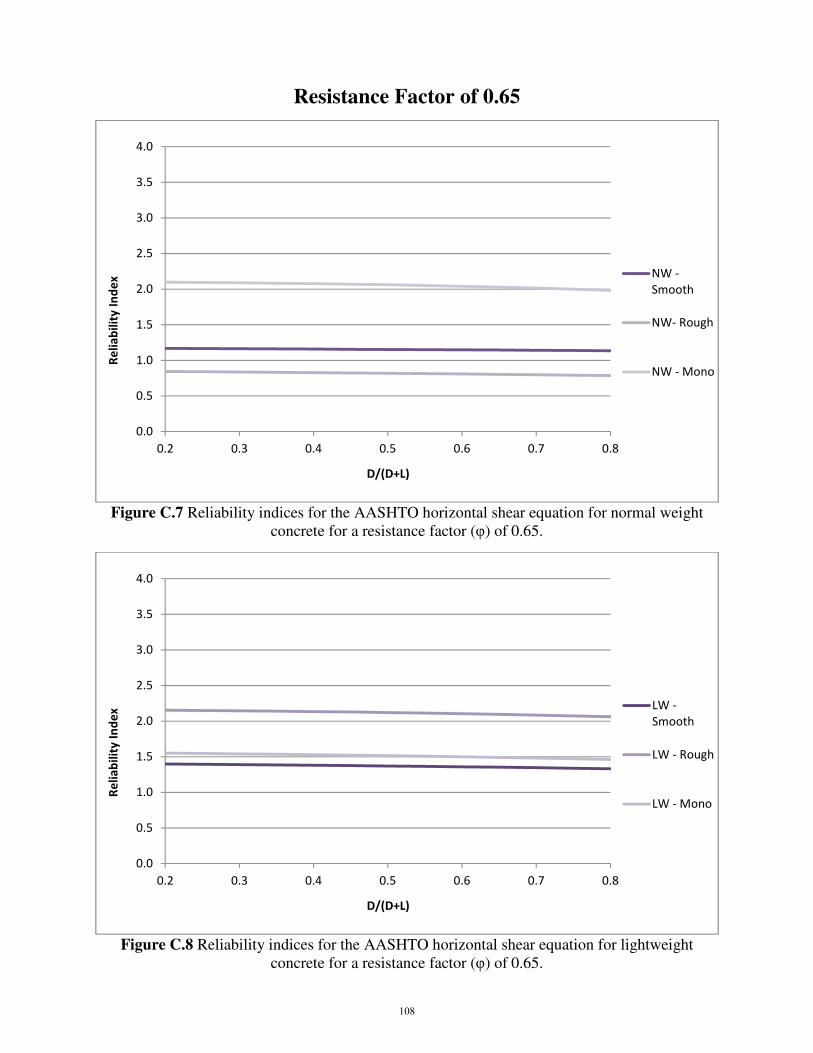
Resistance Factor of 0.65
Figure C.7 Reliability indices for the AASHTO horizontal shear equation for normal weight
concrete for a resistance factor (φ) of 0.65.
Figure C.8 Reliability indices for the AASHTO horizontal shear equation for lightweight
concrete for a resistance factor (φ) of 0.65.
0.0
0.5
1.0
1.5
2.0
2.5
3.0
3.5
4.0
0.2 0.3 0.4 0.5 0.6 0.7 0.8
Re
lia
bil
ity
In
de
x
D/(D+L)
NW -
Smooth
NW- Rough
NW - Mono
0.0
0.5
1.0
1.5
2.0
2.5
3.0
3.5
4.0
0.2 0.3 0.4 0.5 0.6 0.7 0.8
Re
lia
bil
ity
In
de
x
D/(D+L)
LW -
Smooth
LW - Rough
LW - Mono
108
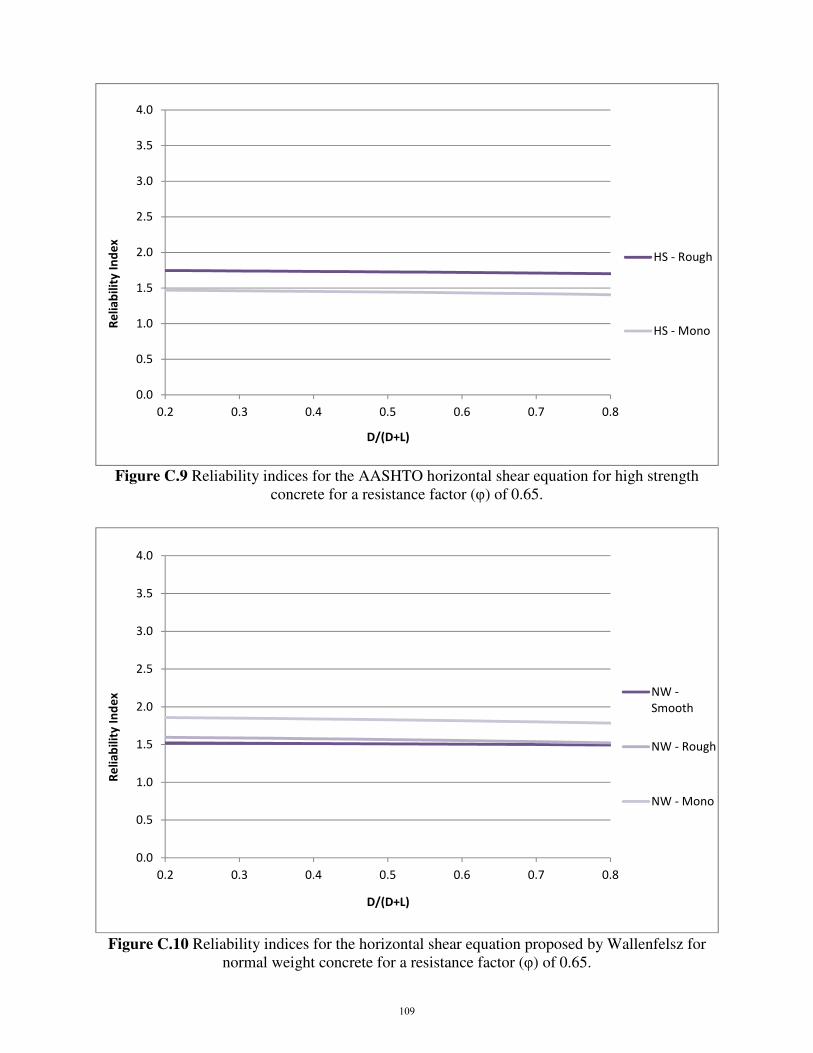
Figure C.9 Reliability indices for the AASHTO horizontal shear equation for high strength
concrete for a resistance factor (φ) of 0.65.
Figure C.10 Reliability indices for the horizontal shear equation proposed by Wallenfelsz for
normal weight concrete for a resistance factor (φ) of 0.65.
0.0
0.5
1.0
1.5
2.0
2.5
3.0
3.5
4.0
0.2 0.3 0.4 0.5 0.6 0.7 0.8
Re
lia
bil
ity
In
de
x
D/(D+L)
HS - Rough
HS - Mono
0.0
0.5
1.0
1.5
2.0
2.5
3.0
3.5
4.0
0.2 0.3 0.4 0.5 0.6 0.7 0.8
Re
lia
bil
ity
In
de
x
D/(D+L)
NW -
Smooth
NW - Rough
NW - Mono
109
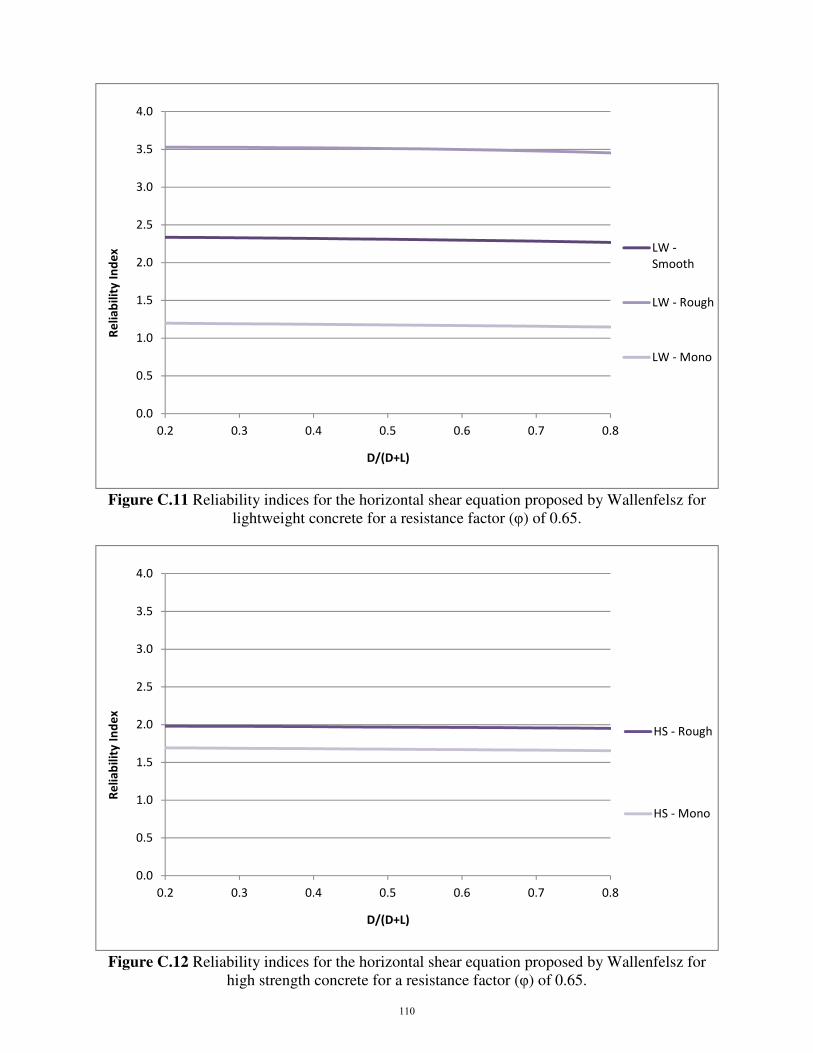
Figure C.11 Reliability indices for the horizontal shear equation proposed by Wallenfelsz for
lightweight concrete for a resistance factor (φ) of 0.65.
Figure C.12 Reliability indices for the horizontal shear equation proposed by Wallenfelsz for
high strength concrete for a resistance factor (φ) of 0.65.
0.0
0.5
1.0
1.5
2.0
2.5
3.0
3.5
4.0
0.2 0.3 0.4 0.5 0.6 0.7 0.8
Re
lia
bil
ity
In
de
x
D/(D+L)
LW -
Smooth
LW - Rough
LW - Mono
0.0
0.5
1.0
1.5
2.0
2.5
3.0
3.5
4.0
0.2 0.3 0.4 0.5 0.6 0.7 0.8
Re
lia
bil
ity
In
de
x
D/(D+L)
HS - Rough
HS - Mono
110
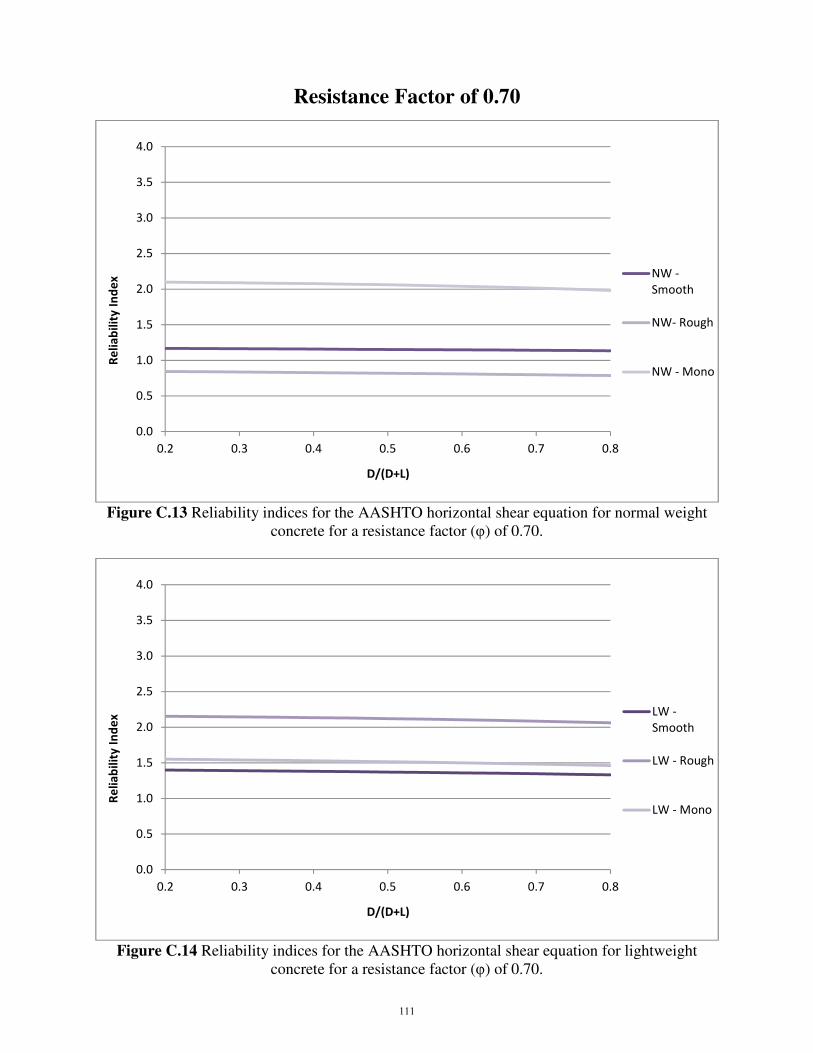
Resistance Factor of 0.70
Figure C.13 Reliability indices for the AASHTO horizontal shear equation for normal weight
concrete for a resistance factor (φ) of 0.70.
Figure C.14 Reliability indices for the AASHTO horizontal shear equation for lightweight
concrete for a resistance factor (φ) of 0.70.
0.0
0.5
1.0
1.5
2.0
2.5
3.0
3.5
4.0
0.2 0.3 0.4 0.5 0.6 0.7 0.8
Re
lia
bil
ity
In
de
x
D/(D+L)
NW -
Smooth
NW- Rough
NW - Mono
0.0
0.5
1.0
1.5
2.0
2.5
3.0
3.5
4.0
0.2 0.3 0.4 0.5 0.6 0.7 0.8
Re
lia
bil
ity
In
de
x
D/(D+L)
LW -
Smooth
LW - Rough
LW - Mono
111
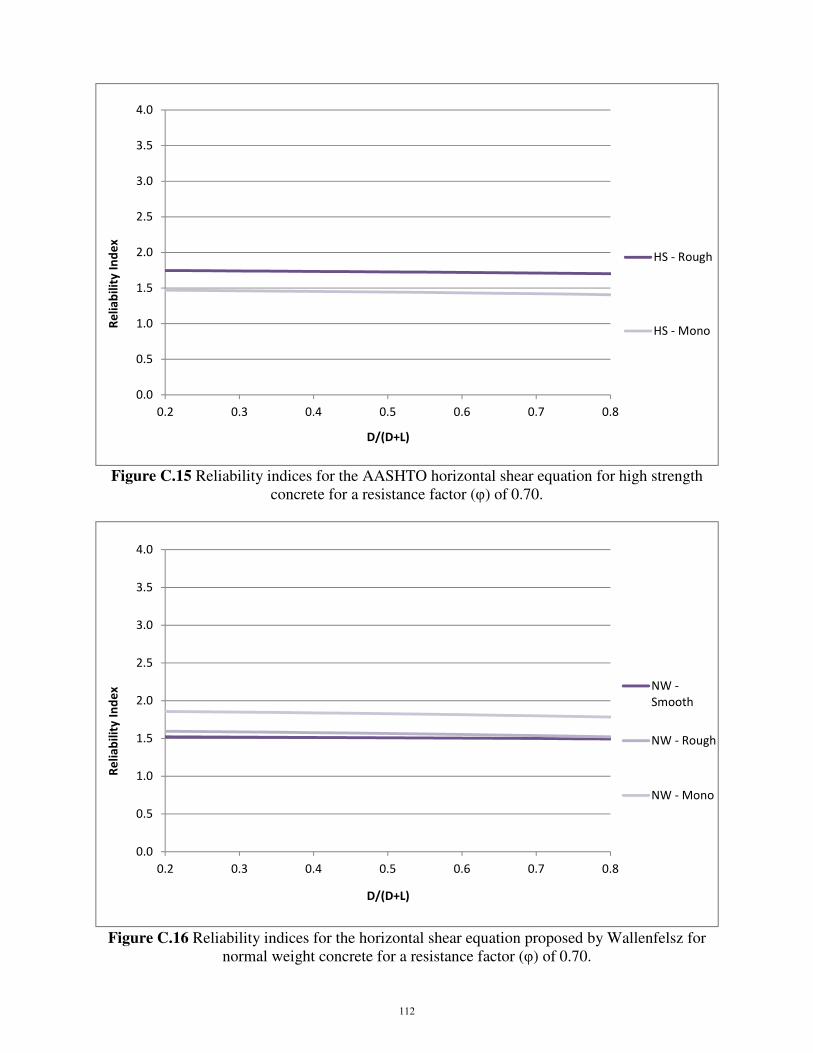
Figure C.15 Reliability indices for the AASHTO horizontal shear equation for high strength
concrete for a resistance factor (φ) of 0.70.
Figure C.16 Reliability indices for the horizontal shear equation proposed by Wallenfelsz for
normal weight concrete for a resistance factor (φ) of 0.70.
0.0
0.5
1.0
1.5
2.0
2.5
3.0
3.5
4.0
0.2 0.3 0.4 0.5 0.6 0.7 0.8
Re
lia
bil
ity
In
de
x
D/(D+L)
HS - Rough
HS - Mono
0.0
0.5
1.0
1.5
2.0
2.5
3.0
3.5
4.0
0.2 0.3 0.4 0.5 0.6 0.7 0.8
Re
lia
bil
ity
In
de
x
D/(D+L)
NW -
Smooth
NW - Rough
NW - Mono
112

Figure C.17 Reliability indices for the horizontal shear equation proposed by Wallenfelsz for
lightweight concrete for a resistance factor (φ) of 0.70.
Figure C.18 Reliability indices for the horizontal shear equation proposed by Wallenfelsz for
high strength concrete for a resistance factor (φ) of 0.70.
0.0
0.5
1.0
1.5
2.0
2.5
3.0
3.5
4.0
0.2 0.3 0.4 0.5 0.6 0.7 0.8
Re
lia
bil
ity
In
de
x
D/(D+L)
LW -
Smooth
LW - Rough
LW - Mono
0.0
0.5
1.0
1.5
2.0
2.5
3.0
3.5
4.0
0.2 0.3 0.4 0.5 0.6 0.7 0.8
Re
lia
bil
ity
In
de
x
D/(D+L)
HS - Rough
HS - Mono
113

Resistance Factor of 0.75
Figure C.19 Reliability indices for the AASHTO horizontal shear equation for normal weight
concrete for a resistance factor (φ) of 0.75.
Figure C.20 Reliability indices for the AASHTO horizontal shear equation for lightweight
concrete for a resistance factor (φ) of 0.75.
0.0
0.5
1.0
1.5
2.0
2.5
3.0
3.5
4.0
0.2 0.3 0.4 0.5 0.6 0.7 0.8
Re
lia
bil
ity
In
de
x
D/(D+L)
NW -
Smooth
NW- Rough
NW - Mono
0.0
0.5
1.0
1.5
2.0
2.5
3.0
3.5
4.0
0.2 0.3 0.4 0.5 0.6 0.7 0.8
Re
lia
bil
ity
In
de
x
D/(D+L)
LW -
Smooth
LW - Rough
LW - Mono
114

Figure C.21 Reliability indices for the AASHTO horizontal shear equation for high strength
concrete for a resistance factor (φ) of 0.75.
Figure C.22 Reliability indices for the horizontal shear equation proposed by Wallenfelsz for
normal weight concrete for a resistance factor (φ) of 0.75.
0.0
0.5
1.0
1.5
2.0
2.5
3.0
3.5
4.0
0.2 0.3 0.4 0.5 0.6 0.7 0.8
Re
lia
bil
ity
In
de
x
D/(D+L)
HS - Rough
HS - Mono
0.0
0.5
1.0
1.5
2.0
2.5
3.0
3.5
4.0
0.2 0.3 0.4 0.5 0.6 0.7 0.8
Re
lia
bil
ity
In
de
x
D/(D+L)
NW -
Smooth
NW - Rough
NW - Mono
115

Figure C.23 Reliability indices for the horizontal shear equation proposed by Wallenfelsz for
lightweight concrete for a resistance factor (φ) of 0.75.
Figure C.24 Reliability indices for the horizontal shear equation proposed by Wallenfelsz for
high strength concrete for a resistance factor (φ) of 0.75.
0.0
0.5
1.0
1.5
2.0
2.5
3.0
3.5
4.0
0.2 0.3 0.4 0.5 0.6 0.7 0.8
Re
lia
bil
ity
In
de
x
D/(D+L)
LW -
Smooth
LW - Rough
LW - Mono
0.0
0.5
1.0
1.5
2.0
2.5
3.0
3.5
4.0
0.2 0.3 0.4 0.5 0.6 0.7 0.8
Re
lia
bil
ity
In
de
x
D/(D+L)
HS - Rough
HS - Mono
116

Resistance Factor of 0.80
Figure C.25 Reliability indices for the AASHTO horizontal shear equation for normal weight
concrete for a resistance factor (φ) of 0.80.
Figure C.26 Reliability indices for the AASHTO horizontal shear equation for lightweight
concrete for a resistance factor (φ) of 0.80.
0.0
0.5
1.0
1.5
2.0
2.5
3.0
3.5
4.0
0.2 0.3 0.4 0.5 0.6 0.7 0.8
Re
lia
bil
ity
In
de
x
D/(D+L)
NW -
Smooth
NW- Rough
NW - Mono
0.0
0.5
1.0
1.5
2.0
2.5
3.0
3.5
4.0
0.2 0.3 0.4 0.5 0.6 0.7 0.8
Re
lia
bil
ity
In
de
x
D/(D+L)
LW -
Smooth
LW - Rough
LW - Mono
117
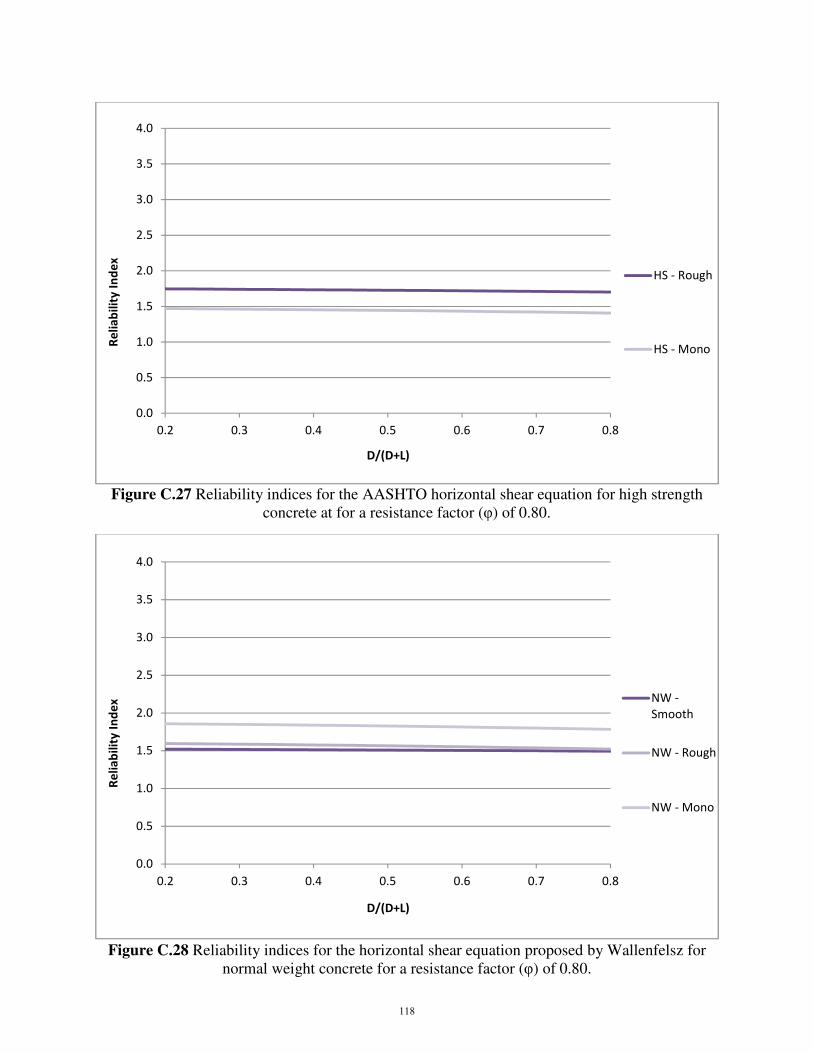
Figure C.27 Reliability indices for the AASHTO horizontal shear equation for high strength
concrete at for a resistance factor (φ) of 0.80.
Figure C.28 Reliability indices for the horizontal shear equation proposed by Wallenfelsz for
normal weight concrete for a resistance factor (φ) of 0.80.
0.0
0.5
1.0
1.5
2.0
2.5
3.0
3.5
4.0
0.2 0.3 0.4 0.5 0.6 0.7 0.8
Re
lia
bil
ity
In
de
x
D/(D+L)
HS - Rough
HS - Mono
0.0
0.5
1.0
1.5
2.0
2.5
3.0
3.5
4.0
0.2 0.3 0.4 0.5 0.6 0.7 0.8
Re
lia
bil
ity
In
de
x
D/(D+L)
NW -
Smooth
NW - Rough
NW - Mono
118

Figure C.29 Reliability indices for the horizontal shear equation proposed by Wallenfelsz for
lightweight concrete for a resistance factor (φ) of 0.80.
Figure C.30 Reliability indices for the horizontal shear equation proposed by Wallenfelsz for
high strength concrete for a resistance factor (φ) of 0.80.
0.0
0.5
1.0
1.5
2.0
2.5
3.0
3.5
4.0
0.2 0.3 0.4 0.5 0.6 0.7 0.8
Re
lia
bil
ity
In
de
x
D/(D+L)
LW -
Smooth
LW - Rough
LW - Mono
0.0
0.5
1.0
1.5
2.0
2.5
3.0
3.5
4.0
0.2 0.3 0.4 0.5 0.6 0.7 0.8
Re
lia
bil
ity
In
de
x
D/(D+L)
HS - Rough
HS - Mono
119

Resistance Factor of 0.85
Figure C.31 Reliability indices for the AASHTO horizontal shear equation for normal weight
concrete for a resistance factor (φ) of 0.85.
Figure C.32 Reliability indices for the AASHTO horizontal shear equation for lightweight
concrete at for a resistance factor (φ) of 0.85.
0.0
0.5
1.0
1.5
2.0
2.5
3.0
3.5
4.0
0.2 0.3 0.4 0.5 0.6 0.7 0.8
Re
lia
bil
ity
In
de
x
D/(D+L)
NW -
Smooth
NW- Rough
NW - Mono
0.0
0.5
1.0
1.5
2.0
2.5
3.0
3.5
4.0
0.2 0.3 0.4 0.5 0.6 0.7 0.8
Re
lia
bil
ity
In
de
x
D/(D+L)
LW -
Smooth
LW - Rough
LW - Mono
120

Figure C.33 Reliability indices for the AASHTO horizontal shear equation for high strength
concrete at for a resistance factor (φ) of 0.85.
Figure C.34 Reliability indices for the horizontal shear equation proposed by Wallenfelsz for
normal weight concrete for a resistance factor (φ) of 0.85.
0.0
0.5
1.0
1.5
2.0
2.5
3.0
3.5
4.0
0.2 0.3 0.4 0.5 0.6 0.7 0.8
Re
lia
bil
ity
In
de
x
D/(D+L)
HS - Rough
HS - Mono
0.0
0.5
1.0
1.5
2.0
2.5
3.0
3.5
4.0
0.2 0.3 0.4 0.5 0.6 0.7 0.8
Re
lia
bil
ity
In
de
x
D/(D+L)
NW -
Smooth
NW - Rough
NW - Mono
121

Figure C.35 Reliability indices for the horizontal shear equation proposed by Wallenfelsz for
lightweight concrete for a resistance factor (φ) of 0.85.
Figure C.36 Reliability indices for the horizontal shear equation proposed by Wallenfelsz for
high strength concrete for a resistance factor (φ) of 0.85.
0.0
0.5
1.0
1.5
2.0
2.5
3.0
3.5
4.0
0.2 0.3 0.4 0.5 0.6 0.7 0.8
Re
lia
bil
ity
In
de
x
D/(D+L)
LW -
Smooth
LW - Rough
LW - Mono
0.0
0.5
1.0
1.5
2.0
2.5
3.0
3.5
4.0
0.2 0.3 0.4 0.5 0.6 0.7 0.8
Re
lia
bil
ity
In
de
x
D/(D+L)
HS - Rough
HS - Mono
122
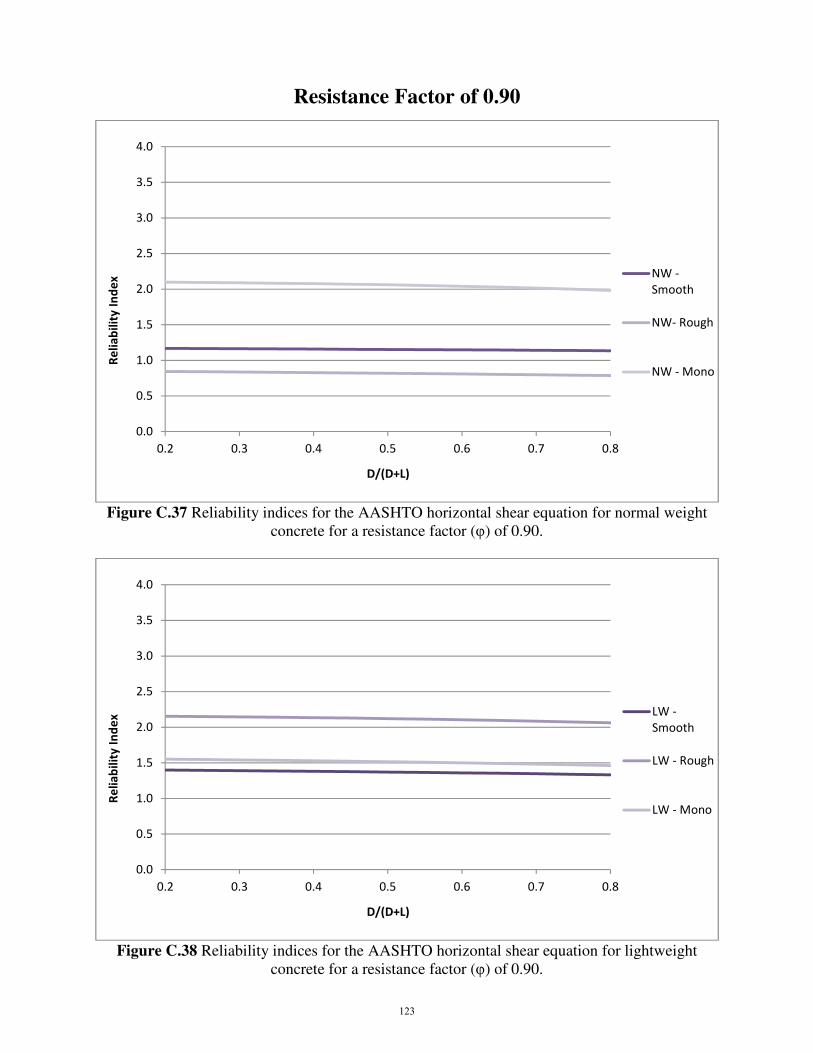
Resistance Factor of 0.90
Figure C.37 Reliability indices for the AASHTO horizontal shear equation for normal weight
concrete for a resistance factor (φ) of 0.90.
Figure C.38 Reliability indices for the AASHTO horizontal shear equation for lightweight
concrete for a resistance factor (φ) of 0.90.
0.0
0.5
1.0
1.5
2.0
2.5
3.0
3.5
4.0
0.2 0.3 0.4 0.5 0.6 0.7 0.8
Re
lia
bil
ity
In
de
x
D/(D+L)
NW -
Smooth
NW- Rough
NW - Mono
0.0
0.5
1.0
1.5
2.0
2.5
3.0
3.5
4.0
0.2 0.3 0.4 0.5 0.6 0.7 0.8
Re
lia
bil
ity
In
de
x
D/(D+L)
LW -
Smooth
LW - Rough
LW - Mono
123
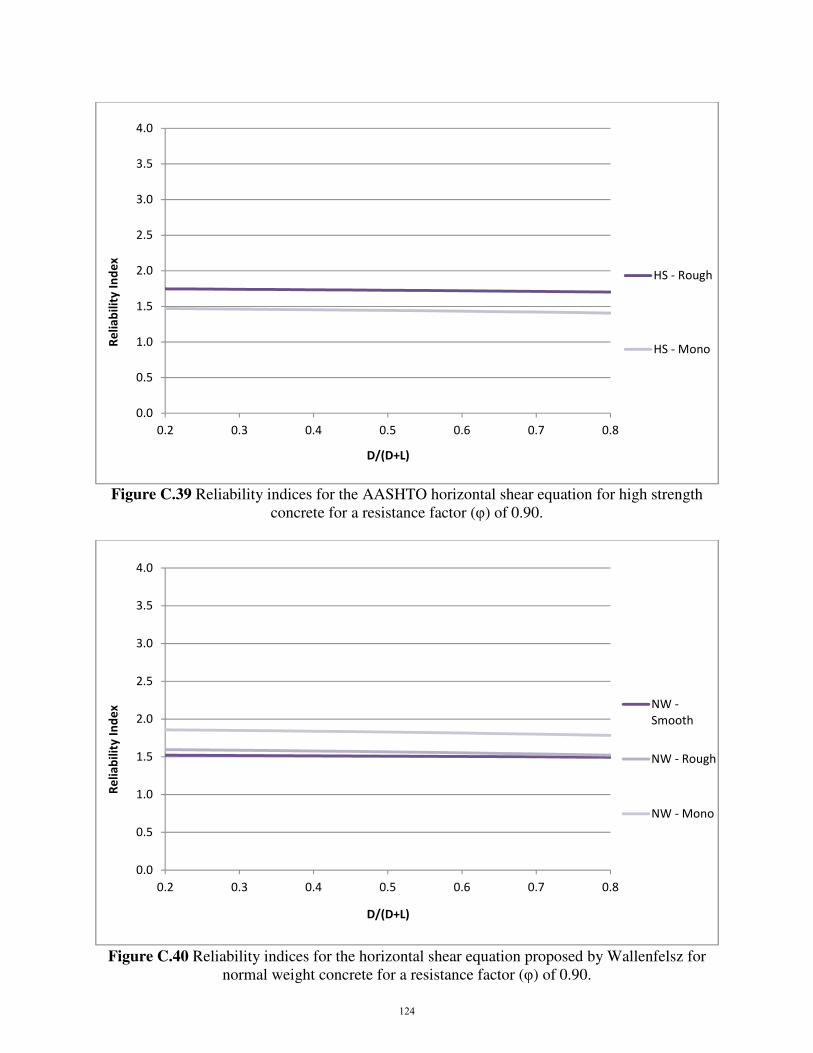
Figure C.39 Reliability indices for the AASHTO horizontal shear equation for high strength
concrete for a resistance factor (φ) of 0.90.
Figure C.40 Reliability indices for the horizontal shear equation proposed by Wallenfelsz for
normal weight concrete for a resistance factor (φ) of 0.90.
0.0
0.5
1.0
1.5
2.0
2.5
3.0
3.5
4.0
0.2 0.3 0.4 0.5 0.6 0.7 0.8
Re
lia
bil
ity
In
de
x
D/(D+L)
HS - Rough
HS - Mono
0.0
0.5
1.0
1.5
2.0
2.5
3.0
3.5
4.0
0.2 0.3 0.4 0.5 0.6 0.7 0.8
Re
lia
bil
ity
In
de
x
D/(D+L)
NW -
Smooth
NW - Rough
NW - Mono
124
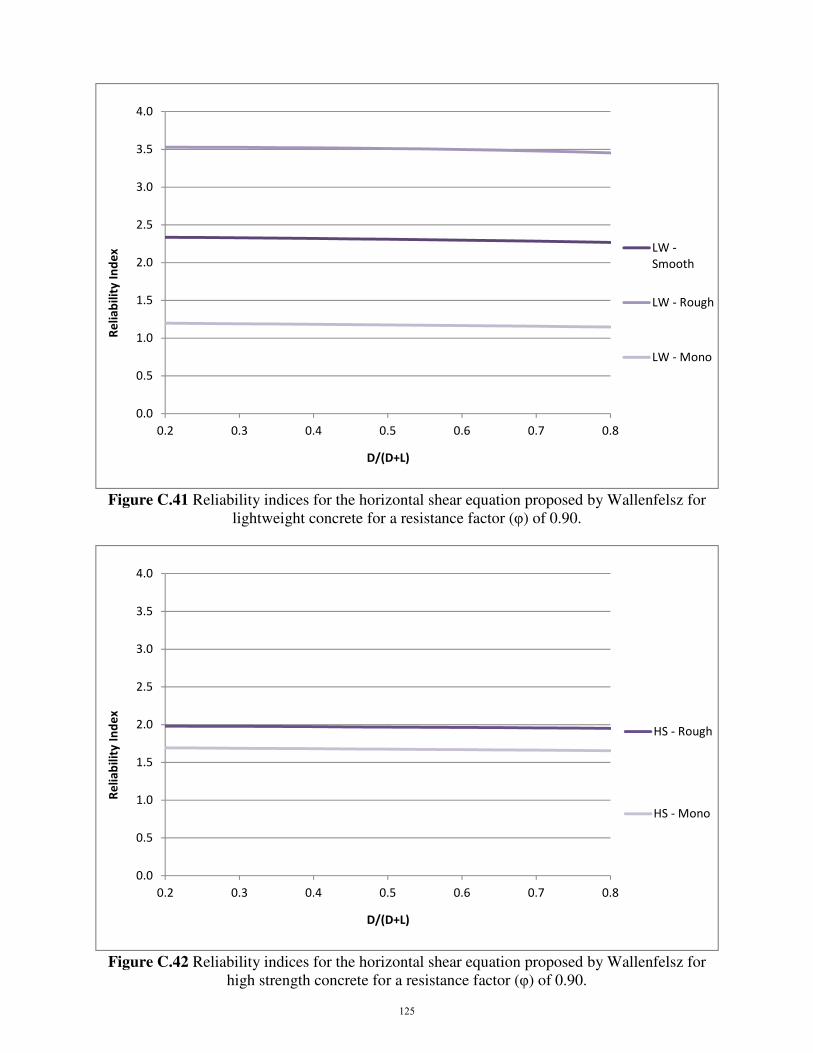
Figure C.41 Reliability indices for the horizontal shear equation proposed by Wallenfelsz for
lightweight concrete for a resistance factor (φ) of 0.90.
Figure C.42 Reliability indices for the horizontal shear equation proposed by Wallenfelsz for
high strength concrete for a resistance factor (φ) of 0.90.
0.0
0.5
1.0
1.5
2.0
2.5
3.0
3.5
4.0
0.2 0.3 0.4 0.5 0.6 0.7 0.8
Re
lia
bil
ity
In
de
x
D/(D+L)
LW -
Smooth
LW - Rough
LW - Mono
0.0
0.5
1.0
1.5
2.0
2.5
3.0
3.5
4.0
0.2 0.3 0.4 0.5 0.6 0.7 0.8
Re
lia
bil
ity
In
de
x
D/(D+L)
HS - Rough
HS - Mono
125

APPENDIX D
Actual Shear Stress vs. Concrete Strength
126

Appendix D
Appendix D presents a collection of charts that compare the actual shear stress to the concrete strength in order to determine if there is
a connection between the two.
Figure D.1 Actual shear stress versus concrete strength for normal weight concrete with a rough interface.
0
0.5
1
1.5
2
2.5
3
3.5
0 1 2 3 4 5 6 7 8
Act
ua
l S
he
ar
Str
ess
Vn
/Acv
(k
si)
f'c (ksi)
Loov & Patnaik (NW)
Scott (NW)
Hanson (NW)
Valluvan, Kreger & Jirsa (NW)
Bass, Carrasquillo & Jirsa (NW)
Kamel (NW)
127
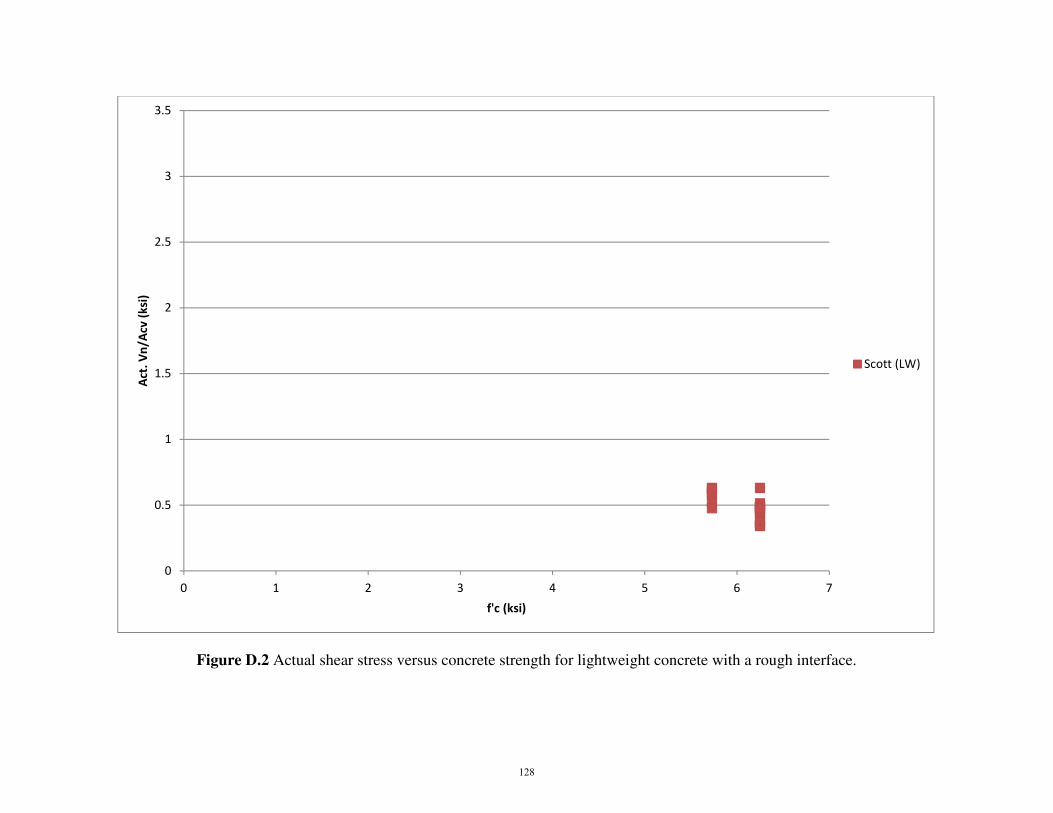
Figure D.2 Actual shear stress versus concrete strength for lightweight concrete with a rough interface.
0
0.5
1
1.5
2
2.5
3
3.5
0 1 2 3 4 5 6 7
Act
. V
n/A
cv (
ksi
)
f'c (ksi)
Scott (LW)
128
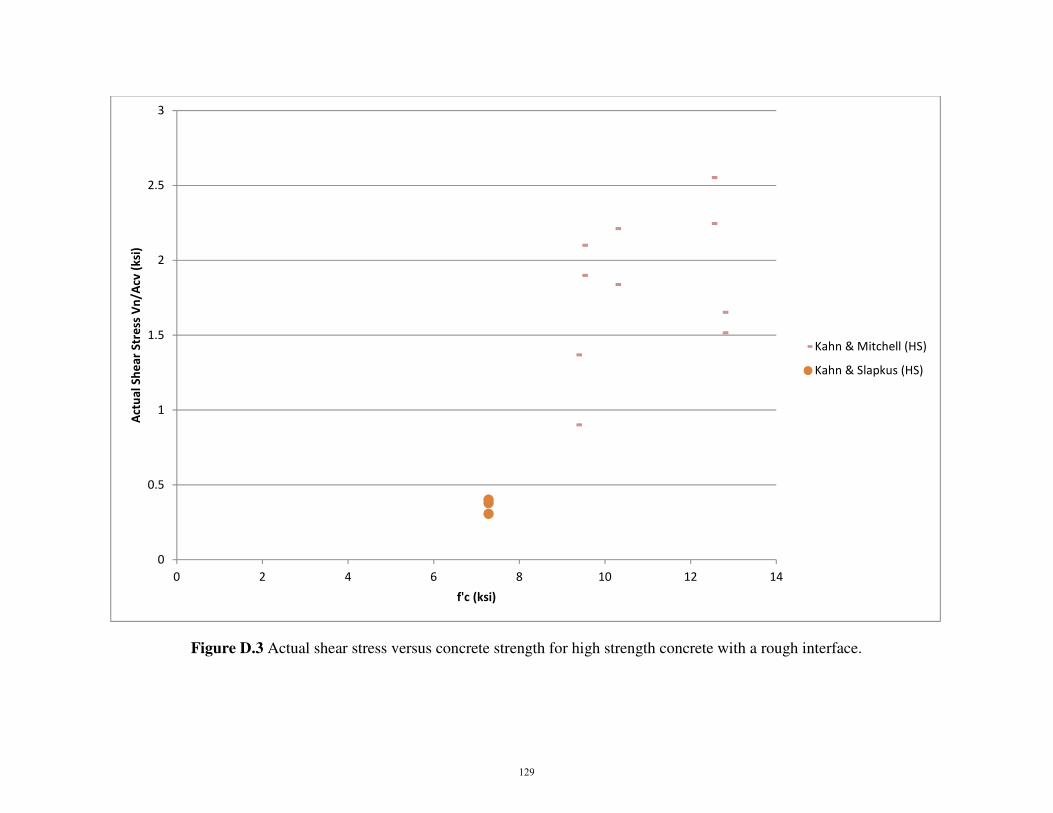
Figure D.3 Actual shear stress versus concrete strength for high strength concrete with a rough interface.
0
0.5
1
1.5
2
2.5
3
0 2 4 6 8 10 12 14
Act
ua
l S
he
ar
Str
ess
Vn
/Acv
(k
si)
f'c (ksi)
Kahn & Mitchell (HS)
Kahn & Slapkus (HS)
129
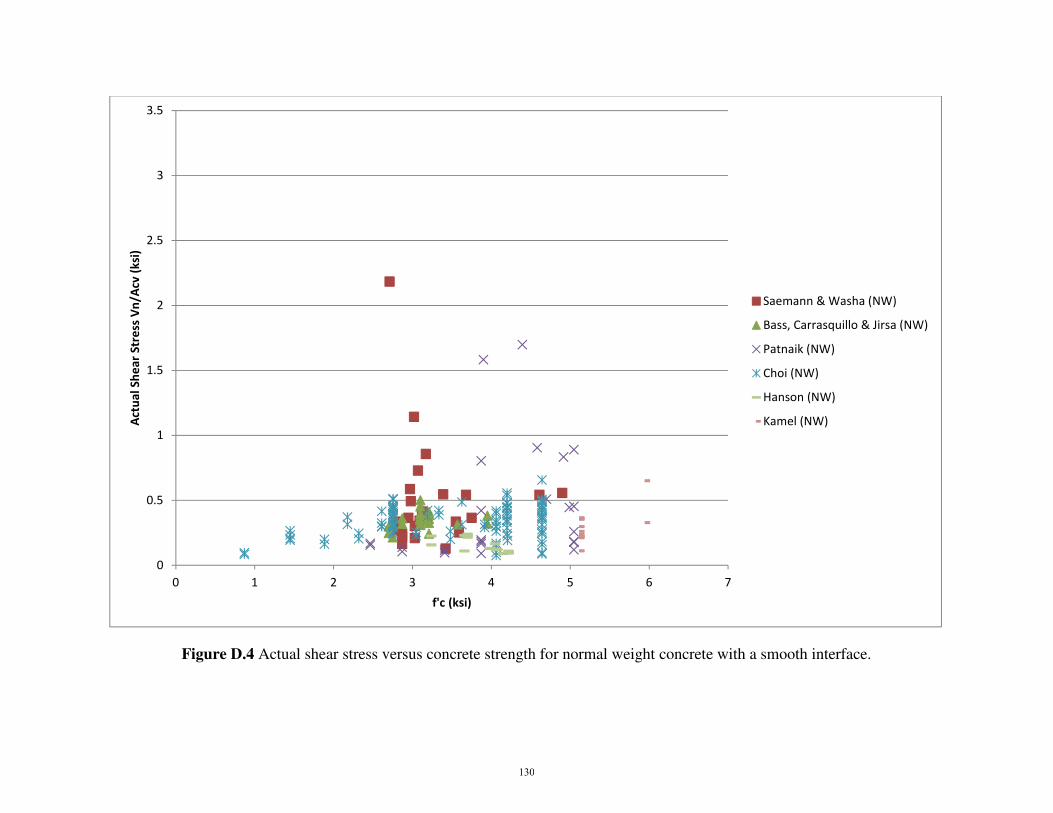
Figure D.4 Actual shear stress versus concrete strength for normal weight concrete with a smooth interface.
0
0.5
1
1.5
2
2.5
3
3.5
0 1 2 3 4 5 6 7
Act
ua
l S
he
ar
Str
ess
Vn
/Acv
(k
si)
f'c (ksi)
Saemann & Washa (NW)
Bass, Carrasquillo & Jirsa (NW)
Patnaik (NW)
Choi (NW)
Hanson (NW)
Kamel (NW)
130

Figure D.5 Actual shear stress versus concrete strength for lightweight concrete with a smooth interface.
0
0.5
1
1.5
2
2.5
3
3.5
0 1 2 3 4 5 6 7
Act
. V
n/A
cv (
ksi
)
f'c (ksi)
Banta (LW)
131
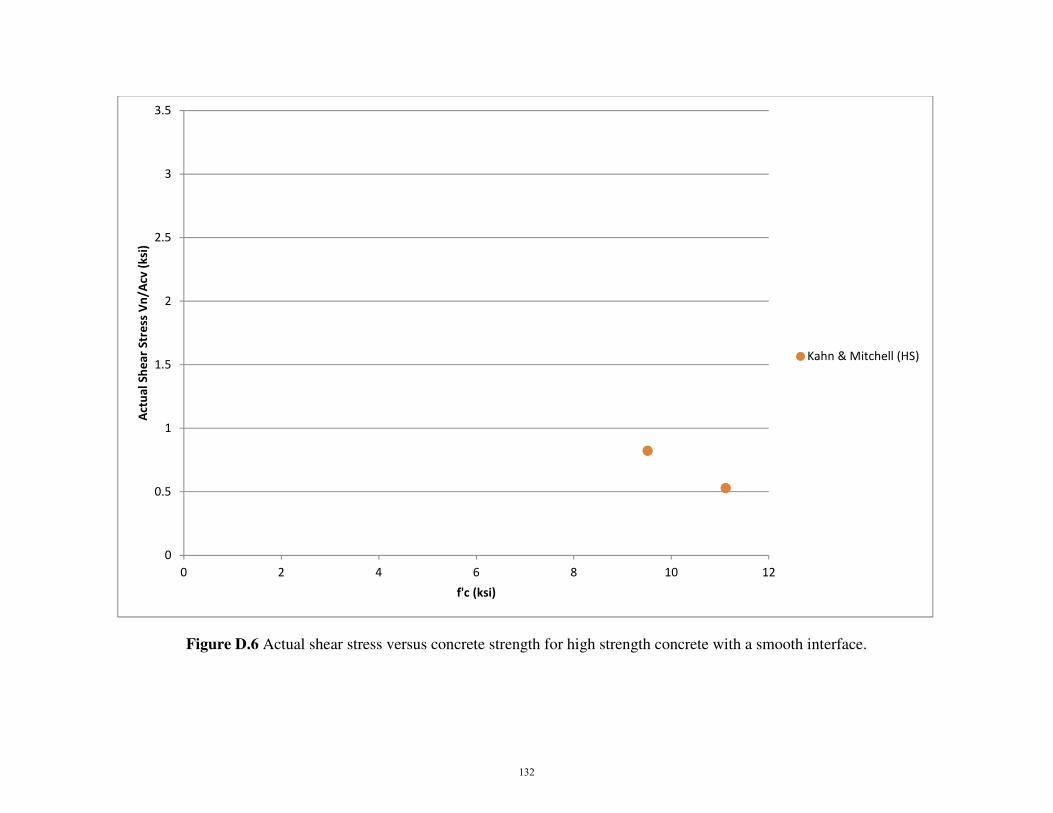
Figure D.6 Actual shear stress versus concrete strength for high strength concrete with a smooth interface.
0
0.5
1
1.5
2
2.5
3
3.5
0 2 4 6 8 10 12
Act
ua
l S
he
ar
Str
ess
Vn
/Acv
(k
si)
f'c (ksi)
Kahn & Mitchell (HS)
132
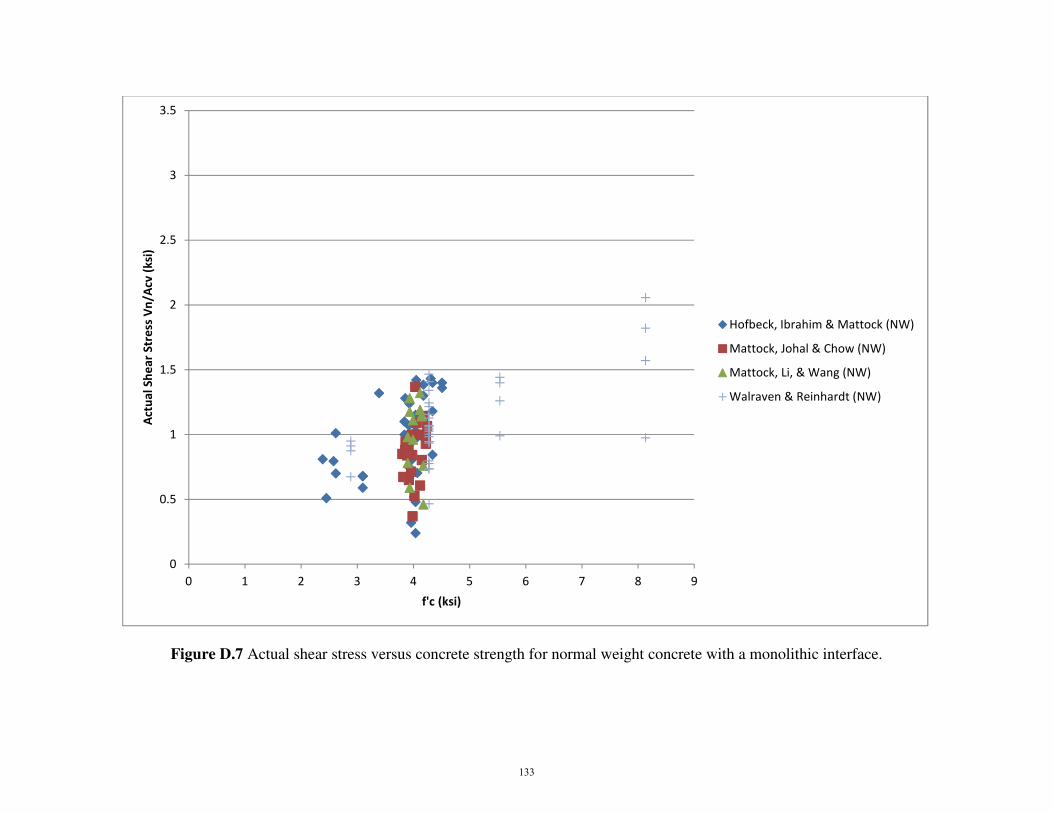
Figure D.7 Actual shear stress versus concrete strength for normal weight concrete with a monolithic interface.
0
0.5
1
1.5
2
2.5
3
3.5
0 1 2 3 4 5 6 7 8 9
Act
ua
l S
he
ar
Str
ess
Vn
/Acv
(k
si)
f'c (ksi)
Hofbeck, Ibrahim & Mattock (NW)
Mattock, Johal & Chow (NW)
Mattock, Li, & Wang (NW)
Walraven & Reinhardt (NW)
133
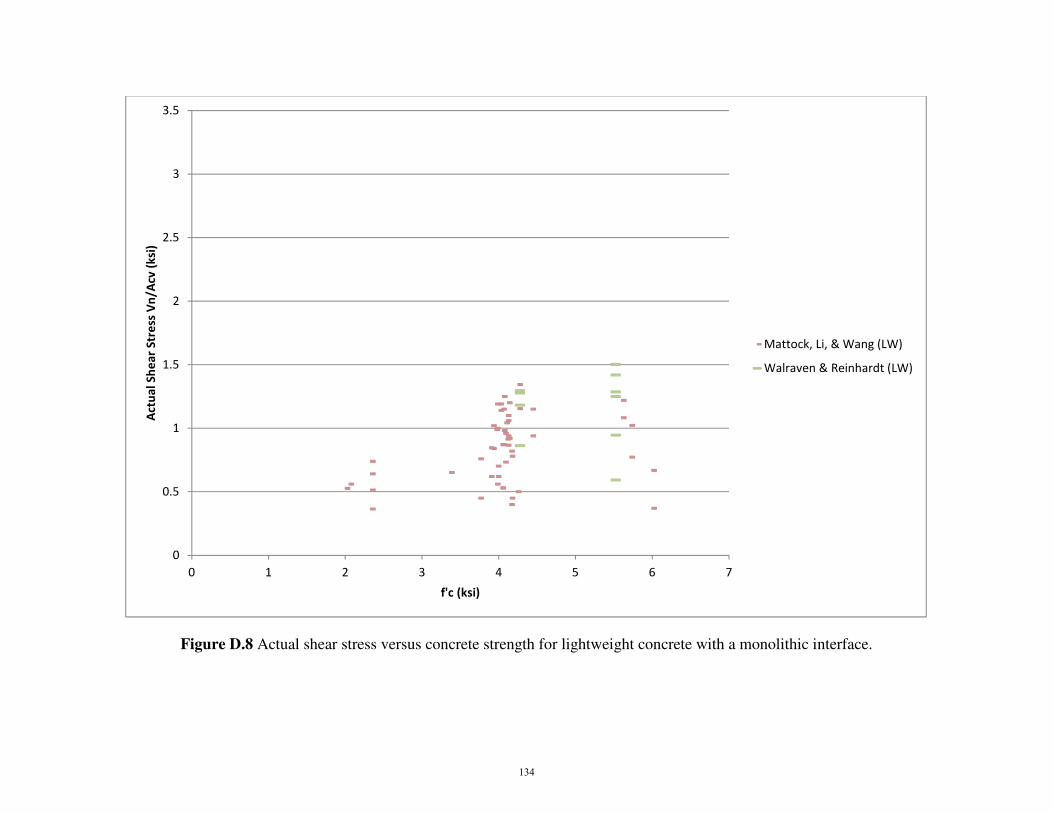
Figure D.8 Actual shear stress versus concrete strength for lightweight concrete with a monolithic interface.
0
0.5
1
1.5
2
2.5
3
3.5
0 1 2 3 4 5 6 7
Act
ua
l S
he
ar
Str
ess
Vn
/Acv
(k
si)
f'c (ksi)
Mattock, Li, & Wang (LW)
Walraven & Reinhardt (LW)
134
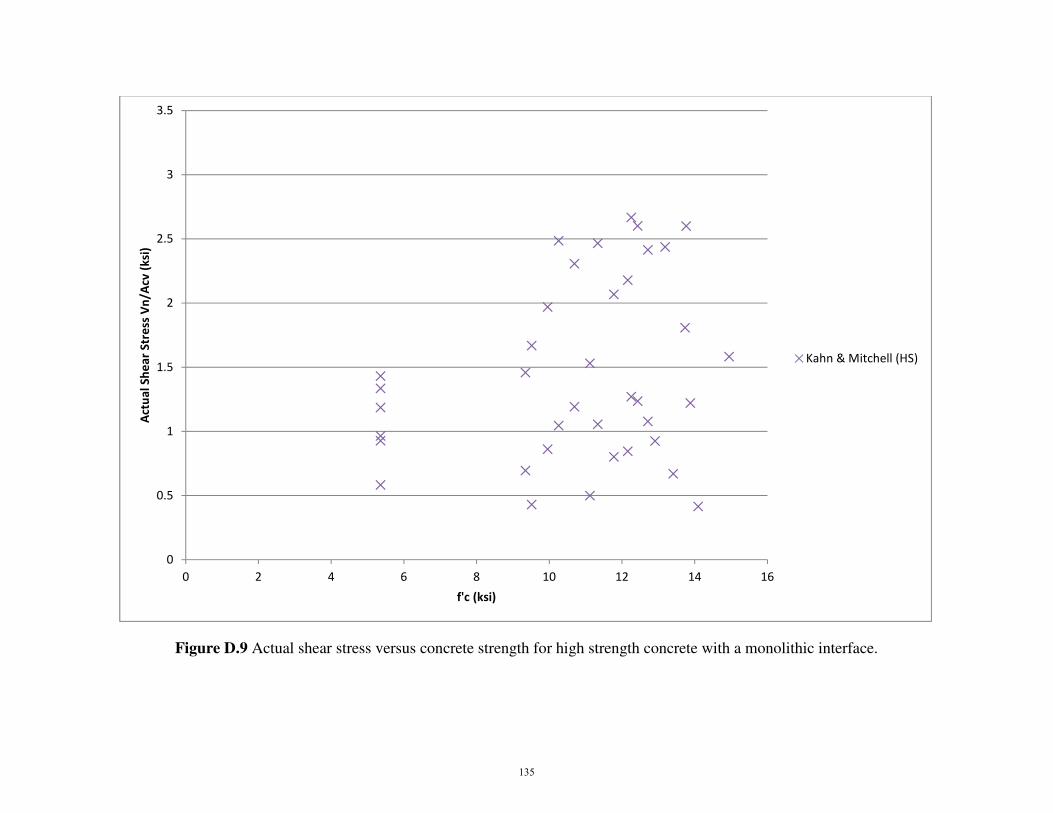
Figure D.9 Actual shear stress versus concrete strength for high strength concrete with a monolithic interface.
0
0.5
1
1.5
2
2.5
3
3.5
0 2 4 6 8 10 12 14 16
Act
ua
l S
he
ar
Str
ess
Vn
/Acv
(k
si)
f'c (ksi)
Kahn & Mitchell (HS)
135