analysis of the americorps nccc service project database
TRANSCRIPT
Analysis of the AmeriCorps NCCC Service Project Database: How NCCC Service Projects Strengthen Communities and Impact Members – Final Report Submitted: September 29, 2020 Submitted to: Melissa Gouge Corporation for National and Community Service 250 E St SW, Suite 300 Washington, DC 20024 Submitted by: JBS International, Inc. 155 Bovet Road, Suite 210 San Mateo, CA 94402
Analysis of the AmeriCorps NCCC Service Project Database:
How NCCC Service Projects Strengthen Communities and
Impact Members – Final Report
September 29, 2020
Authors
This report was prepared by JBS International, Inc. 5515 Security Lane, Suite 800, North
Bethesda, MD, 20852, pursuant to a contract with the Corporation for National and Community
Service (CNCS), a U.S. government agency.
Carmen Sum, M.B.A, Senior Research Associate
Robert Shannon, M.A., Research Associate
Claudia Birmingham, M.A., Research Associate
Thao Phan, B.A., Research Assistant
Wenson Fung, Ph.D., Research Associate
Annie Georges, Ph.D., Senior Research Associate
Donald J. Pratt, Ph.D., Research Associate
Acknowledgements
This study would not be possible with the participation of the CNCS and AmeriCorps NCCC staff
at headquarters and at the four regional NCCC campuses: Pacific, North Central, Southwest,
Southern.
Citation
Sum, C., Shannon, R., Birmingham, C., Phan, T., Fung, W., Georges, A., & Pratt, D., (2020).
Analysis of the AmeriCorps NCCC Service Project Database: How NCCC Service Projects
Strengthen Communities and Impact Members. North Bethesda, MD: JBS International, Inc.

i
Table of Contents Executive Summary ....................................................................................................................... vi
Key Findings ................................................................................................................................ vi
Recommendations ......................................................................................................................viii
Introduction ..................................................................................................................................... 1
Data ................................................................................................................................................. 2
Methods of Analysis ....................................................................................................................... 3
Findings........................................................................................................................................... 3
Types and Characteristics of NCCC Service Projects and Communities Served ......................... 3
Strengthening Communities and Impact on Members................................................................ 46
High-level Findings of FEMA Projects ........................................................................................ 94
Project Characteristics ................................................................................................................ 94
Strengthening Communities and Impact on Members.............................................................. 100
High-Level Findings of NCCC Campuses ................................................................................. 103
Project Characteristics .............................................................................................................. 104
Strengthening Communities and Impact on Members.............................................................. 110
Recommendations for Further Development of the Service Projects Database ......................... 112
Lessons Learned and Best Practices ........................................................................................... 113
Database .................................................................................................................................... 113
AmeriCorps NCCC Forms ........................................................................................................ 113
Conclusion .................................................................................................................................. 116
Appendix A: Methodology ......................................................................................................... 118
Appendix B: Supporting Tables and Descriptions ...................................................................... 121
Table of Tables Table 1: Number and Percent of Service Projects with Secondary Issue Areas, Fiscal Years 2012-
2019 Projects (N=3,358) ................................................................................................................. 5
Table 2: Service Projects Characteristics, Fiscal Years 2012-2019 (N=4,796) .............................. 6
Table 3: Total Number of Outputs Reported in Each Output Category* ..................................... 13
Table 4: Total Number of Outputs in Each Output Category by Issue Area ................................ 13
Table 5: Type of Organization of NCCC Sponsors by Fiscal Years 2012 – 2019* ..................... 16
Table 6: Sponsor Type by Fiscal Years 2012 - 2019 by Natural and Other Disasters (DIS)* ..... 17
Table 7: Sponsor Type by Fiscal Years 2012 - 2018 by Energy Conservation (EC) ................... 18
ii
Table 8: Types of Sponsors for Environmental Stewardship and Conservation (ENV) Service
Projects* ........................................................................................................................................ 19
Table 9: Types of Sponsors for Infrastructure Improvement (INF) Service Projects ................... 20
Table 10: Types of Sponsors for Urban and Rural Development (URD) Service Projects* ........ 21
Table 11: Number of Projects by Year (N=5,004) ....................................................................... 22
Table 12: Recurring and Non-Recurring Service Sites (2012-2019)............................................ 26
Table 13: Percent of Recurring and Non-recurring Service Sites by Project Characteristic, 2012-
2019*............................................................................................................................................. 27
Table 14: Distribution of Sponsor Types (2012-2019) ................................................................. 43
Table 15: Number of Service Projects by Sponsor Type and Year (2012-2019) ......................... 44
Table 16: Average Number of Service Projects per Sponsor by Year (All Sponsor Types) ........ 44
Table 17: Number of Sites by Sponsor Type and Year (2012-2019) ........................................... 45
Table 18: Average Number of Sites per Sponsor by Year (All Sponsor Types) .......................... 45
Table 19: Characteristics of Projects Associated with Disaster Response ................................... 63
Table 20: Characteristics of Projects associated with Disaster Recovery .................................... 64
Table 21: Subcategories for Disaster Preparedness, Prevention, and Mitigation ......................... 76
Table 22: Outputs under Disaster Knowledge and Preparedness ................................................. 76
Table 23: Outputs under Organizational Infrastructure ................................................................ 77
Table 24: Outputs under Organizational Effectiveness ................................................................ 78
Table 25: Outputs under Built and Natural Capital ...................................................................... 78
Table 26: Outputs under FEMA-Related Organizational Infrastructure ...................................... 79
Table 27: Outputs under Other ..................................................................................................... 79
Table 28: Disaster Response Outputs ........................................................................................... 81
Table 29: Disaster Recovery Outputs ........................................................................................... 82
Table 30: Disaster Response and Recovery Outputs by Sub-Category ........................................ 83
Table 31: Subcategories for Building Community and Organization Capacity ........................... 87
Table 32: Community Built and Natural Capital Outputs ............................................................ 88
Table 33: Human Capital and Learning Outputs .......................................................................... 89
Table 34: Outputs under Other ..................................................................................................... 92
Table 35: Number and Percent of FEMA Service Projects with Secondary Issue Areas, Fiscal
Years 2012-2019 Projects (N=1,568) ........................................................................................... 95
Table 36: Top Output Types Reported by FEMA Projects under Natural and Other Disaster (DIS)
Issue Area (100 or more counts) ................................................................................................... 97
Table 37: Number of FEMA Service Project Outputs by Output Category and Issue Area ........ 99
iii
Table of Figures Figure 1: Service Projects Primary Issue Areas, Fiscal Years 2012-2019 (N=5,004) .................... 4
Figure 2: Characteristics of Service Projects in the Natural and Other Disasters (DIS) Primary
Issue Area, Fiscal Years 2012-2019 (N=2,308)* ........................................................................... 7
Figure 3: Characteristics of Service Projects in the Energy Conservation (EC) Issue Area, Fiscal
Years 2012-2019 (N=55)* .............................................................................................................. 8
Figure 4: Characteristics of Service Projects in the Environmental Stewardship and Conservation
(ENV), Fiscal Years 2012-2019 (N=890)* ..................................................................................... 9
Figure 5: Characteristics of Service Projects in Infrastructure Improvement (INF) Issue Area,
Fiscal Years 2012-2019 (N=260)* ............................................................................................... 10
Figure 6: Characteristics of Service Projects in the Urban and Rural Development (URD) Issue
Area, Fiscal Years 2012-2019 (N=1,283)* ................................................................................... 11
Figure 7: Number of Service Projects that Reported Outputs, by Issue Area .............................. 12
Figure 8: Output Categories with Highest Count of Outputs ....................................................... 14
Figure 9: Top Output Types Reported by NCCC Service Projects (400 or more) ....................... 15
Figure 10: Percent of Projects in each Issue Area between 2012-2019 (N=5,004) ...................... 23
Figure 11: Percent of Projects with each Characteristic (N=4,796), 2012-2019 .......................... 24
Figure 12: Percent of Recurring and Non-Recurring Service Sites by Year (2012-2019) ........... 26
Figure 13: States where Service Projects Included “Basic Needs“ Outputs (2012-2019) ............ 32
Figure 14: States where Service Projects Included “Community Well-being” Outputs (2012-2019)
....................................................................................................................................................... 33
Figure 15: States where Service Projects Included “Disaster Prevention, Preparedness, and
Mitigation” Outputs (2012-2019) ................................................................................................. 34
Figure 16: States where Service Projects Included “Disaster Recovery” Outputs (2012-2019) .. 35
Figure 17: States where Service Projects Included “Disaster Response” Outputs (2012-2019) .. 36
Figure 18: States where Service Projects Included “Energy and Environmental Practices” Outputs
(2012-2019)................................................................................................................................... 37
Figure 19: States where Service Projects Included “Housing” Outputs (2012-2019) .................. 38
Figure 20: States where Service Projects Included “Natural Resources” Outputs (2012-2019) .. 39
Figure 21: States where Service Projects Included “Public Space and Infrastructure” Outputs
(2012-2019)................................................................................................................................... 40
Figure 22: States where Service Projects Included “Special Populations” Outputs (2012-2019) 41
Figure 23: States where Service Projects Included Outputs that were “Not Categorized” (2012-
2019) ............................................................................................................................................. 42
Figure 24: Characteristics of Projects associated with Community Impact Projects ................... 47
Figure 25: Characteristics of Projects associated with Tangible Benefits to Individuals ............. 50
Figure 26: Characteristics of Projects associated with Intangible Benefits to Individuals ........... 52

iv
Figure 27: Characteristics of Projects associated with Benefits to Specific Populations ............. 54
Figure 28: Characteristics of Projects Associated with Tangible Benefits to Organizations ....... 57
Figure 29: Characteristics of Projects associated with Intangible Benefits to Organizations ...... 59
Figure 30: Characteristics of Projects associated with Disaster Prevention, Preparedness, and
Mitigation ...................................................................................................................................... 61
Figure 31: Community Level Impacts of NCCC Projects ............................................................ 71
Figure 32: Individual Level Impacts of NCCC Projects ............................................................... 72
Figure 33: Organizational Level Impacts of NCCC Projects ....................................................... 73
Figure 34: Life Skills Gained by Members................................................................................... 75
Figure 35: Professional Skills Gained by Members ..................................................................... 75
Figure 36: Characteristics FEMA Service Projects, Fiscal Years 2012-2019 (N=1,568) ............ 96
Figure 37: Top Types Reported by FEMA Projects under FEMA (FMA) Issue Area (40 or more
counts) ........................................................................................................................................... 98
Figure 38: Community Level Impacts of FEMA Projects .......................................................... 100
Figure 39: Individual Level Impacts of FEMA Projects ............................................................ 101
Figure 40: Organizational Level Impacts of FEMA Projects ..................................................... 102
Figure 41: Life Skills Gained by Members................................................................................. 102
Figure 42: Professional Skills Gained by Members ................................................................... 103
Figure 43: Distribution of Service Projects by Issue Area by Region ........................................ 104
Figure 44: Output Categories of Service Project Accomplishments, Atlantic Campus ............. 106
Figure 45: Output Categories of Service Project Accomplishments at North Central Campus . 107
Figure 46: Output Categories of Service Project Accomplishments at Pacific Campus ............ 107
Figure 47: Output Categories of Service Project Accomplishments at Southern Campus ......... 108
Figure 48: Output Categories of Service Project Accomplishments at Southwest Campus....... 109
Figure 49: FEMA Projects in Regions from Fiscal Year 2012- Spring 2019 ............................. 110

v
Glossary
Issue Area: This is the general category for the focus of the NCCC
service project. • Primary Issue Area: This is the single main area addressed by the project from one of the
following options: Energy Conservation (EC), Environmental Stewardship and
Conservation (ENV), Infrastructure Improvement (INF), Natural and Other Disasters
(DIS), Urban and Rural Development (URD). All projects have a primary issue area.
• Secondary Issue Area: This is the secondary area(s) addressed by the project. Options
include all of the primary issue areas plus two more: FEMA (FMA) and Populations
Assisted and Engaged (VAR). Not all projects have secondary issue areas.
Project characteristic: These are categories that describe the general aims of the project, and
they are related to the outputs/accomplishments. For example, project characteristics may be:
disaster assistance, where NCCC Members assist disaster survivors registering for FEMA
assistance; housing, where Members serve at Habitat for Humanity build sites; education support,
where Members tutor youth; or at-risk ecosystems, where Members clear sites of invasive species.
Projects may have more than one characteristic.
Output: Outputs, or accomplishments, are results of activities completed by NCCC Members,
and they are measurable (countable). For example, outputs could be the number of people served,
number of volunteers recruited, number of acres landscaped, number of houses built, etc. Projects
may have more than one output.
Outcome: Outcomes address community needs, and they are the result of the project’s activities
and outputs/accomplishments. Examples of outcomes include improved access to economic
opportunities or housing, improved food security, and increased knowledge of sustainable energy
practices. Projects may have more than one outcome.
• The primary intended outcome is the main intended benefit resulting from the NCCC
activities.
• Outcome groupings (also called ‘output categories’), are broader categories of similar
intended outcomes, such as “Basic Needs”, “Disaster Recovery”, and “Natural
Resources.” These intended outcomes are a result of the project’s
outputs/accomplishments. For example, the output “pounds of exotic vegetation removed”
is expected to result in the intended outcome “parks, natural habitats, and at-risk
ecosystems preserved or protected,” and the output “new trees planted” is expected to
result in the intended outcome of “parks, natural habitats, and at-risk ecosystems
enhanced.” Both outcomes are similar and fall under the outcome grouping of “Natural
Resources.”
Community Impact: These are the benefits to the community because of the service project.
Impacts may affect the overall community, individuals within the community, or organizations
such as nonprofits that host service projects. For example, at the community level, a service
project may increase a community’s built and natural capital by improving access to public spaces
vi
like trails and parks. At the individual level, the project may provide immediate relief to disaster
survivors or access to affordable housing for low income families. At the organizational level, a
project may improve efficiency by organizing donations, supplies, or data.
Member Impact: These are the benefits to the Members providing the service, such as new
experience and skills. Members may gain professional skills, including both technical (sometimes
referred to as hard) skills in areas like construction or land management or managerial (sometimes
referred to as soft) skills in leadership and teamwork. Members may also show personal growth,
such as resilience or increased awareness of people different from themselves, or they may
solidify career goals.
vi
Executive Summary The Corporation for National and Community Service (CNCS) is a federal agency engaging
more than 5 million Americans in service through its core programs. One of those programs is
AmeriCorps National Civilian Community Corps (NCCC), which engages people ages 18-24 in
a ten-month, full-time term of team-based, residential national service. CNCS is building
evidence for national service across its programs, highlighting the benefits of volunteering and
demonstrating how its programs improve individuals’ lives and strengthen communities. CNCS
contracted JBS International to support NCCC’s efforts assessing its impact on Member
development and strengthening communities. JBS first constructed a prototype AmeriCorps
NCCC Service Projects Database (SPD) containing sample project information and was
subsequently awarded a second contract to populate the database with qualitative and
quantitative project information on the NCCC service projects from FY 2012 to Spring 2019
across all campuses and analyze that data.
The database contains information on 5,004 NCCC service projects completed between 2012 and
Spring of 2019 from the four regional campuses plus 120 service projects randomly selected
from the Atlantic campus. It includes information on things like project issue area,
characteristics, sponsor organization information, and goals and accomplishments.
The two primary purposes of the database are to capture key data about NCCC service projects
in one location, where data can be analyzed both across and within projects, and to support the
selection of case studies for a NCCC study. The information collected will be used to help
AmeriCorps NCCC understand the relationship between service projects, outputs, and short- and
long-term outcomes; to analyze the impact of service projects on communities served and Corps
Members; and to inform a research effort to develop a NCCC-specific definition of
‘strengthening communities’ and Member development. In the longer term, integrating
systematic data collection into daily operations and recording data in a central database can
improve immediate monitoring, assist in identifying strategic goals and benchmarks, and has the
potential for use in future evaluations.
This report describes the results of JBS’s final analysis of the service project data for the NCCC
program. Several research questions framed the final analysis. These questions fall into two
categories. The first set of research questions focused on describing the type and characteristics
of service projects. These questions looked at primary and secondary issue areas, project
accomplishments, what recurring service projects look like in terms of issue areas, project
characteristics, the community needs addressed by service projects, and how frequently NCCC
served the same community with the same needs. The second set of research questions focused
on what could be learned about how NCCC service projects strengthen communities and affect
Members. These questions were based on what Members’ reported on the PCR narratives
Key Findings
Characteristics of NCCC Service Projects and Communities Served Analysis of the SPD reveals the following top-level results regarding the characteristics of
NCCC service projects and the communities they serve.
vii
• The top three issue areas are: Natural and Other Disasters, which made up 50% of
AmeriCorps NCCC service projects, Urban and Rural Development service projects, with
26% of projects, and Environmental Stewardship and Conservation service projects,
which accounted for 18%.
• Service projects typically had multiple project characteristics, which describe the general
purpose of the project and are related to accomplishments Service project characteristics
most often reported were community support (41%), at-risk ecosystems (34%),
infrastructure improvement (34%), and capacity building and leverage (34%).
• Community support and at-risk ecosystems were recurring characteristics across the five
primary issue areas. Infrastructure improvement is also a recurring characteristic across
all the primary issue areas, but only 5% of service projects reported Infrastructure
Improvement as their primary issue area. Lastly, Capacity building and leverage
characteristics were noted in four of the five primary issue areas, but this characteristic is
most frequently reported under service projects in the natural and other disasters primary
issue area.
• The greatest number of accomplishments or outputs were reported in the Natural and
Other Disasters primary issue area with 9,250 outputs, and these accomplishments were
reported under the disaster recovery, disaster prevention preparedness and mitigation, and
disaster response categories. Service projects in the Environmental Stewardship, and
Urban and Rural Development primary issue areas had the second greatest number of
reported accomplishments or outputs, with more than 6,000. In these two primary issue
areas, the categories with high numbers of reported accomplishments include natural
resources and community well-being.
• Between 2012 and 2019, 1,439 unique sponsors were associated with the 5,004 service
projects. The Federal Government, national non-profits, and other non-profits sponsored
most service projects between 2012 and 2018. The Federal Government most frequently
sponsored service projects in the Natural and Other Disaster issue area.
Strengthening Communities and Impact on Members Analysis of the SPD reveals the following top-level results of how service projects strengthen
communities and the impacts on Corps Members.
• Service projects supported communities by providing direct impacts including tangible
and intangible benefits to both individuals and organizations, enhancing disaster
prevention, preparedness, and mitigation, and assisting communities with disaster
recovery.
o The most common community-level impacts of NCCC service projects were on
the built and natural capital of communities through work on improving
accessibility to public structures; building trails, gardens and farms; and
supporting youth camps.
o The most common individual-level impacts are on helping people meet basic
needs such as accessing food and shelter, receiving disaster assistance, and
developing human capital and learning through teaching volunteers or tutoring
youth.

viii
o The most common organization-level impacts noted were in infrastructure
support, which included enhancing an organization’s data infrastructure or
physical infrastructure. Infrastructure support also included Members organizing
and conducting inventory of an organization’s supplies or donations.
• About half of all service projects during the eight-year period involved disaster services.
o Projects that focused on disaster prevention, preparedness, and mitigation most
commonly reported enhancing disaster knowledge and preparedness by
assembling and distributing informational materials and by providing information
to individuals.’
o Disaster response projects most commonly reported impacts associated with
organizational effectiveness, such as supporting disaster service facilities or
volunteer facilities in disaster areas.
o Disaster recovery projects most commonly reported impacts associated with
organizational infrastructure, for example developing resource guides or reports
or completing damage or needs assessments
• Specific populations assisted by projects include military veterans, individuals in crisis
(such as disaster survivors or the homeless), immigrants and refugees, disabled persons,
the elderly, at-risk youth, and Members of Native American communities. Many projects
supported more than one vulnerable population.
• Impacts of projects on Corps Members included enhancing personal and life skills,
building professional skills, growing interpersonal skills, and fostering an understanding
of civic engagement. The most commonly reported impacts on Members were enhancing
construction and environmental management skills, increasing communication skills,
building leadership skills, and fostering personal growth in areas like adaptability and
confidence.
Recommendations The following recommendations emerged from analysis of the SPD data.
• To facilitate analysis of service projects over time and by geographic location,
AmeriCorps NCCC should ensure consistency in how service sites are identified in
service project documents. One way to do this is to assign a unique identifier to each
service site and their sponsor organization.
• To fully capture information on disaster-related service projects, AmeriCorps NCCC
could redesign primary documentation (Service Project Request Form and Project
Application) to accommodate selection of multiple disaster types with an option to
identify the primary disaster type.
• To increase functionality and utility for end users, AmeriCorps NCCC could add the
ability to generate summary reports to the service project database.
• To increase the value of the SPD for NCCC campuses, AmeriCorps NCCC could test the
database with campus staff to obtain feedback on their potential uses of the database.

ix
The following recommendations emerged during the development of the SPD.
• To minimize loss of data during the data entry process, AmeriCorps NCCC could back
up the SPD daily and run the Access database compression routine weekly. Users could
apply “Save Record” when completing database entries on the Project Narratives form to
prevent loss of data.
• To capture complete Member and community impacts consistently and accurately,
AmeriCorps NCCC could provide written guidance on the Community and Member
Impact statements with explicit guidance to not merely list accomplishments (outputs).
• To support Team Leaders capturing their project’s community benefits on the Project
Completion Report (PCR), NCCC could provide written guidance on how to identify
such impacts (and whether they are immediate/visible or speculative/longer-term). This
could take the form of a short list of Community and Member Impact codes or guiding
questions.
• To clarify possible links between multiple service projects (whether undertaken for one
or multiple sponsors), NCCC could add to the database and corresponding Service
Project Request Form and Project Application unique ID numbers for organizations,
secondary sponsors, and sites.
• To obtain detailed and complete information on service project goals, AmeriCorps NCCC
could expand the size of First Goal, Second Goal, and Third Goal fields on the Project
Application form and provide written guidance on how to complete these fields.
• To ensure consistent reporting regarding populations served, NCCC could add a checklist
of specific populations for service projects on the PCR. These populations might include
military veterans; people in crisis (e.g., disaster survivors and homeless individuals);
immigrants or refugees; disabled persons; Native Americans; and the elderly.
Moving forward, integrating systematic data collection into daily operations and recording data
in a central database can improve immediate monitoring and oversight and assist in identifying
longer term strategic goals and benchmarks. In addition, a central database with consistently
defined, systematically collected, high quality data about NCCC service projects, outputs and
outcomes will prove useful in future evaluations.
1
Introduction The mission of AmeriCorps National Civilian Community Corps (NCCC) is to strengthen
communities and develop leaders though direct, team-based service. NCCC Members are 18 to
26 years old and represent a wide variety of socioeconomic, cultural, geographic, and
educational backgrounds. NCCC Members are assigned to one of four regional campuses then
placed into teams ranging between 8 and 12 Members. Teams complete a variety of service
projects, which are generally 3 to 13 weeks in duration, and respond to local community needs
throughout the United States and territories. Teams live in the communities they serve to help
better understand the community, participate in more enhanced service-learning opportunities,
and build leadership and life skills through service.1
The Corporation for National and Community Service (CNCS) contracted JBS International to
support NCCC’s efforts assessing its impact on Member development and strengthening
communities. JBS first constructed a prototype AmeriCorps NCCC Service Projects Database
(SPD) containing sample project information and was subsequently awarded a second contract to
populate the database with qualitative and quantitative project information on NCCC service
projects from FY 2012 to spring 2019 across all campuses and to analyze that data. The two
primary purposes of the database are to capture key data about NCCC service projects in one
location, where data can be analyzed both across and within projects, and to support the selection
of the case studies for an AmeriCorps NCCC study. In the longer term, integrating systematic
data collection into daily operations and recording data in a central database can improve
immediate monitoring and oversight and assist in identifying strategic goals and benchmarks. In
addition, a central database with consistently defined, systematically collected, high-quality data
about AmeriCorps NCCC service projects, outputs and outcomes, will be useful in future
evaluations.
AmeriCorps NCCC completed more than 5,000 service projects through the deployment of
46,989 Corps Members and Team Leaders to all 50 U.S. states and Washington, DC, as well as
three U.S. territories (Puerto Rico, the U.S. Virgin Islands, and the Northern Mariana Islands). A
research team at JBS International coded then analyzed the data on these service projects to
assess the extent to which it can be used to map the types and characteristics of service projects
and evaluate the impact of service projects on communities and Corps Members. In the longer
term, integrating systematic data collection into daily operations and recording data in a central
database can improve immediate monitoring and oversight and assist in identifying strategic
goals and benchmarks. In addition, a central database with consistently defined, systematically
collected, high quality data about AmeriCorps NCCC service projects, outputs and outcomes,
has the potential for use in future evaluations.
The first set of analysis, focusing on the types and characteristics of service projects, is guided by
these research questions:
• Research Question 1: What are the characteristics of NCCC service projects by
issue/focus areas?
1For more information, see: https://www.nationalservice.gov/programs/americorps/americorps-
programs/americorps-nccc/sponsor-americorps-nccc-team.
2
• Research Question 2: What are NCCC’s service project accomplishments to communities
by issue/focus areas?
• Research Question 3: How has the type of sponsor changed over time?
• Research Question 4: How have the characteristics of NCCC service projects changed
over time?
• Research Question 5: What are the characteristics of recurring service projects? What
community needs have service projects addressed over time by issue/focus areas?
• Research Question 6: How frequently does NCCC serve the same community with the
same needs?
• Research Question 7: How many individual service projects are nested within unique
sponsors? What is the number of sites and the average number of sites for each sponsor
type?2
The second set of analysis focus on what can be discerned about impact on communities and
Members based on Members’ report of the service projects’ accomplishments. The following
research questions guided these analyses.
• Research Question 8: What does the data show on how NCCC projects impact and
strengthen communities? What does the data show on how NCCC projects impact
Members? Do these impacts vary and, if so, how?
• Research Question 9: What are the main themes associated with strengthening
communities and Member impact?
• Research Question 10: What are NCCC’s service project contributions to communities’
disaster preparation and mitigation?
• Research Question 11: What are NCCC’s service project contributions to support
recovery and response in communities that experienced disaster?
• Research Question 12: What are NCCC’s service project contributions in building
community and organization capacity?
Data The NCCC Service Projects Database (SPD) is a rich source of both qualitative and quantitative
data on completed service projects from FY 2012 through Spring 2019. AmeriCorps NCCC
provided the research team with electronic versions of these data sourced from completed
Service Project Applications (referred to as Project Application throughout), Service Project
Request (SPR) forms, and Project Completion Reports (PCR). The data included NCCC-
assigned issue areas, project accomplishments, project characteristics, disaster type (when
applicable), type of sponsor, and sponsor and site locations. The measures for project
characteristics describe the general goals of the project and are related to the project
2 Research Question 7 as originally stated “How are individual service projects nested within multiple separable
sponsor initiatives? How often are multiple service projects linked both within sponsors and among multiple co-
sponsors” could not be answered. CNCS data does not include unique IDs for sites or co-sponsors. Thus, the
question was revised to look at data on unique sponsors and sponsor types, and sites under sponsor type.

3
accomplishments. For example, project characteristics include: disaster assistance, where NCCC
Members assist disaster survivors in registering for Federal Emergency Management Agency
(FEMA) assistance; housing, where Members serve at Habitat for Humanity build sites;
education support, where Members tutor youth; and at-risk ecosystems, where Members clear
sites of invasive species. Projects may have more than one characteristic. The SPD also captured
narrative text as reported by NCCC teams that worked on these service projects. The narrative
texts reflect the teams’ perceptions of the service projects on the communities served and what
the Members stated they gained by working with their teams.
Methods of Analysis We used quantitative and qualitative analytic approaches to answer the research questions. We
use frequency, mean, and percent to examine the types and characteristics of service projects.
Our examination of the second set of research questions on the impact of the service projects on
the communities served and Members, used both qualitative and quantitative methods. Appendix
A describes the thematic coding of the narrative texts.
Findings Types and Characteristics of NCCC Service Projects and Communities Served This section describes service projects’ primary and secondary issue areas, their NCCC-assigned
project characteristics (e.g., community support, at-risk ecosystems, infrastructure improvement,
and capacity building and leverage, etc.) and project accomplishments. AmeriCorps NCCC
defines project accomplishments as outputs completed for a service project. We examined
whether the different project characteristics and types of sponsoring organizations changed over
time. Since there are multiple years of data available, we also examined whether the needs
addressed by service projects address recur. Last, we looked at the number of sponsor service
sites that typically engage in NCCC projects.
Research Question 1: What are the characteristics of NCCC service projects by issue area?
For the first research question, the characteristics of service projects are examined by primary
issue areas, secondary issue areas, and types of outputs completed for the service projects taken
from NCCC’s accomplishments data.
Issue Areas NCCC has five categories of issue areas: Energy Conservation (EC), Environmental Stewardship
and Conservation (ENV), Infrastructure Improvement (INF), Natural and Other Disasters (DIS),
and Urban and Rural Development (URD). Each service project is categorized in one primary
issue area.
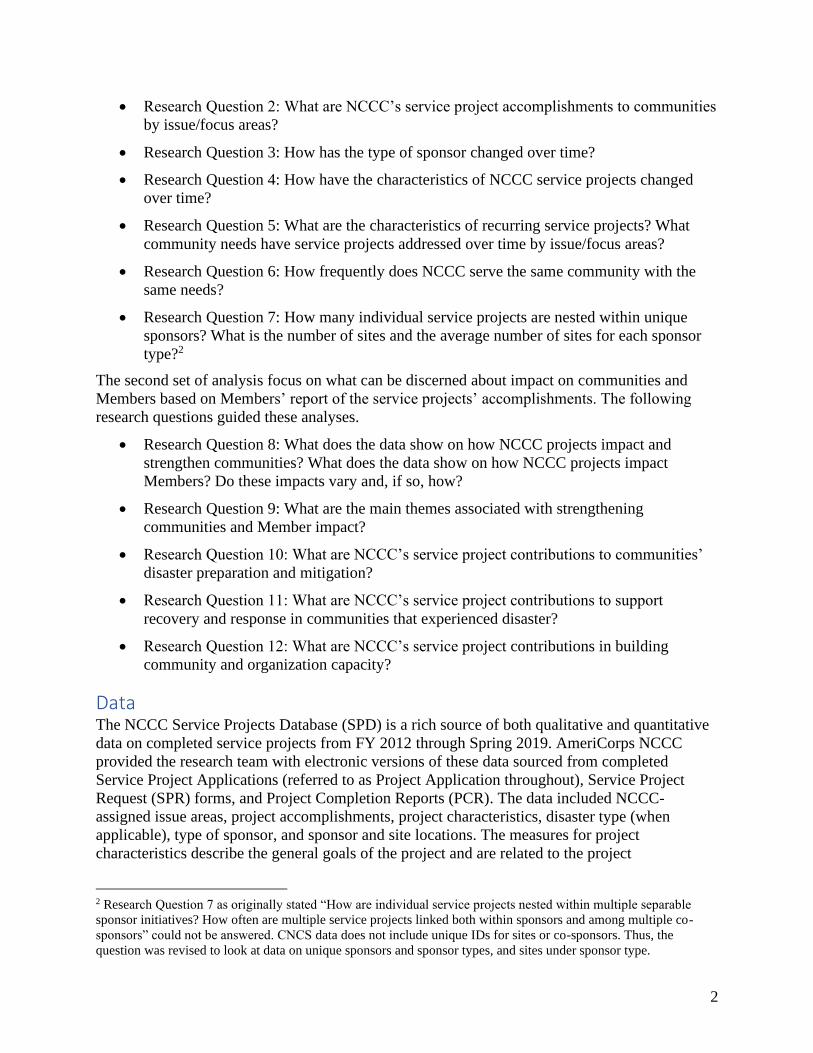
Figure 1 shows half of service projects are in the Natural and Other Disasters and about one-
quarter are in the Urban and Rural Development service projects issue area. One percent of
service projects are in the Energy Conservation primary issue area.
4
Figure 1: Service Projects Primary Issue Areas, Fiscal Years 2012-2019 (N=5,004)
Secondary issue areas include ten categories: the five primary issue areas and the following five
additional categories – FEMA (FMA), Populations Assisted and Engaged (VAR), Education
Support (EDU), Unmet Human Needs (HUM), and Public Safety (PS).3 About two-thirds (67%,
3,358) of service projects have a secondary issue area. Of the 3,358 projects with a secondary
issue area, 1,578 (47%) have one secondary issue area while 1,780 (53%) selected more than
one, resulting in multiple combinations. Table 1 shows the distribution across the secondary
issue area categories. For parsimony, the table shows only the combinations of secondary issue
areas with at least 100 service projects. The FEMA category was the most frequent secondary
issue area with 522 service projects (16%), followed by Populations Assisted and Engaged with
411 service projects (12%).
3 NCCC has since phased out three secondary issue areas— Education Support (EDU), selected by 120 projects;
Unmet Human Needs (HUM), selected by 29 projects; and Public Safety (PS), selected by 16 projects.

5
Table 1: Number and Percent of Service Projects with Secondary Issue Areas, Fiscal Years
2012-2019 Projects (N=3,358) Secondary Issue Area Number of Projects Percent
FEMA (FMA) only 522 16%
Populations Assisted and Engaged (VAR) only 411 12%
Infrastructure Improvement (INF) only 289 9%
Environmental Stewardship and Conservation (ENV) and
Infrastructure Improvement (INF)
224 7%
Infrastructure Improvement (INF) and Urban and Rural
Development (URD)
206 6%
Urban and Rural Development (URD) only 171 5%
Populations Assisted and Engaged (VAR) and Urban and
Rural Development (URD)
139 4%
Environmental Stewardship and Conservation (ENV),
Infrastructure Improvement (INF), and Populations Assisted
and Engaged (VAR)
136 4%
Environmental Stewardship and Conservation (ENV) only 134 4%
Infrastructure Improvement (INF) and Populations Assisted
and Engaged (VAR)
134 4%
Environmental Stewardship and Conservation (ENV) and
Urban and Rural Development (URD)
107 3%
Infrastructure Improvement (INF), Populations Assisted and
Engaged (VAR), and Urban and Rural Development (URD)
105 3%
All remaining combinations of secondary issue areas (less
than 100 projects each)
780 23%
Project Characteristics NCCC records 16 characteristics about their service projects. Characteristics are based on the
service project’s outputs/accomplishments, and a service project may have more than one
characteristic. Of the 5,004 completed service projects, 4,796 had one or more characteristics. As
shown in Table 2, the most frequent characteristics were community support (41%), at-risk
ecosystems (34%), infrastructure improvement (34%), capacity building and leverage (34%), and
disaster assistance provided (30%).

6
Table 2: Service Projects Characteristics, Fiscal Years 2012-2019 (N=4,796) Characteristic Examples of Outputs Percent
Community Support Community activities planned or conducted; meals
served
41%
At-risk Ecosystems Wildlife species protected or assisted; acres of
wetlands restored or protected
34%
Infrastructure
Improvement
Playgrounds constructed or repaired; public buildings
renovated
34%
Capacity Building &
Leverage
Partnerships and coalitions supported; individuals
assisted on the 211-call system
34%
Disaster Assistance
Provided
People assisted at mass care facilities; Federal Disaster
Aid Applications processed
30%
Environmental
Conservation
Miles of new hiking trails constructed; parks restored
or refurbished
29%
Populations Assisted and
Engaged
Number of immigrants or refugees assisted; veterans
assisted
27%
Housing Homes painted or renovated; homes mucked and/or
gutted
24%
Awareness and
Stewardship
New trees planted; energy efficiency kits distributed 18%
Other Healthy Futures Number of gardens started or tended 12%
Education Support K-12 students tutored; adults tutored 11%
Public Safety Disaster simulations or exercises supported 11%
Energy Efficiency Recycling programs started or expanded; number of
efficient lightbulbs installed
4%
Inclusion of People with
Disabilities
Homes in which handicap accessibility was improved 3%
Access to Care People received immunizations 3%
Financial Literacy Tax returns completed 1%
Note: Percent will not add to 100% because service projects may have more than one characteristic.
Project Characteristics by Primary Issue Area This section describes the distribution of projects’ characteristics within each of the five primary
issue areas. Nearly half of the 5,004 service projects (2,472) are categorized as Natural and Other
Disasters (Figure 1), and service projects typically had multiple project characteristics.
Figures 2 through 6 show community support and at-risk ecosystems are recurring characteristics
with 15% to 82% of the service projects having one of these characteristics across the primary
issue areas. Infrastructure improvement is also a recurring characteristic but with a lower
percentage –12% to 45%– of service projects across the five primary issue areas. The exception
was the infrastructure primary issue area, where 85% of service projects were recorded as
infrastructure improvement characteristics. However, as was shown in Figure 1, the
infrastructure primary issue area only accounted for 5% (264) of all service projects from 2012-
2019. The capacity building and leverage characteristic was recorded in four of the five issue
areas, most frequently for service projects in natural and other disasters.
7
The remainder of this section illustrates the distribution of service projects’ characteristics within
each issue area. We organize the discussion alphabetically by issue area acronym with each issue
area’s project characteristics reported by largest to smallest prevalence.
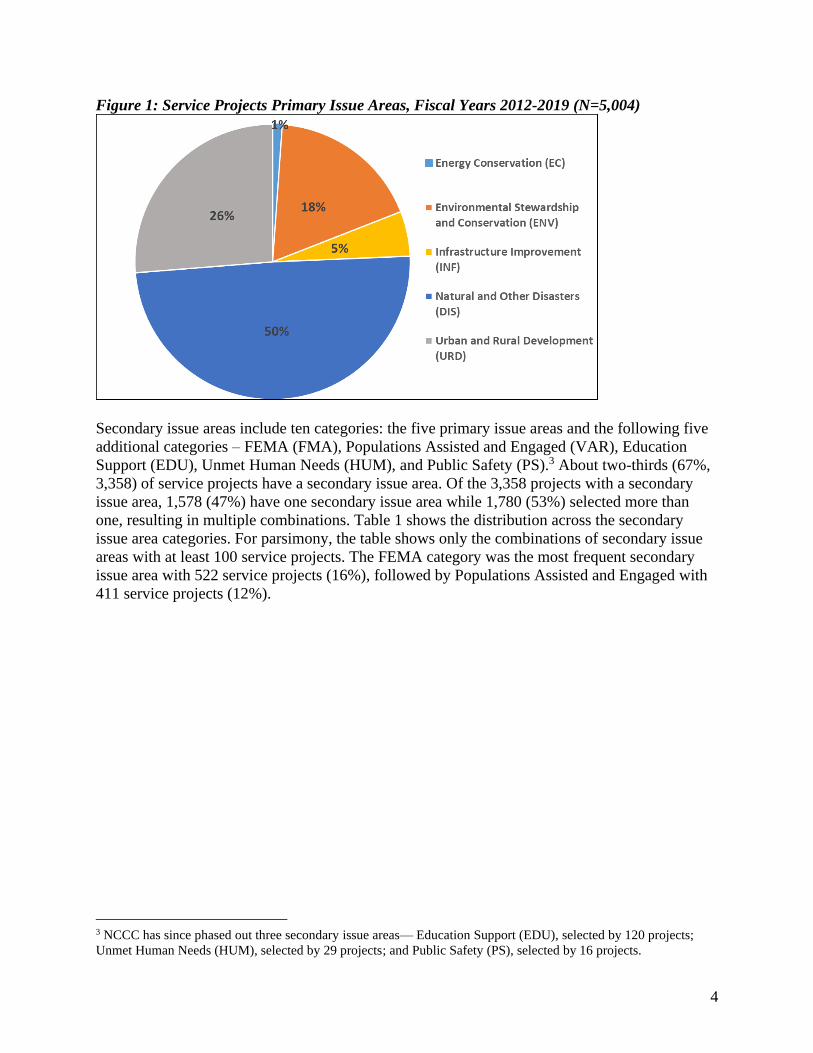
Natural and Other Disasters (DIS)
Service projects in the Natural and Other Disasters (DIS) issue area are typically recorded using
the capacity building and leverage and disaster assistance characteristics. In Figure 2, 70% of
DIS service projects were capacity building and leverage, and 60%were disaster assistance.
Other characteristics recorded for more than 20% of service projects in DIS were housing and
public safety.
Figure 2: Characteristics of Service Projects in the Natural and Other Disasters (DIS)
Primary Issue Area, Fiscal Years 2012-2019 (N=2,308)*
* Service projects might have more than one characteristic.
8
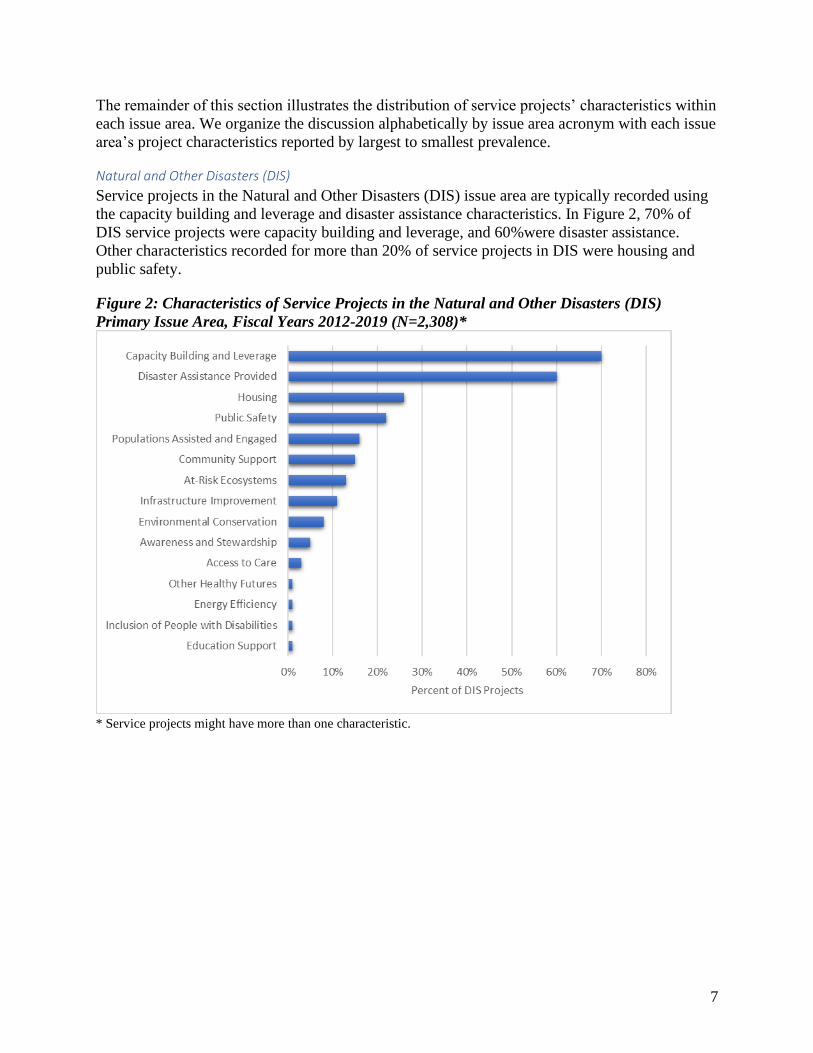
Energy Conservation (EC)
The service projects in the Energy Conservation issue area represent 1% of all service projects
from 2012-2019 (Figure 1). Of the service projects reporting characteristics in the EC issue area,
the most frequent characteristics, as shown in Figure 3, were awareness and stewardship (67%),
energy efficiency (67%), and housing (51%). More than 20% of the service projects were
characterized as community support, population assisted and engaged, infrastructure, and at-risk
ecosystems.
Figure 3: Characteristics of Service Projects in the Energy Conservation (EC) Issue Area,
Fiscal Years 2012-2019 (N=55)*
*Service projects might have more than one characteristic.

9
Environmental Stewardship and Conservation (ENV)
About 18% (890) of the service projects reported characteristics in the Environmental
Stewardship and Conservation issue area (Figure 1). The most frequent characteristics reported
for these service projects are at-risk ecosystems (82%), environmental conservation (80%), and
infrastructure improvement (65%). More than 45% of these service projects are characterized as
community support or awareness and stewardship; more than 20% are characterized as
population assisted and engaged.
Figure 4: Characteristics of Service Projects in the Environmental Stewardship and
Conservation (ENV), Fiscal Years 2012-2019 (N=890)*
*Service projects might have more than one characteristic.
10
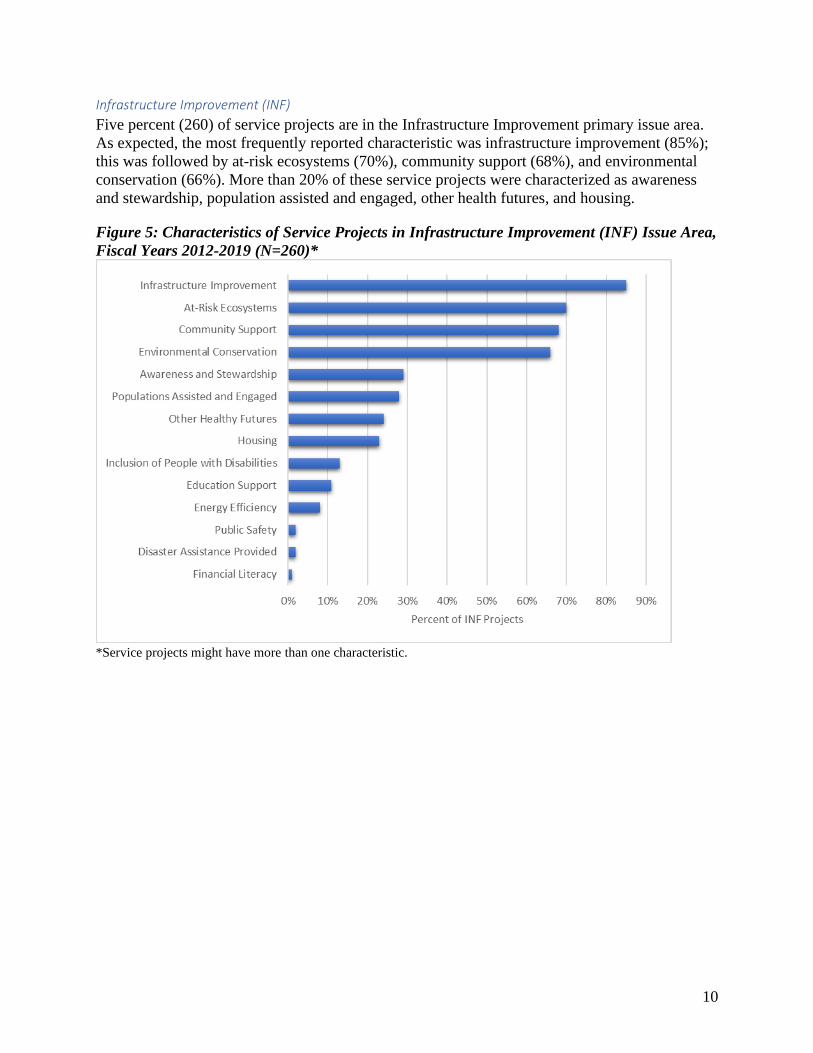
Infrastructure Improvement (INF)
Five percent (260) of service projects are in the Infrastructure Improvement primary issue area.
As expected, the most frequently reported characteristic was infrastructure improvement (85%);
this was followed by at-risk ecosystems (70%), community support (68%), and environmental
conservation (66%). More than 20% of these service projects were characterized as awareness
and stewardship, population assisted and engaged, other health futures, and housing.
Figure 5: Characteristics of Service Projects in Infrastructure Improvement (INF) Issue Area,
Fiscal Years 2012-2019 (N=260)*
*Service projects might have more than one characteristic.

11
Urban and Rural Development (URD)
More than one quarter (26%) of service projects are in the Urban and Rural Development issue
area (Figure 1). These service projects are frequently characterized as community support (76%),
populations assisted and engaged (51%), and infrastructure improvement (45%). Other
characteristics reported for more than 20% of these projects include housing, education support,
at-risk ecosystems, other health futures, and environmental conservation.
Figure 6: Characteristics of Service Projects in the Urban and Rural Development (URD)
Issue Area, Fiscal Years 2012-2019 (N=1,283)*
*Service projects might have more than one characteristic.
12
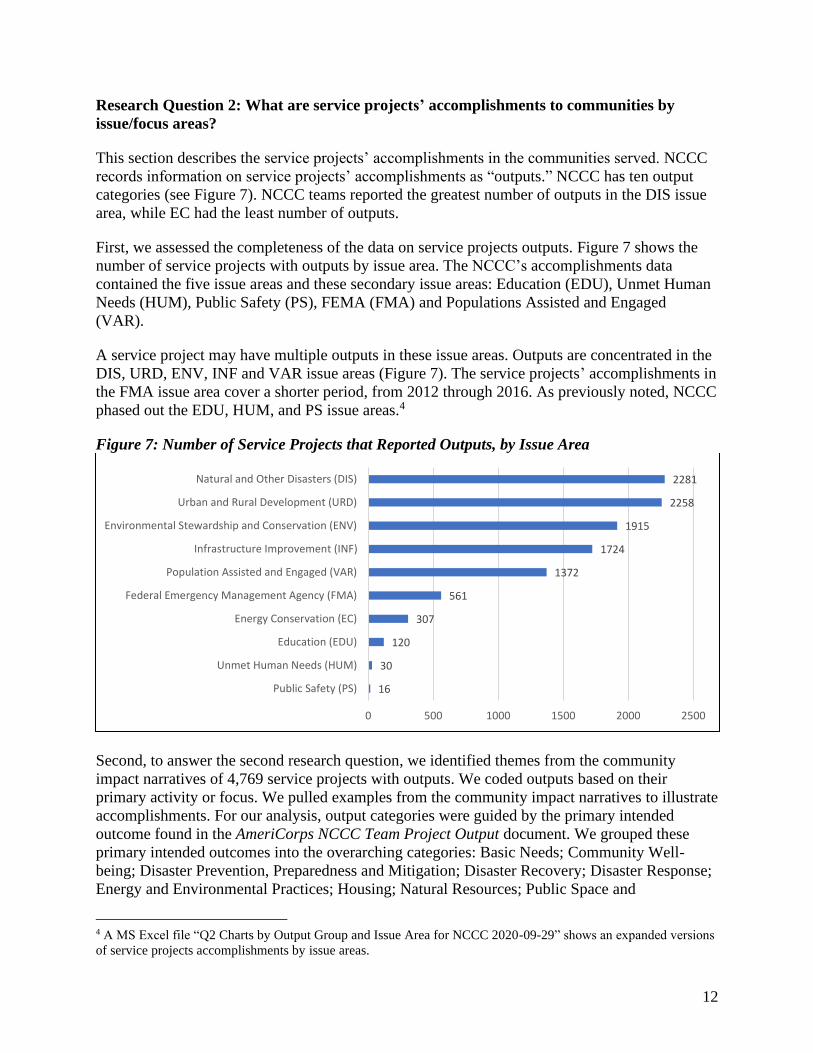
Research Question 2: What are service projects’ accomplishments to communities by
issue/focus areas?
This section describes the service projects’ accomplishments in the communities served. NCCC
records information on service projects’ accomplishments as “outputs.” NCCC has ten output
categories (see Figure 7). NCCC teams reported the greatest number of outputs in the DIS issue
area, while EC had the least number of outputs.
First, we assessed the completeness of the data on service projects outputs. Figure 7 shows the
number of service projects with outputs by issue area. The NCCC’s accomplishments data
contained the five issue areas and these secondary issue areas: Education (EDU), Unmet Human
Needs (HUM), Public Safety (PS), FEMA (FMA) and Populations Assisted and Engaged
(VAR).
A service project may have multiple outputs in these issue areas. Outputs are concentrated in the
DIS, URD, ENV, INF and VAR issue areas (Figure 7). The service projects’ accomplishments in
the FMA issue area cover a shorter period, from 2012 through 2016. As previously noted, NCCC
phased out the EDU, HUM, and PS issue areas.4
Figure 7: Number of Service Projects that Reported Outputs, by Issue Area
Second, to answer the second research question, we identified themes from the community
impact narratives of 4,769 service projects with outputs. We coded outputs based on their
primary activity or focus. We pulled examples from the community impact narratives to illustrate
accomplishments. For our analysis, output categories were guided by the primary intended
outcome found in the AmeriCorps NCCC Team Project Output document. We grouped these
primary intended outcomes into the overarching categories: Basic Needs; Community Well-
being; Disaster Prevention, Preparedness and Mitigation; Disaster Recovery; Disaster Response;
Energy and Environmental Practices; Housing; Natural Resources; Public Space and
4 A MS Excel file “Q2 Charts by Output Group and Issue Area for NCCC 2020-09-29” shows an expanded versions
of service projects accomplishments by issue areas.
16
30
120
307
561
1372
1724
1915
2258
2281
0 500 1000 1500 2000 2500
Public Safety (PS)
Unmet Human Needs (HUM)
Education (EDU)
Energy Conservation (EC)
Federal Emergency Management Agency (FMA)
Population Assisted and Engaged (VAR)
Infrastructure Improvement (INF)
Environmental Stewardship and Conservation (ENV)
Urban and Rural Development (URD)
Natural and Other Disasters (DIS)

13
Infrastructure; and Special Populations5. Table 3 lists the total number of outputs in the 10 output
categories.
Table 3: Total Number of Outputs Reported in Each Output Category* Output Category Total Number of Outputs
Natural Resources 6,588
Public Space and Infrastructure 4,590
Community Well-being 4,384
Disaster Recovery 4,101
Special Population 3,005
Disaster Prevention, Preparedness, and Mitigation 2,899
Disaster Response 1,589
Basic Needs 1,523
Housing 1,277
Energy and Environmental Practices 1,084
Total 31,040
*The output categories were guided by the Primary Intended Outcome from the “AmeriCorps National Civilian
Community Corps (NCCC) Team Project Output” list. AmeriCorps NCCC phased out some accomplishment
outputs; 776 outputs were phased out and not included in the results.
Table 4 shows the total number of outputs in each output category by the Issue Areas. The
highest number of outputs are in the Natural Resources category in the ENV issue area. The
second highest number of outputs are in the Public Space and Infrastructure output category,
which is spread across three issue areas: ENV, URD, and INF. Community Well-being and
Disaster Recovery output categories also had a high number of outputs. Energy and
Environmental practices, and Housing output categories had the fewer total number of outputs.
Table 4: Total Number of Outputs in Each Output Category by Issue Area DIS ENV URD INF VAR FMA EC Total
Natural Resources 6,588 6,588
Public Space and Infrastructure 368 301 3,921 4,590
Community Well-being 4,296 88 4,384
Disaster Recovery 3,431 670 4,101
Special population 758 2,247 3,005
Disaster Prevention, Preparedness,
and Mitigation 2,496 403 2,899
Disaster Response 1,505 84 1,589
Basic Needs 777 719 27 1,523
Housing 283 994 1,277
Energy and Environmental
Practices 510 574 1,084
Total 9,250 7,466 6,310 4,009 2,247 1,184 574 31,040
5 The “Special Population” output category is defined as a group or individuals served by NCCC Members with
specific characteristics, such as disadvantaged youth, higher education students, immigrants or refugees, homeless
individuals, NCCC alumni, people with disabilities, people in disaster areas, senior citizens, veterans, and
volunteers.

14
Figure 8 shows the issue area (inner circle) and their output categories (outer circle) with the
highest counts of outputs.6 The greatest number of outputs were reported in the Natural and
Other Disasters primary issue area, and the bulk of these outputs were reported under the
Disaster Recovery, Disaster Prevention Preparedness and Mitigation, and Disaster Response
output categories, with 7,432 of 9,250 total outputs. Service projects in the Environmental
Stewardship and Conservation, and Urban/Rural Development primary issue areas also had some
of the largest number of reported outputs, with more than 6,000 in each. In these two primary
issue areas, the output categories with the highest number of reported outputs include,
respectively, Natural Resources and Community Well-being.
Figure 8: Output Categories with Highest Count of Outputs
6 Larger segments indicate higher numbers of outputs. For example, there were 4,296 Community Well-being
outputs and 984 Housing outputs within the Rural/Urban Development issue area.

15
Figure 9 represents the issue areas with 400 or more outputs in a single output type. The size of
the slices in the outer layer is based on the total count for the output type, and this layer
determines the relative size of inner slices. For example, because the Environmental Stewardship
and Conservations issue area has more output types with large counts, it appears bigger, but, as
we know from previous figures and tables, Natural and Other Disaster is the biggest issue area
by total number but shows fewer counts under any particular output type.
Figure 9: Top Output Types Reported by NCCC Service Projects (400 or more)
In Appendix B, we provide detailed supporting tables showing the frequency and percent of
outputs within issue areas and output types from 2012 to 2019. See tables B-1 through B-26.

16
Research Question 3: How has the type of sponsor changed over time?
Sponsors Types NCCC had nine organizational classifications for sponsors: Federal Government, Higher
Education - State Controlled, Local Government – County, Local Government – Municipal,
National Non-Profit, Non-Profit, State Education Agency, State Government, and Other. Of the
5,004 service projects, 4,558 had information of the type of organization for the sponsor. From
2012 to 2019, Federal Government sponsored 41% of those projects, non-profits sponsored 28%,
and national non-profits sponsored 16%. In any full fiscal year, Federal Government sponsors
accounted for at least 43% of the service projects (Table 5).
Table 5: Type of Organization of NCCC Sponsors by Fiscal Years 2012 – 2019*
Sponsor
Type
Federal
Government
Higher
Education
Organization
- State
Controlled
Local
Government
- County
Local
Government
- Municipal
National
Non-
Profit
Non-Profit Other
State
Education
Agency
State
Government
N % N % N % N % N % N % N % N % N %
2012
43 9
8
2
14 3
26
5
133 27
213
43
18 4
2
0
40 8
2013
328 45
6 1
23 3
27 4
114 16
163 22
15 2
- 0
49 7
2014
293 44
7
1
11 2
29
4
102 15
168
25
16 2
3
0
41 6
2015
275 43
6 1
13 2
40 6
91 14
172 27
10 2
1 0
33 5
2016
248 47
6 1
11 2
21 4
72 14
141 27
7 1
1 19
19 4
2017
271 48
5 1
4 1
30 5
71 13
153 27
8 1
6 1
20 4
2018
370 47
4 1
9 1
21 3
123 16
210 27
20 3
4 1
23 3
2019
27 18
1 1
2 1
7 5
33 22
56 38
10 7
1 1
10 7
Total 1,855 43 87 201 739 1,276 104 18 235
*Description for “Other” sponsor data was not provided in the NCCC data file.
17
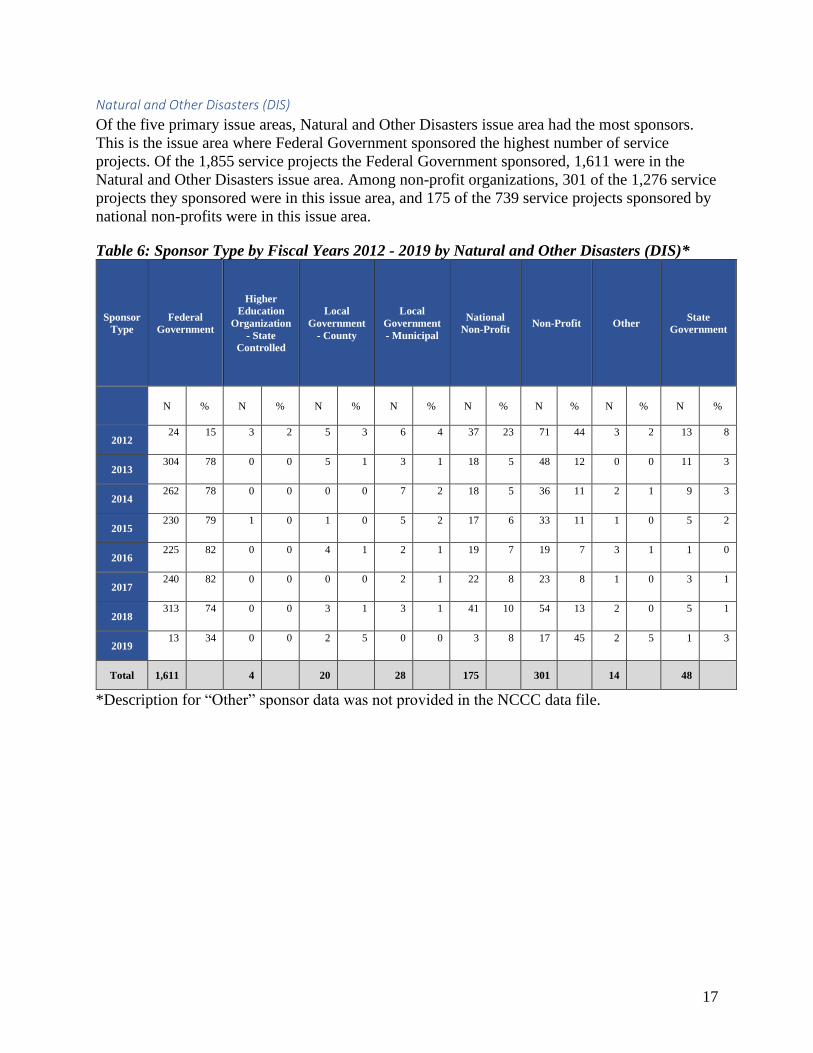
Natural and Other Disasters (DIS)
Of the five primary issue areas, Natural and Other Disasters issue area had the most sponsors.
This is the issue area where Federal Government sponsored the highest number of service
projects. Of the 1,855 service projects the Federal Government sponsored, 1,611 were in the
Natural and Other Disasters issue area. Among non-profit organizations, 301 of the 1,276 service
projects they sponsored were in this issue area, and 175 of the 739 service projects sponsored by
national non-profits were in this issue area.
Table 6: Sponsor Type by Fiscal Years 2012 - 2019 by Natural and Other Disasters (DIS)*
Sponsor
Type
Federal
Government
Higher
Education
Organization
- State
Controlled
Local
Government
- County
Local
Government
- Municipal
National
Non-Profit Non-Profit Other
State
Government
N % N % N % N % N % N % N % N %
2012 24 15 3 2 5 3 6 4 37 23 71 44 3 2 13 8
2013 304 78 0 0 5 1 3 1 18 5 48 12 0 0 11 3
2014 262 78 0 0 0 0 7 2 18 5 36 11 2 1 9 3
2015 230 79 1 0 1 0 5 2 17 6 33 11 1 0 5 2
2016 225 82 0 0 4 1 2 1 19 7 19 7 3 1 1 0
2017 240 82 0 0 0 0 2 1 22 8 23 8 1 0 3 1
2018 313 74 0 0 3 1 3 1 41 10 54 13 2 0 5 1
2019 13 34 0 0 2 5 0 0 3 8 17 45 2 5 1 3
Total 1,611 4 20 28 175 301 14 48
*Description for “Other” sponsor data was not provided in the NCCC data file.

18
Energy Conservation (EC)
Four types of organizations sponsored service projects in the Energy Conservation issue area
(Table 7). Over the seven-year span, non-profit organizations sponsored at least 50% of the
Energy Conservation service projects followed by local government at the municipal level.
Table 7: Sponsor Type by Fiscal Years 2012 - 2018 by Energy Conservation (EC)
Sponsor Type Local Government -
County
Local Government -
Municipal National Non-Profit Non-Profit
N % N % N % N %
2012 1 7 0 0 7 50 6 43
2013 1 11 0 0 2 22 6 67
2014 0 0 0 0 2 22 7 78
2015 0 0 2 50 0 0 2 50
2016 0 0 2 25 0 0 6 75
2017 0 0 3 43 0 0 4 57
2018 0 0 1 33 0 0 2 67
Total 2 8 11 33
19
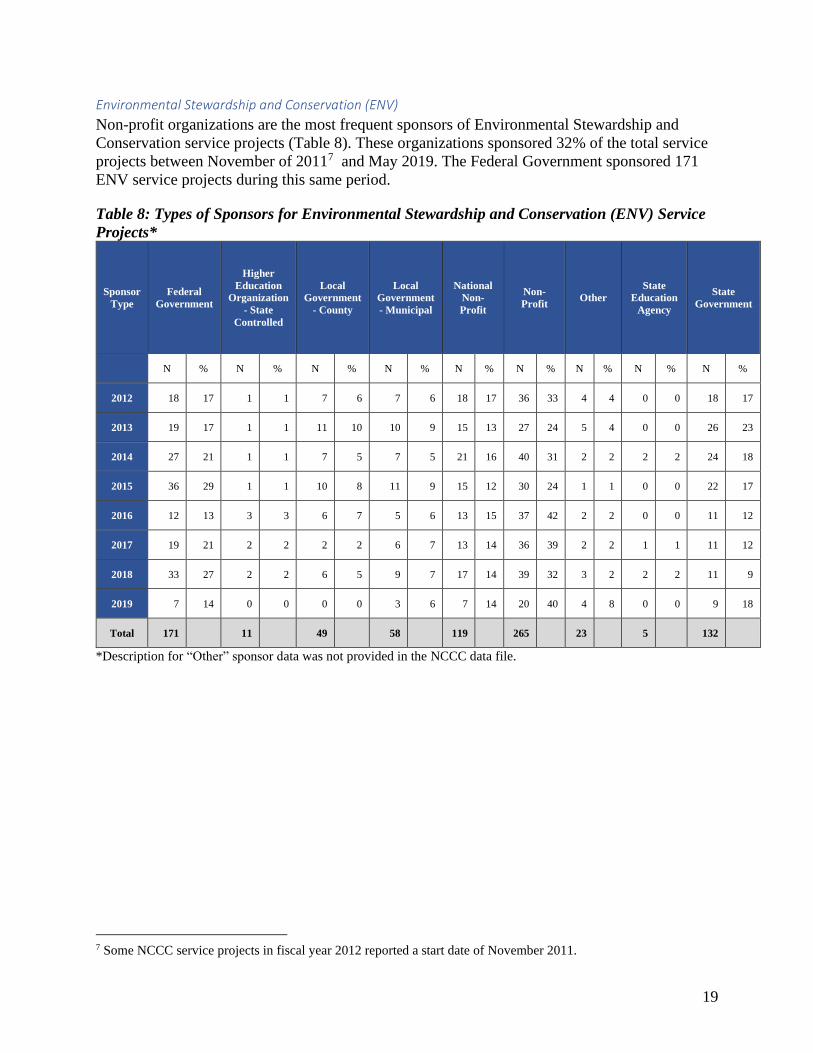
Environmental Stewardship and Conservation (ENV)
Non-profit organizations are the most frequent sponsors of Environmental Stewardship and
Conservation service projects (Table 8). These organizations sponsored 32% of the total service
projects between November of 20117 and May 2019. The Federal Government sponsored 171
ENV service projects during this same period.
Table 8: Types of Sponsors for Environmental Stewardship and Conservation (ENV) Service
Projects*
Sponsor
Type
Federal
Government
Higher
Education
Organization
- State
Controlled
Local
Government
- County
Local
Government
- Municipal
National
Non-
Profit
Non-
Profit Other
State
Education
Agency
State
Government
N % N % N % N % N % N % N % N % N %
2012 18 17 1 1 7 6 7 6 18 17 36 33 4 4 0 0 18 17
2013 19 17 1 1 11 10 10 9 15 13 27 24 5 4 0 0 26 23
2014 27 21 1 1 7 5 7 5 21 16 40 31 2 2 2 2 24 18
2015 36 29 1 1 10 8 11 9 15 12 30 24 1 1 0 0 22 17
2016 12 13 3 3 6 7 5 6 13 15 37 42 2 2 0 0 11 12
2017 19 21 2 2 2 2 6 7 13 14 36 39 2 2 1 1 11 12
2018 33 27 2 2 6 5 9 7 17 14 39 32 3 2 2 2 11 9
2019 7 14 0 0 0 0 3 6 7 14 20 40 4 8 0 0 9 18
Total 171 11 49 58 119 265 23 5 132
*Description for “Other” sponsor data was not provided in the NCCC data file.
7 Some NCCC service projects in fiscal year 2012 reported a start date of November 2011.
20
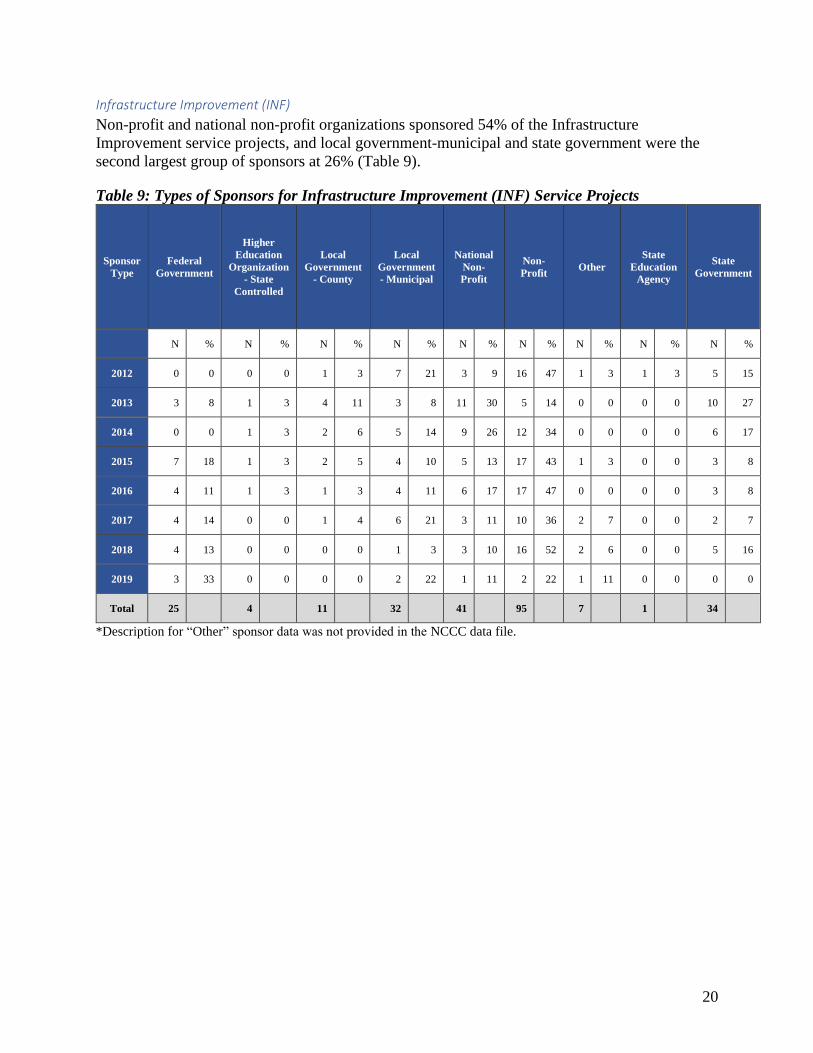
Infrastructure Improvement (INF)
Non-profit and national non-profit organizations sponsored 54% of the Infrastructure
Improvement service projects, and local government-municipal and state government were the
second largest group of sponsors at 26% (Table 9).
Table 9: Types of Sponsors for Infrastructure Improvement (INF) Service Projects
Sponsor
Type
Federal
Government
Higher
Education
Organization
- State
Controlled
Local
Government
- County
Local
Government
- Municipal
National
Non-
Profit
Non-
Profit Other
State
Education
Agency
State
Government
N % N % N % N % N % N % N % N % N %
2012 0 0 0 0 1 3 7 21 3 9 16 47 1 3 1 3 5 15
2013 3 8 1 3 4 11 3 8 11 30 5 14 0 0 0 0 10 27
2014 0 0 1 3 2 6 5 14 9 26 12 34 0 0 0 0 6 17
2015 7 18 1 3 2 5 4 10 5 13 17 43 1 3 0 0 3 8
2016 4 11 1 3 1 3 4 11 6 17 17 47 0 0 0 0 3 8
2017 4 14 0 0 1 4 6 21 3 11 10 36 2 7 0 0 2 7
2018 4 13 0 0 0 0 1 3 3 10 16 52 2 6 0 0 5 16
2019 3 33 0 0 0 0 2 22 1 11 2 22 1 11 0 0 0 0
Total 25 4 11 32 41 95 7 1 34
*Description for “Other” sponsor data was not provided in the NCCC data file.
21
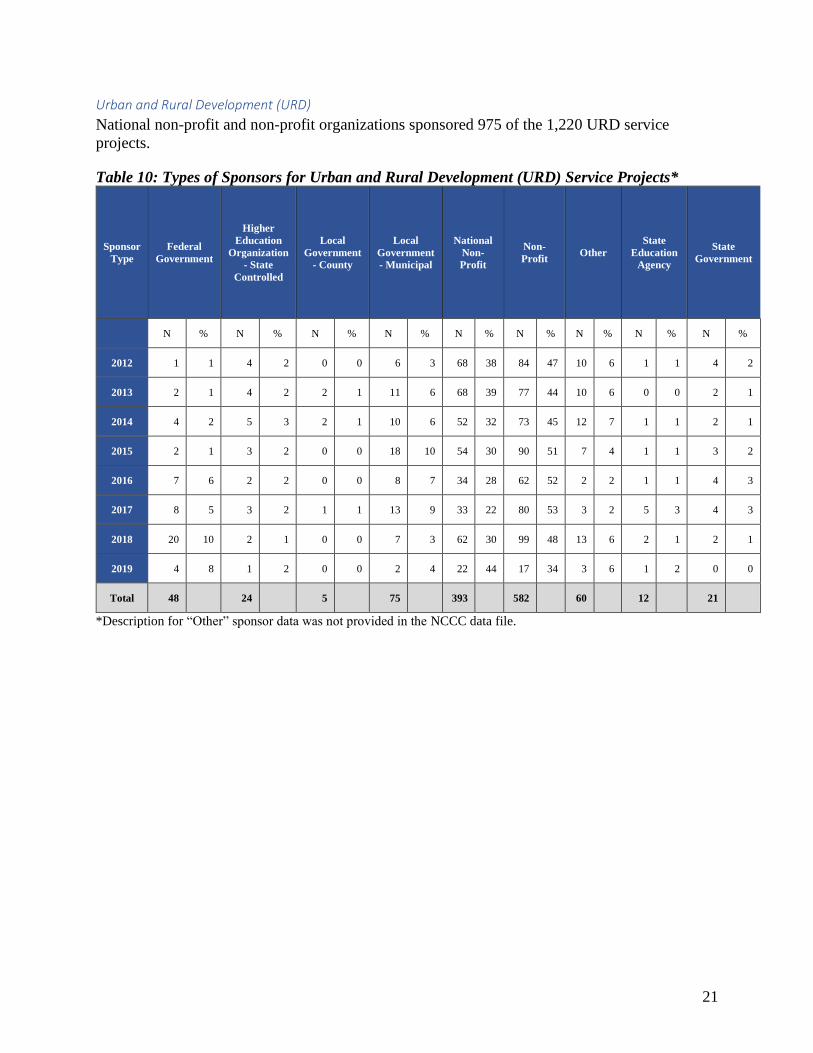
Urban and Rural Development (URD)
National non-profit and non-profit organizations sponsored 975 of the 1,220 URD service
projects.
Table 10: Types of Sponsors for Urban and Rural Development (URD) Service Projects*
Sponsor
Type
Federal
Government
Higher
Education
Organization
- State
Controlled
Local
Government
- County
Local
Government
- Municipal
National
Non-
Profit
Non-
Profit Other
State
Education
Agency
State
Government
N % N % N % N % N % N % N % N % N %
2012 1 1 4 2 0 0 6 3 68 38 84 47 10 6 1 1 4 2
2013 2 1 4 2 2 1 11 6 68 39 77 44 10 6 0 0 2 1
2014 4 2 5 3 2 1 10 6 52 32 73 45 12 7 1 1 2 1
2015 2 1 3 2 0 0 18 10 54 30 90 51 7 4 1 1 3 2
2016 7 6 2 2 0 0 8 7 34 28 62 52 2 2 1 1 4 3
2017 8 5 3 2 1 1 13 9 33 22 80 53 3 2 5 3 4 3
2018 20 10 2 1 0 0 7 3 62 30 99 48 13 6 2 1 2 1
2019 4 8 1 2 0 0 2 4 22 44 17 34 3 6 1 2 0 0
Total 48 24 5 75 393 582 60 12 21
*Description for “Other” sponsor data was not provided in the NCCC data file.
22
Research Question 4. How have the characteristics of NCCC service projects changed over
time?
This research question seeks to describe whether there has been a change in the characteristics of
service projects over time. For context, we first present the number of service projects each year
between 2012 and 2019 (Table 11) and the distribution of service projects in each primary issue
area (Figure 10).
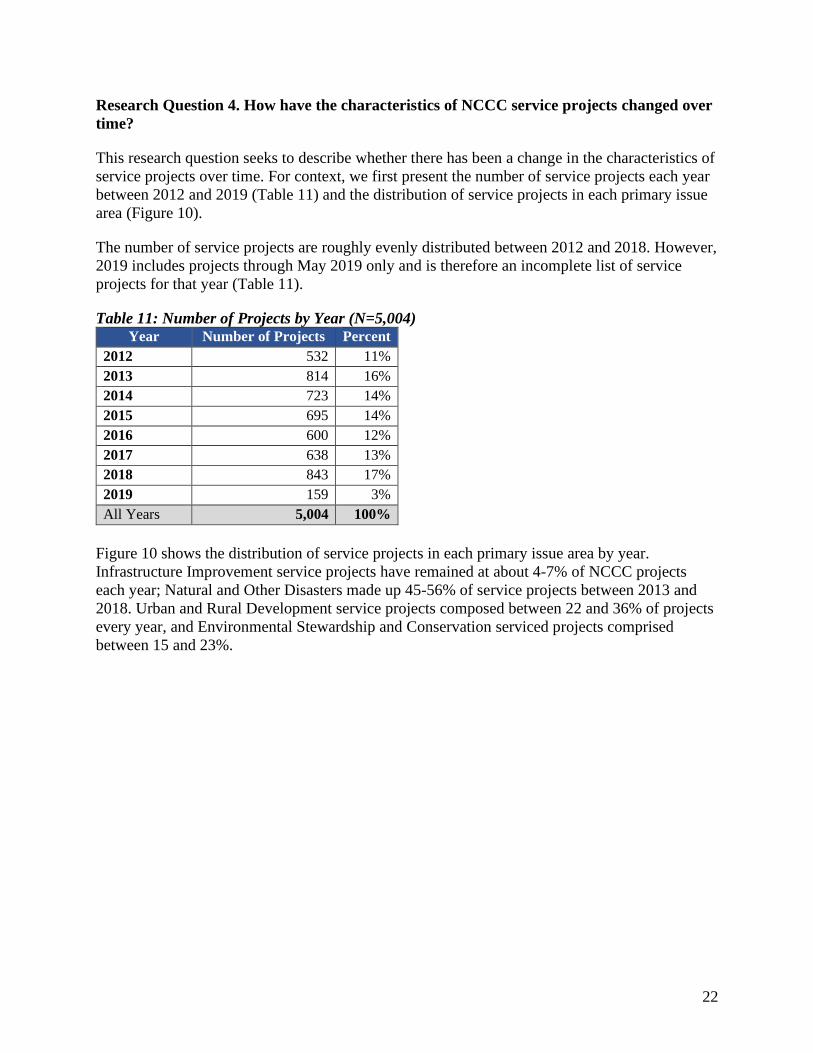
The number of service projects are roughly evenly distributed between 2012 and 2018. However,
2019 includes projects through May 2019 only and is therefore an incomplete list of service
projects for that year (Table 11).
Table 11: Number of Projects by Year (N=5,004) Year Number of Projects Percent
2012 532 11%
2013 814 16%
2014 723 14%
2015 695 14%
2016 600 12%
2017 638 13%
2018 843 17%
2019 159 3%
All Years 5,004 100%
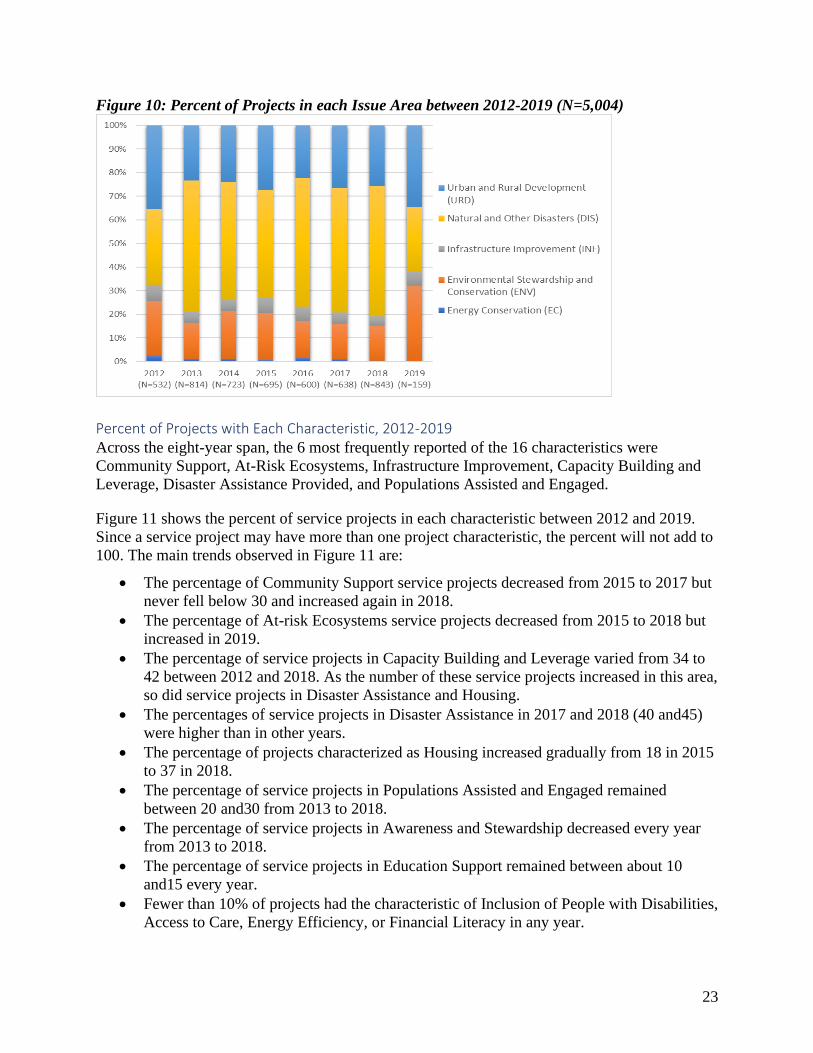
Figure 10 shows the distribution of service projects in each primary issue area by year.
Infrastructure Improvement service projects have remained at about 4-7% of NCCC projects
each year; Natural and Other Disasters made up 45-56% of service projects between 2013 and
2018. Urban and Rural Development service projects composed between 22 and 36% of projects
every year, and Environmental Stewardship and Conservation serviced projects comprised
between 15 and 23%.
23
Figure 10: Percent of Projects in each Issue Area between 2012-2019 (N=5,004)
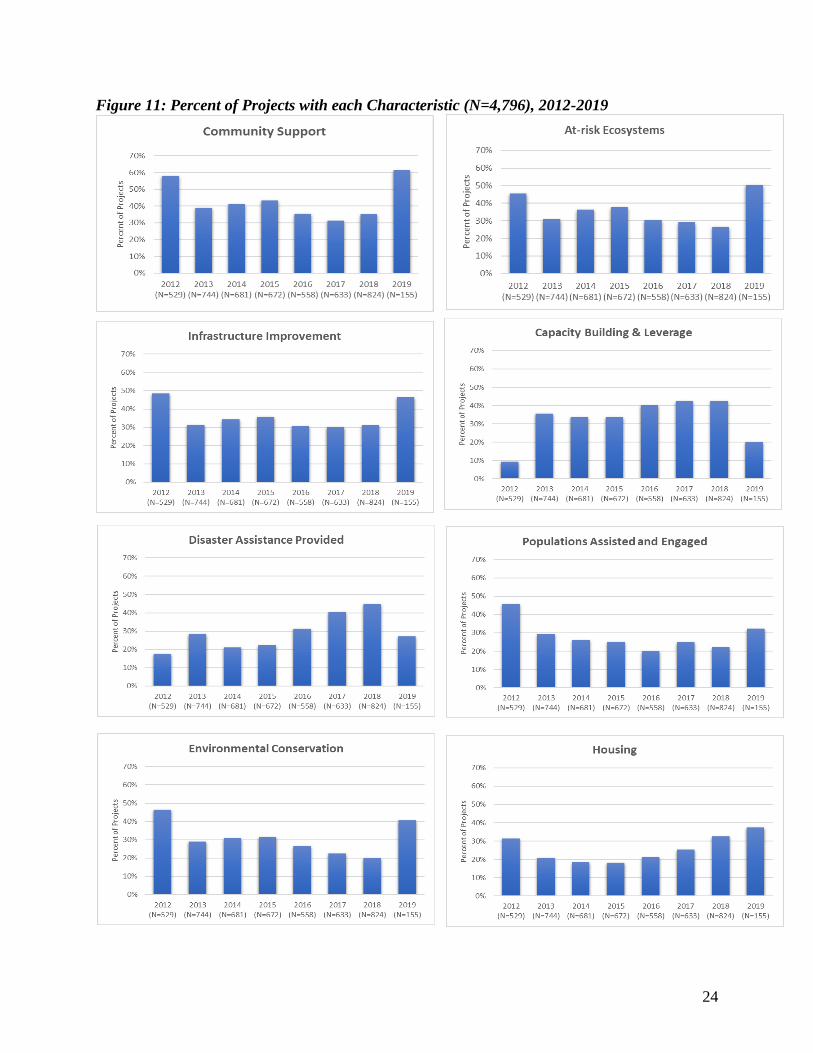
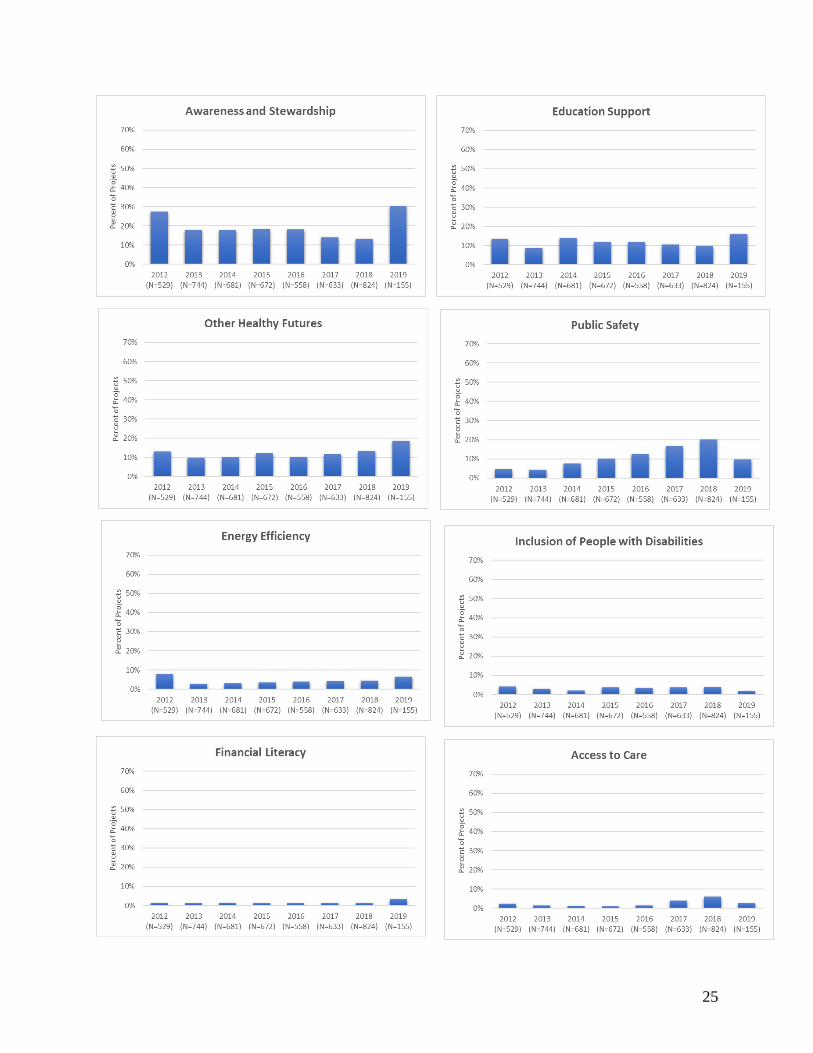
Percent of Projects with Each Characteristic, 2012-2019 Across the eight-year span, the 6 most frequently reported of the 16 characteristics were
Community Support, At-Risk Ecosystems, Infrastructure Improvement, Capacity Building and
Leverage, Disaster Assistance Provided, and Populations Assisted and Engaged.
Figure 11 shows the percent of service projects in each characteristic between 2012 and 2019.
Since a service project may have more than one project characteristic, the percent will not add to
100. The main trends observed in Figure 11 are:
• The percentage of Community Support service projects decreased from 2015 to 2017 but
never fell below 30 and increased again in 2018.
• The percentage of At-risk Ecosystems service projects decreased from 2015 to 2018 but
increased in 2019.
• The percentage of service projects in Capacity Building and Leverage varied from 34 to
42 between 2012 and 2018. As the number of these service projects increased in this area,
so did service projects in Disaster Assistance and Housing.
• The percentages of service projects in Disaster Assistance in 2017 and 2018 (40 and45)
were higher than in other years.
• The percentage of projects characterized as Housing increased gradually from 18 in 2015
to 37 in 2018.
• The percentage of service projects in Populations Assisted and Engaged remained
between 20 and30 from 2013 to 2018.
• The percentage of service projects in Awareness and Stewardship decreased every year
from 2013 to 2018.
• The percentage of service projects in Education Support remained between about 10
and15 every year.
• Fewer than 10% of projects had the characteristic of Inclusion of People with Disabilities,
Access to Care, Energy Efficiency, or Financial Literacy in any year.
24
Figure 11: Percent of Projects with each Characteristic (N=4,796), 2012-2019
25
26
Research Question 5: What are the characteristics of recurring service projects? What
community needs have service projects addressed over time by issue area?
Characteristics of Recurring Service Projects We identified the number of times any service project occurred at the service site address. If the
service site address appeared more than once, the site was considered “recurring.” Just under half
(49%) of the service site addresses were “recurring” (Table 12) with 11% of sites (786) hosting
at least five projects between 2012 and 2019.
Table 12: Recurring and Non-Recurring Service Sites (2012-2019)
Number of times service
project occurred at the site Service Sites (N=6,993) Percent
One Time (Non-recurring) 3,533 51%
Two Times 1,282 18%
Three or Four Times 1,392 20%
Five or More Times 786 11%
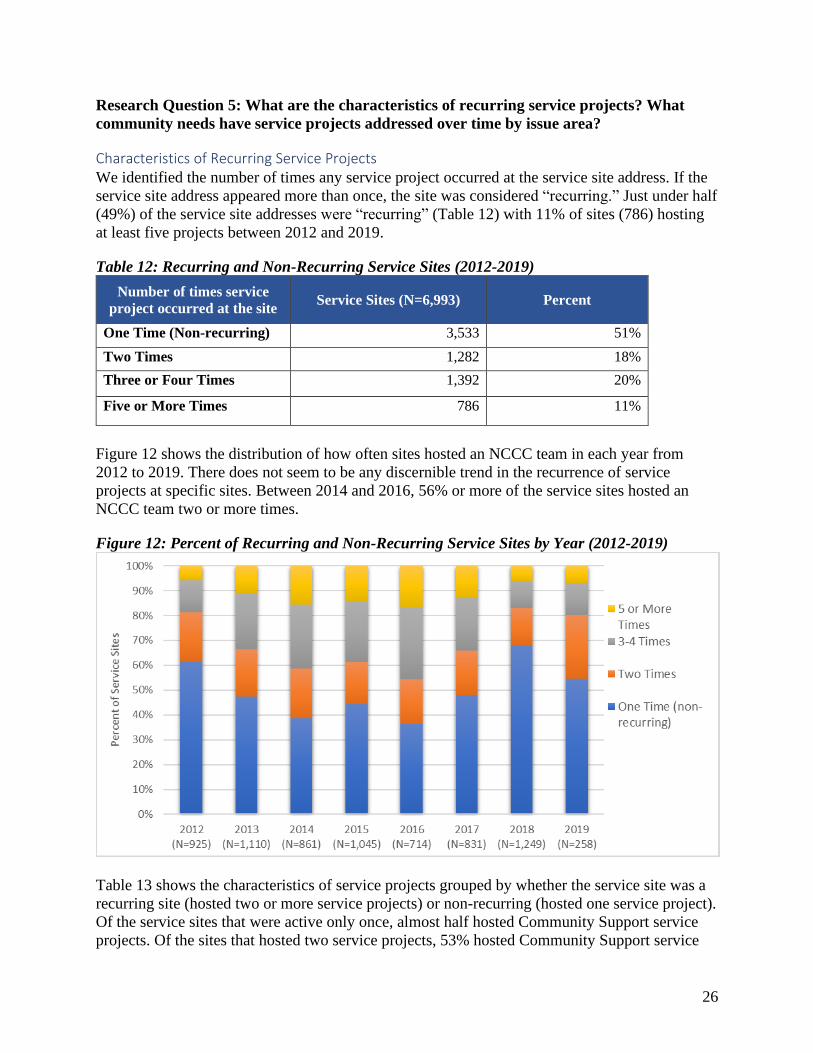
Figure 12 shows the distribution of how often sites hosted an NCCC team in each year from
2012 to 2019. There does not seem to be any discernible trend in the recurrence of service
projects at specific sites. Between 2014 and 2016, 56% or more of the service sites hosted an
NCCC team two or more times.
Figure 12: Percent of Recurring and Non-Recurring Service Sites by Year (2012-2019)
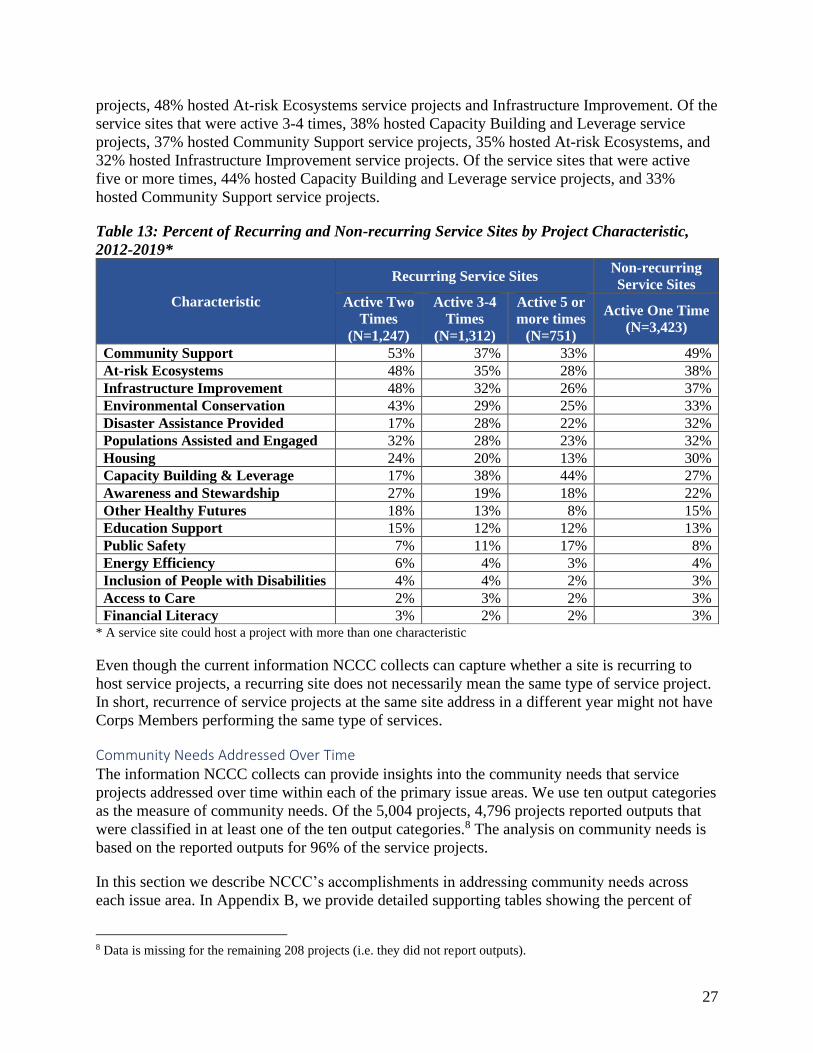
Table 13 shows the characteristics of service projects grouped by whether the service site was a
recurring site (hosted two or more service projects) or non-recurring (hosted one service project).
Of the service sites that were active only once, almost half hosted Community Support service
projects. Of the sites that hosted two service projects, 53% hosted Community Support service
27
projects, 48% hosted At-risk Ecosystems service projects and Infrastructure Improvement. Of the
service sites that were active 3-4 times, 38% hosted Capacity Building and Leverage service
projects, 37% hosted Community Support service projects, 35% hosted At-risk Ecosystems, and
32% hosted Infrastructure Improvement service projects. Of the service sites that were active
five or more times, 44% hosted Capacity Building and Leverage service projects, and 33%
hosted Community Support service projects.
Table 13: Percent of Recurring and Non-recurring Service Sites by Project Characteristic,
2012-2019*
Characteristic
Recurring Service Sites Non-recurring
Service Sites
Active Two
Times
(N=1,247)
Active 3-4
Times
(N=1,312)
Active 5 or
more times
(N=751)
Active One Time
(N=3,423)
Community Support 53% 37% 33% 49%
At-risk Ecosystems 48% 35% 28% 38%
Infrastructure Improvement 48% 32% 26% 37%
Environmental Conservation 43% 29% 25% 33%
Disaster Assistance Provided 17% 28% 22% 32%
Populations Assisted and Engaged 32% 28% 23% 32%
Housing 24% 20% 13% 30%
Capacity Building & Leverage 17% 38% 44% 27%
Awareness and Stewardship 27% 19% 18% 22%
Other Healthy Futures 18% 13% 8% 15%
Education Support 15% 12% 12% 13%
Public Safety 7% 11% 17% 8%
Energy Efficiency 6% 4% 3% 4%
Inclusion of People with Disabilities 4% 4% 2% 3%
Access to Care 2% 3% 2% 3%
Financial Literacy 3% 2% 2% 3% * A service site could host a project with more than one characteristic
Even though the current information NCCC collects can capture whether a site is recurring to
host service projects, a recurring site does not necessarily mean the same type of service project.
In short, recurrence of service projects at the same site address in a different year might not have
Corps Members performing the same type of services.
Community Needs Addressed Over Time The information NCCC collects can provide insights into the community needs that service
projects addressed over time within each of the primary issue areas. We use ten output categories
as the measure of community needs. Of the 5,004 projects, 4,796 projects reported outputs that
were classified in at least one of the ten output categories.8 The analysis on community needs is
based on the reported outputs for 96% of the service projects.
In this section we describe NCCC’s accomplishments in addressing community needs across
each issue area. In Appendix B, we provide detailed supporting tables showing the percent of
8 Data is missing for the remaining 208 projects (i.e. they did not report outputs).
28
outputs within each of the ten output categories and issue areas for each year, from 2012 to 2019
(see Tables B-27 through B-31).
Natural and Other Disasters (DIS)
Natural and Other Disaster (DIS) comprises the highest number of service projects during this
period. Within this issue area, the community needs most frequently addressed were in Disaster
Recovery and Disaster Prevention, Preparedness and Mitigation. Between 2014 and 2018, more
than half of outputs were in these two output categories. Community needs in the Disaster
Recovery output category peaked in 2016 at 38% of all outputs in the Natural and Other Disaster
issue area, and community needs in the Disaster Prevention, Preparedness, and Mitigation output
category increased from 2012 through 2015. Other important areas where community needs were
addressed included Disaster Response, which made up between 7% and 15% of outputs each
year, and Special Populations, which made up 10% to 18% of the outputs for 6 of the 8 years
(see Appendix B, Table B-27).
One service project cited their accomplishments in Disaster Response as follows:
“FEMA Community Relations is a branch of FEMA’s External Affairs Department that
works directly with disaster survivors as a means to direct those who have been impacted
to available assistance and resources. For three weeks, Bayou 4 worked out of FEMA’s
LRO (Long-term Recovery Office) and worked directly with the Community Relations
staff in the New Orleans area. Upon entering the disaster area for Hurricane Isaac,
Bayou 4 was paired up with Community Relations reservists who were already working
the area for several weeks prior to the team’s arrival. Bayou 4 was split up as a team
during the workdays, and went door to door canvassing Jefferson, Orleans, and
Plaquemines Parishes around the greater New Orleans area. Bayou 4 Members gave out
available information to survivors such as: the location of Disaster Recovery Centers,
how to apply for federal disaster assistance, how to eliminate mold from a home, where
to live if a home is inhabitable, and how to follow through for an appeal to get federal
assistance money. “
Energy Conservation (EC)
The Energy Conservation (EC) issue area had the fewest number of service projects between
2012 and 20189 (see Appendix B, Table B-28). The community needs most frequently addressed
in this issue area were in the Energy and Environmental Practices output category, comprising
between 34% and 65% of all outputs every year in this issue area. Natural Resources outputs
accounted for 17% to 25% of all outputs in 4 of the 7 years; they peaked in 2013 at 25% of all
outputs in this issue area and decreased to 6% of outputs by 2018.
This is one example of how the NCCC teams described their accomplishments:
“Coast 2 managed to save Louisiana residents 520,080 kWh worth of energy, $60,720,
and 590,040 pounds of CO2 that would have otherwise been emitted into the atmosphere.
(These statistics are calculations based on the lifetime of a lightbulb--7 to 10 years.)
Additionally, 500 gallons worth of rainwater collected in rain barrels will help prevent
9 EC outputs were not available in 2019.
29
flooding of Louisiana residents’ homes during storms. The owner of the new vegetable
garden can potentially save $10-100 dollars each year, and with nutritious food choices,
will be able to have a healthier lifestyle. Additionally, each of the 85 homeowners who
had lightbulbs installed, the 10 who had rain barrels installed, the 1 who had a garden
installed, and the 28 who were canvassed (124 homeowners overall), were all given
educational packets that described how to be environmentally friendly, how to save more
energy, and how their new products or items save them money, energy, or water.”
Environmental Stewardship and Conservation (ENV)
In the Environmental Stewardship and Conservation (ENV) issue area, Natural Resources were
the most frequent community needs that NCCC teams addressed, accounting for about half of the
outputs every year (see Appendix B, Table B-29). The Public Space and Infrastructure output
category comprised about one quarter of the outputs every year in the ENV area. There was little
fluctuation in the distribution of outputs across the different categories from year to year.
As an example of a community need addressed in ENV projects, an NCCC team wrote:
“Blue Seven worked to make a substantial positive impact on the community. By
constructing 2.3 miles of trail and restoring 12.3 miles of existing trail, Blue Seven aided
in adding and restoring access to nature for locals, tourists, and animals. Blue Seven
building 10 gardens for the community garden provided the needed manpower to get the
community garden started and running again. And by clearing 20.5 acres of brush and
invasive species throughout the project round, Blue Seven helped the city staff keep the
town clean and safe for those that live here and pass through…”
Infrastructure Improvement (INF)
In the Infrastructure Improvement (INF) issue area, the most frequently reported outputs were in
Natural Resources and Public Space and Infrastructure, which combined to cover about two-
thirds of the outputs in this issue area every year (see Appendix B, Table B-30). Between 16%
and 24% of the outputs were in Community Well-being each year, increasing to 24% by 2019.
One NCCC team described their accomplishment as follows:
“River 1 helped restore historically significant buildings that were in serious need of
repairs. The buildings that the team roofed had been placed on a back burner for several
years because they are staff buildings, not seen or used by the public; park funds had
been allocated for the more critical repairs to buildings that the paying patrons used
throughout the park. However, these buildings not only served as an important piece of
history, they were built by the CCC during the 1930’s and the cabin was built with
cabbage palm logs, a style not often seen outside of CCC construction, they are also
important to the functioning of the park; the shop building that was leaking and rotted
housed important tools and equipment while the cabin was going to be the residence of
the volunteer coordinator. By making repairs to a living space, the park was able to
house more of their volunteers or staff with another functioning cabin available.
Approximately 350,000 people visit the park annually and the majority of resources the
park has are dedicated to making the park enjoyable and safe for those people. Although
the volunteers served with the team, having River 1 roof the two buildings allowed the

30
volunteers and rangers to be able spend more time on other pressing matters, such as the
buildings and land that the paying public interacted with rather than spending over a
month on two buildings the public would not benefit from.”
Urban and Rural Development (URD)
Urban and Rural Development (URD) service projects accounted for 26% of all service projects
between 2012 and 2019. The most frequent reported outputs across the communities served were
in the Community Well-being category, which composed about one-third of the outputs in this
issue area in most years (see Appendix B, Table B-31). These reported outputs peaked at 35% of
the outputs in 2014. Public Space and Infrastructure composed about one-fifth of outputs every
year. Natural Resources composed about 15% of the outputs every year, peaking in 2016 at 18%.
An example of NCCC teams’ accomplishments in the Community Well-being output category
was described in this narrative:
“Although Water 5’s main project was working at the House of Abigail, the team got to
work with other community groups to understand the issues that Mountain View faces.
Every Wednesday, the team alternated working with the Mountain View Garden Club
and the Mountain View Community Garden. And once a month, the team would work
with the F.E.E.D. Program (Food Enough Everyone Distribution). The Mountain View
Garden Club works to make the town of Mountain View beautiful and appealing to
people passing through and the residents that live here. The Mountain View Community
Garden works to give the people of Mountain View a place to grow their own food for a
small price of $10 per bed per year. The F.E.E.D. Program is a mobile food pantry that
provides food to residents in the Mountain View and Peace Valley Area that can show
their monthly income and the amount of household Members they are providing for. The
town of Mountain View is a smaller town that has a predominantly older population, so
the team has been helping the town complete projects that wouldn’t otherwise be
completed. By working in the Community Garden and with the F.E.E.D. Program, the
team learned about the food security issues in the town of Mountain View. With the
F.E.E.D. program, the team would help distribute food, but also help people carry their
items to their vehicles. With the Community Garden, the team would help mulch and
weed, along with helping complete other projects such as staining and creating a new
sign that otherwise wouldn’t have been completed.”
31
Research Question 6: How frequently does NCCC serve the same community with the
same needs?
To answer this question, we again use the reported outputs as the measure of community needs.
AmeriCorps NCCC has phased out a group of outputs; these are combined under a general
“Phased Out” category. A service project may report multiple outputs or address multiple needs
across these categories.
We used the state from the site address to determine project locations where NCCC teams served
communities. To determine how frequently NCCC served the same needs (which we measure
from type of outputs reported) in the same communities, we grouped the site addresses and
cross-tabulated the addresses with the 11 project output categories (including “Phased Out”). We
illustrate the results in state-level maps for each output category (or needs) from 2012 to 2019.10
An accompanying Excel file, “Q6 Site Map by Year and Output Grouping for NCCC 2020-09-
29,” includes a table with the list of category outputs and maps of project locations by year.
10 Site addresses were used to determine the location where service projects were completed. There were
324 addresses that were not found, including 173 P.O. Box addresses, and 94 addresses did not have an
exact match.
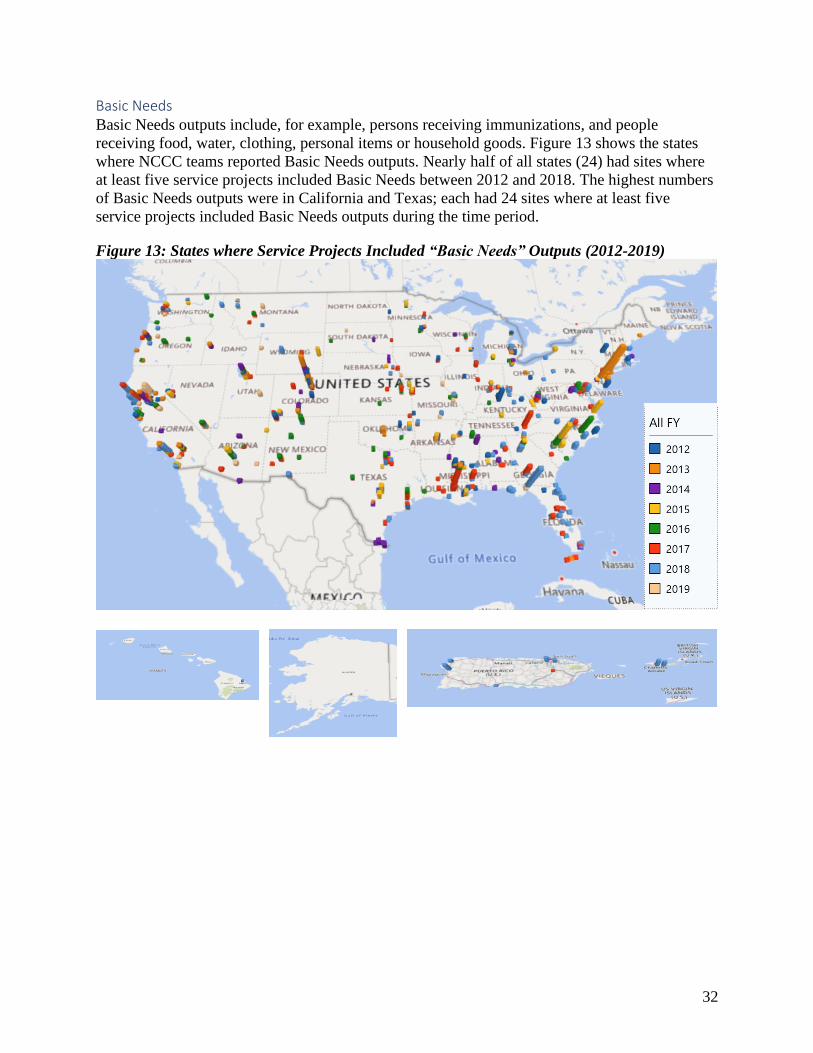
32
Basic Needs Basic Needs outputs include, for example, persons receiving immunizations, and people
receiving food, water, clothing, personal items or household goods. Figure 13 shows the states
where NCCC teams reported Basic Needs outputs. Nearly half of all states (24) had sites where
at least five service projects included Basic Needs between 2012 and 2018. The highest numbers
of Basic Needs outputs were in California and Texas; each had 24 sites where at least five
service projects included Basic Needs outputs during the time period.
Figure 13: States where Service Projects Included “Basic Needs” Outputs (2012-2019)
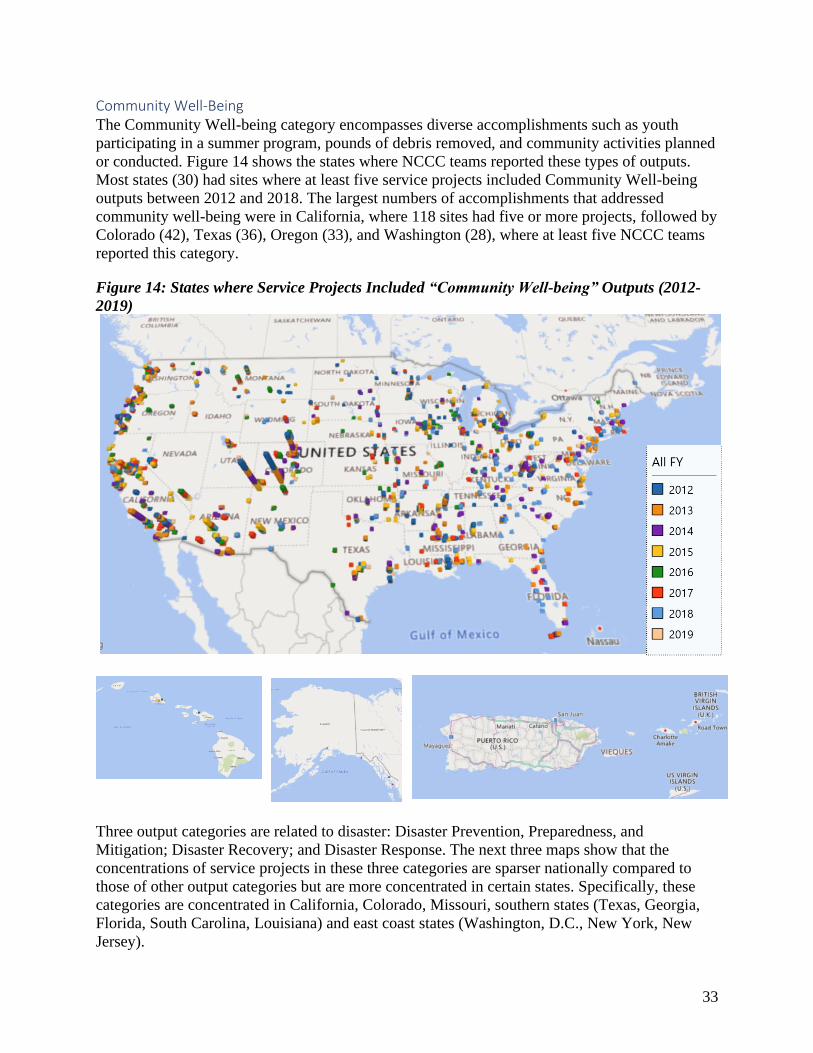
33
Community Well-Being The Community Well-being category encompasses diverse accomplishments such as youth
participating in a summer program, pounds of debris removed, and community activities planned
or conducted. Figure 14 shows the states where NCCC teams reported these types of outputs.
Most states (30) had sites where at least five service projects included Community Well-being
outputs between 2012 and 2018. The largest numbers of accomplishments that addressed
community well-being were in California, where 118 sites had five or more projects, followed by
Colorado (42), Texas (36), Oregon (33), and Washington (28), where at least five NCCC teams
reported this category.
Figure 14: States where Service Projects Included “Community Well-being” Outputs (2012-
2019)
Three output categories are related to disaster: Disaster Prevention, Preparedness, and
Mitigation; Disaster Recovery; and Disaster Response. The next three maps show that the
concentrations of service projects in these three categories are sparser nationally compared to
those of other output categories but are more concentrated in certain states. Specifically, these
categories are concentrated in California, Colorado, Missouri, southern states (Texas, Georgia,
Florida, South Carolina, Louisiana) and east coast states (Washington, D.C., New York, New
Jersey).
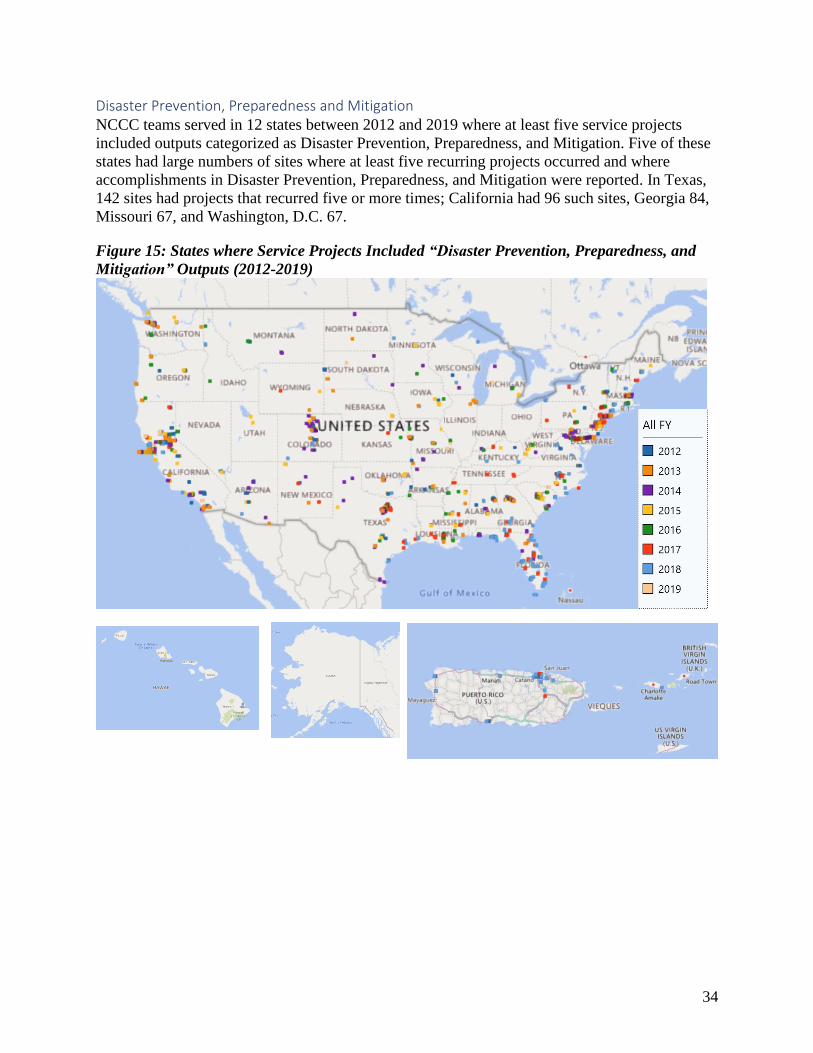
34
Disaster Prevention, Preparedness and Mitigation NCCC teams served in 12 states between 2012 and 2019 where at least five service projects
included outputs categorized as Disaster Prevention, Preparedness, and Mitigation. Five of these
states had large numbers of sites where at least five recurring projects occurred and where
accomplishments in Disaster Prevention, Preparedness, and Mitigation were reported. In Texas,
142 sites had projects that recurred five or more times; California had 96 such sites, Georgia 84,
Missouri 67, and Washington, D.C. 67.
Figure 15: States where Service Projects Included “Disaster Prevention, Preparedness, and
Mitigation” Outputs (2012-2019)
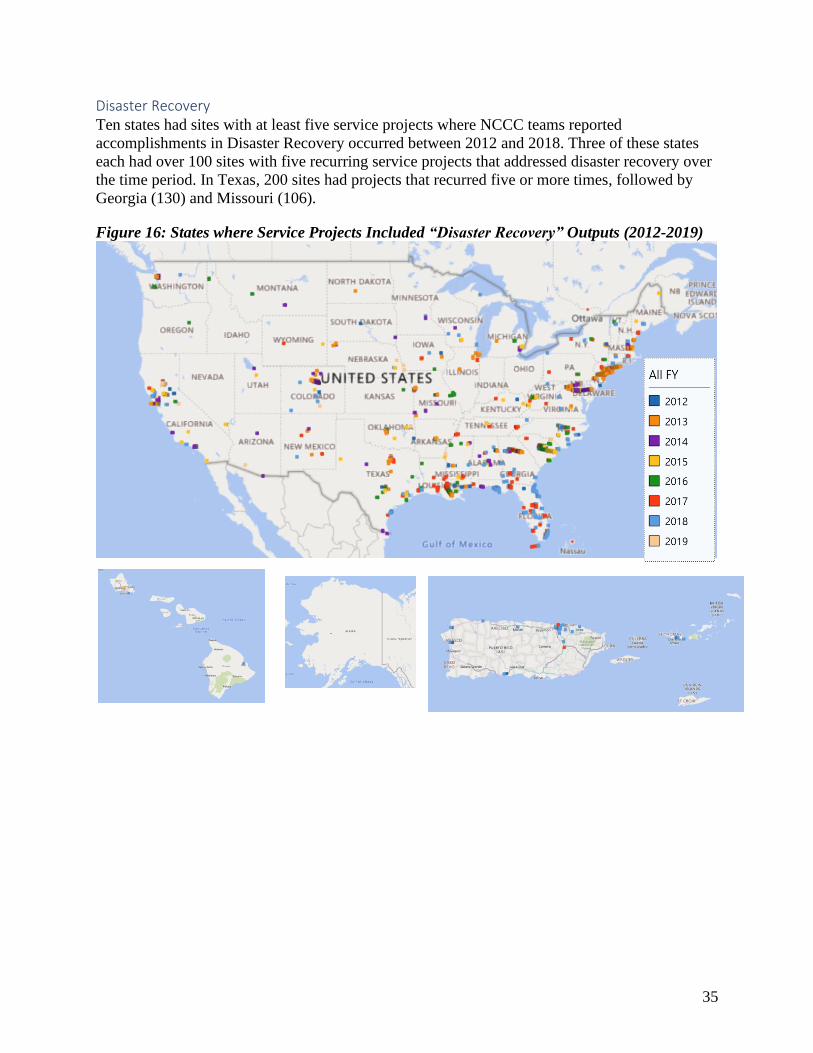
35
Disaster Recovery Ten states had sites with at least five service projects where NCCC teams reported
accomplishments in Disaster Recovery occurred between 2012 and 2018. Three of these states
each had over 100 sites with five recurring service projects that addressed disaster recovery over
the time period. In Texas, 200 sites had projects that recurred five or more times, followed by
Georgia (130) and Missouri (106).
Figure 16: States where Service Projects Included “Disaster Recovery” Outputs (2012-2019)
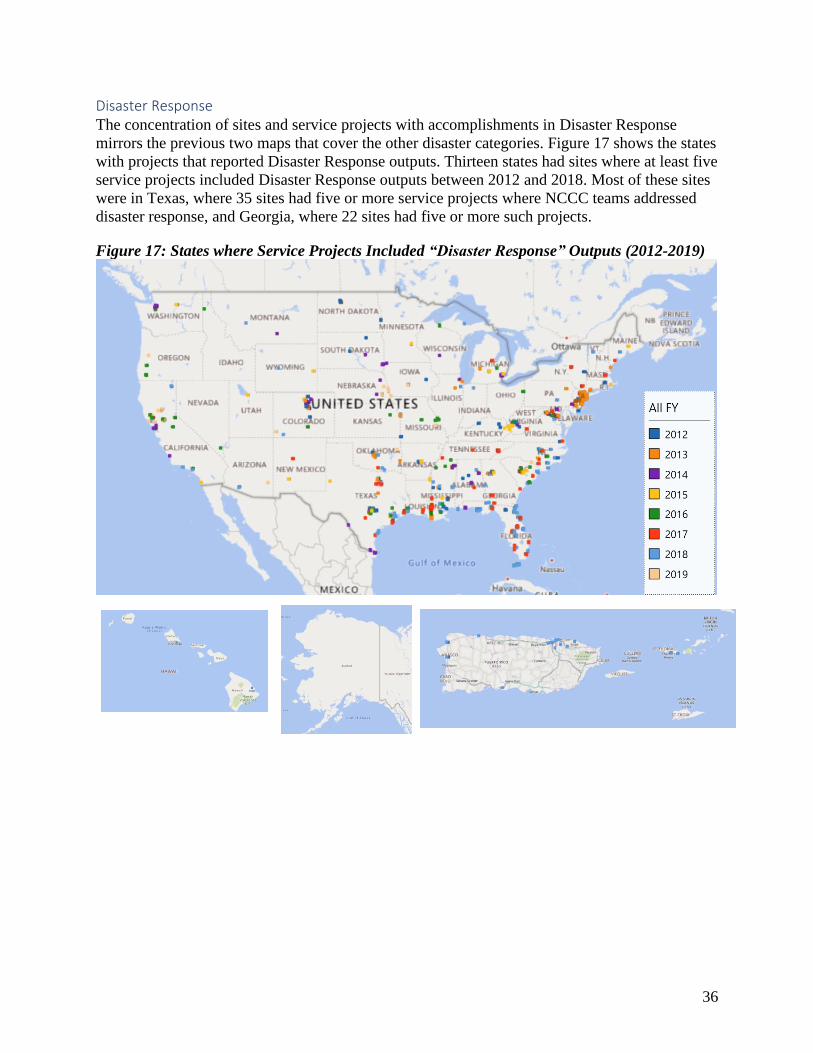
36
Disaster Response The concentration of sites and service projects with accomplishments in Disaster Response
mirrors the previous two maps that cover the other disaster categories. Figure 17 shows the states
with projects that reported Disaster Response outputs. Thirteen states had sites where at least five
service projects included Disaster Response outputs between 2012 and 2018. Most of these sites
were in Texas, where 35 sites had five or more service projects where NCCC teams addressed
disaster response, and Georgia, where 22 sites had five or more such projects.
Figure 17: States where Service Projects Included “Disaster Response” Outputs (2012-2019)
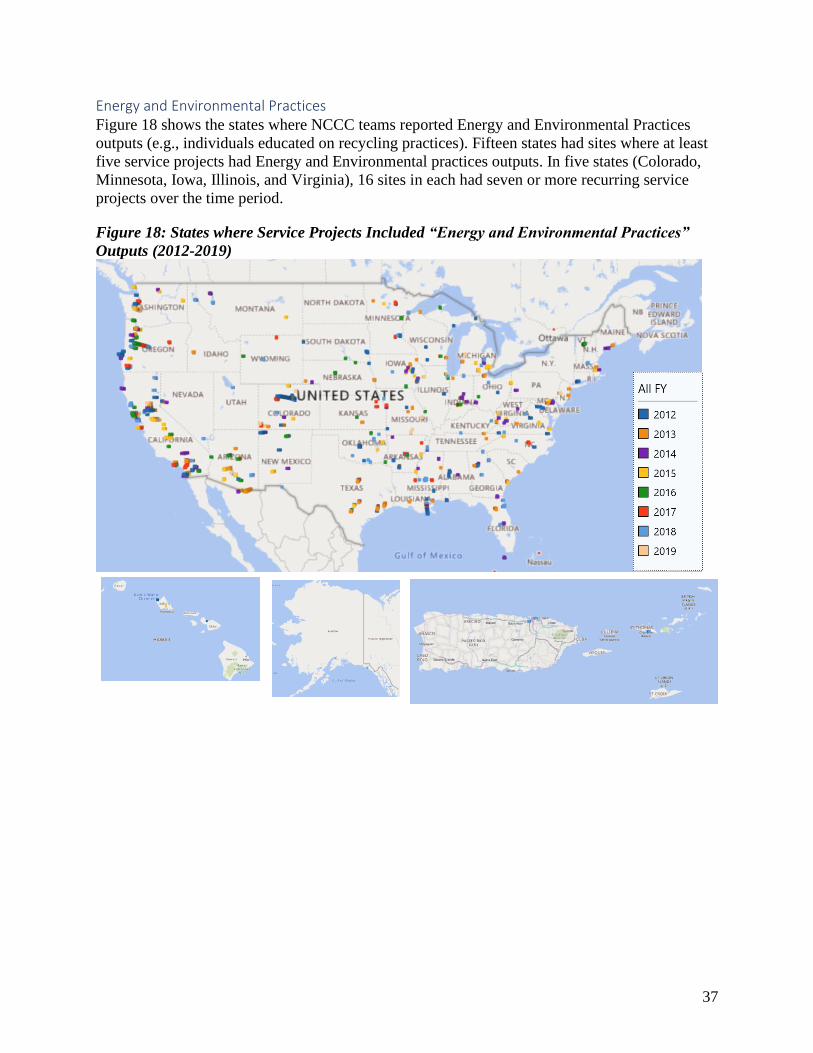
37
Energy and Environmental Practices Figure 18 shows the states where NCCC teams reported Energy and Environmental Practices
outputs (e.g., individuals educated on recycling practices). Fifteen states had sites where at least
five service projects had Energy and Environmental practices outputs. In five states (Colorado,
Minnesota, Iowa, Illinois, and Virginia), 16 sites in each had seven or more recurring service
projects over the time period.
Figure 18: States where Service Projects Included “Energy and Environmental Practices”
Outputs (2012-2019)
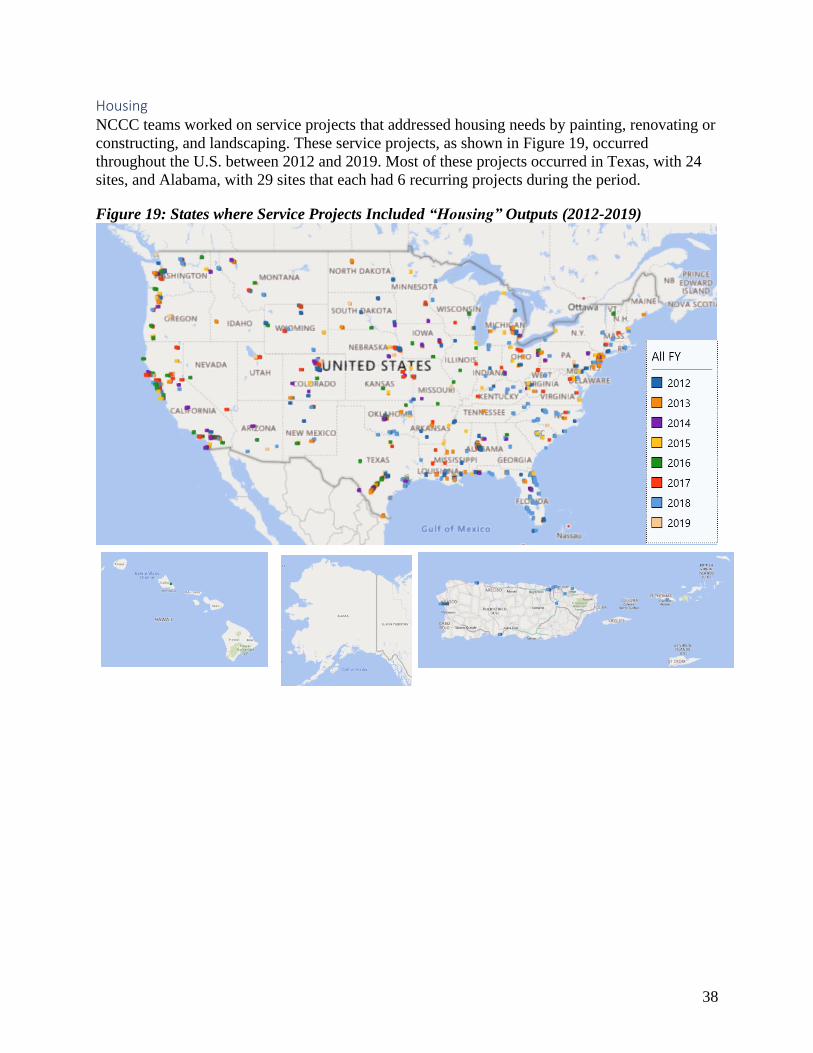
38
Housing NCCC teams worked on service projects that addressed housing needs by painting, renovating or
constructing, and landscaping. These service projects, as shown in Figure 19, occurred
throughout the U.S. between 2012 and 2019. Most of these projects occurred in Texas, with 24
sites, and Alabama, with 29 sites that each had 6 recurring projects during the period.
Figure 19: States where Service Projects Included “Housing” Outputs (2012-2019)
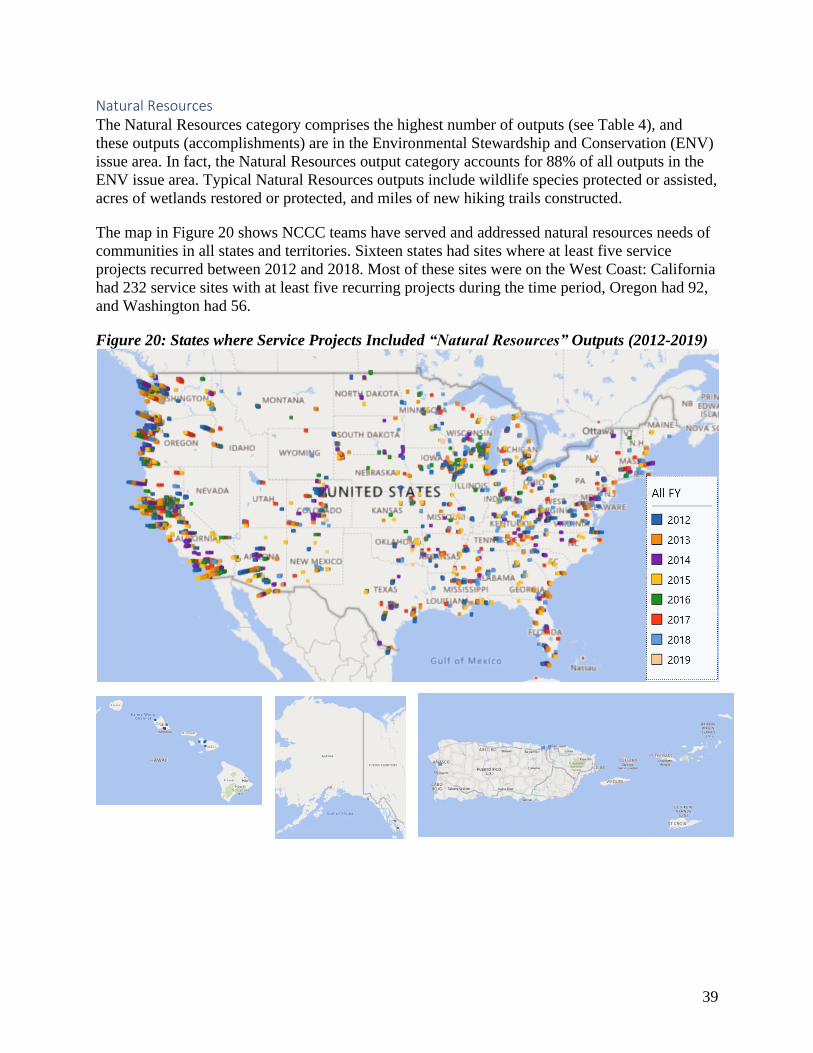
39
Natural Resources The Natural Resources category comprises the highest number of outputs (see Table 4), and
these outputs (accomplishments) are in the Environmental Stewardship and Conservation (ENV)
issue area. In fact, the Natural Resources output category accounts for 88% of all outputs in the
ENV issue area. Typical Natural Resources outputs include wildlife species protected or assisted,
acres of wetlands restored or protected, and miles of new hiking trails constructed.
The map in Figure 20 shows NCCC teams have served and addressed natural resources needs of
communities in all states and territories. Sixteen states had sites where at least five service
projects recurred between 2012 and 2018. Most of these sites were on the West Coast: California
had 232 service sites with at least five recurring projects during the time period, Oregon had 92,
and Washington had 56.
Figure 20: States where Service Projects Included “Natural Resources” Outputs (2012-2019)
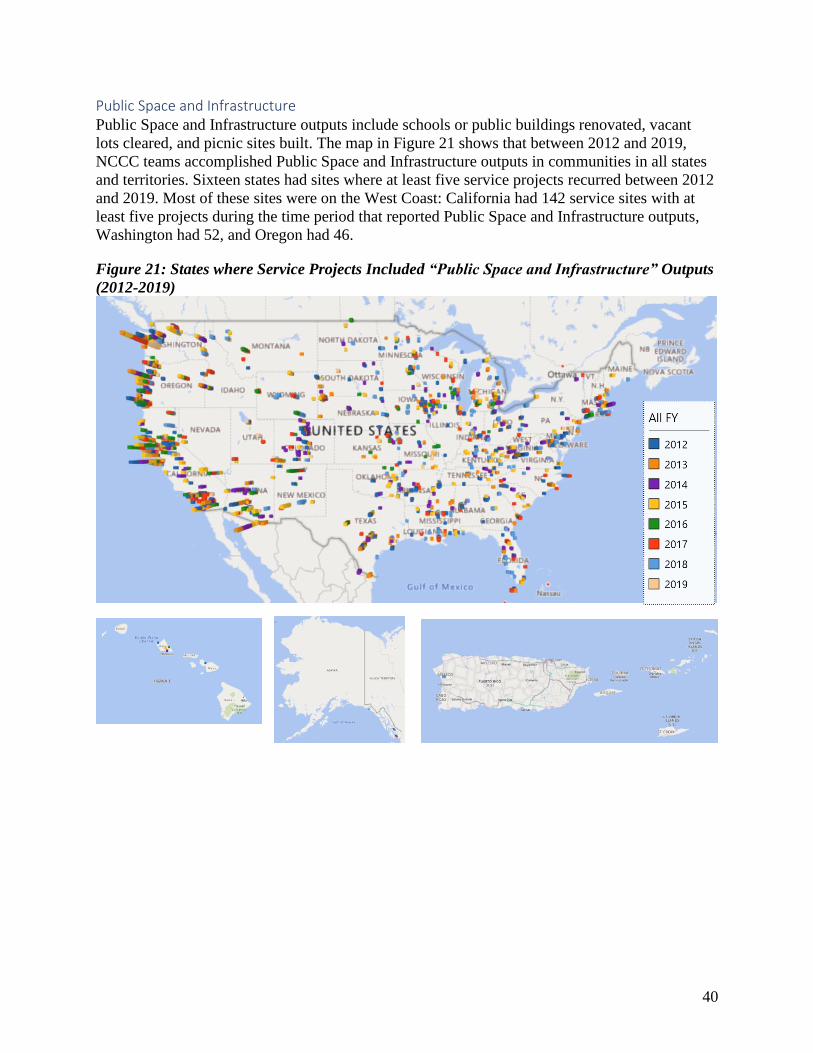
40
Public Space and Infrastructure Public Space and Infrastructure outputs include schools or public buildings renovated, vacant
lots cleared, and picnic sites built. The map in Figure 21 shows that between 2012 and 2019,
NCCC teams accomplished Public Space and Infrastructure outputs in communities in all states
and territories. Sixteen states had sites where at least five service projects recurred between 2012
and 2019. Most of these sites were on the West Coast: California had 142 service sites with at
least five projects during the time period that reported Public Space and Infrastructure outputs,
Washington had 52, and Oregon had 46.
Figure 21: States where Service Projects Included “Public Space and Infrastructure” Outputs
(2012-2019)

41
Special Populations Special Populations include activities to recruit and train volunteers, assist people with
disabilities, seniors, youth, veterans and their families, and individuals experiencing
homelessness. Service projects with Special Populations outputs occurred in every state and
territory. Four states had high numbers of service sites with five or more recurring projects where
Special Populations outputs were reported. California had 58 sites, Washington 41, Alabama 39,
and Georgia 24.
Figure 22: States where Service Projects Included “Special Populations” Outputs (2012-2019)

42
Phased Out Figure 23 shows the states with projects whose outputs have been phased out by CNCS. This
includes 20 outputs; most (16) were in the Education issue area, such as “teen parent programs
presented” and “school hallways painted or renovated.”11 Sixteen states had sites where at least
five service projects occurred between 2012 and 2018. The largest number of sites were in
Colorado (24) and Texas (16).
Figure 23: States where Service Projects Included Outputs that were “Not Categorized” (2012-
2019)
11 A complete list of the 20 phased-out outputs can be found in Appendix B, Table B-32.
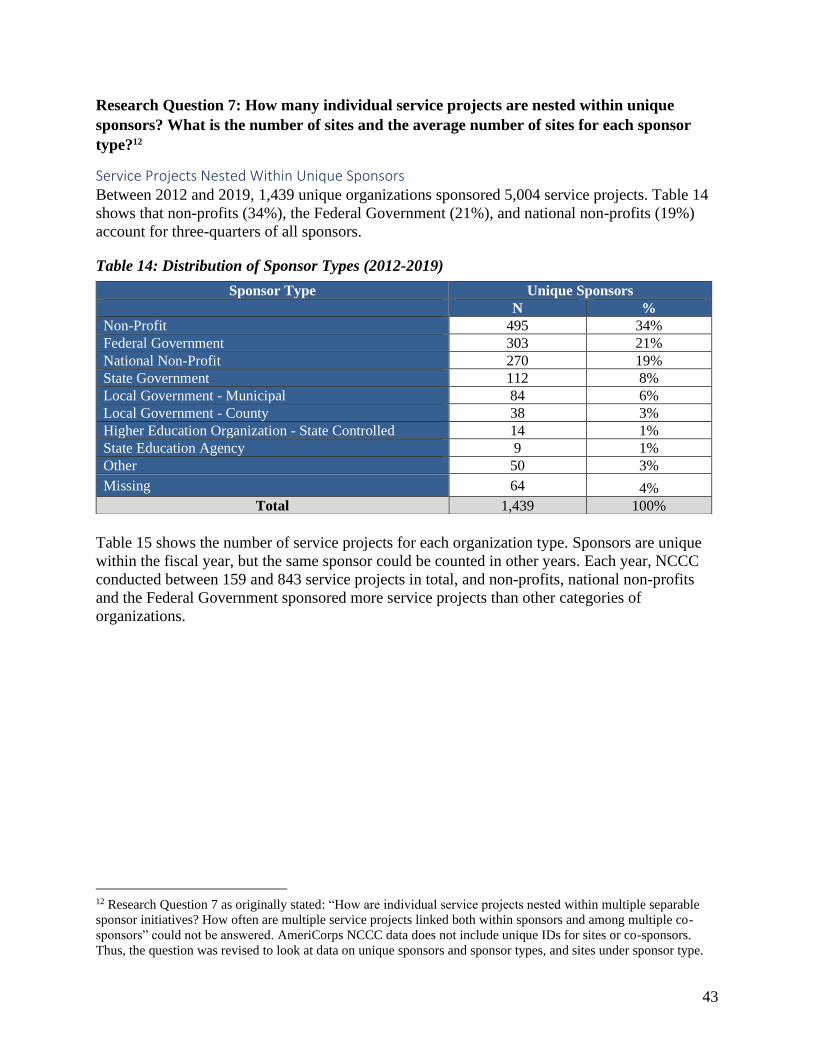
43
Research Question 7: How many individual service projects are nested within unique
sponsors? What is the number of sites and the average number of sites for each sponsor
type?12
Service Projects Nested Within Unique Sponsors Between 2012 and 2019, 1,439 unique organizations sponsored 5,004 service projects. Table 14
shows that non-profits (34%), the Federal Government (21%), and national non-profits (19%)
account for three-quarters of all sponsors.
Table 14: Distribution of Sponsor Types (2012-2019)
Table 15 shows the number of service projects for each organization type. Sponsors are unique
within the fiscal year, but the same sponsor could be counted in other years. Each year, NCCC
conducted between 159 and 843 service projects in total, and non-profits, national non-profits
and the Federal Government sponsored more service projects than other categories of
organizations.
12 Research Question 7 as originally stated: “How are individual service projects nested within multiple separable
sponsor initiatives? How often are multiple service projects linked both within sponsors and among multiple co-
sponsors” could not be answered. AmeriCorps NCCC data does not include unique IDs for sites or co-sponsors.
Thus, the question was revised to look at data on unique sponsors and sponsor types, and sites under sponsor type.
Sponsor Type Unique Sponsors
N %
Non-Profit 495 34%
Federal Government 303 21%
National Non-Profit 270 19%
State Government 112 8%
Local Government - Municipal 84 6%
Local Government - County 38 3%
Higher Education Organization - State Controlled 14 1%
State Education Agency 9 1%
Other 50 3%
Missing 64 4%
Total 1,439 100%
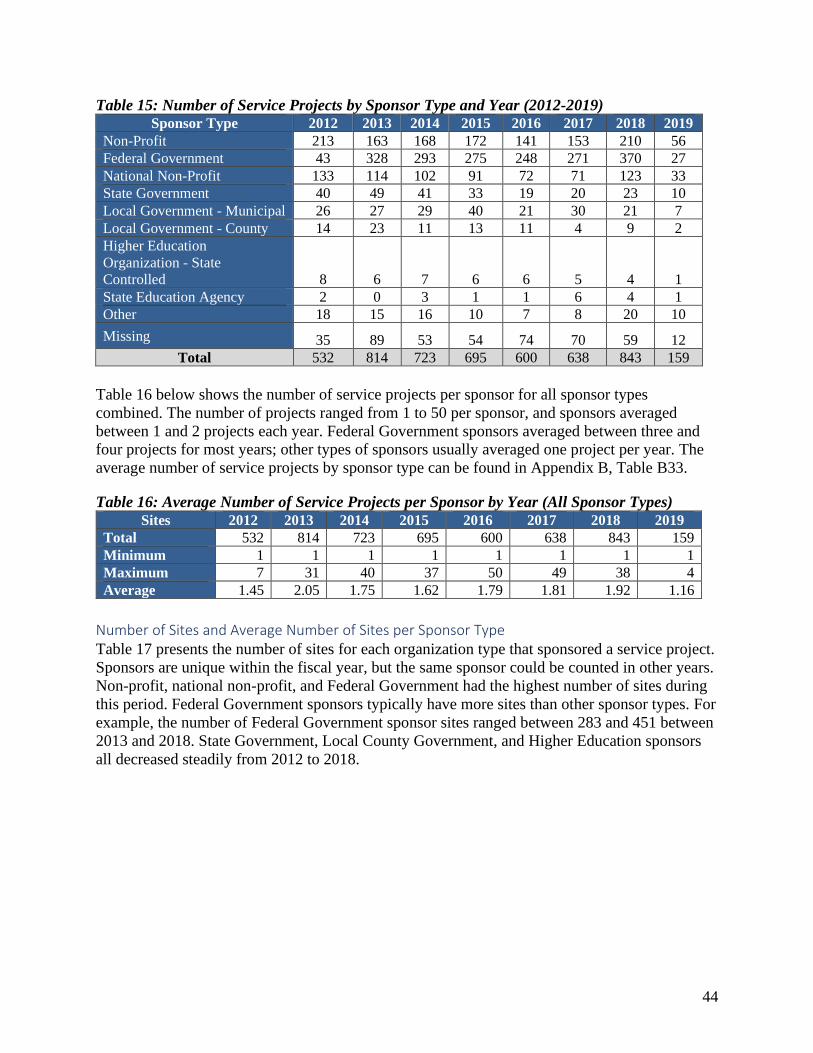
44
Table 15: Number of Service Projects by Sponsor Type and Year (2012-2019) Sponsor Type 2012 2013 2014 2015 2016 2017 2018 2019
Non-Profit 213 163 168 172 141 153 210 56
Federal Government 43 328 293 275 248 271 370 27
National Non-Profit 133 114 102 91 72 71 123 33
State Government 40 49 41 33 19 20 23 10
Local Government - Municipal 26 27 29 40 21 30 21 7
Local Government - County 14 23 11 13 11 4 9 2
Higher Education
Organization - State
Controlled 8 6 7 6 6 5 4 1
State Education Agency 2 0 3 1 1 6 4 1
Other 18 15 16 10 7 8 20 10
Missing 35 89 53 54 74 70 59 12
Total 532 814 723 695 600 638 843 159
Table 16 below shows the number of service projects per sponsor for all sponsor types
combined. The number of projects ranged from 1 to 50 per sponsor, and sponsors averaged
between 1 and 2 projects each year. Federal Government sponsors averaged between three and
four projects for most years; other types of sponsors usually averaged one project per year. The
average number of service projects by sponsor type can be found in Appendix B, Table B33.
Table 16: Average Number of Service Projects per Sponsor by Year (All Sponsor Types)
Sites 2012 2013 2014 2015 2016 2017 2018 2019
Total 532 814 723 695 600 638 843 159
Minimum 1 1 1 1 1 1 1 1
Maximum 7 31 40 37 50 49 38 4
Average 1.45 2.05 1.75 1.62 1.79 1.81 1.92 1.16
Number of Sites and Average Number of Sites per Sponsor Type Table 17 presents the number of sites for each organization type that sponsored a service project.
Sponsors are unique within the fiscal year, but the same sponsor could be counted in other years.
Non-profit, national non-profit, and Federal Government had the highest number of sites during
this period. Federal Government sponsors typically have more sites than other sponsor types. For
example, the number of Federal Government sponsor sites ranged between 283 and 451 between
2013 and 2018. State Government, Local County Government, and Higher Education sponsors
all decreased steadily from 2012 to 2018.
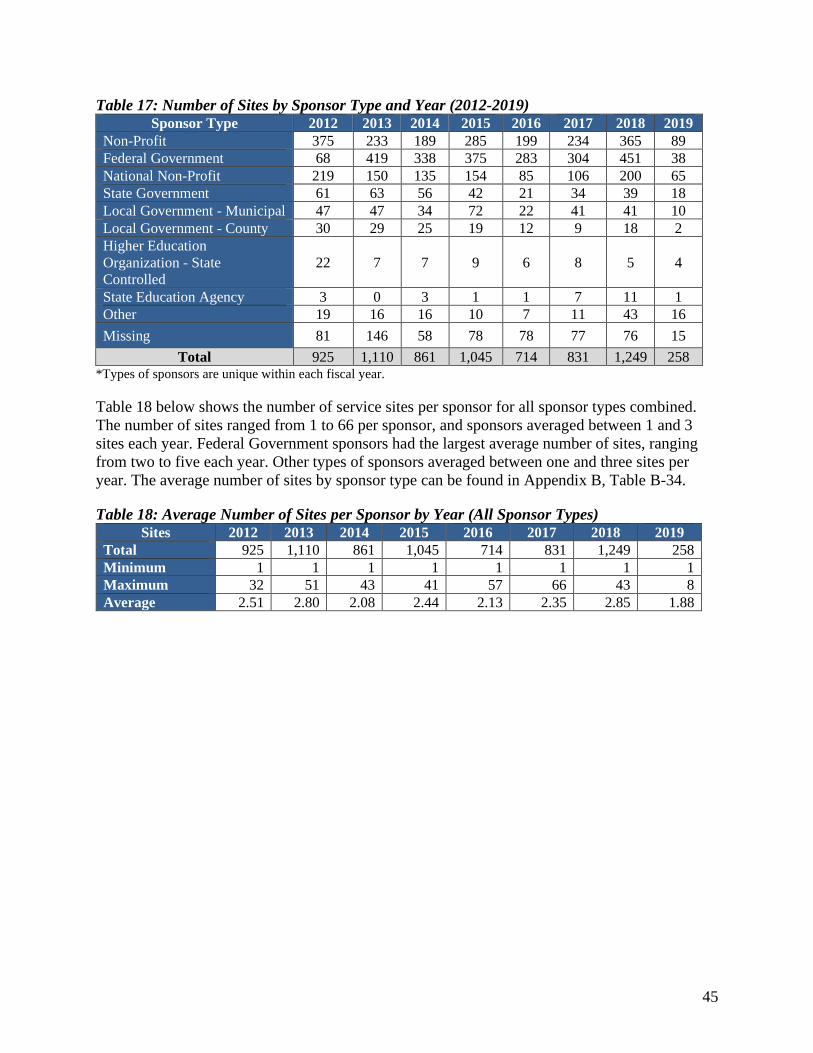
45
Table 17: Number of Sites by Sponsor Type and Year (2012-2019) Sponsor Type 2012 2013 2014 2015 2016 2017 2018 2019
Non-Profit 375 233 189 285 199 234 365 89
Federal Government 68 419 338 375 283 304 451 38
National Non-Profit 219 150 135 154 85 106 200 65
State Government 61 63 56 42 21 34 39 18
Local Government - Municipal 47 47 34 72 22 41 41 10
Local Government - County 30 29 25 19 12 9 18 2
Higher Education
Organization - State
Controlled
22 7 7 9 6 8 5 4
State Education Agency 3 0 3 1 1 7 11 1
Other 19 16 16 10 7 11 43 16
Missing 81 146 58 78 78 77 76 15
Total 925 1,110 861 1,045 714 831 1,249 258 *Types of sponsors are unique within each fiscal year.
Table 18 below shows the number of service sites per sponsor for all sponsor types combined.
The number of sites ranged from 1 to 66 per sponsor, and sponsors averaged between 1 and 3
sites each year. Federal Government sponsors had the largest average number of sites, ranging
from two to five each year. Other types of sponsors averaged between one and three sites per
year. The average number of sites by sponsor type can be found in Appendix B, Table B-34.
Table 18: Average Number of Sites per Sponsor by Year (All Sponsor Types) Sites 2012 2013 2014 2015 2016 2017 2018 2019
Total 925 1,110 861 1,045 714 831 1,249 258
Minimum 1 1 1 1 1 1 1 1
Maximum 32 51 43 41 57 66 43 8
Average 2.51 2.80 2.08 2.44 2.13 2.35 2.85 1.88

46
Strengthening Communities and Impact on Members NCCC teams provide narrative on each of their service projects. These narratives are recorded in
the PCR. The two types of narratives are the community impact narrative on community benefits
and the Member impact narrative on Member benefits. We thematically coded these narratives to
capture and measure the impacts NCCC service has on communities and Members. We also
look specifically at service projects involved in disaster preparation, mitigation, recovery, and
response and their effect on the communities. Last, we look at the impact of NCCC service on
the communities and the sponsoring organizations themselves in terms of building capacity.
Research Question 8: What does the data show on how NCCC projects impact and
strengthen communities? What does the data show on how NCCC projects impact
Members? Do these impacts vary and, if so, how?
Impact on Communities of NCCC Projects In order to answer this question, we qualitatively analyzed community impact statements from
CNCS narrative data files by applying codes developed through an initial sampling of projects.
Our analysis showed several themes across NCCC service projects, such as direct impacts to
communities; tangible and intangible benefits to individuals in communities; tangible and
intangible benefits to organizations; enhanced disaster prevention, preparedness, and mitigation;
and assistance with disaster recovery.
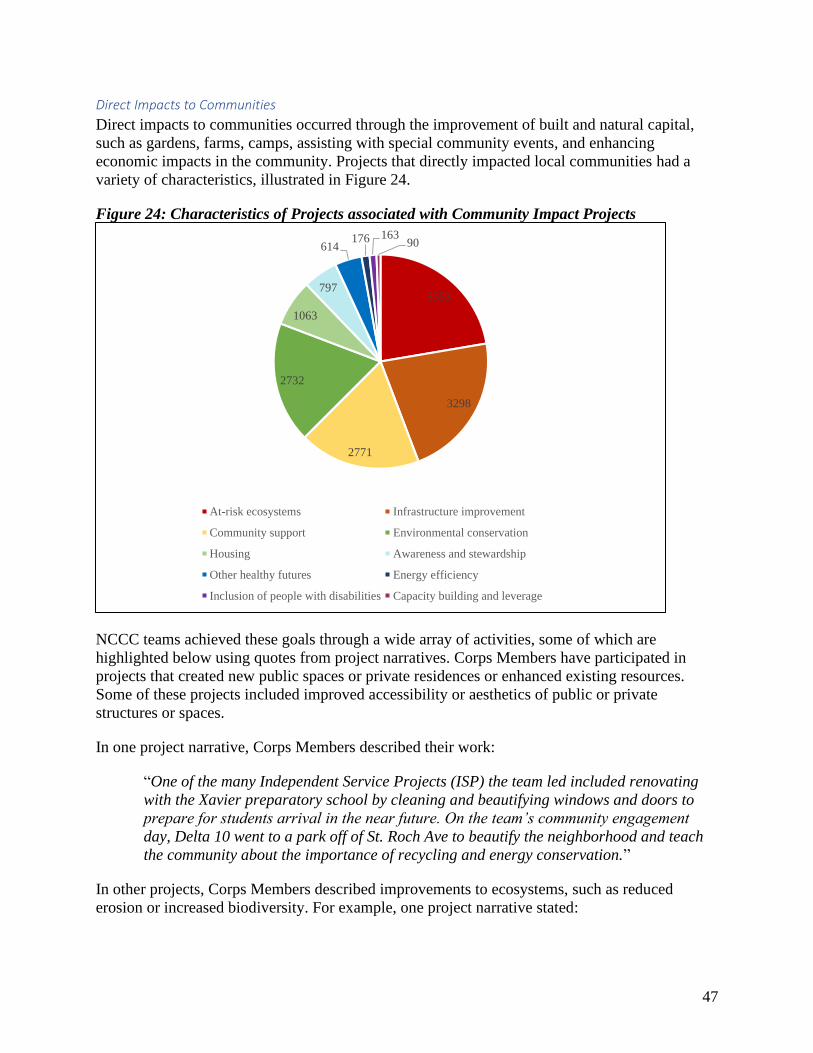
47
Direct Impacts to Communities
Direct impacts to communities occurred through the improvement of built and natural capital,
such as gardens, farms, camps, assisting with special community events, and enhancing
economic impacts in the community. Projects that directly impacted local communities had a
variety of characteristics, illustrated in Figure 24.
Figure 24: Characteristics of Projects associated with Community Impact Projects
NCCC teams achieved these goals through a wide array of activities, some of which are
highlighted below using quotes from project narratives. Corps Members have participated in
projects that created new public spaces or private residences or enhanced existing resources.
Some of these projects included improved accessibility or aesthetics of public or private
structures or spaces.
In one project narrative, Corps Members described their work:
“One of the many Independent Service Projects (ISP) the team led included renovating
with the Xavier preparatory school by cleaning and beautifying windows and doors to
prepare for students arrival in the near future. On the team’s community engagement
day, Delta 10 went to a park off of St. Roch Ave to beautify the neighborhood and teach
the community about the importance of recycling and energy conservation.”
In other projects, Corps Members described improvements to ecosystems, such as reduced
erosion or increased biodiversity. For example, one project narrative stated:
3353
3298
2771
2732
1063
797
614176 163
90
At-risk ecosystems Infrastructure improvement
Community support Environmental conservation
Housing Awareness and stewardship
Other healthy futures Energy efficiency
Inclusion of people with disabilities Capacity building and leverage
48
“In addition, the team was instrumental in coalescing with the U.S. Forest Service
(USFS) to accomplish the reclaiming of several popular campsites in Homestake and the
surrounding area that had been depleted of its natural state due to excessive foot and
vehicle traffic. Essentially, specific campsites were being rehabbed after heavy
machinery churned the soil, which allowed Sun Four to plant 110 lodgepole pine trees
and to tend to 180 freshly planted trees by watering them. Moreover, Members
implemented four simplistic water bars to obstruct unnatural water flow as a result of
motor vehicle tracks that were contributing to further erosion and runoff flowing into the
river in the mountains of Piney Lake. Lastly, the team restored 36 feet of riverbank with
the USFS by extracting and fastening together willow bundles that were staked at the
river’s edge and in total assisted in 8.5 acres of wildlife habitat restoration.”
Some NCCC projects contributed to the addition of or improvements to community gardens or
farms. For example, one NCCC team serving at a camp reported the following:
“Cedar 1 worked with Feed Iowa First in Cedar Rapids, IA for one week. They planted
fresh fruits and vegetables such as watermelons, strawberries, peas, tomatoes, peppers,
onions, bok choy, Chinese string beans, lettuce, kale, broccoli, cabbage, and cauliflower.
First, one Member tilled the rows of empty land where the vegetables were going to be
planted. Then, two people dug holes on each side of the row and another two people
would bring the plants to put them in the ground and cover them with soil. They also
helped the current crops by weeding around them. Cedar 1 made it possible to till the
ground by mowing the grass. They also weed whacked around the shed and areas the
riding mower could not reach. To ensure proper growth and support, stakes need to be
placed next to tomato plants. One Member cut pieces of rebar to the correct length and
another Member hammered them into the ground at every third tomato plant.”
A number of NCCC projects also provided specific support for improving the built and natural
capital at camps. For example, one project reported:
“After a winter storm in 2012 that took down over a hundred trees, Camp Zanika has
been cluttered with unwanted debris that also acts as fuel for fire. Silver Seven was able
to reduce the fuel level in the surrounding forests of the camp, while also taking an active
part in the camp sessions. In total the team burned 1,751 pounds of that unwanted debris,
clearing an area of 6.5 acres. The project also consisted of camp beautification, in which
the team repainted 13 different cabins. The team interacted with the ongoing summer
camp sessions, shadowing counselors and helping to conduct the programs. In hopes to
develop Camp Zanika’s environmental education program, the team constructed 1
birdhouse-type box that children will be able to deposit their questions about the natural
world into in order to get a written response from the nature director.”
Another area of direct impacts to the community is assistance NCCC teams provide to special
community events. The activities NCCC teams assisted with include event preparation, set up,
and clean up. Some of these events were aimed at awareness or fundraising; for example, one
team reported:
49
“Silver Six’s main project with the Noyo Food Forest was preparing for and facilitating the
2013 Earth Day Festival. The Earth Day Festival is the Noyo Food Forest’s annual major
community outreach and fundraising event. Leading up to the festival, the team worked on
beautification and infrastructure improvement projects to prepare the garden for community
members attending the festival and businesses providing services throughout the event. The team
laid 400 pounds of mulch, cleared paths and beds of grass and weeds totaling 600 pounds,
transplanted 1,750 flowers and vegetables, and painted 32 signs. During the Earth Day Festival,
Silver Six provided operational and logistical support to the Noyo Food Forest by greeting and
assisting 750 visitors, setting up booths for vendors, serving soup, chili, and coffee, picking up
trash, assisting with plant sales, recruiting children to help paint 1 community mural, and
helping with other general tasks throughout the day.”
Other events NCCC teams supported included volunteer days; one team wrote, “Finally, Maple
2 completed a Community Day in Hamilton County in collaboration with Hamilton County
Convention and Visitor’s Bureau. The team organized volunteers to paint 5 rooms in a historic
home and create a rain garden along with other landscaping improvements.”
Finally, some NCCC projects helped to provide economic benefits to communities in which they
worked. For example, one project reported:
“About 350,000 visitors each year make their way to West Texas to visit Big Bend
National Park and see the Chihuahuan Desert, one of the richest examples of North
American desert. Maintaining and improving trails will enable more visitors to learn
about the vast desert and cultural history of the Big Bend region. Big Bend crews and the
AmeriCorps NCCC team addressed the need for great trails that will allow for
exploration by Members of communities from all over the nation. Big Bend National Park
is surrounded by Brewster County; the county, though immense, has only 15,000
inhabitants who depend on the tourism generated by the park to make a living. Corps
Members helped to create a viable income for the local residents and at the same time
provided those same residents a park to enjoy. Additionally, the Big Bend Trail recycling
program offers local communities a place to recycle, for free, thus improving the local
community's awareness and environment.”
Tangible and Intangible Benefits to Individuals
Tangible Benefits to Individuals Our analysis showed NCCC projects had tangible benefits to individuals through improved
access to food, water, clothing, health care, shelter, or other basic needs. Characteristics of
projects that provided tangible benefits to individuals are shown in Figure 25. Common impacts
of these projects are illustrated below using project narrative quotes.
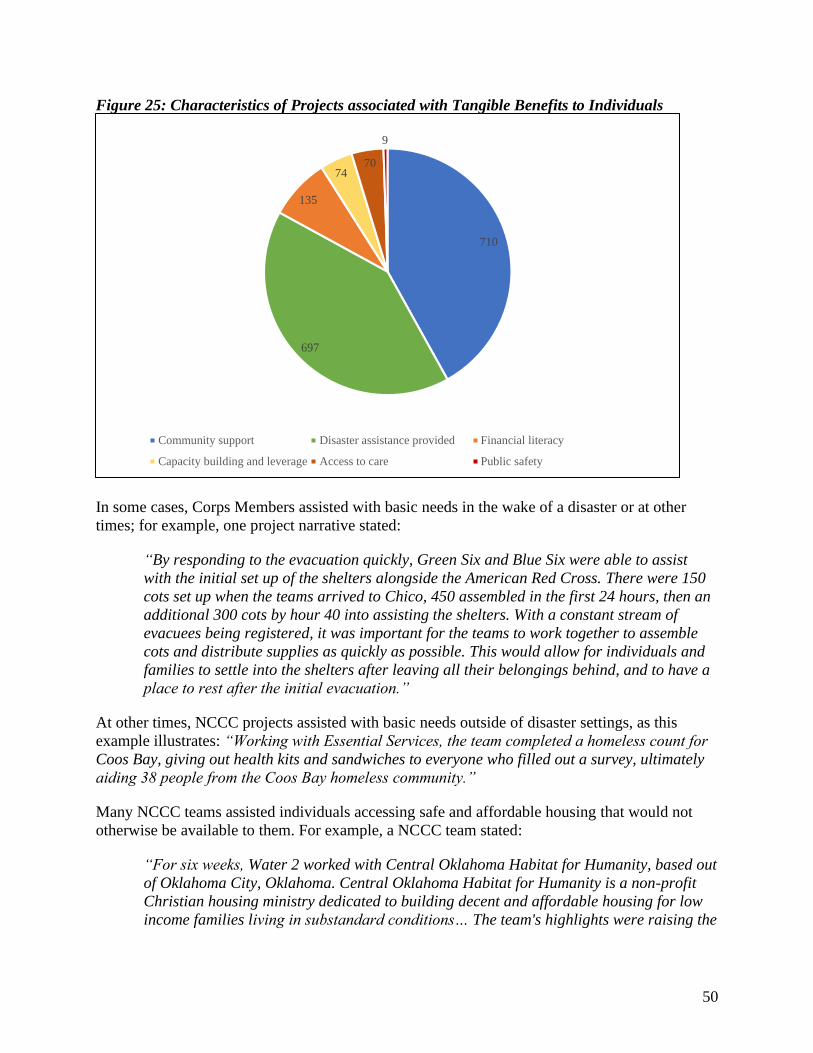
50
Figure 25: Characteristics of Projects associated with Tangible Benefits to Individuals
In some cases, Corps Members assisted with basic needs in the wake of a disaster or at other
times; for example, one project narrative stated:
“By responding to the evacuation quickly, Green Six and Blue Six were able to assist
with the initial set up of the shelters alongside the American Red Cross. There were 150
cots set up when the teams arrived to Chico, 450 assembled in the first 24 hours, then an
additional 300 cots by hour 40 into assisting the shelters. With a constant stream of
evacuees being registered, it was important for the teams to work together to assemble
cots and distribute supplies as quickly as possible. This would allow for individuals and
families to settle into the shelters after leaving all their belongings behind, and to have a
place to rest after the initial evacuation.”
At other times, NCCC projects assisted with basic needs outside of disaster settings, as this
example illustrates: “Working with Essential Services, the team completed a homeless count for
Coos Bay, giving out health kits and sandwiches to everyone who filled out a survey, ultimately
aiding 38 people from the Coos Bay homeless community.”
Many NCCC teams assisted individuals accessing safe and affordable housing that would not
otherwise be available to them. For example, a NCCC team stated:
“For six weeks, Water 2 worked with Central Oklahoma Habitat for Humanity, based out
of Oklahoma City, Oklahoma. Central Oklahoma Habitat for Humanity is a non-profit
Christian housing ministry dedicated to building decent and affordable housing for low
income families living in substandard conditions… The team's highlights were raising the
710
697
135
7470
9
Community support Disaster assistance provided Financial literacy
Capacity building and leverage Access to care Public safety

51
walls of 3 new homes, painting and cleaning 10 homes, and participating in the
dedication of two new homes given to a family.”
The contributions of NCCC teams may have supported individuals’ physical health and safety
within those communities. One project reported, “Green Two partnered with Oregon State
University KidSpirit, clearing out a gymnasium as well as sanitizing a gymnastics studio. The
team helped to make the gym a safer, cleaner environment for the children that use the studio
space.”
A team helping to muck and gut houses stated, “Because of the teams work the homes would be
able to be treated for mold control and there would not be further risks to the family’s health
making a healthier and therefore happier community.”
A team that worked on trail repair and maintenance noted, “The team also repaired 2 foot
bridges on the trail to make them safer for campers and their guardians.”
Some of the NCCC teams also helped individuals complete their tax forms, enabling them to
obtain tax refunds. For example:
“Delta 4 strengthen the community of Memphis, as well as all the other cities that they
visited and served, by putting $362,009 in tax refunds back into the pockets of citizens.
322 tax returns were completed, processed, and approved; this is significant because
those are 322 families and individuals who would have otherwise not been able to file
their taxes due to lack of resources or knowledge. With the assistance of an AmeriCorps
team new sites were opened by United Way in areas where individuals have a more
difficult time completing their taxes. The presence of AmeriCorps NCCC increased
community awareness around sites and financial resources that can be utilized in the
years to come.”
Finally, some NCCC projects helped to provide economic and financial benefits to individuals.
For example, some of the home repair projects that NCCC teams took on allowed home owners
to avoid paying for costly services: “The mucking and gutting services that Delta 6 provided
allowed for homeowners to save money as well.”
In other cases, home repairs may have long-term economic benefits for homeowners as this
narrative illustrates: “Providing insulation allows for lower energy costs by not spending as
much on heating and cooling for the home. The insulation was provided for residents that were
low-income households and many of those residents are elderly. By saving money on energy
costs, these residents are able to use that money on essential items like medications and food.”
Intangible Benefits to Individuals Our analysis showed intangible benefits of NCCC projects to Members of the communities in the
form of psychosocial benefits and increases in human capital and learning. The characteristics of
projects that provided intangible benefits to individuals are illustrated in Figure 26. The variety
of impacts these projects had on individuals is illustrated below through the project narrative
quotes.
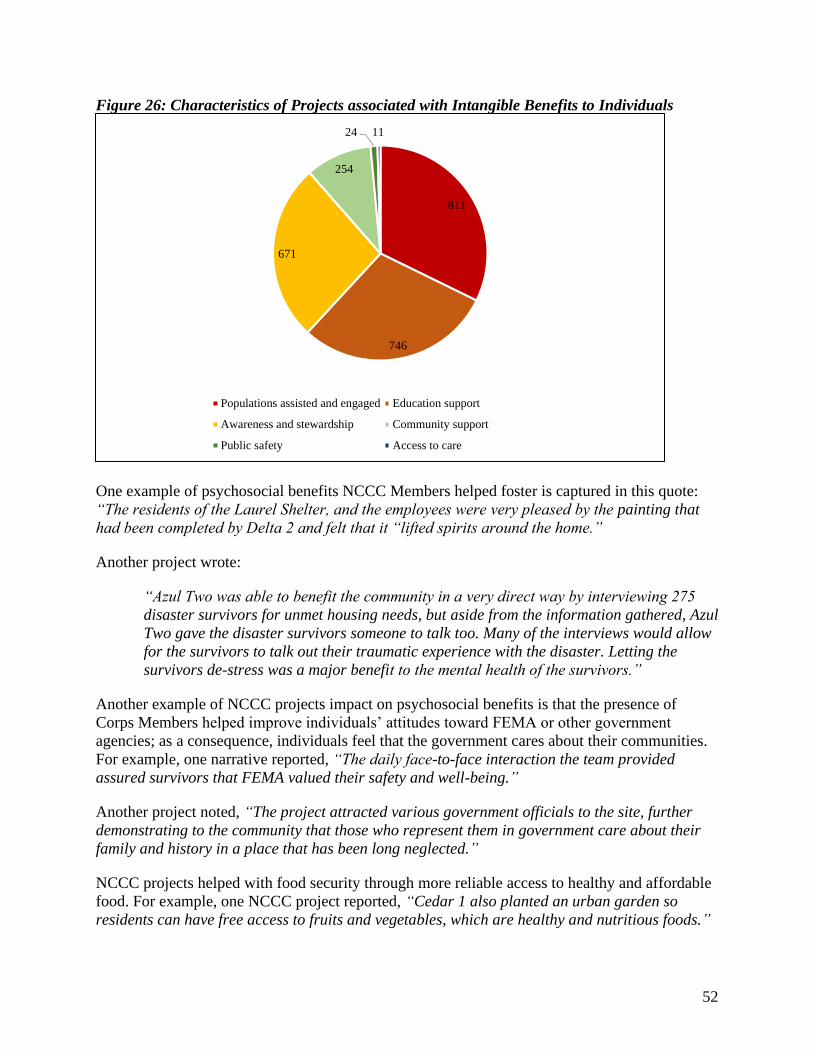
52
Figure 26: Characteristics of Projects associated with Intangible Benefits to Individuals
One example of psychosocial benefits NCCC Members helped foster is captured in this quote:
“The residents of the Laurel Shelter, and the employees were very pleased by the painting that
had been completed by Delta 2 and felt that it “lifted spirits around the home.”
Another project wrote:
“Azul Two was able to benefit the community in a very direct way by interviewing 275
disaster survivors for unmet housing needs, but aside from the information gathered, Azul
Two gave the disaster survivors someone to talk too. Many of the interviews would allow
for the survivors to talk out their traumatic experience with the disaster. Letting the
survivors de-stress was a major benefit to the mental health of the survivors.”
Another example of NCCC projects impact on psychosocial benefits is that the presence of
Corps Members helped improve individuals’ attitudes toward FEMA or other government
agencies; as a consequence, individuals feel that the government cares about their communities.
For example, one narrative reported, “The daily face-to-face interaction the team provided
assured survivors that FEMA valued their safety and well-being.”
Another project noted, “The project attracted various government officials to the site, further
demonstrating to the community that those who represent them in government care about their
family and history in a place that has been long neglected.”
NCCC projects helped with food security through more reliable access to healthy and affordable
food. For example, one NCCC project reported, “Cedar 1 also planted an urban garden so
residents can have free access to fruits and vegetables, which are healthy and nutritious foods.”
811
746
671
254
24 11
Populations assisted and engaged Education support
Awareness and stewardship Community support
Public safety Access to care

53
Another project reported:
“The main goal set out for the team consisted of preparing Revision International's two urban
vegetable farms, the Somali-Bantu Farm and Kepner Community Farm, for the upcoming
season. This involved raking, weeding, sifting and spreading compost, adding fertilizer, turning
soil, and planting in the plant beds. The team was also responsible for planting, thinning,
transplanting, fertilizing and watering 10,000 vegetable and herb seedlings. These seedlings are
to be sold in weekly seedling sales, for community members to use. The seedlings will also be
used in their 300+ backyard gardens, and will be planted at the two farms to be harvested for
their Community Supported Agriculture (CSA) farm shares. These uses help provide
opportunities for community members to develop a nutritious diet. Fire 1 was also responsible
for seed inventory and distribution for the twelve community teachers, or promotoras, who will
educate backyard garden owners and aid in the planting of their gardens.”
Many NCCC projects promoted human capital and learning by teaching new skills to members
of the communities. A NCCC team working on an energy conservation-focused project with
adult members of the community reported: “This will improve air quality and slow contributions
to global warming. Educating the public on energy conservation and renewable resources will
have similar benefits. If the people who have been educated put their education into practice they
can both save themselves money and reduce their environmental impact.”
Another NCCC team working on a project with children and young people reported, “Blue Two
served at a community event in which they taught children how to plant trees. This educational
experience may impact the mindset of these children as they grow older to bolster a more
environmentally-conscious generation.”
NCCC teams tutored, mentored, supported or helped students with educational curriculum and
materials. For example, one NCCC team worked directly in schools and reported the following
activities: “River 5 taught and coached the children how to play soccer, flag football, volleyball,
basketball, prison ball, and capture the flag. River 5 also provided Zumba lessons for the
children and preformed various callisthenic routines. In addition, River 5 helped the children
learn math and read. River 5 also took the children at MQFCO on various field trips.”
Another team worked to help local law enforcement officers access education about disability
integration: “The members also researched training opportunities for Law Enforcement
personnel to attend in order to become more educated in disability integration and
coordination.”
Finally, NCCC teams helped to engage and support individuals who worked as volunteers with
community organizations. For example, one team helped to registre a large number of volunteers
for an environmentally-focused nonprofit: “At this event, Maple 7 registered 440 community
volunteers from the Quad City area in the three-day expo event. Maple 7 worked alongside the
community volunteers to supervise, educate and teach individuals about the tree wrapping
process.”
Another team working on a home-building project reported, “7 had the opportunity to
coordinate volunteer groups ranging from 10-30 people. By becoming the lead on separate

54
tasks, the team was able to efficiently and effectively get more done for the project site and help
the site supervisor maintain a safe work environment.”
Benefits to Specific Populations NCCC projects also provided support and benefits to specific populations. These populations
included individuals in crisis (like disaster survivors and those experiencing homelessness),
veterans, the elderly, people with disabilities, at-risk youth, immigrants and refugees, and others.
Projects that provided benefits to specific populations had a variety of characteristics, illustrated
in Figure 27. Driven by these goals, projects conducted an array of activities, with some of the
key types of activities and impacts illustrated using the project narratives below.
Figure 27: Characteristics of Projects associated with Benefits to Specific Populations
Some NCCC projects assisted individuals affected by disasters and other crises. For example, a
NCCC team assisting individuals in response to Hurricane Isaac reported:
“First, Oak 3 was assigned to a client shelter in Shreveport, LA. The gym at the LSUS
(Louisiana State University of Shreveport) campus provided shelter for clients who
evacuated their town, before the hurricane hit. Here, the team supported the operation by
serving breakfast, lunch, and dinner, to a gross total of 98 clients. In addition, Members
interacted with the 31 youth, to make it easier for the parents who were very concerned
for their homes.”
Another team reported, “Pine 5 informed survivors of the full range of services available (such
as the phone number for receiving mold kits and where to seek alternative shelter), registered
those who suffered damages to their property with FEMA, and provided referrals to whole
community partners.”
1134
6647
101
Populations assisted and engaged Capacity building and leverage
Access to care Disaster assistance provided
Housing
55
In addition to assisting disaster survivors, NCCC teams also provided support to individuals and
families experiencing homelessness. One team reported :
“Gold Four received and sorted 7250 pounds of household goods and 7500 pounds of
clothing received and sorted. At the Midvale Family Shelter, Gold Four received and
sorted through 1525 pounds of clothing for the homeless families. At the Midvale Family
Shelter, the team helped clean 35 beds in the dorm area for incoming families. During
Gold Four’s stay at The Road Home they were able to distribute 1000 pounds of food for
the Homeless clients and 250 pounds of food was distributed at the Midvale location.”
Another project reported, “Cedar 1 helped the Eastside Mission with different projects, such as
assisting in the kitchen to serve the homeless or disadvantaged, and sorting clothes for their
clothing shop. Families are able to get clothing at no cost, giving them the opportunity to dress
appropriately for interviews, special occasions, and day-to-day activities.”
Some NCCC projects focused on serving the veteran community. One project reported:
“In the Westwood Community, the team cut down and removed 1250 pounds of unwanted
vegetation from one veteran's back yard, replaced the broken siding on his house, and
primed and painted the whole exterior. The team also wrote and designed a banner,
which they presented at a community Veterans Day gathering, where they served 24
veterans and their family Members lunch.”
NCCC projects also supported a range of other vulnerable populations. Some projects provided
assistance to people with disabilities. NCCC teams supported individuals with both physical and
intellectual disabilities. One project described its team’s experience:
“Most of the team’s time and effort was devoted to assisting other staff Members in
providing childcare for 22 visually impaired or blind children and 13 siblings ranging in
ages from 8 months old to 18 years old, so that parents could attend the workshops and
sessions. Members of Maple 6 were divided among multiple rooms throughout the Braille
School where they were able to care for the children. These rooms provided the children
with varied environments and activities such as a game room and an arts and crafts
room. The team also assisted the children with eating, communicating, and traveling
throughout the buildings.”
Other projects assisted the elderly, at-risk youth, immigrants, refugees, and Native American
individuals and communities. For example, one project described its work with unaccompanied
alien children (UAC – also known as unaccompanied minors), writing, “We received donated
toys, supplies and training from Save the Children and utilized this support to better the children
under Border Patrol’s supervision. We provided recreational and educational activities to the
UAC, we were able to enrich the lives of children caught in a challenging situation.”
Another project worked with at-risk youth, writing:
“The team assisted in total 200 cadets, male and female, considered at-risk youth. River
One did so through teaching the Boys & Girls Club of America’s financial literacy
course “Money Matters” to each cadet. The corps Members tutored these same 200

56
cadets in Health and English classes, putting in around 1120 total tutoring hours as a
team.”
Another project wrote:
“Youth Members of these various clubs, but especially the Moody County Boys and Girls Club
and the Santee Sioux Tribe Tribal Education Youth Center, face persistent issues of summer
learning loss through lack of out of school academic engagement, inconsistent meals/poor
nutrition at home, and lack of stable/regular positive role models in their personal lives.
Assisting in facilitating the programs which Maple 4 took part in, managing the summer food
grant program, and spending time engaging with youth in a range of contexts improves the well-
being of club youth and directly addresses community needs identified by the sponsor. Giving
youth the competence, confidence, and well-being to succeed in the immediate and long term,
fosters the development of youth who are better able to mature into adulthood, which leads to a
community of more engaged and positive community members.”
In many cases, NCCC projects supported multiple vulnerable populations through their work.
For example, one project reported:
“River 1 worked to help disabled, elderly, and veteran community members finish taxing and
laborious work on the way to finalizing their homes and returning them to pre-flood conditions.
One corps member worked on the completion of several phases of a house owned by a disabled
veteran, seeing a before and after of a nearly four week project.”
Tangible and Intangible Benefits to Organizations
Many NCCC projects supported organizations that serve communities, allowing those
organizations to spend more time serving their target populations.
Tangible Benefits to Organizations NCCC projects served organizations in a variety of tangible ways. These projects had
characteristics focused primarily around Capacity Building and Leverage, though all of the
characteristics of these projects are shown in Figure 28. Common impacts of these projects are
described below using quotes from project narratives.
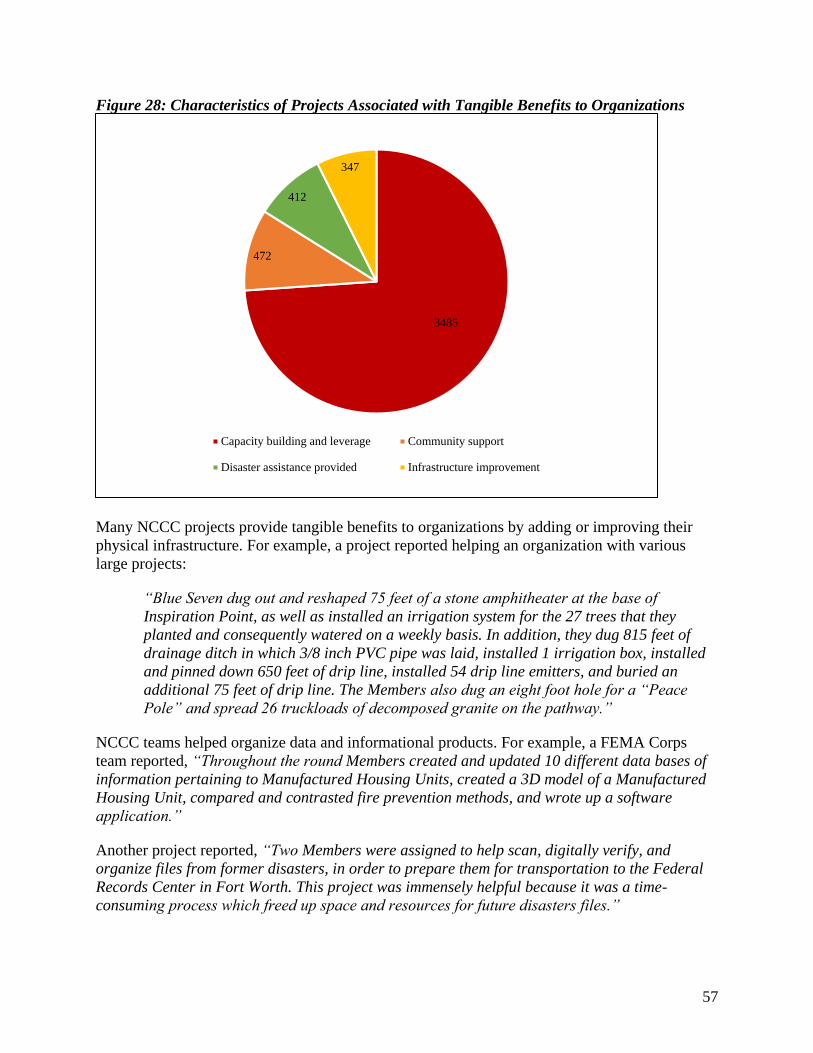
57
Figure 28: Characteristics of Projects Associated with Tangible Benefits to Organizations
Many NCCC projects provide tangible benefits to organizations by adding or improving their
physical infrastructure. For example, a project reported helping an organization with various
large projects:
“Blue Seven dug out and reshaped 75 feet of a stone amphitheater at the base of
Inspiration Point, as well as installed an irrigation system for the 27 trees that they
planted and consequently watered on a weekly basis. In addition, they dug 815 feet of
drainage ditch in which 3/8 inch PVC pipe was laid, installed 1 irrigation box, installed
and pinned down 650 feet of drip line, installed 54 drip line emitters, and buried an
additional 75 feet of drip line. The Members also dug an eight foot hole for a “Peace
Pole” and spread 26 truckloads of decomposed granite on the pathway.”
NCCC teams helped organize data and informational products. For example, a FEMA Corps
team reported, “Throughout the round Members created and updated 10 different data bases of
information pertaining to Manufactured Housing Units, created a 3D model of a Manufactured
Housing Unit, compared and contrasted fire prevention methods, and wrote up a software
application.”
Another project reported, “Two Members were assigned to help scan, digitally verify, and
organize files from former disasters, in order to prepare them for transportation to the Federal
Records Center in Fort Worth. This project was immensely helpful because it was a time-
consuming process which freed up space and resources for future disasters files.”
3485
472
412
347
Capacity building and leverage Community support
Disaster assistance provided Infrastructure improvement
58
NCCC teams helped organize physical supplies and equipment. One NCCC team working on a
conservation project reported, “By assisting with miscellaneous tasks such as sorting hand tools
and cleaning shop areas, the team saved the park staff time and energy that can instead be
focused on wildlife conservation.”
Another team reported, “The main focus of work during the project with Habitat for Humanity
in Omaha was organizing and packing materials and supplies at their 5,000 square foot
warehouse and assisting with moving, unpacking, and reorganizing supplies in their new 24,000
square foot warehouse.”
Another project reported:
“One group worked in the Freeport Boys and Girls Club where they worked to remove
furniture and other items from the old club to the new club. They also organized those
items in a storage room, painted one classroom, cleaned, and designed an art project for
the children to partake in. The other group helped to organize office space, file
paperwork, create props for a talent show, and inventoried decorations for the Annual
Boys and Girls Club Holiday Gala.”
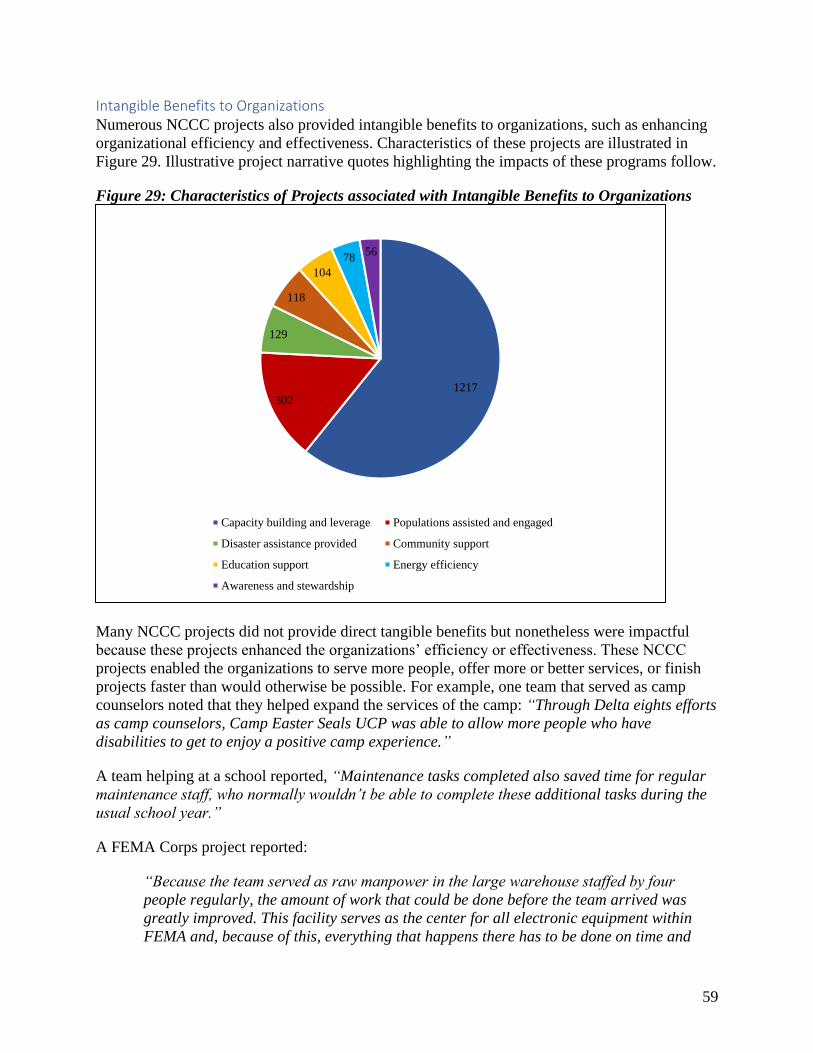
59
Intangible Benefits to Organizations Numerous NCCC projects also provided intangible benefits to organizations, such as enhancing
organizational efficiency and effectiveness. Characteristics of these projects are illustrated in
Figure 29. Illustrative project narrative quotes highlighting the impacts of these programs follow.
Figure 29: Characteristics of Projects associated with Intangible Benefits to Organizations
Many NCCC projects did not provide direct tangible benefits but nonetheless were impactful
because these projects enhanced the organizations’ efficiency or effectiveness. These NCCC
projects enabled the organizations to serve more people, offer more or better services, or finish
projects faster than would otherwise be possible. For example, one team that served as camp
counselors noted that they helped expand the services of the camp: “Through Delta eights efforts
as camp counselors, Camp Easter Seals UCP was able to allow more people who have
disabilities to get to enjoy a positive camp experience.”
A team helping at a school reported, “Maintenance tasks completed also saved time for regular
maintenance staff, who normally wouldn’t be able to complete these additional tasks during the
usual school year.”
A FEMA Corps project reported:
“Because the team served as raw manpower in the large warehouse staffed by four
people regularly, the amount of work that could be done before the team arrived was
greatly improved. This facility serves as the center for all electronic equipment within
FEMA and, because of this, everything that happens there has to be done on time and
1217302
129
118
104
7856
Capacity building and leverage Populations assisted and engaged
Disaster assistance provided Community support
Education support Energy efficiency
Awareness and stewardship
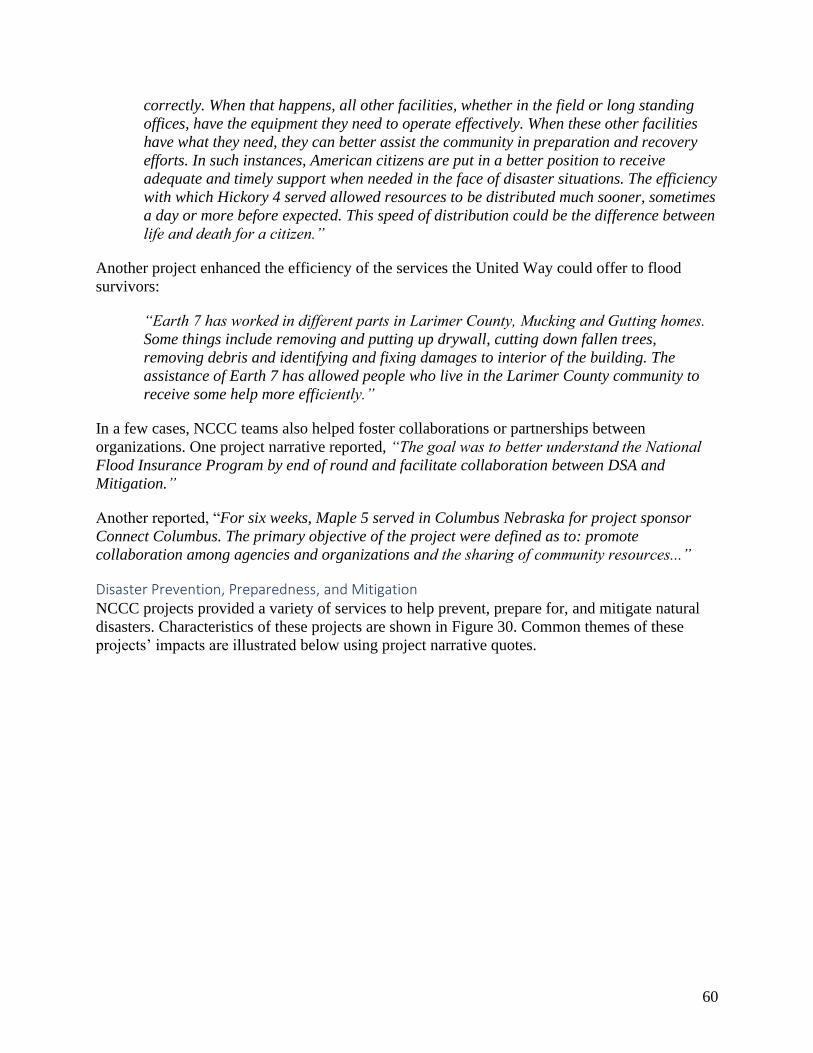
60
correctly. When that happens, all other facilities, whether in the field or long standing
offices, have the equipment they need to operate effectively. When these other facilities
have what they need, they can better assist the community in preparation and recovery
efforts. In such instances, American citizens are put in a better position to receive
adequate and timely support when needed in the face of disaster situations. The efficiency
with which Hickory 4 served allowed resources to be distributed much sooner, sometimes
a day or more before expected. This speed of distribution could be the difference between
life and death for a citizen.”
Another project enhanced the efficiency of the services the United Way could offer to flood
survivors:
“Earth 7 has worked in different parts in Larimer County, Mucking and Gutting homes.
Some things include removing and putting up drywall, cutting down fallen trees,
removing debris and identifying and fixing damages to interior of the building. The
assistance of Earth 7 has allowed people who live in the Larimer County community to
receive some help more efficiently.”
In a few cases, NCCC teams also helped foster collaborations or partnerships between
organizations. One project narrative reported, “The goal was to better understand the National
Flood Insurance Program by end of round and facilitate collaboration between DSA and
Mitigation.”
Another reported, “For six weeks, Maple 5 served in Columbus Nebraska for project sponsor
Connect Columbus. The primary objective of the project were defined as to: promote
collaboration among agencies and organizations and the sharing of community resources...”
Disaster Prevention, Preparedness, and Mitigation NCCC projects provided a variety of services to help prevent, prepare for, and mitigate natural
disasters. Characteristics of these projects are shown in Figure 30. Common themes of these
projects’ impacts are illustrated below using project narrative quotes.
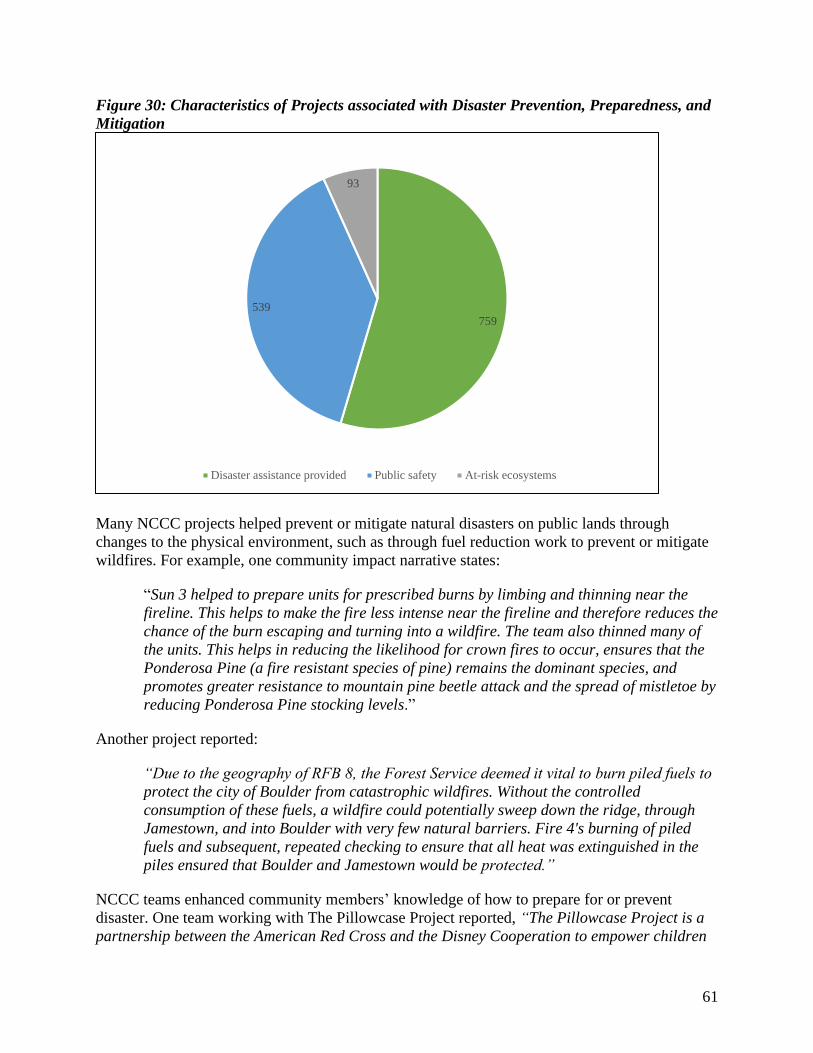
61
Figure 30: Characteristics of Projects associated with Disaster Prevention, Preparedness, and
Mitigation
Many NCCC projects helped prevent or mitigate natural disasters on public lands through
changes to the physical environment, such as through fuel reduction work to prevent or mitigate
wildfires. For example, one community impact narrative states:
“Sun 3 helped to prepare units for prescribed burns by limbing and thinning near the
fireline. This helps to make the fire less intense near the fireline and therefore reduces the
chance of the burn escaping and turning into a wildfire. The team also thinned many of
the units. This helps in reducing the likelihood for crown fires to occur, ensures that the
Ponderosa Pine (a fire resistant species of pine) remains the dominant species, and
promotes greater resistance to mountain pine beetle attack and the spread of mistletoe by
reducing Ponderosa Pine stocking levels.”
Another project reported:
“Due to the geography of RFB 8, the Forest Service deemed it vital to burn piled fuels to
protect the city of Boulder from catastrophic wildfires. Without the controlled
consumption of these fuels, a wildfire could potentially sweep down the ridge, through
Jamestown, and into Boulder with very few natural barriers. Fire 4's burning of piled
fuels and subsequent, repeated checking to ensure that all heat was extinguished in the
piles ensured that Boulder and Jamestown would be protected.”
NCCC teams enhanced community members’ knowledge of how to prepare for or prevent
disaster. One team working with The Pillowcase Project reported, “The Pillowcase Project is a
partnership between the American Red Cross and the Disney Cooperation to empower children
759
539
93
Disaster assistance provided Public safety At-risk ecosystems

62
grades 3-5 with the knowledge and skills to be prepared and take action in emergency
situations.”
Another project reported:
“FEMA Gold Four also attended and assisted at 3 local community preparedness fairs,
where the team set-up and manned a FEMA booth, completing 16 hours of outreach to
300 people by providing disaster preparedness information. The team also provided the
local community with information such as encouraging them to create a disaster kit,
informing them what safety precautions to take during the event of a disaster and various
other tips pertaining to disaster preparedness.”
A team in Atlanta reported, “Lastly, Summit 4 volunteered at Refugee Family Services and
delivered a disaster preparedness lesson plan to elementary school-aged children. The team
gave the children disaster preparedness materials and family preparedness plans to fill out with
their families.”
Another project reported:
“At this workshop, 10 youth leaders trained in disaster preparedness activities including
a sandbagging workshop, a fire extinguisher class, an individual preparedness session,
and a workshop on herbal medicines for disaster. A total of 30 people, including the 10
youth leaders, participated in this safety awareness training…During the conference, 300
educational kits were distributed to participants. This kit contained a DVD Emergency
Preparedness Tool Kit developed to be used as a guide for training youth in their tribes
to prepare for disaster.”
Finally, some NCCC teams assisted directly to improve response readiness through disaster
simulations, drills, and related activities that provided opportunities to first responders and others
to practice and improve response. A FEMA Corps project reported, “During the rest of the
team’s time there they assisted the Trainers in leading an advanced course for Public
Information Officers. FEMA Green One assisted in the simulation by creating media injects, role
playing, and answering the phones to allow for the students to experience a simulation as real
life as possible.”
Another team reported:
“An interactive simulation also allowed audience Members to personally develop and
run a mock VRC (Volunteer Response Center], and encounter individuals with various
intentions of visiting the VRC. They additionally were supplied with different
supplementary materials to assist them and potentially their fellow employees, to
eventually help in their own creation of VRCs in their towns. Ocean Eight was granted
the opportunity to travel to and work in the areas they lead these presentations in,
allowing them to observe and experience Northeastern Mississippi, as well as along the
Gulf of Mississippi. Over the course of three and a half weeks, Members presented 4 VRC
facilitations in Oxford, Starkville, Hattiesburg, and Gulfport to 14 individuals.”
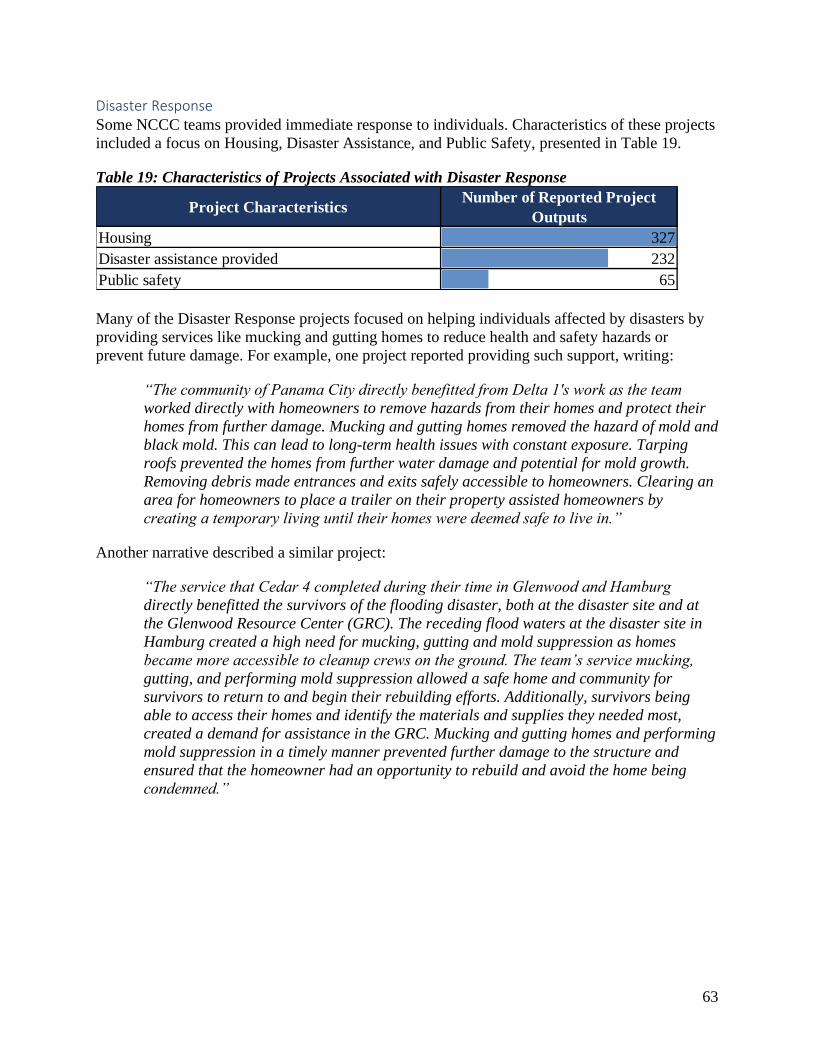
63
Disaster Response Some NCCC teams provided immediate response to individuals. Characteristics of these projects
included a focus on Housing, Disaster Assistance, and Public Safety, presented in Table 19.
Table 19: Characteristics of Projects Associated with Disaster Response
Many of the Disaster Response projects focused on helping individuals affected by disasters by
providing services like mucking and gutting homes to reduce health and safety hazards or
prevent future damage. For example, one project reported providing such support, writing:
“The community of Panama City directly benefitted from Delta 1's work as the team
worked directly with homeowners to remove hazards from their homes and protect their
homes from further damage. Mucking and gutting homes removed the hazard of mold and
black mold. This can lead to long-term health issues with constant exposure. Tarping
roofs prevented the homes from further water damage and potential for mold growth.
Removing debris made entrances and exits safely accessible to homeowners. Clearing an
area for homeowners to place a trailer on their property assisted homeowners by
creating a temporary living until their homes were deemed safe to live in.”
Another narrative described a similar project:
“The service that Cedar 4 completed during their time in Glenwood and Hamburg
directly benefitted the survivors of the flooding disaster, both at the disaster site and at
the Glenwood Resource Center (GRC). The receding flood waters at the disaster site in
Hamburg created a high need for mucking, gutting and mold suppression as homes
became more accessible to cleanup crews on the ground. The team’s service mucking,
gutting, and performing mold suppression allowed a safe home and community for
survivors to return to and begin their rebuilding efforts. Additionally, survivors being
able to access their homes and identify the materials and supplies they needed most,
created a demand for assistance in the GRC. Mucking and gutting homes and performing
mold suppression in a timely manner prevented further damage to the structure and
ensured that the homeowner had an opportunity to rebuild and avoid the home being
condemned.”
Project CharacteristicsNumber of Reported Project
Outputs
Housing 327
Disaster assistance provided 232
Public safety 65
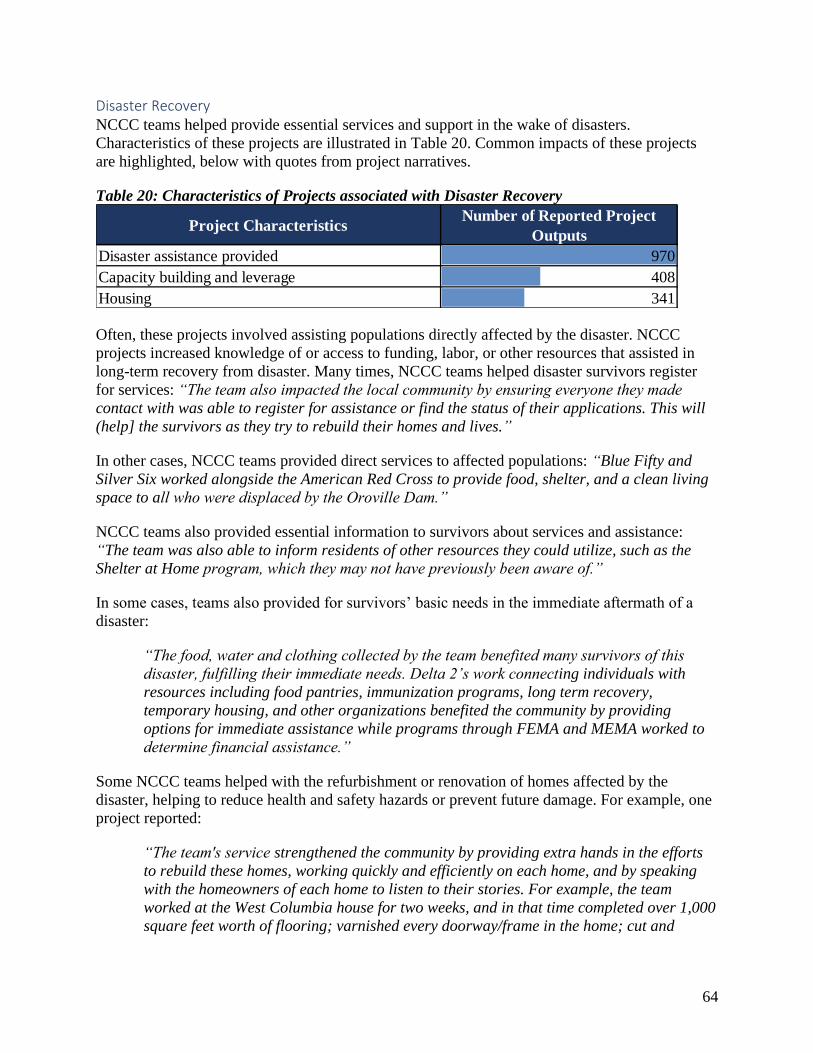
64
Disaster Recovery NCCC teams helped provide essential services and support in the wake of disasters.
Characteristics of these projects are illustrated in Table 20. Common impacts of these projects
are highlighted, below with quotes from project narratives.
Table 20: Characteristics of Projects associated with Disaster Recovery
Often, these projects involved assisting populations directly affected by the disaster. NCCC
projects increased knowledge of or access to funding, labor, or other resources that assisted in
long-term recovery from disaster. Many times, NCCC teams helped disaster survivors register
for services: “The team also impacted the local community by ensuring everyone they made
contact with was able to register for assistance or find the status of their applications. This will
(help] the survivors as they try to rebuild their homes and lives.”
In other cases, NCCC teams provided direct services to affected populations: “Blue Fifty and
Silver Six worked alongside the American Red Cross to provide food, shelter, and a clean living
space to all who were displaced by the Oroville Dam.”
NCCC teams also provided essential information to survivors about services and assistance:
“The team was also able to inform residents of other resources they could utilize, such as the
Shelter at Home program, which they may not have previously been aware of.”
In some cases, teams also provided for survivors’ basic needs in the immediate aftermath of a
disaster:
“The food, water and clothing collected by the team benefited many survivors of this
disaster, fulfilling their immediate needs. Delta 2’s work connecting individuals with
resources including food pantries, immunization programs, long term recovery,
temporary housing, and other organizations benefited the community by providing
options for immediate assistance while programs through FEMA and MEMA worked to
determine financial assistance.”
Some NCCC teams helped with the refurbishment or renovation of homes affected by the
disaster, helping to reduce health and safety hazards or prevent future damage. For example, one
project reported:
“The team's service strengthened the community by providing extra hands in the efforts
to rebuild these homes, working quickly and efficiently on each home, and by speaking
with the homeowners of each home to listen to their stories. For example, the team
worked at the West Columbia house for two weeks, and in that time completed over 1,000
square feet worth of flooring; varnished every doorway/frame in the home; cut and
Project CharacteristicsNumber of Reported Project
Outputs
Disaster assistance provided 970
Capacity building and leverage 408
Housing 341

65
placed trim along each wall in the 9 rooms within the house, and painted the walls,
ceilings, and trim with top coat.”
Another team reported:
“Many people within the community of Tuscaloosa are still rebuilding from the tornado
in 2011. There are families who still are waiting for homes. Homeowners are extremely
grateful to have volunteers like AmeriCorps NCCC to help. As volunteers with Habitat
for Humanity Tuscaloosa (HFHT) River Two Members were consistent participants in
the building process.”
The actions of NCCC teams sometimes helped individuals return to their homes or go back to
work more quickly following a disaster. One project reported, “By lending our manpower to SBP
we helped accelerate the process of getting these homeowners moved back in to their homes and
bringing their long and arduous journey to a close.”
Another project report stated, “Due to Maple 1’s work, these individuals are closer to returning
to their homes and getting their normal lives back.”
Another team wrote, “As vocalized frequently by the project leads, Water 4 helped to deliver the
SBP mission of shrinking the time between disaster and recovery. Overall, as Water 4 completed
over 3000 hours of home renovation and repair the team helped to improve the lives of those still
struggling in Brazoria County.”
Finally, in some instances, NCCC teams reported helping individuals affected by disaster to
experience a sense of normalcy and providing other emotional and psychosocial benefits: “With
our help, the community was able to benefit by regaining a sense of normalcy after a disaster in
a faster amount of time. The homeowners who benefit from SBP’s work regained a sense of pride
in their home, slowly restoring the overall morale of the community itself.”
Another team described their service: “River 5 was able to serve those who could not complete
any necessary work themselves, while simultaneously providing hope for the future as the
community moves on from the flood.”
These intangible benefits are, according to some of the project narratives, just as valuable as the
more tangible benefits teams provided;
“Our team has had the opportunity to speak with these individuals, and the gratitude and
joy they have expressed at being able to have their home back has been truly life-
changing for the team. It is clear that our work and the work of AHAH has not just
provided a physical service for these individuals, but an emotional one as well.
Homeowners have expressed to us that they felt deserted and helpless before All Hands
and Hearts offered their services. This organization has helped to make people feel
remembered and cared for when it seemed that no one else did.”
Impact on Members of NCCC Projects Through the service projects narrative, NCCC also asks Members to record how their work
impacted them. We thematically coded and analyzed the Member Impact statements using a
66
codebook developed through an initial sampling of projects; these codes were then applied to the
narrative text. Four main themes reflect impact on Members: personal impacts and life skills,
professional skills, interpersonal connections, and civic orientation and engagement.
Personal Impacts and Life Skills
Corps Members reported that their service impacted their self-efficacy, confidence, and
resilience. One FEMA Corps team reported, “It was a beneficial experience to the team to have
a forgiving and kind point of contact, to help the Corps Members become more comfortable and
competent in their jobs, give them space to make mistakes, but held them to the same standards
as the rest of the FEMA crew.”
One NCCC project reported, “At a more abstract level, corps Members learned how to stay
motivated while performing mundane, repetitive tasks.”
NCCC teams reported impact on managerial skills through stress management and critical
thinking skills, as these examples point out: “The long hours worked by Cedar 4 gave the team
experience in coping with stress;”
Another team reported, “The team was able to practice flexibility and adapting to the needs of
others.”
And, another wrote, “This confidence lead to the team doing their assigned job better, which will
bring them even more confidence in their lives. Confidence is paramount to being able to work in
a team, lead a team, or really perform any function that requires someone to rely on you.”
Participation in NCCC also helped some Members think more about their careers, affirming or
changing career interests or otherwise helping Members better prepare for careers. For example,
one project reported how team Members were able to obtain professional development
opportunities: “The team also participated in two professional development trainings consisting
of useful information on salary negotiation, cover letters, resumes, interviewing, international
work, and what to do after you get the job.”
Some NCCC projects provided useful experiences preparing employment applications and
interviews; for example, “Members carried chainsaws and other heavy equipment, had no
electricity and minimal to no phone service. This will be a powerful experience for Members to
recall in interviews and applications for positions requiring outdoor work/physical stamina--a
likely scenario for many in the team pursuing careers in natural resources.”
Other NCCC projects provided Members with opportunities to build a professional network that
could provide employment references; as a FEMA Corps project reported, “In addition, the team
has continued to build a list of professional references which will greatly benefit any one of them
when it comes time to apply for a job after the program is completed.”
NCCC projects also helped Members acquire new knowledge and skills to help carry out a
variety of endeavors. Some of this knowledge will help Members in their personal lives, as this
example illustrates: “In order to inform others about their health insurance options, every
Member of Cedar 5 needed to gain a full understanding of the Affordable Care Act. This
67
knowledge was useful to the team because everyone is approaching the age where they are no
longer covered by their parents’ plans.”
In other cases, Corps Members acquired new knowledge and skills that will help them
effectively carry out work-related projects as in this statement:
“Corps Members benefited from this project in many ways. Corps Members gained the
skills to successfully set and run a staging area. Members trained in many different
position including truck check in/ check out, ground support, general maintenance and
data entry. While at Region IV corps Member also were able to learn the work that goes
into a disaster before it even happens.”
Another team wrote, “The team gained extensive experience with planning, facilitating, and
supporting a community event through their work with the Home Fire Campaign.”
Professional Skills
NCCC projects also provided Corps Members the opportunity to develop professional skills.
This included technical skills, including skills related to construction, crisis response, the use of
computers, and environmental management. These skills are acquired through formal training
and hands-on experience, which Corps Members can include on their resumes. Training for
Members varied based on the types of projects and organizations they worked with. For example,
a NCCC team working on a crisis project noted, “Corps Members were trained on how to
properly carry and transport critically injured victims.”
An NCCC team working on an environmental conservation project noted:
“Silver received training on herbicide application and native plants and were able to
apply this knowledge several times a week. By the end of the project, Members were able
to give interpretive tours and talk knowledgably to visiting groups and volunteers about
the local flora and fauna. The team also had trainings on operating Bobcat tractors,
ATV’s, and boom lifts.”
One NCCC team working on physical construction project noted, “Members were able to gain
onsite training with a variety of tools and construction skills. Members learned how to cut and
install metal framing and roofing.”
Another team received training in a variety of managerial and office skills:
“The team participated in four training days at the office. The team now has a better
understanding of the Individual Assistance Delivery Process. Additionally, the team was
able to learn several skills with their two projects including: customer service, problem
solving, multi-tasking, research, telecommunication skills, and data entry.”
Corps Members benefit from hands-on opportunities to practice new skills that may assist them
in their future careers. A FEMA Corps project reported, “Each of the Members of the team got
the chance to perform physical work that took them out of the office setting …The work at the
staging area also taught the Members of Ocean 2 to consider safety issues while working around
and with heavy machinery and working on top of THUs.”
68
An Oregon-based NCCC project reported, “Members had several service days with trail
maintenance, where they learned the proper way to handle, use, and maintain trail tools.”
Another NCCC team reported, “The corps Members of Fire 7 have gained experience in the safe
use of many construction tools including levels, measuring tape, power drills, circular saws, and
table saws.”
A team working with gardens reported, “Throughout the course of the year, the team has gained
experience planting trees and maintaining gardens. St. Dorothy’s Rest offered the opportunity to
serve in the initial stages of garden planning and startup. Members learned the complexities of
designing and establishing a garden.”
And, a team that worked with computer-based geospatial systems reported, “Members have
developed competence in skills relating to basic geospatial information system operation.”
Interpersonal Connections
NCCC projects help Members’ interpersonal skills by engaging with people who differ from
themselves. For example, one NCCC team noted, “Members worked with a diverse group of at-
risk youth and applied their schooling to tutoring youth. The culture and population in Mecca
was very different from the communities the Members had experienced in their past, and the
team learned some Spanish as well as meeting many families from Mexico.”
Another team noted how their work helped them become more sensitive to working with diverse
individuals, writing, “Members learned how to be sensitive to various cultural differences and
how to work about language barriers.”
Another team reported, “The team also gained a great deal of empathy and respect for the
people of the Caribbean, and people from different cultures in general.”
The Member impact statements in the service project narratives noted how NCCC participation
impacts oral and written communication skills. One NCCC team reported, “The team honed and
refined new life skills like listening with compassion, responding with empathy…”
Members in some cases improved on professional interpersonal communication, as this quote
illustrates, “Delta 6 improved their interpersonal skills through communication with the various
site supervisors.”
Another NCCC team reported, “Members located within the Voluntary Agency Liaison and
External Affairs department received skills in case management, creating and submitting order
request forms, as well as professional phone etiquette.”
A FEMA project reported, “Interacting with survivors allowed Members to improve
communication skills and continue developing interpersonal skills.”
Corps Members gained critical experience in both effective teamwork and leadership. A team
working with Habitat for Humanity reported how the experience had helped foster both
leadership and teamwork among Members:
69
“Because the work site is so large and outside volunteers are constant, the Members of
the team have been able to develop their own personal leadership skills on site taking
control of a specific task and becoming the expert on leading others in completing this
task. This leadership has also played well into team dynamics since each Member must
share and teach their newly acquired skills with others on the team.”
A FEMA Corps team noted, “Everyone on the team developed in their own way as leaders and
everyone on the team took the opportunity to prove not only to the team, but to FEMA as well
that young people can be mature, adapt to the situation given, and take it head on.”
In some cases, Corps Members stepped into leadership positions, as the following example
illustrates:
“Members of the team also were able to practice their meeting-running skills and public
speaking by running the daily All Hands and Hearts 5:30 meetings covering work
accomplished that day, work for tomorrow, meeting notes, shout outs, and assignment of
Base responsibilities. An excellent example is CM Mary Smith13 stepping into a role as
Base Manager for a portion of time while in Coastal Bend, undertaking responsibilities
such as organization of various base operations, grocery shopping, and delegating tasks
to volunteers on base duty for the day.”
Civic Orientation and Engagement
Many NCCC teams reported impacts on Members’ civic orientation and engagement, which is
likely due to increased Corps Member knowledge about the need for and efforts to strengthen
communities. One team reported how their experience helped to instill a commitment to future
service, writing:
“Though the team noted marked differences between military service and
national/community service, the team also found that the two were rooted in similar
values that emphasized the importance of community, working in service of others, and
securing a brighter future. This connection invigorated the team in understanding the
context of their own service and the value of long-term professional commitment to
service.”
In some cases, Corps Members witnessed and learned from organizational efforts, as this quote
illustrates, “A huge benefit that was given to Oak 5 was the ability to see a well-run nonprofit
organization and the wood, dedication, and passion that go into making a successful impact.”
A NCCC team working on a disaster project reported, “On the project, Members were able to
get a sense of all the different tasks that go into responding to a disaster through looking at what
the MA tasks were.”
In some cases, Corps Members learned more about civic engagement and participation. A NCCC
team’s learning about civic processes inspired Corps Members, as this narrative reported:
13 Name has been changed.
70
“The team was able to interact with various city employees and officials and learned
more about how city town hall meetings, cops meetings, and board meetings for Keep
Jackson Beautiful are carried out. Many Members were inspired to continue to learn
about these topics and want to carry this information forward with them into their lives
after AmeriCorps NCCC.”
In some cases, the experience fostered a desire to continue serving their communities. A NCCC
team reported:
“Many Members have not experienced the devastation from a natural disaster and are
now gravely aware of the need caused from one. Many said they were very interested in
continuing to help the Red Cross and similar relief efforts after the NCCC program.
Providing assistance for clients through the American Red Cross was an experience
Members will forever hold in their hearts.”
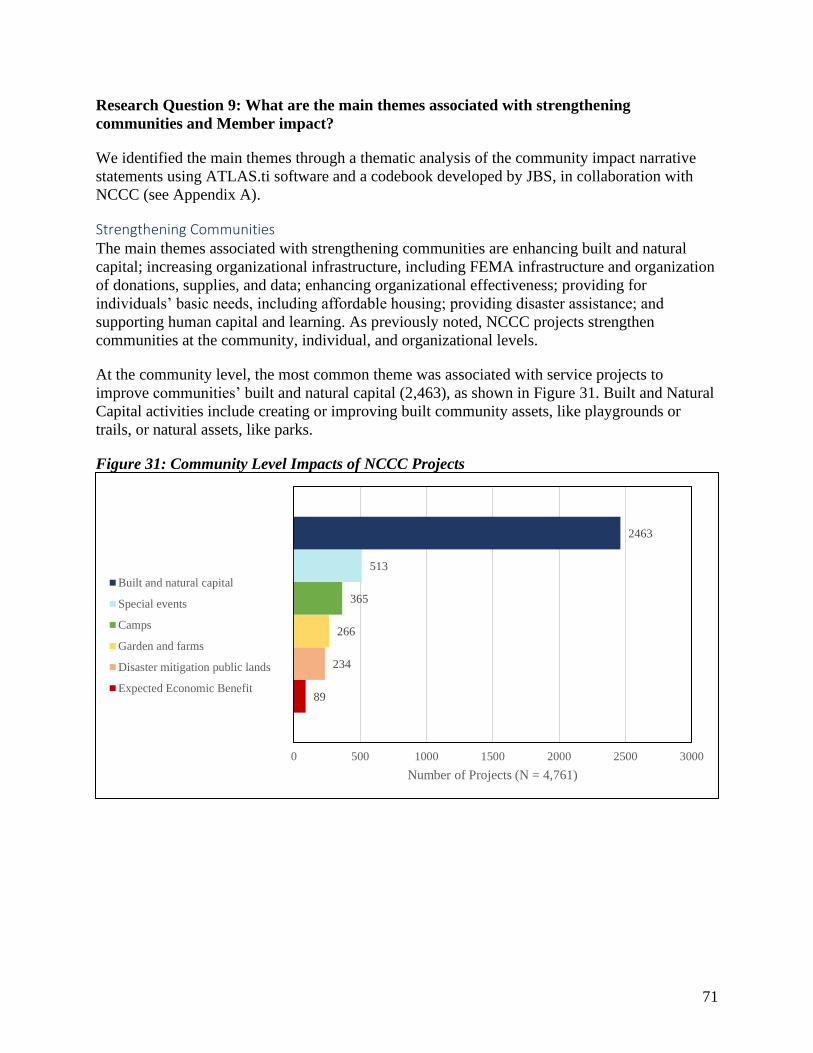
71
Research Question 9: What are the main themes associated with strengthening
communities and Member impact?
We identified the main themes through a thematic analysis of the community impact narrative
statements using ATLAS.ti software and a codebook developed by JBS, in collaboration with
NCCC (see Appendix A).
Strengthening Communities The main themes associated with strengthening communities are enhancing built and natural
capital; increasing organizational infrastructure, including FEMA infrastructure and organization
of donations, supplies, and data; enhancing organizational effectiveness; providing for
individuals’ basic needs, including affordable housing; providing disaster assistance; and
supporting human capital and learning. As previously noted, NCCC projects strengthen
communities at the community, individual, and organizational levels.
At the community level, the most common theme was associated with service projects to
improve communities’ built and natural capital (2,463), as shown in Figure 31. Built and Natural
Capital activities include creating or improving built community assets, like playgrounds or
trails, or natural assets, like parks.
Figure 31: Community Level Impacts of NCCC Projects
89
234
266
365
513
2463
0 500 1000 1500 2000 2500 3000
Number of Projects (N = 4,761)
Built and natural capital
Special events
Camps
Garden and farms
Disaster mitigation public lands
Expected Economic Benefit
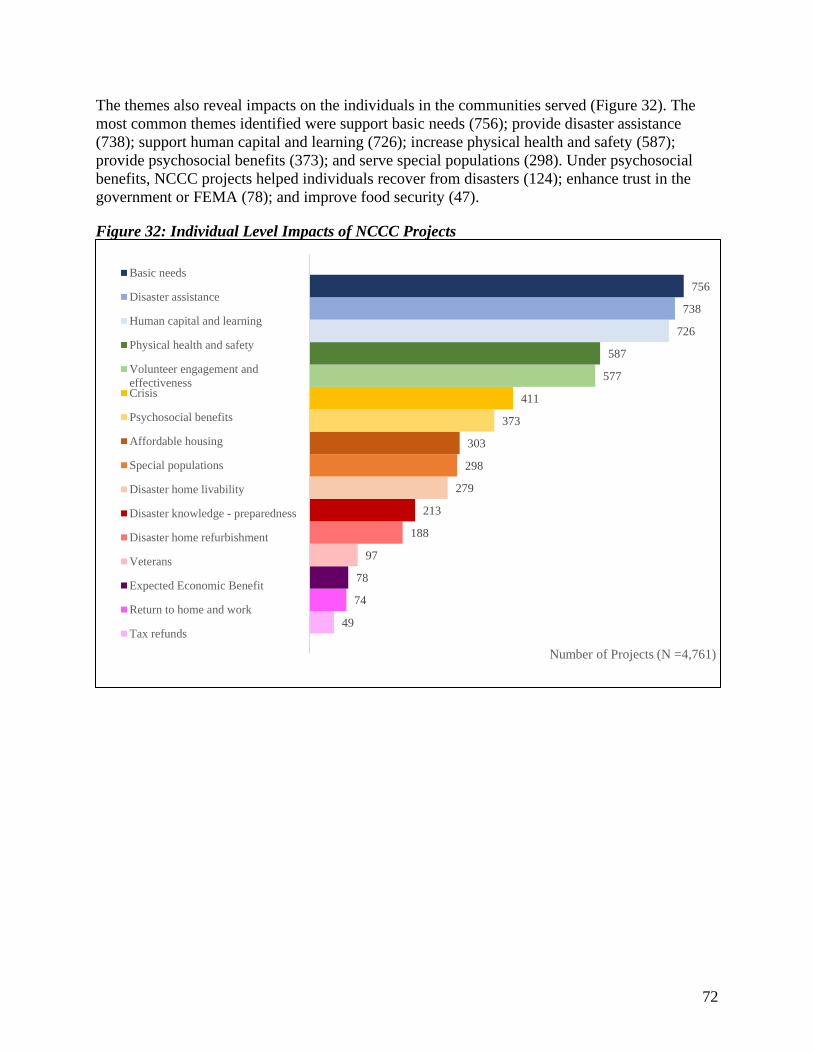
72
The themes also reveal impacts on the individuals in the communities served (Figure 32). The
most common themes identified were support basic needs (756); provide disaster assistance
(738); support human capital and learning (726); increase physical health and safety (587);
provide psychosocial benefits (373); and serve special populations (298). Under psychosocial
benefits, NCCC projects helped individuals recover from disasters (124); enhance trust in the
government or FEMA (78); and improve food security (47).
Figure 32: Individual Level Impacts of NCCC Projects
49
74
78
97
188
213
279
298
303
373
411
577
587
726
738
756
Number of Projects (N =4,761)
Basic needs
Disaster assistance
Human capital and learning
Physical health and safety
Volunteer engagement and
effectivenessCrisis
Psychosocial benefits
Affordable housing
Special populations
Disaster home livability
Disaster knowledge - preparedness
Disaster home refurbishment
Veterans
Expected Economic Benefit
Return to home and work
Tax refunds
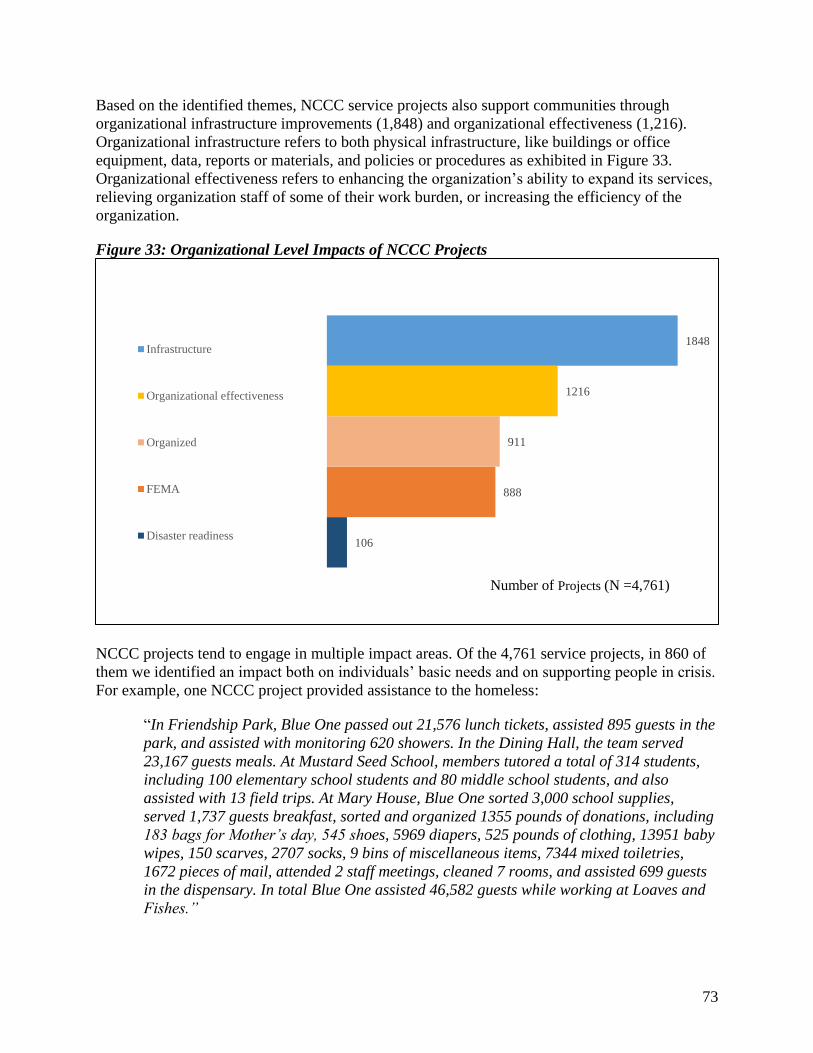
73
Based on the identified themes, NCCC service projects also support communities through
organizational infrastructure improvements (1,848) and organizational effectiveness (1,216).
Organizational infrastructure refers to both physical infrastructure, like buildings or office
equipment, data, reports or materials, and policies or procedures as exhibited in Figure 33.
Organizational effectiveness refers to enhancing the organization’s ability to expand its services,
relieving organization staff of some of their work burden, or increasing the efficiency of the
organization.
Figure 33: Organizational Level Impacts of NCCC Projects
NCCC projects tend to engage in multiple impact areas. Of the 4,761 service projects, in 860 of
them we identified an impact both on individuals’ basic needs and on supporting people in crisis.
For example, one NCCC project provided assistance to the homeless:
“In Friendship Park, Blue One passed out 21,576 lunch tickets, assisted 895 guests in the
park, and assisted with monitoring 620 showers. In the Dining Hall, the team served
23,167 guests meals. At Mustard Seed School, members tutored a total of 314 students,
including 100 elementary school students and 80 middle school students, and also
assisted with 13 field trips. At Mary House, Blue One sorted 3,000 school supplies,
served 1,737 guests breakfast, sorted and organized 1355 pounds of donations, including
183 bags for Mother’s day, 545 shoes, 5969 diapers, 525 pounds of clothing, 13951 baby
wipes, 150 scarves, 2707 socks, 9 bins of miscellaneous items, 7344 mixed toiletries,
1672 pieces of mail, attended 2 staff meetings, cleaned 7 rooms, and assisted 699 guests
in the dispensary. In total Blue One assisted 46,582 guests while working at Loaves and
Fishes.”
106
888
911
1216
1848Infrastructure
Organizational effectiveness
Organized
FEMA
Disaster readiness
Number of Projects (N =4,761)

74
In 1,031 service projects, the themes show that NCCC teams worked with individuals in crisis
and providing psychosocial benefits. For example, one project reported how they helped provide
assistance to disaster survivors as well as lent a listening ear:
“Cedar 7 served alongside volunteers from NECHAMA and the International Orthodox
Christian Charities (IOCC) to alleviate some of the stress and loss and to help put each
homeowner back in a safe and stable home. A lot of the homeowners the team served did
not have any other support and found themselves in extremely stressful and difficult
situations. Some homeowners were elderly or had disabilities which further complicated
their recovery efforts. Cedar 7 may not have been able to completely recover their homes
or possessions, but even the smallest of tasks the team could help with seemed to make a
difference to many residents. Whether it was a roof that needed a small tarp, or just a
chance for survivors to share their story, residents of Flagler Beach are now better able
to take their first steps on the long path towards recovery from Hurricane Irma’s
impact.”
In 306 service projects, we identified themes on both home refurbishment and individuals’
physical health and safety. One NCCC team wrote:
“Within Williamsburg and Georgetown counties there are many low-income households
who did not receive assistance after the flood through insurance or FEMA. AHV has
been providing mold sanitation and working to rebuild these homes where in some cases
the homeowners were living with black mold which can lead to serious health issues.
Delta 3 benefitted the community by giving AHV an extra ten volunteers to help complete
repairs on more homes in a timelier manner. Homeowners and in some cases the
homeowner’s families were able to move back into homes that were rebuilt into
functional structures knowing that the mold had been sanitized.”
Member Impacts The main themes associated with impacts on Members can be divided into life skills,
professional skills, and increased civic engagement and orientation.
Under life skills, the theme of personal growth (916) came up frequently, such as increased self-
efficacy, confidence, and resilience. Another theme was Member increased awareness,
knowledge, and skills in dealing with people different from themselves (633) and Member’
increased knowledge of strategies and skills to plan, prepare, execute, and assess endeavors (539)
(see Figure 34).
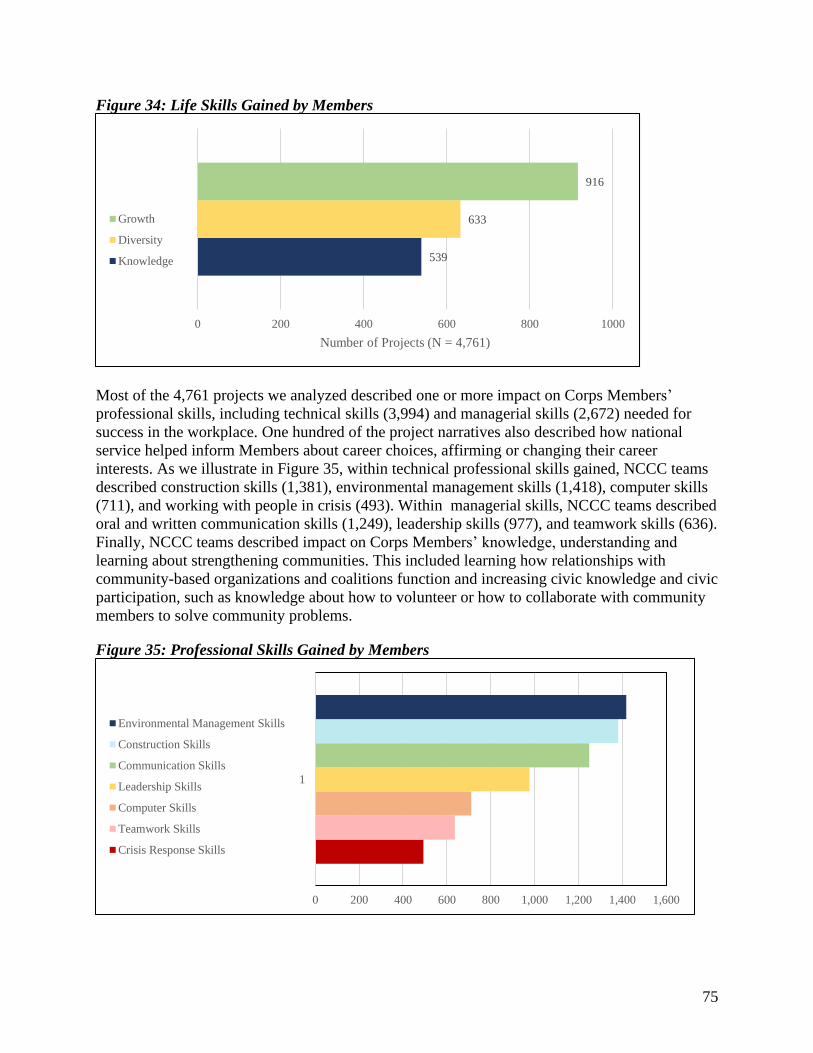
75
Figure 34: Life Skills Gained by Members
Most of the 4,761 projects we analyzed described one or more impact on Corps Members’
professional skills, including technical skills (3,994) and managerial skills (2,672) needed for
success in the workplace. One hundred of the project narratives also described how national
service helped inform Members about career choices, affirming or changing their career
interests. As we illustrate in Figure 35, within technical professional skills gained, NCCC teams
described construction skills (1,381), environmental management skills (1,418), computer skills
(711), and working with people in crisis (493). Within managerial skills, NCCC teams described
oral and written communication skills (1,249), leadership skills (977), and teamwork skills (636).
Finally, NCCC teams described impact on Corps Members’ knowledge, understanding and
learning about strengthening communities. This included learning how relationships with
community-based organizations and coalitions function and increasing civic knowledge and civic
participation, such as knowledge about how to volunteer or how to collaborate with community
members to solve community problems.
Figure 35: Professional Skills Gained by Members
539
633
916
0 200 400 600 800 1000
Number of Projects (N = 4,761)
Growth
Diversity
Knowledge
0 200 400 600 800 1,000 1,200 1,400 1,600
1
Environmental Management Skills
Construction Skills
Communication Skills
Leadership Skills
Computer Skills
Teamwork Skills
Crisis Response Skills
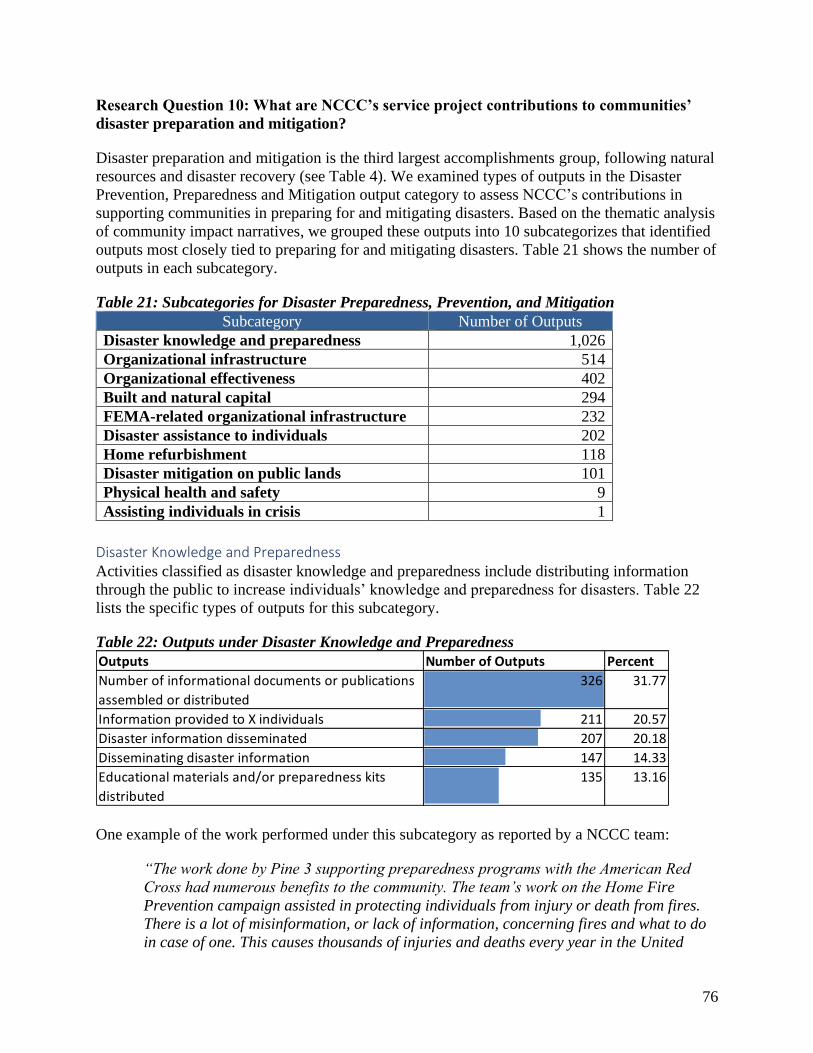
76
Research Question 10: What are NCCC’s service project contributions to communities’
disaster preparation and mitigation?
Disaster preparation and mitigation is the third largest accomplishments group, following natural
resources and disaster recovery (see Table 4). We examined types of outputs in the Disaster
Prevention, Preparedness and Mitigation output category to assess NCCC’s contributions in
supporting communities in preparing for and mitigating disasters. Based on the thematic analysis
of community impact narratives, we grouped these outputs into 10 subcategorizes that identified
outputs most closely tied to preparing for and mitigating disasters. Table 21 shows the number of
outputs in each subcategory.
Table 21: Subcategories for Disaster Preparedness, Prevention, and Mitigation
Subcategory Number of Outputs
Disaster knowledge and preparedness 1,026
Organizational infrastructure 514
Organizational effectiveness 402
Built and natural capital 294
FEMA-related organizational infrastructure 232
Disaster assistance to individuals 202
Home refurbishment 118
Disaster mitigation on public lands 101
Physical health and safety 9
Assisting individuals in crisis 1
Disaster Knowledge and Preparedness Activities classified as disaster knowledge and preparedness include distributing information
through the public to increase individuals’ knowledge and preparedness for disasters. Table 22
lists the specific types of outputs for this subcategory.
Table 22: Outputs under Disaster Knowledge and Preparedness
One example of the work performed under this subcategory as reported by a NCCC team:
“The work done by Pine 3 supporting preparedness programs with the American Red
Cross had numerous benefits to the community. The team’s work on the Home Fire
Prevention campaign assisted in protecting individuals from injury or death from fires.
There is a lot of misinformation, or lack of information, concerning fires and what to do
in case of one. This causes thousands of injuries and deaths every year in the United
Outputs Number of Outputs Percent
Number of informational documents or publications
assembled or distributed
326 31.77
Information provided to X individuals 211 20.57
Disaster information disseminated 207 20.18
Disseminating disaster information 147 14.33
Educational materials and/or preparedness kits
distributed
135 13.16
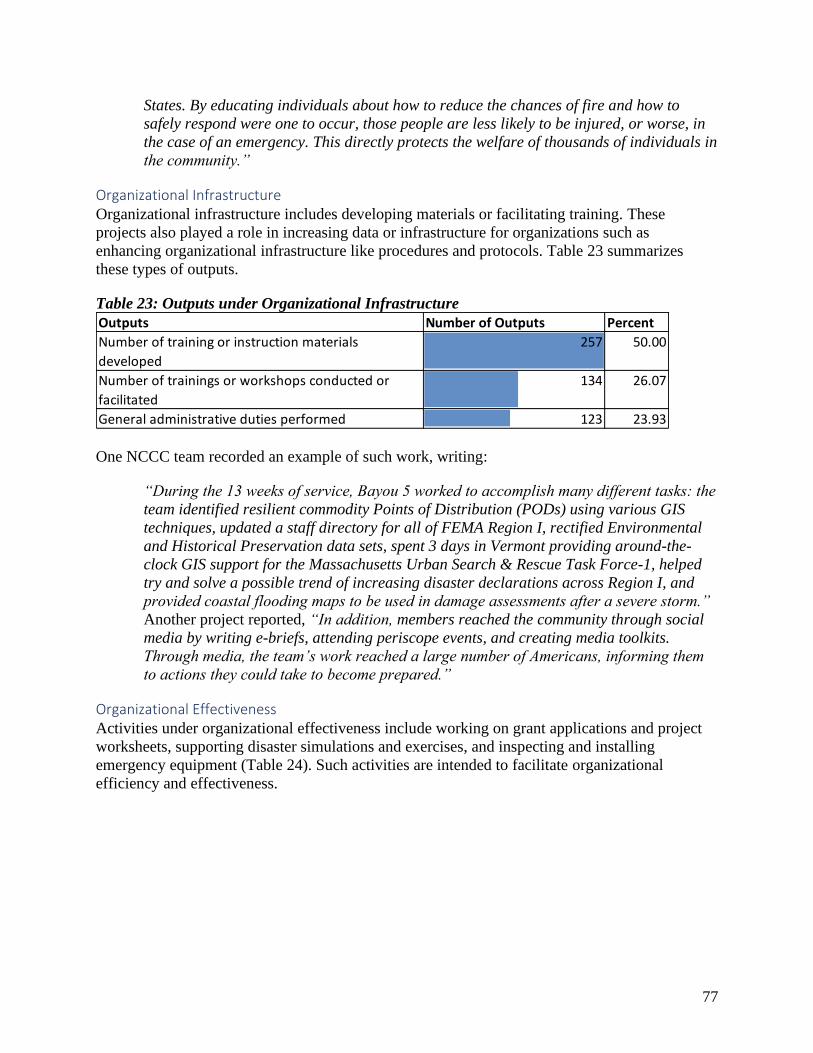
77
States. By educating individuals about how to reduce the chances of fire and how to
safely respond were one to occur, those people are less likely to be injured, or worse, in
the case of an emergency. This directly protects the welfare of thousands of individuals in
the community.”
Organizational Infrastructure Organizational infrastructure includes developing materials or facilitating training. These
projects also played a role in increasing data or infrastructure for organizations such as
enhancing organizational infrastructure like procedures and protocols. Table 23 summarizes
these types of outputs.
Table 23: Outputs under Organizational Infrastructure
One NCCC team recorded an example of such work, writing:
“During the 13 weeks of service, Bayou 5 worked to accomplish many different tasks: the
team identified resilient commodity Points of Distribution (PODs) using various GIS
techniques, updated a staff directory for all of FEMA Region I, rectified Environmental
and Historical Preservation data sets, spent 3 days in Vermont providing around-the-
clock GIS support for the Massachusetts Urban Search & Rescue Task Force-1, helped
try and solve a possible trend of increasing disaster declarations across Region I, and
provided coastal flooding maps to be used in damage assessments after a severe storm.”
Another project reported, “In addition, members reached the community through social
media by writing e-briefs, attending periscope events, and creating media toolkits.
Through media, the team’s work reached a large number of Americans, informing them
to actions they could take to become prepared.”
Organizational Effectiveness Activities under organizational effectiveness include working on grant applications and project
worksheets, supporting disaster simulations and exercises, and inspecting and installing
emergency equipment (Table 24). Such activities are intended to facilitate organizational
efficiency and effectiveness.
Outputs Number of Outputs Percent
Number of training or instruction materials
developed
257 50.00
Number of trainings or workshops conducted or
facilitated
134 26.07
General administrative duties performed 123 23.93
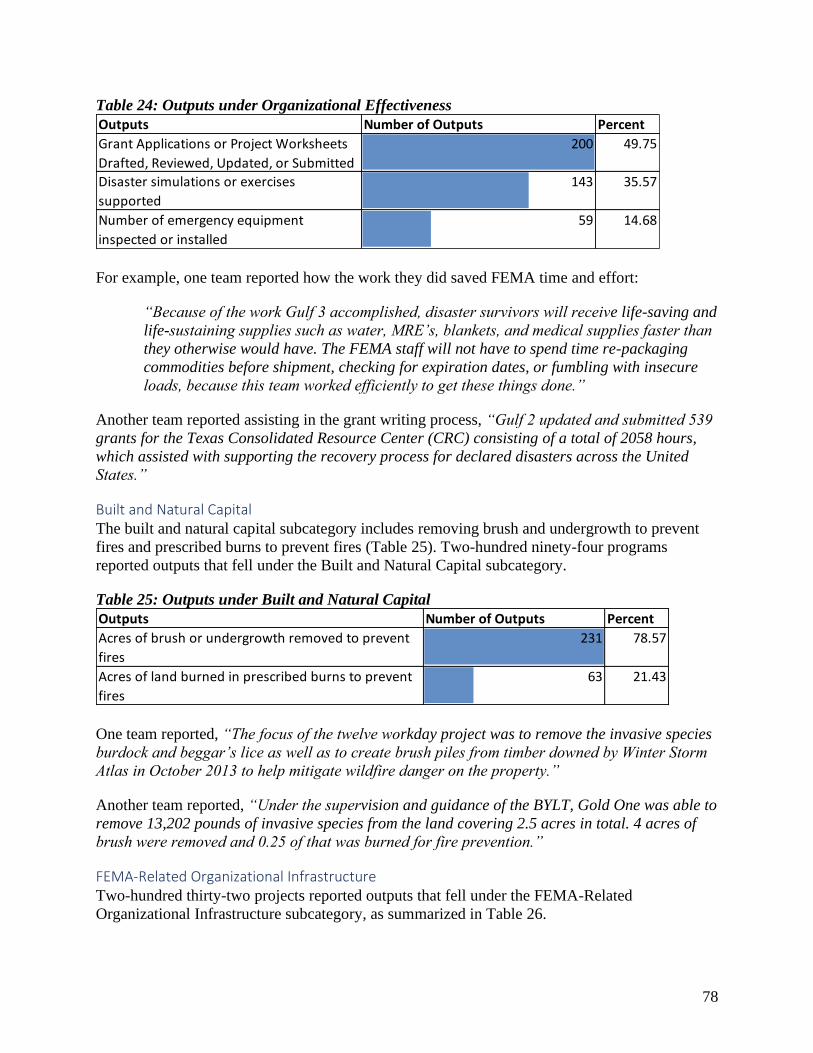
78
Table 24: Outputs under Organizational Effectiveness
For example, one team reported how the work they did saved FEMA time and effort:
“Because of the work Gulf 3 accomplished, disaster survivors will receive life-saving and
life-sustaining supplies such as water, MRE’s, blankets, and medical supplies faster than
they otherwise would have. The FEMA staff will not have to spend time re-packaging
commodities before shipment, checking for expiration dates, or fumbling with insecure
loads, because this team worked efficiently to get these things done.”
Another team reported assisting in the grant writing process, “Gulf 2 updated and submitted 539
grants for the Texas Consolidated Resource Center (CRC) consisting of a total of 2058 hours,
which assisted with supporting the recovery process for declared disasters across the United
States.”
Built and Natural Capital The built and natural capital subcategory includes removing brush and undergrowth to prevent
fires and prescribed burns to prevent fires (Table 25). Two-hundred ninety-four programs
reported outputs that fell under the Built and Natural Capital subcategory.
Table 25: Outputs under Built and Natural Capital
One team reported, “The focus of the twelve workday project was to remove the invasive species
burdock and beggar’s lice as well as to create brush piles from timber downed by Winter Storm
Atlas in October 2013 to help mitigate wildfire danger on the property.”
Another team reported, “Under the supervision and guidance of the BYLT, Gold One was able to
remove 13,202 pounds of invasive species from the land covering 2.5 acres in total. 4 acres of
brush were removed and 0.25 of that was burned for fire prevention.”
FEMA-Related Organizational Infrastructure Two-hundred thirty-two projects reported outputs that fell under the FEMA-Related
Organizational Infrastructure subcategory, as summarized in Table 26.
Outputs Number of Outputs Percent
Grant Applications or Project Worksheets
Drafted, Reviewed, Updated, or Submitted
200 49.75
Disaster simulations or exercises
supported
143 35.57
Number of emergency equipment
inspected or installed
59 14.68
Outputs Number of Outputs Percent
Acres of brush or undergrowth removed to prevent
fires
231 78.57
Acres of land burned in prescribed burns to prevent
fires
63 21.43

79
Table 26: Outputs under FEMA-Related Organizational Infrastructure
One NCCC team described the management of a FEMA warehouse:
“Five of the team members were assigned to the warehouse, where all of the donations
would be sent. Corps members helped to unload the trucks as they came in to the loading
dock, palletizing as necessary and ensuring that the materials could safely be transported
via forklift around the large storage area. They were also responsible for setting up a
system for sorting donations into different groups, so that when certain supplies were
needed they would be easier to access.”
Another team described their work managing water distribution, “The team also pioneered the
effort to move the water distribution center into the remaining recovery site and team members
were the ones to create and implement the system they continue to use.”
Other Outputs that Contribute to Disaster Preparedness, Prevention, and Mitigation In addition to these most common subcategories listed above, NCCC projects reported these
other outputs related to the Disaster Preparedness, Prevention, and Mitigation output category
(Table 27). This work varied from improving technologies or programs to conducting outreach
and installing smoke detectors.
Table 27: Outputs under Other
One team described assisting in fire suppression activities: “Fire 4 had the privilege to engage in
direct fire suppression activities during this project. The team was dispatched on the Peewink
Fire near Sugarloaf Mountain late in the round. Fire 4 participated in both the Initial Attack and
mop-up of the fire.”
Outputs Number of Outputs Percent
Number of new or improve technologies, processes,
or programs designed or implemented
172 74.14
Shelters assessed or surveyed 47 20.26
Warehouse/Distribution centers managed 13 5.6
Outputs Number of Outputs Percent
Number of kits assembled 147 22.17
Number of homes protected from disaster damage 66 9.95
Outreach conducted 55 8.3
Homes or other buildings protected from damage in a
disaster
52
7.84
Acres of land in which fire was suppressed or
contained
49
7.39
Sandbags filled or installed 41 6.18
Number of public spaces or facilities protected from
disaster damage
11
1.66
Smoke detectors installed 9 1.36
Individuals sheltered 1 0.15

80
Teams also helped install smoke detectors and carbon monoxide detectors; “Fire Seven also
installed smoke and carbon monoxide detectors along with high efficiency light bulbs.”
In Arizona, a team helped protect communities from torrential rains: “In the two days the team
worked on sandbagging, they bagged and palletized 1,720 sandbags to be placed in Sedona.”
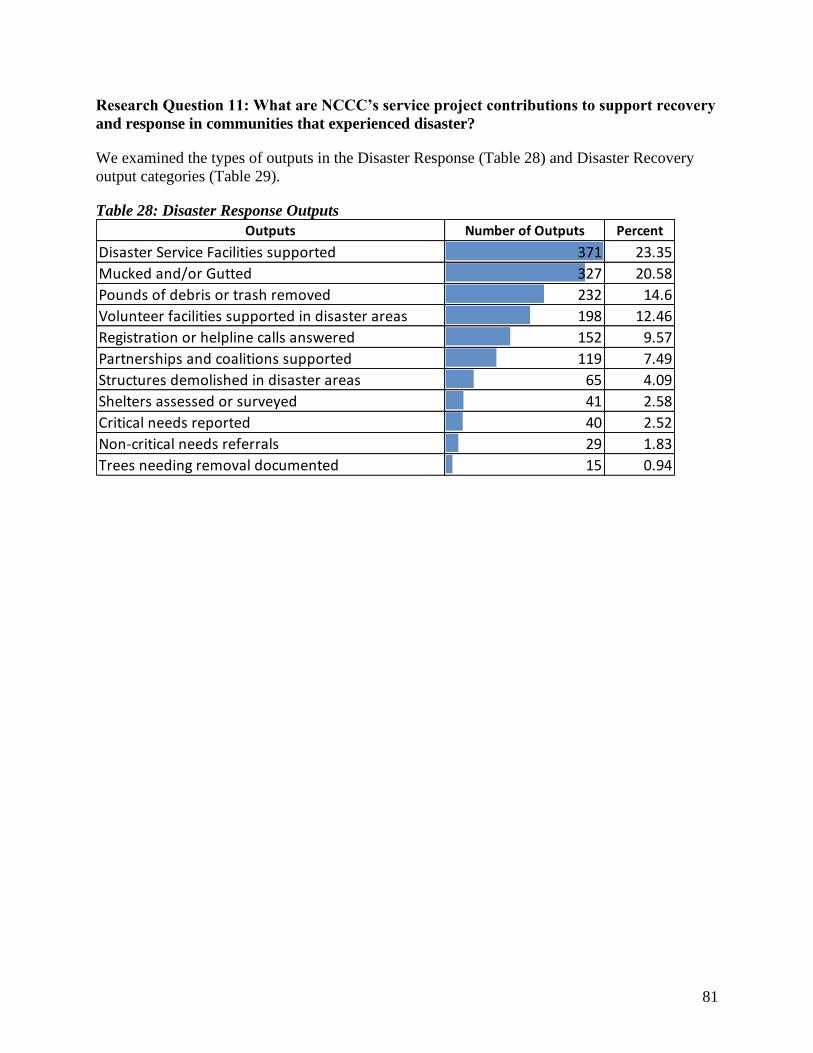
81
Research Question 11: What are NCCC’s service project contributions to support recovery
and response in communities that experienced disaster?
We examined the types of outputs in the Disaster Response (Table 28) and Disaster Recovery
output categories (Table 29).
Table 28: Disaster Response Outputs
Outputs Number of Outputs Percent
Disaster Service Facilities supported 371 23.35
Mucked and/or Gutted 327 20.58
Pounds of debris or trash removed 232 14.6
Volunteer facilities supported in disaster areas 198 12.46
Registration or helpline calls answered 152 9.57
Partnerships and coalitions supported 119 7.49
Structures demolished in disaster areas 65 4.09
Shelters assessed or surveyed 41 2.58
Critical needs reported 40 2.52
Non-critical needs referrals 29 1.83
Trees needing removal documented 15 0.94
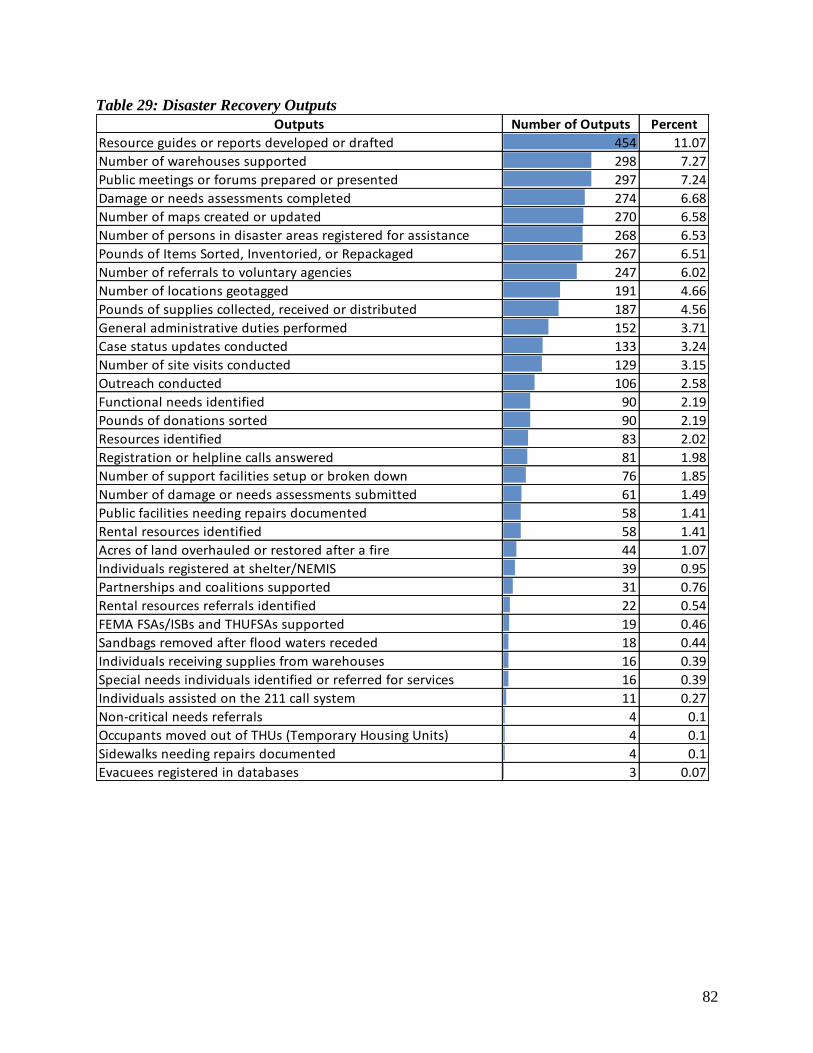
82
Table 29: Disaster Recovery Outputs
Outputs Number of Outputs Percent
Resource guides or reports developed or drafted 454 11.07
Number of warehouses supported 298 7.27
Public meetings or forums prepared or presented 297 7.24
Damage or needs assessments completed 274 6.68
Number of maps created or updated 270 6.58
Number of persons in disaster areas registered for assistance 268 6.53
Pounds of Items Sorted, Inventoried, or Repackaged 267 6.51
Number of referrals to voluntary agencies 247 6.02
Number of locations geotagged 191 4.66
Pounds of supplies collected, received or distributed 187 4.56
General administrative duties performed 152 3.71
Case status updates conducted 133 3.24
Number of site visits conducted 129 3.15
Outreach conducted 106 2.58
Functional needs identified 90 2.19
Pounds of donations sorted 90 2.19
Resources identified 83 2.02
Registration or helpline calls answered 81 1.98
Number of support facilities setup or broken down 76 1.85
Number of damage or needs assessments submitted 61 1.49
Public facilities needing repairs documented 58 1.41
Rental resources identified 58 1.41
Acres of land overhauled or restored after a fire 44 1.07
Individuals registered at shelter/NEMIS 39 0.95
Partnerships and coalitions supported 31 0.76
Rental resources referrals identified 22 0.54
FEMA FSAs/ISBs and THUFSAs supported 19 0.46
Sandbags removed after flood waters receded 18 0.44
Individuals receiving supplies from warehouses 16 0.39
Special needs individuals identified or referred for services 16 0.39
Individuals assisted on the 211 call system 11 0.27
Non-critical needs referrals 4 0.1
Occupants moved out of THUs (Temporary Housing Units) 4 0.1
Sidewalks needing repairs documented 4 0.1
Evacuees registered in databases 3 0.07
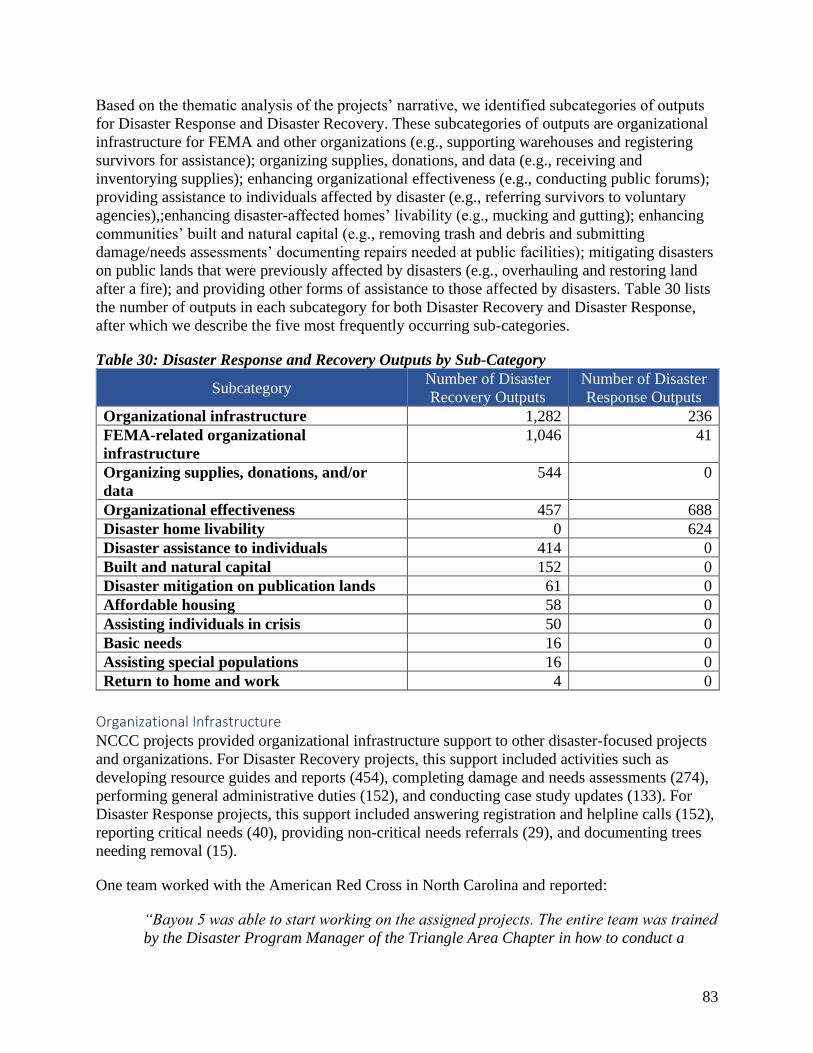
83
Based on the thematic analysis of the projects’ narrative, we identified subcategories of outputs
for Disaster Response and Disaster Recovery. These subcategories of outputs are organizational
infrastructure for FEMA and other organizations (e.g., supporting warehouses and registering
survivors for assistance); organizing supplies, donations, and data (e.g., receiving and
inventorying supplies); enhancing organizational effectiveness (e.g., conducting public forums);
providing assistance to individuals affected by disaster (e.g., referring survivors to voluntary
agencies),;enhancing disaster-affected homes’ livability (e.g., mucking and gutting); enhancing
communities’ built and natural capital (e.g., removing trash and debris and submitting
damage/needs assessments’ documenting repairs needed at public facilities); mitigating disasters
on public lands that were previously affected by disasters (e.g., overhauling and restoring land
after a fire); and providing other forms of assistance to those affected by disasters. Table 30 lists
the number of outputs in each subcategory for both Disaster Recovery and Disaster Response,
after which we describe the five most frequently occurring sub-categories.
Table 30: Disaster Response and Recovery Outputs by Sub-Category
Subcategory Number of Disaster
Recovery Outputs
Number of Disaster
Response Outputs
Organizational infrastructure 1,282 236
FEMA-related organizational
infrastructure
1,046 41
Organizing supplies, donations, and/or
data
544 0
Organizational effectiveness 457 688
Disaster home livability 0 624
Disaster assistance to individuals 414 0
Built and natural capital 152 0
Disaster mitigation on publication lands 61 0
Affordable housing 58 0
Assisting individuals in crisis 50 0
Basic needs 16 0
Assisting special populations 16 0
Return to home and work 4 0
Organizational Infrastructure NCCC projects provided organizational infrastructure support to other disaster-focused projects
and organizations. For Disaster Recovery projects, this support included activities such as
developing resource guides and reports (454), completing damage and needs assessments (274),
performing general administrative duties (152), and conducting case study updates (133). For
Disaster Response projects, this support included answering registration and helpline calls (152),
reporting critical needs (40), providing non-critical needs referrals (29), and documenting trees
needing removal (15).
One team worked with the American Red Cross in North Carolina and reported:
“Bayou 5 was able to start working on the assigned projects. The entire team was trained
by the Disaster Program Manager of the Triangle Area Chapter in how to conduct a
84
shelter survey as well as how to properly fill out the shelter survey form. The team was
able to conduct 10 shelter surveys throughout the project. Several Corps Members were
also trained and able to update the Region’s shelter information in the National Shelter
System.”
FEMA-Related Organizational Infrastructure Many service projects that worked on Disaster Recovery and Response activities supported
FEMA by enhancing physical infrastructure and data related to the needs of current and potential
disaster survivors. Under Disaster Recovery, these activities included, for example, supporting
warehouses (298), creating and updating maps (270), and registering disaster survivors for
assistance (268). Under Disaster Response, these activities included assessing and surveying
shelters (41).
One of the ways that NCCC projects provided organizational infrastructure support to FEMA
was by registering those in need of assistance and otherwise recording data and information. For
example, one NCCC team wrote:
“Azul Five assisted the city of Tallahassee, Florida and Leon County by providing
registration assistance, case inquiries, and case updates for disaster assistance. The team
interacted with community leaders and disaster survivors as a part of FEMA’s mission to
assess and canvass impacted areas. Members were able to register survivors and provide
information and updates to local officials on the registration process. The service
provided by Azul Five will help the citizens of Leon County to recover and from this
disaster.”
Another team reported:
“Alpine Three worked at the Joint Field Office (JFO) in Bloomington, Minnesota to meet
the mission of Public Assistance recovery for DR-4182 (Minnesota Flooding). The team's
main focuses was preparing Project Worksheets, documenting eligible costs, conducting
site visits, making Geographic Information Systems (GIS) maps. Alpine Three's tasks and
goals contributed to getting the state of Minnesota and the effected counties to pre-
disaster conditions.”
In addition to organizing and recording data, NCCC Members also helped FEMA with physical
infrastructure tasks. For example, one team reported: “The team also helped to increase
communication across the region by working with Health and Human Services to install a High
Frequency 100-watt antenna onto the building. This antenna provides a clear channel between
regional operations on the continent and the US Virgin Islands.”
Organizing Supplies, Donations, or Data Many of the teams that worked on Disaster Recovery service projects helped organize supplies,
donations, and data for disaster recovery activities. These activities included sorting,
repackaging, and inventorying items (267); collecting, receiving, and distributing supplies (187);
and sorting donations (90).

85
One example of the work performed under this subcategory was reported by an NCCC team:
“Key 2 provided vital support to keep the Red Cross operation running smoothly. Several
Members were involved in logistics, receiving, inventorying, distributing, and reordering
supplies for the shelter, which kept the residents clothed, fed, and comfortable.”
Another project reported, “FEMA Gold Two supported the Voluntary Agency Liaison (VAL)
team over a six-week period. The team was assigned to 3 sections within the VAL department.
Three Members supported the Oklahoma Multi-Agency Warehouse (MAW). The team sorted,
inventoried and moved over 100,000 pounds of clothes, food and supplies to send out to
survivors.”
Organizational Effectiveness NCCC teams worked on service projects that helped increase organizational efficiency and
effectiveness. Activities under Disaster Recovery related to organizational effectiveness include
preparing and presenting public meetings or forums (297), conducting site visits (129), and
supporting partnerships and coalitions (31). Activities under Disaster Response outputs include
supporting disaster service facilities (371), supporting volunteer facilities in disaster areas (198),
and supporting partnerships and coalitions (119).
One project highlighted their work in this area, writing, “Earth 4 has improved their social
media sites as well as updated them regularly throughout the round…The team was able to help
Rebuild Joplin get caught up on all volunteers who have signed up online in the past before the
NCCC team arrived and entered all information into the team’s new system as well as contacted
them to follow up on their volunteer dates”
Disaster Home Livability NCCC Members mucked and gutted homes (327), removed trash and debris (232), and
demolished structures in disaster areas (65) to make homes affected by disasters more livable.
For example, one project team wrote, “The team suited up to do a proper muck and gut of the
damaged rooms inside, demolishing the mold filled ceilings and removing damaged insulation—
all of which has been sitting for 3+ years. After the rooms were treated for mold, the team was
able to begin installing insulation and drywall.”
Another team reported, “Additionally, spraying homes/structures for mold suppression ensured a
safer and healthier environment for homeowners who were living in their damaged homes.”
Disaster Assistance to Individuals NCCC Members provided direct assistance to disaster survivors by providing referrals to
voluntary agencies (247), conducting outreach (106), and submitting damage or needs
assessments (61).
One team described the benefits that disaster survivors received:
“As soon as Summit 5 arrived in Austin, the team hit the ground running to assist
disaster survivors. Covering four different Disaster Service Facilities in four different
communities, the team scattered Hays County. After a few weeks of going to door-to-door
86
and staffing fixed registration sites, the team had assisted 3,179 survivors by
disseminating disaster information. The team also provided 9 case updates and 57
referrals to community partners. Once the DSA mission was completed, the team worked
with Voluntary Agency Liaison partners to muck and gut four homes that had been
damaged by the disaster.”
Another project described its work:
“Eagle 1 spent majority of their time completing Disaster Survivor Assistance (DSA)
field work throughout Richland County. Our field work consists of identifying high
impacted areas and going door to door to interact with the residents. We act as a
resource by answering any questions about the FEMA assistance process, deliver
information to other resources, provide community referrals as well as assist survivors
file new registrations, perform case updates & inquiries. Lastly our team provides a
therapeutic medium for survivors to share their story by actively listening to stories with
compassion and empathy.”
In the following example, NCCC Members providing direct assistance to disaster survivors,
including those with intellectual disabilities:
“By supporting the DSA mission of community outreach, the team was able to reach
survivors who might not be able to get to DRCs during a disaster, have mobility concerns
due to age or disability, or individuals who could not understand the assistance being
offered by FEMA through the telephone or internet, and an at-home visit was necessary
to better explain the process. For example, the team had a survivor who was living in her
damaged dwelling and sleeping on a flood contaminated mattress. She had a mental
health disability that made it difficult for her to leave her home to go to the MRIC at the
high school to talk to someone there. By visiting her home several times on different days,
the team was able to aid the survivor by providing disaster specific information and help
her understand the available resources and assistance for her. The survivor was able to
receive a mattress through whole community referrals and will be able to have a
sufficient mattress to sleep on.”
Other Disaster Response and Recovery Outputs NCCC teams helped contribute to a variety of other Disaster Response and Recovery outputs. In
some cases, NCCC Members helped improve built and natural capital in communities affected
by disasters. For example, this team, working as a part of flood relief efforts in South Dakota,
wrote the following: “When Maple 2 moved to Rapid City, South Dakota, they served five
counties within the Black Hills. The team helped at 27 different homes. The team was able to
remove 73,750 pounds of brush, tree limbs, and logs from homeowners’ yards. The team weed-
wacked 25 square feet in addition to having moved and stacked 1.75 fire cords.”
In another example, an NCCC team was able to help survivors of a disaster find information
regarding rental units: “Over the course of this interview, Members provided survivors with
rental resources and Members ensured that survivors had a place to stay. Not only does this help
survivors to find a place to stay in their area, but also, it re-assures survivors of the Federal
Emergency Management Agency's mission and presents a very positive front.”
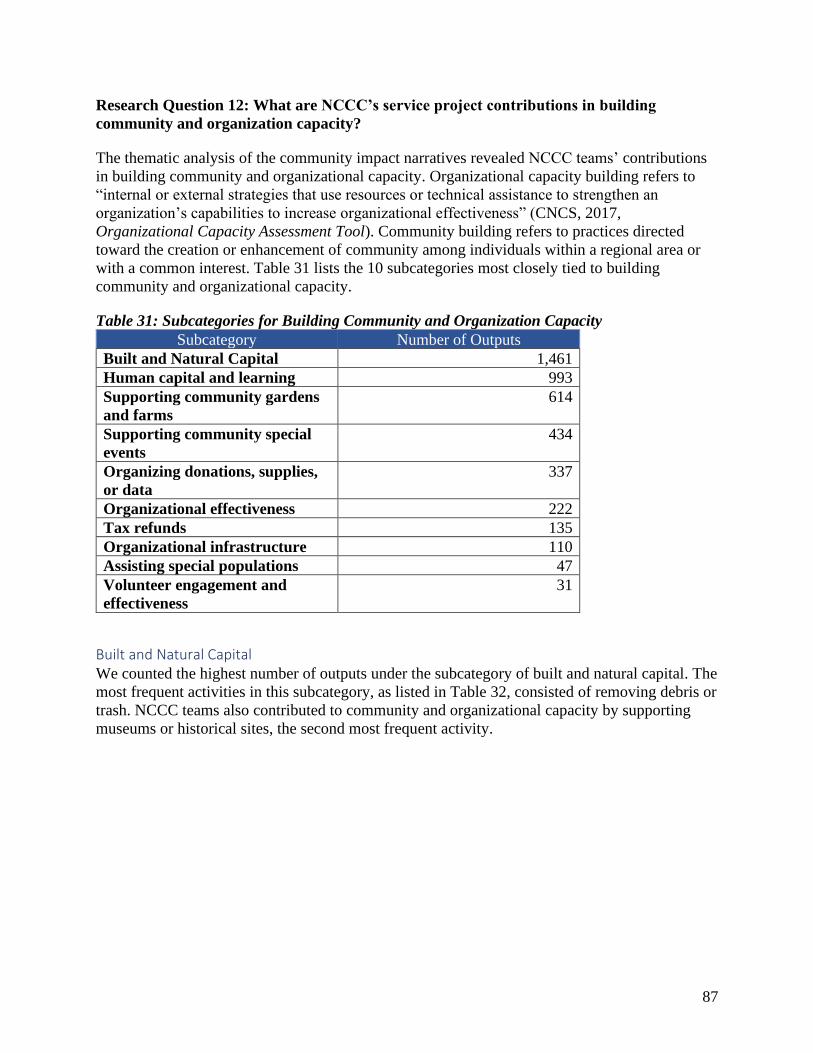
87
Research Question 12: What are NCCC’s service project contributions in building
community and organization capacity?
The thematic analysis of the community impact narratives revealed NCCC teams’ contributions
in building community and organizational capacity. Organizational capacity building refers to
“internal or external strategies that use resources or technical assistance to strengthen an
organization’s capabilities to increase organizational effectiveness” (CNCS, 2017,
Organizational Capacity Assessment Tool). Community building refers to practices directed
toward the creation or enhancement of community among individuals within a regional area or
with a common interest. Table 31 lists the 10 subcategories most closely tied to building
community and organizational capacity.
Table 31: Subcategories for Building Community and Organization Capacity
Subcategory Number of Outputs
Built and Natural Capital 1,461
Human capital and learning 993
Supporting community gardens
and farms
614
Supporting community special
events
434
Organizing donations, supplies,
or data
337
Organizational effectiveness 222
Tax refunds 135
Organizational infrastructure 110
Assisting special populations 47
Volunteer engagement and
effectiveness
31
Built and Natural Capital We counted the highest number of outputs under the subcategory of built and natural capital. The
most frequent activities in this subcategory, as listed in Table 32, consisted of removing debris or
trash. NCCC teams also contributed to community and organizational capacity by supporting
museums or historical sites, the second most frequent activity.
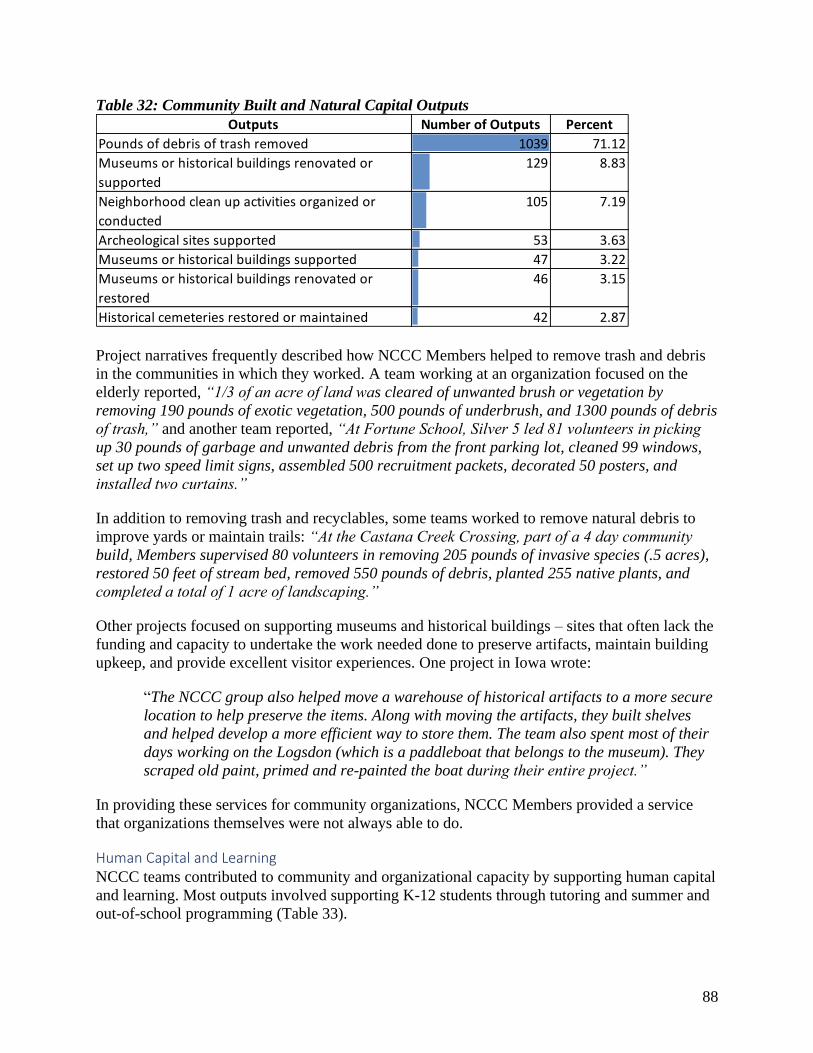
88
Table 32: Community Built and Natural Capital Outputs
Project narratives frequently described how NCCC Members helped to remove trash and debris
in the communities in which they worked. A team working at an organization focused on the
elderly reported, “1/3 of an acre of land was cleared of unwanted brush or vegetation by
removing 190 pounds of exotic vegetation, 500 pounds of underbrush, and 1300 pounds of debris
of trash,” and another team reported, “At Fortune School, Silver 5 led 81 volunteers in picking
up 30 pounds of garbage and unwanted debris from the front parking lot, cleaned 99 windows,
set up two speed limit signs, assembled 500 recruitment packets, decorated 50 posters, and
installed two curtains.”
In addition to removing trash and recyclables, some teams worked to remove natural debris to
improve yards or maintain trails: “At the Castana Creek Crossing, part of a 4 day community
build, Members supervised 80 volunteers in removing 205 pounds of invasive species (.5 acres),
restored 50 feet of stream bed, removed 550 pounds of debris, planted 255 native plants, and
completed a total of 1 acre of landscaping.”
Other projects focused on supporting museums and historical buildings – sites that often lack the
funding and capacity to undertake the work needed done to preserve artifacts, maintain building
upkeep, and provide excellent visitor experiences. One project in Iowa wrote:
“The NCCC group also helped move a warehouse of historical artifacts to a more secure
location to help preserve the items. Along with moving the artifacts, they built shelves
and helped develop a more efficient way to store them. The team also spent most of their
days working on the Logsdon (which is a paddleboat that belongs to the museum). They
scraped old paint, primed and re-painted the boat during their entire project.”
In providing these services for community organizations, NCCC Members provided a service
that organizations themselves were not always able to do.
Human Capital and Learning NCCC teams contributed to community and organizational capacity by supporting human capital
and learning. Most outputs involved supporting K-12 students through tutoring and summer and
out-of-school programming (Table 33).
Outputs Number of Outputs Percent
Pounds of debris of trash removed 1039 71.12
Museums or historical buildings renovated or
supported
129 8.83
Neighborhood clean up activities organized or
conducted
105 7.19
Archeological sites supported 53 3.63
Museums or historical buildings supported 47 3.22
Museums or historical buildings renovated or
restored
46 3.15
Historical cemeteries restored or maintained 42 2.87
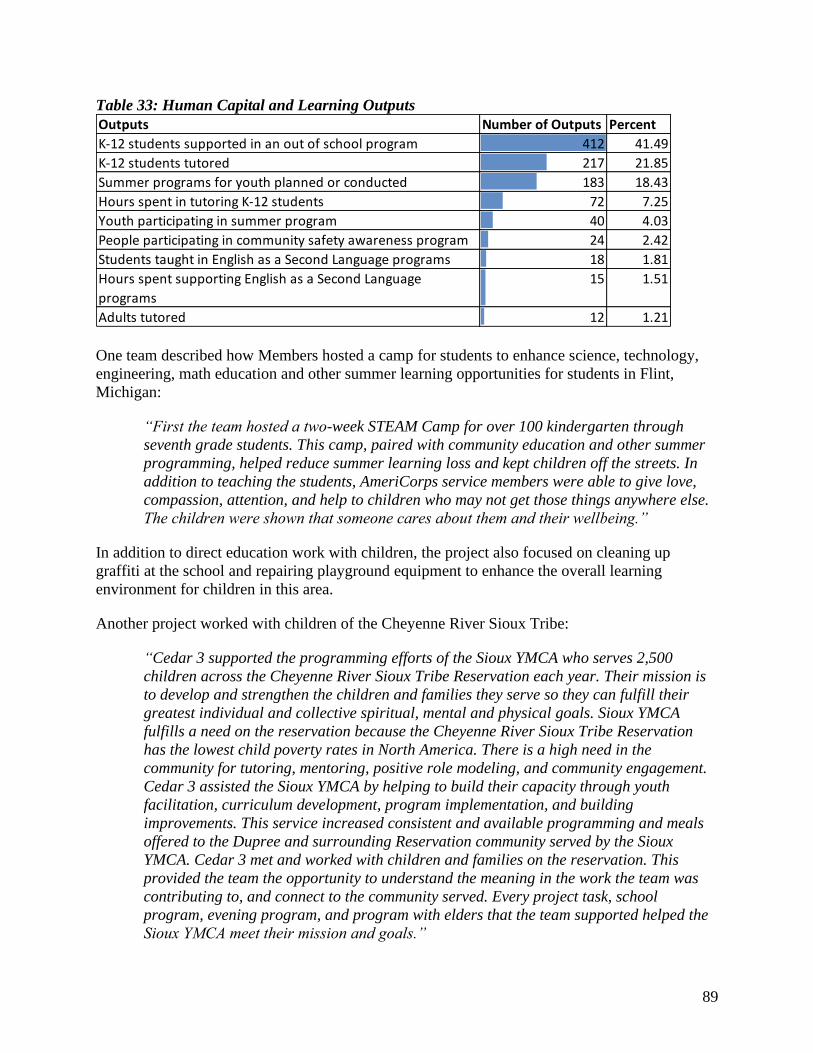
89
Table 33: Human Capital and Learning Outputs
One team described how Members hosted a camp for students to enhance science, technology,
engineering, math education and other summer learning opportunities for students in Flint,
Michigan:
“First the team hosted a two-week STEAM Camp for over 100 kindergarten through
seventh grade students. This camp, paired with community education and other summer
programming, helped reduce summer learning loss and kept children off the streets. In
addition to teaching the students, AmeriCorps service members were able to give love,
compassion, attention, and help to children who may not get those things anywhere else.
The children were shown that someone cares about them and their wellbeing.”
In addition to direct education work with children, the project also focused on cleaning up
graffiti at the school and repairing playground equipment to enhance the overall learning
environment for children in this area.
Another project worked with children of the Cheyenne River Sioux Tribe:
“Cedar 3 supported the programming efforts of the Sioux YMCA who serves 2,500
children across the Cheyenne River Sioux Tribe Reservation each year. Their mission is
to develop and strengthen the children and families they serve so they can fulfill their
greatest individual and collective spiritual, mental and physical goals. Sioux YMCA
fulfills a need on the reservation because the Cheyenne River Sioux Tribe Reservation
has the lowest child poverty rates in North America. There is a high need in the
community for tutoring, mentoring, positive role modeling, and community engagement.
Cedar 3 assisted the Sioux YMCA by helping to build their capacity through youth
facilitation, curriculum development, program implementation, and building
improvements. This service increased consistent and available programming and meals
offered to the Dupree and surrounding Reservation community served by the Sioux
YMCA. Cedar 3 met and worked with children and families on the reservation. This
provided the team the opportunity to understand the meaning in the work the team was
contributing to, and connect to the community served. Every project task, school
program, evening program, and program with elders that the team supported helped the
Sioux YMCA meet their mission and goals.”
Outputs Number of Outputs Percent
K-12 students supported in an out of school program 412 41.49
K-12 students tutored 217 21.85
Summer programs for youth planned or conducted 183 18.43
Hours spent in tutoring K-12 students 72 7.25
Youth participating in summer program 40 4.03
People participating in community safety awareness program 24 2.42
Students taught in English as a Second Language programs 18 1.81
Hours spent supporting English as a Second Language
programs
15 1.51
Adults tutored 12 1.21
90
Supporting Community Gardens and Farms NCCC projects supported community and organizational capacity by developing and
maintaining community gardens and farms. About 9 in 10 outputs involved starting or tending
gardens; 1 in 10 harvested food.
The gardens and farms that NCCC Members worked on are used both for local food production
and for education about gardening, healthy eating, and dietary diversity. One project narrative
explained,
“Water 5 helped UKB build gardens on tribal land for the UKB's Child Development Center and
Elder Community Center. Additionally, the team worked in the community building personal
gardens at 6 UKB community member's homes. Team Members collaborated with several Elders
to help relocate and expand the garden for the Elder Center. The team planted a variety of
vegetables and herbs, and constructed a wire fence around the 25x30 foot garden bed.
Additionally, the team initiated a completely new garden for the Child Development Center for
the children to become engaged in gardening and to learn more about local food production.
The Child Center staff and children served will enjoy three new raised garden beds that are
ready for planting. Through all these efforts, UKB community members will have easier access
to fresh produce and therefore many health and economic benefits.”
As this narrative notes, many of the projects worked to build gardening opportunities that offered
educational benefits and cultivated an appreciation for gardening and food in Members of the
community.
In other cases, NCCC Members’ work at gardens and farms was more directly centered around
food security for those in need. One such project described how NCCC Members provided
essential services to a farm that supported a local food bank and provided food for members of
the community:
“During their service with the Josephine County Food Bank, Gold 3 harvested 1778 pounds of
produce and collected 5750 pounds of food from various donors in Grants Pass. These donations
and produce were then distributed to members of the community who cannot afford their own
food. The Josephine County Food Bank only has two employees who work the 6 acre farm and
would not be able to produce the expected 40,000 pounds of fresh produce and do the rest of the
work necessary to keep the farm going. The new greenhouse Gold 3 built will increase the farm's
productivity. The fencing the team repaired will keep herbivores from eating what the farm
grows. The restored barn will be a good space for coordinating volunteers, teaching local
students about environmental stewardship and gardening, and hosting events for the donors to
the food bank...Gold 3's work educating various groups that visited the farm increased the
community's awareness of the farm, its activities, and the crisis their neighbors are facing. At the
same time, the team educated these visitors in proper and environmentally friendly ways to grow
their own food and become more self-sufficient.”
Supporting Community Special Events Four hundred thirty-four NCCC projects helped support special events occurring in the
communities in which they worked.
91
For many community-based organizations, special events are a key opportunity to raise
awareness and funds for their organization. By supporting these events, NCCC Members
strengthen organizations’ ability to fund their work and generate interest and excitement around
the work of the organizations. One project explained:
“Earth 6 strengthened the community by assisting in putting on Wildwoods Lanterns
festival that serves as the primary source of revenue for year. Wildwood provides the
greater Little Rock community with access to nature, the arts, and diverse cultural events
and the work of Earth 6 helped to grow the efforts that Wildwood puts forth in engaging
the community through art and nature. The Lanterns festival itself provides the
community with a look into Chinese, German, Mexican, and UK culture. Over the course
of the 3 day festival approximately 4,100 attended. The first month at Wildwood earth 6
focused primarily on cleaning up the park and helping to change the perception that the
park is overgrown and uncared for. The work that the team completed helped to sustain
the park for the coming year, including making trails accessible again and making the
park a safer place for people to visit and enjoy. By removing invasive species and debris
throughout the park the team put Wildwood in a better position to grow the green space,
artistic offerings and educational outreach to visitors of the park.”
In some cases, while Members helped ensure event success, these events also provided an
opportunity for Members to grow closer to the communities in which they worked. A project in
Joplin, Missouri explained, “May 22nd commemorated the one-year anniversary of the tornado
in Joplin and Joplin “celebrated” by holding a Day of Unity. Despite having arrived in Joplin a
week prior, Earth 2 participated in the day. They started the Day at the Walmart were they
passed out flags and bracelets. Afterwards, they participated in the town’s Unity Walk, which
was approximately 3.5 miles long and passed by the areas that were hit the hardest by the
tornado. The Unity Walk ended at Cunningham Park, where the team passed out programs for
the memorial and subsequently watched the ceremony.”
Organizing Donations, Supplies, or Data NCCC projects also directly supported the work of community organizations by sorting, doing
inventorying, organizing, and archiving donations, supplies, materials, and data. Most of this
work involved food donations, but some projects also organized historical materials.
In many cases, NCCC Members helped receive, inventory, and distribute food for organizations
such as food banks. One project narrative explained, “Habitat for Humanity also partnered with
the CARE Food Pantry and Earth 5 distributed 1500 lbs. of food to 30+ individuals.”
Another project reported, “Members also supported a food and water drive that received 7500
pounds of food and 288 gallons of water and distributed these goods to 250 local community
members.”
A project in Virginia reported:
“Delta 7 was able to participate in delivering 1,500+ pounds of food from Trader Joes
on Saturdays to locations where people could come and pick up what they needed for
their families each week. Along the same lines, Delta 7 helped prepare three mobile food
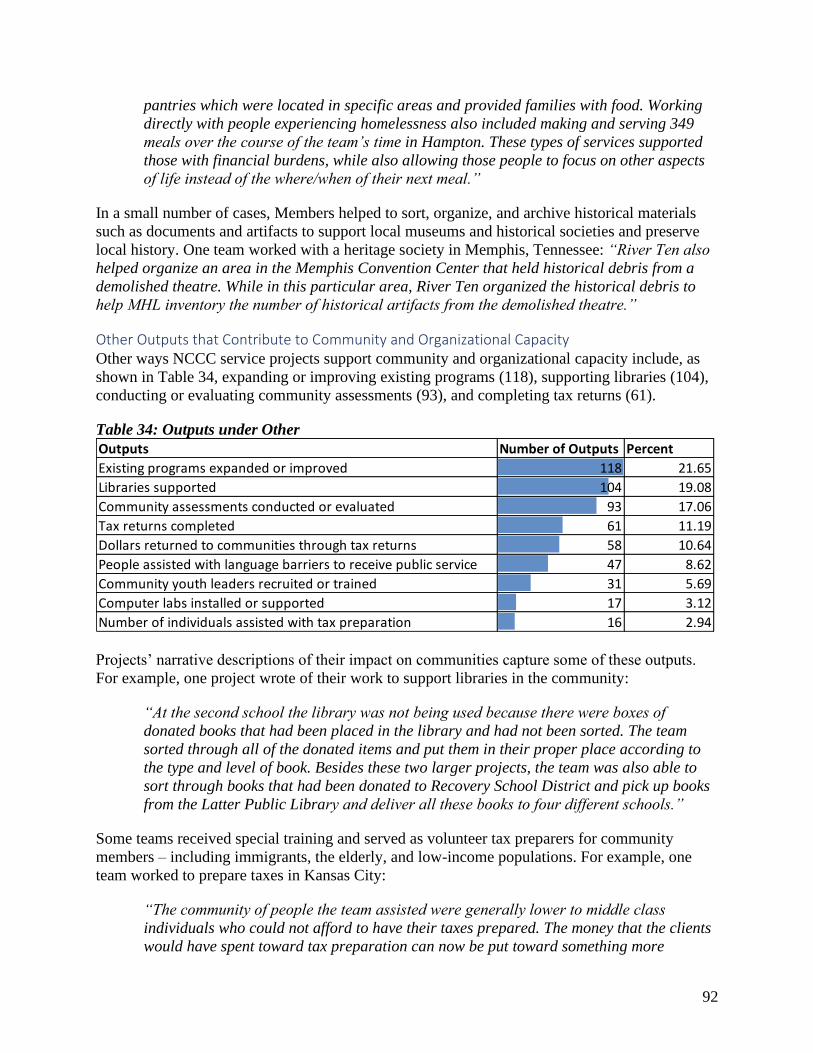
92
pantries which were located in specific areas and provided families with food. Working
directly with people experiencing homelessness also included making and serving 349
meals over the course of the team’s time in Hampton. These types of services supported
those with financial burdens, while also allowing those people to focus on other aspects
of life instead of the where/when of their next meal.”
In a small number of cases, Members helped to sort, organize, and archive historical materials
such as documents and artifacts to support local museums and historical societies and preserve
local history. One team worked with a heritage society in Memphis, Tennessee: “River Ten also
helped organize an area in the Memphis Convention Center that held historical debris from a
demolished theatre. While in this particular area, River Ten organized the historical debris to
help MHL inventory the number of historical artifacts from the demolished theatre.”
Other Outputs that Contribute to Community and Organizational Capacity Other ways NCCC service projects support community and organizational capacity include, as
shown in Table 34, expanding or improving existing programs (118), supporting libraries (104),
conducting or evaluating community assessments (93), and completing tax returns (61).
Table 34: Outputs under Other
Projects’ narrative descriptions of their impact on communities capture some of these outputs.
For example, one project wrote of their work to support libraries in the community:
“At the second school the library was not being used because there were boxes of
donated books that had been placed in the library and had not been sorted. The team
sorted through all of the donated items and put them in their proper place according to
the type and level of book. Besides these two larger projects, the team was also able to
sort through books that had been donated to Recovery School District and pick up books
from the Latter Public Library and deliver all these books to four different schools.”
Some teams received special training and served as volunteer tax preparers for community
members – including immigrants, the elderly, and low-income populations. For example, one
team worked to prepare taxes in Kansas City:
“The community of people the team assisted were generally lower to middle class
individuals who could not afford to have their taxes prepared. The money that the clients
would have spent toward tax preparation can now be put toward something more
Outputs Number of Outputs Percent
Existing programs expanded or improved 118 21.65
Libraries supported 104 19.08
Community assessments conducted or evaluated 93 17.06
Tax returns completed 61 11.19
Dollars returned to communities through tax returns 58 10.64
People assisted with language barriers to receive public service 47 8.62
Community youth leaders recruited or trained 31 5.69
Computer labs installed or supported 17 3.12
Number of individuals assisted with tax preparation 16 2.94
93
meaningful to them and their families, like education expenses, or household bills.
Providing a free service to lower income families allowed the team to have a tangible
and impactful presence within the community that improved lives. The team provided free
tax assistance to over 2,000 families. That’s 2,000 people who would have otherwise had
to spend a paycheck on tax services.”
Another team in Kentucky reported:
“Through the Volunteer Income Tax Assistance program administered through the
Brighton Center, River 6 was trained and made available to serve Northern Kentucky
residents through tax preparation, from Basic level to Advanced including Health
Savings Account taxes. As a resource, River 6 made a positive impact on more than 125
families and individuals, returning a total of $375,000 and saving the Northern Kentucky
area residents at least $18,000 on paid tax preparation. This amount both returned and
saved can make a real difference in the lives of Northern Kentucky's residents.”
NCCC Members supported communities in numerous other ways. They assisted those with
limited English-language abilities: “Blue Four also participated in the construction of three
homes and helped renovate 10 other homes. The team also helped clear one empty lot and
provided help to 34 senior citizens, one disabled person, and 30 people with language barriers
to receive assistance.”
And, they constructed and renovated spaces like computer labs: “A total of 9 rooms were
renovated, which included a STEM classroom, a computer lab, 2 libraries, an art room, a
cafeteria/gymnasium, an office and a cafeteria kitchen. In total, the team organized, cleaned and
painted approximately 6,450.5 square feet of the BUCC, in addition to painting 4 murals.”

94
High-level Findings of FEMA Projects This section highlights the characteristics and accomplishments of FEMA Corps service projects.
This section also summarizes the themes associated with strengthening communities and
Member impact across FEMA Corps service projects.
In 2012, the FEMA and CNCS created FEMA Corp, a track of the AmeriCorps NCCC program.
FEMA Corps is a national service program dedicated to help communities prepare for and
respond to disasters.
Project Characteristics AmeriCorps NCCC FEMA Corps teams completed 1,568 service projects through deployment of
12,573 FEMA Corps Members and Team Leaders to all 50 U.S. states and Washington, D.C.,
including 3 U.S. territories (Puerto Rico, the U.S. Virgin Islands, and Northern Mariana Islands).
The Federal Government sponsored between 98% and 100% of the FEMA Corps projects each
year from 2013 to 2019. Local and national nonprofits sponsored about 2% of FEMA Corps
service projects.
All FEMA service projects recorded Natural and Other Disasters as their primary issue area14,
but they also had accomplishments that fell under a secondary issue area. As previous noted,
secondary issue areas include the five primary issue areas (Energy Conservation (EC),
Environmental Stewardship and Conservation (ENV), Infrastructure Improvement (INF), Natural
and Other Disasters (DIS), and Urban and Rural Development (URD)), and five additional
categories: FEMA (FMA), Populations Assisted and Engaged (VAR), Education Support
(EDU), Unmet Human Needs (HUM), and Public Safety (PS). More than one-third (40%, 625)
of FEMA service projects have a secondary issue area. Of the 625 projects with a secondary
issue area, 525 (84%) have one secondary issue area while 100 (16%) selected more than one,
resulting in multiple combinations.
Table 35 shows the distribution across the secondary issue area categories. The FEMA category
was the most frequent secondary issue area, selected by 1,503 (96%) of the projects, with 522
service projects (33%) selecting it as their only secondary issue area.15
14 The total number of projects that reported FEMA as their program type was 1,570 projects. There are two FEMA
projects with primary issue area of Urban and Rural Development (URD). These are errors and excluded from this
FEMA sites analysis. 15 “FEMA” is not one of the options for a primary issue area.
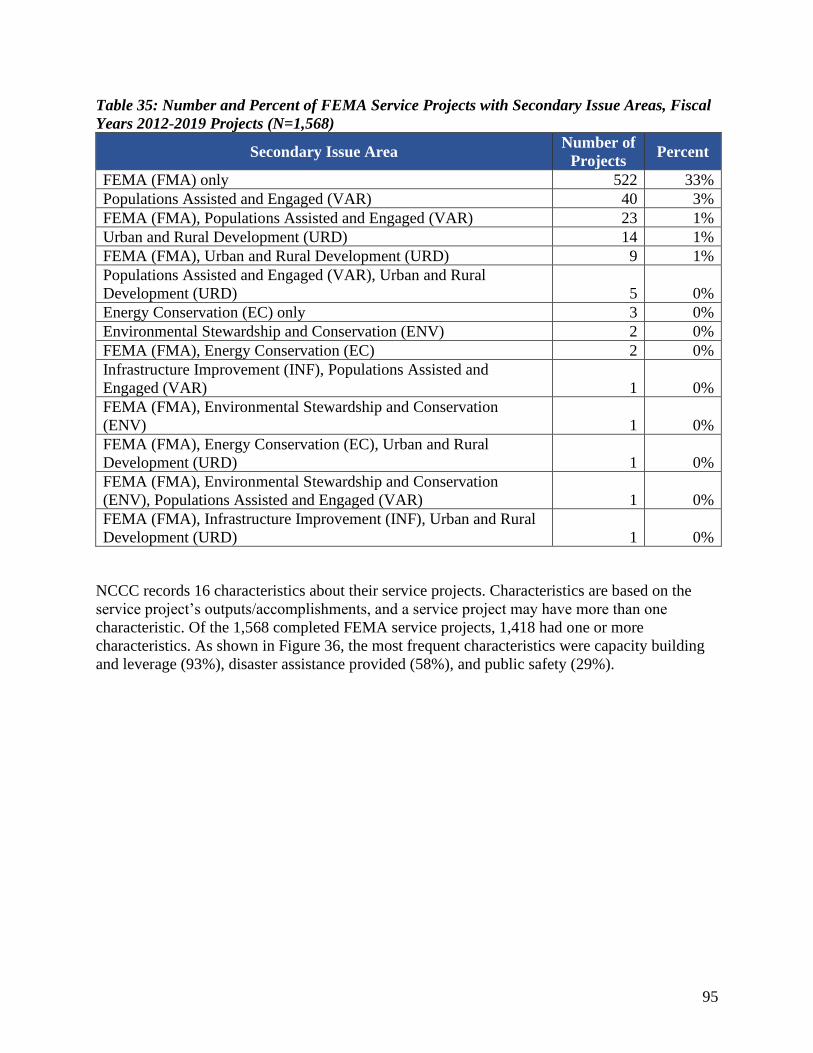
95
Table 35: Number and Percent of FEMA Service Projects with Secondary Issue Areas, Fiscal
Years 2012-2019 Projects (N=1,568)
Secondary Issue Area Number of
Projects Percent
FEMA (FMA) only 522 33%
Populations Assisted and Engaged (VAR) 40 3%
FEMA (FMA), Populations Assisted and Engaged (VAR) 23 1%
Urban and Rural Development (URD) 14 1%
FEMA (FMA), Urban and Rural Development (URD) 9 1%
Populations Assisted and Engaged (VAR), Urban and Rural
Development (URD) 5 0%
Energy Conservation (EC) only 3 0%
Environmental Stewardship and Conservation (ENV) 2 0%
FEMA (FMA), Energy Conservation (EC) 2 0%
Infrastructure Improvement (INF), Populations Assisted and
Engaged (VAR) 1 0%
FEMA (FMA), Environmental Stewardship and Conservation
(ENV) 1 0%
FEMA (FMA), Energy Conservation (EC), Urban and Rural
Development (URD) 1 0%
FEMA (FMA), Environmental Stewardship and Conservation
(ENV), Populations Assisted and Engaged (VAR) 1 0%
FEMA (FMA), Infrastructure Improvement (INF), Urban and Rural
Development (URD) 1 0%
NCCC records 16 characteristics about their service projects. Characteristics are based on the
service project’s outputs/accomplishments, and a service project may have more than one
characteristic. Of the 1,568 completed FEMA service projects, 1,418 had one or more
characteristics. As shown in Figure 36, the most frequent characteristics were capacity building
and leverage (93%), disaster assistance provided (58%), and public safety (29%).

96
Figure 36: Characteristics FEMA Service Projects, Fiscal Years 2012-2019 (N=1,568)
Note: Percent will not add to 100% because service projects may have more than one characteristic.
Table 36 shows the Natural and Other Disaster (DIS) issue area where an output type had 100 or
more counts. Among FEMA service projects, the Disaster Recovery category had the largest
number of outputs. Within this category, the output type with the highest count was “Resource
guides or reports developed or drafted” (443,16%). The second largest category in this issue area
was Disaster Prevention, Preparedness, and Mitigation, and the output type with the largest count
was “Number of informational documents or publications assembled or distributed” (311, 17%).
Lastly, in the Disaster Response category, the output type “Disaster Service Facilities supported”
accounted for 40% of the outputs.
0% 10% 20% 30% 40% 50% 60% 70% 80% 90% 100%
Access to Care
Community Support
Populations Assisted and Engaged
Housing
Public Safety
Disaster Assistance Provided
Capacity Building & Leverage
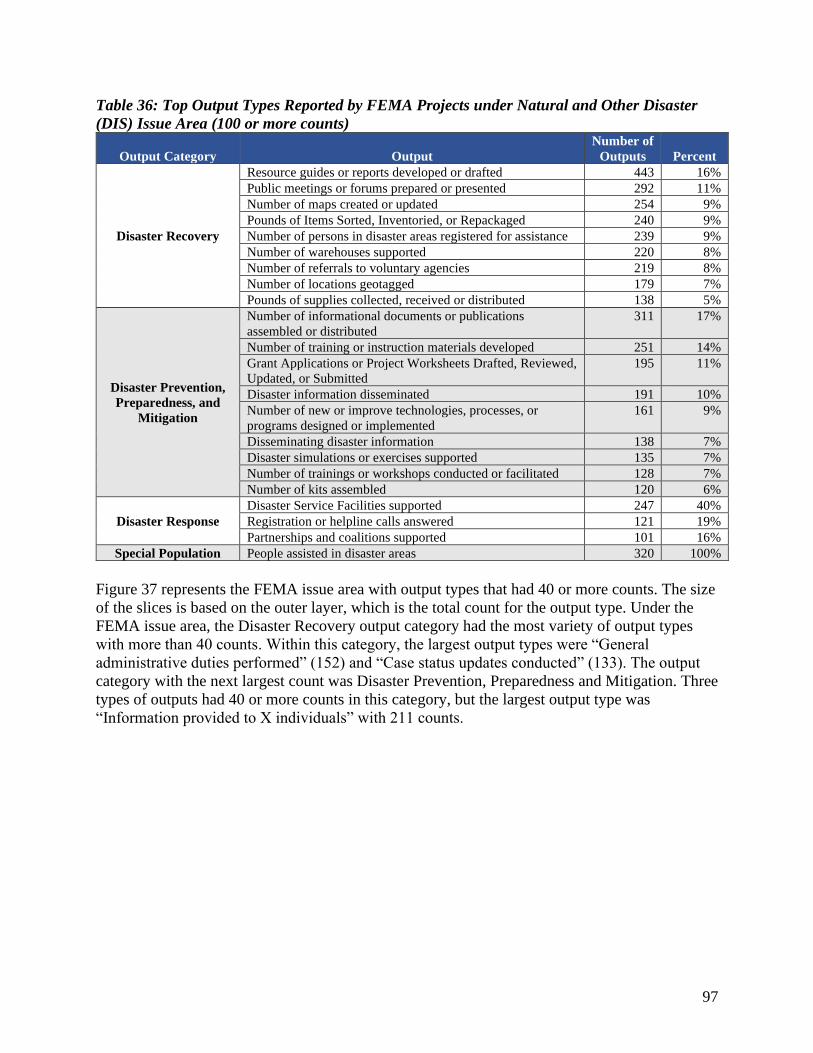
97
Table 36: Top Output Types Reported by FEMA Projects under Natural and Other Disaster
(DIS) Issue Area (100 or more counts)
Output Category Output
Number of
Outputs Percent
Disaster Recovery
Resource guides or reports developed or drafted 443 16%
Public meetings or forums prepared or presented 292 11%
Number of maps created or updated 254 9%
Pounds of Items Sorted, Inventoried, or Repackaged 240 9%
Number of persons in disaster areas registered for assistance 239 9%
Number of warehouses supported 220 8%
Number of referrals to voluntary agencies 219 8%
Number of locations geotagged 179 7%
Pounds of supplies collected, received or distributed 138 5%
Disaster Prevention,
Preparedness, and
Mitigation
Number of informational documents or publications
assembled or distributed
311 17%
Number of training or instruction materials developed 251 14%
Grant Applications or Project Worksheets Drafted, Reviewed,
Updated, or Submitted
195 11%
Disaster information disseminated 191 10%
Number of new or improve technologies, processes, or
programs designed or implemented
161 9%
Disseminating disaster information 138 7%
Disaster simulations or exercises supported 135 7%
Number of trainings or workshops conducted or facilitated 128 7%
Number of kits assembled 120 6%
Disaster Response
Disaster Service Facilities supported 247 40%
Registration or helpline calls answered 121 19%
Partnerships and coalitions supported 101 16%
Special Population People assisted in disaster areas 320 100%
Figure 37 represents the FEMA issue area with output types that had 40 or more counts. The size
of the slices is based on the outer layer, which is the total count for the output type. Under the
FEMA issue area, the Disaster Recovery output category had the most variety of output types
with more than 40 counts. Within this category, the largest output types were “General
administrative duties performed” (152) and “Case status updates conducted” (133). The output
category with the next largest count was Disaster Prevention, Preparedness and Mitigation. Three
types of outputs had 40 or more counts in this category, but the largest output type was
“Information provided to X individuals” with 211 counts.
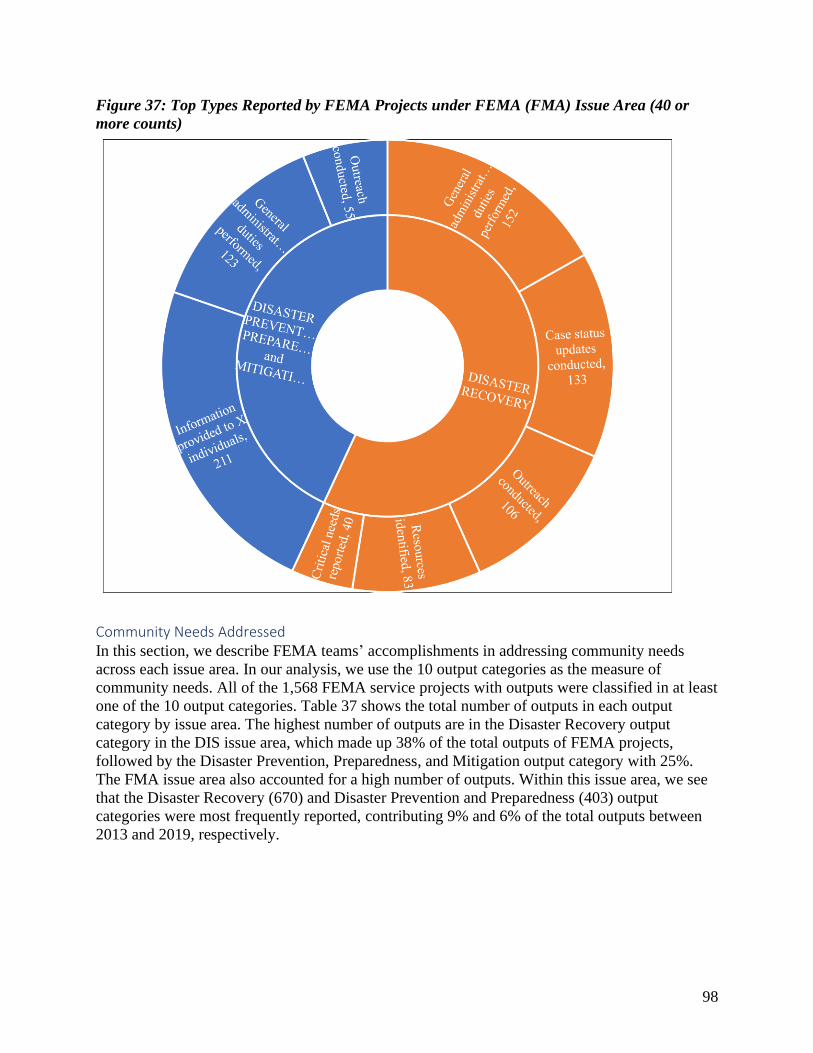
98
Figure 37: Top Types Reported by FEMA Projects under FEMA (FMA) Issue Area (40 or
more counts)
Community Needs Addressed In this section, we describe FEMA teams’ accomplishments in addressing community needs
across each issue area. In our analysis, we use the 10 output categories as the measure of
community needs. All of the 1,568 FEMA service projects with outputs were classified in at least
one of the 10 output categories. Table 37 shows the total number of outputs in each output
category by issue area. The highest number of outputs are in the Disaster Recovery output
category in the DIS issue area, which made up 38% of the total outputs of FEMA projects,
followed by the Disaster Prevention, Preparedness, and Mitigation output category with 25%.
The FMA issue area also accounted for a high number of outputs. Within this issue area, we see
that the Disaster Recovery (670) and Disaster Prevention and Preparedness (403) output
categories were most frequently reported, contributing 9% and 6% of the total outputs between
2013 and 2019, respectively.
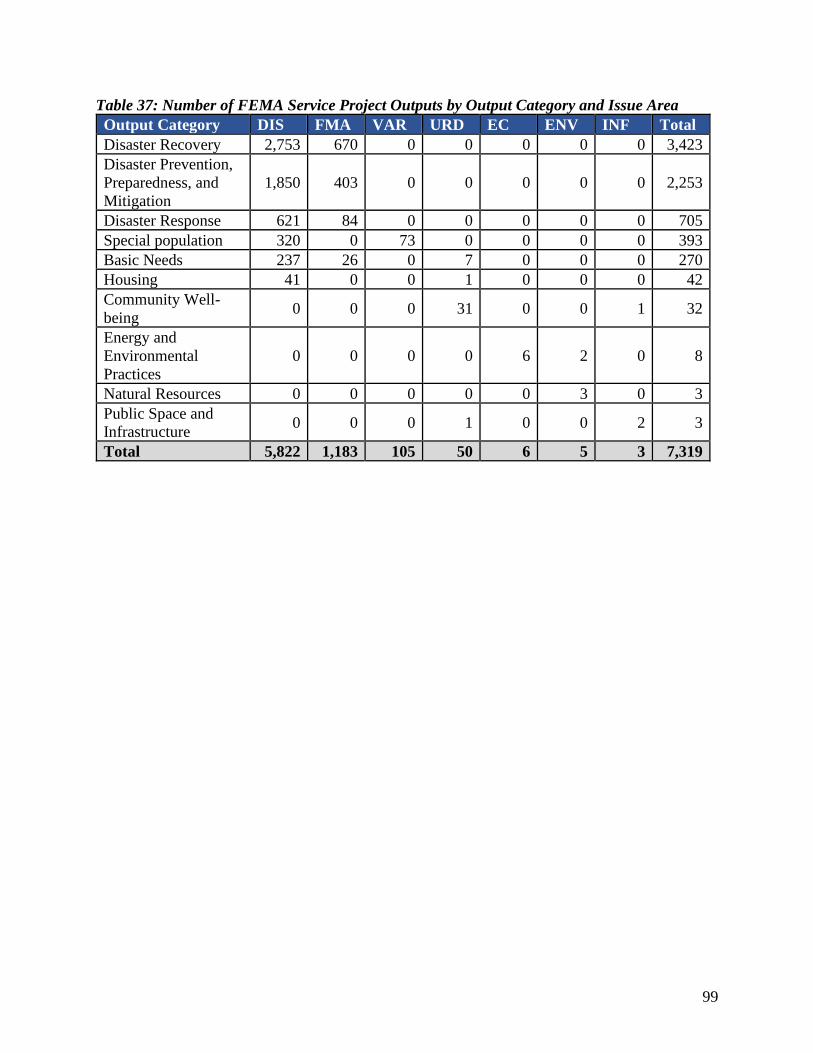
99
Table 37: Number of FEMA Service Project Outputs by Output Category and Issue Area
Output Category DIS FMA VAR URD EC ENV INF Total
Disaster Recovery 2,753 670 0 0 0 0 0 3,423
Disaster Prevention,
Preparedness, and
Mitigation
1,850 403 0 0 0 0 0 2,253
Disaster Response 621 84 0 0 0 0 0 705
Special population 320 0 73 0 0 0 0 393
Basic Needs 237 26 0 7 0 0 0 270
Housing 41 0 0 1 0 0 0 42
Community Well-
being 0 0 0 31 0 0 1 32
Energy and
Environmental
Practices
0 0 0 0 6 2 0 8
Natural Resources 0 0 0 0 0 3 0 3
Public Space and
Infrastructure 0 0 0 1 0 0 2 3
Total 5,822 1,183 105 50 6 5 3 7,319
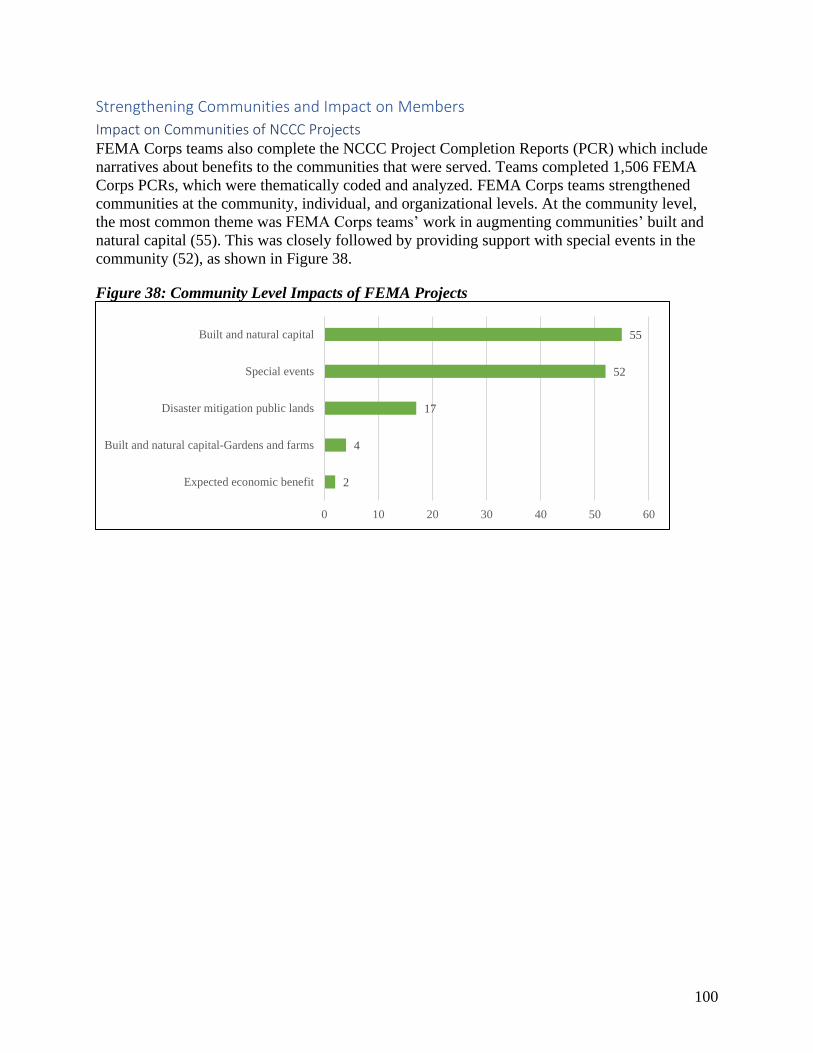
100
Strengthening Communities and Impact on Members
Impact on Communities of NCCC Projects FEMA Corps teams also complete the NCCC Project Completion Reports (PCR) which include
narratives about benefits to the communities that were served. Teams completed 1,506 FEMA
Corps PCRs, which were thematically coded and analyzed. FEMA Corps teams strengthened
communities at the community, individual, and organizational levels. At the community level,
the most common theme was FEMA Corps teams’ work in augmenting communities’ built and
natural capital (55). This was closely followed by providing support with special events in the
community (52), as shown in Figure 38.
Figure 38: Community Level Impacts of FEMA Projects
2
4
17
52
55
0 10 20 30 40 50 60
Expected economic benefit
Built and natural capital-Gardens and farms
Disaster mitigation public lands
Special events
Built and natural capital

101
Of individual-level impacts, FEMA teams most frequently provided disaster assistance support
(565). The other common impacts included support to people in crisis (225), helping individuals
be better prepared for future disasters (194), and assisting individuals meet basic needs (161).
Under psychosocial benefits, FEMA teams helped enhance trust in the government or FEMA
(53); assisted individuals recover from disasters (47); and improved food security (2) as
exhibited in Figure 39.
Figure 39: Individual Level Impacts of FEMA Projects
In addition to community-level and individual-level impacts, our analysis of FEMA projects
found organizational-level impacts as shown in Figure 40. These impacts supported communities
through organizational infrastructure improvements (1,009) and, more specifically, providing
increased data and infrastructure for FEMA (867). Organizational infrastructure refers to both
physical infrastructures, like buildings or office equipment, data, reports or materials, and
policies or procedures. Another general theme observed was organizational effectiveness (507),
which refers to enhancing the organization’s ability to expand its services, relieving organization
staff of some of their work burden, or increasing the efficiency of the organization.
2
3
6
6
8
18
43
47
49
53
57
59
71
83
161
194
225
565
0 100 200 300 400 500 600
Psychosocial benefits -Food security
Expected economic benefit
Disaster home refurbishment
Veterans
Return to home and work
Disaster home liveability
Special populations
Psychosocial benefits-Disaster recovery
Basic needs -Affordable housing
Psychosocial benefits -Trust in government or FEMA
Volunteer engagement and effectiveness
Physical health and safety
Human capital and learning
Psychosocial benefits
Basic needs
Disaster knowledge- Preparedness
Crisis
Disaster assistance
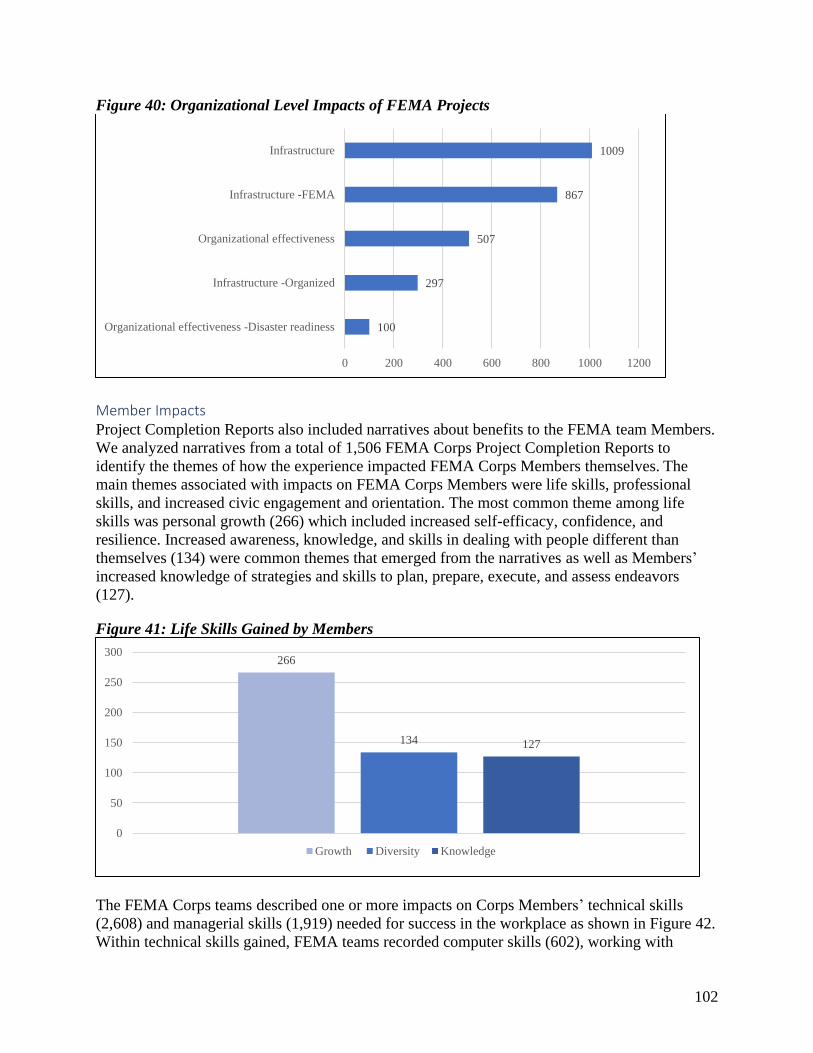
102
Figure 40: Organizational Level Impacts of FEMA Projects
Member Impacts Project Completion Reports also included narratives about benefits to the FEMA team Members.
We analyzed narratives from a total of 1,506 FEMA Corps Project Completion Reports to
identify the themes of how the experience impacted FEMA Corps Members themselves. The
main themes associated with impacts on FEMA Corps Members were life skills, professional
skills, and increased civic engagement and orientation. The most common theme among life
skills was personal growth (266) which included increased self-efficacy, confidence, and
resilience. Increased awareness, knowledge, and skills in dealing with people different than
themselves (134) were common themes that emerged from the narratives as well as Members’
increased knowledge of strategies and skills to plan, prepare, execute, and assess endeavors
(127).
Figure 41: Life Skills Gained by Members
The FEMA Corps teams described one or more impacts on Corps Members’ technical skills
(2,608) and managerial skills (1,919) needed for success in the workplace as shown in Figure 42.
Within technical skills gained, FEMA teams recorded computer skills (602), working with
100
297
507
867
1009
0 200 400 600 800 1000 1200
Organizational effectiveness -Disaster readiness
Infrastructure -Organized
Organizational effectiveness
Infrastructure -FEMA
Infrastructure
266
134 127
0
50
100
150
200
250
300
Growth Diversity Knowledge

103
people in crisis (319), construction skills (28), and environmental management skills (15).
Within managerial skills, FEMA teams described oral and written communication skills (577),
leadership skills (192), and teamwork skills (166).
Figure 42: Professional Skills Gained by Members
In addition to the professional skills shown in the figure, FEMA Corps teams described how
national service helped inform them about career choices, affirming or changing their career
interests (474). Lastly, 222 FEMA Corps teams described impacts on their knowledge,
understanding and learning about strengthening communities and how relationships with
community-based organizations and coalitions work, including increased civic knowledge and
civic participation (e.g., knowledge of how to volunteer, how to collaborate with other Members
of the community to solve community problems, how community-based organizations or
coalitions operate).
High-Level Findings of NCCC Campuses This section summarizes key findings for each of the NCCC Regions: Atlantic, North Central,
Pacific, Southern, and Southwest. We summarize the projects’ characteristics and how service
projects strengthened communities and impacted Members from 2012 through Spring 2019.
AmeriCorps NCCC has four active regions, which are North Central, Pacific, Southern, and
Southwest. In 2017, AmeriCorps NCCC closed its Atlantic Campus. As mentioned in previous
sections, the database contains information on 5,004 NCCC service projects completed from
2012 to Spring of 2019 from the four regional campuses. Of this total, 120 service projects were
randomly selected from the Atlantic Campus.
AmeriCorps NCCC’s five issue areas are Energy Conservation (EC), Environmental
Stewardship and Conservation (ENV), Infrastructure Improvement (INF), Natural and Other
Disasters (DIS), and Urban and Rural Development (URD). As shown in Figure 1, the top three
issue areas are Natural and Other Disasters (DIS), Urban and Rural Development (URD), and
Environmental Stewardship and Conservation (ENV). About half of the service projects are
within the issue area of Natural and Other Disasters (DIS) while the second most frequent issue
15
28
166
192
319
577
602
0 100 200 300 400 500 600 700
Environmental Management Skills
Construction Skills
Teamwork Skills
Leadership Skills
Crisis Response Skills
Communication Skills
Computer Skills
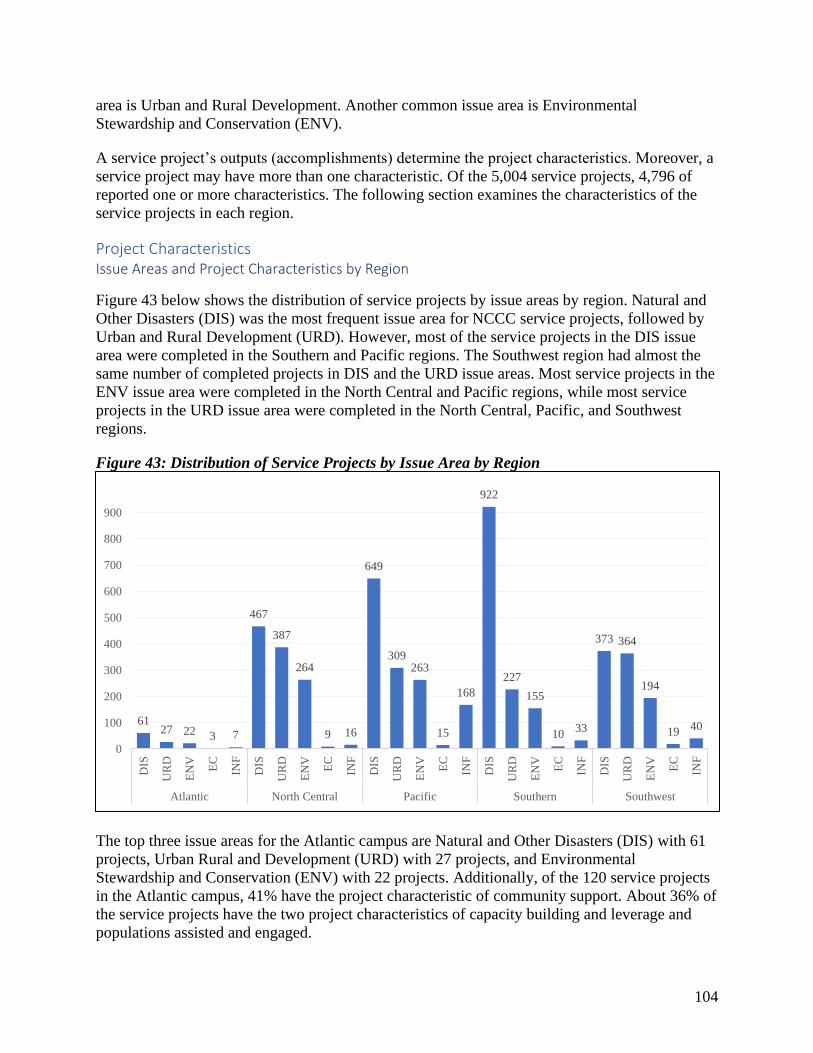
104
area is Urban and Rural Development. Another common issue area is Environmental
Stewardship and Conservation (ENV).
A service project’s outputs (accomplishments) determine the project characteristics. Moreover, a
service project may have more than one characteristic. Of the 5,004 service projects, 4,796 of
reported one or more characteristics. The following section examines the characteristics of the
service projects in each region.
Project Characteristics Issue Areas and Project Characteristics by Region
Figure 43 below shows the distribution of service projects by issue areas by region. Natural and
Other Disasters (DIS) was the most frequent issue area for NCCC service projects, followed by
Urban and Rural Development (URD). However, most of the service projects in the DIS issue
area were completed in the Southern and Pacific regions. The Southwest region had almost the
same number of completed projects in DIS and the URD issue areas. Most service projects in the
ENV issue area were completed in the North Central and Pacific regions, while most service
projects in the URD issue area were completed in the North Central, Pacific, and Southwest
regions.
Figure 43: Distribution of Service Projects by Issue Area by Region
The top three issue areas for the Atlantic campus are Natural and Other Disasters (DIS) with 61
projects, Urban Rural and Development (URD) with 27 projects, and Environmental
Stewardship and Conservation (ENV) with 22 projects. Additionally, of the 120 service projects
in the Atlantic campus, 41% have the project characteristic of community support. About 36% of
the service projects have the two project characteristics of capacity building and leverage and
populations assisted and engaged.
6127 22 3 7
467
387
264
9 16
649
309263
15
168
922
227
155
1033
373 364
194
1940
0
100
200
300
400
500
600
700
800
900
DIS
UR
D
EN
V
EC
INF
DIS
UR
D
EN
V
EC
INF
DIS
UR
D
EN
V
EC
INF
DIS
UR
D
EN
V
EC
INF
DIS
UR
D
EN
V
EC
INF
Atlantic North Central Pacific Southern Southwest
105
The North Central region recorded 1,143 completed service projects. For this region, Natural and
Other Disasters (DIS) is the most frequently occurring issue area (467), Urban Rural and
Development (URD) is the second most common issue area (387), and Environmental
Stewardship and Conservation (ENV) is third (264). The most frequent project characteristics at
the North Central region were community support (40%), at-risk ecosystems (33%), and
infrastructure improvement (32%).
The Pacific region completed 1,404 service projects. Of these service projects, 649 were in the
issue area of Natural and Other Disasters (DIS). Thus, DIS is the most common issue area in the
region. Following at 309 projects is Urban and Development (URD), and Environmental
Stewardship and Conservation (ENV) is next with 263 projects. Almost half of the service
projects in the Pacific region have a project characteristic of at-risk ecosystems (45%). Two
other common project characteristics found were community support (43%) and infrastructure
improvement (41%).
There were 1,347 completed service projects in the Southern region. More than two-thirds, 68%,
of the Southern region’s service projects identified their primary issue area as Natural and Other
Disasters (DIS) (922). Furthermore, capacity building and leverage compose almost half of the
project characteristics in the Southern region’s service projects; 44% of projects focused on
providing disaster assistance, while 31% focused on housing.
The top three issue areas for the Southwest campus are Natural and Other Disasters (DIS), Urban
and Rural Development (URD), and Environmental Stewardship and Conservation (ENV).
Although Natural and other Disasters (DIS) was the most frequent issue area (373 of the 990
service projects), Urban and Rural Development (URD) also had a high number of projects
(364). More than half of the Southwest’s projects were characterized as community support
(51%). We also found that 42% of this region’s service projects improved infrastructure, and
39% worked on at-risk ecosystems.
Community Needs Addressed
We identified the output categories of 4,769 service projects by grouping together outputs
(accomplishments). The analysis for the output categories was guided by the primary intended
outcome found in the AmeriCorps NCCC Team Project Output document. We grouped these
primary intended outcomes into 10 overarching output categories: Basic Needs; Community
Well-being; Disaster Prevention, Preparedness and Mitigation; Disaster Recovery; Disaster
Response; Energy and Environmental Practices; Housing; Natural Resources; Public Space and
Infrastructure; and Special Populations. We use these categories as the measure of community
needs.
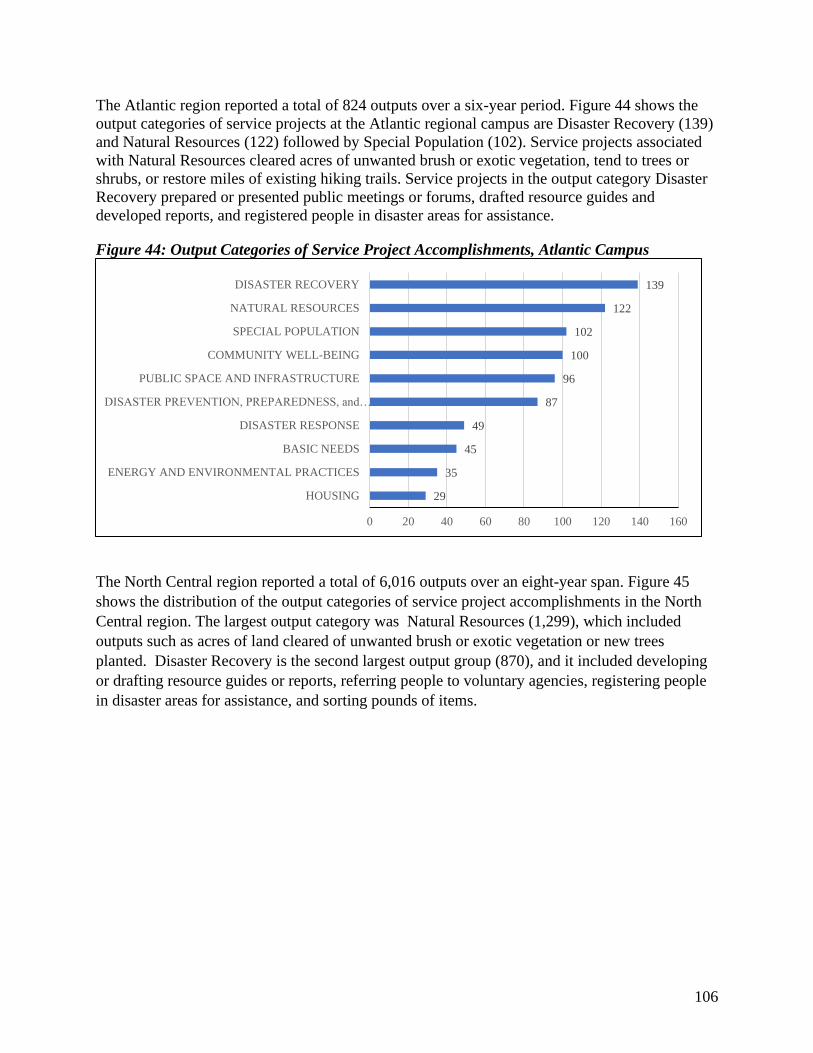
106
The Atlantic region reported a total of 824 outputs over a six-year period. Figure 44 shows the
output categories of service projects at the Atlantic regional campus are Disaster Recovery (139)
and Natural Resources (122) followed by Special Population (102). Service projects associated
with Natural Resources cleared acres of unwanted brush or exotic vegetation, tend to trees or
shrubs, or restore miles of existing hiking trails. Service projects in the output category Disaster
Recovery prepared or presented public meetings or forums, drafted resource guides and
developed reports, and registered people in disaster areas for assistance.
Figure 44: Output Categories of Service Project Accomplishments, Atlantic Campus
The North Central region reported a total of 6,016 outputs over an eight-year span. Figure 45
shows the distribution of the output categories of service project accomplishments in the North
Central region. The largest output category was Natural Resources (1,299), which included
outputs such as acres of land cleared of unwanted brush or exotic vegetation or new trees
planted. Disaster Recovery is the second largest output group (870), and it included developing
or drafting resource guides or reports, referring people to voluntary agencies, registering people
in disaster areas for assistance, and sorting pounds of items.
29
35
45
49
87
96
100
102
122
139
0 20 40 60 80 100 120 140 160
HOUSING
ENERGY AND ENVIRONMENTAL PRACTICES
BASIC NEEDS
DISASTER RESPONSE
DISASTER PREVENTION, PREPAREDNESS, and…
PUBLIC SPACE AND INFRASTRUCTURE
COMMUNITY WELL-BEING
SPECIAL POPULATION
NATURAL RESOURCES
DISASTER RECOVERY
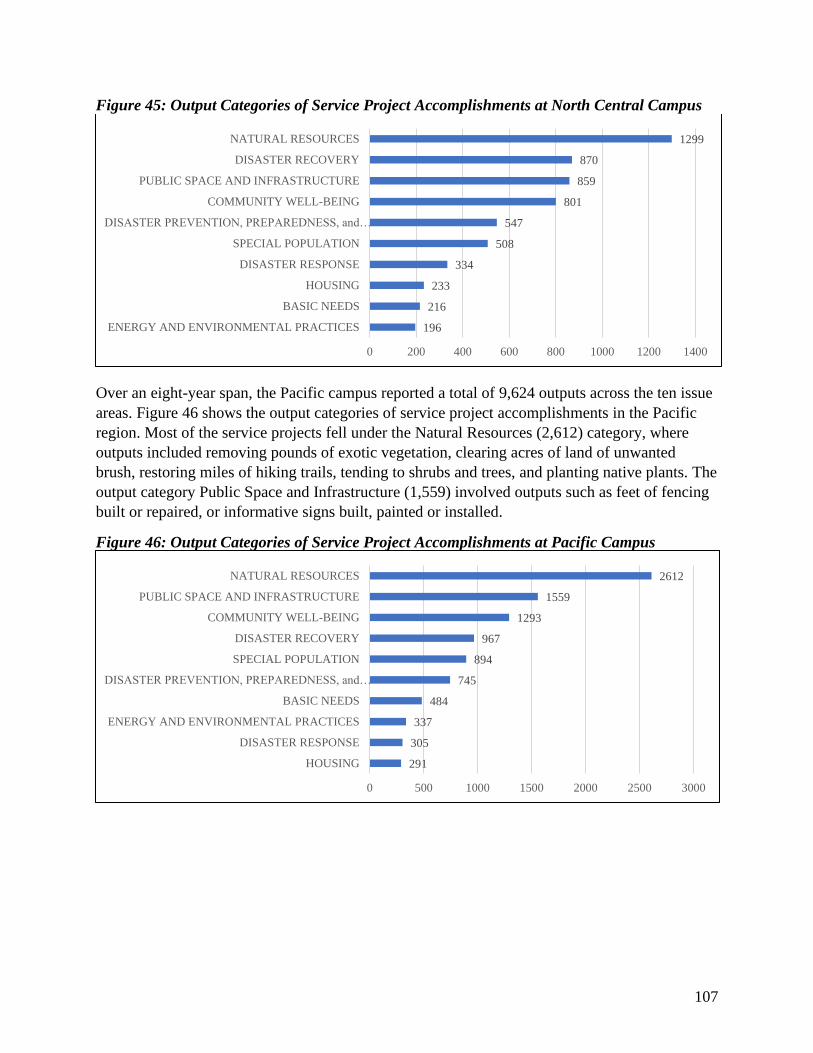
107
Figure 45: Output Categories of Service Project Accomplishments at North Central Campus
Over an eight-year span, the Pacific campus reported a total of 9,624 outputs across the ten issue
areas. Figure 46 shows the output categories of service project accomplishments in the Pacific
region. Most of the service projects fell under the Natural Resources (2,612) category, where
outputs included removing pounds of exotic vegetation, clearing acres of land of unwanted
brush, restoring miles of hiking trails, tending to shrubs and trees, and planting native plants. The
output category Public Space and Infrastructure (1,559) involved outputs such as feet of fencing
built or repaired, or informative signs built, painted or installed.
Figure 46: Output Categories of Service Project Accomplishments at Pacific Campus
196
216
233
334
508
547
801
859
870
1299
0 200 400 600 800 1000 1200 1400
ENERGY AND ENVIRONMENTAL PRACTICES
BASIC NEEDS
HOUSING
DISASTER RESPONSE
SPECIAL POPULATION
DISASTER PREVENTION, PREPAREDNESS, and…
COMMUNITY WELL-BEING
PUBLIC SPACE AND INFRASTRUCTURE
DISASTER RECOVERY
NATURAL RESOURCES
291
305
337
484
745
894
967
1293
1559
2612
0 500 1000 1500 2000 2500 3000
HOUSING
DISASTER RESPONSE
ENERGY AND ENVIRONMENTAL PRACTICES
BASIC NEEDS
DISASTER PREVENTION, PREPAREDNESS, and…
SPECIAL POPULATION
DISASTER RECOVERY
COMMUNITY WELL-BEING
PUBLIC SPACE AND INFRASTRUCTURE
NATURAL RESOURCES

108
A total of 7,982 outputs were accounted by the Southern region over an eight-year period. In the
Southern region, the top output categories reported by service projects were Disaster Recovery
(1,559); Disaster Prevention, Preparedness, and Mitigation (115); and Natural Resources (976).
The Disaster Recovery service projects include drafting resources guides, supporting
warehouses, and presenting and preparing public meetings or forums. Another output category
that stood out in the Southern region is Natural Resources with 976 outputs. Natural Resources
outputs include clearing acres of unwanted land, restoring miles of existing hiking trails, and
removing exotic vegetation.
Figure 47: Output Categories of Service Project Accomplishments at Southern Campus
The Southwest regions reported a total of 7,370 total outputs across the ten issue areas over an
eight-year span. Figure 48 shows the most frequent output categories of service project
accomplishments in the Southwest region. The top three output categories in the Southwest
region are Natural Resources (1,579), Community Well-being (1,378), and Public Space and
Infrastructure (1,219). Typical activities within Natural Resources include clearing acres of
unwanted land, restoring hiking trails, and removing vegetation. Activities in the Community
Well-being output category include removing trash, tending to gardens, and supporting K-12
students in and out of school programs.
158
420
463
630
812
857
859
976
1115
1559
0 200 400 600 800 1000 1200 1400 1600 1800
ENERGY AND ENVIRONMENTAL PRACTICES
HOUSING
BASIC NEEDS
DISASTER RESPONSE
COMMUNITY WELL-BEING
PUBLIC SPACE AND INFRASTRUCTURE
SPECIAL POPULATION
NATURAL RESOURCES
DISASTER PREVENTION, PREPAREDNESS, and…
DISASTER RECOVERY
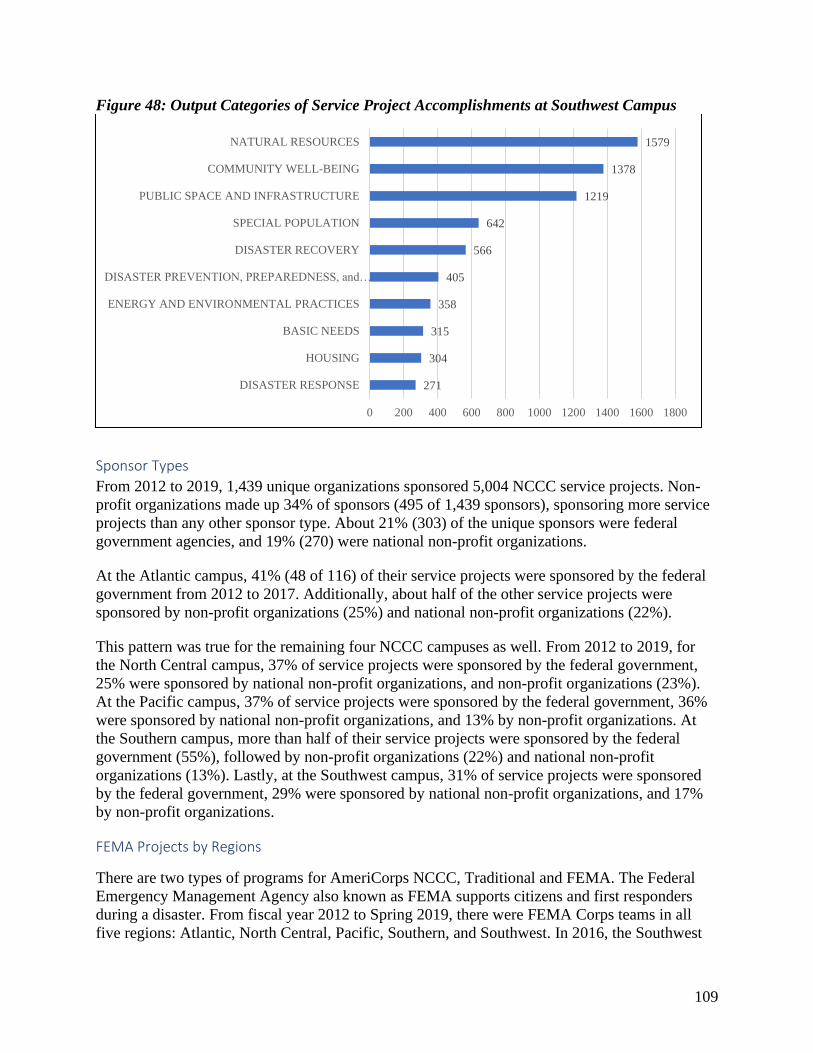
109
Figure 48: Output Categories of Service Project Accomplishments at Southwest Campus
Sponsor Types
From 2012 to 2019, 1,439 unique organizations sponsored 5,004 NCCC service projects. Non-
profit organizations made up 34% of sponsors (495 of 1,439 sponsors), sponsoring more service
projects than any other sponsor type. About 21% (303) of the unique sponsors were federal
government agencies, and 19% (270) were national non-profit organizations.
At the Atlantic campus, 41% (48 of 116) of their service projects were sponsored by the federal
government from 2012 to 2017. Additionally, about half of the other service projects were
sponsored by non-profit organizations (25%) and national non-profit organizations (22%).
This pattern was true for the remaining four NCCC campuses as well. From 2012 to 2019, for
the North Central campus, 37% of service projects were sponsored by the federal government,
25% were sponsored by national non-profit organizations, and non-profit organizations (23%).
At the Pacific campus, 37% of service projects were sponsored by the federal government, 36%
were sponsored by national non-profit organizations, and 13% by non-profit organizations. At
the Southern campus, more than half of their service projects were sponsored by the federal
government (55%), followed by non-profit organizations (22%) and national non-profit
organizations (13%). Lastly, at the Southwest campus, 31% of service projects were sponsored
by the federal government, 29% were sponsored by national non-profit organizations, and 17%
by non-profit organizations.
FEMA Projects by Regions
There are two types of programs for AmeriCorps NCCC, Traditional and FEMA. The Federal
Emergency Management Agency also known as FEMA supports citizens and first responders
during a disaster. From fiscal year 2012 to Spring 2019, there were FEMA Corps teams in all
five regions: Atlantic, North Central, Pacific, Southern, and Southwest. In 2016, the Southwest
271
304
315
358
405
566
642
1219
1378
1579
0 200 400 600 800 1000 1200 1400 1600 1800
DISASTER RESPONSE
HOUSING
BASIC NEEDS
ENERGY AND ENVIRONMENTAL PRACTICES
DISASTER PREVENTION, PREPAREDNESS, and…
DISASTER RECOVERY
SPECIAL POPULATION
PUBLIC SPACE AND INFRASTRUCTURE
COMMUNITY WELL-BEING
NATURAL RESOURCES

110
FEMA Corps program ended. In 2017, the Atlantic FEMA Corps program ended, then the North
Central FEMA Corps program ended in 2019. There are currently two active FEMA Corps
programs in the Pacific and Southern regions. We analyzed all 1,568 FEMA Corps projects
completed from 2013 – 2019 across the five regions.
Figure 49: FEMA Projects in Regions from Fiscal Year 2012- Spring 2019
Since FEMA is focused on disaster recovery and response, all its service projects have an issue
area of Natural and Other Disasters (DIS). As shown above in Figure 49, the Southern region
completed the most FEMA Corps projects (593) followed by the Pacific (415).
FEMA service projects from different regions share project characteristics. The most common
project characteristic is capacity building and leverage. The second most common project
characteristic is providing disaster assistance. Another common project characteristic that all
FEMA projects have is public safety.
Within all regions, the most common project output category for FEMA projects was Disaster
Recovery. Service projects that fall under this output category include present or prepare public
meetings, draft resource guides, and register people in disaster areas for assistance. Other
frequent output categories include Disaster Prevention, Preparedness, and Mitigation, and
Disaster Response. Tasks in these project accomplishments include supporting disaster
simulations or exercises, supporting disaster service facilities, answering helpline calls,
supporting partnerships and coalitions, and volunteering at facilities that support disaster areas.
Strengthening Communities and Impact on Members
Impact on Communities of NCCC Projects In this analysis, we looked at how NCCC service projects – both Traditional Programs and
FEMA Corps – impact communities in the five NCCC regional campuses. Improving
accessibility to public structures; building trails, gardens, and farms; and supporting youth camps
are some examples of the work that was impactful to the communities. Furthermore, service
projects can also impact individuals in the community by helping people meet basic needs like
food and shelter, receiving disaster assistance, mentoring volunteers and youth, rebuilding homes
after a disaster, filing tax returns, assisting veterans, and engaging volunteers.
593
415
345
178
37
0
100
200
300
400
500
600
700
Southern Pacific North Central Southwest Atlantic
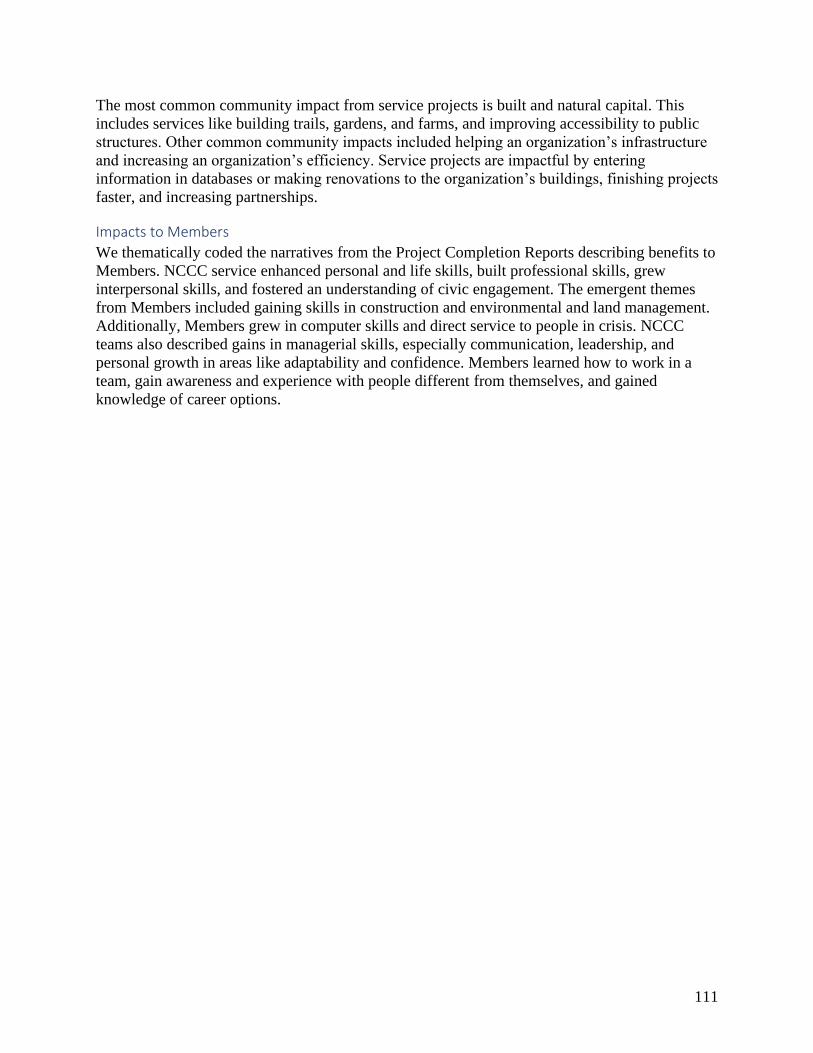
111
The most common community impact from service projects is built and natural capital. This
includes services like building trails, gardens, and farms, and improving accessibility to public
structures. Other common community impacts included helping an organization’s infrastructure
and increasing an organization’s efficiency. Service projects are impactful by entering
information in databases or making renovations to the organization’s buildings, finishing projects
faster, and increasing partnerships.
Impacts to Members
We thematically coded the narratives from the Project Completion Reports describing benefits to
Members. NCCC service enhanced personal and life skills, built professional skills, grew
interpersonal skills, and fostered an understanding of civic engagement. The emergent themes
from Members included gaining skills in construction and environmental and land management.
Additionally, Members grew in computer skills and direct service to people in crisis. NCCC
teams also described gains in managerial skills, especially communication, leadership, and
personal growth in areas like adaptability and confidence. Members learned how to work in a
team, gain awareness and experience with people different from themselves, and gained
knowledge of career options.
112
Recommendations for Further Development of the Service Projects Database To support future analysis of the service projects data, we offer several recommendations based
on our work importing, coding, and analyzing the AmeriCorps NCCC data in the Service
Projects Database (SPD):
• Assign unique identifiers (IDs) and names to sites and organizations and create a
corresponding “look-up table” for reference. This is important because a site entry name
can vary across service projects resulting in the appearance of multiple sites all of which
actually refer to the same site (e.g., it is spelled differently, an acronym is used instead of
the name, an incomplete name is used). Unique IDs will allow AmeriCorps NCCC to
track organizations and sites over time and delve further and more accurately into
recurring service projects in the same communities.
• Consider whether one or more disaster types should be available for entry in the “Type of
Disaster” field in the Service Project Data Entry form. Currently, the user may select one
type of disaster, which would be the primary disaster, but the project applications and
SPRs sometimes describe situations where a service project is addressing several
disasters. Since only type of disaster is recorded in the data, the additional information
about other types of disasters is not available for analysis.
• Review current data tables and see whether tables should be added, consolidated, or
deleted. Currently, the database has 5 main tables and 13 associated look-up tables. JBS
staff simplified the process for importing program data with sites, project narratives, and
project accomplishments using the minimal number of tables necessary. However, there
might be additional information in the AmeriCorps NCCC database not currently in the
SPD that would be useful to include in future analysis.
• Create MS Access summary reports for SPD tables to check data at a glance. Reports can
calculate and present selected relevant data in a user-friendly format. Such a report might
be easier to understand than looking at a data table cluttered and complicated by
extraneous detail.
• Review AmeriCorps NCCC’s needs and goals for the data in SPD and how the SPD
might be used by the regions if it were available to them. Test the database with regional
staff to explore whether the SPD might be feasibly and usefully implemented at the field
level. Assess whether campuses have the technology or staff to maintain an MS Access
database.
113
Lessons Learned and Best Practices The following lessons learned and best practices emerged from data entry and analysis of the
Service Projects Database (SPD).
Database The SPD includes current data on programs, accomplishments, and narratives for 5,004
AmeriCorps NCCC service projects.
Two best practices for AmeriCorps NCCC regarding the SPD database are to ensure that: (1) the
database is backed-up nightly on a central server so data is not lost or the back-end data file is
mistakenly deleted; and (2) that AmeriCorps NCCC staff compact the database at least weekly
because, as more information is entered and more tables and queries are created, the database
could be corrupted or damaged and its growth could impede performance or ..
To ensure that entered data is recorded and saved when using the database’s Project Narratives
form to conduct thematic coding of the Community and Member Impact statements, users should
be absolutely certain to click the “Save Record” button at the bottom of the page before
proceeding to the next project .
AmeriCorps NCCC Forms
Project Completion Reports JBS staff received data for service projects’ Member and Community Impact statements to code.
JBS understands “impacts” as benefits to members, due to their participation in the project, and
benefits to communities because of the work accomplished. Through the coding process, we
found that some projects were providing only a list of outputs (accomplishments) in the Member
and Community Impact statements and not highlighting benefits from those accomplishments for
communities or NCCC Members. To consistently capture more accurate and more complete
information on the impacts due to AmeriCorps NCCC projects, AmeriCorps NCCC might
provide guidance or a template for completing the Community and Member Impact statements,
and an explanation of the difference between impacts and the accomplishments (outputs) that
projects report elsewhere.
The narrative of service projects recorded in the PCR typically did not describe intangible
benefits to the community, especially psychosocial benefits. Guidance and training could be
offered to NCCC teams to better assess intangible benefits that might not be immediately visible.
Training could also help NCCC teams assess potential longer-term impacts of their work and
describe those impacts in terms of the sponsor’s larger mission. Providing guiding questions to
respond to rather than having the teams write a general impact statement would be one way to
support NCCC teams in describing these benefits.
It might be useful to make available a condensed list of the Community and Member Impact
codes at NCCC Team Leader trainings. This would help NCCC teams consider more deeply,
then document more thoroughly, their work’s impact. While some narratives contained highly
detailed descriptions, others were quite brief. Although inference would suggest that a project
had certain types of impact (e.g., Pro – hard – construct while working on a Habitat for
Humanity project), not all impacts were explicitly described in the narratives. A list at hand of
114
possible areas of impact would help spur all NCCC teams’ thinking about their work to be more
descriptive and complete. These guidance materials would be provided either as a list of
potential impacts to consider or as specific writing prompts. For example, see the following
guiding questions:
Community Impact Statements
• Did Member contributions to this include things like building trails, working on camp
cabins and infrastructure, working on community gardens and farms, etc.
• Did Member contributions to this project help to prevent or mitigate future disasters?
This might include activities such as fuel reduction, increasing knowledge of disaster
preparedness in the community, or working with an organization on disaster response
simulations.
• Did Member contributions to this project include things like providing food or affordable
housing or less-tangible benefits like mental wellness, food security, or increasing trust in
government? This might also include activities that help increase individuals’ knowledge
and skills and provide increased health and safety to individuals.
• Did Member contributions to this project help respond to a disaster? This might include
activities like mucking and gutting homes, rebuilding homes damaged by a disaster, or
helping individuals return to home or work.
• Did Member contributions to this project help the organization they worked with? This
might include activities like setting up an office, organizing data files, or preparing
materials – or expanding programming, writing grant proposals, or spreading awareness
of the organization in the community.
• Did Member contributions to this project provide an economic benefit either to the
community as a whole – such as increasing tourism revenue – or to individuals – such as
increasing savings?
Member Impact Statements
• Did participation in this project affect Member life skills? These skills may include
Members’ ability to work with diverse people and populations; Members’ personal
growth in terms of adaptability, flexibility, and confidence; or Members’ knowledge of
how to plan, execute, and evaluate tasks.
• Did participation in this project affect Member professional skills? These skills may
include technical skills – like the ability to use specific tools or computer programs or
work with crisis-affected populations – or managerial skills – like the ability to
communicate, lead, or work as a team.
• Did participation in the project affect Member ability to seek and acquire job
opportunities? This might include skills such as resume writing, networking, or
interviewing.

115
• Did participation in the project affect Member knowledge of or ability to help strengthen
communities? This might include things like learning how nonprofits function, learning
how community partnerships can solve challenging problems, or learning about
volunteerism.
Project Application and SPR Forms One of the research questions was to analyze how multiple service projects are linked both
within sponsors and among multiple co-sponsors. AmeriCorps NCCC program data currently do
not identify unique sponsor or site information to answer this question accurately. If
AmeriCorps NCCC would like to answer these types of questions, then the Project Application
and SPR forms will need to include unique IDs for each organization, for secondary sponsors,
and for sites; this will allow better tracking of where Member, service projects, and
accomplishments occur.
Starting in 2017, the Project Application forms allowed NCCC teams to report as many as three
goals for their service projects. The limited space provided on the form to report each goal might
have contributed to the inconsistent information reported about project goals. AmeriCorps
NCCC should consider additional guidance to NCCC teams regarding how to document a
project’s goals. One example of guidance would explain that the NCCC team is expected to write
a one-sentence summary of each goal. Alternatively, AmeriCorps NCCC could extend the space
allotted for goal recording to allow more detailed descriptions of the service project and its goals.
It might be useful for AmeriCorps NCCC to add a checklist of specific populations that projects
work with to help ensure consistent reporting regarding specific populations. Such a list might
include: veterans; people in crisis (including disaster survivors and the homeless);
immigrants/refugees; disabled persons; Native Americans/tribal communities; and the
elderly/senior citizens.

116
Conclusion The service projects database (SPD) contains information on more than 5,000 service projects
completed between fiscal year 2012 and Spring 2019. The SPD is an important tool for
AmeriCorps NCCC to demonstrate the benefits of national service and how national service
improves the lives of individuals and strengthens communities.
Three issue areas account for 94% of all NCCC service projects: Natural and Other Disasters
(50%), Urban and Rural Development (26%), and Environmental Stewardship and Conservation
(18%). These same issue areas also accounted for the largest share of service project
accomplishments (outputs). While most service projects had multiple project characteristics, the
most frequent were community support (41%), at-risk ecosystems (34%), infrastructure
improvement (34%), and building or leveraging organizational capacity (34%). Between 2012
and 2019, 1,439 unique sponsors accounted for the 5,004 service projects captured in the SPD.
Leading project sponsors were the Federal government, national non-profits, and other non-
profits.
The most common community-level impacts of NCCC service projects were on the built and
natural capital of communities through work on improving accessibility to public structures,
building trails, gardens and farms, and supporting youth camps. In the particular issue area of
Natural and Other Disasters, the most common impacts of service projects on communities were
enhancing disaster knowledge and preparedness, and increased support for disaster service
facilities. The most common individual-level impacts were on helping people meet basic needs
such as accessing food and shelter, receiving disaster assistance, including registration for FEMA
assistance, and human capital and learning through teaching volunteers or tutoring youth. The
most common organization-level impacts noted were in infrastructure support, which included
updating information in organizations’ databases, renovating physical infrastructure, and
conducting inventories of supplies or donations. The most common impacts on Members were
enhancing construction and environmental management skills, increasing communication skills,
building leadership skills, and fostering personal growth in areas like adaptability and
confidence.
The SPD will help AmeriCorps NCCC understand the relationship between national service,
outputs, and short- and long-term outcomes. The data in the SPD is a tool for analyzing the
impact of service projects on communities served and on Member. The data will also inform any
future research studies to develop operational definitions of ‘strengthening communities’ and
‘member development’ in relation to service with AmeriCorps NCCC.
This report identifies several lessons learned and recommendations springing from the
development of the SPD and analysis of the data. A key task of the SPD project was to identify
ways to improve the quality and utility of data generated by NCCC’s service projects to
maximize the value of this data for program assessment and continuous improvement. Some of
the most salient recommendations include providing written guidance on Community and
Member Impact statements and PCRs to help improve the quality and usefulness of the service
projects narratives; providing more space for NCCC teams to write comprehensive goal
statements in the project application; assigning a unique identifier to each service site and
sponsor organization; redesigning primary documentation for disaster-related service projects;

117
adding a checklist of specific populations served to the PCR; and adding reporting features to the
SPD.
AmeriCorps NCCC should consider integrating systematic data collection into daily operations
and recording the service project data in a central database to facilitate monitoring and oversight
and assist in identifying strategic goals and benchmarks. A central database with consistently
defined, systematically collected, high-quality data about NCCC service projects, outputs, and
outcomes, has the potential for future use in evaluations of the AmeriCorps NCCC program. The
quality of the analyses conducted using the SPD will depend greatly on the quality and
completeness of the data that NCCC continues to add to the database. This points to the value of
harnessing daily business practices and processes to consistently collect well-defined data.
Integrating more rigorous data collection and better data collection habits into daily operations
and storing data in a shared database increases the SPD’s utility for real-time use. High-quality
data also creates the foundation for more rigorous evaluation of AmeriCorps NCCC.
118
Appendix A: Methodology This appendix describes the steps taken to code then analyze the AmeriCorps NCCC service
projects data. NCCC gathers both quantitative and qualitative data on each service project. These
data include outputs (e.g., number of people served, number of houses built, or trails cleared),
outcomes (e.g., improved access to economic opportunities or housing, improved food security,
and increased knowledge of sustainable energy practices), project characteristics (e.g., at-risk
ecosystems, capacity building and leverage, and disaster assistance provided), type of program,
issue area, organization, and site geographic location. The forms also capture narratives written
by the NCCC team that worked on the service project. As further described below, we developed
a coding framework to code the narrative text, enabling us to document impact of the service
projects on Members and the communities they serve.
For research questions 1 through 7, we use frequency, mean, and percentage to describe the
characteristics of service projects, their accomplishments, and types of sponsors. We analyze the
themes that emerged from coding the service projects narrative and quoted narratives for
research questions 8 and 9. A mixed-methods approach (qualitative and quantitative analysis)
was employed for research questions 10 through 12.
In addition to quantitative and qualitative analyses, we created separate maps for sponsors and
service sites, for a total of two Excel files. We used Microsoft Office 365 Excel 3D Map, a
standard feature in recent versions of Excel, to map sponsor and service site locations. We chose
Excel 3D Map because, as a feature within Excel, it assures compatibility across computer
systems. Using a combination of the program dataset and project accomplishments datasets, we
created the interactive maps for each fiscal year (2012 to 2019). Excel 3D Map uses Bing Maps
to plot address information.
The maps are contained within each Excel file and can be accessed by selecting “Insert” on the
ribbon and then selecting “3D Map.” Each interactive map contains one layer for each fiscal year
(2012 to 2019) and one layer that displays data for all fiscal years. Fiscal years (layers) can be
displayed individually, multiple years at once, or all years at once. Users can zoom in to the
location of an individual sponsor or service site, or search by address, city, or ZIP code using the
“Find Location” button. Each layer of the sponsor-level map is filtered by type of organization.
Each layer of the site-level map is filtered by outcome grouping. Each map has two main
methods of visualization, bubble and heat maps. Additional options include height, thickness,
colors, opacity of the visuals, and display map labels (e.g., city and street names). The user will
be able to append additional data to the Excel spreadsheet and update the map with new data
(using the “Refresh Data” button), provided that all variable names from the new data are the
same and appear in the same order.
There are three instances where it will not be possible to map an address or when a close
approximate address will be mapped. The first instance is that, as with all mapping software,
Excel 3D Map will not be able to find P.O. Box addresses. There were 173 service sites and 207
sponsors with P.O. Box addresses. The second instance is that, even when there is a full address,
Bing Maps might not be able to find it. The third instance is that there are addresses where Bing
Maps does not have an exact match and automatically attempts to map a close match. The
Mapping Confidence report in Excel 3D Maps shows percentage of addresses that were plotted
with high confidence and the specific addresses that have no resolution or close match. The
119
Mapping Confidence report can be found by expanding the layer for all fiscal years and clicking
on the percentage of confidence in the “Location” section. For CNCS’s convenience, we copied
the information from the Mapping Confidence report into a sheet, “No or Near Match
Addresses,” in each Excel spreadsheet.
Methodology for Thematic Analysis and Coding of Narrative Text
We developed a coding framework on key Member and community outcomes based on intensive
and iterative analysis of narratives from a stratified random sample of 400 service projects. We
reviewed program materials, logic models, and the literature on strengthening communities,
leadership development, and Member retention. These materials inform the creation of an initial
set of codes for deductive coding for both Community Outcome and Member Outcome
protocols.
Community Outcome Framework
We developed a framework to codify community outcomes based on narrative text written by
NCCC teams on each service project. This process began with emergent, inductive-oriented
coding with approximately 100 service projects. We conducted rapid coding to quickly develop
an understanding of the narrative data. We used a constant comparative method to ensure that the
codes were grounded and accurately reflected the data. We then added deductive codes using the
logic model. Based on discussion with NCCC, ORE, and two subject matter experts, Drs.
Matthew Hudson-Flege (Clemson University) and Mary Ohmer (University of Pittsburgh), we
added codes for organizational capacity building.
We refined the coding framework to distinguish units of analysis (individuals, organizations, and
community level) and clarity of support (tangible and intangible). Tangible support captures
outcomes that are clear to observers, such as providing food and clothing to survivors of a
disaster. Intangible support captures outcomes that are not concrete or clear to observers, such as
providing emotional support to survivors after a crisis or listening to people in the community
who are struggling with addiction.
This careful approach ensured our coding was sensitized to key issues and made the initial set of
deductive codes more useful while it also made discoveries possible during inductive coding.
The evolving framework differentiated certain codes and showed that some codes could be
consolidated or made into subcodes (e.g., making Food security, classified as an intangible, into
a subcode of Psychosocial benefits). We also worked with NCCC and ORE to clarify disaster-
related activities and suggestions on developing codes to align with FEMA Corps’ language
(e.g., Home Refurbishment was changed to Disaster Home Refurbishment to clarify the context
within which this work occurred).
We conducted an initial round of consensus coding and calculated intercoder agreement. This
first assessment yielded a low intercoder agreement and too many codes, both of which are
standard and expected in this initial phase of the analysis. We coded an additional 50 service
projects to assess the frequency of the codes; we eliminated or consolidated rare and overlapping
120
codes, which reduced the number of codes from 36 to 24.16 For example, we added the Built and
Natural Capital – Gardens and Farms subcode because “Food security” was discussed less often
but Built and Natural Capital related to food was still worth noting.
Member Outcome Framework
The Leadership Development logic model was the foundation for developing the framework to
codify Member impact. We selected 40 project narratives and applied deductive codes outlined
in the logic model. We included additional subcodes that emerged during the coding.
Based on discussion with NCCC, ORE, and Drs. Ohmer and Hudson-Flege, we refined the
deductive codes to include additional codes and subcodes, such as Pro-Crisis to capture instances
during which Members responded to people in acute crisis situations Under the Pro-Success
code, the subcode Pro-Success-Lead was added to capture and emphasize Members employing
leadership skills during service and.
We coded a total of 100 narratives and calculated frequencies for each deductive and inductive
code. We dropped or consolidated low frequency codes which appeared less than 10% of the
time. This process reduced the number of codes from 33 to 16.
16 For the Community Outcome Codebook, we retained rare codes (e.g., tax refunds) since there is more variation in
Community Outcome narratives and some items are rare but are distinct enough to warrant keeping the code. We
also consolidated some subcodes into parent codes (e.g., built and natural capital, currently a single parent codes,
was consolidated from three subcodes because distinctions between the subcodes were not meaningful based on our
analysis of the data).
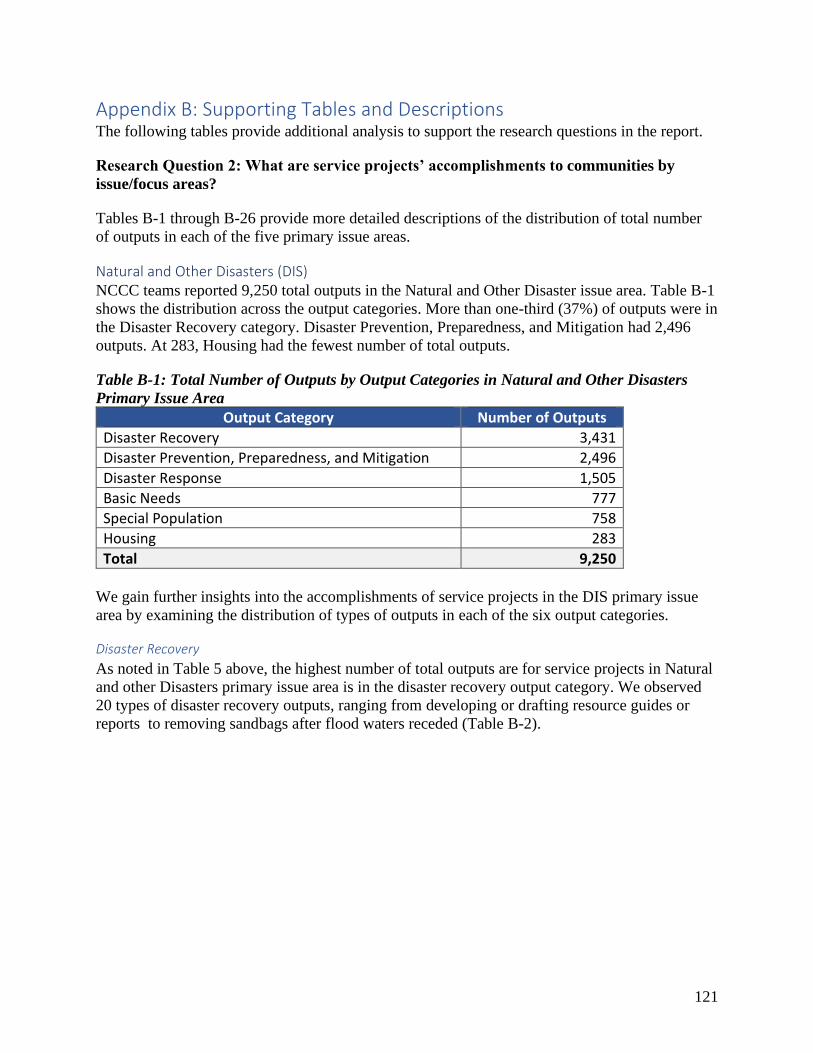
121
Appendix B: Supporting Tables and Descriptions The following tables provide additional analysis to support the research questions in the report.
Research Question 2: What are service projects’ accomplishments to communities by
issue/focus areas?
Tables B-1 through B-26 provide more detailed descriptions of the distribution of total number
of outputs in each of the five primary issue areas.
Natural and Other Disasters (DIS) NCCC teams reported 9,250 total outputs in the Natural and Other Disaster issue area. Table B-1
shows the distribution across the output categories. More than one-third (37%) of outputs were in
the Disaster Recovery category. Disaster Prevention, Preparedness, and Mitigation had 2,496
outputs. At 283, Housing had the fewest number of total outputs.
Table B-1: Total Number of Outputs by Output Categories in Natural and Other Disasters
Primary Issue Area
Output Category Number of Outputs
Disaster Recovery 3,431
Disaster Prevention, Preparedness, and Mitigation 2,496
Disaster Response 1,505
Basic Needs 777
Special Population 758
Housing 283
Total 9,250
We gain further insights into the accomplishments of service projects in the DIS primary issue
area by examining the distribution of types of outputs in each of the six output categories.
Disaster Recovery
As noted in Table 5 above, the highest number of total outputs are for service projects in Natural
and other Disasters primary issue area is in the disaster recovery output category. We observed
20 types of disaster recovery outputs, ranging from developing or drafting resource guides or
reports to removing sandbags after flood waters receded (Table B-2).
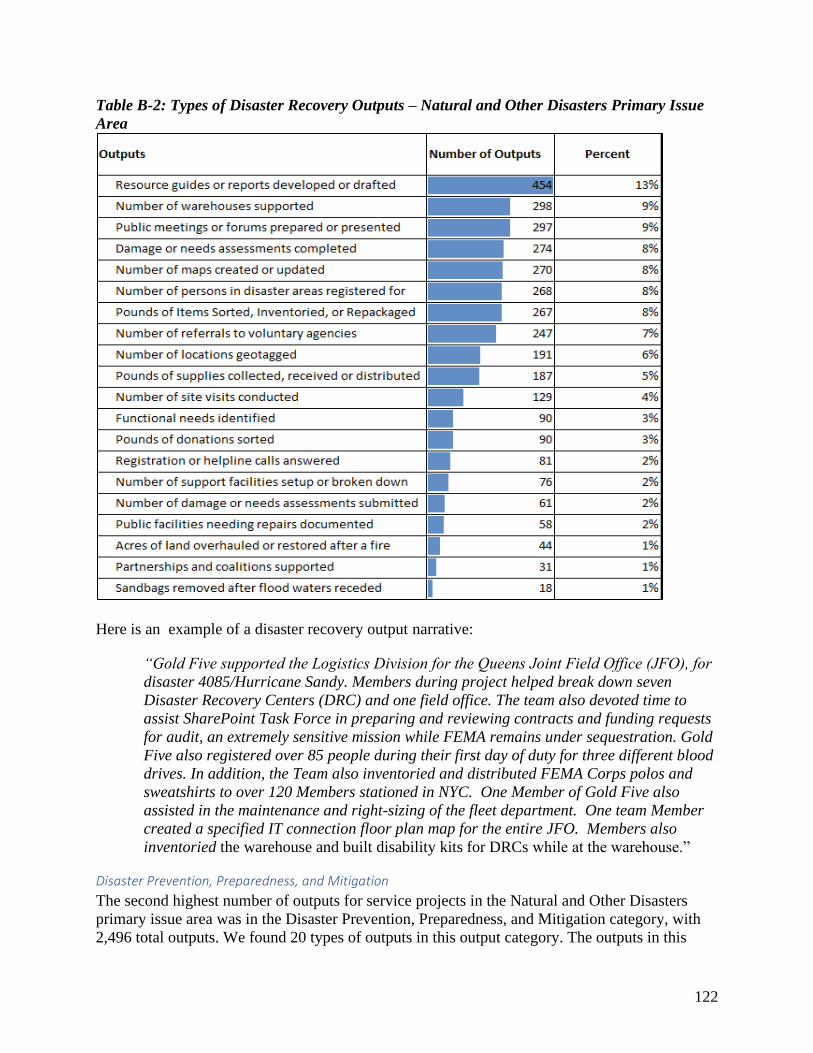
122
Table B-2: Types of Disaster Recovery Outputs – Natural and Other Disasters Primary Issue
Area
Here is an example of a disaster recovery output narrative:
“Gold Five supported the Logistics Division for the Queens Joint Field Office (JFO), for
disaster 4085/Hurricane Sandy. Members during project helped break down seven
Disaster Recovery Centers (DRC) and one field office. The team also devoted time to
assist SharePoint Task Force in preparing and reviewing contracts and funding requests
for audit, an extremely sensitive mission while FEMA remains under sequestration. Gold
Five also registered over 85 people during their first day of duty for three different blood
drives. In addition, the Team also inventoried and distributed FEMA Corps polos and
sweatshirts to over 120 Members stationed in NYC. One Member of Gold Five also
assisted in the maintenance and right-sizing of the fleet department. One team Member
created a specified IT connection floor plan map for the entire JFO. Members also
inventoried the warehouse and built disability kits for DRCs while at the warehouse.”
Disaster Prevention, Preparedness, and Mitigation
The second highest number of outputs for service projects in the Natural and Other Disasters
primary issue area was in the Disaster Prevention, Preparedness, and Mitigation category, with
2,496 total outputs. We found 20 types of outputs in this output category. The outputs in this

123
category ranged from preparing informational documents or publications to installing smoke
detectors in homes (See Table B-3). An example of an output narrative:
“The community benefits, in the broad view, Jade 1 enhanced a more efficient
preparedness, response and recovery of the whole community in times of crisis. The
community now has a better perspective on what it means to be a whole community
partner in all hazards preparedness, response and recovery. Jade 1 assisted in
increasing engagement with houses of worship and faith-based private non-profit groups
that work with seniors, low-income populations, ethnic and religious minorities, people
with limited English proficiency/low literacy and all people with access and functional
needs.”
Table B-3: Disaster Prevention, Preparedness, and Mitigation Outputs – Natural and Other
Disasters Issue Area
Disaster Response
The Disaster Response output category shows nine types of outputs and a total of 1,505 outputs,
with nearly half of the outputs reported under Disaster Service Facilities supported (371) and
Muck and/or Gutted activities (327).
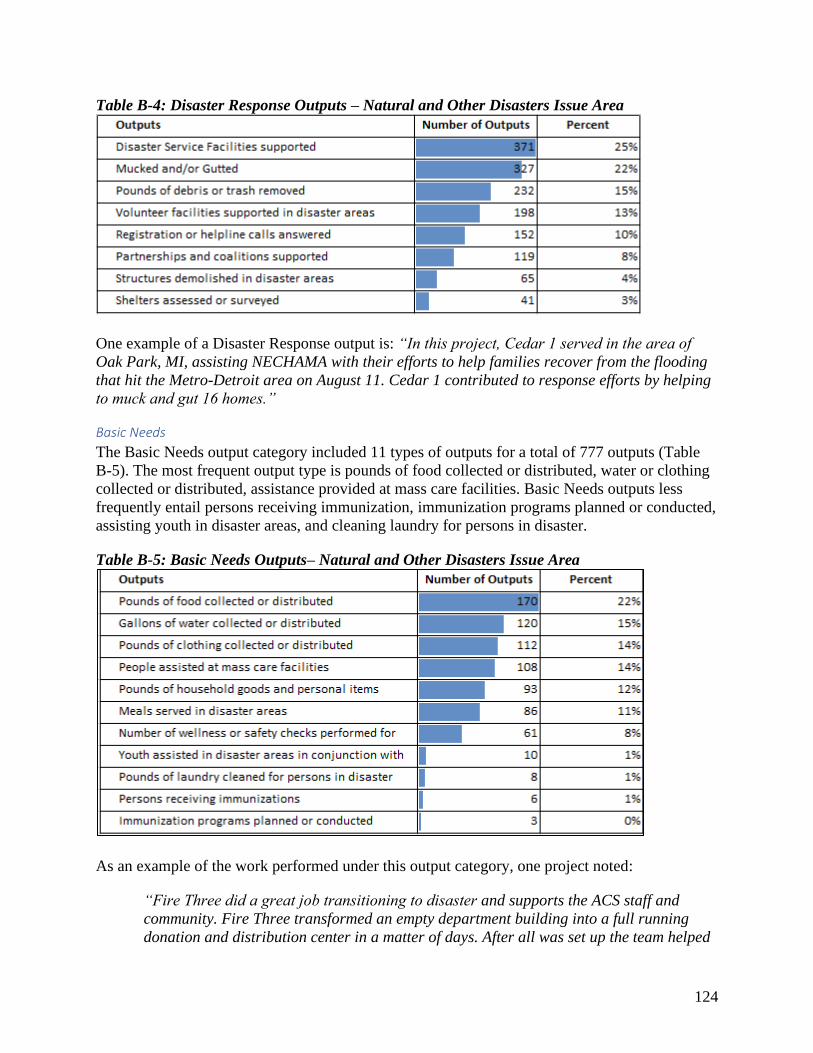
124
Table B-4: Disaster Response Outputs – Natural and Other Disasters Issue Area
One example of a Disaster Response output is: “In this project, Cedar 1 served in the area of
Oak Park, MI, assisting NECHAMA with their efforts to help families recover from the flooding
that hit the Metro-Detroit area on August 11. Cedar 1 contributed to response efforts by helping
to muck and gut 16 homes.”
Basic Needs
The Basic Needs output category included 11 types of outputs for a total of 777 outputs (Table
B-5). The most frequent output type is pounds of food collected or distributed, water or clothing
collected or distributed, assistance provided at mass care facilities. Basic Needs outputs less
frequently entail persons receiving immunization, immunization programs planned or conducted,
assisting youth in disaster areas, and cleaning laundry for persons in disaster.
Table B-5: Basic Needs Outputs– Natural and Other Disasters Issue Area
As an example of the work performed under this output category, one project noted:
“Fire Three did a great job transitioning to disaster and supports the ACS staff and
community. Fire Three transformed an empty department building into a full running
donation and distribution center in a matter of days. After all was set up the team helped
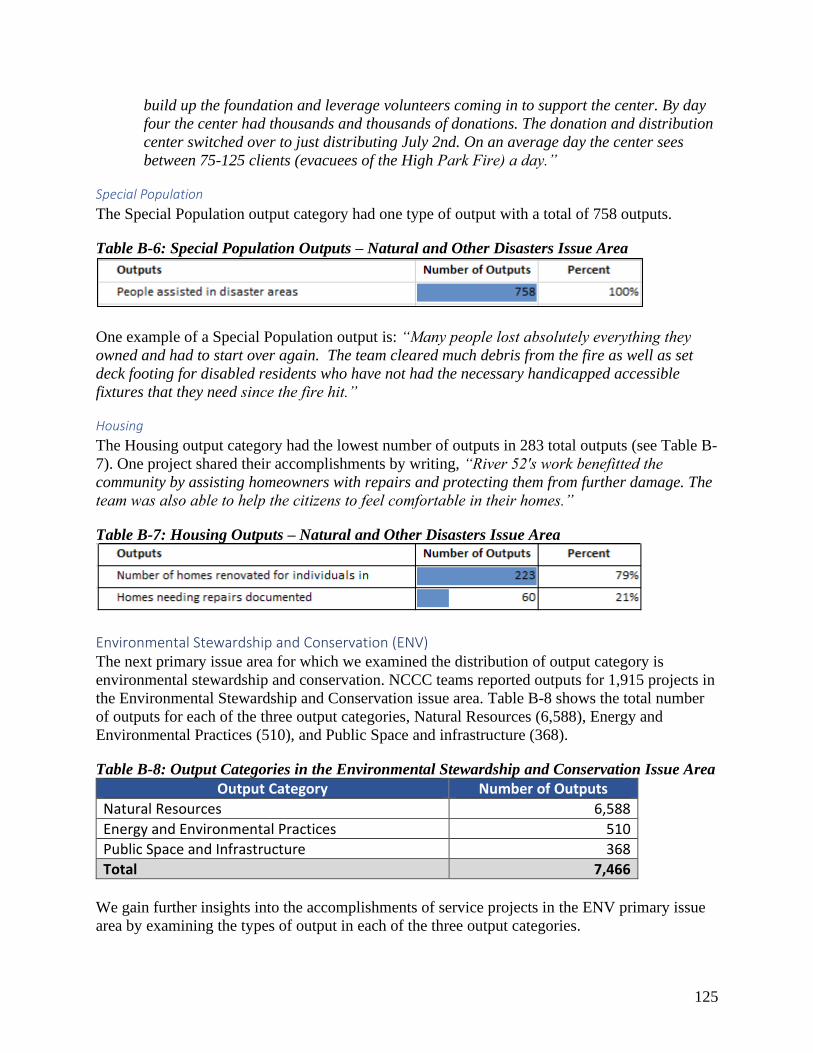
125
build up the foundation and leverage volunteers coming in to support the center. By day
four the center had thousands and thousands of donations. The donation and distribution
center switched over to just distributing July 2nd. On an average day the center sees
between 75-125 clients (evacuees of the High Park Fire) a day.”
Special Population
The Special Population output category had one type of output with a total of 758 outputs.
Table B-6: Special Population Outputs – Natural and Other Disasters Issue Area
One example of a Special Population output is: “Many people lost absolutely everything they
owned and had to start over again. The team cleared much debris from the fire as well as set
deck footing for disabled residents who have not had the necessary handicapped accessible
fixtures that they need since the fire hit.”
Housing
The Housing output category had the lowest number of outputs in 283 total outputs (see Table B-
7). One project shared their accomplishments by writing, “River 52's work benefitted the
community by assisting homeowners with repairs and protecting them from further damage. The
team was also able to help the citizens to feel comfortable in their homes.”
Table B-7: Housing Outputs – Natural and Other Disasters Issue Area
Environmental Stewardship and Conservation (ENV) The next primary issue area for which we examined the distribution of output category is
environmental stewardship and conservation. NCCC teams reported outputs for 1,915 projects in
the Environmental Stewardship and Conservation issue area. Table B-8 shows the total number
of outputs for each of the three output categories, Natural Resources (6,588), Energy and
Environmental Practices (510), and Public Space and infrastructure (368).
Table B-8: Output Categories in the Environmental Stewardship and Conservation Issue Area
Output Category Number of Outputs
Natural Resources 6,588
Energy and Environmental Practices 510
Public Space and Infrastructure 368
Total 7,466
We gain further insights into the accomplishments of service projects in the ENV primary issue
area by examining the types of output in each of the three output categories.

126
Natural Resources
The natural resources output category has 23 types of outputs under (Table B-9). Three types of
outputs, acres of land cleared unwanted brush or exotic vegetation, pounds of exotic vegetation
removed, and miles of existing hiking trails restored composed close to half (46%) of the total
natural resource outputs.
Table B-9: Natural Resources Outputs - Environmental Stewardship and Conservation Issue
Area
Note: The outputs “Miles of coastal shoreline restored or protected” and “Miles of streambeds, riverbeds,
riverbanks, or stream banks restored or protected” previously used feet as the measurement for these outputs.
As an example of the work performed in the natural resource output category, one project noted:
“The work that the park was trying to accomplish consisted of creating a proper habitat
for the endangered red-cockaded woodpecker, referred to as the RCW. River Two was to
eradicate a surplus of sand pine trees, turkey oaks, and long-leaf pines that were not fit to
become potential nesting trees for the bird. By clearing certain trees, River Two was able
Outputs Number of Outputs Percent
Acres of land cleared of unwanted brush or exotic vegetation 1141 17%
Pounds of exotic vegetation removed 1031 16%
Miles of existing hiking trail restored 869 13%
Trees or shrubs tended or cared for 483 7%
Miles of new hiking trails constructed 418 6%
New trees planted 404 6%
Number of native plants planted 393 6%
Feet of erosion controlling walls built or repaired 270 4%
Water bars installed in hiking trails 219 3%
Wildlife species protected or assisted 213 3%
Acres of wildlife habitats restored or protected 195 3%
Pounds of underbrush removed 183 3%
Miles of streambeds, riverbeds, riverbanks, or stream banks restored or
protected
178 3%
Acres of parks restored or refurbished 157 2%
Parks restored or refurbished 133 2%
Acres of land burned in prescribed burns 88 1%
Pounds of seeds collected 70 1%
Miles of coastal shoreline restored or protected 57 1%
Acres cleared or maintained for animal passage 30 0%
Acres of dunes preserved 30 0%
Acres of wetlands restored or protected 26 0%
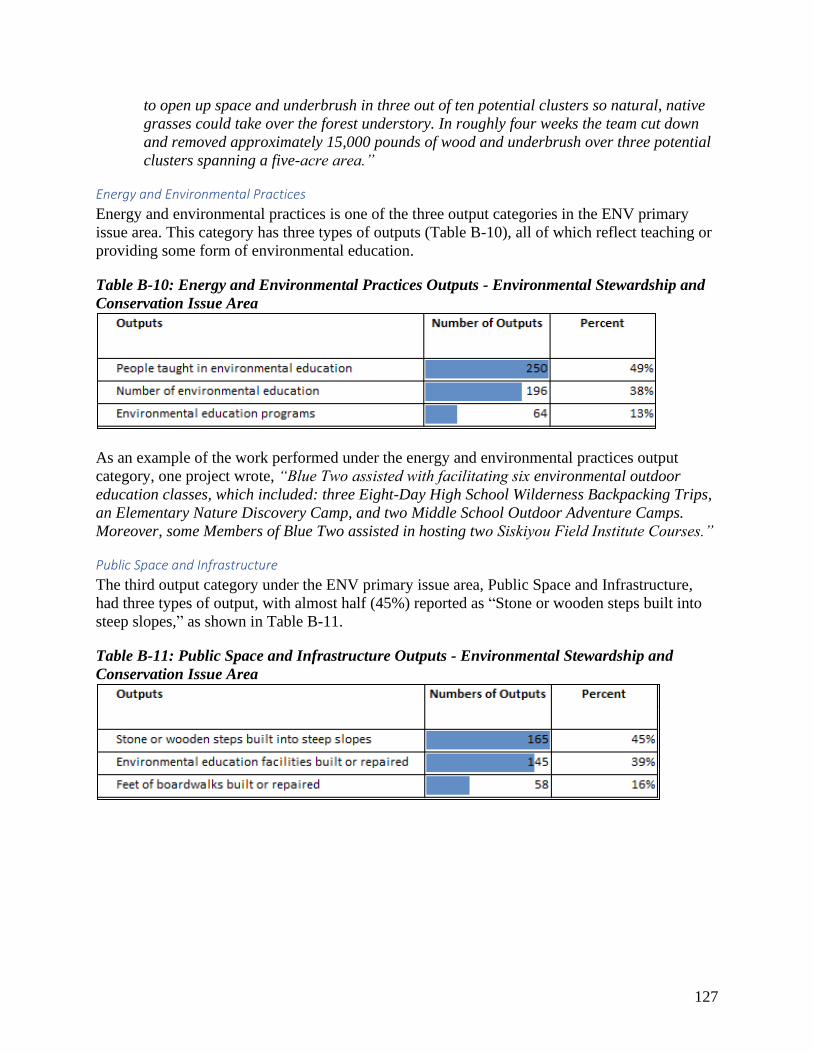
127
to open up space and underbrush in three out of ten potential clusters so natural, native
grasses could take over the forest understory. In roughly four weeks the team cut down
and removed approximately 15,000 pounds of wood and underbrush over three potential
clusters spanning a five-acre area.”
Energy and Environmental Practices
Energy and environmental practices is one of the three output categories in the ENV primary
issue area. This category has three types of outputs (Table B-10), all of which reflect teaching or
providing some form of environmental education.
Table B-10: Energy and Environmental Practices Outputs - Environmental Stewardship and
Conservation Issue Area
As an example of the work performed under the energy and environmental practices output
category, one project wrote, “Blue Two assisted with facilitating six environmental outdoor
education classes, which included: three Eight-Day High School Wilderness Backpacking Trips,
an Elementary Nature Discovery Camp, and two Middle School Outdoor Adventure Camps.
Moreover, some Members of Blue Two assisted in hosting two Siskiyou Field Institute Courses.”
Public Space and Infrastructure
The third output category under the ENV primary issue area, Public Space and Infrastructure,
had three types of output, with almost half (45%) reported as “Stone or wooden steps built into
steep slopes,” as shown in Table B-11.
Table B-11: Public Space and Infrastructure Outputs - Environmental Stewardship and
Conservation Issue Area

128
Urban and Rural Development (URD) The Urban and Rural Development (URD) primary issue area had four output categories:
Community Well-being, “Housing, Basic Needs, and Public Space and Infrastructure (Table B-
12).
Table B-12: Output Categories in the Urban and Rural Development Issue Area
Output Category Number of Outputs
Community Well-being 4,296
Housing 994
Basic Needs 719
Public Space and Infrastructure 301
Total 6,310
We gain further insights into the accomplishments of service projects in the URD primary issue
area by examining the types of output in each of the four output categories.
Community Well-being
The Community Well-being output category had 28 types of outputs, as listed in Table B-13. In
this category, NCCC teams frequently recorded the removal of debris and trash, followed by
tending or starting a garden, planning or conducting community activities, and supporting K-
12students.

129
Table B-13: Community Well-being Outputs - Urban and Rural Development Issue Area
(N=4296)
As an example of the work performed under the community well-being output category, one
project noted:
“Blue Two served Loaves and Fishes in five programs, assisting the staff in running each
program more efficiently during their busiest time of year and upholding the
organization’s mission of providing guests with acceptance and respect in a safe
environment. The team served meals to 26,021 guests through the Dining Room,

130
Maryhouse and Mustard Seed School and assisted a total of 10,953 guests with questions
and services. At Mustard Seed, Blue Two tutored 64 preschool students, 72 elementary
school students and 26 middle school students and led 1.5 hours of physical activity each
day, totaling 665.5 hours. At Maryhouse, the team sorted and inventoried 7,255 pounds
of clothing donations and organized and packaged 220 pounds of toiletries for individual
donations. The team supported a library and a computer lab by aiding the Librarian in
daily operations and tasks.”
Housing
The Housing output category encompassed four types of outputs. More than half (57%) of the
number of outputs are “Homes painted or renovated,” followed by “Houses constructed” (37%).
Table B-14: Housing Outputs - Urban and Rural Development Issue Area (N=994)
As an example of the work performed under “Housing,” output category, one project stated:
“Oak Four winterized 15 homes by preparing plumbing pipes for winter. The team
framed two 250 square foot porches for new homes. The main focus of work during the
project with Habitat for Humanity in Omaha was organizing and packing materials and
supplies at their 5,000 square foot warehouse and assisting with moving, unpacking, and
reorganizing supplies in their new 24,000 square foot warehouse. Members removed
6,000 pounds of plant material and garbage from Habitat properties. The team installed
insulation, countertops, and screen doors at three homes, as well as power-washed
sidewalk and siding. Oak Four helped deliver building supplies to four Habitat work
sites.”
Basic Needs
The Basic Needs category in the URD primary issue area had eight types of outputs (Table B-
15), including the most frequent types: serving meals (32%), receiving household goods or
personal items (24%), and receiving, sorting and distributing clothes (24%).
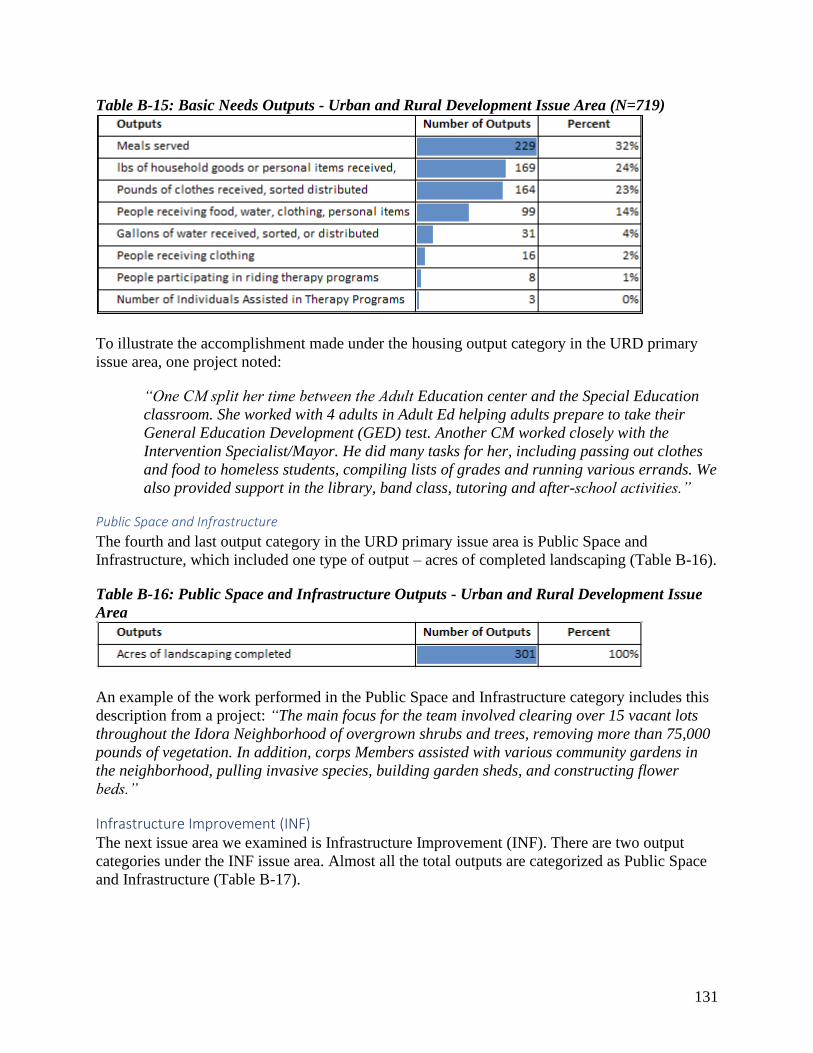
131
Table B-15: Basic Needs Outputs - Urban and Rural Development Issue Area (N=719)
To illustrate the accomplishment made under the housing output category in the URD primary
issue area, one project noted:
“One CM split her time between the Adult Education center and the Special Education
classroom. She worked with 4 adults in Adult Ed helping adults prepare to take their
General Education Development (GED) test. Another CM worked closely with the
Intervention Specialist/Mayor. He did many tasks for her, including passing out clothes
and food to homeless students, compiling lists of grades and running various errands. We
also provided support in the library, band class, tutoring and after-school activities.”
Public Space and Infrastructure
The fourth and last output category in the URD primary issue area is Public Space and
Infrastructure, which included one type of output – acres of completed landscaping (Table B-16).
Table B-16: Public Space and Infrastructure Outputs - Urban and Rural Development Issue
Area
An example of the work performed in the Public Space and Infrastructure category includes this
description from a project: “The main focus for the team involved clearing over 15 vacant lots
throughout the Idora Neighborhood of overgrown shrubs and trees, removing more than 75,000
pounds of vegetation. In addition, corps Members assisted with various community gardens in
the neighborhood, pulling invasive species, building garden sheds, and constructing flower
beds.”
Infrastructure Improvement (INF) The next issue area we examined is Infrastructure Improvement (INF). There are two output
categories under the INF issue area. Almost all the total outputs are categorized as Public Space
and Infrastructure (Table B-17).
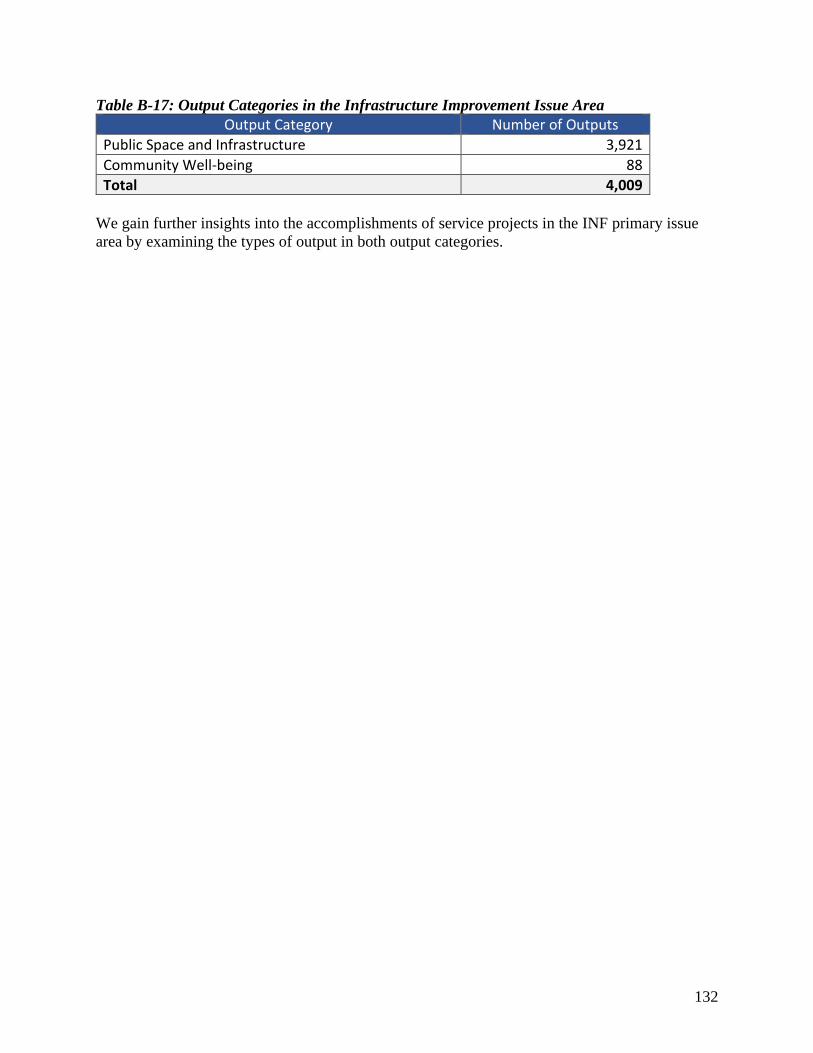
132
Table B-17: Output Categories in the Infrastructure Improvement Issue Area
Output Category Number of Outputs
Public Space and Infrastructure 3,921
Community Well-being 88
Total 4,009
We gain further insights into the accomplishments of service projects in the INF primary issue
area by examining the types of output in both output categories.
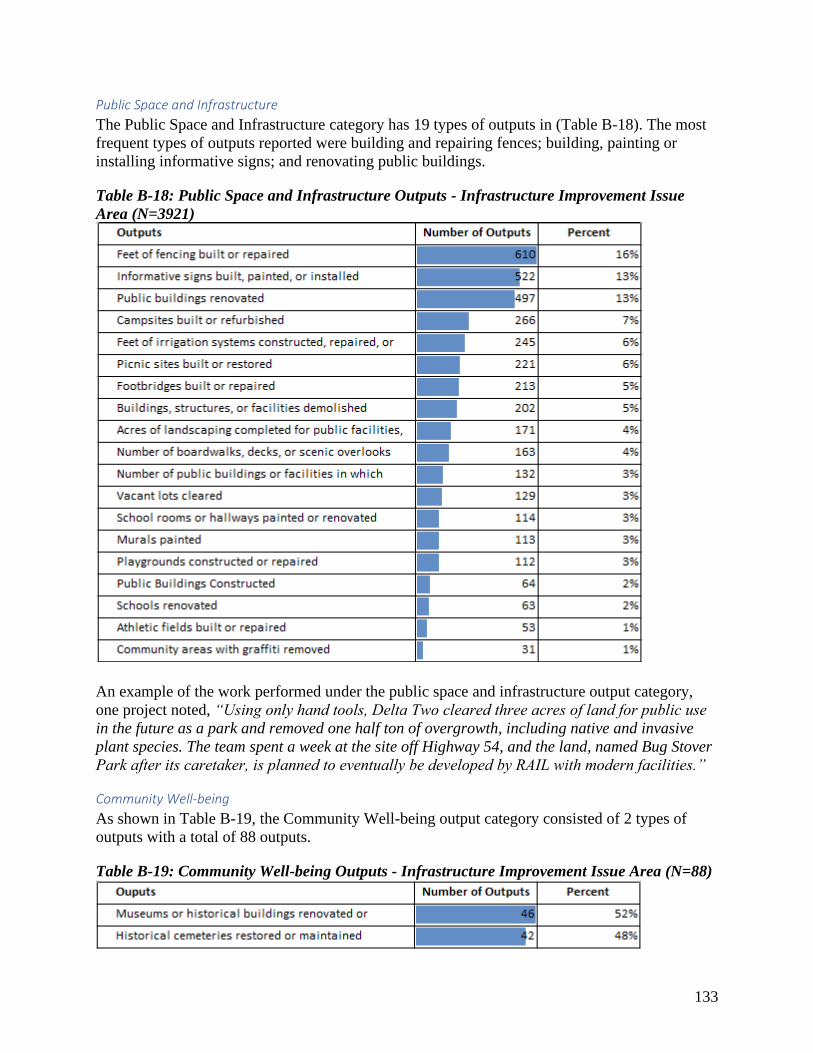
133
Public Space and Infrastructure
The Public Space and Infrastructure category has 19 types of outputs in (Table B-18). The most
frequent types of outputs reported were building and repairing fences; building, painting or
installing informative signs; and renovating public buildings.
Table B-18: Public Space and Infrastructure Outputs - Infrastructure Improvement Issue
Area (N=3921)
An example of the work performed under the public space and infrastructure output category,
one project noted, “Using only hand tools, Delta Two cleared three acres of land for public use
in the future as a park and removed one half ton of overgrowth, including native and invasive
plant species. The team spent a week at the site off Highway 54, and the land, named Bug Stover
Park after its caretaker, is planned to eventually be developed by RAIL with modern facilities.”
Community Well-being
As shown in Table B-19, the Community Well-being output category consisted of 2 types of
outputs with a total of 88 outputs.
Table B-19: Community Well-being Outputs - Infrastructure Improvement Issue Area (N=88)
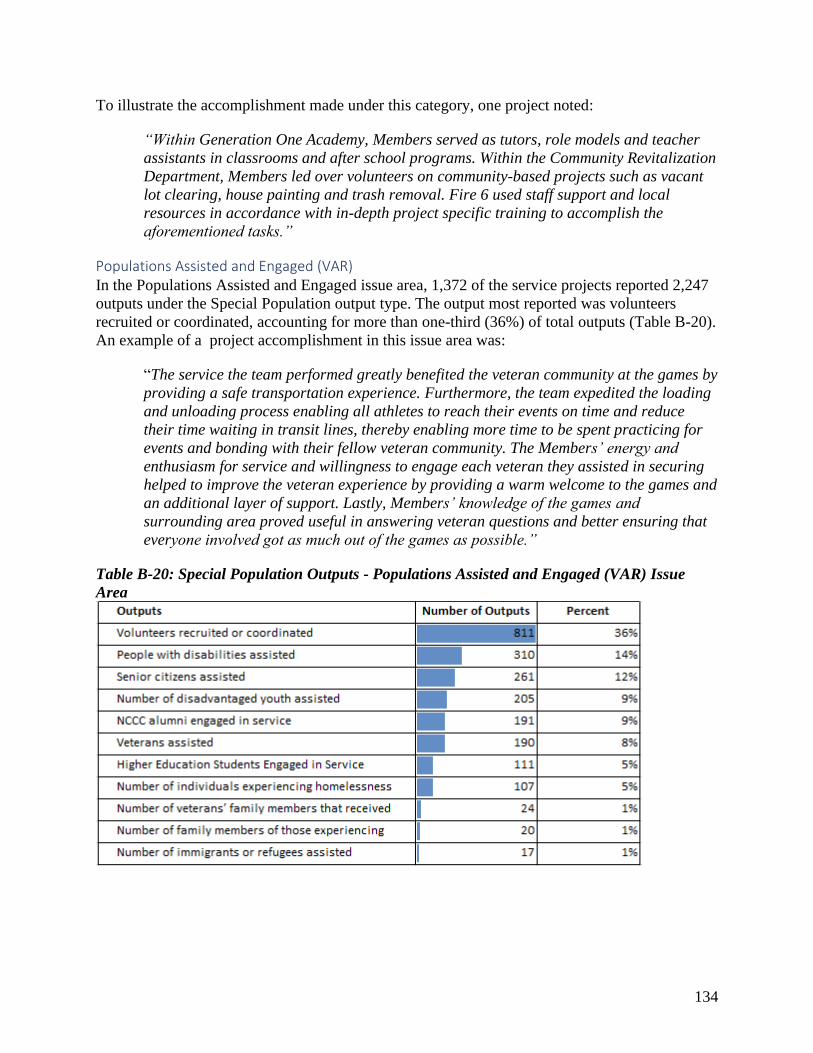
134
To illustrate the accomplishment made under this category, one project noted:
“Within Generation One Academy, Members served as tutors, role models and teacher
assistants in classrooms and after school programs. Within the Community Revitalization
Department, Members led over volunteers on community-based projects such as vacant
lot clearing, house painting and trash removal. Fire 6 used staff support and local
resources in accordance with in-depth project specific training to accomplish the
aforementioned tasks.”
Populations Assisted and Engaged (VAR) In the Populations Assisted and Engaged issue area, 1,372 of the service projects reported 2,247
outputs under the Special Population output type. The output most reported was volunteers
recruited or coordinated, accounting for more than one-third (36%) of total outputs (Table B-20).
An example of a project accomplishment in this issue area was:
“The service the team performed greatly benefited the veteran community at the games by
providing a safe transportation experience. Furthermore, the team expedited the loading
and unloading process enabling all athletes to reach their events on time and reduce
their time waiting in transit lines, thereby enabling more time to be spent practicing for
events and bonding with their fellow veteran community. The Members’ energy and
enthusiasm for service and willingness to engage each veteran they assisted in securing
helped to improve the veteran experience by providing a warm welcome to the games and
an additional layer of support. Lastly, Members’ knowledge of the games and
surrounding area proved useful in answering veteran questions and better ensuring that
everyone involved got as much out of the games as possible.”
Table B-20: Special Population Outputs - Populations Assisted and Engaged (VAR) Issue
Area

135
Federal Emergency Management Agency (FMA) Under the FMA issue area, four types of outputs were reported as shown in Table B-21.
Table B-21: Output Categories in the FEMA Issue Area
Output Category Number of Outputs
Disaster Recovery 670
Disaster Prevention, Preparedness, and Mitigation 403
Disaster Response 84
Basic Needs 27
Total 1,184
Following is a summary of the output categories reported in the FEMA issue area.
Disaster Recovery
The FMA projects reported 670 outputs for Disaster Recovery (Table B-22). As shown in the
table, there are 15 types of outputs, with the greatest number of outputs in general administrative
duties performed and case status updates.
Table B-22: Disaster Recovery Outputs – FEMA Issue Area (N=670)
To illustrate the accomplishment made under this category, one project noted:
“Beginning September 12, 2013, the state of Colorado received widespread flooding and
on September 14, a presidential disaster declaration was made for the most affected
counties. On September 16, Alpine 1 began working at an emergency donations and
distribution center in Loveland, CO. The distribution center was established by the City
of Loveland and is operated by Adventist Community Services (ACS). Alpine 1 was

136
requested to support the operations of the distribution center, and the team members
were split among all departments of the center. Alpine 1 served as a consistent group of
workers who helped the center run as efficiently as possible by maintaining data systems
and operational procedures as established by ACS. FEMA Corps members received,
inventoried and sorted donations, managed volunteers, maintained all data necessary for
operations, including client information and statistics of the amount of items clients took
away from the center. The information collected and maintained was used to help prevent
disaster fraud and to report to the City of Loveland about the activities of the emergency
distribution center. The team helped implement monitoring measures by working with
local police to verify addresses, to ensure that those who needed it most were able to
receive all that they required. Team members also performed customer service to all
clients, and referred them to other agencies if possible and/or necessary. Throughout the
round, corps members from Alpine 1 received, sorted and distributed 315,963 pounds of
donated goods including food, clothing, personal care and household items, assisted
4,000 disaster survivors in meeting their emergency needs, performed 514 hours of data
entry, and managed 1400 volunteers. “
Disaster Prevention, Preparedness, and Mitigation
The FMA projects reported 403 outputs for Disaster Prevention, Preparedness, and Mitigation
(Table B-23). As shown in the table, there are five types of outputs with 52% of outputs in
information provided to X individuals and 31% in general administrative duties performed.
Table B-23: Disaster Prevention, Preparedness, and Mitigation– FEMA Issue Area (N=403)
An example of the work performed under this category was reported by one project, writing, “In
two days, FEMA Corps members were able to inventory $873,656.28 worth of equipment.
FEMA Corps members were able to begin and manage a recycling system for all 4 floors of the
JFO, we were able to gather 30 pounds of recyclables per day.”
Disaster Response
The FMA projects reported 84 outputs for Disaster Response (Table B-24), with critical needs
tallying 48% of the outputs.
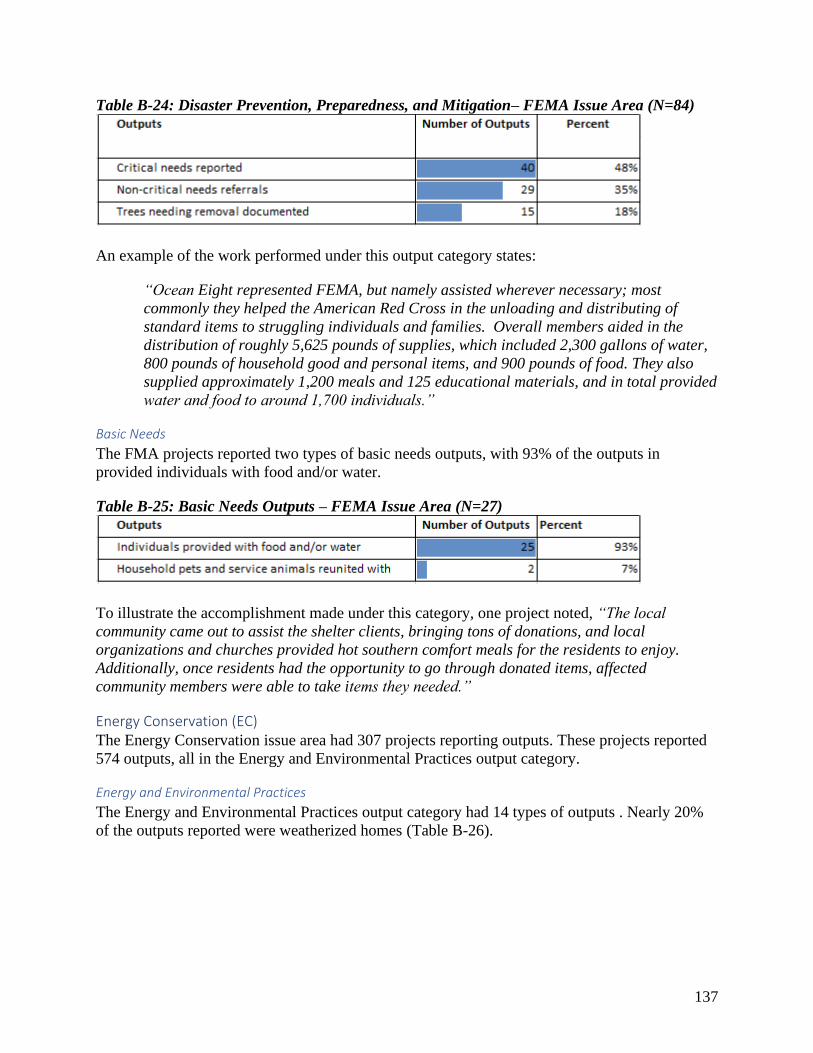
137
Table B-24: Disaster Prevention, Preparedness, and Mitigation– FEMA Issue Area (N=84)
An example of the work performed under this output category states:
“Ocean Eight represented FEMA, but namely assisted wherever necessary; most
commonly they helped the American Red Cross in the unloading and distributing of
standard items to struggling individuals and families. Overall members aided in the
distribution of roughly 5,625 pounds of supplies, which included 2,300 gallons of water,
800 pounds of household good and personal items, and 900 pounds of food. They also
supplied approximately 1,200 meals and 125 educational materials, and in total provided
water and food to around 1,700 individuals.”
Basic Needs
The FMA projects reported two types of basic needs outputs, with 93% of the outputs in
provided individuals with food and/or water.
Table B-25: Basic Needs Outputs – FEMA Issue Area (N=27)
To illustrate the accomplishment made under this category, one project noted, “The local
community came out to assist the shelter clients, bringing tons of donations, and local
organizations and churches provided hot southern comfort meals for the residents to enjoy.
Additionally, once residents had the opportunity to go through donated items, affected
community members were able to take items they needed.”
Energy Conservation (EC) The Energy Conservation issue area had 307 projects reporting outputs. These projects reported
574 outputs, all in the Energy and Environmental Practices output category.
Energy and Environmental Practices
The Energy and Environmental Practices output category had 14 types of outputs . Nearly 20%
of the outputs reported were weatherized homes (Table B-26).
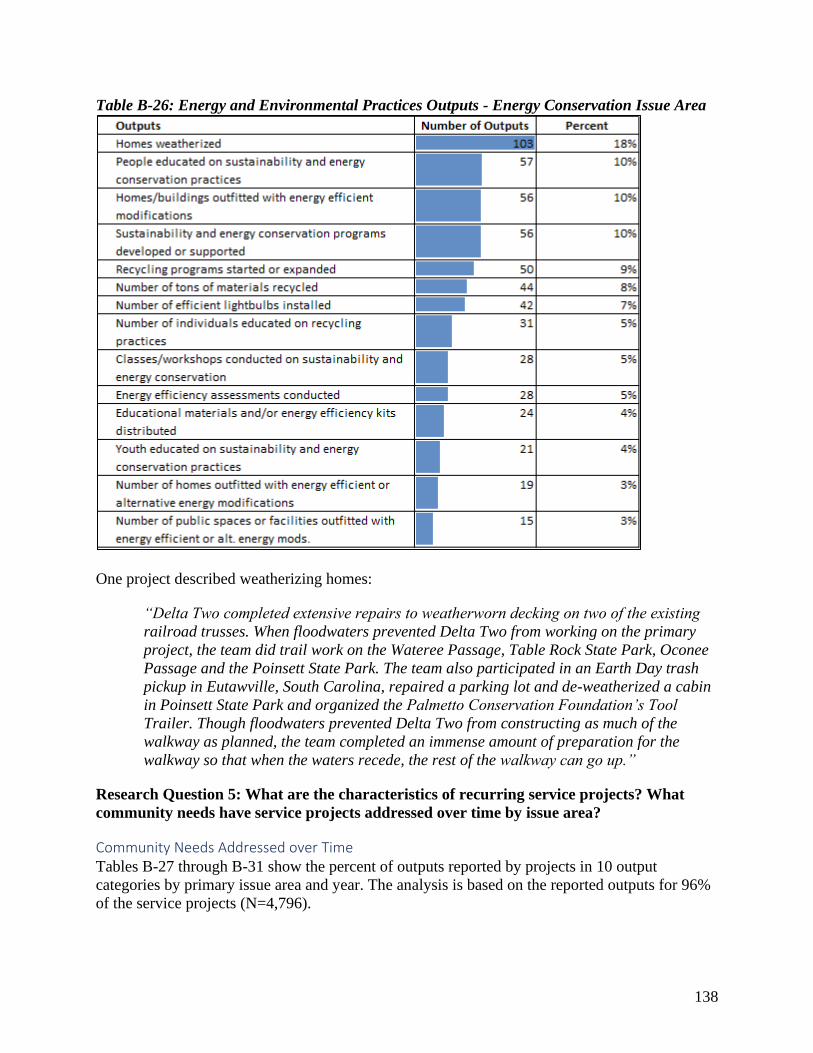
138
Table B-26: Energy and Environmental Practices Outputs - Energy Conservation Issue Area
One project described weatherizing homes:
“Delta Two completed extensive repairs to weatherworn decking on two of the existing
railroad trusses. When floodwaters prevented Delta Two from working on the primary
project, the team did trail work on the Wateree Passage, Table Rock State Park, Oconee
Passage and the Poinsett State Park. The team also participated in an Earth Day trash
pickup in Eutawville, South Carolina, repaired a parking lot and de-weatherized a cabin
in Poinsett State Park and organized the Palmetto Conservation Foundation’s Tool
Trailer. Though floodwaters prevented Delta Two from constructing as much of the
walkway as planned, the team completed an immense amount of preparation for the
walkway so that when the waters recede, the rest of the walkway can go up.”
Research Question 5: What are the characteristics of recurring service projects? What
community needs have service projects addressed over time by issue area?
Community Needs Addressed over Time Tables B-27 through B-31 show the percent of outputs reported by projects in 10 output
categories by primary issue area and year. The analysis is based on the reported outputs for 96%
of the service projects (N=4,796).
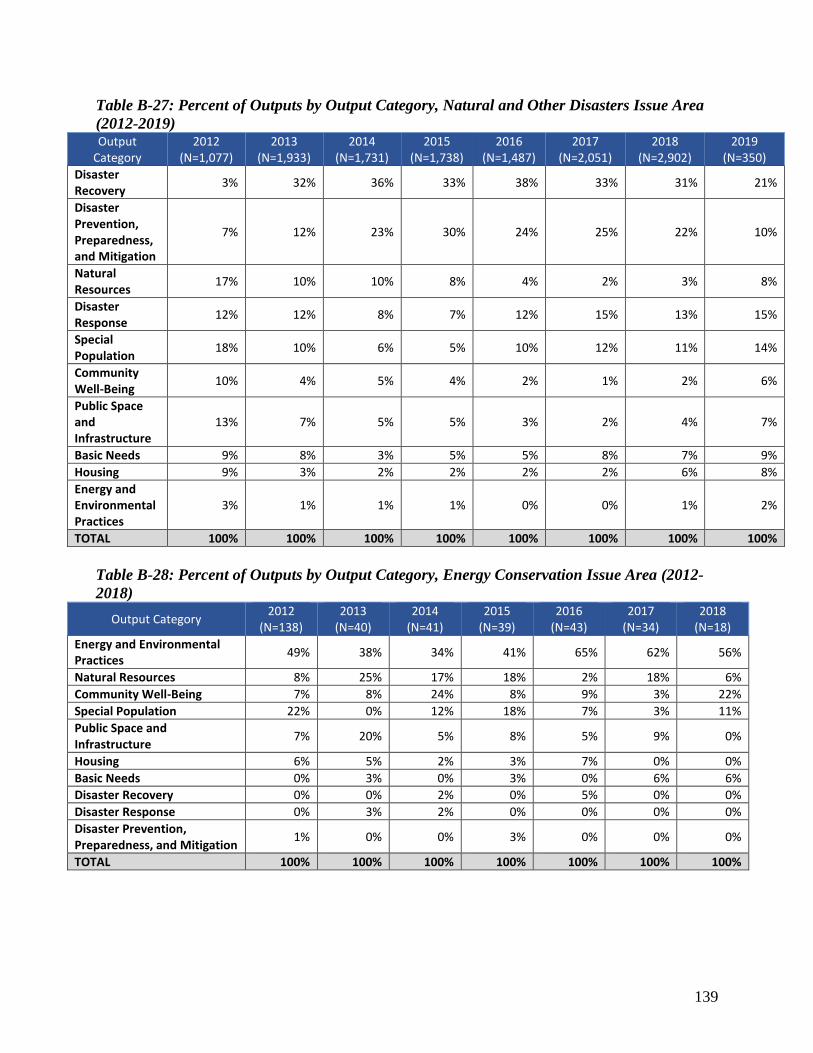
139
Table B-27: Percent of Outputs by Output Category, Natural and Other Disasters Issue Area
(2012-2019) Output
Category 2012
(N=1,077) 2013
(N=1,933) 2014
(N=1,731) 2015
(N=1,738) 2016
(N=1,487) 2017
(N=2,051) 2018
(N=2,902) 2019
(N=350)
Disaster Recovery
3% 32% 36% 33% 38% 33% 31% 21%
Disaster Prevention, Preparedness, and Mitigation
7% 12% 23% 30% 24% 25% 22% 10%
Natural Resources
17% 10% 10% 8% 4% 2% 3% 8%
Disaster Response
12% 12% 8% 7% 12% 15% 13% 15%
Special Population
18% 10% 6% 5% 10% 12% 11% 14%
Community Well-Being
10% 4% 5% 4% 2% 1% 2% 6%
Public Space and Infrastructure
13% 7% 5% 5% 3% 2% 4% 7%
Basic Needs 9% 8% 3% 5% 5% 8% 7% 9%
Housing 9% 3% 2% 2% 2% 2% 6% 8%
Energy and Environmental Practices
3% 1% 1% 1% 0% 0% 1% 2%
TOTAL 100% 100% 100% 100% 100% 100% 100% 100%
Table B-28: Percent of Outputs by Output Category, Energy Conservation Issue Area (2012-
2018)
Output Category 2012
(N=138) 2013
(N=40) 2014
(N=41) 2015
(N=39) 2016
(N=43) 2017
(N=34) 2018
(N=18)
Energy and Environmental Practices
49% 38% 34% 41% 65% 62% 56%
Natural Resources 8% 25% 17% 18% 2% 18% 6%
Community Well-Being 7% 8% 24% 8% 9% 3% 22%
Special Population 22% 0% 12% 18% 7% 3% 11%
Public Space and Infrastructure
7% 20% 5% 8% 5% 9% 0%
Housing 6% 5% 2% 3% 7% 0% 0%
Basic Needs 0% 3% 0% 3% 0% 6% 6%
Disaster Recovery 0% 0% 2% 0% 5% 0% 0%
Disaster Response 0% 3% 2% 0% 0% 0% 0%
Disaster Prevention, Preparedness, and Mitigation
1% 0% 0% 3% 0% 0% 0%
TOTAL 100% 100% 100% 100% 100% 100% 100%
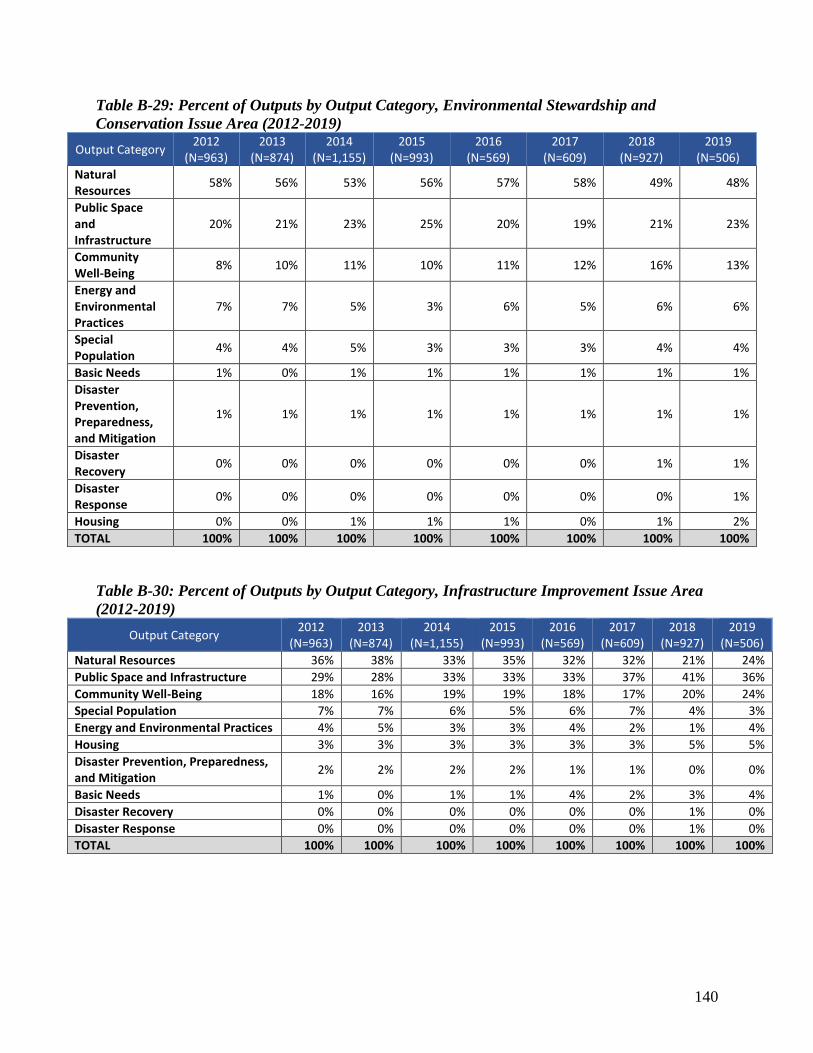
140
Table B-29: Percent of Outputs by Output Category, Environmental Stewardship and
Conservation Issue Area (2012-2019)
Output Category 2012
(N=963) 2013
(N=874) 2014
(N=1,155) 2015
(N=993) 2016
(N=569) 2017
(N=609) 2018
(N=927) 2019
(N=506)
Natural Resources
58% 56% 53% 56% 57% 58% 49% 48%
Public Space and Infrastructure
20% 21% 23% 25% 20% 19% 21% 23%
Community Well-Being
8% 10% 11% 10% 11% 12% 16% 13%
Energy and Environmental Practices
7% 7% 5% 3% 6% 5% 6% 6%
Special Population
4% 4% 5% 3% 3% 3% 4% 4%
Basic Needs 1% 0% 1% 1% 1% 1% 1% 1%
Disaster Prevention, Preparedness, and Mitigation
1% 1% 1% 1% 1% 1% 1% 1%
Disaster Recovery
0% 0% 0% 0% 0% 0% 1% 1%
Disaster Response
0% 0% 0% 0% 0% 0% 0% 1%
Housing 0% 0% 1% 1% 1% 0% 1% 2%
TOTAL 100% 100% 100% 100% 100% 100% 100% 100%
Table B-30: Percent of Outputs by Output Category, Infrastructure Improvement Issue Area
(2012-2019)
Output Category 2012
(N=963) 2013
(N=874) 2014
(N=1,155) 2015
(N=993) 2016
(N=569) 2017
(N=609) 2018
(N=927) 2019
(N=506)
Natural Resources 36% 38% 33% 35% 32% 32% 21% 24%
Public Space and Infrastructure 29% 28% 33% 33% 33% 37% 41% 36%
Community Well-Being 18% 16% 19% 19% 18% 17% 20% 24%
Special Population 7% 7% 6% 5% 6% 7% 4% 3%
Energy and Environmental Practices 4% 5% 3% 3% 4% 2% 1% 4%
Housing 3% 3% 3% 3% 3% 3% 5% 5%
Disaster Prevention, Preparedness, and Mitigation
2% 2% 2% 2% 1% 1% 0% 0%
Basic Needs 1% 0% 1% 1% 4% 2% 3% 4%
Disaster Recovery 0% 0% 0% 0% 0% 0% 1% 0%
Disaster Response 0% 0% 0% 0% 0% 0% 1% 0%
TOTAL 100% 100% 100% 100% 100% 100% 100% 100%
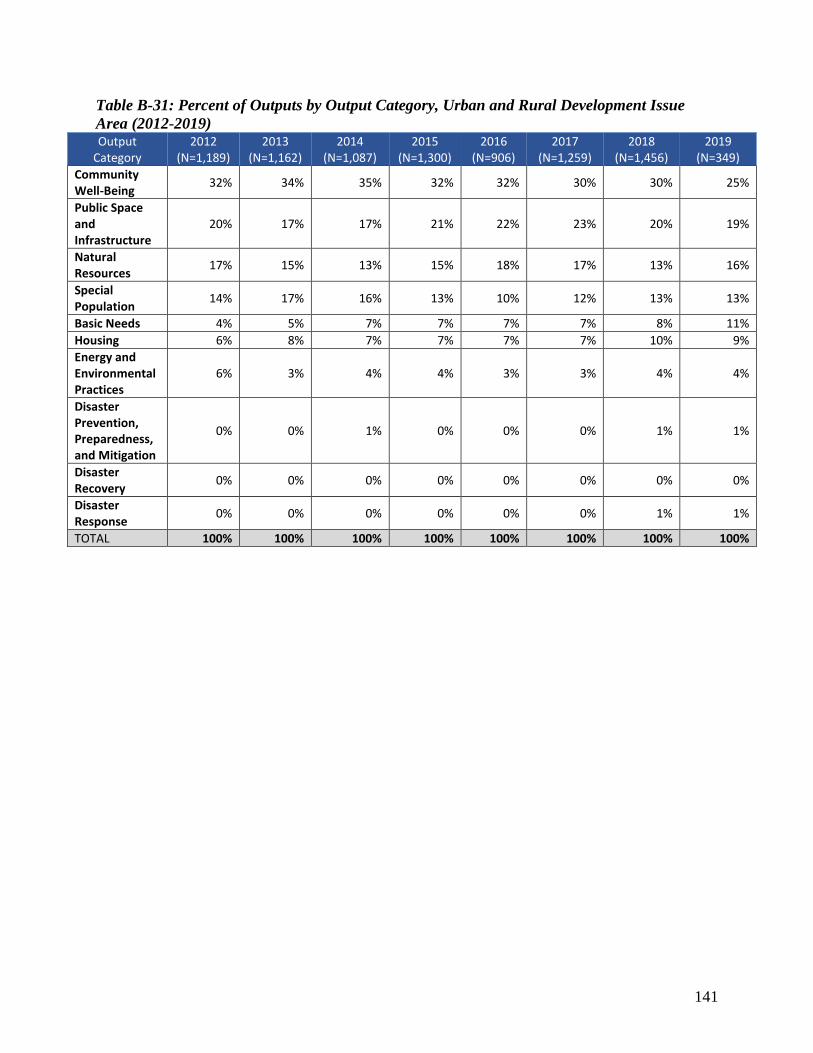
141
Table B-31: Percent of Outputs by Output Category, Urban and Rural Development Issue
Area (2012-2019) Output
Category 2012
(N=1,189) 2013
(N=1,162) 2014
(N=1,087) 2015
(N=1,300) 2016
(N=906) 2017
(N=1,259) 2018
(N=1,456) 2019
(N=349)
Community Well-Being
32% 34% 35% 32% 32% 30% 30% 25%
Public Space and Infrastructure
20% 17% 17% 21% 22% 23% 20% 19%
Natural Resources
17% 15% 13% 15% 18% 17% 13% 16%
Special Population
14% 17% 16% 13% 10% 12% 13% 13%
Basic Needs 4% 5% 7% 7% 7% 7% 8% 11%
Housing 6% 8% 7% 7% 7% 7% 10% 9%
Energy and Environmental Practices
6% 3% 4% 4% 3% 3% 4% 4%
Disaster Prevention, Preparedness, and Mitigation
0% 0% 1% 0% 0% 0% 1% 1%
Disaster Recovery
0% 0% 0% 0% 0% 0% 0% 0%
Disaster Response
0% 0% 0% 0% 0% 0% 1% 1%
TOTAL 100% 100% 100% 100% 100% 100% 100% 100%
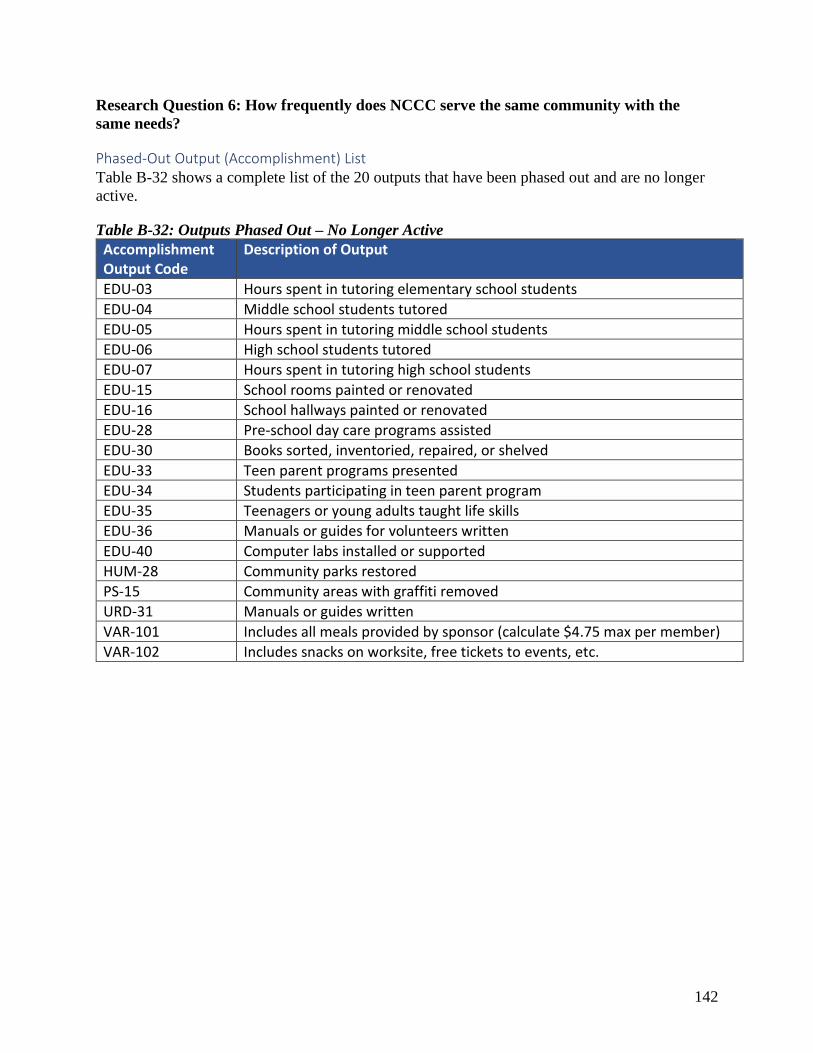
142
Research Question 6: How frequently does NCCC serve the same community with the
same needs?
Phased-Out Output (Accomplishment) List Table B-32 shows a complete list of the 20 outputs that have been phased out and are no longer
active.
Table B-32: Outputs Phased Out – No Longer Active
Accomplishment Output Code
Description of Output
EDU-03 Hours spent in tutoring elementary school students
EDU-04 Middle school students tutored
EDU-05 Hours spent in tutoring middle school students
EDU-06 High school students tutored
EDU-07 Hours spent in tutoring high school students
EDU-15 School rooms painted or renovated
EDU-16 School hallways painted or renovated
EDU-28 Pre-school day care programs assisted
EDU-30 Books sorted, inventoried, repaired, or shelved
EDU-33 Teen parent programs presented
EDU-34 Students participating in teen parent program
EDU-35 Teenagers or young adults taught life skills
EDU-36 Manuals or guides for volunteers written
EDU-40 Computer labs installed or supported
HUM-28 Community parks restored
PS-15 Community areas with graffiti removed
URD-31 Manuals or guides written
VAR-101 Includes all meals provided by sponsor (calculate $4.75 max per member)
VAR-102 Includes snacks on worksite, free tickets to events, etc.
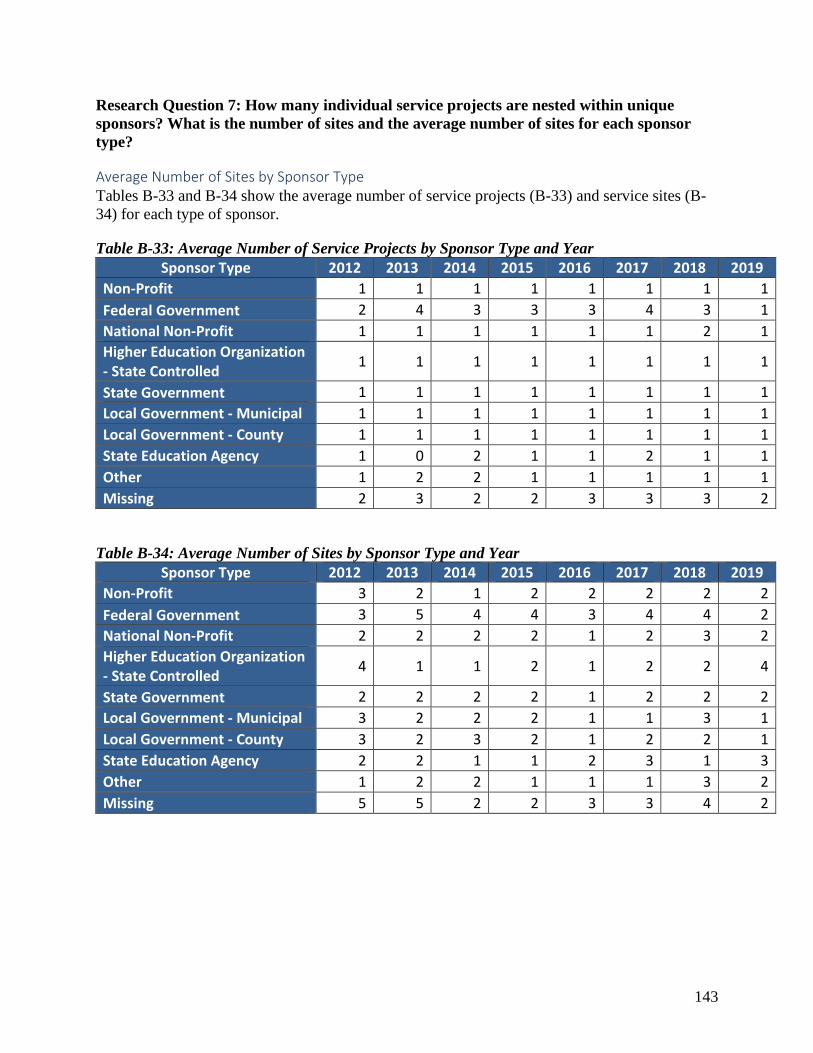
143
Research Question 7: How many individual service projects are nested within unique
sponsors? What is the number of sites and the average number of sites for each sponsor
type?
Average Number of Sites by Sponsor Type Tables B-33 and B-34 show the average number of service projects (B-33) and service sites (B-
34) for each type of sponsor.
Table B-33: Average Number of Service Projects by Sponsor Type and Year
Sponsor Type 2012 2013 2014 2015 2016 2017 2018 2019
Non-Profit 1 1 1 1 1 1 1 1
Federal Government 2 4 3 3 3 4 3 1
National Non-Profit 1 1 1 1 1 1 2 1
Higher Education Organization - State Controlled
1 1 1 1 1 1 1 1
State Government 1 1 1 1 1 1 1 1
Local Government - Municipal 1 1 1 1 1 1 1 1
Local Government - County 1 1 1 1 1 1 1 1
State Education Agency 1 0 2 1 1 2 1 1
Other 1 2 2 1 1 1 1 1
Missing 2 3 2 2 3 3 3 2
Table B-34: Average Number of Sites by Sponsor Type and Year
Sponsor Type 2012 2013 2014 2015 2016 2017 2018 2019
Non-Profit 3 2 1 2 2 2 2 2
Federal Government 3 5 4 4 3 4 4 2
National Non-Profit 2 2 2 2 1 2 3 2
Higher Education Organization - State Controlled
4 1 1 2 1 2 2 4
State Government 2 2 2 2 1 2 2 2
Local Government - Municipal 3 2 2 2 1 1 3 1
Local Government - County 3 2 3 2 1 2 2 1
State Education Agency 2 2 1 1 2 3 1 3
Other 1 2 2 1 1 1 3 2
Missing 5 5 2 2 3 3 4 2