analysis of the coordinate differences caused by different ...€¦ · analysis of the coordinate...
TRANSCRIPT
1
Analysis of the Coordinate Differences caused by Different Methods to align the Combined EUREF Solution to the ITRF
C. BRUYNINX1, G. CARPENTIER1, P. DEFRAIGNE1
Presented at the EUREF Symposium, June 1-4, 2005, Vienna, Austria
Abstract The station coordinates in the weekly combined EUREF SINEX solution are the main product of the EUREF Permanent Network (EPN). However, these weekly solutions are not consistent in time because the underlying reference frame has changed several times throughout the years. When re-aligning each of the EUREF SINEX solutions to the ITRF2000 using the minimum constraint approach, the vertical component of the station coordinates changes at the cm-level. This coordinate change finds its origin in a bug in a subroutine correcting the Earth tides in the Bernese GPS software. This bug affected the vertical component of the weekly EUREF solution with an annual periodicity reaching peak-to-peak 2.8 cm for a typical EPN station like Brussels. While this annual period is clearly seen in the coordinates of the combined EUREF solution, it fades in the minimally constrained solution because it is absorbed by the underlying Helmert transformation.
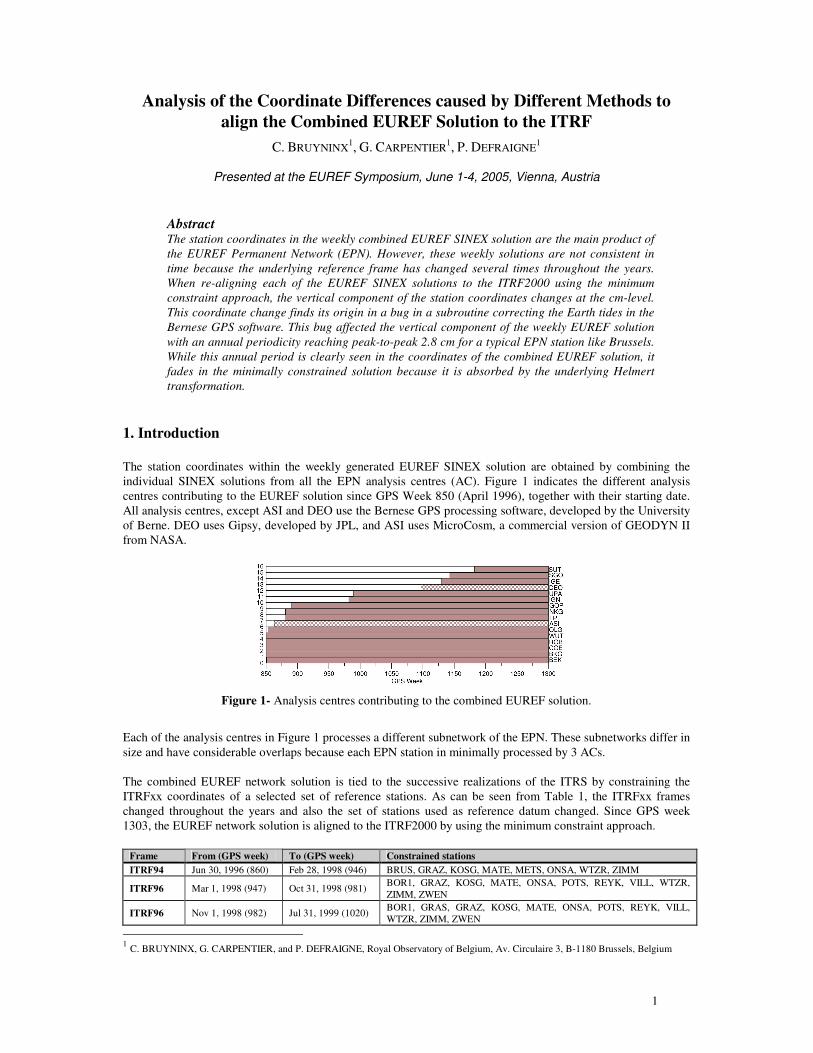
1. Introduction The station coordinates within the weekly generated EUREF SINEX solution are obtained by combining the individual SINEX solutions from all the EPN analysis centres (AC). Figure 1 indicates the different analysis centres contributing to the EUREF solution since GPS Week 850 (April 1996), together with their starting date. All analysis centres, except ASI and DEO use the Bernese GPS processing software, developed by the University of Berne. DEO uses Gipsy, developed by JPL, and ASI uses MicroCosm, a commercial version of GEODYN II from NASA.
Figure 1- Analysis centres contributing to the combined EUREF solution.
Each of the analysis centres in Figure 1 processes a different subnetwork of the EPN. These subnetworks differ in size and have considerable overlaps because each EPN station in minimally processed by 3 ACs. The combined EUREF network solution is tied to the successive realizations of the ITRS by constraining the ITRFxx coordinates of a selected set of reference stations. As can be seen from Table 1, the ITRFxx frames changed throughout the years and also the set of stations used as reference datum changed. Since GPS week 1303, the EUREF network solution is aligned to the ITRF2000 by using the minimum constraint approach.
Frame From (GPS week) To (GPS week) Constrained stations ITRF94 Jun 30, 1996 (860) Feb 28, 1998 (946) BRUS, GRAZ, KOSG, MATE, METS, ONSA, WTZR, ZIMM
ITRF96 Mar 1, 1998 (947) Oct 31, 1998 (981) BOR1, GRAZ, KOSG, MATE, ONSA, POTS, REYK, VILL, WTZR, ZIMM, ZWEN
ITRF96 Nov 1, 1998 (982) Jul 31, 1999 (1020) BOR1, GRAS, GRAZ, KOSG, MATE, ONSA, POTS, REYK, VILL, WTZR, ZIMM, ZWEN
1 C. BRUYNINX, G. CARPENTIER, and P. DEFRAIGNE, Royal Observatory of Belgium, Av. Circulaire 3, B-1180 Brussels, Belgium

2
ITRF97 Aug 1, 1999 (1021) Apr 8, 2000 (1056) BOR1, GRAS, GRAZ, KOSG, MATE, NYA1, ONSA, POTS, REYK, THU1, TRO1, VILL, WTZR, ZWEN
ITRF97 Apr 9, 2000 (1057) Dec 1, 2000 (1142) BOR1, GRAS, GRAZ, KOSG, MATE, NYA1, ONSA, POTS, REYK, THU1, TRO1, VILL, WTZR
ITRF2000 Dec 2, 2001 (1143) Jan 5, 2002 (1147) BOR1, GRAS, GRAZ, KOSG, MATE, NYA1, ONSA, POTS, REYK, THU1, TRO1, VILL, WTZR
ITRF2000 Jan 6, 2002 (1148) Jul 10, 2004 (1278) BOR1, GRAS, GRAZ, KOSG, MATE, NYA1, ONSA, POTS, REYK, TRO1, VILL, WTZR
ITRF2000 Jul 11, 2004 (1279) Dec 25,2004 (1302) BOR1, GRAS, GRAZ, KOSG, MATE, NYA1, ONSA, POTS, REYK, VILL, WTZR
Table 1 – Successive frames to which the combined EUREF coordinate solution was tied.
The reference frame changes cause jumps in the EUREF coordinates. This can be seen when we extract for each EPN station the weekly estimated (X,Y,Z) coordinate from the combined EUREF solutions and compute the difference between each weekly coordinate and its mean. These differences are then converted to a local (N,E,U) system. Some examples are given in Figure 2.

3
Figure 2- Coordinates extracted from combined EUREF solution.
2. Comparison of the constrained and minimally constrained solutions In order to have more continuous time series, we used the minimum constraint approach to re-align all weekly combined EUREF solutions with the same ITRF, namely the ITRF2000, using the CatRef software (Altamimi et al, 2004). Altamimi (2003) already showed that the minimum constraint approach would be a better way of tying the EUREF solution to the ITRF, and he applied, as an example, this approach to the combined EUREF solution of GPS week 1149. We will now apply it to all the weekly EUREF solutions. Afterwards, similar to what was done in Figure 2, we extracted for each EPN station the (X,Y,Z) coordinates from the re-aligned weekly solutions and computed the difference between each weekly coordinate and its mean. These differences are then again converted to a local (N,E,U) system. The results are given in Figure 3. The comparison of Figure 2 and Figure 3 shows that the behaviour of the vertical component of the coordinates has changed considerably. In Figure 2, most of the stations show a strong annual periodicity in their vertical component. In Figure 3 this periodicity has mostly disappeared. In order to assess if this periodicity is common to the whole network, we estimated for each weekly solution the scale between the combined EUREF solution and the ITRF2000. The result in given in Figure 4 where we can see that the annual period starts around GPS week 1000 and seems to fade in the latest EUREF solutions. Using a test solution for GPS week 1149, Altamimi (2003) demonstrated that the difference between the station coordinates within the EUREF SINEX solution (for the period it was constrained to the ITRF2000) and the coordinates outcome from minimally constrained solution differed only with a few mm. However, due to the fact that both Figure 2 and Figure 3 show time series with respect to their internal mean coordinate, these drawings do not give information about the absolute coordinate differences between the constrained and minimally constrained solutions. Therefore, we have computed these absolute differences for two stations, Brussels and Onsala (which was constrained in the original EUREF solution), and this for the complete time period where the EUREF solution was tied to the ITRF2000 using constraints (GPS week 1143 – 1302). The results are shown in Figure 5. For Brussels, the difference between the two approaches reaches a few mm for the horizontal component. However for the vertical component, the differences are between -1.5 and 1.5 cm. This difference was not detected by Altamimi (2003) because for his test week (the dotted line in Figure 5), the differences are respectively -0.17 mm, -0.07 mm and 0.70 mm, in the north, east and up-components. For Onsala, the annual periodicity is not explicitly present since this station was constrained to the ITRF in the original EUREF solution. However, as is also the case for Brussels, the differences in the up-component have a non-zero mean. This result was also confirmed by the test of Altamimi.

4
Figure 3 – Coordinates extracted from combined EUREF solution aligned to the ITRF2000 using the minimum constraint approach.

5
Figure 4 - Scale factor between the weekly combined EUREF solution and the ITRF2000. Each week a new scale is estimated.
Figure 5 – Difference between the minimally constrained and the constrained solution (EUREF solution), Left:
BRUS, right: ONSA. The dotted line corresponds to Altamimi’s test week 1149.
3. Analysis of the Coordinate Differences What happened with the EUREF solution around GPS week 1000? As can be seen from Figure 1, at that time, 12 analysis centres were contributing to the EPN: ASI, BEK, BKG, COE (CODE), GOP, IGN, LPT, NKG, OLG, ROB, UPA and WUT. All of these analysis centres, except ASI were using the Bernese 4.0 and switched around GPS week 1040 (with the exception of CODE which from which we can suppose they did the switch long before the others) to the Bernese 4.2 version. At that time, CODE processed still a major part of the EPN stations (half of the stations). In the summer of 2004, the University of Berne detected a “tidal bug” in the Bernese GPS processing software (see BSW Electronic Mail, Message 190). This bug was originally introduced in version 4.2 of the Bernese and was detected when distributing version 5.0 within the GPS user community. The mail explained that
“The height component of stations at mid latitudes shows a one-per-day variation with an amplitude of about 1 cm with a superposed annual variation with an amplitude of another 1 cm. The coordinates in small regional networks are only affected at the sub-millimeter level because this effect cancels by the definition of the datum. For large regional networks a seasonal variation of the scale must be expected, and for a global network the error causes regionally correlated station height errors of up to one centimeter.”
The bug consisted of an incorrect expression of the time argument within the computation of the frequency dependent part of the tidal displacement for diurnal and long-period tides. In the long-period tidal band (periods of 13.7 days, 6 months and one year), the frequency dependence arises from the earth’s mantle inelasticity and it induces a periodic displacement of less than 1 mm in amplitude. In the dominating diurnal band, the frequency-dependent part is mainly due to the Nearly Diurnal Free Wobble resonance, a mode associated with the Free Core Nutation, of which the period is quasi-diurnal (1.0023 days). In the vertical component, its amplitude reaches about 2 cm peak-to-peak for European stations. The bug caused that the variable FHR used to express the hour of the day in the subroutine for the diurnal and long-period tides took values in the range 0-1, while it should have values ranging from 0 to 24. As the effect on long period tides is below the mm level, we only concentrate on the diurnal frequency band which is illustrated in

6
Figure 6. The true tidal displacement appears with its diurnal period, and of course its daily averages are about zero. But, due to the bug, the tidal displacement correction appears with non-zero daily averages with a close to annual periodicity and amplitude of about 2 cm peak-to-peak. Consequently, an annual signal was introduced in the computed daily station positions. This annual period originates from the fact that the main diurnal wave (the one with the largest amplitude), named K1, is not perfectly diurnal, its frequency is 1.002737909 cycle/day (=1+1/365.2422) days. Therefore, the maxima of the diurnal wave are shifted in time every day by 1/365.2422 day, and using the tidal displacement of 0h for all the days, leads to a period of 365.2422 days. This corresponds to the principle of aliasing, as one uses one point per day while there is a higher frequency in the signal. Only the vertical component is affected, because the frequency-dependent contribution to the horizontal components of the station position is below one mm.
Figure 6 – Effect of the Bernese tidal bug on the vertical position. The lower graph shows a zoom of a part of the
upper graph. Being already present in the Bernese V4.2, it is realistic to suppose that the bug has been introduced in the combined EUREF solutions gradually, first from the moment the CODE group switched to V4.2, and later when the majority of the other ACs introduced V4.2 in GPS week 1040 (Dec. 1999). A few of the ACs even did the switch some weeks later. In order to validate the assumption that the annual periodicities observed in the vertical component of the combined EUREF solutions are due the Bernese tidal bug, we compared the vertical component of the coordinates from the combined EUREF solution with the difference between the correct frequency-dependent tidal displacement and the one used by the bug. Some comparisons are shown in Figure 7 ; they show that the correlation is station-dependent. This can be explained by the following facts: • Presently, 14 of the 16 EPN analysis centres use the Bernese GPS processing software; the other two
analysis centres use Microcosm and Gipsy. Among the stations in Figure 7, CAGL is the only station that is not only processed by analysis centres using Bernese, but is also processed by an analysis centre not using Bernese. This can explain why the correlation is less striking for this station.
• The station height component is very sensible to geophysical effects. An already existing periodicity in this component can mask, or be combined with, the annual periodicity caused by the tidal bug.
Around GPS week 1140, there is almost no agreement between the vertical component and the tidal bug. As can be seen in Figure 8, this can be explained by the fact that at that time the quality of the combined EUREF solution was reduced mainly due to problem with the reference station THU1, which was removed as reference station in GPS week 1148 (see Table 1).
The bug was reported on July 15, 2004 and could be corrected in the combined EUREF solution from GPS week 1277 on. However, from the 14 AC that use Bernese, 9 did not correct the bug at all and only 3 AC’s corrected it. For the remaining 2 AC the information is not available to date.

7
Figure 7 – Comparison of the vertical component of the coordinates in combined EUREF solution and the
difference between the correct frequency-dependent tidal displacement and the one used by the bug (solid line).
Figure 8 – Root mean square error of the weekly EUREF SINEX solutions
4. Influence on the Stacked Coordinate Time Series Why doesn’t this periodicity show up when the weekly EUREF SINEX solutions are stacked over time in order to produce time series? The answer is simple: in order be able to stack these normal equations, it is necessary to first remove their constraints and then align each solution with a reference solution (a subset of the ITRF2000 for example) through a Helmert transformation.
Figure 9 – Vertical component for the station Metsahovi (Finland): (1) extracted from weekly combined EUREF
solution, (2) after removing constraints from (1), (3) after re-aligning (2) to the ITRF2000 using minimum constraint (implicit Helmert transformation)

8
This is an effect similar to the one we saw when comparing Figure 2 and Figure 3. Figure 9 illustrates these three steps for the station Metsahövi and shows how in the last step, before the stacking, the large annual periodicity disappears. In Figure 10, the scale factor of this weekly Helmert transformation is shown and a clear annual periodicity appears around GPS week 1000. This scale factor has absorbed the common annual network periodicity in the EUREF time series.
Figure 10 – Detrended scale factor between the weekly combined EUREF solution and the ITRF2000. The solid
line shows the vertical displacement induced by the earth tide bug at the station Potsdam.
5. Conclusion
We have shown that a bug in the Bernese software degrades the quality of the combined EUREF coordinate solution with an annual period from the beginning of 2000 on. The final shape of the annual periodicity caused by the bug is station-dependent because within the EPN not all ACs use the Bernese software and in addition a lot of stations have already local geophysical periodicities. Even while the bug has been reported in the summer of 2004 and the necessary software corrections were distributed to the Bernese user community, the majority of the EPN analysis centres did not correct their software for it. The reason why this bug remained undetected for so long is that it does not show up when coordinate time series are produced using a Helmert transformation, which absorbs the main part of the annual periodicity (the part common to the whole EPN network). Since GPS week 1303, the EUREF SINEX solution is tied to the ITRF2000 using the minimum constraint approach. We have shown that, if the EUREF AC will not all correct the Bernese bug, the fact of tying the weekly EUREF solution to the ITRF2000 using the minimum constraint approach instead of using the classic constraint approach, can cause coordinate differences of up to 1.5 cm in the vertical component and a few mm in the horizontal components. The reprocessing of the EPN data has been under discussion for some time now and we can only conclude that this paper provides us with one more argument in favour of reprocessing. Acknowledgements: The research of G. Carpentier was supported by the DWTC grant MO/33008. References
Altamimi Z. (2003) Discussion of How to Express a Regional GPS Solution in the ITRF, EUREF Publication No. 12, Verlag des Bundesamtes für Kartographie und Geodäsie, Frankfurt am Main 2003, pp. 162-167
Altamimi Z, Sillard P, Boucher C (2004) CATREF software: Combination and analysis of terrestrial reference frames, LAREG Technical Note SP08, Institut Géographique National, Paris, France