analysis of the labour economy - mhlw.go.jp of the analysis of the labour economy 2016 with our...
TRANSCRIPT
Analysis of the Labour Economy
-Realization of a Society Where Everyone Can Play an Active Role andChallenges for Enhancement of Labour Productivity-
〔 Summary 〕
September 2016
Ministry of Health, Labour and Welfare
2016(White Paper on the Labour Economy 2016)

2016(White Paper on the Labour Economy 2016)
Analysis of the Labour Economy
-Realization of a Society Where Everyone Can Play an Active Role andChallenges for Enhancement of Labour Productivity-
〔 Outline 〕
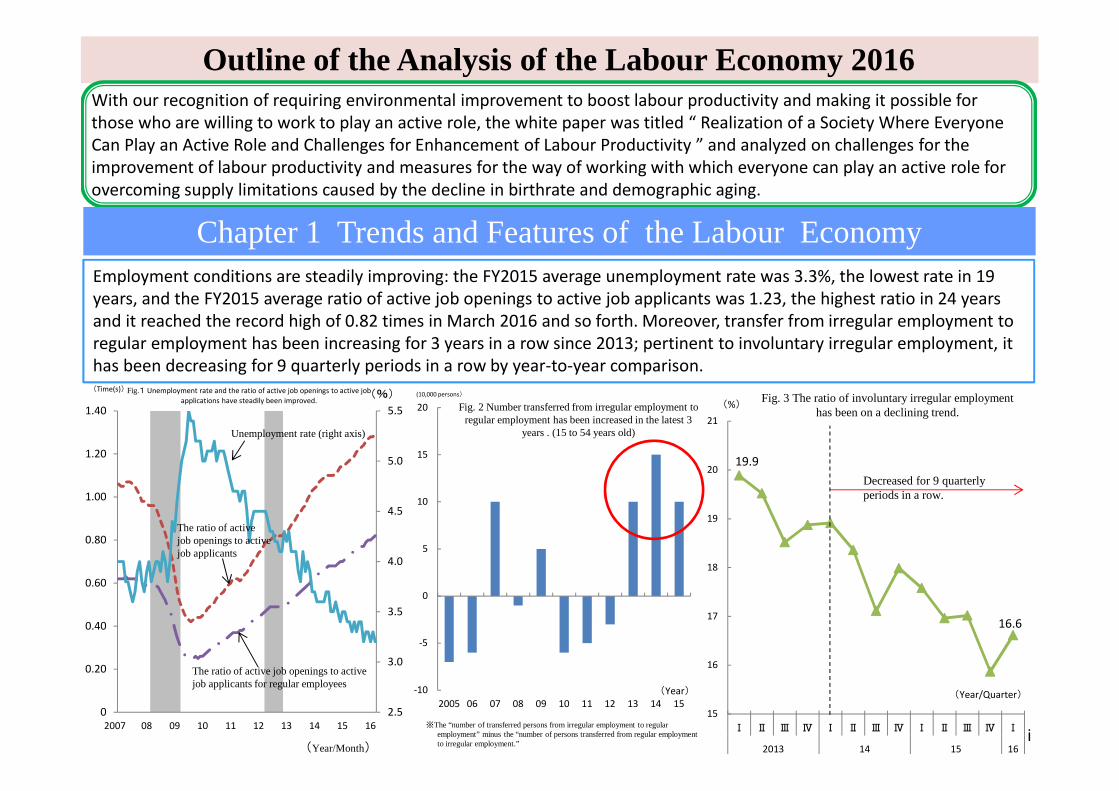
Outline of the Analysis of the Labour Economy 2016With our recognition of requiring environmental improvement to boost labour productivity and making it possible forthose who are willing to work to play an active role, the white paper was titled “ Realization of a Society Where EveryoneCan Play an Active Role and Challenges for Enhancement of Labour Productivity ” and analyzed on challenges for theimprovement of labour productivity and measures for the way of working with which everyone can play an active role forovercoming supply limitations caused by the decline in birthrate and demographic aging.
2.5
3.0
3.5
4.0
4.5
5.0
5.5
0
0.20
0.40
0.60
0.80
1.00
1.20
1.40
2007
08 09 10 11 12 13 14 15 16
Fig.1 Unemployment rate and the ratio of active job openings to active job
applications have steadily been improved.
Unemployment rate (right axis)
The ratio of active job openings to activejob applicants for regular employees
The ratio of activejob openings to activejob applicants
(Time(s))(%)
(Year/Month)
2007
-10
-5
0
5
10
15
20
2005 06 07 08 09 10 11 12 13 14 15(Year)
(10,000 persons)
Fig. 2 Number transferred from irregular employment toregular employment has been increased in the latest 3
years . (15 to 54 years old)
15
16
17
18
19
20
21
Ⅰ Ⅱ Ⅲ Ⅳ Ⅰ Ⅱ Ⅲ Ⅳ Ⅰ Ⅱ Ⅲ Ⅳ Ⅰ
2013 14 15 16
(Year/Quarter)
(%)Fig. 3 The ratio of involuntary irregular employment
has been on a declining trend.
19.9
16.6
Decreased for 9 quarterlyperiods in a row.
※The “number of transferred persons from irregular employment to regularemployment” minus the “number of persons transferred from regular employmentto irregular employment.”
ⅰ
Chapter 1 Trends and Features of the Labour EconomyEmployment conditions are steadily improving: the FY2015 average unemployment rate was 3.3%, the lowest rate in 19years, and the FY2015 average ratio of active job openings to active job applicants was 1.23, the highest ratio in 24 yearsand it reached the record high of 0.82 times in March 2016 and so forth. Moreover, transfer from irregular employment toregular employment has been increasing for 3 years in a row since 2013; pertinent to involuntary irregular employment, ithas been decreasing for 9 quarterly periods in a row by year-to-year comparison.
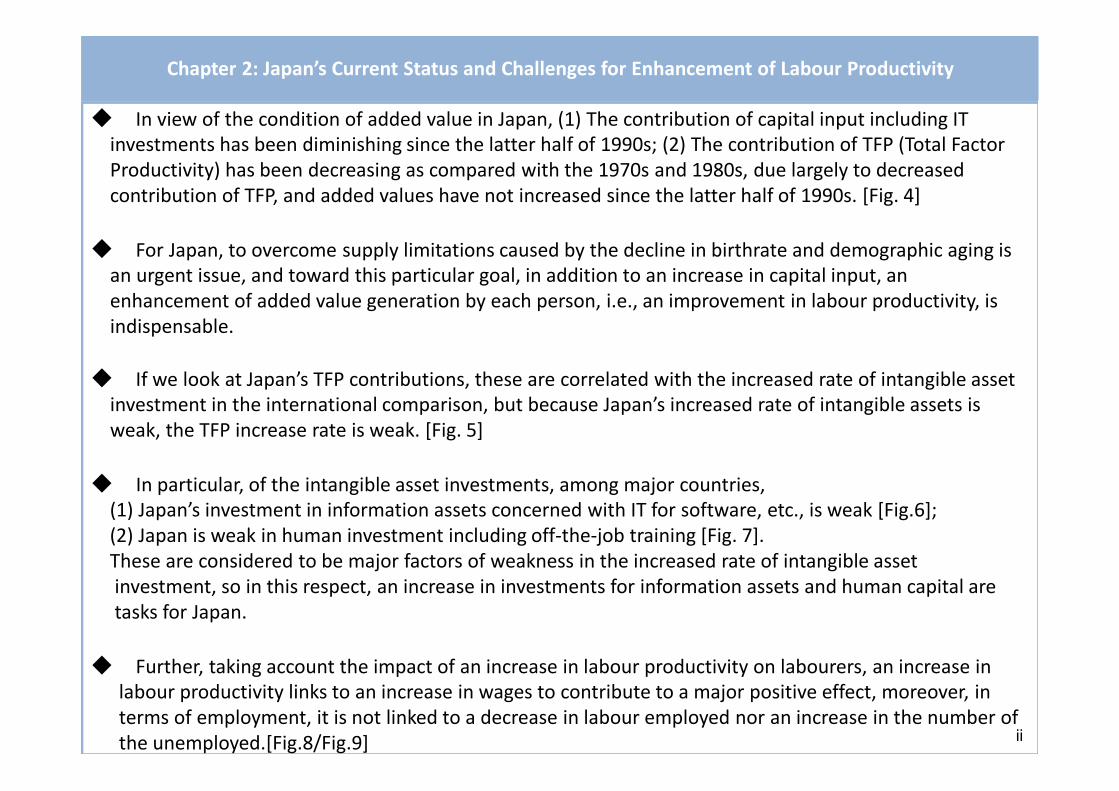
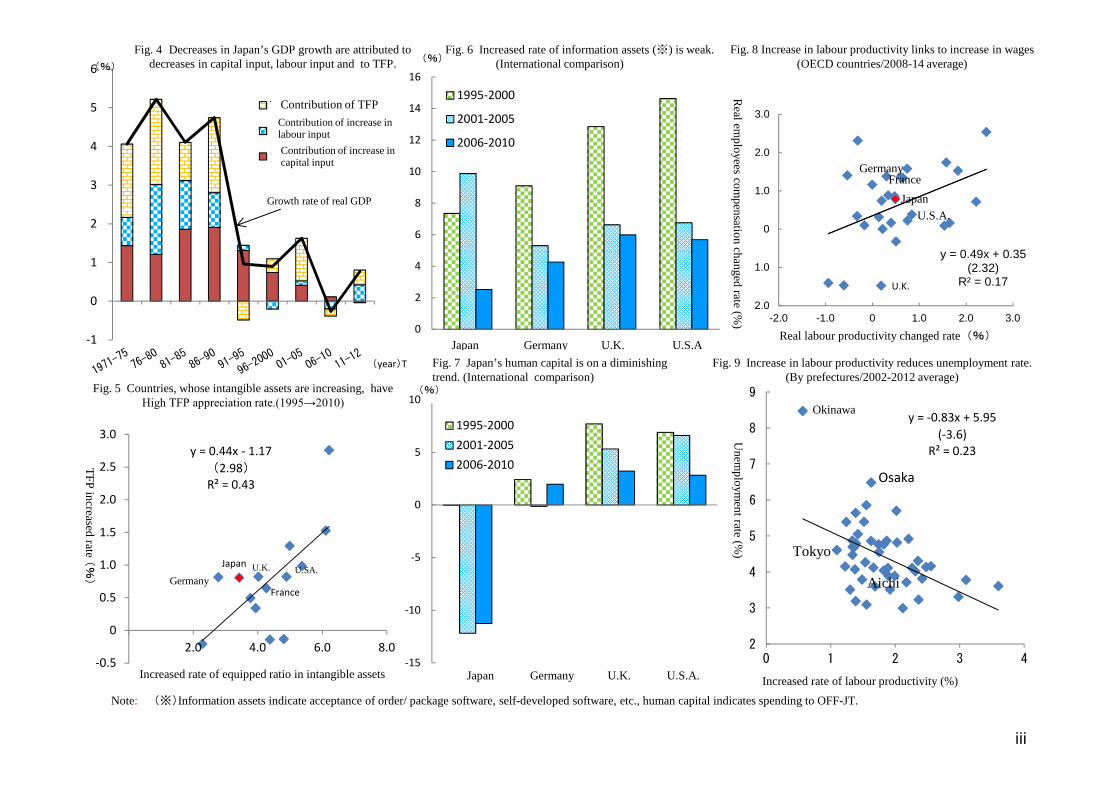
◆ In view of the condition of added value in Japan, (1) The contribution of capital input including ITinvestments has been diminishing since the latter half of 1990s; (2) The contribution of TFP (Total FactorProductivity) has been decreasing as compared with the 1970s and 1980s, due largely to decreasedcontribution of TFP, and added values have not increased since the latter half of 1990s. [Fig. 4]
◆ For Japan, to overcome supply limitations caused by the decline in birthrate and demographic aging isan urgent issue, and toward this particular goal, in addition to an increase in capital input, anenhancement of added value generation by each person, i.e., an improvement in labour productivity, isindispensable.
◆ If we look at Japan’s TFP contributions, these are correlated with the increased rate of intangible assetinvestment in the international comparison, but because Japan’s increased rate of intangible assets isweak, the TFP increase rate is weak. [Fig. 5]
◆ In particular, of the intangible asset investments, among major countries,(1) Japan’s investment in information assets concerned with IT for software, etc., is weak [Fig.6];(2) Japan is weak in human investment including off-the-job training [Fig. 7].These are considered to be major factors of weakness in the increased rate of intangible assetinvestment, so in this respect, an increase in investments for information assets and human capital aretasks for Japan.
◆ Further, taking account the impact of an increase in labour productivity on labourers, an increase inlabour productivity links to an increase in wages to contribute to a major positive effect, moreover, interms of employment, it is not linked to a decrease in labour employed nor an increase in the number ofthe unemployed.[Fig.8/Fig.9]
Chapter 2: Japan’s Current Status and Challenges for Enhancement of Labour Productivity
ⅱ
-15
-10
-5
0
5
10
日本 ドイツ 英国 米国
1995-2000
2001-2005
2006-2010
Japan Germany U.K. U.S.A.
図7 我が国の人的資本(※)は減少傾向(国際比較)
Fig. 5 Countries, whose intangible assets are increasing, haveHigh TFP appreciation rate.(1995→2010)
y = 0.44x - 1.17
(2.98)R² = 0.43
-0.5
0
0.5
1.0
1.5
2.0
2.5
3.0
2.0 4.0 6.0 8.0
無形資産装備率の上昇率(%)
Germany
Increased rate of equipped ratio in intangible assets
France
y = -0.83x + 5.95
(-3.6)R² = 0.23
2
3
4
5
6
7
8
9
0 1 2 3 4
Un
emp
loym
ent
rate(%
)
Increased rate of labour productivity (%)
Osaka
Okinawa
Aichi
Tokyo
0
2
4
6
8
10
12
14
16
日本 ドイツ 英国 米国
1995-2000
2001-2005
2006-2010
(%)Fig. 6 Increased rate of information assets (※) is weak.
(International comparison)
-1
0
1
2
3
4
5
6
TFPの寄与
労働投入増加の寄与
資本投入増加の寄与
(%)
(year)T
Contribution of TFP
Contribution of increase inlabour input
Contribution of increase incapital input
Growth rate of real GDP
y = 0.49x + 0.35(2.32)
R² = 0.17
-2.0
-1.0
0
1.0
2.0
3.0
-2.0 -1.0 0 1.0 2.0 3.0
Real labour productivity changed rate(%)
Real
emp
loyees
com
pen
sation
chan
gedrate
(%)
Japan
U.S.A.
U.K.
Fig. 8 Increase in labour productivity links to increase in wages(OECD countries/2008-14 average)
Fig. 9 Increase in labour productivity reduces unemployment rate.(By prefectures/2002-2012 average)
Fig. 4 Decreases in Japan’s GDP growth are attributed todecreases in capital input, labour input and to TFP.
Note: (※)Information assets indicate acceptance of order/ package software, self-developed software, etc., human capital indicates spending to OFF-JT.
TF
Pin
creasedrate
(%) U.SA.U.K.
Japan Germany U.K. U.S.A
Fig. 7 Japan’s human capital is on a diminishingtrend. (International comparison)
GermanyFrance
Japan
ⅲ
(%)
Chapter 3: Toward for a Society where everyone can play an active rolein the face of Population Decline
【Environmental improvement for the Elderly on How to Work and Play an Active Role】
◆ Although a decrease in population is expected in Japan in the future, in view of the elderly, an increase in
population is expected. In the elderly, while numbers of persons employed are slightly increasing, there are still
plenty of elderly people who have not yet been employed irrespective of their willingness to work. In this regard,
environmental improvements enabling them to select a variety of working ways is necessary.【Fig.10/Fig.11】
◆ As an alternative for work, “starting a business” is also considered in addition to employment. Those aged 60 or
older who wish to start a business are increasing. Taking account of the elderly’s experiences cultivated during
their long career, support for starting a business for them as a venue to play an active role is necessary.【Fig.12】
【Challenges of companies/Labourers aiming to Play an Active Role for Limited Human Resources】
◆ While the employment situation is improving, the decline birthrate and demographic aging are continuing to
develop, and labour shortages are emerging. Amid the labour shortages, finite human resources exert abilities
obtained by their experiences, and it is significant to establish a society, in which everyone can actively participate.
◆ Companies are faced with situations offers of work result in no applicants, or no applicants are found suitable
for the work. Reexamining the consolidation of support for the enhancement of applicant qualifications, wage
levels, treatment/labour conditions, proposing better job recruitments and endeavoring to secure human resources
are crucial. 【Fig. 13】
ⅳ

9601,104
1,267
284
250
313
0
200
400
600
800
1,000
1,200
1,400
1,600
1,800
02 07 12
(10,000 persons)
(年)
Fig.11 In addition to occupied population of 60 years or older, considerablenumber of wishing to work exist, it tends to be increasing.
有業者数 就業希望者
就業希望者(+29)
Number of occupied
population
Wishing to work
Wishing to work
2002
43.2
34.8
5.9
16.1
0
20
40
募集しても、応募がない
応募はあるが、応募者の資
質が自社の求める水準に
満たない
応募はあるが、求職者が
求める処遇・労働条件と
自社の提示内容が
折り合わない
応募があり採用もしている
が、早期に離職してしまう
(%)
Insp
iteo
fo
ffering
job
recruitm
ent.,
no
app
lication
emerges
Fig. 13 There are many companies which do not reach the acceptance even thoughreceiving applicants for recruitment. (2016)
Mismatch in thephase of application
0
2
4
6
8
10
12
14
16
18
20
2002 07 12 (Year)
Fig. 12 Of those who are 60 years or older, personsto wish to found a company have increased.
(10,000 persons)
10.7
14.5
17.3
Fig. 10 While the population of less than 60 years of agesdecreases, 60 years or older population increases (※)
(※) Numerical values in 2020 are from “Japan’s future estimated population”prepared by the National Institute of Population and Social SecurityResearch. (Estimated in January 2012.)
4104
4346
8648
8064
0
8,000
8,200
8,400
8,600
8,800
0
3,800
4,000
4,200
4,400
4,600
2012 15 20 (Year)
Less than 60 years of ages(right axis)(-583)
6o years or older(+243)
(10,000 persons) ( 10,000 persons )
ⅴ
Desp
iteth
ereis
anap
plicatio
n,
the
qu
alification
of
the
app
licant
cann
ot
be
satisfiedth
elevel
the
com
pan
yreq
uires
Desp
iteth
ereare
app
lication
s,treatm
ent/w
ork
con
ditio
ns
requ
iredb
yap
plican
tsan
dco
mp
any’s
presen
tedco
nten
td
oes
no
tb
eco
nfo
rmed
Desp
iteth
ereare
app
lication
san
dcarry
ou
trecru
its,th
eyleave
ajo
bso
on
(Year)
2016(White Paper on the Labour Economy 2016)
Analysis of Labour Economy
-Realization of a Society Where Everyone Can Play an Active Role andChallenge for Enhancement of Labour Productivity-
〔 Overview 〕
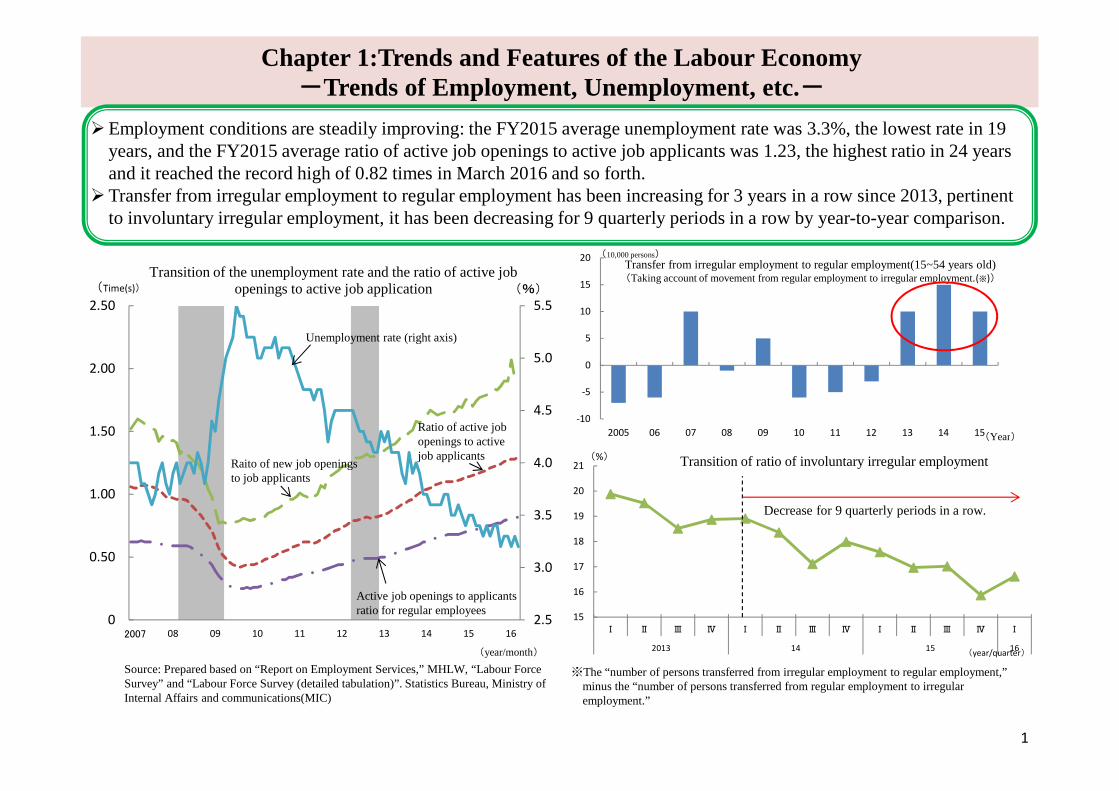
Employment conditions are steadily improving: the FY2015 average unemployment rate was 3.3%, the lowest rate in 19years, and the FY2015 average ratio of active job openings to active job applicants was 1.23, the highest ratio in 24 yearsand it reached the record high of 0.82 times in March 2016 and so forth.
Transfer from irregular employment to regular employment has been increasing for 3 years in a row since 2013, pertinentto involuntary irregular employment, it has been decreasing for 9 quarterly periods in a row by year-to-year comparison.
Chapter 1:Trends and Features of the Labour Economy-Trends of Employment, Unemployment, etc.-
2.5
3.0
3.5
4.0
4.5
5.0
5.5
0
0.50
1.00
1.50
2.00
2.50
2007
08 09 10 11 12 13 14 15 16
Transition of the unemployment rate and the ratio of active jobopenings to active job application
Unemployment rate (right axis)
Raito of new job openingsto job applicants
Active job openings to applicantsratio for regular employees
Ratio of active jobopenings to activejob applicants
(Time(s)) (%)
(year/month)
2007
Source: Prepared based on “Report on Employment Services,” MHLW, “Labour ForceSurvey” and “Labour Force Survey (detailed tabulation)”. Statistics Bureau, Ministry ofInternal Affairs and communications(MIC)
-10
-5
0
5
10
15
20
2005 06 07 08 09 10 11 12 13 14 15(Year)
(10,000 persons)Transfer from irregular employment to regular employment(15~54 years old)(Taking account of movement from regular employment to irregular employment.(※))
※The “number of persons transferred from irregular employment to regular employment,”minus the “number of persons transferred from regular employment to irregularemployment.”
15
16
17
18
19
20
21
Ⅰ Ⅱ Ⅲ Ⅳ Ⅰ Ⅱ Ⅲ Ⅳ Ⅰ Ⅱ Ⅲ Ⅳ Ⅰ
2013 14 15 16(year/quarter)
(%) Transition of ratio of involuntary irregular employment
Decrease for 9 quarterly periods in a row.
1
Chapter 1: Trends and Features of Labour Economy-Trends of wages-
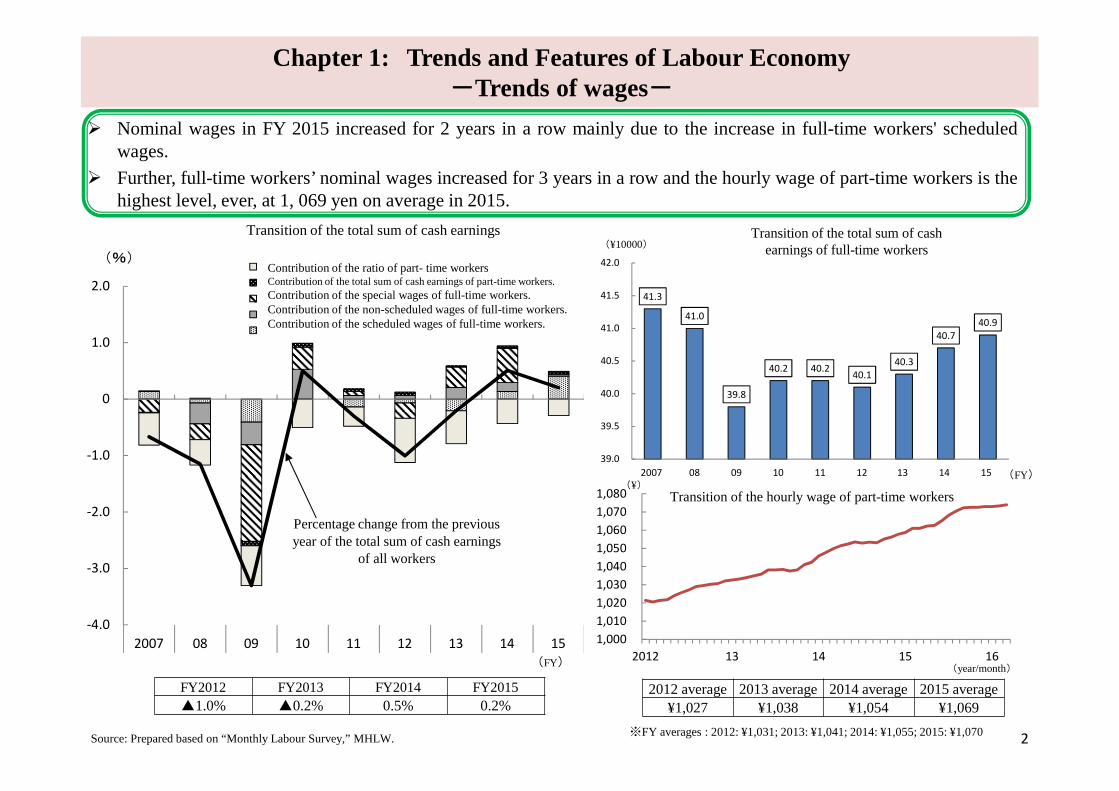
Nominal wages in FY 2015 increased for 2 years in a row mainly due to the increase in full-time workers' scheduledwages.
Further, full-time workers’ nominal wages increased for 3 years in a row and the hourly wage of part-time workers is thehighest level, ever, at 1, 069 yen on average in 2015.
-4.0
-3.0
-2.0
-1.0
0
1.0
2.0
2007 08 09 10 11 12 13 14 15
Transition of the total sum of cash earnings
パートタイム労働者比率の寄与パートタイム労働者の現金給与総額の寄与一般労働者の特別給与の寄与一般労働者の所定外給与の寄与一般労働者の所定内給与の寄与
(%)
Percentage change from the previousyear of the total sum of cash earnings
of all workers
(FY)
Contribution of the ratio of part- time workersContribution of the total sum of cash earnings of part-time workers.
Contribution of the special wages of full-time workers.Contribution of the non-scheduled wages of full-time workers.Contribution of the scheduled wages of full-time workers.
41.3
41.0
39.8
40.2 40.240.1
40.3
40.740.9
39.0
39.5
40.0
40.5
41.0
41.5
42.0
2007 08 09 10 11 12 13 14 15
1,000
1,010
1,020
1,030
1,040
1,050
1,060
1,070
1,080
2012 13 14 15 16
Transition of the hourly wage of part-time workers(¥)
(year/month)
Transition of the total sum of cashearnings of full-time workers(¥10000)
(FY)
Source: Prepared based on “Monthly Labour Survey,” MHLW.※FY averages : 2012: ¥1,031; 2013: ¥1,041; 2014: ¥1,055; 2015: ¥1,070
2012 average 2013 average 2014 average 2015 average
¥1,027 ¥1,038 ¥1,054 ¥1,069
FY2012 FY2013 FY2014 FY2015
▲1.0% ▲0.2% 0.5% 0.2%
2
Chapter 2: Japan’s Current Status and Challenges for Enhancement of Labour Productivity
– Current Status of Labour Productivity in Japan (1) –
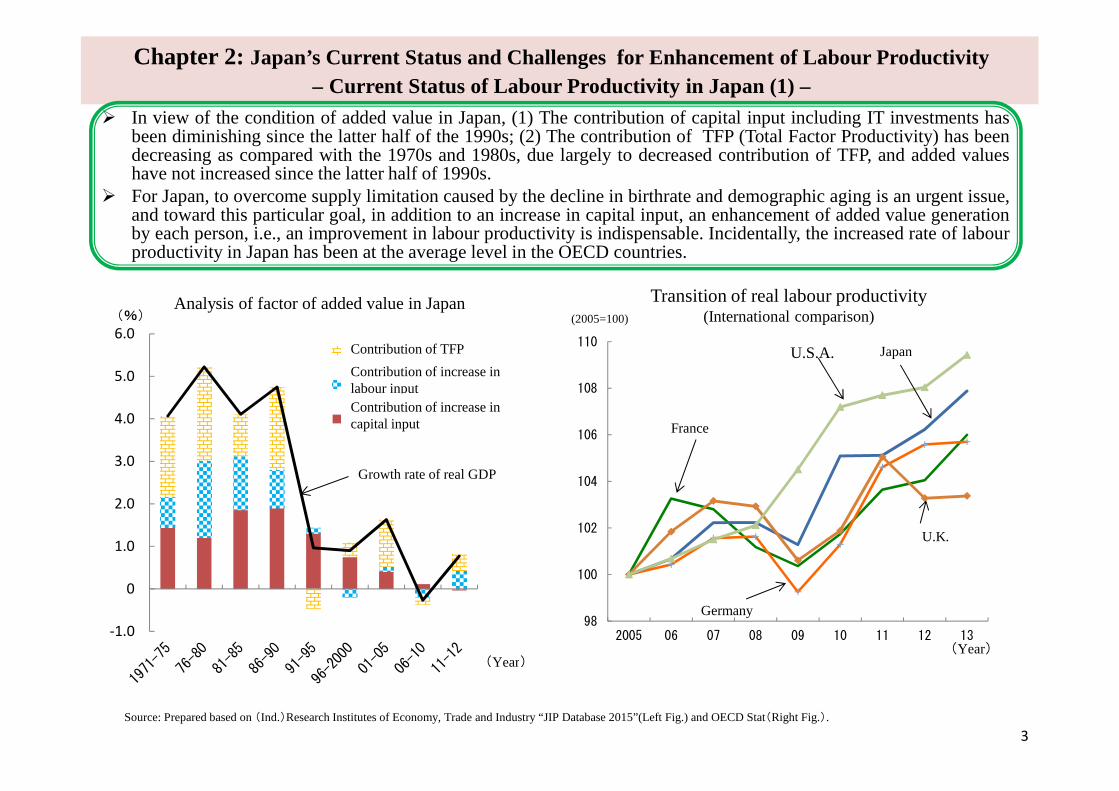
In view of the condition of added value in Japan, (1) The contribution of capital input including IT investments hasbeen diminishing since the latter half of the 1990s; (2) The contribution of TFP (Total Factor Productivity) has beendecreasing as compared with the 1970s and 1980s, due largely to decreased contribution of TFP, and added valueshave not increased since the latter half of 1990s.
For Japan, to overcome supply limitation caused by the decline in birthrate and demographic aging is an urgent issue,and toward this particular goal, in addition to an increase in capital input, an enhancement of added value generationby each person, i.e., an improvement in labour productivity is indispensable. Incidentally, the increased rate of labourproductivity in Japan has been at the average level in the OECD countries.
98
100
102
104
106
108
110
2005 06 07 08 09 10 11 12 13
France
Japan
U.K.
(2005年=100)
U.S.A.
Germany
Transition of real labour productivity(International comparison)
3
-1.0
0
1.0
2.0
3.0
4.0
5.0
6.0TFPの寄与
労働投入増加の寄与
資本投入増加の寄与
(%)
(Year)
実質GDP成長率
Contribution of TFP
Contribution of increase inlabour input
Contribution of increase incapital input
Growth rate of real GDP
Source: Prepared based on (Ind.)Research Institutes of Economy, Trade and Industry “JIP Database 2015”(Left Fig.) and OECD Stat(Right Fig.).
Analysis of factor of added value in Japan(2005=100)
(Year)

90
100
110
120
130
2000 01 02 03 04 05 06 07 08 09
France Japan U.K.
U.S.A.
(2000=100)
(Year)
Germany -30%
-20%
-10%
0%
10%
20%
30%
40%
日本
米国
英国
ドイツ
フランス
付加価値
デフレーター労働投入
実質労働生産性の変化率
Labour input
4
-10%
0%
10%
20%
30%
40%
日本
米国
英国
ドイツ
フランス
Deflator
Labour input
Changed rate of real labour productivity
Japan
Added value
Chapter 2 Japan’s Current Status and Challenges for Enhancement of Labour Productivity-Current Status of Labour Productivity in Japan (2)-
When looking at the trends of labour productivity by industry, the increased rate of real labour productivity in the manufacturing industry inJapan is comparable to major countries. Meanwhile, although the increased rate of labour productivity in the eating and drinking servicesindustry is the highest in major countries, its level is the lowest.
When conducting analysis of factors, the added value factor is weak in both the manufacturing and the eating and drinking servicesindustries. Factors of increase in labour productivity are due to decreases in the deflating factor in the manufacturing industry and todecreases in labour input in the eating and drinking service industry.
In order for Japan’s labour productivity to be increased even further, an increase in added value is required.
Source: Prepared based on EU KLEMS Database.
Analysis of factor of real labour productivity in manufacturing industryTransition of real labour productivity in manufacturing industry
90
100
110
120
130
140
150
160
170
2000 01 02 03 04 05 06 07 08 09
France Germany
(2000=100)
(Year)
U.S.A.
Japan
U.K.
Transition of real labour productivity in eating and drinking service industry
(%)
(%)
13
Japan
Deflator
U.S
.A.
U.K
.
Germ
any
Fran
ceF
rance
Germ
any
U.K
.
U.S
.A.
Analysis of factor of real labour productivity in eating and drinking services industry
Added valueChanged rate of reallabour productivity

Chapter 2: Japan’s Current State and Challenges for Enhancement of Labour Productivity--Current State of Labour Productivity in Japan (3) -
If we look at Japan’s TFP contributions, these are correlated with an increased rate of intangible asset investment in theinternational comparison, but because Japan’s increased rate of intangible assets is weak, the TFP increase rate is weak.
In particular, of the intangible assets investments, among major countries, (1) Japan’s investments in information assetsconcerned with IT for software, etc., is weak, (2) Japan is weak in human investments including off-the-job training.These are considered to be major factors of weakness in the increased rate of intangible asset investment.
Relations between intangible assets and TFP
Source: Prepared based on (Ind.)Research Institute of Economy, Trade and Industry “JIP Database 2013”, INTAN-Invest, Corrado. Haskel, Jona-Lasinio, Iommi (2012)“Intangible Capital and Growth in Advanced Economies”, Miyagawa/Hisa (2013) “Intangible asset investment by industry and Japan’s economic growth” , EU KLEMS database.Note : (1)TFP (Total Factor Productivity) is comprehended as a part (residual error) incapable of measuring by an increase in input by production factors such as capital/labourand understood that it reflects innovation and management efficiency. (2)Intangible assets are classified into (a) “Information Assets” like software, etc., (b) “InnovativeProperty” of R&D, etc., (c) “Economic Competences” like investments in brand equity/organizational structure and human capital.
y = 0.44x - 1.17
(2.98)R² = 0.43
-0.5
0
0.5
1.0
1.5
2.0
2.5
3.0
1.00 2.00 3.00 4.00 5.00 6.00 7.00
T
F
P
上昇率(%)
0
5
10
15
20
日本 ドイツ 英国 米国
1995-2000
2001-2005
2006-2010
(%) International comparison of the increased rate of information assets
-15
-10
-5
0
5
10
日本 ドイツ 英国 米国
1995-2000
2001-2005
2006-2010
(%)人的資本の上昇率の国際比較
5
Japan
Japan Germany U.K. U.S.A.
Germany U.K. U.S.A.
International comparison of the increased rate of human capital
Germany Japan U.K.
France.
U.S.A.
Increased rate of equipped ratio in intangible assets
TF
Pin
creasedrate
(%)

Chapter 2: Japan’s Current Status and Challenges for Enhancement of Labour Productivity-Fruits of an Increase in Labour Productivity from the Perspective of Wages/Employment (1)-
When looking at the relationship between labour productivity and wages with international points of view, as real labourproductivity increases, the relationship in which real employees’ compensation increases can be seen.
When looking at the relationship between labour productivity and the unemployment rate by prefectures in Japan, aninverse correlation is recognized between an increase in labour productivity and unemployment rates, and therelationship of if labour productivity increases, the number of the unemployed increases cannot be seen.
Relations between labour productivity and wages in OECD countries(2008-2014 average)
Source: Prepared based on OECD.Stat(Left Fig.),“Basic Statistical Survey on Employment Structure”, Statistics Bureau(MIC), “Prefectural Accounts,” Cabinet Office(Right Fig.), "Monthly Labour Survey (regional)," MHLW(Right Fig.)
y = 0.50x + 0.35
(2.32)
R² = 0.17
-2.0
-1.0
0
1.0
2.0
3.0
-2.0 -1.0 0 1.0 2.0 3.0Real labour productivity changed rate (%)
Real
emp
loyees’
com
pen
sation
chan
gedrate
(%)
y = -0.83x + 5.95
(-3.6)
R² = 0.23
2.0
3.0
4.0
5.0
6.0
7.0
8.0
9.0
0 0.5 1.0 1.5 2.0 2.5 3.0 3.5 4.0
失業率(%)
Relations between labour productivity and unemployment byprefectures in Japan
(Fiscal 2002 – 2015 average)
Unem
plo
yment
rate
Okinawa
Osaka
Aichi
Tokyo
GermanyFrance
Japan
U.S.A.
U.S.A.
Increased rate of labour productivity (%)
6
50
60
70
80
90
40 50 60 70 80 90
Co
mp
anies’
imp
lemen
tation
ratioo
fO
FF
-JT(R
egular
emp
loyees)
(%)
Companies’ implementation ratio of OJT (Regular employees) (%)
卸売業
Retail trade
Eating and drinking services
Living-related and personal services,amusement services
情報通信業
Wholesaletrade
Manufacturing
Scientific reserch, proffessionaland technical services
Information andcommunications
70
80
90
100
110
120
50 60 70 80 90
Retail trade
飲食サービス業
Information andcommunications
Degree
ofcom
pan
ies’p
ositiveen
gagemen
tin
develop
men
tof
labou
rers’ab
ility(regu
larem
ployees)
Manufacturing
Eating and drinkingservices
Living-related andpersonal services,amusementservices
Scientific reserch, proffessionaland technical services
Chapter 2: Japan’s Current State and Challenges for Enhancement of Labour Productivity― Japan’s Challenges and Policies Aiming for an Increase in Labour Productivity(1) ―
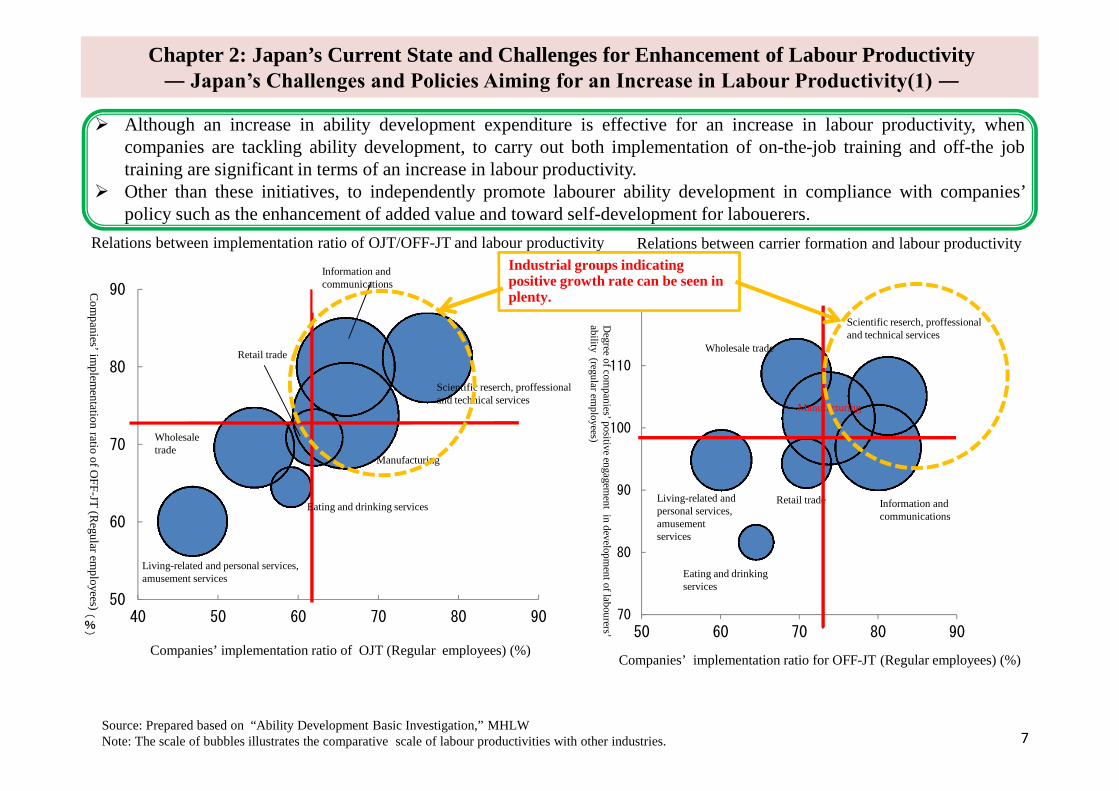
Although an increase in ability development expenditure is effective for an increase in labour productivity, whencompanies are tackling ability development, to carry out both implementation of on-the-job training and off-the jobtraining are significant in terms of an increase in labour productivity.
Other than these initiatives, to independently promote labourer ability development in compliance with companies’policy such as the enhancement of added value and toward self-development for labouerers.
Source: Prepared based on “Ability Development Basic Investigation,” MHLWNote: The scale of bubbles illustrates the comparative scale of labour productivities with other industries.
Relations between implementation ratio of OJT/OFF-JT and labour productivity Relations between carrier formation and labour productivity
Industrial groups indicatingpositive growth rate can be seen inplenty.
Wholesale trade
Companies’ implementation ratio for OFF-JT (Regular employees) (%)
7
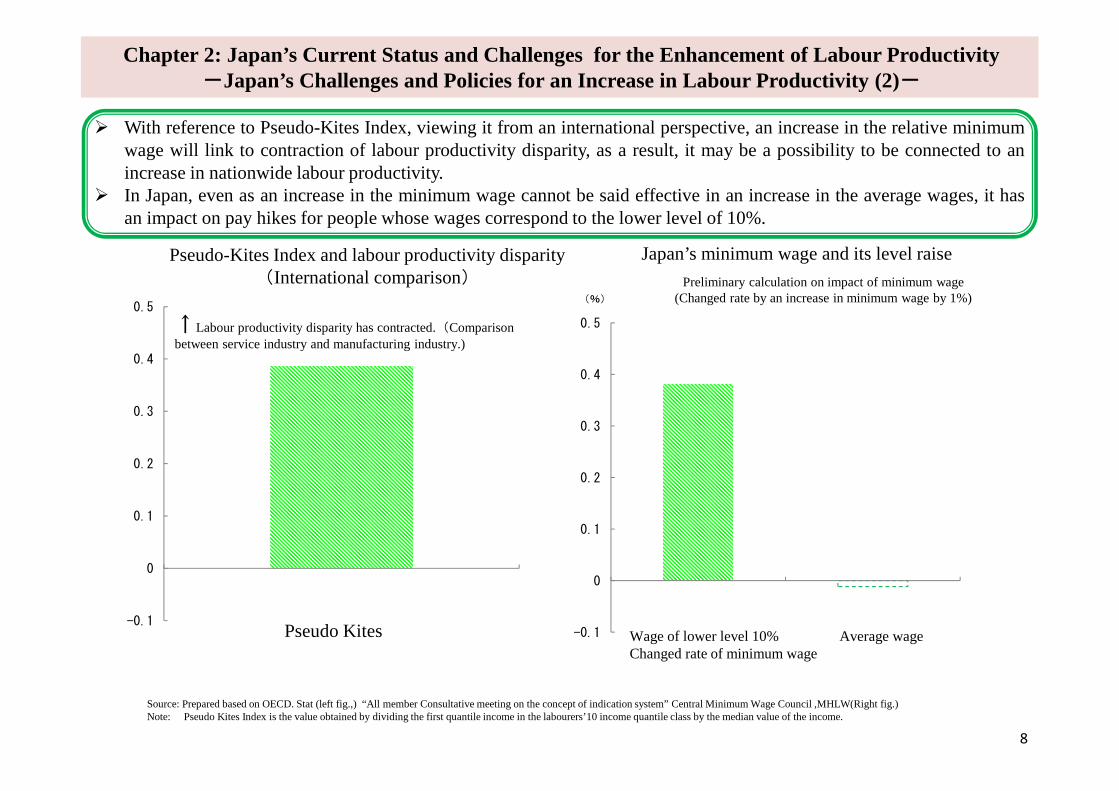
With reference to Pseudo-Kites Index, viewing it from an international perspective, an increase in the relative minimumwage will link to contraction of labour productivity disparity, as a result, it may be a possibility to be connected to anincrease in nationwide labour productivity.
In Japan, even as an increase in the minimum wage cannot be said effective in an increase in the average wages, it hasan impact on pay hikes for people whose wages correspond to the lower level of 10%.
Chapter 2: Japan’s Current Status and Challenges for the Enhancement of Labour Productivity-Japan’s Challenges and Policies for an Increase in Labour Productivity (2)-
Pseudo-Kites Index and labour productivity disparity(International comparison)
Japan’s minimum wage and its level raise
-0.1
0
0.1
0.2
0.3
0.4
0.5
下位10%賃金 平均賃金
(%)
Preliminary calculation on impact of minimum wage(Changed rate by an increase in minimum wage by 1%)
Wage of lower level 10% Average wageChanged rate of minimum wage
8
-0.1
0
0.1
0.2
0.3
0.4
0.5
疑似カイツ
↑Labour productivity disparity has contracted.(Comparisonbetween service industry and manufacturing industry.)
Pseudo Kites
Source: Prepared based on OECD. Stat (left fig.,) “All member Consultative meeting on the concept of indication system” Central Minimum Wage Council ,MHLW(Right fig.)Note: Pseudo Kites Index is the value obtained by dividing the first quantile income in the labourers’10 income quantile class by the median value of the income.
-0.5
0
0.5
1.0
1.5
2.0
2.5
3.0
3.5
4.0
1981-85 86-90 91-95 96-2000 01-05 06-10
デニソン効果
ボーモル効果
純生産性要因
(%)
(Year)
Labourproductivity
increased rate
0
0.025
0.030
0.035
0.040
0.045
0.050
リリエン指標
Under average Average – 20% 20% or greater
Hours spent for learning and practices
Chapter 2 Japan’s Current Status and Challenges for the Enhancement of Labour Productivity―Japan’s Challenges and Policies for an Increase in Labour Productivity (3)-
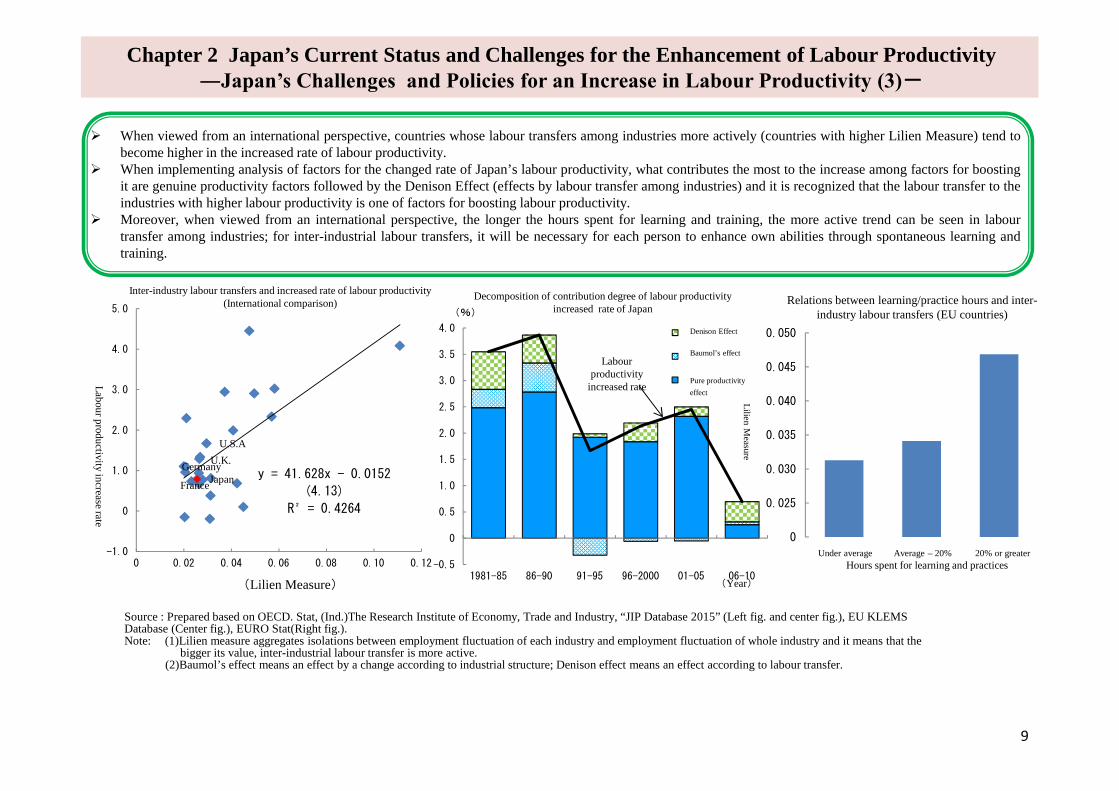
When viewed from an international perspective, countries whose labour transfers among industries more actively (countries with higher Lilien Measure) tend tobecome higher in the increased rate of labour productivity.
When implementing analysis of factors for the changed rate of Japan’s labour productivity, what contributes the most to the increase among factors for boostingit are genuine productivity factors followed by the Denison Effect (effects by labour transfer among industries) and it is recognized that the labour transfer to theindustries with higher labour productivity is one of factors for boosting labour productivity.
Moreover, when viewed from an international perspective, the longer the hours spent for learning and training, the more active trend can be seen in labourtransfer among industries; for inter-industrial labour transfers, it will be necessary for each person to enhance own abilities through spontaneous learning andtraining.
Decomposition of contribution degree of labour productivityincreased rate of Japan
Relations between learning/practice hours and inter-industry labour transfers (EU countries)
9
France
GermanyJapan
U.K.
U.S.A
y = 41.628x - 0.0152
(4.13)
R² = 0.4264
-1.0
0
1.0
2.0
3.0
4.0
5.0
0 0.02 0.04 0.06 0.08 0.10 0.12
(Lilien Measure)
Inter-industry labour transfers and increased rate of labour productivity(International comparison)
Denison Effect
Baumol’s effect
Pure productivity
effect
Lab
our
prod
uctivity
increase
rate
Lilien
Measure
Source : Prepared based on OECD. Stat, (Ind.)The Research Institute of Economy, Trade and Industry, “JIP Database 2015” (Left fig. and center fig.), EU KLEMSDatabase (Center fig.), EURO Stat(Right fig.).Note: (1)Lilien measure aggregates isolations between employment fluctuation of each industry and employment fluctuation of whole industry and it means that the
bigger its value, inter-industrial labour transfer is more active.(2)Baumol’s effect means an effect by a change according to industrial structure; Denison effect means an effect according to labour transfer.

Chapter 3: Toward a Society Where Everyone can Play an Active Role in the face of Population decline-Japan’s Situation Where Active Roles of Workers are sought-
Although a decrease in the labour force population is expected, when looking into potential labour force*, there are 4.13million population who wish to work and 2.22 million unemployed.
In terms of a certain number of existence of those who have not yet been employed due to incongruous content of work,duty hours, wage, etc., from their requests, provision of working alternatives by configuration of a variety of workinghours, and attempting the enhancement of matching functions by transparency of jobsite information, are essential.
Source : Prepared based on “Labour force survey (detailed tabulation)(2015)”, Statistic Bureau (MIC)
* Those who are considered as wage-earners regardless of not reaching to be employed. Within non-labour force population, “Wishing to work” and the“Unemployed” are considered.
112 134
301
88
0
100
200
300
400
就業希望者 完全失業者
Potential labour force (by gender)(10,000 persons)
Males Females
Wishing to work
121
23 18
51
524
95
21
6685
0
20
40
60
80
100
120
140
適当な仕事が
ありそうにない
近くに仕事が
ありそうにない
自分の知識・能力
にあう仕事が
ありそうにない
勤務時間・賃金などが
希望にあう仕事が
ありそうにない
今の景気や季節では
仕事がありそうに
ない
適当な仕事が
ありそうにないのうち
その他
出産・育児のため
介護・看護のため
健康上の理由のため
その他
Non-job seeking reasons of non-labour force populationswho wish to work
(10,000 persons)
Breakdown of “There seems no appropriate jobs”(1,210,000 persons)
Oth
ers
There
seems
nojobs
inview
ofcurrent
economy
17 26 3218
60
16
49
0
10
20
30
40
50
60
70
80
賃金・
給料が
希望とあわない
勤務時間・休日
などが希望と
あわない
求人の年齢と
自分の年齢とが
あわない
自分の技術や
技能が求人要件に
満たない
希望する種類・
内容の仕事が
ない
条件にこだわら
ないが仕事が
ない
その他
Number of the unemployed by reason why unemployed
Job recruitment is incongruous with job application(1,530,000persons)
(10,000 persons)D
uty
hou
rs,holid
ays,etc.,d
on
otsatisfy
requ
est
Th
eage
ofrecru
itmen
tan
dow
nage
do
not
fit
Th
ereis
no
jobs
tosu
itow
nreq
uirem
ent
Th
ereis
no
jobs,even
regardles
ofcon
dition
s
Oth
ers
Ow
ntech
niq
uean
dsk
illd
on
otsatisfy
recruitm
ent
requ
iremen
ts
10
Unemployed
There
seems
nojobs
.inco
nform
ityw
ithone’s
knowledge,
ability
There
seems
nojobs
whose
dutyhours,
wage,
etc.,conform
torequest
There
seems
nojobs
inthe
vicinity
There
seems
noappropriate
jobs
There
seems
noappro
priatejobs,
others
Du
eto
health
con
ditio
n
Du
eto
child
birth
and
care
Du
eto
caring
and
nu
rsing
care
Wage/salary
do
not
satisfyreq
uest
11
9601,104
1,267
284
250
313
0
200
400
600
800
1,000
1,200
1,400
1,600
1,800
02 07 12(Year)
60歳以上の有業者と就業希望者
有業者数 就業希望者
就業希望者(+29)
(10,000 persons)
2002
Chapter 3: Toward a Society Where Everyone can Play an Active Role in the face of Population decline― Environmental Improvement for the Elderly on How to Work and Play Active Roles (1)-
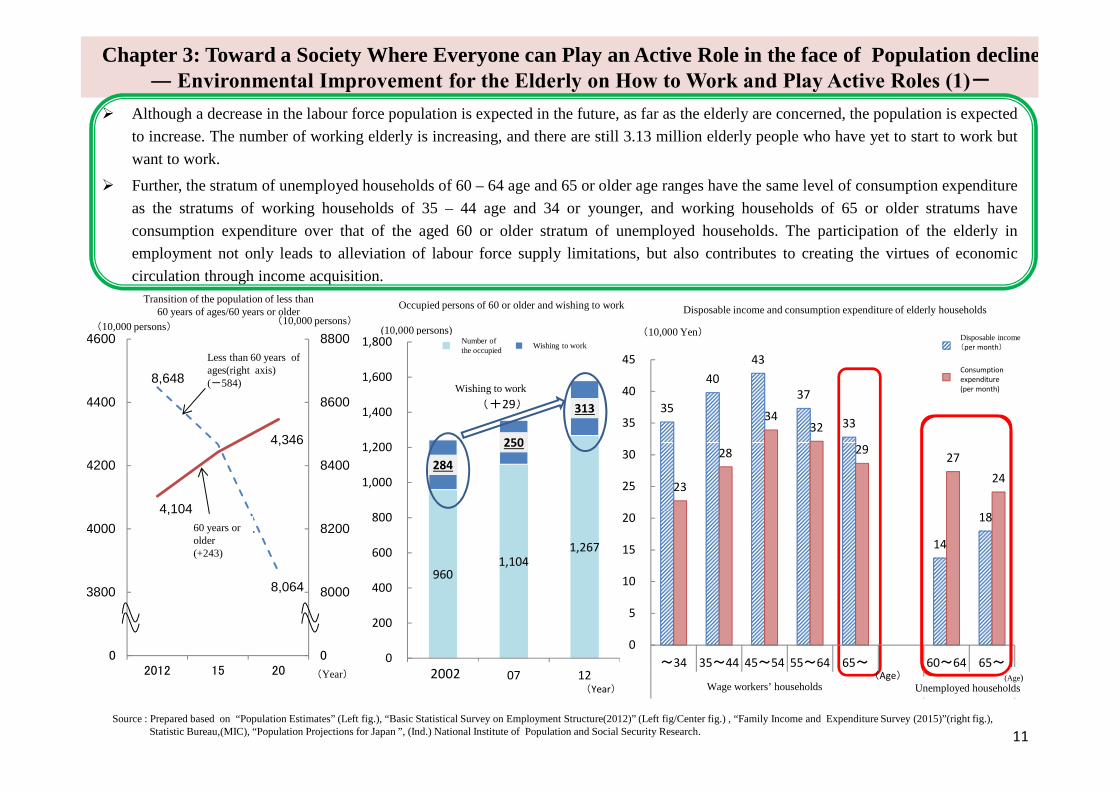
Although a decrease in the labour force population is expected in the future, as far as the elderly are concerned, the population is expected
to increase. The number of working elderly is increasing, and there are still 3.13 million elderly people who have yet to start to work but
want to work.
Further, the stratum of unemployed households of 60 – 64 age and 65 or older age ranges have the same level of consumption expenditure
as the stratums of working households of 35 – 44 age and 34 or younger, and working households of 65 or older stratums have
consumption expenditure over that of the aged 60 or older stratum of unemployed households. The participation of the elderly in
employment not only leads to alleviation of labour force supply limitations, but also contributes to creating the virtues of economic
circulation through income acquisition.
資料
4,104
4,346
8,648
8,064
0
8000
8200
8400
8600
8800
0
3800
4000
4200
4400
4600
2012 15 20 (Year)
60歳以上(+243)
(10,000 persons)(10,000 persons)
35
40
43
37
33
14
18
23
28
3432
2927
24
0
5
10
15
20
25
30
35
40
45
~34 35~44 45~54 55~64 65~ 60~64 65~
勤労者世帯 無職世帯
可処分所得
消費支出
(10,000 Yen)
(歳)
高年齢者世帯の可処分所得と消費支出
(Age)Unemployed households
(Age)
Disposable income(per month)
Transition of the population of less than60 years of ages/60 years or older
Occupied persons of 60 or older and wishing to work Disposable income and consumption expenditure of elderly households
Number ofthe occupied
Less than 60 years ofages(right axis)(-584)
60 years orolder(+243)
Wishing to work
Wishing to work
Wage workers’ households
Consumptionexpenditure(per month)
Source : Prepared based on “Population Estimates” (Left fig.), “Basic Statistical Survey on Employment Structure(2012)” (Left fig/Center fig.) , “Family Income and Expenditure Survey (2015)”(right fig.),Statistic Bureau,(MIC), “Population Projections for Japan ”, (Ind.) National Institute of Population and Social Security Research.
Chapter 3: Toward a Society Where Everyone can Play an Active Role in the face of Population declineEnvironmental Improvement for the Elderly on How to Work and Play an Active Role (2)-
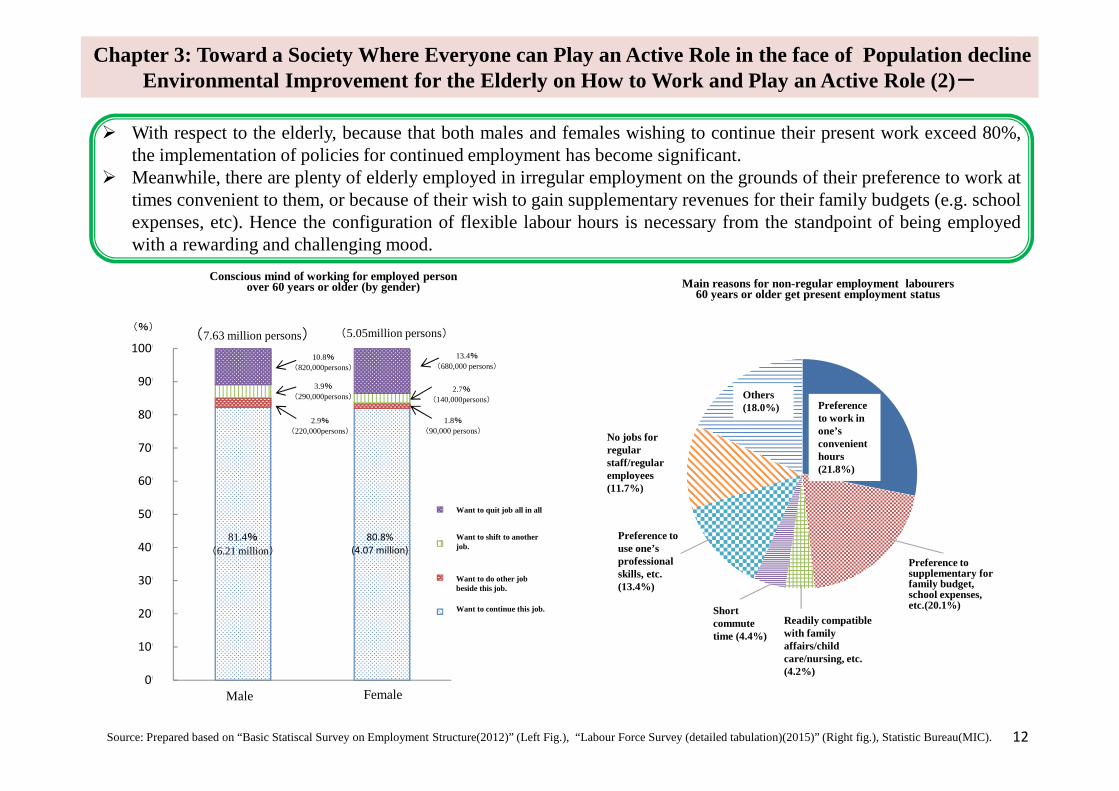
With respect to the elderly, because that both males and females wishing to continue their present work exceed 80%,the implementation of policies for continued employment has become significant.
Meanwhile, there are plenty of elderly employed in irregular employment on the grounds of their preference to work attimes convenient to them, or because of their wish to gain supplementary revenues for their family budgets (e.g. schoolexpenses, etc). Hence the configuration of flexible labour hours is necessary from the standpoint of being employedwith a rewarding and challenging mood.
Source: Prepared based on “Basic Statiscal Survey on Employment Structure(2012)” (Left Fig.), “Labour Force Survey (detailed tabulation)(2015)” (Right fig.), Statistic Bureau(MIC). 12
81.4%
(6.21 million)
80.8%(4.07 million)
2.9%
(220,000persons)
1.8%
(90,000 persons)
3.9%
(290,000persons)2.7%
(140,000persons)
10.8%
(820,000persons)
13.4%
(680,000 persons)
0%
10%
20%
30%
40%
50%
60%
70%
80%
90%
100%
男性 女性
仕事をすっかり
やめてしまいたい
ほかの仕事に
変わりたい
この仕事のほかに
別の仕事もしたい
この仕事を続けたい
(7.63 million persons) (5.05million persons)(%)
Want to quit job all in all
Want to shift to anotherjob.
Want to do other jobbeside this job.
Male Female
Want to continue this job.
No jobs forregularstaff/regularemployees(11.7%)
Preference touse one’sprofessionalskills, etc.(13.4%)
Others(18.0%) Preference
to work inone’sconvenienthours(21.8%)
Shortcommutetime (4.4%)
Preference tosupplementary forfamily budget,school expenses,etc.(20.1%)
Main reasons for non-regular employment labourers60 years or older get present employment status
Conscious mind of working for employed personover 60 years or older (by gender)
Readily compatiblewith familyaffairs/childcare/nursing, etc.(4.2%)
Chapter 3: Toward a Society Where Everyone can Play an Active Role in the face of Population decline― Environmental Improvement for the Elderly on How to Work and Play an Active Role (3)-
Source: Prepared based on “Basic Statiscal Survey on Employment Structure(2012)” (Left Fig.), Statistic Bureau(MIC), “Inauguration of Senior entrepreneur (2012)” (Right fig.) ,Japan FinanceCorporation General Research Center
13
0
2
4
6
8
10
12
14
16
18
20
2002 07 12
(year)
Of persons 60 years or older, thoseprefer to found enterprise
(10,000 persons)
10.7
14.5
17.351.1
36.2 36.235.1
24.522.3
20.218.1
10.68.5
13.8
0
10
20
30
40
50
60
仕事の経験・知識
や資格を生かした
かった
社会の役に立つ
仕事がしたかった
年齢や性別に
関係なく仕事が
したかった
自由に仕事が
したかった
収入を増やし
たかった
自分の技術や
アイデアを事業化
したかった
事業経営という
仕事に興味が
あった
適当な勤め先が
なかった
時間や気持ちに
ゆとりが欲し
かった
趣味や特技を
生かしたかった
その他
Incentives of founding enterprise (Multiple responses up to 3)
(%)
To
utilize
jobexp
eriences/
kn
owled
gean
dq
ualifications
To
practice
ajob
tocon
tribu
teto
society
To
do
one’s
jobfreely
To
increase
incom
e
Interested
ina
jobfor
bu
siness
man
agemen
t
To
mak
eon
e’stech
nology
and
idea
systemize
asa
bu
siness
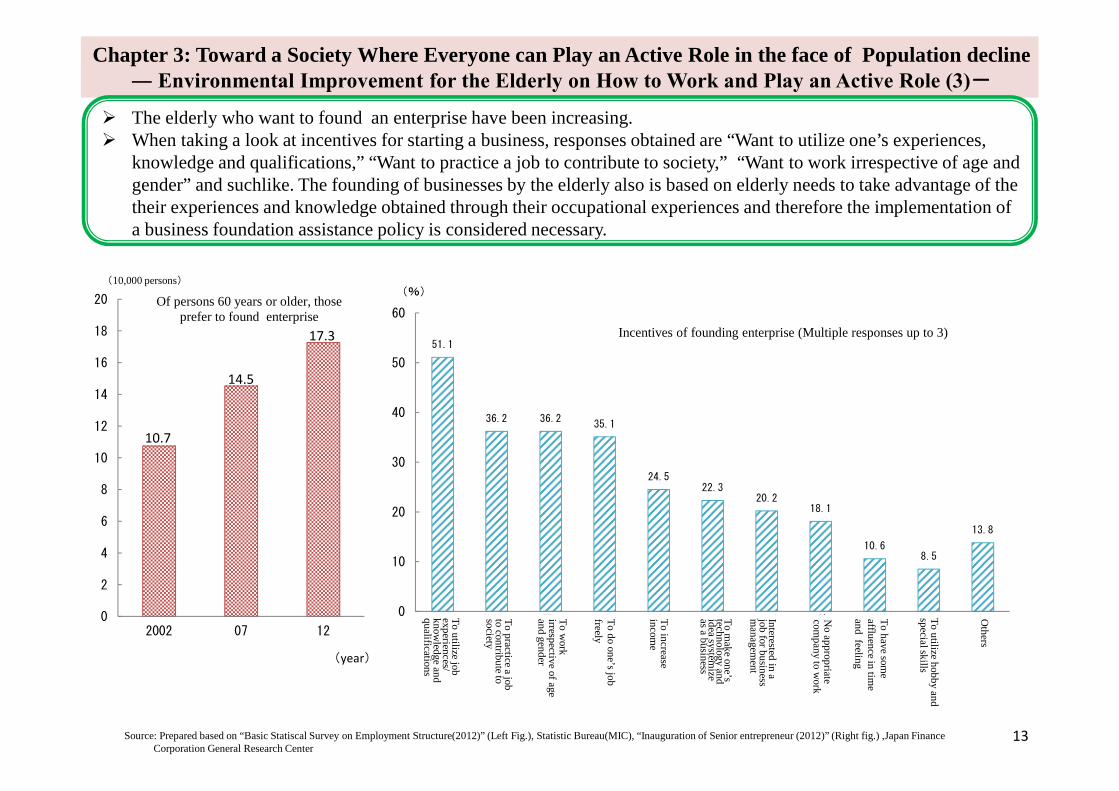
The elderly who want to found an enterprise have been increasing. When taking a look at incentives for starting a business, responses obtained are “Want to utilize one’s experiences,
knowledge and qualifications,” “Want to practice a job to contribute to society,” “Want to work irrespective of age andgender” and suchlike. The founding of businesses by the elderly also is based on elderly needs to take advantage of thetheir experiences and knowledge obtained through their occupational experiences and therefore the implementation ofa business foundation assistance policy is considered necessary.
To
work
irrespective
ofage
and
gend
er
No
app
ropriate
comp
any
tow
ork
To
have
some
affluen
cein
time
and
feeling
To
utilize
hob
by
and
specialsk
ills
Oth
ers
Chapter 3 Toward a Society Where Everyone can Play an Active Role in the face of Population decline-Environmental Improvement for the Elderly on How to Work and Play an Active Role (4)-
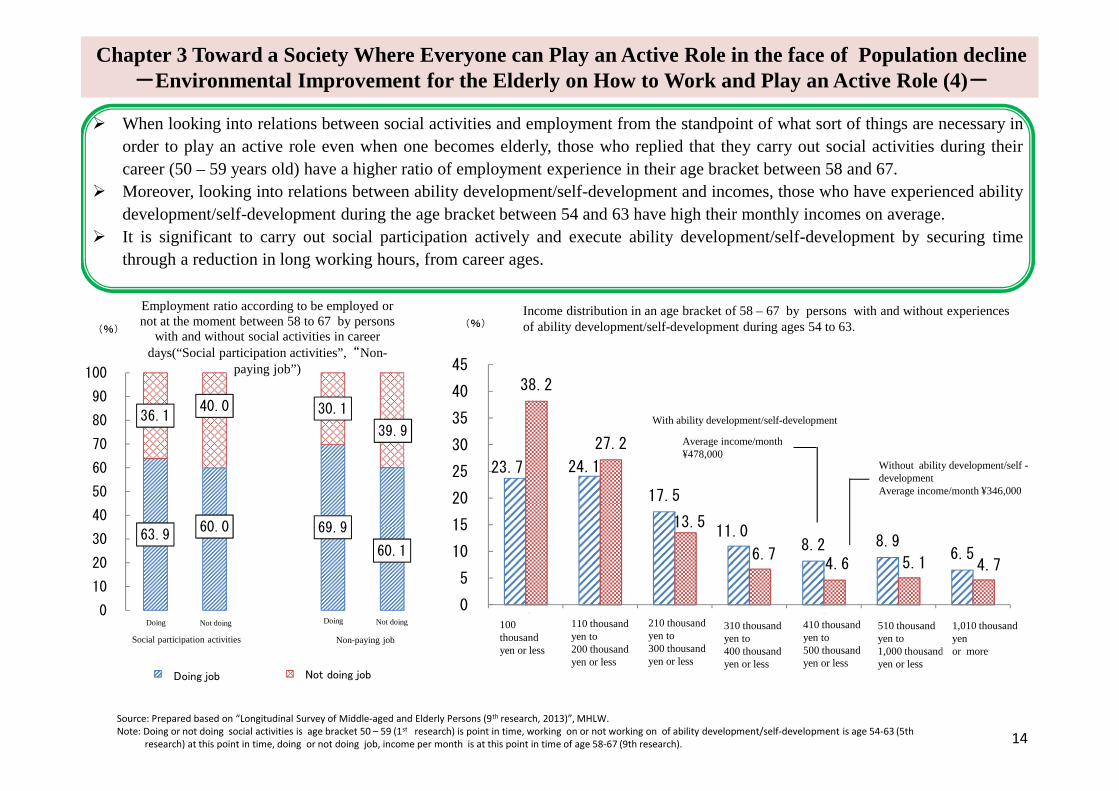
When looking into relations between social activities and employment from the standpoint of what sort of things are necessary in
order to play an active role even when one becomes elderly, those who replied that they carry out social activities during their
career (50 – 59 years old) have a higher ratio of employment experience in their age bracket between 58 and 67.
Moreover, looking into relations between ability development/self-development and incomes, those who have experienced ability
development/self-development during the age bracket between 54 and 63 have high their monthly incomes on average.
It is significant to carry out social participation actively and execute ability development/self-development by securing time
through a reduction in long working hours, from career ages.
23.7 24.1
17.5
11.08.2 8.9
6.5
38.2
27.2
13.5
6.74.6 5.1 4.7
0
5
10
15
20
25
30
35
40
45
10
万円以下
11
~20
万円以下
21
~30
万円以下
31
~40
万円以下
41
~50
万円以下
51
~100
万円以下
101
万円以上
54~63歳時に能力開発・自己啓発の経験の有無別58~67歳時点の収入分布(%)
能力開発・自己啓発あり1か月の平均収入額47.8万円 能力開発・自己啓発
なし1か月の平均収入額34.6万円
110 thousandyen to200 thousandyen or less
210 thousandyen to300 thousandyen or less
310 thousandyen to400 thousandyen or less
410 thousandyen to500 thousandyen or less
510 thousandyen to1,000 thousandyen or less
1,010 thousandyenor more
14
63.960.0 69.9
60.1
36.140.0 30.1
39.9
0
10
20
30
40
50
60
70
80
90
100
Employment ratio according to be employed ornot at the moment between 58 to 67 by persons
with and without social activities in careerdays(“Social participation activities”,“Non-
paying job”)
仕事をしている 仕事をしていない
(%)
Doing Not doing
Social participation activities
Doing Not doing
Non-paying job
Not doing job
With ability development/self-development
Average income/month¥478,000
Without ability development/self -developmentAverage income/month ¥346,000
100thousandyen or less
Income distribution in an age bracket of 58 – 67 by persons with and without experiencesof ability development/self-development during ages 54 to 63.
Doing job Not doing job
Source: Prepared based on “Longitudinal Survey of Middle-aged and Elderly Persons (9th research, 2013)”, MHLW.Note: Doing or not doing social activities is age bracket 50 – 59 (1st research) is point in time, working on or not working on of ability development/self-development is age 54-63 (5th
research) at this point in time, doing or not doing job, income per month is at this point in time of age 58-67 (9th research).
49.4%45.0%
5.6%
Business’ Judgment on Personnel
Appropriate
Excess
43.234.8
5.916.1
0
20
40
募集しても、
応募がない
応募はある
が、応募者の
資質が自社の
求める水準に
満たない
応募はある
が、求職者が
求める処遇・
労働条件と
自社の提示内
容が折り合わ
ない
応募があり採
用もしている
が、早期に離
職してしまう
(%)Reasons why recruitment cannot be fulfilled *Business Survey
Mismatch at application phase
Regard
lesso
frecru
itmen
t,no
app
lication
emerged
Alth
ou
ghth
ereare
entries
for
job
offers,
treatmen
t/labo
ur
con
ditio
ns
requ
iredb
yjo
bseekers
and
com
pan
y’sp
osted
con
tent
arein
com
patib
le
Alth
ou
ghth
ereare
app
lication
san
daccep
tance,
the
emp
loyed
areliab
leto
qu
itso
on
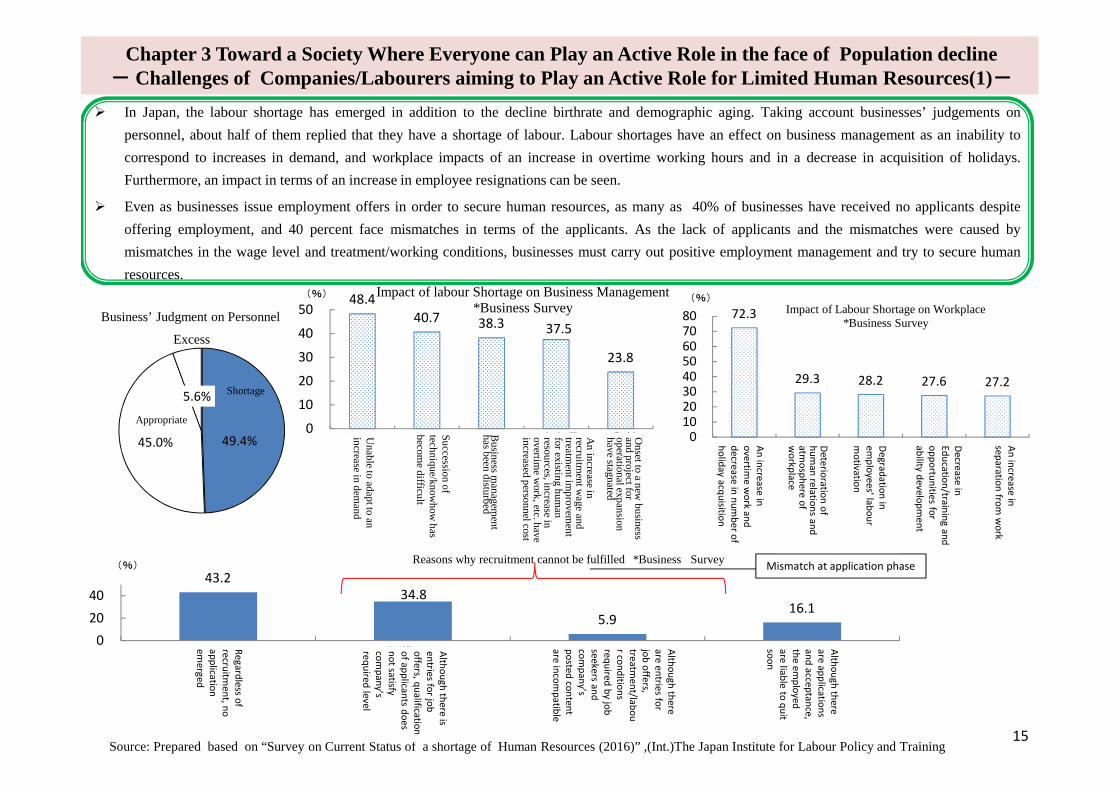
In Japan, the labour shortage has emerged in addition to the decline birthrate and demographic aging. Taking account businesses’ judgements on
personnel, about half of them replied that they have a shortage of labour. Labour shortages have an effect on business management as an inability to
correspond to increases in demand, and workplace impacts of an increase in overtime working hours and in a decrease in acquisition of holidays.
Furthermore, an impact in terms of an increase in employee resignations can be seen.
Even as businesses issue employment offers in order to secure human resources, as many as 40% of businesses have received no applicants despite
offering employment, and 40 percent face mismatches in terms of the applicants. As the lack of applicants and the mismatches were caused by
mismatches in the wage level and treatment/working conditions, businesses must carry out positive employment management and try to secure human
resources.
48.4
40.7 38.3 37.5
23.8
0
10
20
30
40
50
需要の増加
に対応できない
技術・ノウハウの着実
な伝承が困難になって
いる
事業運営上に支障を
来している
募集賃金の上昇や既存
人材の処遇改善、時間
外労働の増大等で人件
費が増大している
新規事業への着手や事
業拡大計画が停滞して
いる
Impact of labour Shortage on Business Management*Business Survey
(%)
Su
ccessionof
techn
ique/kn
owh
owh
asb
ecome
difficu
lt
Bu
siness
man
agemen
th
asb
eend
isturb
ed
Chapter 3 Toward a Society Where Everyone can Play an Active Role in the face of Population decline- Challenges of Companies/Labourers aiming to Play an Active Role for Limited Human Resources(1)-
72.3
29.3 28.2 27.6 27.2
01020304050607080
時間外労働の増加や
休暇取得数の減少
従業員間の人間関係
や
職場の雰囲気の悪化
従業員の労働意欲の
低下
教育訓練や能力開発
機会の減少
離職の増加
Impact of Labour Shortage on Workplace*Business Survey
(%)
Source: Prepared based on “Survey on Current Status of a shortage of Human Resources (2016)” ,(Int.)The Japan Institute for Labour Policy and Training15
Shortage
Un
able
toad
aptto
anin
creasein
dem
and
An
increase
inrecru
itmen
twage
and
treatmen
tim
provem
ent
forexistin
gh
um
anresou
rces,increase
inovertim
ew
ork,
etc.have
increased
person
nel
cost
On
setto
an
ewb
usin
essan
dp
rojectfor
operation
alexpan
sionh
avestagn
ated
Deterio
ration
of
hu
man
relation
san
datm
osp
here
of
wo
rkplace
An
increase
ino
vertime
wo
rkan
dd
ecreasein
nu
mb
ero
fh
olid
ayacq
uisitio
n
Degrad
ation
inem
plo
yees’labo
ur
mo
tivation
Decrease
inEd
ucatio
n/train
ing
and
op
po
rtun
itiesfo
rab
ilityd
evelop
men
t
An
increase
insep
aration
from
wo
rk
Alth
ou
ghth
ereis
entries
for
job
offers,
qu
alification
of
app
licants
do
esn
ot
satisfyco
mp
any’s
requ
iredlevel
76.0%
Company takingaccount ofsatisfy both joband life
Ratio of labourers tobe conscious ofattainment of theirability exertion.
63.5%
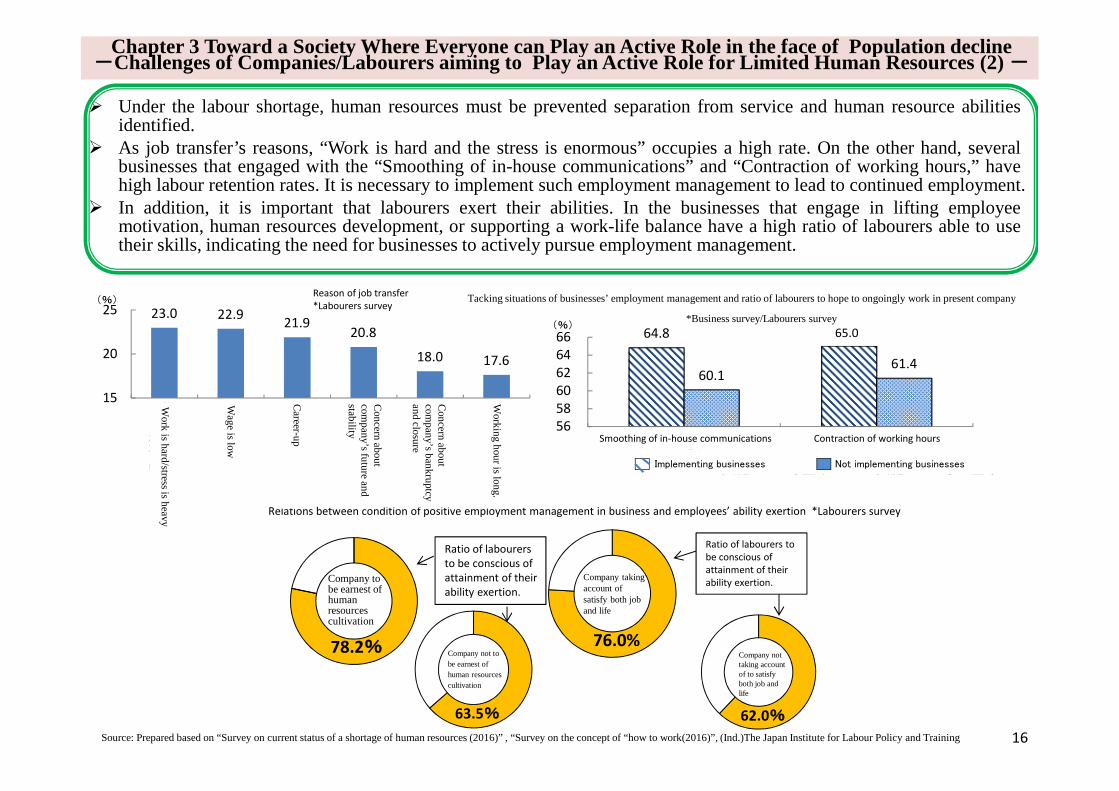
Under the labour shortage, human resources must be prevented separation from service and human resource abilitiesidentified.
As job transfer’s reasons, “Work is hard and the stress is enormous” occupies a high rate. On the other hand, severalbusinesses that engaged with the “Smoothing of in-house communications” and “Contraction of working hours,” havehigh labour retention rates. It is necessary to implement such employment management to lead to continued employment.
In addition, it is important that labourers exert their abilities. In the businesses that engage in lifting employeemotivation, human resources development, or supporting a work-life balance have a high ratio of labourers able to usetheir skills, indicating the need for businesses to actively pursue employment management.
23.0 22.921.9
20.8
18.0 17.6
15
20
25
仕事がきつい・ストレス
が大きい
賃金が安い
キャリアアップ
会社の将来性、安定
性に対する不安
会社の倒産、事業所の
閉鎖
労働時間が長い
転職理由
※労働者調査(%)
Chapter 3 Toward a Society Where Everyone can Play an Active Role in the face of Population decline-Challenges of Companies/Labourers aiming to Play an Active Role for Limited Human Resources (2) -
64.8 65.0
60.161.4
565860626466
社内コミュニケーション
の円滑化
労働時間の短縮化
企業の雇用管理の取組状況と現在の勤務先で、引き続き働くことを希望する労働者の割合
※企業調査・労働者調査
実施している企業 実施していない企業
(%)
16
62.0%
78.2%
Ratio of labourersto be conscious ofattainment of theirability exertion.
Relations between condition of positive employment management in business and employees’ ability exertion *Labourers survey
Reason of job transfer*Labourers survey
Tacking situations of businesses’ employment management and ratio of labourers to hope to ongoingly work in present company
*Business survey/Labourers survey
65.0
Smoothing of in-house communications Contraction of working hours
Implementing businesses Not implementing businesses
Wage
islow
Work
ish
ard/stress
ish
eavy
Career-u
p
Con
cernab
out
comp
any’s
futu
rean
dstab
ility
Con
cernab
out
comp
any’s
ban
kru
ptcyan
dclosu
re
Work
ing
hou
ris
long.
Source: Prepared based on “Survey on current status of a shortage of human resources (2016)” , “Survey on the concept of “how to work(2016)”, (Ind.)The Japan Institute for Labour Policy and Training
Company tobe earnest ofhumanresourcescultivation
Company not to
be earnest of
human resources
cultivation
Company nottaking accountof to satisfyboth job andlife