analysis of the plastic packaging value chain - … of the plastic... · · 2016-09-07title :...
TRANSCRIPT

NEW_InnoNet | H2020 CSA | D 2.4_ Report summarising the analysis of the plastic packaging value chain | Page 1 of 30
Analysis of the plastic
packaging value chain
HORIZON 2020 | CSA| WASTE-4a-2014I Grant Agreement No. 642231
Start date of project: 2015/02/01 Duration: 30 Months
Identifier: D2.4 Report summarising the analysis of the plastic packaging value
chain
Date: 2016/03/04
Class: Deliverable
Responsible Partner: EuPC
Annexes: -
Distribution: Public
Title: Analysis of the plastic packaging value chain
The project has received funding from the European Union’s Horizon 2020 research
and innovation programme under grant agreement no 642231
PROPRIETARY RIGHTS STATEMENT
THIS DOCUMENT CONTAINS INFORMATION, WHICH IS PROPRIETARY TO THE NEW_InnoNet CONSORTIUM.
NEITHER THIS DOCUMENT NOR THE INFORMATION CONTAINED HEREIN SHALL BE USED, DUPLICATED OR
COMMUNICATED BY ANY MEANS TO ANY THIRD PARTY, IN WHOLE OR IN PARTS, EXCEPT WITH THE PRIOR
WRITTEN CONSENT OF THE NEW_InnoNet CONSORTIUM THIS RESTRICTION LEGEND SHALL NOT BE ALTERED OR
OBLITERATED ON OR FROM THIS DOCUMENT

WP2 Analysis of the plastic packaging
value chain
NEW_InnoNet | H2020 CSA | D 2.4_Report summarising the analysis of the plastic packaging value chain | Page 2 of 30
TABLE OF CONTENTS
TABLE OF CONTENTS ..................................................................................................................... 2
1. Summary .................................................................................................................................................. 3
2. Overview of the report ............................................................................................................................... 4 2.1 Objective ................................................................................................................................................................... 4 2.2 Scope ......................................................................................................................................................................... 4
3 Background information ............................................................................................................................ 6
4 Methodology for bottleneck analysis .........................................................................................................10
5 Definition and analysis of the best practice value chain............................................................................... 12 5.1 Description of the value chain .................................................................................................................................... 12 5.2 Analysis of the value chain.......................................................................................................................................... 14
5.2.1 Actors .................................................................................................................................................................. 14 5.2.2 Operations .......................................................................................................................................................... 17 5.2.3 Products .............................................................................................................................................................. 18
6 Definition of bottlenecks ......................................................................................................................... 19
7 Analysis of bottlenecks ............................................................................................................................. 23

WP2 Analysis of the plastic packaging
value chain
NEW_InnoNet | H2020 CSA | D 2.4_Report summarising the analysis of the plastic packaging value chain | Page 3 of 30
1. SUMMARY
An analysis is made of the plastic packaging waste value chain to identify bottlenecks that hamper the
minimization of waste production within the value chain and to analyse the potential when these bottlenecks
could be overcome. The purpose is to provide an analysis of the plastic packaging waste value chain (as one of
the three cases to be analysed in the NEW_InnoNet project), in order to enable a prioritization of the
bottlenecks according a multiple criteria decision analysis. The overall objective of the analyses of the value
chain bottlenecks is to create, in a next step of the project, the basis for roadmaps and a strategic research
and innovation agenda by evaluating where and how the change towards near zero-waste value chains and
circular economy can be made by overcoming the major bottlenecks.
Based on a flow diagram and an analysis of the plastic packaging waste value chain, and its relation to the
plastics packaging production value chain, the bottlenecks with the most potential for minimizing waste
production within the value chain are identified.
These bottlenecks relate to:
• Limited source separation;
• Bad product design;
• Export of plastic packaging waste outside the EU;
• Performance of separation/sorting technology;
• Performance of recycling technology.
The criteria chosen to describe the potential related to these bottlenecks are material efficiency (losses of
plastics due to the bottleneck), total costs and revenues, GHG emissions and feasibility of removing the
bottleneck during the next 5-10 years.
The main results of the impacts related to solving the bottlenecks are summarized in the following table:
Losses of
plastics Total EU cost
Total EU
revenues
GHG emissions
inside the EU Feasibility
% €/ton recycled €/ton recycled
kg CO2 eq/ton
waste generated high (5), low (1)
Situation 2012 69% 1.474 676 1.143 -
Limited source
separation 52% 1.212 678 955 3
‘Bad’ product design 68% 1.425 676 1.126 1
Export outside EU 69% 1.604 748 1.206 1
Performance of sorting
technology 68% 1.430 676 1.127 4
Performance of recycling
technology 67% 1.408 679 1.121 5

WP2 Analysis of the plastic packaging
value chain
NEW_InnoNet | H2020 CSA | D 2.4_Report summarising the analysis of the plastic packaging value chain | Page 4 of 30
2. OVERVIEW OF THE REPORT
WP: WP2
Task : Task 2.3 Value chain analysis for plastic packaging waste
Title : Analysis of the plastic packaging value chain
Version: Final (2016/03/04)
2.1 OBJECTIVE
Within the context of WP2 of the H2020 project NEW_InnoNet, an EU near zero-waste stakeholder platform,
an analysis is made of three selected waste value chains (WEEE, ELV and plastic packaging waste) to identify
bottlenecks that hamper the minimization of waste production within the respective value chain and to
analyse the potential when these bottlenecks could be overcome.
The approach and methodology for this analysis is explained in more detail in a dedicated methodology
report for bottleneck analysis., which is summarized in chapter 4 Methodology for bottleneck analysis.
The purpose of the present report is to provide an analysis of the plastic packaging waste value chain (as one
of the three cases to be analysed) , in order to enable a prioritization of the bottlenecks according a multiple
criteria decision analysis.
This final report includes:
The definition of the scope
A summary of the methodology for bottleneck analysis
Background information
A description of the value chain
Identification of bottlenecks
Analysis of bottlenecks
2.2 SCOPE
Post-consumer plastic waste (including industrial, commercial and municipal waste) can be found in six
distinctive waste streams:
Packaging waste,
Waste from Electrical and Electronic Equipment (WEEE),
End of Life Vehicles (ELV),
Building and Construction Waste (B&C),
Agricultural waste,
and Other plastic waste, which is a broad and non-specific category including all other types of plastic
waste that might occur outside of the five aforementioned waste streams.

WP2 Analysis of the plastic packaging
value chain
NEW_InnoNet | H2020 CSA | D 2.4_Report summarising the analysis of the plastic packaging value chain | Page 5 of 30
Within the context of the NEW_InnoNet project and the corresponding value chain analysis, the scope of the
plastic waste value chain is defined as plastic packaging waste.
A description and an analysis of this value chain are provided in the next chapters.
Packaging is defined as any material which is used to contain, protect, handle, deliver and present goods.
Packaging waste can arise from a wide range of sources including supermarkets, retail outlets, manufacturing
industries, households, hotels, hospitals, restaurants and transport companies. Items like glass bottles, plastic
containers, aluminium cans, food wrappers, timber pallets and drums are all classified as packaging.
The classification of packaging waste and ordinary waste is defined according to the three criteria in Article 3
of the Packaging Waste Directive. In contrast to other waste statistics, the term 'packaging waste generated'
means not the amount of 'packaging collected', but rather all 'packaging placed on the market'. 1.
The main packaging materials are glass, paper and board, plastics, metals (aluminium and steel) and wood.
Composite materials are made of paper, plastic and metal which cannot be separated by hand. Composites
are reported under their predominant material by weight. Other packaging materials are counted as 'others'.
1 http://ec.europa.eu/eurostat/statistics-explained/index.php/Packaging_waste_statistics

WP2 Analysis of the plastic packaging
value chain
NEW_InnoNet | H2020 CSA | D 2.4_Report summarising the analysis of the plastic packaging value chain | Page 6 of 30
3 BACKGROUND INFORMATION
In Europe, packaging applications are the largest application sector for the plastics industry and represent
39.6% of the total plastics demand.2
Building and construction is the second largest application sector with 20.3% of the total European demand.
Automotive is the third sector with a share of 8.5% of the total demand.
Electrical and electronic applications represent 5.6% of the plastics demand and are closely followed by
agricultural applications which have a share of 4.3%.
Other application sectors such as appliances, household and consumer products, furniture and medical
products comprise a total of 21.7% of the European plastics demand.
Figure 1: Overview of European plastic demand by segment 2013 Source: PlasticsEurope (PEMRG)/Consultic/ECEBO
2 Plastics, the facts 2014-2015, http://www.plasticseurope.org/Document/plastics---the-facts-2015.aspx
WP2 Analysis of the plastic packaging
value chain
NEW_InnoNet | H2020 CSA | D 2.4_Report summarising the analysis of the plastic packaging value chain | Page 7 of 30
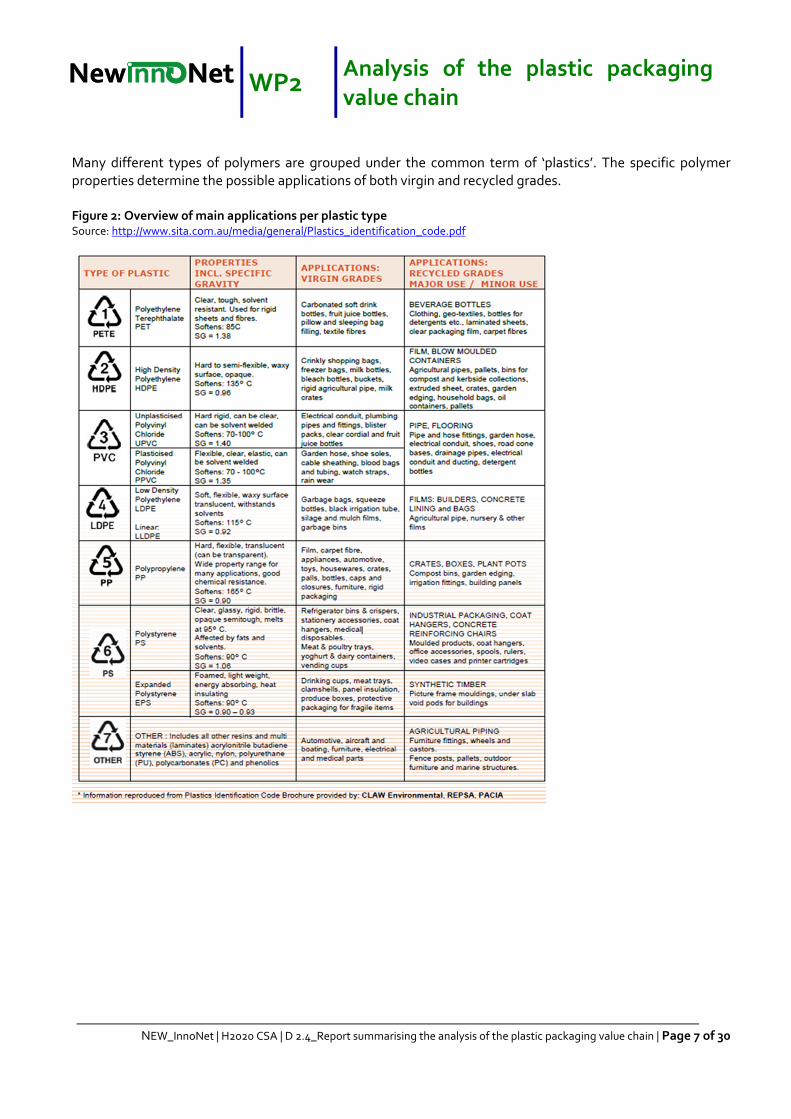
Many different types of polymers are grouped under the common term of ‘plastics’. The specific polymer
properties determine the possible applications of both virgin and recycled grades.
Figure 2: Overview of main applications per plastic type Source: http://www.sita.com.au/media/general/Plastics_identification_code.pdf

WP2 Analysis of the plastic packaging
value chain
NEW_InnoNet | H2020 CSA | D 2.4_Report summarising the analysis of the plastic packaging value chain | Page 8 of 30
The shares of particular polymers within the total plastics demand of an application sector however differs
greatly between sectors. For instance, while PVC is dominating the polymer demand from the building &
construction sector, its share in automotive applications is rather limited.
Figure 3: Overview of main markets for plastics Source: PlasticsEurope (PEMRG)/Consultic/ECEBO

WP2 Analysis of the plastic packaging
value chain
NEW_InnoNet | H2020 CSA | D 2.4_Report summarising the analysis of the plastic packaging value chain | Page 9 of 30
The sector in which a certain polymer type is applied will determine to a large degree the duration of its useful
life. Typically, the life cycle of polymers applied in the building sector will reach out over several decades, but
packaging applications might turn into waste in just a few days. Due to these differences, the share of a
particular polymer fraction in post-consumer waste will also differ from its share in the demand for plastics.
In 2012, 25.2 million tonnes of post-consumer plastics waste ended up in the waste upstream.
Packaging plastic waste makes up 63% of this post-consumer waste3, although the packaging sector only
represents 39,6% of the total demand for plastics.
Table 1: Overview of plastic waste per application Source: Bio by Deloitte 2015
With respect to the treatment of EU plastic waste, 26% of the post-consumer plastics waste was recycled,
while 36% was sent to energy recovery and 38% still went to landfill.
Figure 4: Overview of EU plastic waste treatment Source: PlasticsEurope (PEMRG)/Consultic/ECEBO
3 Hestin, M., Faninger, T., Milios, L., Increased EU Plastics Recycling Targets: Environmental, Economic and Social
Impact Assessment, Final Report. Bio by Deloitte. 2015

WP2 Analysis of the plastic packaging
value chain
NEW_InnoNet | H2020 CSA | D 2.4_Report summarising the analysis of the plastic packaging value chain | Page 10 of 30
4 METHODOLOGY FOR BOTTLENECK ANALYSIS
A common methodology was used in the analysis of the three value chains within the scope of the
NEW_InnoNet project: End-of-Life Vehicles (ELV), Waste Electrical and Electronic Equipment (WEEE) and
Plastics Packaging.
The overall objective of the analysis is to evaluate where and how the change towards near zero-waste value
chains can be made by overcoming the major bottlenecks of technical and non-technical nature. Secondly,
the analysis should create a basis for subsequent project activities, including innovation roadmaps and
strategic research and innovation agenda.
A schematic overview of the key stages in the analysis is given in Figure 5.
Figure 5: Description of the stages of analysis of the value chains to identify best practices and bottlenecks
The current best practice value chains were defined in order to enable identification of bottlenecks
limiting the performance in the chain and to enable collection of data for analysis and prioritisation of the
bottlenecks. The value chain covers whole the material cycle. Main focus is in the waste handling
operations from waste discarding and collection to processing stages which prepare reusable parts or raw
materials fulfilling the specifications of the prevalent manufacturing processes. Other parts of the cycle
cannot be excluded because they are linked and have influence on the perfomance of the waste value
chain.
The bottlenecks, their causes and impacts were identified and described as explicitly as possible. The
bottlenecks were defined based on the project goal and scope as factors that limit transformation
towards zero waste value chains.
The significance of the bottlenecks was analysed based on the economic value and improved material
and environmental efficiency that could be attained by removal or reduction of the limiting factors. First
the criteria which describe the impact of removal of the bottlenecks were selected. The following types of
criteria were chosen and further adapted depending on the characteristics of each value chain:

WP2 Analysis of the plastic packaging
value chain
NEW_InnoNet | H2020 CSA | D 2.4_Report summarising the analysis of the plastic packaging value chain | Page 11 of 30
a. Economic: Lost value and additional costs due to the bottleneck;
b. Material efficiency: Losses of materials due to the bottleneck;
c. Environmental: GHG emissions due to the bottleneck;
d. Other: Technical and economic feasibility of removing the bottleneck.
The criteria performance was evaluated using either quantitative, semi-quantitative or qualitative
information describing the consequences of each bottleneck. The bottlenecks were prioritized using this
information. Either panel or questionnaire based multiple criteria decision making method was used in
order to arrive at a list of prioritized bottlenecks.
The results of the analysis per value chain were cross-linked to define commonalities between the chains
and bottlenecks, so that uniform solutions applicable to several waste streams could be identified.
Creation of a database of potential technological solutions of the bottlenecks to be used and further
developed during subsequent project activities.

WP2 Analysis of the plastic packaging
value chain
NEW_InnoNet | H2020 CSA | D 2.4_Report summarising the analysis of the plastic packaging value chain | Page 12 of 30
5 DEFINITION AND ANALYSIS OF THE BEST PRACTICE VALUE CHAIN
The aim of this stage is to define the current best practice value chain in order to enable identification of
bottlenecks limiting the performance in the chain and to enable collection of data that is needed for analysis
and prioritisation of the bottlenecks. The definition of the chain defines the borders of the analysis and the
focus area of the database on current and future best practice technologies and solutions.
5.1 DESCRIPTION OF THE VALUE CHAIN
Figure 6gives an overview of the plastic packaging waste value chain, and its relation to the plastics
packaging production value chain.
In this figure operations are indicated in blue, actors in black and products in green.
The dotted line in the figure delineates the scope of our work, being plastic packaging recycling.
Plastic packaging waste is generated by both households and commercial sources (EU split: 62%/38%).
Part of this waste ends up in municipal solid waste and gets incinerated or disposed. The other part of the
waste is separately collected and transported to sorting facilities, where the waste is pre-treated and sorted
into different plastic resins. These sorted plastic resins are transported to specific recycling facilities and
processed into new products that can be put on the market by brand owners and product manufacturers. In
Section 3.2, the plastic packaging waste value chain is described in detail.

WP2 Analysis of the plastic packaging
value chain
NEW_InnoNet | H2020 CSA | D 2.4_Report summarising the analysis of the plastic packaging value chain | Page 13 of 30
Figure 6: Overview of the plastic packaging waste value chain

WP2 Analysis of the plastic packaging
value chain
NEW_InnoNet | H2020 CSA | D 2.4_Report summarising the analysis of the plastic packaging value chain | Page 14 of 30
5.2 ANALYSIS OF THE VALUE CHAIN
5.2.1 Actors
Waste suppliers
Plastic packaging in general has a very limited useful lifetime between packaging a product for distribution
and unpacking it at the point of consumption. Plastic packaging becomes packaging waste from the moment
the holder of the packaging wants to dispose of it. This happens at several stages in the packaged product
distribution and consumption chain: at the end consumer when the primary packaging is removed from the
product; or at the distribution stage when individual products are removed from secondary transport
packaging. The holder of the waste can thus be different actors: households, industrial and commercial users
of packaged products, and retailers.
The Packaging and Packaging Waste Directive (94/62/EC) obliges the Member States to introduce systems
for the return and/or collection of used packaging to attain a general packaging recycling rate of 55% to 80%4.
The specific target for plastic packaging waste currently is 22.5 %, but might be increased during review of
the Directive as part of the expected Communication on a Circular Economy. The Directive covers all
packaging placed on the European market and all packaging waste, whether it is used or released at
industrial, commercial, office, shop, service, household or any other level, regardless of the material used.
Stakeholders at the level of waste generation include:
• Households: Private consumers have different possibilities to discard their plastic packaging waste,
depending on the local collection systems available (see 3.2.2 for more details):
o Discard with municipal collection of residual waste
o Discard with some form of separate collection system, organised by a producer responsibility
organisation in cooperation with public and private actors
o Discard at a municipal collection centre
• Small businesses, e.g. catering: As food and drink packaging is one of the main applications of plastic
packaging, restaurants and catering businesses are important producers of plastic packaging waste.
In principle, they have to make use of private waste collection companies to discard their plastic
packaging waste, although small businesses often also make use of municipal collection systems.
• Retailers: during the distribution of goods, secondary plastic packaging waste arises. This waste is
collected by private waste management companies. In this context, reusable packaging solutions are
common as well, as regular transportation between the same partners in a business-to-business
setting provides the right conditions to set up reuse systems. This significantly increases the useful
lifetime of packaging, but eventually also this packaging (crates, pallets) becomes waste that is
handed over to private waste management companies.
4 The target is actually a collection target, as the rate is measured at the input of the recycling system, and not at the
output.

WP2 Analysis of the plastic packaging
value chain
NEW_InnoNet | H2020 CSA | D 2.4_Report summarising the analysis of the plastic packaging value chain | Page 15 of 30
Producer Responsibility Organisations
Producer Responsibility Organisation, i.e. a collective entity set up by producers or through legislation, which
becomes responsible for meeting the recovery and recycling obligations of the individual producers.
The Extended Producer Responsibility (EPR) concept is an environmental policy approach in which a
producer’s responsibility for a product is extended to the post-consumer stage of a product’s life cycle. EPR,
as a principle of product policy, was introduced in legislative acts in the early 1990s to address the life-cycle
issues of products, using a target-oriented approach, instead of traditional command-and-control type
regulation5.
At EU level, for 3 product categories, ELVs, WEEE and batteries, EPR is introduced as a policy approach,
respectively in the ELV Directive 2000/53/EC, the (new) WEEE Directive 2012/19/EU and the Batteries
Directive 2006/66/EC. The Packaging and Packaging Waste Directive (94/62/EC) does not impose EPR
explicitly, although it is widely used in the context of the implementation of this Directive. Also the Waste
Framework Directive (2008/98, Article 8) includes a clause related to the implementation of EPR by the
European Member States.
The EPR policy is characterised by the provision of incentives to producers to take into account
environmental considerations when designing their products. As the OECD6 puts it, “while other policy
instruments tend to target a single point in the chain, EPR seeks to integrate signals related to the
environmental characteristics of products and production processes throughout the product chain”.
Plastics Recyclers
Mechanical recycling refers to the processing of waste plastics by physical preparation and conversion means
(grinding, shredding, melting) back to shredded or micronised plastics, new granulates, compounds, or plastic
articles. In order to mechanically recycle plastics waste, it has first to be collected, sorted, separated, washed,
ground, densified and reprocessed, before it can be admixed with virgin plastics of the same type for
producing new articles, or used on its own for alternative (usually lower value) articles. As a rule admixing to
virgin resin is necessary, in order to ensure some minimum adherence to the expected specifications, by
ensuring a reasonably predictable and constant quality.
Mechanical recycling of various plastic materials is a well-established and growing business. The mechanical
recycling sector, however, is far from being easy to define, for simple, both practical and commercial reasons.
The different main operations in the mechanical recycling chain - collection, sorting, reprocessing and the
end-use of the recycled material – are often treated holistically. In reality, the chain is composed of more or
less specialised individual operators (see Figure 7).
In general, once collected, the plastics intended for mechanical recycling are delivered to either a material
recovery facility (MRF) for sorting into single resin streams, or in order to constitute unit transport and
handling loads (often a full, single container) and thus increase product value. The sorted plastics are often
baled or else wise densified and typically shipped to reprocessors where the plastics are chopped into flakes
5 Development of Guidance on Extended Producer Responsibility (EPR), European Commission – DG Environment, 2014;
http://ec.europa.eu/environment/waste/pdf/target_review/Guidance%20on%20EPR%20-%20Final%20Report.pdf
6 OECD (2001) Extended Producer Responsibility: A Guidance Manual for Governments, OECD, March, Paris, 164p;
http://www.oecd.org/env/waste/factsheetextendedproducerresponsibility.htm

WP2 Analysis of the plastic packaging
value chain
NEW_InnoNet | H2020 CSA | D 2.4_Report summarising the analysis of the plastic packaging value chain | Page 16 of 30
and contaminants such as paper labels, dust, or metal are removed and/or the flakes are washed. Flakes may
also be further (re-)extruded into granules/pellets at the reprocessor, or they can be sold as flakes to the end-
users for the manufacture of new articles, depending on their customer’s requirements. Some reprocessors
may already re-compound the recycled material with additives and/or add production waste or more virgin
raw material at the re-extruding phase.
Figure 7: Plastics’ mechanical recycling
Chemical recycling (feedstock recycling) refers to operations that aim to chemically degrade the collected
plastics waste into its monomers or other basic chemicals. The output may be reused for polymerisation into
new plastics, for production of other chemicals or as an alternative fuel.
Examples of mechanical recycling of post-consumer plastics waste7:
• Collection and grinding of sorted, clean PP crates and blending of the regrind with virgin polymer to
mould new crates;
• Collection of PE-LD films used in agriculture and industrial packaging, pre-washing, grinding,
washing, separating, drying and melt-filtration/re-granulation and processing into refuse bags;
• Collection and sorting of PET bottles used for drinks packaging, grinding, washing, separating, drying
and processing into polyester fibres, sheets or containers
Plastics Converters
Plastics converters (sometimes called "Processors") manufacture plastics semi-finished and finished products
for an extremely wide range of industrial and consumer markets. Raw materials for the plastic converting
industry include both virgin plastics, provided by large chemical companies which are transforming a carbon
based material into a polymer by a polymerisation process, as well as recycled plastics from plastic recyclers.
Plastics converters buy in raw material in granular or powder form, subject it to a process involving pressure,
heat and/or chemistry and apply design expertise to manufacture their products. They often undertake
additional finishing operations such as printing and assembly work to add further value to their activities.
7 http://www.plasticsrecyclers.eu/plastic-recycling-industry-europe
Collection
- consumer
Sorting
(MRF / handler)
Reprocessing
(reprocessor)End-user
Collection
- distribution
-industrial

WP2 Analysis of the plastic packaging
value chain
NEW_InnoNet | H2020 CSA | D 2.4_Report summarising the analysis of the plastic packaging value chain | Page 17 of 30
5.2.2 Operations8
Waste generation
In 2012 in total about 25.2 Mton of plastic waste was generated, 63 % or 15.9 Mton of this being plastic
packaging waste. For future years, the amount of generated plastic packaging waste is expected to grow
annually about 1.0 %, resulting in projected plastic packaging waste amounts of 17.2 Mton and 18.1 Mton for
2020 and 2025 respectively.
Currently the recyclable share9 of plastic packaging is about 76 %. For future scenarios, higher recyclability
rates (80-85 %) can be assumed taking into account potential ongoing eco-design improvements.
Collection
There are different collection systems in EU Member States (MS) for collecting packaging waste, including
kerbside collection, bring site collection, deposit/refund systems, recycling centres, civic amenity sites and
privately organised on-site collection for the industrial and commercial sector.
The collection systems are generally influenced by different local legislative and economic parameters and
even within one single MS there could be different collection schemes in the different regions or cities, while
sometimes parallel collection systems co-exist in a same place.
Recyclable plastics are collected in different ways that may include:
- separate collection as a single stream,
- mixed collection with other similar recyclables (e.g. light packaging),
- mixed collection with all dry recyclables (e.g. paper, glass, etc.), and
- mixed collection with residual waste.
A screening of all collection systems in EU MS in order to identify the most prominent collection schemes
which are used most often in the EU for the collection of plastic recyclables concluded that in the EU
(especially among the 7 MS with the higher plastic waste generation) plastic packaging waste is mostly
collected either with other light packaging materials and separately from paper and glass, or together with all
packaging including paper and cardboard, but still without glass.
In 2012 the separate collection rate of plastic packaging waste in the EU was 41%, or 6.5 Mton. The remaining
9.4 Mton of plastic packaging waste was landfilled or incinerated with energy recovery.
Pre-treatment/Sorting
The goal of pre-treatment and sorting is to separate the different plastic resin types and to remove
impurities. Process efficiencies are generally high (on average 82%, from 75% for household packaging waste
to 95% for commercial/industrial packaging waste).
8 Increased EU Plastics Recycling Targets: Environmental, Economic and Social Impact Assessment, PRE, 2015;
http://www.plasticsrecyclers.eu/sites/default/files/BIO_Deloitte_PRE_Plastics%20Recycling%20Impact_Assesment_Fin
al%20Report.pdf
9 This refers to the share of theoretically possible recyclable pastic waste in the plastic packaging waste stream. The
recyclability of plastics depends on several parameters, primarily on the type of plastic resin or the mix of resins in
composite products, and on the technologies available for recycling.

WP2 Analysis of the plastic packaging
value chain
NEW_InnoNet | H2020 CSA | D 2.4_Report summarising the analysis of the plastic packaging value chain | Page 18 of 30
Ultimately, 34% of collected plastic packaging waste arrives at recycling facilities (5.4 Mton), meaning that
7% (1.1 Mton) of the collected waste is lost during pre-treatment and sorting. This waste is diverted into
landfilling or incineration with energy recovery.
Processing
The actual recycling of plastic packaging waste consists of a combination of sorting, cleaning, grinding and
melting steps, depending on the type of plastic resin. The recycling yield for plastic packaging waste is on
average 73% (plus by-products), leading to 3.9 Mton of plastic packaging waste being recycled in 2012. This is
an average over all plastic resins contained in plastic packaging waste. Recycling efficiencies for different
resin types are shown in the table below. The residual waste is diverted to landfilling or incineration with
energy recovery.
Table 2: Recycling yield by plastic resin
5.2.3 Products
The output of the recycling process consists of pellets, agglomerates, regrind, flakes and other recyclates
depending on the type of resin. These plastics secondary raw materials can be converted by plastics
converters into products, in the same way primary plastic raw materials are converted into products.
In some cases, the recycled resin can be used in the original packaging application (e.g. PET in beverage
containers), but technical or legislative requirements can limit this closed loop recycling. In the case of food
packaging, food safety regulations do not always allow the use of recycled plastics. Therefore, recycled
plastics from packaging waste are commonly used for other product types. In many cases, this means
downcycling compared to the original application, although examples of recycling exist as well.
WP2 Analysis of the plastic packaging
value chain
NEW_InnoNet | H2020 CSA | D 2.4_Report summarising the analysis of the plastic packaging value chain | Page 19 of 30
6 DEFINITION OF BOTTLENECKS
The overall objective of the analyses of the value chain bottlenecks in the NEW_InnoNET project (work
package 2) is to create the basis for roadmaps and a strategic research and innovation agenda by evaluating
where and how the change towards near zero-waste value chains and circular economy can be made by
overcoming the major bottlenecks. Bottlenecks are defined as factors that limit the performance and
efficiency of the value chain and thus prevent or limit the move towards a near zero-waste value chain and
circular economy. The bottlenecks can be either technical or non-technical (financial, organizational,
legislative or societal) in nature.
Bottlenecks are described comprehensively and explicitly in such manner that their effect on the whole
performance of the value chain can be detected. Therefore, in the bottleneck description a deeper definition
of which things causes the bottleneck (cause and effect) are requisite. The description includes:
- The name of the bottleneck;
- The reason why is it a bottleneck;
- A description of what an affect it has on the value chain (with respect to the objectives of the
project).
The bottleneck analysis and corresponding (to be developed) roadmaps should provide regional, national and
European policy makers with relevant prove of how recycling could be improved by actors in the value chain
in order to be able to provide an evidence base to develop a near-zero waste roadmap and strategic research
and innovation agenda.
The bottlenecks identified for the plastics packaging waste value chain are listed in
Table 3.
These bottlenecks have been identified through an iteration of brainstorm sessions with representatives of
PRE, EuPC and VITO involved in the NEW_InnoNET project.
Increasing targets for recycling or bans for landfilling of recyclable materials (and other policy measures) are
not included in the bottleneck identification as they are rather drivers or measures to support more recycling
than bottlenecks themselves. Such policy measures can be drivers for industry to invest in more appropriate
infrastructure and can initiate additional recycling, but they cannot be considered a bottleneck for recycling
as they do not hamper industry in recycling more.
Besides the name, the reason and the effects also a possible solution to overcome the bottleneck and an
approach to analyse the potential of overcoming the bottleneck are included.

WP2 Analysis of the plastic packaging
value chain
NEW_InnoNet | H2020 CSA | D 2.4_Report summarising the analysis of the plastic packaging value chain | Page 20 of 30
Table 3: Identified bottlenecks for the plastic value chain
No. Name of the bottleneck Reasons for the
bottleneck
Effects of the bottleneck on
the value chain
Possible
solution
Approach Potential
Analysis
1 Limited source separation
of plastic packaging waste
No or inappropriate
systems for source
separation of plastic
packaging are in place
Recyclable plastics end up in
residual waste stream and are
diverted to the corresponding
treatments
(disposal/incineration)
Implement source
separation for all
plastic packaging
waste
All recyclable (80%)
plastic packaging waste
in recycling value chain
2 ‘Bad’ product design Product design not
adapted to current
technologies for
sorting/separating
materials; use of
composite materials
Plastics technically or
economically not fit for
recycling, leading to loss of
material value
Improve product
design for recycling
Increased pre-
treatment yield from
82 to 86%
3 Export of plastic
packaging waste for
recycling outside EU
Lower costs for recycling
(because of lower human
and environmental
standards)
Added value of recycling of
plastic packaging leaving EU
Limit export outside
EU
Export to zero

WP2 Analysis of the plastic packaging
value chain
NEW_InnoNet | H2020 CSA | D 2.4_Report summarising the analysis of the plastic packaging value chain | Page 21 of 30
No. Name of the bottleneck Reasons for the
bottleneck
Effects of the bottleneck on
the value chain
Possible
solution
Approach Potential
Analysis
4 Performance of
separation/sorting
technology:
- High cost
- Technology not able
to sort new packaging
product designs
- Presence of unwanted
substances in the
plastic waste streams
(flame retardants,
additives (Cd, Pb,…)
Product development goes
faster than sorting
technology development
Part of the plastic packaging
waste ending up in disposal or
incineration
Better separation
technologies
The automatic
sorting technology
has been developing
enormously in the
past years. But it
should further
improve in order to
be more precise and
reduce the
investment costs.
Increased pre-
treatment yield from
82 to 86%
5 Performance of recycling
technology
The recycling technology
did not evolve drastically
over the past decades.
Important developments
are needed in order to
improve the washing
efficiency and the related
costs.
Part of the plastic packaging
waste ending up in disposal or
incineration
Better recycling
technologies
Increased recycling
yield from 73 to 78%

WP2 Analysis of the plastic packaging
value chain
NEW_InnoNet | H2020 CSA | D 2.4_Report summarising the analysis of the plastic packaging value chain | Page 22 of 30
Additional to the bottlenecks listed in the table above, other obstacles are inventoried:
- Lack of common calculation methodology to calculate EU recycling targets, including more
measuring points (collection, sorting & recycling) to efficiently measure the material flow;
- Supply of highly heterogeneous and/or contaminated plastics from collection leading to downcycling
and high rejection rates;
- Lack of market trust in (products containing) recycled plastics; absence of quality requirement (end of
waste criteria) for recycled plastic waste, both on supply and demand side;
- Product standards limiting the use of recycled material;
- Uneven level playing field for environmentally sound recycling plants because of not harmonized EU
legislation in Member States and regions.
For these bottleneck we were not able to quantify their potential when overcoming them.

WP2 Analysis of the plastic packaging
value chain
NEW_InnoNet | H2020 CSA | D 2.4_Report summarising the analysis of the plastic packaging value chain | Page 23 of 30
7 ANALYSIS OF BOTTLENECKS
To calculate the potentials of taking away the bottlenecks, we start with the analysis of the actual situation,
being anno 2012. This situation is mainly based on numbers from the report ‘Increased EU plastics recycling
targets’, complemented with data from the Eurostat database on waste for the year 2012.
To compare the potentials of each bottleneck, a scenario calculation is done calculating how the current
situation would change when each of the bottlenecks are being taken away separately. To have an idea of the
potentials, one has to compare the numbers of the actual situation (on emissions, costs, etc.) with those of the
chosen scenario. Table 5 gives an overview of the assumptions we took into account to make a scenario
analysis of the different bottlenecks.
A preselection is made of criteria for bottleneck analysis representing relevant aspects of the potential.
The criteria, their measures and interpretations are given in Table 4. To best describe the bottlenecks, the
criteria were selected to cover both the economic, environmental and material efficiency effects of the
bottlenecks as follows:
Material efficiency: Losses of plastics due to the bottleneck;
Economic: Total costs and revenues of the scenario;
Employment;
Environmental: GHG emissions due to the bottleneck;
Other: Feasibility of removing the bottleneck during the next 5-10 years.

WP2 Analysis of the plastic packaging
value chain
NEW_InnoNet | H2020 CSA | D 2.4_Report summarising the analysis of the plastic packaging value chain | Page 24 of 30
Table 4: The proposed criteria for the multiple criteria decision analysis
Criteria Measure Interpretation
Losses of plastics in the
recycling system
% The fraction of losses plastics packaging waste in the scenario
comparing to the total mass of plastic packaging waste.
The losses of plastics packaging waste in the scenario is the quantity
of plastic packaging waste that ends up in disposal sites or
incinerations plants.
Losses of plastics:
- direct disposal after collection;
- direct energy recovery, after collection;
- losses of sorting and recycling, inside and outside the EU
(pre-treatment installations and recycling installations).
The total mass plastic packaging waste is 15 876 ktonnes.
Total EU cost of the
recycling scenario per ton
recycled plastic packaging
waste
Euro/ton recycled
plastic packaging
waste
This is the ratio of the total EU cost of the recycling scenario and the
total quantity of recycled material.
The total EU cost of the recycling scenario includes the following:
• cost of collection of generated plastic packaging waste
• + cost of landfilling in the EU
• + cost of energy recovery in the EU
• + cost of pre-treatment
• + cost of recycling
• + cost of transport
These costs do not explicitly include investment costs in new or extra
pre-treatment or recycling facilities
The total quantity of recycled material is the sum of the quantity of
recycled plastics raw material from plastic packaging waste produced
inside the EU and outside the EU.
Total EU revenues of the
recycling scenario per ton
recycled plastic packaging
waste
Euro/ton recycled
plastic packaging
waste
This is the ratio of the total EU revenues of the recycling scenario
and the total quantity of recycled material.
The total EU revenues of the recycling scenario includes the
following:
• price recycled plastics EU
• + price exported materials outside the EU.
These costs do not explicitly include investment costs in new or extra
pre-treatment or recycling facilities
The total quantity of recycled material is the sum of the quantity of
recycled plastics raw material from plastic packaging waste produced
inside the EU and outside the EU.

WP2 Analysis of the plastic packaging
value chain
NEW_InnoNet | H2020 CSA | D 2.4_Report summarising the analysis of the plastic packaging value chain | Page 25 of 30
Criteria Measure Interpretation
Total of GHG emissions
inside the EU due to the
recycling scenario per ton
waste generated
tonnes CO2
eq/ton waste
generated
This is the division of the total GHG emissions inside the EU due to
the recycling scenario and the total quantity of plastic packaging
waste generated.
Total GHG emissions inside the EU due to the recycling scenario are
the GHG emissions of:
• collection;
• + landfill in the EU;
• + energy recovery in the EU;
• + pre-treatment operations;
• + recycling inside the EU;
• + transport to landfill, energy recovery, recyclers and 50% of
transport outside the EU.
The total mass plastic packaging waste generated is 15 876 ktonnes
Employment Jobs/ton recycled Number of jobs (in the EU) per ton plastic recycled
Total jobs Number of jobs (in the EU)
Feasibility A probability estimate,
0 (not possible) – 1
(certain)
How likely the bottleneck could be realistically removed within
the next 5-10 years?
The feasibility attribute is included in order to avoid assigning
most value on alternatives that would have a high impact but
would in reality be very difficult to attain technically,
economically or even socially.
For the quantification of the criteria per bottleneck, an analysis was made of the effect/potential when the
bottleneck would be solved, including all downstream changes/consequences.
In Table 5 an overview is given of a description and the assumptions for both the reference situation (Situation
2012) and the scenario’s with one bottleneck solved.

WP2 Analysis of the plastic packaging
value chain
NEW_InnoNet | H2020 CSA | D 2.4_Report summarising the analysis of the plastic packaging value chain | Page 26 of 30
Table 5: Overview of the different scenarios
Situation 2012 We start with the actual waste generated volume of 15 876 ktonnes. We made a flow diagram on how
the waste is treated in the value chain. Therefore we combined the numbers of the Bio-Deloitte report
on landfill, energy recovery and pre-treatment with those of Eurostat on export of sorted packaging
waste and on recycling in EU Member States.
We took into account that:
100% of the waste is collected, 20% is non-recyclable waste and goes directly to energy recovery or landfill.
After collection of waste:
• 23% of the generated waste goes direct to landfill;
• 26% of the generated waste goes direct to energy recovery;
• 52% of the generated waste is collected separated and goes to a pre-treatment installation.
Pre-treatment has a yield of 82%. From the pre-treatment output
• 20% is exported outside the EU;
• 80% is sent to a recycling plant.
• The losses go to landfill (47% of the losses) or energy recovery (53% of the losses).
Recycling has a yield of 73%.
• The recycling output is sold as recycled plastics.
• The losses go to landfill (47% of the losses) or energy recovery (53% of the losses).
For the cost of the current situation we took into account the cost prices of the Bio-Deloitte report:
• collection cost: 151 €/t;
• landfill cost: 73 €/t;
• energy recovery cost: 74 €/t;
• transport to landfill or energy recovery: 2 €/t. We count this on the total volume sent to landfill
or energy recovery (also volumes of recyclers);
• pre-treatment cost: 185 €/t;
• revenues of export of sorted materials: 288 €/t. This is the average price for sorted materials,
taking into account the composition of packaging waste. (The minimum price is 238 €/t, the
maximum price is 339 €/t).
• recycling cost: 446 €/t;
• transport to recycler: 15 €/t . We only count this one on the total input volume of the pre-
treatment installations;
• revenues recycled plastics: 748 €/t. This is the minimum price of recycled plastics, taking into
account the composition of packaging waste.
To calculate the emissions, we took into account the emissions of the BIO-Deloitte report:
• collection: 17 kg CO2 eq/t;
• landfill: 10 kg CO2 eq/t;
• energy recovery: 2 697 kg CO2 eq/t;
• transport to disposal or energy recovery: 2 kg CO2 eq/t;
• pre-treatment: 26,5 kg CO2 eq/t;
• transport outside EU: 118 kg CO2 eq/t, own estimation, based on the direct emissions of a
seaship (0.00785 kg CO2 eq /tonkm – source: Pré sustainability LCA software SimaPro), and a
distance of 15 000 km oversea. Depending on the place of the harbour, the distance can vary;
• recycling: 403 kg CO2 eq/t;
• transport to recycler: 22 kg CO2 eq/t.
We don’t have a view on the oversea’s recycling rate, therefore, we assume the recycling yield is the
same as inside the EU: 73%. We also assume a comparable fraction of the losses of recyclers is sent to
landfill (47%) and to energy recovery (53%).
As we don’t have knowledge on the recycling yields outside Europe, there is quit some uncertainty on
those numbers.

WP2 Analysis of the plastic packaging
value chain
NEW_InnoNet | H2020 CSA | D 2.4_Report summarising the analysis of the plastic packaging value chain | Page 27 of 30
Limited source
separation of
plastic packaging
waste
When the bottleneck is solved, 100 % of the collected waste must be source separated. The non-
recyclable part (20%) will go directly to landfill (10%) or energy recovery (10%). The recyclable waste
(80% of the collected waste) will be pre-treated.
We assume that the source separation will be done by the producers of waste (households, companies,
etc.). Therefore, we assume this measure will be cost neutral.
We assume that the cost for the collection of source separated waste is the same as for non-separated
waste, as the mass of transported material will be the same. In practice this could be an underestimation
of the real cost.
Furthermore, we assume all (additional) infrastructures for collection, sorting and recycling being
available.
‘Bad’ product
design
When products are designed in a better way (design for recycling), this will increase the pre-treatment
yield. The sector assumes that better design combined with better pre-treatment operations will lead to
an increase of the pre-treatment yield with 8%. We therefore assume half of this could be allocated to
better design.
Export of plastic
packaging waste for
recycling outside
EU
The export of sorted plastic packaging waste outside the EU is stopped. The value of sorted plastic
waste is kept inside the EU, and all plastic packaging waste is recycled in EU.
The costs and benefits for recycling inside or outside the EU are the same (as we do not have any more
accurate information).
We assume all (additional) infrastructures for collection, sorting and recycling being available.
As we all recycling operations take place inside the EU, there will be a better view on the recycling
volumes and rates. Therefore the uncertainty on the numbers in the scenario will be lower.
Performance of
separation/sorting
technology
The sector assumes that better design combined with better pre-treatment operations will lead to an
increase of the pre-treatment yield with 8%. We therefore assume half of this could be allocated to
better design and half to more efficient pre-treatment. This results in a pre-treatment yield of 86%
instead of 82% in the current situation.
Based on expert judgement we assume that
• the cost of the pre-treatment would increase with 2% due to extra infrastructure: pre-
treatment cost: 188.7 €/t;
• the GHG emissions increase with 1%: GHG emission of pre-treatment: 26.8 kg CO2 eq/t.
Motivation for the assumptions:
- in case of free market, the increase in cost price of the recycling yield must be lower than the
increase in amount of pre-treated materials, otherwise it is not economical feasible.
- in case good technology, the impact of better pre-treatment on the GHG emissions must be as
low as possible.
Performance of
recycling
technology
Sector experts assume an increase in recycling efficiency of maximum 5% (from 73% to 78%). We
assume the recycling yield outside Europe will stay the same (73%).
Based on expert judgement we assume that
• the cost of the recycling would increase with 3% due to extra infrastructure: recycling cost:
459,4 €/t;
• the GHG emissions increase with 2%: GHG emission recycling: 411.1 kg CO2 eq/t.
Motivation for the assumptions:
- in case of free market, the increase in cost price of the recycling yield must be lower than the
increase in amount of pre-treated materials, otherwise it is not economical feasible;
- in case good technology, the impact of better recycling on the GHG emissions must be as low
as possible.
Combination 1 Increased pre-treatment yield from 82 to 90% (due to a combination of a better design and a better pre-
treatment yield) + Increased recycling yield of the recycling yield inside Europe to 78%.
(= ‘Performance of separation/sorting technology’ + ‘Performance of recycling technology’)

WP2 Analysis of the plastic packaging
value chain
NEW_InnoNet | H2020 CSA | D 2.4_Report summarising the analysis of the plastic packaging value chain | Page 28 of 30
Combination 2 When different bottlenecks are solved:
• source separation of plastic packaging waste;
• increased pre-treatment yield with 4% due to better design;
• increased pre-treatment yield with 4% due to better pre-treatment;
increased recycling yield
Combination 3 When different bottlenecks are solved:
• source separation of plastic packaging waste;
• increased pre-treatment yield with 4% due to better design;
• increased pre-treatment yield with 4% due to better pre-treatment;
• increased recycling yield;
• export stop.
Combination 4 When different bottlenecks are solved:
• source separation of plastic packaging waste;
• export stop.
For each of these scenario’s the potential related to the described criteria is quantified in Table 6, Table 7 and
Table 8, respectively providing a summary of the impact of the scenarios on the criteria, quantification of the
impacts of the scenarios for solving an individual bottleneck and quantification of the impacts of the
scenarios for solving a combination of bottlenecks (called combined scenarios).
Table 6: Summary of the differences between the current situation (2012) and the scenarios
impact on the quantity of
recycled materials
impact on the costs impact on the GHG emissions
Limited source separation of
plastic packaging waste
100% of the generated waste
will be pre-treated • no impact on the working
cost
• abstraction is made of
the investment costs
no difference
‘Bad’ product design increase of the pre-treatment
yield with 4%
no impact no impact
Export of plastic packaging
waste for recycling outside EU
100% of the pre-treatment
output stays in the EU • no impact on the working
cost
• abstraction is made of
the investment costs
no difference
Performance of
separation/sorting technology
increase of the pre-treatment
yield with 4%
increase of the pre-treatment
costs with 2%
increase of the GHG emissions
of pre-treatment with 1%
Performance of recycling
technology
increase of the recycling yield
with 5% inside the EU
increase of the recycling costs
inside the EU with 3%
increase of the GHG emissions
of recycling in the EU with 2%

NEW_InnoNet | H2020 CSA | D 2.4_ Report summarising the analysis of the plastic packaging value chain | Page 29 of 30
Analysis of the plastic
packaging value chain
HORIZON 2020 | CSA| WASTE-4a-2014I Grant Agreement No. 642231
Table 7: Criteria analysis of the bottlenecks
Losses of plastics
in the recycling
system
Total EU cost of
the recycling
scenario
Total EU
revenues
GHG emissions
inside the EU Employment
Feasibility for
solving the
bottleneck10
% €/ton recycled €/ton recycled
kg CO2 eq/ton
waste generated
Jobs/ton
recycled Total jobs high (5), low (1)
Situation 2012 69% 1.474 676 1.143 79,5 30.979 -
Limited source
separation of plastic
packaging waste
52% 1.212 678 955 78,0 47.244 3
‘Bad’ product design 68% 1.425 676 1.126 77,6 31.735 1
Export of plastic
packaging waste for
recycling outside EU
69% 1.604 748 1.206 71,7 35.111 1
Performance of
separation/sorting
technology
68% 1.430 676 1.127 77,6 31.735 4
Performance of recycling
technology 67% 1.408 679 1.121 74,3 30.952 5

WP2 Analysis of the plastic packaging
value chain
NEW_InnoNet | H2020 CSA | D 2.4_Report summarising the analysis of the plastic packaging value chain | Page 30 of 30
Table 8: Combined scenarios
Losses of plastics
in the recycling
system
Total EU cost of
the recycling
scenario
Total EU
revenues
GHG emissions
inside the EU Employment
% €/ton recycled €/ton recycled
kg CO2 eq/ton
waste generated
Jobs/ton
recycled Total jobs
Combination 1 64% 1.321 679 1.087 71,0 32.461
Combination 2 64% 1.428 748 1.150 64,4 36.989
Combination 3 45% 1.094 679 868 69,8 49.547
Combination 4 44% 1.204 748 966 63,5 56 580