analysis of the radial and tangential soil pressure on
TRANSCRIPT

Analysis of the radial and tangential soil pressure on pipes installed by the pipe jacking method in the Aburrá Valley
Sergio Andrés Otálvaro Velásquez
Universidad EAFIT School of Engineering Medellín, Colombia
2019

ii Analysis of the radial and tangential soil pressure on pipes
installed by the pipe jacking method in the Aburrá Valley
Sergio Andrés Otálvaro Velásquez
In Partial Fulfillment of the Requirements for the Degree Mcs. Engineering (Soil mechanics and foundations)
Director:
Silvana Montoya Noguera
Universidad EAFIT School of Engineering Medellín, Colombia
2019

iii
ACKNOWLEDGMENTS
I want to dedicate this work to the most important people in my life, my parents, my wife and our
expected daughter.
I would like to thank to Empresas Públicas de Medellín and their professionals who helped me
with the information about pipe jacking projects developed in the Aburrá Valley and several
technical aspects of this work.
Special thanks to professor Silvana Montoya Noguera for her support and recommendations during
the development of this work.

iv Summary
In the pipe jacking design, it is required the estimation of radial and tangential pressures exerted
by soil on pipes, to determine the jacking forces that need to be achieve to overcome the frictional
resistance during the installation process.
This document presents theoretical methods that can be used to compute the external pressures on
pipes and jacking forces, especially in cohesionless soils where the frictional component is
determinant in the jacking process. In addition, several analyses are presented of how these
calculations are affected by the variability of the geotechnical parameters of soils in the Aburrá
Valley.
Additionally, a comparison between computed values and field data recorded from two projects
developed in the Aburrá Valley are presented, in order to analyze how well the computed values,
approximate the real data.
The comparison showed that theoretical models tend to overestimate the real behavior recorded in
the projects, however, this overestimation provide a safety factor that must be optimized by the
designer of a future pipe jacking project.
Keywords:
Pipe jacking, radial and tangential soil pressures, jacking force, geotechnical parameters, frictional
resistance, Aburrá Valley.

v
Table of Contents
INTRODUCTION .......................................................................................................................... 1 CHAPTER 1 ................................................................................................................................... 4
1.1 Objectives ....................................................................................................................... 4
1.2 Motivation for study ....................................................................................................... 5 1.3 General context of pipe jacking method ......................................................................... 7 1.4 Pipe jacking general procedure ....................................................................................... 8
CHAPTER 2 ................................................................................................................................. 12 2.1 Theoretical models ........................................................................................................ 12
2.1.1 The jacking forces ..................................................................................................... 12
2.1.2 Tunnel stability ......................................................................................................... 13 2.1.3 Stable soils ................................................................................................................ 15
2.1.4 Unstable soils ............................................................................................................ 19
2.1.5 Prediction of the vertical and horizontal effective stresses on the pipe .................... 22
2.1.6 Angle of friction between pipe and soil 𝜹 ................................................................ 27 CHAPTER 3 ................................................................................................................................. 30
3.1 Aburrá Valley Geography ............................................................................................. 30
3.2 Population growth of the Aburrá Valley ....................................................................... 32 3.3 Geological and geotechnical conditions in the Aburrá Valley ..................................... 33
3.3.1 Geotechnical parameters in Aburrá Valley ............................................................... 34
3.4 Field case histories of pipe jacking in Medellin ........................................................... 39 3.4.1 Centro Parrilla project ............................................................................................... 39
3.4.1.1 Description of the project.................................................................................. 39 3.4.1.2 Geological and geotechnical conditions ........................................................... 42
3.4.1.3 Construction stage ............................................................................................. 45 3.4.2 Interceptor Norte project ........................................................................................... 52
3.4.2.1 Description of the project.................................................................................. 52 3.4.2.2 Geotechnical conditions along the alignment ................................................... 55 3.4.2.3 Construction stage ............................................................................................. 58
CHAPTER 4 ................................................................................................................................. 63 4.1 Analysis of soil pressure on pipes installed by pipe jacking method in Aburrá Valley 63 4.2 Variation of radial stress around the pipe ..................................................................... 63
4.2.1 Radial stress Vs. Bulk unit weight of soil ................................................................. 63 4.2.2 Radial stress Vs. Internal friction angle of soil ......................................................... 65
4.3 Variation of tangential resistance in pipe jacking ......................................................... 66 4.3.1 Variation between jacking force and the bulk unit weight of soil ............................ 66 4.3.2 Variation between jacking force and installation depth ............................................ 68 4.3.3 Variation between jacking force and the pipe diameter ............................................ 69 4.3.4 Comparing computed jacking forces to field data .................................................... 71
4.3.4.1 Comparison in “Centro Parrilla” project........................................................... 71 4.3.4.2 Comparison in the “Interceptor Norte” project ................................................. 73
CHAPTER 5 ................................................................................................................................. 79
5.1 Methodology to compute the jacking force .................................................................. 79

vi 5.1.1 Practical exaple #1 .................................................................................................. 80
5.1.2 Practical example #2 ................................................................................................. 85
CONCLUSIONS AND PERSPECTIVES .................................................................................... 89 REFERENCES ............................................................................................................................. 91
List of tables
Table 1. Pipe and soil information for a case in stable soils using the Newton´s law of friction . 15 Table 2. Pipe and soil information for a case in stable soils using the Haslem method (Haslem,
1986) ..................................................................................................................................... 17
Table 3. Relation (𝛅/𝚽′) for concrete pipe surface and sand. Tomlinson (1969) ....................... 28 Table 4. Aburrá Valley Geographic data. Source: http://datosabiertos.metropol.gov.co/ ............ 30 Table 5. Geotechnical parameters of “Centro Parrilla” project
(Ingetec SA - Ingenieros Consultores, 2013) ........................................................................ 45
Table 6. Information about the segment between C348A and C359A shafts. (Ingetec SA - Ingenieros Consultores, 2013) ........................................................................ 47
Table 7. General information about the “interceptor Norte” project (Consorcio CISE, 2011) .... 53 Table 8. Average geotechnical parameters of “Interceptor Norte” project (GICA, 2011) ........... 58
Table 9. Information about the segment between C14 and C16 shafts of the “Interceptor Norte” project (GICA, 2011) ............................................................................................................ 60
Table 10. Information for example #1 .......................................................................................... 81 Table 11. Geotechnical parameters for example #1 ...................................................................... 83 Table 12. Computed jacking forces in the Aburrá Valley municipalities ..................................... 87

vii List of figures
Figure 1. Underground construction techniques, modified from: ISTT (2018) ............................. 7 Figure 2. Pipe jacking scheme. Modified from (Staheli, 2006) ...................................................... 9 Figure 3. Criteria to select conventional open trench or trenchless installation. Modified from
(Balairón Pérez, 2002) .......................................................................................................... 11 Figure 4. Jacking forces during pipe Jacking. Modified from (Staheli, 2006) ............................. 12
Figure 5. (a) Pipe on stable soil. (b) Pipe on unstable soil. Modified from (Milligan and Norris, 1999) ..................................................................................................................................... 14
Figure 6. Contact area between the pipe and soil in Haslem method (Haslem, 1986) ................. 18 Figure 7. Soil stresses on a pipe. Modified from (Ripley, 1989) .................................................. 20 Figure 8. Mohr's circle of stresses on the pipe. Modified from (Ripley, 1989) ............................ 21
Figure 9. Arching in cohesionless soils. Modified from (Terzaghi, 1943) ................................... 23
Figure 10. Ground loading from Auld model. Modified from (Milligan and Norris, 1999) ........ 24 Figure 11. Stress model in DWA-A 161 Standard. Modified from DWA-A 161 (2014) ............ 27
Figure 12. Aburrá Valley configuration. Modified from: http://datosabiertos.metropol.gov.co/ . 31
Figure 13. Aburrá Valley relief. Source: (Google maps, 2019) .................................................... 32 Figure 14. Geomorphology of the Aburrá Valley. Modified from:
http://datosabiertos.metropol.gov.co/.................................................................................... 33 Figure 15. Angle of friction variation in Aburrá Valley. Modified from: “Armonización de la
microzonificación sísmica de los municipios del Valle de Aburrá (Universidad de Los Andes, 2016)” ....................................................................................................................... 35
Figure 16. Bulk unit weight of soil in Aburrá Valley. Modified from: “Armonización de la microzonificación sísmica de los municipios del Valle de Aburrá, (Universidad de Los Andes, 2016)” ....................................................................................................................... 36
Figure 17. Water table variation in Aburrá Valley. Modified from: “Armonización de la microzonificación sísmica de los municipios del Valle de Aburrá, (Universidad de Los Andes, 2016)” ....................................................................................................................... 37
Figure 18. Cohesion of soil in Aburrá Valley. Modified from: “Armonización de la microzonificación sísmica de los municipios del Valle de Aburrá, (Universidad de Los Andes, 2016)” ....................................................................................................................... 38
Figure 19. Google map view (GICA, 2011)of “Centro Parrilla” Project. Green: Metro lines. Blue: Santa Elena Creek. Dotted-red: Project borders. Modified from: (Gutierrez, 2015) .. 40
Figure 20. Launch shaft, concrete pipes and hydraulic jacks used in “Centro Parrilla” Project. Modified from: EPM photographic record ........................................................................... 41
Figure 21. Geology of “Centro Parrilla” Project (Ingetec SA - Ingenieros Consultores, 2013)... 42 Figure 22. Geotechnical zones of “Centro Parrilla” Project (Ingetec SA - Ingenieros Consultores,
2013) ..................................................................................................................................... 44 Figure 23. Typical segment of pipe jacking in “Centro Parrilla” Project (EPM-51MED23-07RE-
0337, 2013) ........................................................................................................................... 46 Figure 24. Segment between C348A and C359A shafts in “Centro Parrilla” Project. (EPM-
51MED23-07RE-0337, 2013)............................................................................................... 47 Figure 25. Behavior of the predicted and real jacking forces. Modified form (Milligan & Norris,
Pipe-soil interaction during pipe jacking, 1999) ................................................................... 49 Figure 26. Jacking forces between C348A and C359A shafts in “Centro Parrilla” Project. ........ 51 Figure 27. Google map view of “Interceptor Norte” Project. Modified from: (GICA, 2011) ...... 53
viii Figure 28. River and Metro line crossing “Interceptor Norte” Modified from: EPM
photographic record .............................................................................................................. 54
Figure 29. Typical shaft, TBM, hydraulic jacks and concrete pipe used in the “Interceptor Norte” project Modified from: EPM photographic record ............................................................... 55
Figure 30. Geotechnical profile along the “Interceptor Norte” project (GICA, 2011) ................. 56 Figure 31. Profile view of the segment between C14 and C16 shafts in the “Interceptor Norte”
project. .................................................................................................................................. 58
Figure 32. Intermediate jacking stations in the Interceptor Norte project. ................................... 59 Figure 33. Jacking forces between C14 and C16 shafts in “Interceptor Norte” Project. .............. 61 Figure 34. Typical radial stress variation around the pipe during pipe jacking (unstable soils). . 64 Figure 35. Radial stress distribution around the pipe. .................................................................. 64 Figure 36. Radial stress Vs Internal angle of friction for soil ....................................................... 65
Figure 37. Jacking force Vs length between shafts, for typical values of the bulk unit weight of soil in Aburrá Valley ............................................................................................................. 67
Figure 38. Jacking force (Fr) Vs Bulk unit weight of soil (γ)....................................................... 68
Figure 39. Jacking force variation with the installation depth of pipe .......................................... 69
Figure 40. Jacking force variation for different pipe diameters .................................................... 70 Figure 41. Jacking force Vs Pipe diameter ................................................................................... 70
Figure 42. Field jacking force and computed jacking force in “Centro Parrilla” project ............. 72 Figure 43. Field jacking force of the main jack (segment between C14 and C16 shafts).
Interceptor Norte project (Ingetec SA, 2013) ....................................................................... 75
Figure 44. Field jacking force and computed jacking force in the “Interceptor Norte” project ... 76 Figure 45. Plan view of the project for example #1 ...................................................................... 81
Figure 46. Schematic profile view of the project for example #1 ................................................ 82 Figure 47. Computed jacking force in example #1 ....................................................................... 83
Figure 48. Variation for jacking force with γ in example #1 ........................................................ 84

ix List of symbols and abbreviations
Symbol Definition Units Equation
Ac Contact area between pipe and soil m b Width of the contact area between pipe and soil m 2.2 B Width of affected ground m 2.12, 2.13 c’ Effective cohesion of the soil kPa Dc Internal diameter of the tunnel m De External diameter of the pipe m Di Internal diameter of the pipe m Ce Ratio between Poisson ratio for the soil/pipe and
Elastic moduli of the soil/pipe 1/kPa 2.4
Ep Elastic moduli of the pipe kPa Es Elastic moduli of the soil kPa f´c Compressive strength of concrete MPa Fr Frictional resistance per unit length kN/m 2.1, 2.7 g Gap between pipe and soil (in diameter) m H Depth of the pipe crown m H1 Depth of the water table m Ko Coefficient of earth pressure Lu Length of a single pipe m Lt Total length of pipe between shafts m kd Ratio between external diameter of the pipe and
internal diameter of the tunnel m 2.3
Pr Normal load on pipe induced by the soil kN/m 2.6 Pu Contact force between pipe and soil per unit
length kN/m
q Surcharge on the ground surface kPa R External radius of the pipe m Su Undrained strength of the soil kPa t Pipe thickness m W Weight of the pipe per unit length kN/m z Depth from the ground surface m

x
Symbol Definition Units Equation
α Angle at any point of the circumference of the pipe
º
γ Bulk unit weight of the soil kN/m3 γ' Submerged unit weight of the soil kN/m3 γw Unit weight of water kN/m3 δ Angle friction between pipe and soil º
λ Reduction factor for effective vertical stress on pipe caused by soil
2.15
λo Reduction factor for surcharge 2.16 νp Poisson ratio for pipe
νs Poisson ratio for soil
σr' Effective radial stress on pipe by the soil kPa 2.5 σh' Effective horizontal stress in soil kPa 2.11 σv' Effective vertical stress in soil kPa 2.9 τ Shear stress in soil kPa Φ’ Effective internal angle of friction of the soil °

1
INTRODUCTION
The installation of new pipelines in urban environments is a complex activity because not
only there is not enough space in the cities, which brings problems with the pedestrian and
vehicular traffic, but also because of the numerous intersections of different utilities in the
underground (pipes of water, sewer, gas, electrical conduits and optical fiber, etc.). For this
reason, engineers have been developing new methods like trenchless technologies. This
development includes manufacturing new materials for pipes and their joints, sophisticated
microtunneling equipment, inspection technologies and renewal methods in all areas of
water, sewer, gas and other applications.
The International Society for Trenchless Technology (ISTT, 2018), defines trenchless as
“all the techniques that involves the installation, replacement or renewal of underground
utilities with minimum excavation and surface disruption”. Those techniques can be used
for all underground utilities.
One of the most interesting methods of trenchless is “pipe jacking”. This technique is a
good option for new installation of pipes in big cities because it causes minimum
disturbance during construction that represents an advantage for the traffic flow causing
small or no impact to the local economy in the project area. Furthermore, pipe jacking is
an environmental friendly method compared with the conventional trench excavation for
pipe installation, because it reduces the quantity of the excavated material and it has a low
impact on the existing infrastructure. In addition, the pipe jacking method has a minimum
noise impact in the project area (ISTT, 2018).

2
Due to the technical, environmental and social advantages of pipe jacking, this method is
becoming increasingly important for the installation of new service pipes and sewer pipes
throughout the world. The Aburrá Valley in Antioquia department of Colombia is one of
the metropolitan areas where this technology is being used.
The pipe jacking method requires a good knowledge of the geological and geotechnical
conditions, because the tunnel excavation can produce, among others, soil deformations,
settlements, tunnel instability, ground closure and local interface stresses between the pipe
and soil (radial and tangential soil pressure on pipes). These problems need to be studied
and must be properly solved especially in urban areas, where the excessive deformation
and settlements in the soil could cause building foundation damages, rupture of existent
water pipes, sewer, gas or electrical conduits, damages in road pavements and impacts on
the pipe jacking installation process (Milligan & Norris, 1993).
The purpose of this document is to analyses how the radial and tangential soil pressure
impact the pipe jacking installation process, especially for projects that could be planned
in the future in different areas in the Aburrá Valley. This topic is important for a good
planning, design and construction process.
The document is divided in five chapters. The first one presents the objectives, the general
context of the pipe jacking method and its construction procedure. In chapter two, a
literature review is presented about the distribution of normal and tangential stresses on
pipes due to the soil pressure. The third chapter is about the Aburrá Valley geotechnical
soil conditions and the pipe jacking projects developed in the Aburrá Valley in recent years.
Chapter four presents the effect and influence of geotechnical parameters in the calculation

3
of soil pressures on pipes and the jacking forces required for installation. The fifth chapter
summarizes the results of chapter four and presents some practical examples in the Aburrá
Valley for pipe jacking projects using geotechnical information presented in chapter three.
Finally, conclusions and recommendations are presented in order to have information that
help designers and planners to compute an approximated value of jacking forces required
in a future pipe jacking project in the Aburrá Valley.

4
CHAPTER 1
1.1 Objectives
General objective:
Analyze how the geotechnical parameters of soils in the Aburrá Valley impacts the
calculation of radial and tangential pressures on pipes installed by the pipe jacking method.
Specific objectives:
Study theoretical models to calculate the radial and tangential stresses on pipes due
to the soil pressure during pipe jacking installation.
Review of geotechnical soil conditions in the Aburrá Valley and the pipe jacking
projects developed in recent years in this metropolitan area.
Analyze the influence and variability of geotechnical parameters on the pressure
distributions on pipes installed by the pipe jacking method and the jacking forces
required for installation.
Present a methodology for the calculation of the jacking forces for different soil
types, pipe diameters and installation depths in future projects of pipe jacking in
the Aburrá Valley.
Conclusions and perspectives for future projects and investigation about the pipe
jacking in the Aburrá Valley.

5
1.2 Motivation for study
Medellín is located in the Aburrá Valley in the center of the Antioquia department of
Colombia. This city is part of a group of ten municipalities called “the metropolitan area
of the Aburrá Valley” (Área Metropolitana del Valle de Aburrá - AMVA, 2006). The
municipalities are: Caldas, La Estrella, Sabaneta, Itagüí, Envigado, Bello, Copacabana,
Girardota, Barbosa and Medellín.
The total area of the metropolitan area is about 1165 km2 (including rural and urban areas),
its population in 2018 was 3.72 million and the projected population in 2030 is about
4.5 million people (Departamento Administrativo Nacional de Estadística (DANE) , 2018).
In the last 15 years, the local public service company for the Aburrá Valley called Empresas
Públicas de Medellín (EPM) has been working in the use of trenchless for water and sewer
projects. EPM has received many suppliers of these technologies and has developed
projects like Centro Parrilla, which is a rehabilitation and renovation project of the
Medellin downtown networks of sewerage and potable water, using trenchless techniques
like: horizontal directional drilling, pipe ramming, cured in place pipe (CIPP), pipe
bursting, close fit sliplining and pipe jacking (Montoya, 2017).
Rehabilitation and new installation of pipes in Aburrá Valley using trenchless technologies,
especially pipe jacking, requires a good estimation of ground deformations and soils
pressures on pipes, because the tunnel stability can cause sudden collapses that may
damage tunneling machinery, ground movements above the pipe may cause damage in
existent building foundations, road pavements and other services pipes (Milligan & Norris,
6
1993). In addition, a ground collapse onto the pipe will increase the resistance to jacking
and lead excessive jacking forces during construction.
Due to the increasing use of these trenchless technologies in the Aburrá Valley, there is a
necessity to understand different technical aspects of trenchless technologies, in order to
have valuable information that help planners and designers of water and sewer services to
use these techniques in future projects in the metropolitan area.
This document is focused in a specific topic of the pipe jacking method applied to the local
conditions of soils in the Aburrá Valley, which is the evaluation and analysis of the radial
and tangential soil pressures for different soil types.
It is important to evaluate the variation of the soil pressures in different soil types because
the stability of the tunnel depends on the type of material excavated. For example, granular
materials whether in dry or fully saturated condition are considered unstable as the hole
will tend to close and collapse onto the pipe. In contrast, in fine soils the cohesion between
particles can help to maintain temporary stability of the hole during the construction
process (Milligan and Norris, 1999).
The estimation of the radial and tangential soil pressures allows determining the jacking
forces involved in the installation process. In turn, the quantification of these forces is
essential in the different phases of pipe jacking projects – planning, designing and
constructing (Staheli, 2006). For instance, the definition of the distance between the launch
and the receiving shaft depends on the jacking forces. In addition, the hydraulic jacks
capacity for pushing the pipes depends on those forces. Finally, the need of intermediate

7
jacking stations depends on the magnitude of the jacking forces and the distance between
shafts.
1.3 General context of pipe jacking method
According to the classification of The International Society for Trenchless Technology
(ISTT, 2018), pipe jacking is a new installation of trenchless technique, as is shown in
Figure 1.
Figure 1. Underground construction techniques, modified from: ISTT (2018)
Pipe jacking is a trenchless method for installation of new pipes, and it is differentiated
from conventional tunneling by the soil support structure. In pipe jacking methods, the
pipes are installed at the same time the soil is excavated. In contrast, in a conventional

8
tunnel, first, the tunnel is excavated and the internal perimeter of the hole is lined with a
liner system (prefabricated concrete plates, steel ribs, etc). After the excavation and
installation of the liner system, the pipe sections are transported one by one and installed
into the tunnel. Both pipe jacking method and conventional tunneling can use the same
excavation system such as the tunnel boring machine (TBM) or the earth-pressure balance
machine (EPBM) (Najafi, 2010).
1.4 Pipe jacking general procedure
In this method of installation, a prefabricated pipe sections are jacked or pushed behind the
TBM or EPBM, and one of its principal advantages is that during the excavation process
no personnel are required into the tunnel, therefore the risk of accidents is minimized
considerably.
Pipe jacking starts with the construction of a launch shaft and a receiving shaft. These are
constructed to the designed pipeline depth. The distance between shafts depends on the
pipe diameter and the force required to overcome the forces associated with face pressures
on the machine and friction between soil and pipe (Staheli, 2006).
In the launch shaft, a jacking frame and the hydraulic jacks for pushing the pipes are
installed. Additionally, a thrust block in concrete is built on the wall of the shaft for
receiving the stress from the hydraulic jacks.
Some auxiliary components like a discharge pump, a laser guidance system, conveyor and
supply pipes are placed into the launch shaft. Some components for the work are placed
outside of the launch shaft, for instance: a control container where the operator controls the

9
alignment of the boring machine and the hydraulic jack, a spoil removal system (conveyor
belt and haul units), and a sedimentation tank for excavated material storage.
The pipes are introduced into the launch shaft and the hydraulic jacks push them into the
tunnel behind the boring machine (see Figure 2). One common practice to help the pipe
slip easily through the tunnel is to place grout plugs in each section of pipe, these plugs are
used to pump lubricants around the outside of the pipe during the jacking operation.
Sometimes it is possible to use intermediate jacking stations that can be incorporated into
the pipe at a distance behind the microtunneling machine. This intermediate jacking station
can help to reduce the total jacking force of the main hydraulic jack located in the launch
shaft. The pipes sections are then pushed between the intermediate station and the tunneling
boring machine.
Figure 2. Pipe jacking scheme. Modified from (Staheli, 2006)

10
The external diameter of the intermediate jacking station must be equal to the external
diameter of the pipe, and the number of these stations needs to be computed according to
the jacking forces to overcome (Staheli, 2006). Normally, there is a gap between the
external diameter of the pipe and the face of the excavated hole made by the (TBM or
EPBM). This gap is referred to the over cut or annular space (Reyes, 2017).
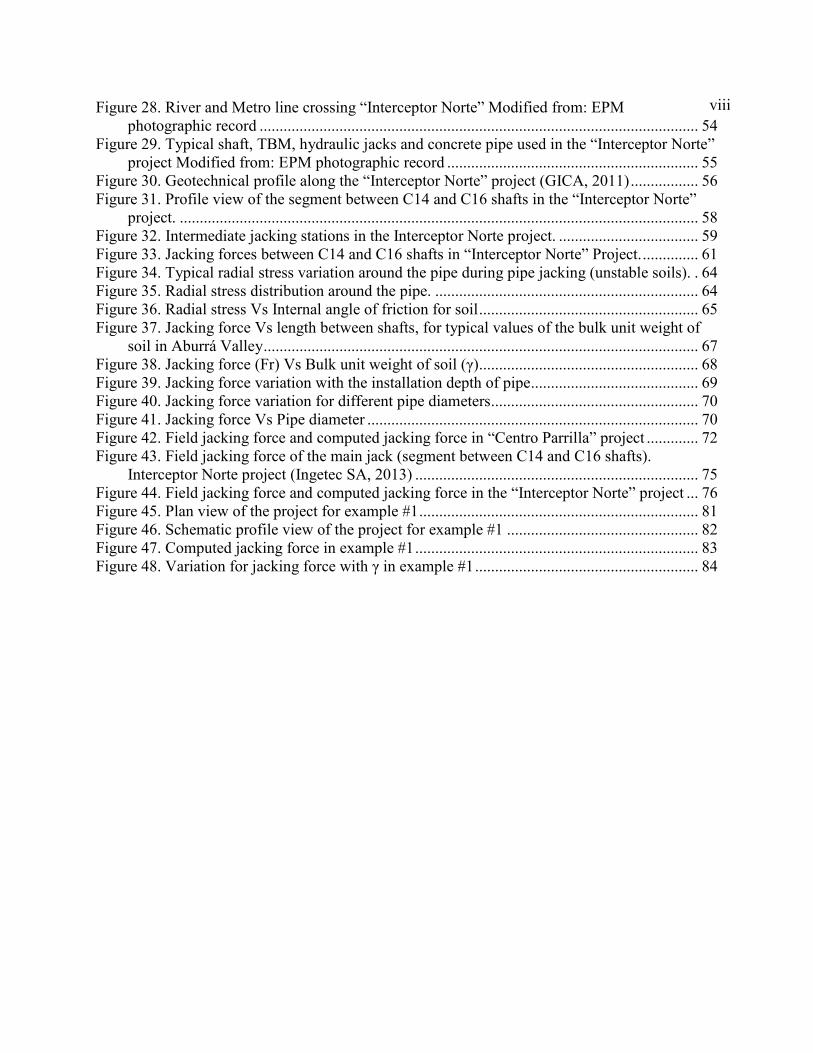
Pipe jacking typical diameters of installation range between 0.40 m and 3.05 m. However,
diameters are not limited to those values, because this type of technology is being
developed every day and can be adapted according to the need. Some authors (Ueki, M;
Hass, C; Seo, J, 1999) have proposed general criteria based in economic aspects to select
the most convenient method of pipe installation. Figure 3, shows the combination of pipe
diameter and installation depth that make the trenchless technology like pipe jacking
economically more advantageous.
11
Figure 3. Criteria to select conventional open trench or trenchless installation. Modified from (Balairón
Pérez, 2002)

12
CHAPTER 2
2.1 Theoretical models
2.1.1 The jacking forces The jacking force that needs to be applied in pipe jacking is composed by two components:
the face pressure acting in the front of the excavation due to the soil and water (if the tunnel
is under the water table), and the second component is the tangential pressure due to the
friction between the soil and pipe (see Figure 4).
Figure 4. Jacking forces during pipe Jacking. Modified from (Staheli, 2006)
The face pressure is balanced by pumping slurry to the front of the tunnel-boring machine
to contain the groundwater and earth pressure. This equilibrium depends on the machine
operation and its advance speed. If the operational speed is high, the face pressure will
increase and the machine may be damaged. On the other hand, if the speed is too slow the

13
material at the front may slide into the excavation. Because of this, the face pressure acting
on the TBM or EPBM shield remains between the active and passive earth pressure.
In general, projects experiences around the world has shown that face pressure represents
a low contribution in the total jacking force, and this condition is adjusted during
construction by the machine operation, who is responsible for the speed and advance rates
(Staheli, 2006).
Tangential pressure or frictional resistance is the second component in the jacking force
evaluation. This is the resistance caused by the friction between the soil and pipe and its
magnitude depends on the tunnel stability.
2.1.2 Tunnel stability Depending on the material excavated, the opening in the soil may be stable or unstable. If
the soil is stable, the excavation will stay open temporarily and the pipes can slide into the
tunnel, but if the soil is unstable, the soil can collapse onto the pipe. As a result, a radial
soil pressure is generated and the resistance to jacking will increase (see Figure 5).
In pipe jacking installation, it is convenient to have a larger diameter in the excavation hole
respect to the external pipe diameter, the reason of this is to allow the pipe to slide easily
into the tunnel. This gap usually is about 10-20 mm in diameter (Milligan and Norris,
1999).

14
Figure 5. (a) Pipe on stable soil. (b) Pipe on unstable soil. Modified from (Milligan and Norris, 1999)
Notation:
Dc: Internal diameter of the tunnel
De: External diameter of the pipe
H: Depth of the pipe crown
H1: Depth of the water table
Bentonite is injected for lubrication in stable cases, to facilitate the slide of the pipe surface
into the tunnel. This bentonite must be design and its injection pressure needs to be
controlled to ensure the stability of the excavation.
When the soil collapses onto the pipe, the use of bentonite has less effect in lubrication,
and depending on the soil type it may cause problems for the tunnel stability.

15
2.1.3 Stable soils
Tunnels excavated in clay soils tend to be stable due to cohesion, and it will stay open
temporally, so the pipes can slide easily along the tunnel. In this case, there are two models
of analysis to calculate the frictional resistance.
The first model, and the most accepted, assumes that the contact between the pipe and the
soil is purely frictional and the resistance is given by the Newton’s law of friction:
𝐹𝑟 = 𝑊 ∙ tan(𝛿) (2.1)
Where:
Fr: Frictional resistance per unit length (kN/m)
W: Weight of the pipe per unit length (kN/m)
𝛿: Angle of friction between pipe and soil (º)
To illustrate this, consider a project with the following information:
Table 1. Pipe and soil information for a case in stable soils using the Newton´s law of friction
Pipe Material Reinforced concrete (f'c= 42 MPa) Internal diameter Di 1.50 m Pipe thickness t 0.15 m Weight per unit length of pipe W 17.88 kN/m Length of a single pipe Lu 2.50 m Length of pipe between shafts Lt 100 m
Soil
Type of soil along the pipe alignment Medium-stiff clay
Angle of friction between pipe and soil δ 19°

16
Frictional resistance is computed according to equation (2.1):
𝐹𝑟 = 𝑊 ∙ tan(𝛿)
𝐹𝑟 = 17.88𝑘𝑁/𝑚 ∙ tan(19°) = 6.16𝑘𝑁/𝑚
The force required to move the pipe in the total length between shafts will be:
𝐹𝑟𝑡 = (6.16𝑘𝑁/𝑚) ∙ (100𝑚) = 616𝑘𝑁
In cohesive soils, a portion of the resistance to the movement of the pipe is the adhesion
between the pipe and the soil. There is another model proposed by (Haslem, 1986) which
assumes a cohesive interaction between pipe and soil, with the resistance per unit contact
area related to the undrained strength of soil. Haslem suggested that the width (b) of the
contact area between pipe and soil should be the solution for elastic contact between two
curved surfaces:
𝑏 = 1.6(𝑃𝑢𝑘𝑑𝐶𝑒)0.5 (2.2)
where:
b: Width of the contact area between pipe and soil (m)
Pu: Contact force per unit length between pipe and soil per unit length (kN/m)
kd: Ratio between external diameter of the pipe and internal diameter of the tunnel (m)
(equation 2.3)
Ce: Ratio between Poisson ratio for the soil/pipe and Elastic moduli of the soil/pipe (1/kPa)
(equation 2.4)
De: External diameter of the pipe (m)
Dc: Internal diameter of the tunnel (m)
Es: Elastic moduli of the soil (kPa)

17
Ep: Elastic moduli of the pipe (kPa)
𝜈𝑠: Poisson ratio for soil
𝜈𝑝: Poisson ratio for pipe
𝑘𝑑 =𝐷𝑐𝐷𝑒
(𝐷𝑐−𝐷𝑒) (2.3)
𝐶𝑒 =(1−𝜈𝑠
2)
𝐸𝑠+
(1−𝜈𝑝2)
𝐸𝑝 (2.4)
To illustrate the second method, consider the same project described in Table 1.
Additionally, consider the following information:
Table 2. Pipe and soil information for a case in stable soils using the Haslem method (Haslem, 1986)
Pipe data Material Reinforced concrete Elastic moduli of the pipe (concrete f'c= 42 MPa) Ep 30500 MPa Poisson ratio for pipe νp 0.2 Internal diameter of the pipe Di 1.50 m Pipe thickness t 0.15 m External diameter of the pipe De 1.80 m Contact force between pipe and soil per unit length (equal to the weight per unit length of pipe) Pu 17.88 kN/m
Length of a single pipe Lu 2.50 m
Length of pipe between shafts Lt 100 m
Gap between pipe and soil (in diameter) g 0.05 m Soil data
Type of soil along the pipe alignment Medium-stiff clay Elastic moduli of the soil Es 15000 kPa Poisson ratio for soil νs 0.4 Undrained strength of the soil Su 20 kPa Internal diameter of the tunnel Dc 1.85 m

18
Computing the parameters kd and Ce:
𝑘𝑑 =𝐷𝑐𝐷𝑒
(𝐷𝑐 − 𝐷𝑒)=
(1.85𝑚) ∙ (1.80𝑚)
(1.85𝑚 − 1.80𝑚)= 66.60𝑚
𝐶𝑒 =(1 − 𝜈𝑠
2)
𝐸𝑠+(1 − 𝜈𝑝
2)
𝐸𝑝=
(1 − 0.402)
15000𝑘𝑃𝑎+
(1 − 0.202)
30500000𝑘𝑃𝑎= 0.000056
𝑘𝑃𝑎⁄
This model assumes that the interaction between pipe and soil is cohesive, with the
resistance per unit contact area related to the undrained strength of the soil (Milligan &
Norris, 1999).
Then:
𝑏 = 1.6(𝑃𝑢𝑘𝑑𝐶𝑒)0.5 = 1.6 [(17.88𝑘𝑁/𝑚) ∙ (66.6𝑚) ∙ (0.000056 𝑘𝑃𝑎⁄ )]0.5 = 0.41𝑚
The contact area between the pipe and soil along the entire length between shafts is:
𝐴𝑐 = 𝑏 ∙ 𝐿𝑡 = (0.41𝑚)(100𝑚) = 41𝑚2
Figure 6. Contact area between the pipe and soil in Haslem method (Haslem, 1986)

19
The undrained resistance Su is assumed equal to the cohesion value in the Mohr-Coulomb
envelope for total stress. For this example, the value of (Su) will be 20 kPa.
Then, the force required to move the pipe in the total length between shafts will be:
𝐹𝑟𝑡 = 𝐴𝑐 ∙ 𝑆𝑢 = (41𝑚2)(20𝑘𝑃𝑎) = 820𝑘𝑁
The difference between the two methods for stable soils is because the first model assumes
that the contact between pipe and soil is purely frictional and the second assumes that the
interaction is cohesive.
It is a normal construction practice to fill the gap between the pipe and soil with bentonite,
to reduce the frictional resistance to jacking. Under this condition, the pipe will be partially
buoyant and its weight will become smaller than the normal pipe weight.
2.1.4 Unstable soils When a tunnel is excavated in dry or completely saturated cohesionless soils, the
excavation does not have the capability to be stable and the material tends to close around
the pipe generating a radial stress, which is normal to the pipe surface. This stress will
increase the frictional resistance and the jacking force (Milligan and Norris, 1999).
Radial effective stresses on a pipe due to the imposed soil stresses are given by:

20
Figure 7. Soil stresses on a pipe. Modified from (Ripley, 1989)
Where:
R: External radius of the pipe (m)
𝛼: Angle at any point of the circumference of the pipe (°)
𝛾: Bulk unit weight of the soil (kN/m3)
𝜎′𝑣: Vertical effective stress at centroid of the pipe (kPa)
𝐾𝑜: Coefficient of earth pressure

21
Figure 8. Mohr's circle of stresses on the pipe. Modified from (Ripley, 1989)
Using Mohr’s circle to calculate the radial stress at any point:
𝜎′𝑟 = [(𝜎′𝑣 + 𝛾𝑅𝑆𝑒𝑛𝛼) + 𝐾𝑜(𝜎′𝑣 + 𝛾𝑅𝑆𝑒𝑛𝛼)
2] + {[
(𝜎′𝑣 + 𝛾𝑅𝑆𝑒𝑛𝛼) − 𝐾𝑜(𝜎′𝑣 + 𝛾𝑅𝑆𝑒𝑛𝛼)
2] 𝐶𝑜𝑠(𝜋 − 2𝛼)}
𝜎′𝑟 = (
𝜎′𝑣+𝛾𝑅𝑆𝑒𝑛𝛼
2) (1 + 𝐾𝑜 − (1 − 𝐾𝑜)𝐶𝑜𝑠2𝛼) (2.5)
Evaluating: α = π/2, 𝜎′𝑟 = 𝜎′𝑣 + 𝛾𝑅 α = 0, 𝜎′𝑟 = 𝐾𝑜𝜎′𝑣 α = -π/2, 𝜎′𝑟 = 𝜎′𝑣 − 𝛾𝑅 The normal load induced on pipe by the radial stress is given by:
𝑃𝑟 = 2∫ 𝜎′𝑟𝑅𝑑𝛼𝜋/2
−𝜋/2

22
𝑃𝑟 = 2∫ 𝑅 (𝜎′𝑣 + 𝛾𝑅𝑆𝑒𝑛𝛼
2) (1 + 𝐾𝑜 − (1 − 𝐾𝑜)𝐶𝑜𝑠2𝛼)𝑑𝛼
𝜋/2
−𝜋/2
𝑃𝑟 = 𝑅∫ 𝜎′𝑣(1 + 𝐾𝑜 − (1 − 𝐾𝑜)𝐶𝑜𝑠2𝛼) + 𝛾𝑅𝑆𝑒𝑛𝛼(1 + 𝐾𝑜) − 𝛾𝑅(1 − 𝐾𝑜)(𝑆𝑒𝑛𝛼𝐶𝑜𝑠2𝛼)𝑑𝛼𝜋/2
−𝜋/2
𝑃𝑟 = 𝑅 [𝜎′𝑣(1 + 𝐾𝑜)𝛼 − 𝜎′𝑣(1 − 𝐾𝑜)𝑆𝑒𝑛2𝛼
2− 𝛾𝑅𝐶𝑜𝑠𝛼(1 + 𝐾𝑜) + 𝛾𝑅(1 − 𝐾𝑜) (
𝐶𝑜𝑠3𝛼
6−𝐶𝑜𝑠𝛼
2)]
𝑃𝑟 = 𝜋𝑅𝜎′𝑣(1 + 𝐾𝑜)
Considering:
𝜎′ℎ = 𝐾𝑜𝜎′𝑣 ∴ 𝑅 = 𝐷𝑒/2
𝑃𝑟 =𝜋𝐷𝑒
2(𝜎′𝑣 + 𝜎′ℎ) (2.6)
Pr is de total force due to the radial stresses caused by soil, and the jacking force required
to push the pipe under this radial force is given by:
𝐹𝑟 =𝜋𝐷𝑒
2(𝜎′𝑣 + 𝜎′ℎ) tan 𝛿 (2.7)
Where (δ) is the angle of friction between the pipe and soil.
2.1.5 Prediction of the vertical and horizontal effective stresses on the pipe
Many researchers have been studying the calculation of the stresses acting on the pipe. One
of the most accepted theories of how the soil stresses are distributed on the pipe was
presented by Auld (1982). Auld presented a model based in the Terzaghi arching theory.

23
Terzaghi developed a test in which he observed the behavior of a sand in a large box that
contained a small trap door in the base. If the trap door is closed, the vertical stress per unit
of area on the horizontal support is equal to the depth of the layer of sand times the bulk
unit weight of the sand. However, when the trap door is slowly removed at the base of the
box, the sand located above the strip started to yield. As a result, the vertical stress
decreases an amount equal to the vertical component of the shearing resistance which acts
on the boundaries of the yielding zone. Then, the adjoining stationary parts of that yielding
zone increases the vertical stress in the same amount (see Figure 9). This transfer of
pressure from a yielding mass of soil to the adjoining stationary parts is commonly called
the arching effect (Terzaghi, 1943).
Figure 9. Arching in cohesionless soils. Modified from (Terzaghi, 1943)
Based on the Terzaghi’s model, many researchers have used the arching theory to calculate
the normal stress acting on the pipe during pipe jacking. Most of the researchers correlated
the trap door width to the pipe diameter (Staheli, 2006).

24
Auld (1982) represented a pipe installed in cohesionless soil that collapsed onto the pipe
exerting a normal stress on it (see Figure 10).
Figure 10. Ground loading from Auld model. Modified from (Milligan and Norris, 1999)
Where:
𝜏 = 𝑐′ + 𝜎′ℎtan(𝜙′)
𝜎′ℎ = 𝐾𝜎′𝑣
c’= Efective cohesion of the soil (kPa)
q: Surcharge at the ground surface (kPa)
B: Width of the affected ground (m)
Φ’: internal angle of friction for soil (°)
γ’: Submerged unit weight = γ - γw (kN/m3)

25
γ: Bulk unit weight of soil (kN/m3)
γw: Unit weight of water (kN/m3)
Ko: Coefficient of earth pressure
De: External diameter of the pipe (m)
The total force due to the radial stresses is given by equation 2.7:
𝐹𝑟 =
𝜋𝐷𝑒
2(𝜎′𝑣 + 𝜎′ℎ) tan 𝛿 (2.7)
To determine σv’ and σh’, a vertical equilibrium of a differential layer of soil below the
water table can be done:
∑𝑉𝑒𝑟𝑡𝑖𝑐𝑎𝑙𝑓𝑜𝑟𝑐𝑒𝑠 = 0
2𝐵𝜎′𝑣 + 2𝐵𝛾′𝛿𝑧 − 2𝐵(𝜎′𝑣 + 𝛿𝜎′𝑣) − 2𝜏𝛿𝑧 = 0 (2.8)
Rearranging and substituting equation (2.8):
2𝐵𝜎′𝑣 + 2𝐵𝛾′𝛿𝑧 − 2𝐵(𝜎′𝑣 + 𝛿𝜎′𝑣) − 2𝑐´𝛿𝑧 − 2𝐾𝑜𝜎′𝑣 tan(𝜙
′) 𝛿𝑧 = 0
𝜎′𝑣 + 𝛾′𝛿𝑧 − 𝜎′𝑣 − 𝛿𝜎′𝑣 −𝑐´
𝐵𝛿𝑧 −
𝐾𝑜𝐵𝜎′𝑣 tan(𝜙
′) 𝛿𝑧 = 0
𝛾′𝛿𝑧 −𝑐´
𝐵𝛿𝑧 −
𝐾𝑜𝐵𝜎′𝑣 tan(𝜙
′) 𝛿𝑧 = 𝛿𝜎′𝑣
(𝛾′ −𝑐´
𝐵−𝐾𝑜𝐵𝜎′𝑣 tan(𝜙
′)) 𝛿𝑧 = 𝛿𝜎′𝑣
Solving this equation and integrating:
𝜎′𝑣 =𝐵(𝛾′−𝑐´ 𝐵⁄ )
𝐾𝑜∙𝑡𝑎𝑛(𝜙′)(1 − 𝑒−
(𝑧−𝐻1)𝐾𝑜𝑡𝑎𝑛(𝜙′)
𝐵 ) + 𝜎′𝑣1 ∙ 𝑒−(𝑧−𝐻1)𝐾𝑜𝑡𝑎𝑛(𝜙
′)
𝐵 (2.9)

26
The value of 𝜎′𝑣1 is found from a similar analysis for the soil above the water table, using
the bulk unit weight of the soil (ϒ) rather than the submerged unit weight (ϒ’):
𝜎′𝑣1 =𝐵(𝛾−𝑐´ 𝐵⁄ )
𝐾𝑜∙𝑡𝑎𝑛(𝜙′)(1 − 𝑒−
𝐻1𝐾𝑜𝑡𝑎𝑛(𝜙′)
𝐵 ) + 𝑞 ∙ 𝑒−𝐻1𝐾𝑜𝑡𝑎𝑛(𝜙
′)
𝐵 (2.10)
𝜎′ℎ is given by:
𝜎′ℎ = 𝐾𝑜(𝜎′𝑣 + 0.5𝛾′𝐷𝑒) (2.11)
The width of the affected ground at surface is given by:
𝐵 =𝐷𝑒∙tan(45°−𝜙′/2)
2+
𝐷𝑒
2∙𝑠𝑒𝑛(45°+𝜙′/2) (2.12)
Some other authors have proposed alternative methods for the calculation of the vertical
and horizontal effective stresses on the pipe, most of them based on the Terzaghi arching
theory, the difference between these methods are the magnitude of the width of the affected
ground “B”, which varies from one to other researcher (Staheli, 2006).
For instance, the German Standard DWA-A 161 Statische Berechnung von
Vortriebsrohren (2014), recommends:
𝐵 = 𝐷𝑒 ∙ √3 (2.13)
𝜎′𝑣 = 𝜆 ∙ 𝛾′ ∙ (𝐻 − 𝐻1 + 𝐷𝑒)+𝜆 ∙ 𝛾 ∙ (𝐻1 −𝐷𝑒) + 𝜆𝑜 ∙ 𝑞 (2.14)
𝜆 =1−𝑒
−2𝐻𝐵𝐾0𝑡𝑎𝑛(𝛿)
2𝐻
𝐵𝐾𝑡𝑎𝑛(𝛿)
(2.15)
𝜆𝑜 = 𝑒−2𝐻
𝐵𝐾0𝑡𝑎𝑛(𝛿) (2.16)

27
𝜎′ℎ = 𝐾𝑜(𝜎′𝑣 + 0.5𝛾′𝐷𝑒) (2.11)
Figure 11. Stress model in DWA-A 161 Standard. Modified from DWA-A 161 (2014)
2.1.6 Angle of friction between pipe and soil (𝜹)
The value of the angle of interface friction depends on the soil type and the pipe material.
There are different materials that are used for pipe jacking around the world: Glass fiber
reinforced plastic pipes (GRP), reinforced concrete pipes (RCP), polymer concrete pipe,
vitrified clay pipes and rolled steel pipes. Each material has a different surface roughness
that affect the interface friction angle and the interaction mechanism between pipe and soil.

28
It is important to say that the most commonly used materials for pipe jacking in Colombia
are GRP pipes and reinforced concrete pipes (RCP) because the availability of
manufacturers in the country.
The ground conditions determine the material selection of the pipe, for example, the best
soil for RCP pipes is clay, because the internal angel of friction (Φ’) is lower than the value
of (Φ’) in the sand. The higher the percentage of granular materials in the clay (silt or sand),
the higher the value of friction and jacking loads on the pipe.
Some researchers have studied the value for the angle of interface friction (𝛿) between
concrete pipe and soils. Tomlinson (1969) presented a table relating the angle of interface
friction (𝛿) at the concrete pipe surface with the soil friction angle in sands (Φ’):
Table 3. Relation (𝛅/𝚽′) for concrete pipe surface and sand. Tomlinson (1969)
Surface finish (𝛅/𝚽`) for dry sand
Smooth (made in metal formwork)
0.76
Grained (made in timber formwork)
0.88
Rough (cast on ground) 0.98
GRP pipe has an external surface with less roughness than the concrete pipe, because the
composition of the materials and the external surface finish of pipe. This condition allows
the GRP pipe to slide more easily in granular soils, decreasing the friction resistance force
between soil and pipe.

29
Other researchers argue that the value of (Φ’) varies depending on the soil stress changes,
and they use a reducing factor to calculate (δ) typically between 1/4 ϕ and 3/4 ϕ (Staheli,
2006).
In general, the selection of the angle of interface friction depends on the type of soil and
the pipe material, and a practical value of (δ/Φ’) of 0.70 is usually assume by the
pipejackers and designers (Ripley, 1989).
Also, the use of bentonite or grout injection into the gap between excavation and pipe is a
common practice to improve the lubrication and decrease the friction force. In that case the
value of (δ) is affected and in some cases the pipes become buoyant within the fluid.

30
CHAPTER 3
3.1 Aburrá Valley Geography
The metropolitan area of the Aburrá Valley is an integration of 10 municipalities: Caldas,
La Estrella, Envigado, Itagüí, Sabaneta, Bello, Copacabana, Girardota, Barbosa and
Medellín. The total area of this zone is about 1165 km2 (including rural and urban areas).
The Aburrá Valley is in the north of the central mountain range of Colombia. The valley is
a natural basin of the Medellín river and can be divided in two principal zones: the first one
which is in the north -south direction between Caldas and Bello, and the second one which
is in the north-east direction between Bello and Barbosa. The valley is narrow at the south
and progressively become wider in the middle. It is surrounded by mountains that vary
their altitude approximately between 1300 and 2800 meters above sea level.
In table 2 it is shown the main geographic data of the Aburrá Valley:
Table 4. Aburrá Valley Geographic data. Source: http://datosabiertos.metropol.gov.co/
Country Colombia Division Antioquia Name of region Aburrá Valley
Coordinates Latitude 6° 15' N Longitude 75° 33' W
Altitude (average) 1300 - 2800 m.a.s.l. Temperature range 12 - 30 ˚C Precipitation (annual) 1554 mm Length (average) 60 km
Width Max. 30 Min. 8 km
Area 1165 km2 River name Medellín River

31
Figures 12 and 13 shown the configuration and relief of the valley.
Figure 12. Aburrá Valley configuration. Modified from: http://datosabiertos.metropol.gov.co/

32
Figure 13. Aburrá Valley relief. Source: (Google maps, 2019)
3.2 Population growth of the Aburrá Valley
Due to the difficult economic and violence conditions suffered by the region of Antioquia
in recent years, there has been a phenomenon of migration from rural areas to the
metropolitan area of the Aburrá Valley, this is added to the growth of the local industries
and the normal increase of the population.
According to Departamento Administrativo Nacional de Estadistica de Colombia
(DANE, 2018), the current population of the Aburrá Valley is 3.72 million people.
Projections suggest that population will increase to 4.5 million people in 2030.
Taking into account that the population will increase in the next years, and considering the
topography conditions, it is necessary to look for alternatives such as trenchless
technologies to carry out extensions of the water and sewerage systems for the metropolitan
area.

33
3.3 Geological and geotechnical conditions in the Aburrá Valley
Surface formations of the Aburrá Valley include diverse fluvial and slope deposits in a
stepped structure. In the valley, there are several geological and geomorphological units as
can be seen in Figure 14.
Figure 14. Geomorphology of the Aburrá Valley. Modified from: http://datosabiertos.metropol.gov.co/
According to the figure 14 and considering the regional geological context, the superficial
materials in the valley corresponds to a sequence of alluvial deposits which are associated
with torrential events of the Medellín river and several tributary streams. These torrential

34
events transport the material in the areas where the streams follow a turbulent behavior,
until reaching lower slopes where they are deposited.
Additionally, a considerable part of the surface materials in the valley correspond to slope
deposits. Most of those deposits are mudflows conformed by a mix of fine materials (sand,
clay and silt) and granular materials (gravel and rock blocs). The water content in the slopes
of the valley is variable generating landslides that are moved down in the slope by gravity
effect. The older layers of this old landslides have placed in the upper part of the slopes,
and the newer layers are in the lower part of the slopes, close to the Medellín river.
Surface formations have variable thickness in the valley and usually in the first 10 m - 20 m
there are soils composed by gravel, sand and silt with embedded rock balls (García, 2006).
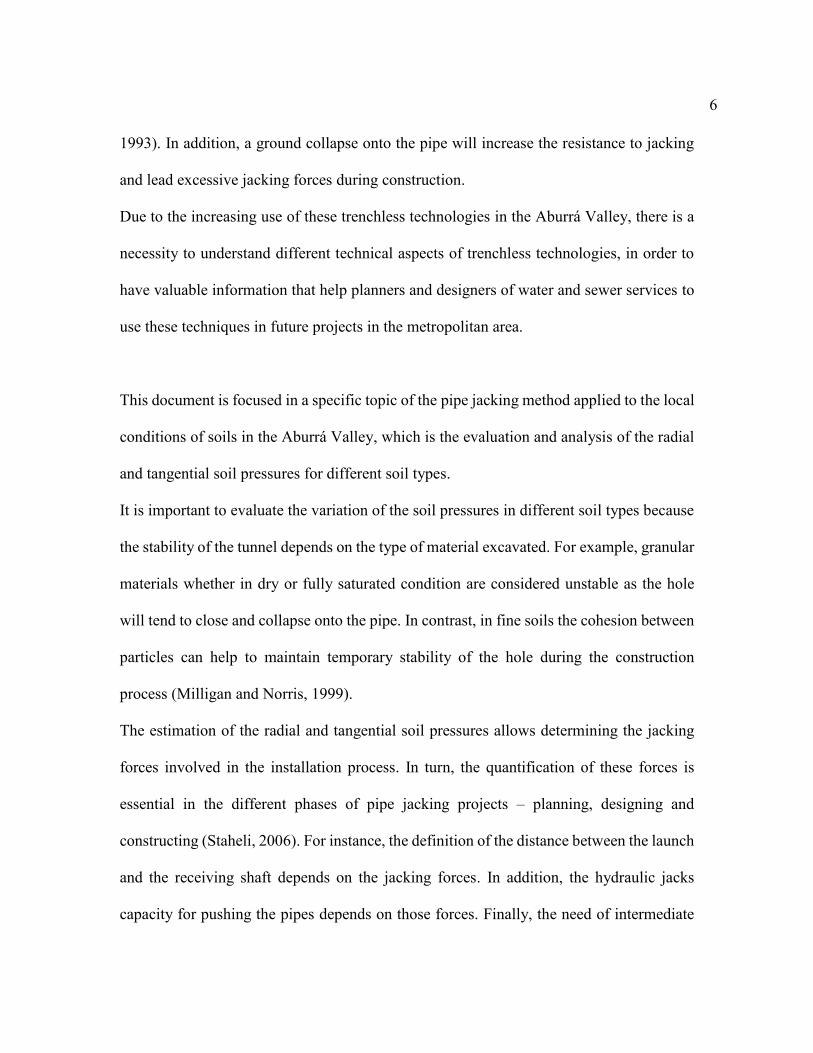
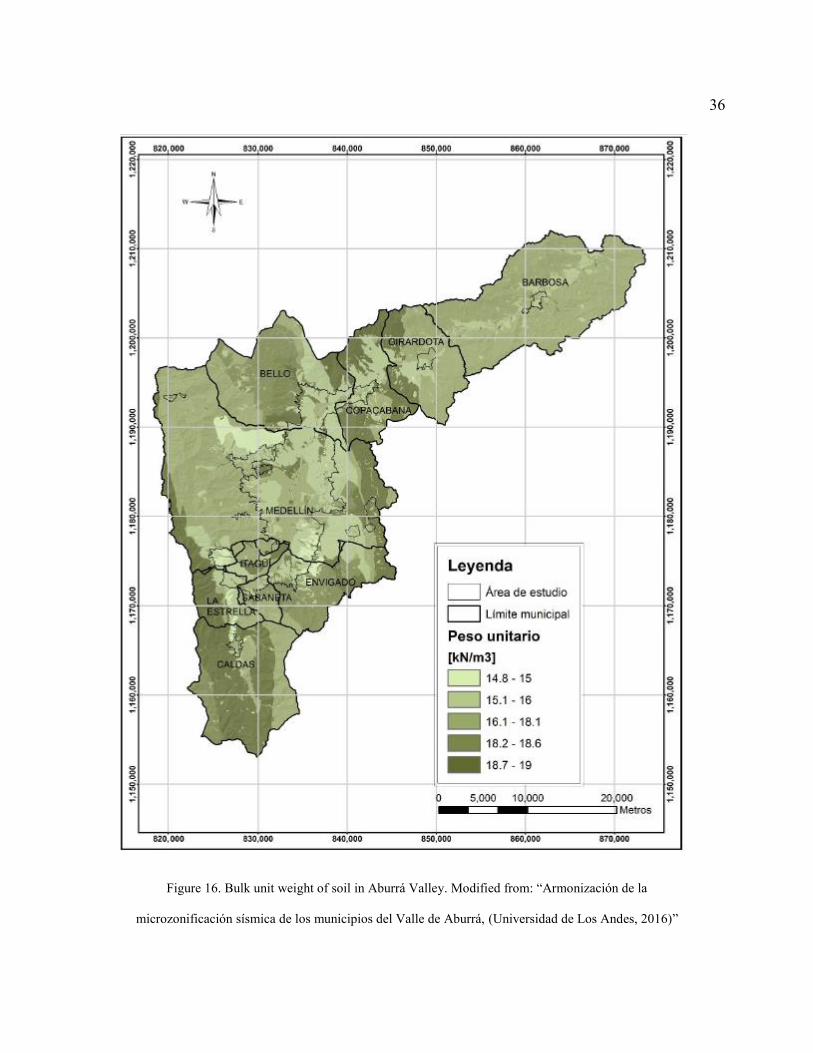
3.3.1 Geotechnical parameters in Aburrá Valley For analyzing the radial and tangential soil pressure induced by soil on pipes installed by
the jacking pipe method in Aburrá Valley, it is necessary to know the variation of the
geotechnical parameters in this area, those parameters are: the internal angle of friction of
the soil (Φ’), the bulk unit weight of soil (γ), the water table level (H1) and cohesion of
soil (c´). In figures 15 to 18 are presented typical values of those parameters in the Aburrá
Valley taken from: Universidad de Los Andes, 2016. Armonización de la
microzonificación sísmica de los municipios del Valle de Aburrá.

35
Figure 15. Angle of friction variation in Aburrá Valley. Modified from: “Armonización de la
microzonificación sísmica de los municipios del Valle de Aburrá (Universidad de Los Andes, 2016)”
36
Figure 16. Bulk unit weight of soil in Aburrá Valley. Modified from: “Armonización de la
microzonificación sísmica de los municipios del Valle de Aburrá, (Universidad de Los Andes, 2016)”

37
Figure 17. Water table variation in Aburrá Valley. Modified from: “Armonización de la microzonificación
sísmica de los municipios del Valle de Aburrá, (Universidad de Los Andes, 2016)”

38
Figure 18. Cohesion of soil in Aburrá Valley. Modified from: “Armonización de la microzonificación
sísmica de los municipios del Valle de Aburrá, (Universidad de Los Andes, 2016)”

39
3.4 Field case histories of pipe jacking in Medellin
Two projects have been constructed by the local public service company for the Aburrá
Valley using pipe jacking method.
During construction of these projects, valuable information was collected such jacking
forces measurement, face pressure, cutter wheel torque measurement and slurry flow rates.
This information can help to understand the behavior of several parameters involved in the
pipe jacking process.
3.4.1 Centro Parrilla project
3.4.1.1 Description of the project In 2015 Empresas Públicas de Medellín (EPM) began the renovation and rehabilitation of
potable water and sewer services in the downtown of Medellín city. This network is located
in the urban center of Medellín, from San Juan Avenue to 62nd Street, and between 38th
Street and Regional Avenue near to Medellín river (see Figure 19).
The project called "Centro Parrilla" had to solve different problems associated to vehicular
traffic, numerous intersections of existing pipes and several social, economic and
environmental problems.
In this project was implemented different trenchless methods including: pipe jacking, cured
in place pipe (CIPP), horizontal directional drilling, pipe bursting and close fit sliplining.
The total length of pipes for rehabilitation and renovation was approximately 75 km (40 km
for potable water and 35 km for sewerage networks). Trenchless was implemented in 67%
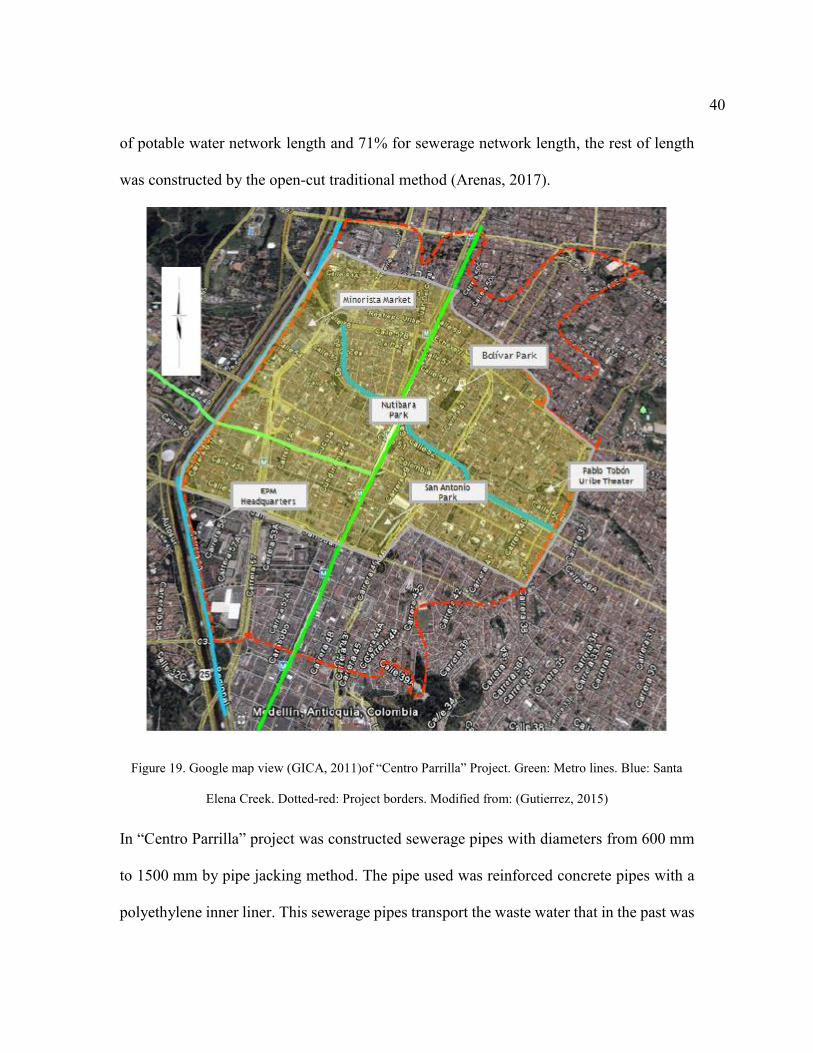
40
of potable water network length and 71% for sewerage network length, the rest of length
was constructed by the open-cut traditional method (Arenas, 2017).
Figure 19. Google map view (GICA, 2011)of “Centro Parrilla” Project. Green: Metro lines. Blue: Santa
Elena Creek. Dotted-red: Project borders. Modified from: (Gutierrez, 2015)
In “Centro Parrilla” project was constructed sewerage pipes with diameters from 600 mm
to 1500 mm by pipe jacking method. The pipe used was reinforced concrete pipes with a
polyethylene inner liner. This sewerage pipes transport the waste water that in the past was

41
discharged directly to Santa Elena creek to the “Interceptor Norte” which is a big pipe that
transport the fluid to the water treatment plant “PTAR Aguas Claras” constructed by
Empresas Públicas de Medellín in Bello municipality.
Launch and receptions shafts were constructed along the alignment of the pipe with
variable separation lengths between them. Shafts were approximately between 3 m and
21 m deep and their geometry was rectangular and circular.
The excavation lining used in shafts was shotcrete and concrete dowels. In some cases,
steel and wood beams were used.
The microtunneling machine used in “Centro Parrilla” project was earth-pressure balance
machine (EPBM) with a shield adapted for a mixed ground (soft and hard soils).
Figure 20. Launch shaft, concrete pipes and hydraulic jacks used in “Centro Parrilla” Project. Modified
from: EPM photographic record

42
3.4.1.2 Geological and geotechnical conditions A complete geotechnical characterization of the zone was made for designing phase of the
project by the design contractor (INGETEC – Ingenieros Consultores). As can be seen in
Figure 21, there are four types of geological units presents in the zone: Qal, QFIII, KgSD
and TRmPP.
Figure 21. Geology of “Centro Parrilla” Project (Ingetec SA - Ingenieros Consultores, 2013).

43
Qal correspond to alluvial deposits which are present in nearly flat areas along the course
of a Medellín River and their streams which are naturally subject to flooding. In general,
this material is composed by a mix of gravel, sand and silt with embedded rounded rocks
of different sizes. As can be seen in Figure 21 this is the predominant formation in the
project area.
QFII correspond to mudflows that was deposited in the lower part of the slopes by old
landslides that are moved down by gravity effect. In general, this material is characterized
by presenting rock blocks of different sizes on a sandy-silt matrix.
KgSD is an igneous formation which present a strong physical weathering profile near the
surface. The residual material product of the rock disaggregation corresponds to silty-sand
soils.
TrmPP correspond to a migmatite formation present a strong physical weathering. The
residual material product of the rock disaggregation has different characteristics (silty-
sands and clay-sandy soils).
Figure 22 shows a division of the project area into 7 zones: 1, 2, 3a, 3b, 4, 5a, 5b. This
division was made based in 36 exploratory perforations with depths between 1.80 m –
20 m. With the information collected from the perforations made, the ground resistance
parameters were obtained for each of the 7 zones.

44
Figure 22. Geotechnical zones of “Centro Parrilla” Project (Ingetec SA - Ingenieros Consultores, 2013)
In Table 5 is presented the geotechnical parameters of the project for every zone.

45
Table 5. Geotechnical parameters of “Centro Parrilla” project (Ingetec SA - Ingenieros Consultores, 2013)
3.4.1.3 Construction stage In Figure 23 is presented a plan view of a typical segment of pipe jacking installation in
“Centro Parrilla” project. On this segment for sewer pipe renovation, there are 5 shafts (red
dots), those launching and receiving shafts allowed to install 280 m of a new concrete sewer
pipe of 600 mm and 700 mm diameter.
No drenadosMódulo de
elasticidad
Nivel
freático
γ [kN/m3] c´ [kPa] Φ´ [°] Su [kPa] E [MPa] [m]Suelos de meteorización
de TrmPP y KgsD 0.00 - 1.50 18.30 14 27 91 19
Suelos de meteorización
de TrmPP y KgsD 1.50 - 3.50 18.10 13 34 127 27
Suelos de meteorización
de TrmPP y KgsD 3.50 - 6.00 18.20 15 32 114 29
Flujos de escombros y/o
lodos QFIII 0.00 - 1.5018.8 15 31 75 19
Flujos de escombros y/o
lodos QFIII 1.50 - 4.0017.6 28 26 127 23
Flujos de escombros y/o
lodos QFIII 4.00 - 6.0017.6 13 31 143 25
Depósitos aluviales Qal 0.00 - 1.40 19.2 20 31 66 19
Depósitos aluviales Qal 1.40 - 4.50 18.3 18 27 99 25
Depósitos aluviales Qal 4.50 - 6.30 19.1 6 42 137 29
Depósitos aluviales Qal 0.00 - 1.50 19.8 27 36 71 25
Depósitos aluviales Qal 1.50 - 2.85 19 11 32 89 32
Depósitos aluviales Qal 2.85 - 6.00 20 18 25 121 50
Depósitos aluviales Qal 0.00 - 1.40 19.6 20 31 95 26
Depósitos aluviales Qal 1.40 - 4.70 18.7 14 33 137 40
Depósitos aluviales Qal 4.70 - 6.00 17.3 14 23 115 36
Depósitos aluviales Qal 0.00 - 1.40 21.1 15 34 - 35
Depósitos aluviales Qal 1.40 - 6.30 21.2 15 42 - 65
5a 4.00
5b 4.00
PARÁMEROS DE RESISTENCIA
4 1.80
DrenadosZona geotécnica Descripción
Profundidad
[m]
1.80
3a y 3b2.50 (3a)
4.00 (3b)
1 1.80
2

46
Figure 23. Typical segment of pipe jacking in “Centro Parrilla” Project (EPM-51MED23-07RE-0337,
2013)
In order to analyze the pipe jacking installation process, in figure 24 is shown a longitudinal
section between shafts C348A and C359A.

47
Figure 24. Segment between C348A and C359A shafts in “Centro Parrilla” Project. (EPM-51MED23-
07RE-0337, 2013)
In Table 6 is presented the basic information about the segment between C348A and
C359A shafts.
Table 6. Information about the segment between C348A and C359A shafts.
(Ingetec SA - Ingenieros Consultores, 2013)
Parameter Value
Pipe material Reinforced concrete with a polyethylene inner liner
Pipe diameter 0.70 m Length between shaft axes 74.13 m Effective jacked length 56.08 m Average depth of soil cover over the pipe crown 2.30 m

48
Parameter Value
Geotechnical zone (according to figure 22)
Zona 4 - Depósitos aluviales (Qal)
Efective internal angle of friction of the soil (Φ’) (according to table 5) 32° Bulk unit weight of the soil (γ) (according to table 5) 19 kN/m3 Depth of the water table from surface (H1) (according to table 5) 1.80 m
During construction stage, it was possible to collect information that is useful to understand
the interaction between pipe and soil. Parameters such the jacking force needed to push the
pipes between shafts, the advance rates, the cutter wheel torque and the face pressure were
measured.
It is very important to say that during the jacking operation the microtunneling machine
excavated a larger diameter hole than the external pipe diameter. In this case the overcut
was about 3 and 5 cm. In this annular space it was injected bentonite through the lubrication
ports located on the pipe walls (every two pipes).
In order to illustrate and analyze the information collected in the field, in Figure 25 is
presented a scheme where can be seen a longitudinal view of pipe that is pushed by the
main jacks. In the same figure is shown the “time effects” and “lubrication effects” during
the pipe jacking process.

49
Figure 25. Behavior of the predicted and real jacking forces. Modified form (Milligan & Norris, Pipe-soil
interaction during pipe jacking, 1999)
As can be seen in Figure 25, there is a “base line” that represents the frictional component
of the jacking force. The frictional component increase while the distance is larger due to
the increasing contact surface between pipe and soil and the radial stresses induced by the
soil on the pipe.

50
The real jacking force behavior is affected by two principal effects. The first effect that
increase rapidly the jacking force is the time effect. It is observed during periods when the
pipeline is not moving. During construction it is common to stop the advance for any
technical reason and after the stoppage the jacking force jumps up and the force presents
values higher than the values of the base line (Milligan & Norris, 1999).
The second effect that affects the increasing or decreasing in jacking force is lubrication.
When there is a lack of lubrication between the pipe and soil, the jacking force gradually
increases due to the direct frictional interaction between pipe and soil. When using
lubrication, the jacking force decreases and in some cases could generate a buoyant effect
on the pipe.
This effects can be seen in Figure 26, where is presented the jacking forces measured
between C348A and C359A shafts in Centro Parrilla project.

51
Figure 26. Jacking forces between C348A and C359A shafts in “Centro Parrilla” Project.
Modified from: (Ingenieria y Contratos S.A.S, 2013)
As can be seen in Figure 26, the time effect increase abruptly the force after a stop of the
work, for example when the drive length of the tunnel was 24 m, the force in the main jacks
registered was 380 kN, but after a stop of several hours the jacking force jumps up to
810 kN. After that, the lubrication using bentonite helps to reduce the force to values of
450 kN approximately.
The lubrication effect can be observed too. Note the bentonite effect in Figure 26, when no
lubricant is used the interface friction coefficient between pipe and soil is reduced
considerably respect to the non-lubricated interface friction coefficient. As a consequence,
the jacking forces increase gradually when there is no lubricant in the gap between the pipe
and soil.

52
The minimum values that can be seen in Figure 26 corresponds to measurement errors.
This occurs because the measuring device consisting of a wheel that makes contact with
the pipe loses contact with the pipe wall and wrong force values are recorded.
3.4.2 Interceptor Norte project
3.4.2.1 Description of the project The “Interceptor Norte” is a project conducted by EPM (Empresas Públicas de Medellín)
for the sanitation of Medellín river and their affluent creeks. The project consists in a big
pipe that transport the waste water of the north side of Medellín city and Bello municipality
to the treatment plant “PTAR Aguas Claras”.
In Figure 27 is presented the project location. The pipe alignment is parallel to Medellin
river from Moravia neighborhood as the initial point, to the final point in Niquia
neighborhood where is located the treatment plant.

53
Figure 27. Google map view of “Interceptor Norte” Project. Modified from: (GICA, 2011)
Launch and receptions shafts were constructed along the pipe alignment with variable
separation lengths between them. Shafts were constructed approximately between 2 m and
20 m of depth.
Table 7. General information about the “interceptor Norte” project (Consorcio CISE, 2011)
Shaft Pipe diameter (m)
Pipe Length (m) Installation method
C1 to C14 2.20 4747 Pipe jacking C14-C22 2.40 2006 Pipe jacking C22-C23 2.40 511 Open cut trench
C23-C26E 2.20 397 Pipe jacking Cross points between
shafts: C27-C 5 C28-C8
C30-C10A C31-C15
1.20 579 Pipe jacking

54
As can be seen in Figure 28, along the alignment the pipe had to cross the Metro line, the
Medellín river from the east side to the west side and existing infrastructure.
Figure 28. River and Metro line crossing “Interceptor Norte” Modified from: EPM photographic record
The excavation for pipe jacking installation was carried out by a slurry tunnel boring
machine with pressure balance in the front of the excavation. The face pressure was
balanced by pumping slurry (bentonite) to the front of the tunnel-boring machine to contain
the face pressure. The machine shield used was adapted for cutting soft grounds and rock.
In the “Interceptor Norte” project was used sewerage pipes with diameters from 1200 mm
to 2400 mm by pipe the pipe jacking method

55
Figure 29. Typical shaft, TBM, hydraulic jacks and concrete pipe used in the “Interceptor Norte” project
Modified from: EPM photographic record
3.4.2.2 Geotechnical conditions along the alignment In order to know the geological and geotechnical conditions along the “Interceptor”
alignment a complete exploration campaign was executed by the contractor. The
exploration campaign consisted in a several number of boreholes located in each shaft and
different points along the pipe alignment. In Figure 30 is shown a stratigraphic profile along
the interceptor axis (red line) and perforations that were made which are denoted with the
letter “P”.

56
Figure 30. Geotechnical profile along the “Interceptor Norte” project (GICA, 2011)
According to the final inform for the geological and geotechnical characterization of
Interceptor Norte (GICA, 2011), the following geotechnical characterization was made:
Thick alluvial deposit (Depósito aluvial grueso - Qal): This material is a mix of gravel,
sand and silt. This is a well-graded material in which the smaller soil particles fill the space

57
between the large particles. Also the material has rounded rock particles larger than 25 mm
(1 in). As can be seen in Figure 30 this is the predominant material along the pipe
alignment.
Alluvial-torrential deposit (Depósito aluviotorrencial – QAT): These are alluvial
deposits which are associated with old torrential events of the Medellín river. These
torrential events transported the material in the areas where the streams follow a turbulent
behavior, until reaching lower slopes where they were deposited. The material is composed
by angular fragments of dunite and gabbro rocks embedded in a clayey-silt matrix.
Recent alluvial deposit (Depósito aluvial reciente - Qal): Correspond to silts and clays
with variable plasticity (CL, ML, CH, MH).
Dunite residual soil (Suelo residual dunita -KuM): Correspond to silty and sandy soils
with high plasticity.
In Table 8 is presented the average geotechnical parameters for the predominant materials
along the interceptor alignment.

58
Table 8. Average geotechnical parameters of “Interceptor Norte” project (GICA, 2011)
3.4.2.3 Construction stage In Figure 31 is presented a profile view of a typical pipe jacking installation on “Interceptor
Norte” project. On this segment, C14 and C16 are the launching and receiving shafts and
there is an intermediate inspection shaft C15.
Figure 31. Profile view of the segment between C14 and C16 shafts in the “Interceptor Norte” project.
Modified from: (GICA, 2011)

59
In order to decrease the jacking loads, the use of bentonite for lubrication was implemented
every two pipes. Additionally, it was used intermediate jacking stations inside the tunnel
with a maximum spacing of 120 m or in zones where the frictional component of the
jacking force was excessive and could cause a structural damage of the pipe.
The intermediate jacks propelled the TBM and the pipes between the machine and the
intermediate station and the rest of the pipe length behind the intermediate station was
propelled by the main jacks in the launching shaft or by another intermediate station.
The intermediate jacks were located inside a cylindrical steel section that was fabricated
with the same external diameter of the pipe. The steel section connected two concrete pipes
with special joints in order to prevent a local collapse of the ground when the jacks were
activated.
In Figure 32 is presented one scheme and picture of the intermediate jacking stations.
Figure 32. Intermediate jacking stations in the Interceptor Norte project.
Modified from: (GICA, 2011)
In Table 9 is presented the basic information about the segment between C14 and C16
shafts.

60
Table 9. Information about the segment between C14 and C16 shafts of the “Interceptor Norte” project
(GICA, 2011)
Parameter Value
Pipe material Reinforced concrete
Pipe diameter 2.40 m Length between shafts 712 m Average depth of soil cover over the pipe crown 7 m
Soil materials Alluvial deposit (200 m)
Alluvial-torrential deposit (512 m)
Internal angle of friction of the soil
Alluvial deposit (Φ’=42°) Alluvial-torrential deposit (φ’=38°)
Bulk unit weight of the soil
Alluvial deposit (γ =19 kN/m3) Alluvial-torrential deposit
(γ =20 kN/m3)
Depth of the water table from surface
Alluvial deposit (H1 =5.3 m) Alluvial-torrential deposit (H1=5.4 m)
In Figure 33 is shown the jacking forces measured between C14 and C16 shafts on the
Interceptor Norte project.

61
Figure 33. Jacking forces between C14 and C16 shafts in “Interceptor Norte” Project.
Modified from: (Ingetec SA, 2013)
As can be seen in Figure 33, the time effect increase abruptly the force after a stop
(example: 9000 kN at 311 m), but after and before that pipe, the jacking force behavior
shows values of 5000 kN approximately. That means that probably on that point of the
interceptor alignment there occurred a stop during some period of time.
The lubrication effect can be observed too. When there was a lack of bentonite between
the pipe and soil the jacking force gradually increases, and when there was a good
lubrication the jacking force gradually decreased.
An additional effect that decreases the jacking forces in the main jacks happened because
the use of intermediate jacking stations. In the “Interceptor Norte” project it was define
that every 120 m should be located intermediate jacking stations. This is a very important
aspect to take into account in Figure 33, because the force recorded corresponds to the main
jack station which was reduced by the effect of the intermediate stations. This machines

62
helped to push some segments between the TBM and the point where they were installed,
as a consequence, the main jacks decreased the force needed to push the pipes.
The minimum values that can be seen in Figure 33 corresponds to measurement errors.
From information presented in chapter 3, it is possible to resume the following aspects:
Soils in the Aburrá Valley corresponds to alluvial and slope deposits, which in general are
composed by gravel, sand and silt with embedded rock balls. This type of materials can be
classified as unstable for a tunnel excavation and pipe jacking. That means that the
excavation does not have the capability to be stable and the material tends to close around
the pipe generating a radial stress, which increases the frictional resistance for pipe
installation.

63
CHAPTER 4
4.1 Analysis of soil pressure on pipes installed by pipe jacking method in Aburrá
Valley
Geotechnical parameters of soils have impacts in calculation of radial and tangential
stresses on pipes installed by the pipe jacking method. The effect of these parameters and
their influence on jacking forces are analyzed in this chapter using equations that were
presented in section 2.1.5 and information of soils in Aburrá Valley presented in chapter 3.
4.2 Variation of radial stress around the pipe
4.2.1 Radial stress Vs. Bulk unit weight of soil In order to evaluate the variation of radial stress induced by soil on pipe, consider a 1.00 m
pipe (external diameter), installed 10.00 m depth from surface level. The bulk unit weight
of soil (γ) vary from 15 kN/m3 to 19 kN/m3, according to figure 16 in the Aburrá Valley.
The internal friction angle of soil was assumed in 30° and the water table 5.00 m from
surface level.
Radial stress variation was evaluated according to equation (2.5)

64
Figure 34. Typical radial stress variation around the pipe during pipe jacking (unstable soils).
Figure 34 allows to visualize the magnitude variation of radial stresses and their
distribution around the external surface of the pipe. In general, the pattern and the shape of
the radial stresses around the pipe keeps the distribution presented, regardless of diameter
and geotechnical parameter values assumed.
The radial stress can be illustrated around the pipe as can be seen in Figure 35:
Figure 35. Radial stress distribution around the pipe.
0
5
10
15
20
25
30
35
40
0 45 90 135 180 225 270 315 360
Rad
ial s
tress
σr
'(kP
a)
Angle at any point of the pipe α(°)
γ=15 kN/m3 γ=16 kN/m3 γ=17 kN/m3 γ=18 kN/m3 γ=19 kN/m3

65
4.2.2 Radial stress Vs. Internal friction angle of soil
In Figure 36 is presented the variation of radial stresses with the internal friction angle of
the soil for the same conditions exposed in numeral 4.2.1. Values of the friction angle was
evaluated for the range of this geotechnical parameter in the Aburrá Valley according to
Figure 15.
Figure 36. Radial stress Vs Internal angle of friction for soil
As can be seen in figure 36, soils with higher values of the friction angle will induce less
radial stresses on pipes due to their higher shear resistance to the Terzaghi’s arching effect
(see 2.1.5).
Note: The radial stress was computed at α = 90°.
0
10
20
30
40
50
60
70
10 15 20 25 30 35 40 45 50
Rad
ial s
tress
σr
'( (k
Pa)
Internal angle of friction for soil (Φ´)

66
4.3 Variation of tangential resistance in pipe jacking
Resistance to movement of pipe as it is pushed into the tunnel in a typical pipe jacking
installation is because the tangential resistance or tangential pressure, which is related to
the frictional interaction between pipe and soil.
Jacking forces that need to be achieve to overcome the tangential resistance is analyzed in
this section, taking into account the variation of the geotechnical parameters in the Aburrá
Valley.
4.3.1 Variation between jacking force and the bulk unit weight of soil As a first step, it was calculated the vertical and horizontal effective stresses on pipe from
equations (2.9) and (2.11), then it was computed the jacking force using equation (2.7).
Values of the bulk unit weight of soil (γ) were taken from Figure 16 (section 3.3.1) for the
Aburrá Valley. Also, for the analysis purpose, it was assumed Φ’= 32°, De = 0.70 m,
H = 2.30 m and H1=1.8 m. These values were assumed equal to “Centro Parrilla” project
data presented in section 3.4.1.3 (see table 6). A practical value of (δ/Φ’) of 0.70 was
assume for analysis (see section 2.1.6).
In Figure 37 is presented the jacking forces along a segment between shafts for typical
values of (γ) in the Aburrá Valley soils.

67
Figure 37. Jacking force Vs length between shafts, for typical values of the bulk unit weight of soil in
Aburrá Valley
As can be seen in Figure 37, the jacking force has proportional relation with (γ), it means
that if (γ) is increased, also the jacking forces will be increase. In addition, as the length
between shafts increases, the effect of (γ) on the jacking forces is greater.
Figure 38 presents the variability of (γ) in a fixed length. For this exercise it can be seen
that in 100 m length the jacking force vary from 1100 kN to 1511 kN, which represents a
variation of 37%.
0
200
400
600
800
1000
1200
1400
1600
1800
2000
0 20 40 60 80 100 120 140
Fr (k
N)
Length (m)
Φ'=32°, De=0.70 m, H=2.30 m, H1=1.80 m
γ=15 kN/m3
γ=16 kN/m3
γ=17 kN/m3
γ=18 kN/m3
γ=19 kN/m3

68
Figure 38. Jacking force (Fr) Vs Bulk unit weight of soil (γ)
The variability of (γ) along a segment between shafts has a very important implication
when computing jacking forces. For this reason, is important to have field investigations
data, in order to know the variability of this geotechnical parameter.
4.3.2 Variation between jacking force and installation depth The same procedure described in section 4.3.1 was performed to observe the variation of
jacking force with installation depth (H).
600
800
1000
1200
1400
1600
1800
2000
14.50 15.00 15.50 16.00 16.50 17.00 17.50 18.00 18.50 19.00 19.50
Fr (k
N)
γ (kN/m3)
Φ'=32°, De=0.70 m, H=2.30 m, H1=1.80 m

69
Figure 39. Jacking force variation with the installation depth of pipe
As can be seen in Figure 39, if geotechnical parameters remain relatively constant between
shafts, there is no significant variation of the jacking forces. For instance, if the length is
100 m, the force is 1317 kN for H=6 m and 1285 kN for H= 10 m, this represents a
difference of 2.4% in the jacking force. Additionally, comparing the force for H=3 m and
H=6 m there is a difference of 8.7%. Thus, in a particular project the installation depth of
pipe could be changed in a reasonable range without needing to require higher capacity of
hydraulic jacks.
4.3.3 Variation between jacking force and the pipe diameter The same procedure described in section 4.3.1 was performed to observe the variation of
jacking force with pipe diameter (De).
0
200
400
600
800
1000
1200
1400
1600
1800
2000
0 20 40 60 80 100 120 140
Fr (
kN)
Length (m)
γ=19 kN/m3, Φ'=32°, De=0.70 m, H1=1.80 m
H=2.30 m
H=3.00 m
H=4.00 m
H=5.00 m
H=6.00 m
H=10.00 m

70
Figure 40. Jacking force variation for different pipe diameters
In this case, the variability of jacking force is significant, since the diameter increases the
contact surface between soil and pipe.
Figure 41. Jacking force Vs Pipe diameter
0
2000
4000
6000
8000
10000
12000
0 20 40 60 80 100 120 140
Fr (k
N)
Length (m)
Φ'=35º, γ=19 kN/m3, H=9 m
De=0.70m De=1.00m De=1.30m De=1.50m De=1.80m
0
2000
4000
6000
8000
10000
12000
14000
16000
0 0.5 1 1.5 2 2.5 3
Fr (k
N)
Diameter (m)
Φ'= 35º, γ =19 kN/m3, H= 9m
L=100m
L=80m
L=60m
L=40m
L=20m

71
From Figure 41, it can be seen that the relationship between the pipe diameter and the
jacking force is not a linear relation. The pipe diameter is the variable that most affects the
calculation of jacking forces compared with the other parameters in equations (2.7), (2.9)
and (2.11). However, the pipe diameter is normally determined by the hydraulic necessities
in a particular project, and usually there is no variation of this parameter along a segment
between shafts in pipe jacking operations.
4.3.4 Comparing computed jacking forces to field data
4.3.4.1 Comparison in “Centro Parrilla” project
Computed jacking forces were compared with field jacking forces obtained from “Centro
Parrilla” project. Value of γ was taken as 19 kN/m3 and Φ’ as 32° (see Table 5). Pipe
diameter De = 0.70 m, H = 2.30 m and H1 = 1.80 m. These values were taken from “Centro
Parrilla” project data presented in section 3.4.1.3. A practical value of (δ/Φ’) of 0.70 was
assume for analysis (see section 2.1.6).
The type of soil between C348A and C359A shafts in “Centro Parrilla” corresponds to
alluvial deposits, which are composed by a mix of gravel, sand and silt with embedded
rounded rocks of different sizes. This soil can be characterized as a cohesionless or unstable
soil for a tunnel construction (see section 2.1.4).
The calculation was made using Auld´s and the German Standard DWA-A 161 according
to equations presented in section 2.1.5.

72
Figure 42. Field jacking force and computed jacking force in “Centro Parrilla” project
Figure 42 shows that the computed values have an incremental tendency with the drive
length of the pipe. This is because the frictional component increases with distance due to
the increasing contact surface between pipe and soil and the radial stresses induced by the
soil on the pipe.
In addition, Figure 42 shows that computed values of jacking forces using equations from
Auld’s method and German standard DWA-A 161 are very similar. The difference between
these methods was 2% approximately.
As it was mentioned in section 3.4.1.3 the highest values of the field jacking forces shown
in Figure 41 are because the time effect. This effect occurs during construction periods
when the pipeline is not moving. During construction it is common to stop the advance for
0100200300400500600700800900
1000
10 20 30 40 50 60
Jack
ing
forc
e (k
N)
Drive length (m)
Field data (jacking force) (kN)Computed jacking force (Auld method) (kN)Computed jacking force (DWA -A 161 Standard) (kN)Computed jacking force by Auld's method - Standard deviationComputed jacking force by Auld's method+ Standard deviation

73
any technical reason, or just because the work stops at nights and restart at mornings, and
after the stoppage the jacking force jumps up and presents higher values than before the
stop.
Computed values do not take into account lubrication and time effects that are two
components that affect the real jacking forces, but this prediction is a good approximation
when a designer have to evaluate the magnitude of jacking forces in early stages of a pipe
jacking projects.
4.3.4.2 Comparison in the “Interceptor Norte” project
To compare computed jacking forces with the field data in the “Interceptor Norte” project,
it is necessary to take into account the use of intermediate jacking stations during
construction. In this project, it was used intermediate jacking stations inside the tunnel with
a maximum spacing of 120 m in order to protect the pipes from a structural damage. In
addition, a value of 18300 kN was defined in the project as a maximum allowable load for
the concrete pipe (Consorcio CICE, 2011).
The force recorded corresponds to the main jack station which was reduced by the effect
of the intermediate stations (see Figure 43).
The type of soil for the first 120 m between C14 and C16 shafts in the “Interceptor Norte”
corresponds to thick alluvial deposits. This material is a mix of gravel, sand and silt, and it

74
has rounded rock particles larger than 25 mm (see figure 31 and Table 8, section 3.4.2.2
and 3.4.2.3).
For calculations of jacking forces, it was considered two cases. In the first one it was
assumed a cohesionless soil taking into account the geotechnical information of the project.
The value of γ was taken as 19 kN/m3, an equivalent internal angle of friction (Φeq´) was
taken as 42° (see Table 9). Pipe diameter De = 2.40 m, H = 8.00 m and H1 = 5.30 m. These
values were assumed equal to “Interceptor Norte” project data presented in section 3.4.2.3.
A practical value of (δ/Φ’) of 0.70 was assume for analysis (see section 2.1.6).
In the second case it was assumed that soil has a cohesion according to the information of
geotechnical parameters in the Aburrá Valley presented in section 3.3.1. The value of
Φ´= 27º and c’= 25 kPa was taken from figures 15 and 18.
In this case, the computed jacking force will not be analyzed by the DWA- A 161 German
Standard, because there is not a big difference with the Auld’s method as evidenced in
Figure 42.
In Figures 43 and 44 is presented the comparison for the segment between the main jack
and the first intermediate station for the two cases analyzed (the first 120 m of the segment
between the C14 and C16 shafts).

75
Figure 43. Field jacking force of the main jack (segment between C14 and C16 shafts). Interceptor Norte
project (Ingetec SA, 2013)

76
Figure 44. Field jacking force and computed jacking force in the “Interceptor Norte” project
As can be seen in Figure 44, the values calculated by the Auld’s method considering a
cohesionless soil are much higher than those observed for the field data. However, in the
second case when cohesion of soil is considered, the values computed by Auld’s method
has a better approximation to the field data of jacking forces.
It is not possible to compare the total segment between shafts because the presence of
intermediate jacking stations. This stations push the segments between the TBM and the
point where they were installed, as a consequence, the main jacks decreased the force
needed to push the pipes. Additionally, the use of bentonite for lubrication was
implemented every two pipes along the entire length between shafts (Consorcio CISE,
2011).
0
2500
5000
7500
10000
12500
15000
17500
20000
0 20 40 60 80 100 120
Jack
ing
forc
e (k
N)
Drive length (m)
Field data (jacking force)Computed jacking force (Auld's method assuming cohesionless soil Φ'eq=42º)Computed jacking force (Auld's method using cohesion of soil Φ'=27º, c'=25 kPa)Allowable load for pipe (2.40m)

77
From the analysis presented in chapter 4, it is possible to resume the following aspects:
Radial and tangential pressures on pipes installed by the pipe jacking method are affected
by the variability of geotechnical parameters, the pipe diameter and the installation depth.
The pipe diameter is the variable that most affects the radial and tangential pressures
associated to jacking forces, and the pipe installation depth is the variable that less affects
them as was presented in Figures 39 and 41. However, the pipe diameter is controlled by
the hydraulic design and usually there is no variation of this parameter in a segment of
pipe. In addition, among geotechnical parameters analyzed, it was found that the bulk unit
weight of soil (γ) was the value that most affects the jacking forces followed by the internal
angle of friction (Φ’). For this reason, it is very important to have field investigations, in
order to analyze the variability of this parameters in soils where a pipe jacking project is
projected.
Calculation of jacking forces using theoretical models were made and compared with field
data recorded from “Centro Parrilla” and “Interceptor Norte” projects developed in the
Aburrá Valley. In “Centro Parrilla” the computed values had a reasonable agreement with
the field data. In the “Interceptor Norte” the computed values by Auld’s method
considering a cohesionless soil were much higher than those observed for the field data,
but when cohesion of soil is considered, the values computed has a better approximation.

78
It is important to say that theoretical models tend to overestimate the jacking forces,
however this overestimation provide a safety factor that can be optimized by the designer
of a future pipe jacking project. In addition, theoretical methods do not take into account
the use of lubrication and intermediate jacking stations and its influence on reduction of
jacking forces.
In detailed design stage, designers can do numerical simulations using a finite element
software, considering more information to accurate the value of the jacking forces (J. Yen,
K. Shou, 2015).
Calculation of jacking forces in unstable soils by Auld´s and German standard DWA-A 161
models have shown a difference of 2%. The reason of this is because both methods are
based on the Terzaghi arching theory. Difference between these methods are basically the
magnitude of the width of the affected ground (B), which is 2% greater in the German
Standard compared with the calculated by Auld’s equations. In engineering practice, values
of jacking forces computed by the German Standard are more conservatives than values of
Auld´s method.
79
CHAPTER 5
Public services companies, planners and designers have to evaluate the feasibility of
projects where there is no space for a conventional pipe installation using a typical
construction of a trench, and the study of an alternative solution of a trenchless method like
pipe jacking is required. It is common that designers and planners of water and sewer
projects do not take into account or simply discard trenchless technologies such pipe
jacking due to the limited information available and the lack of experience in this type of
projects in the Aburrá Valley.
This chapter summarizes the results of chapter 4 and presents some application cases in the
Aburrá Valley for a pipe jacking project using geotechnical information presented in
chapter 3.
In addition, some examples will be presented with the objective to help designers and
planners to compute approximated values of the jacking forces required in a project, in
order to establish requirements of civil works and hydraulic jacks capacity. Quantification
of these forces is essential in the different phases of pipe jacking projects
5.1 Methodology to compute the jacking force
A procedure to determine the magnitude of jacking forces in a pipe jacking project is
presented:
1. Input data:
a. Type of project (sewer or water supply)
b. Pipe diameter and pipe material.

80
c. Pipe alignment (plan and profile)
2. Geotechnical parameters
a. Effective angle of friction of the soil (Φ’)
b. Bulk and submerged unit weight of the soil (γ, γ’)
c. Water table (H1)
d. Angle of friction between pipe and soil (δ)
3. Computed jacking forces
4. Variation of jacking forces due to variability of geotechnical parameters. In this
step is studied the uncertainty of the results obtained due to the input data and
geotechnical parameters used.
5. Recommendations for future steps of the project (detailed design).
In numerals 5.1.1 and 5.1.2 some examples of application will be presented in order to
illustrate this methodology.
5.1.1 Practical exaple #1 A sewer project located in the Aburrá Valley is planned to be developed in Itagui
municipality. A hydraulic design was made taking into account the growth of the
population and the demand of water and sewer in the area. The information of the hydraulic
design is as follows:

81
1. Input data:
Table 10. Information for example #1
Pipe material
Internal pipe diameter
(Hydraulic)
Pipe thickness (t)
External pipe
diameter (De)
Pipe strength
(m) (m) (m) (kN/m) Reinforced
concrete 1.20 0.136 1.47 175
Pipe alignment according to figures 45 and 46.
Figure 45. Plan view of the project for example #1

82
Figure 46. Schematic profile view of the project for example #1
As can be seen in Figures 44 and 45, the pipe alignment is crossing an urban area with high
population density. The pipe depth is at least 5.00 m because there are several utilities pipes
crossing along the street.
A typical open-trench installation method for this case would have interference with traffic
and disruption of business or industry in the zone. Additionally, it would require a large
excavation, for this reason, pipe jacking is a practical alternative to study.
2. Geotechnical parameters
Due to the project is in a feasibility stage, there are no geotechnical exploration along the
alignment proposed in the hydraulic design. However, it is necessary for the project planner
to know the magnitude of the civil works and the equipment required for pipe jacking
installation.
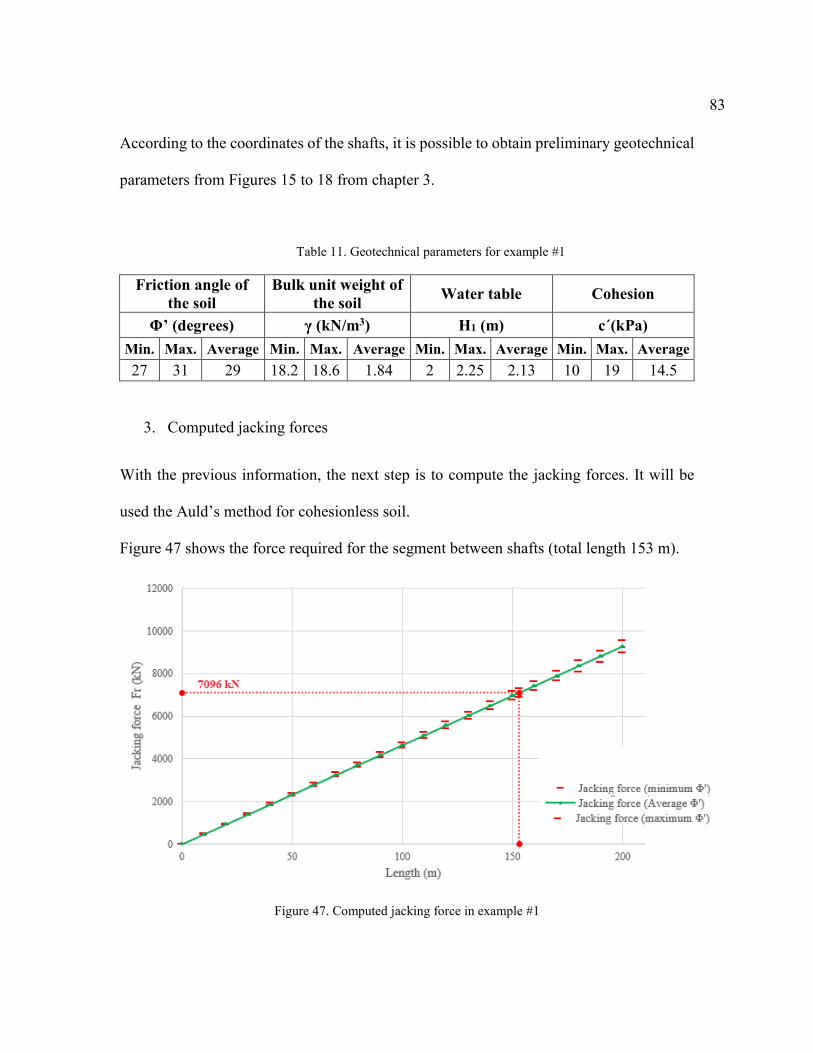
83
According to the coordinates of the shafts, it is possible to obtain preliminary geotechnical
parameters from Figures 15 to 18 from chapter 3.
Table 11. Geotechnical parameters for example #1
Friction angle of the soil
Bulk unit weight of the soil Water table Cohesion
Φ’ (degrees) γ (kN/m3) H1 (m) c´(kPa) Min. Max. Average Min. Max. Average Min. Max. Average Min. Max. Average 27 31 29 18.2 18.6 1.84 2 2.25 2.13 10 19 14.5
3. Computed jacking forces
With the previous information, the next step is to compute the jacking forces. It will be
used the Auld’s method for cohesionless soil.
Figure 47 shows the force required for the segment between shafts (total length 153 m).
Figure 47. Computed jacking force in example #1

84
From Figure 47, it can be seen that the jacking force required for the total length between
shafts is 7096 kN. Additional points (red lines) corresponds to the computed jacking force
for minimum and maximum variation of the angle of friction. The variation is ± 3% respect
to maximum and minimum value of (Φ’).
4. Variation of jacking forces
Step 3 showed the variation of the jacking force for the maximum and minimum values of
the angle of friction. Now, it will be show how the computed force can vary if (γ) is not
constant in the entire length between shafts.
Figure 48 shows how the variability of (γ) affects the magnitude of jacking force.
Figure 48. Variation for jacking force with γ in example #1

85
Figure 48 presents the jacking forces for the minimum, maximum and average values of
(γ):
- Minimum jacking force: 6966 kN (for γmin 18.2 kN/m3)
- Maximum jacking force: 7226 kN (for γmax 18.6 kN/m3)
- Average jacking force: 7096 kN (for γaverage 18.4 kN/m3)
The relative difference between maximum and minimum values respect to the average
is 2%.
5. Recommendations for future steps of the project (detailed design).
According to the analysis carried out in steps 1 to 4, designer and planers of this project
should consider an average value of 7096 kN (jacking force).
Civil works and mechanical equipment as the reaction wall, the internal space for the
shafts, the hydraulic jacks, and other elements need to be dimensioned considering this
jacking force magnitude.
Quantification of this infrastructure is a valuable information to approach the cost of the
project and move on to a next stage of detailed design.
5.1.2 Practical example #2 Geological formations in the Aburrá Valley corresponds to alluvial and slope deposits,
according to geological and geotechnical information described in section 3.3.

86
Most of those deposits have variable thickness in the valley and usually in the first
10 m – 20 m there are soils composed by a gravel, sand and silt with embedded rock balls
(García, 2006).
Taking into account this general information, in this example will be presented the
computed jacking forces using Auld´s theory for cohesionless soils in 10 municipalities of
the Aburrá Valley.
Typical diameters for pipes in which the pipe jacking technique can present economic
advantages will be taken into account (see Figure 3, section 1.4), in order to have
information about the jacking forces needed for each project location. Calculations will be
presented for a typical length of 120 m and installation depth H =5.0 m.
Installation depth of pipe (H) and total length between shafts (Lt) were assumed as fixed
values, because pipe jacking is a trenchless method that offers economic advantages for
depths above 5.00 m and lengths above to 50 m (Ueki, M; Hass, C; Seo, J, 1999). However,
straight distances greater than 120 m are not common, considering the topography
conditions and available spaces in the Aburrá Valley.
Geotechnical parameters for each municipality will be taken according to information from
Armonización de la microzonificación sísmica de los municipios del Valle de Aburrá.
(Universidad de Los Andes, 2016) (see Figures 15 to 18).

87
Table 12. Computed jacking forces in the Aburrá Valley municipalities
Municipality
Geotechnical parameter (average)
Internal pipe diameter
Jacking force
Φ’(°) γ (kN/m3) c´(kPa) H1 (m) Di (m) Fr (kN)
Barbosa 25 15.6 33 2.5
1.00 2259 1.20 3085 1.50 4418 1.80 5830 2.00 6805
Girardota 27 17.1 30 2.75
1.00 2834 1.20 3872 1.50 5551 1.80 7333 2.00 8565
Copacabana 29 18.1 24 3.00
1.00 3306 1.20 4525 1.50 6498 1.80 8597 2.00 10048
Bello 31 17.4 32 2.00
1.00 2700 1.20 3711 1.50 5364 1.80 7132 2.00 8360
Medellin 25 17.0 27 1.80
1.00 2343 1.20 3182 1.50 4536 1.80 5974 2.00 6968
Itagui 29 18.2 15 2.20
1.00 2947 1.20 4033 1.50 5798 1.80 7680 2.00 8984
Envigado 24 16.5 12 1.75
1.00 2166 1.20 2937 1.50 4180 1.80 5497

88
Municipality
Geotechnical parameter (average)
Internal pipe diameter
Jacking force
Φ’(°) γ (kN/m3) c´(kPa) H1 (m) Di (m) Fr (kN)
2.00 6407
Sabaneta 25 16.0 40 3.00
1.00 2605 1.20 3548 1.50 5064 1.80 6666 2.00 7771
La Estrella 27 18.4 28 2.00
1.00 2854 1.20 3886 1.50 5556 1.80 7333 2.00 8563
Caldas 28 18.7 40 2.20
1.00 3052 1.20 4164 1.50 5966 1.80 7886 2.00 9215
Table 12 shows general values of jacking forces that can be used in planning and feasibility
stages in future projects where pipe jacking is a good alternative. These values should be
taken only as a reference and additional studies should be carried out to detail with greater
precision the jacking forces for detailed design and construction.

89
CONCLUSIONS AND PERSPECTIVES
Trenchless technology like pipe jacking must be evaluated considering technical and
economic aspects, in order to have well criteria to select the right construction method for
new pipelines. There are some combinations of installation depths and pipe diameters that
are not recommended for trenchless technologies as presented in chapter 1, for this reason
designers and planners have to study the local conditions of the project, including technical,
environmental and social aspects to recommend the construction method in a specific
project.
Theoretical models presented in this document can be used to compute the jacking forces
in early stages of planning and design, however, designers should estimate the variation of
computed values due to variability of geotechnical parameters.
In detailed design, designers can do numerical simulations using a finite element software,
in order to optimize the required jacking forces during construction (J. Yen, K. Shou,
2015).
Further research should be done in future projects that will be developed in the Aburrá
Valley, in order to study technical aspects on pipes during installation. This could be done
using instrumented pipes with sensors to measure radial and tangential stresses of soil on
pipes, joint deflections, ground movements, settlements, interface friction between pipe
and soil and jacking forces. This investigation would help to validate theoretical and

90
numerical models and allow to have valuable information for the design process of pipe
jacking projects in the Aburrá Valley.

91
REFERENCES
Área Metropolitana del Valle de Aburrá - AMVA. (2006). Microzonificación sísmica
detallada de los Municipios de Barbosa, Girardota, Copacabana, Sabaneta, La
Estrella, Caldas y Envigado.
Arenas, H. L. (2017). EPM con tecnologías sin zanja interviene las redes del centro de
Medellín. Trenchless World Congress: No Dig Medellín 2017.
Auld, F. (1982). Determination of pipe jacking loads. Proceedings of the Pipe Jacking
Association Conference, Manchester, 1982. Pipe Jacking Association. London.
Balairón Pérez, L. (2002). Las tecnologías sin zanja como alternativa a la obra
tradicional. Salamanca: Universidad de Salamanca.
Consorcio CICE. (2011). Informe cálculo presiones, fuerzas gateo y asentamientos.
Túnel interceptor norte del río Medellín. Medellín.
Consorcio CISE. (2011). Diseño detallado y construcción del interceptor del río
Medellín y obras accesorias. Manual de construcción Túnel. Medellín.
Datos Abiertos AMVA. (2019, 1 21). Datos abiertos del Área Metropolitana del Valle de
Aburrá. Retrieved from http://datosabiertos.metropol.gov.co/
Departamento Administrativo Nacional de Estadística (DANE) . (2018). Censo nacional
de población y vivienda 2018. Bogotá.
DWA-A161-Standard. (2014). Working sheet. Statische Berechnung von
Vortriebsrohren.
EPM-51MED23-07RE-0337. (2013). Planos y especificaciones del diseño conceptual y
detallado para la reposición y optimización del sistema de alcantarillado del
sector denominado Centro Parrilla Grupo 1. Medellin.
García, C. (2006). Estado del conocimiento de los depósitos de vertiente del Valle de
Aburrá. Revista Boletín Ciencias de la Tierra.
GICA. (2011). GICA_20111015-CICE_IN_02 Informe final caracterización geológica
geotécnica del intercetor norte. Medellín.

92
Google maps. (2019, 2 11). Google maps. Retrieved from
https://www.google.com/maps/@6.0848199,-
75.6119991,20480a,35y,37.09t/data=!3m1!1e3
Gutierrez, J. C. (2015). Technical description of the most important underground
infrastructure projects under construction in Colombia, South America.
International No-Dig Istambul 2015. 33rd International Conference and
Exhibition .
Haslem, R. (1986). Pipe jacking forces; from theory to practice. Proceedings of the
Infrastructure, Renovation and Waste Control Centenary Conference, Northwest
Association. Institution of Civil Engineers.
Ingenieria y Contratos S.A.S. (2013). Fuerzas de gateo Centro parrilla drive 1_C348A-
C359A_S01 BOLIVAR LONG 64m. Medellín.
Ingetec SA. (2013). Anexo 14 - Fuerza de empuje túnel tramo C16 - C14. Medellin.
Ingetec SA - Ingenieros Consultores. (2013). Diseño conceptual y detallado para la
reposición y optimización del sistema de alcantarillado del sector denominado
Centro Parrilla. Anexo F1 Informe de investigaciones geotécnicas. Sector 1.
Medellín.
International Society for Trenchless Technology. (2018). Retrieved from
http://www.istt.com/index/why-trenchless
J. Yen, K. Shou. (2015). Numerical simulation for the estimation the jacking force of
pipe jacking. Tunnelling and Underground Space Technology.
Milligan, G. W., & Norris, P. (1993). The performance of concrete jacking pipes during
installation. Report N° OUEL 1986/93 University of Oxford, 5.
Milligan, G. W., & Norris, P. (1999). Pipe-soil interaction during pipe jacking.
Proceedings of the Institution of Civil Engineers-Geotechnical Engineering, Vol.
137. pp 27-44.
Montoya, R. A. (2017). Visión de EPM sobre las tecnologías sin zanja en la construcción
y rehabilitación de redes de acueducto y alcantarillado. Trenchless World
Congress: No Dig Medellín 2017.

93
Najafi, M. (2010). Trenchless technology piping. Installation and inspection. New York,
USA: McGraw-Hill.
Reyes, R. G. (2017). Túneles y microtúneles en suelos urbanos. Trenchless World
Congress: No Dig Medellín 2017. Medellín.
Ripley, K. J. (1989). The Performance of Jacked Pipes. Doctoral Thesis. Oxford:
University of Oxford.
Staheli, K. (2006). Jacking force prediction: An interface friction aproach based on pipe
surface roughness. Doctoral Thesis. Atlanta: Georgia Institute of technology.
Terzaghi, K. (1943). Theoretical Soil Mechanics. New York: Wiley and Sons.
Tomlinson, M. J. (1969). Foundation Design and Construction. London: Pintman
Publishing.
Ueki, M; Hass, C; Seo, J. (1999). Decision tool for microtunneling method selection.
Journal of construction engineering and management. ASCE.
Universidad de Los Andes. (2016). Armonización de la microzonificación sísmica de los
municipios del Valle de Aburrá e inclusión de los corregimientos de Medellín.
Bogotá D.C.