analysis of the size and distribution of the impacts of ... r&d spillover: micro-level analysis...
TRANSCRIPT

Analysis of the size and distribution of the impacts of agricultural trade at the firm and industry levels in developing countries

Analysis of the size and distribution of the impacts of agricultural trade at the firm and industry levelsin developing countries
Edited byManitra A. RakotoarisoaTrade and Markets DivisionEconomic and Social Development Department
Food and Agriculture Organization of the United NationsRome, 2015
Front cover: ©FAO/Joan Manuel Baliellas
©FAO/Christena Dowsett
©FAO/Simon Maina
©FAO/Giuseppe Bizzarri
Back cover: ©M. Namundjebo
Photo credits
The designations employed and the presentation of material in this information product do not imply the expression of any opinion whatsoever on the part of the Food and Agriculture Organization of the United Nations (FAO) concerning the legal or development status of any country, territory, city or area or of its authorities, or concerning the delimitation of its frontiers or boundaries. The mention of specific companies or products of manufacturers, whether or not these have been patented, does not imply that these have been endorsed or recommended by FAO in preference to others of a similar nature that are not mentioned. The views expressed in this information product are those of the author(s) and do not necessarily reflect the views or policies of FAO. ISBN 978-92-5-108963-7 © FAO, 2015 FAO encourages the use, reproduction and dissemination of material in this information product. Except where otherwise indicated, material may be copied, downloaded and printed for private study, research and teaching purposes, or for use in non-commercial products or services, provided that appropriate acknowledgement of FAO as the source and copyright holder is given and that FAO’s endorsement of users’ views, products or services is not implied in any way. All requests for translation and adaptation rights, and for resale and other commercial use rights should be made via www.fao.org/contact-us/licence-request or addressed to [email protected]. FAO information products are available on the FAO website (www.fao.org/publications) and can be purchased through [email protected].
iii
Table of contents
Foreword viiAcknowledgements viiiExecutive summary ix
PART ONE CHAPTER 1: Introduction 3
1.1 Motivations 31.2 Objectives 1.3. Approach 1.4 Organization and overview of this report 6
CHAPTER 2: Trade and R&D spillover effects: implications for firm level analysis in the agricultural sector 9
2.1 Introduction 92.2 R&D spillover: Macro-level analysis 102.3 Conclusions: Part I 192.4 R&D spillover: Micro-level analysis 212.5 Conclusions part II 322.6 Conclusions and implications for future research and agricultural trade 33Appendix A: Measuring stocks of knowledge 37Appendix B: Grossman and helpman on weighting international information flows 38References 39
CHAPTER 3: Investigating the structures of agricultural trade industry in developing countries 49
3.1 Introduction 493.2 Agriculture, agri-business and trade 503.3 Agro-industry trade structure: global perspective 533.4 Developing country perspective 623.5 Agro-industry trade structure: causes and consequences 673.6 Conclusion 74References 76

iv
PART TWO CHAPTER 4: Analysis of trade impacts on the fresh pineapple sector in Ghana 83
4.1 Introduction 834.2 Evolution of the pineapple export industry in Ghana 854.3 Structure/organization of the pineapple export industry 904.4 Some quantitative analyses of trade impacts 954.5 Policy and trade environement 994.6 Strengths weaknesses, opportunities and threats (SWOT) analysis 1064.7 Conclusions and recommendations 107References 110
CHAPTER 5: Market structure and distribution of benefits from agricultural exports: The case of the Philippine mango industry 113
5.1 Introduction 1135.2 Philippine mango industry: review of past trends and studies 1145.3 Method 1215.4 Results 123References 132
CHAPTER 6: Conclusions 133
6.1 Main findings 1346.2 Implications for the promotion of agro-industry growth 1376.3 Looking ahead 139
LIST OF BOXES
Box 3.1 Other rice trading companies 60Box 3.2 Other major vegetable oil traders 60Box 3.3 Sime Darby Berhad 63Box 3.4 The case of CP foods 64Box 5.1 The Philippines 115
v
LIST OF TABLES
Table 2.1 Typology of goods 13Table 2.2 Trader’s entry and exit 25Table 2.3 Distribution of US exporting firms 28Table 3.1 Share of agriculture and agribusiness in GDP, selected developing
countries, recent years (%) 50 Table 3.2 World merchandise exports, total and selected item, 1995–2010 52Table 3.3 Concentration ratios in selected food industries in the US (%) 53Table 3.4 Schema for characterizing the structure of global agro-industry 54Table 3.5 Size indicators of top global input suppliers, 2007 (USD million) 55Table 3.6 Concentration indicators in agricultural input industries, global markets,
1994 and 2009 55Table 3.7 Top twenty companies with agricultural production as core business, 2007 56Table 3.8 Share of global packaged food retail sales, by manufacturer, 2007 (%) 57Table 3.9 Four-firm concentration ratios (CR4) in selected food products, 2007 (%) 58Table 3.10 Revenues and business activities of top global agricultural logistics companies (2008) 59Table 3.11 Annual sales of top ten global retailers, in $ billions, 2006 61Table 3.13 Marketing boards for importables in selected developing countries 67
Table 4.1 List of Interviewees 85Table 4.2 Fairtrade certified pineapple exporters 89Table 4.3 List of major fresh pineapple exporters 91Table 4.4 Land size and staff strength of current exporters of fresh pineapples 93Table 4.5 Comparison of some production indicators Ghana vs. Costa Rica 94Table 4.6 Correlation 95Table 4.7 Impact of MD2 shock on export volumes (in pallets) 97Table 4.8 Impact of MD2 shock on export quantities (a deeper look at the effect
of MD2 conversion) 97Table 4.9 Impact of MD2 shock on export shares 98Table 4.10 Impact of MD2 shock on export shares (a deeper look at the effect of
MD2 Conversion) 99Table 4.11 Determinants of export per worker 101Table 4.12 Determinants of export volume 101Table 4.13 Determinant of export shares 102Table 4.14 Determinant of capital intensity (Land size/Number of worker) 102Table 4.15 SWOT analysis of the pineapple industry in Ghana 106
Table 5.1 Production cost of mango, 2010 117Table 5.2 Distribution of mango farmers by size of farm and type of tenure, 2001 (percent) 117Table 5.3 Price margins for mango by market level, in percent, 2002 119Table 5.4 Marketing costs and farmgate price of mango in selected provinces, in P/kg (2001) 119Table 5.5 Net margins by stage of marketing chain, selected locations 120Table 5.6 Distribution of respondents 121Table 5.7 Characteristics of enterprises average and enterprise heads 126Table 5.8 Summary statistics of the enterprise variables 128

vi
Table 5.9 Pairwise correlation coefficients of selected enterprise variables 128Table 5.10 Results of least squares regression on unit revenue 129Table 5.11 Results of log-linear least squares regression on logarithm of unit revenue 130Table 5.12 Results of log-linear least squares regression on logarithm of RKG (Pctexp dropped) 130
LIST OF FIGURES
Figure 2.1 Growth and productivity measurement 11Figure 2.2 Knowledge spillovers: the narrowing information channel 17Figure 2.3 Griliches (1963) Distribution of US commercial farms by sale 21Figure 2.4 Firm’s entry and exit 24Figure 2.5 A flow-chart interpretation of the Melitz model 26Figure 2.6 Distribution of a 10% liberalization on French firms by size decile 32
Figure 3.1 World agricultural exports, 1961-2009, in constant $, (1984=100) 51Figure 3.2 Top ten agricultural exporters , by country category, 2009 ($ billions) 52Figure 3.3 Figure 3.3: Shares in the global food retail market by type of retail outlet, 2009 61Figure 3.4 Export supply chain concentration ratios, selected countries 65
Figure 4.1 Export volumes of sea and air freighted pineapples from Ghana (1994 – 2011) 86Figure 4.2 Number of fresh pineapple exporters in Ghana 89Figure 4.3 Value chain map of fresh Pineapple exports 91Figure 4.4 Contribution of exported pineapple volumes to total horticultural
volumes in Ghana 1998 - 2010 92Figure 4.5 Percentage contribution of horticulture to agricultural exports from Ghana 92Figure 4.6 Destination ports in Europe receiving sea freighted pineapples from Ghana 93Figure 4.7 Destination of fresh pineapple exports from Ghana 93Figure 4.8 Profitability analysis Ghana vs. Costa Rica HA 105
Figure 5.2 Area (in ‘000 ha) and yield (t/ha) of mango, 1990 – 2010 115Figure 5.2 Mango production in the Philippines by island group, 1990 - 2011 (‘000 t) 115Figure 5.3 Area (in ‘000 ha) and yield (t/ha) of mango,1990 – 2010 116Figure 5.4 Mango production in the Philippines by island group, 1990 - 2011 (‘000 t) 116Figure 5.5 Average farm size of mango farms by region, 2002, in ha 117Figure 5.6 Marketing channels for the mango value chain 118Figure 5.7 Exports under the reference and alternative scenario, ‘000 t 124Figure 5.8 Production under reference and no-export scenarios, ‘000 t 124Figure 5.9 Exports under the reference and alternative scenario, ‘000 t 124Figure 5.10 Production under reference and no-export scenarios, ‘000 t 124Figure 5.11 Exports under the reference and alternative scenario, ‘000 t 125Figure 5.12 Production under reference and no-export scenarios, ‘000 t 125Figure 5.13 Scatterplot diagram between unit revenue (RKG) and enterprise assets 127Figure 5.14 Scatterplot diagram between unit revenue(RKG) and enterprise assets, in natural
logarithm 127

vii
Foreword
Linking agricultural production to export markets is viewed as one of the best means to increase farmers’ market and income opportunities. Because agro-trading firms are often the main interface between local farm production and foreign markets, understanding how these firms are structured and how they behave in identifying trade opportunities and sharing trade benefits is highly important from various perspectives.
This book compiles a series of studies on the structure and behavior of agro-trading industries in developing countries, with the aims of investigating the size and distribution of trade impacts among agro-trading firms and providing implications for agricultural and industrial policies. It offers a blend of theoretical reviews and empirical case studies, combining analytical techniques with primary survey data on farmers, workers and agro-exporters in a number of
developing countries. The case studies highlight the strong correlation between the organization and behavior of firms in the agro-export industries and the size and distribution of trade impacts. The impacts on upstream input owners such as firm workers, and especially farmers, are also examined. What mainly stands out from the analyses is that beside the necessary actions to improve market access, efforts to provide a stable supply of high-quality agricultural products to agro-industries are key to capturing trade opportunities.
The numerous findings reported in this book represent an important contribution and constitute a basis for further applied studies, offering pointed policy implications for enhancing trade benefits through more efficient and effective links between agricultural and trade policies.
Boubaker BenBelhassenDirector
Trade and Markets DivisionEconomic and Social Development Department
Food and Agriculture Organization of the United Nations

viii
This study is the outcome of the fruitful collaboration between FAO and the Government of Australia on a project aimed at finding ways to enhance the benefits from agricultural trade in developing countries. Authors thank Kari Heerman for her valuable insights in designing the questionnaires and her efforts to review the relevant literature. Ramesh Sharma and Jamie Morrison helped initiate the project. The African Center of Economic Transformation (Accra, Ghana) and the Philippine Institute for Development Studies have largely contributed to the conduct of the surveys and analyses in the
case studies. Authors thank the participants at the Seminar ‘Agro-Trading Firms and Industries in Developing Countries: Size and Distribution of Trade Impacts’ (20-21 September 2012, Manila) for their valuables comments and suggestions. The project benefits from the valuables secretarial support provided by Malou Santos, Antonia Caggiani, Joy Masongsong, and Noemi Siquig. Technical support from Rita DiIorio, Rita Ashton and especially Ettore Vecchione who patiently and skillfully formatted this report is gratefully acknowledged. Remaining errors are the editor’s and authors’ own.
Acknowledgements

ix
Executive summary
The size and distribution of the impacts of agricultural trade matter to traders and, more important, to upstream links, including farmers and workers whose income depends on agricultural trade revenues. Because it is generally firms, not countries, that practice trade, the size and distribution of the impacts of agricultural trade in developing countries are better examined at the firm and industry level. The main purpose of the studies compiled in this report was to analyse the size and distribution of trade impacts among heterogeneous agro-trading firms in developing countries, with special attention given to the role of the organization and behaviour of these firms. The studies included reviews of theories and evidence regarding trade impacts at the firm and industry level, as well as four case studies examining the size and distribution of trade impacts for selected agro-industries. The aim was to provide suggestions for targeted policies and efforts to enhance trade benefits among firms and input owners (farmers and workers) in upstream links.
The reviews of the literature and preliminary investigations pointed to the difficulties of applying the macro-economic theories of trade impacts, such as R&D spillover effects of trade, at the firm and industry levels. Evidence about the size and distribution of trade impacts and the role of the organization and behaviour among trading firms in developing countries, remained scarce. Many agro-trading industries in developing countries, however, were found to be concentrated on a few large firms; these firms were not necessarily colluding but did engage in various forms of cooperation to enhance trade gains. These early indications had to be confirmed in the case studies.
The case studies covered the exports of pineapple in Ghana, horticultural products in Indonesia, mango in the Republic of the Philippines, and cashew nut in the United Republic of Tanzania. These agro-processing and exporting industries were found to be concentrated in a few large firms holding large export shares. Cooperation among the larger
firms in the case studies (especially in Ghana and the Philippines) focused generally not on controlling prices but on taking collective actions to negotiate for better export prices and favourable export policies (especially low export tax) with their buyers and local governments. Agro-export industries in the case studies had benefitted from trade expansion (even for the pineapple export industry of Ghana, contrary to prior fears that the industry would disappear). Firms with large financial and physical capital assets got the largest trade benefits, in the forms of market share and profit margins. Benefits from exports were also found to be positively correlated with the skill level of employees, the education level of workers/managers, the total number of years in business, firms’ ability to link with other firms, and their proximity to the export markets.
There were however a few surprises. One surprise was that although tariff and non-tariff barriers still held export back, they were not the primary concern of the managers. The main concern was that these agro-exporting firms had many export opportunities but could not keep up with the high and rising export demand. The main reason was that the firms could not find stable supplies of good quality raw materials. Another surprising result was the resilience of small- and medium-sized firms. This seemed to have come from their flexibility to manage risk by hiring and firing inputs quickly. In some cases, these small- and medium-sized firms were found to be as input productive as the large firms. Low productivity and high landing costs seemed also to be common causes of lack of competitiveness of the firms.
These findings have led to important implications, with the main priority to enhance agricultural trade benefits by raising the amount and quality of raw materials. Technical and institutional supports to production of raw materials and swift decision to correct the often inconsistent and erratic production and trade policies would be needed to achieve this end.

PART
ONE
©FAO/Roberto
Faidutti

3Chapter 1: Introduction
1.1 Motivations
The size and distribution of the impacts of agricultural trade matter to traders and, more important, to upstream links, including farmers and workers whose income depends on trade revenues. Because it is generally firms, not countries, that practice trade, the size and distribution of the impacts of agricultural trade in developing countries are often better examined at the firm and industry levels. However, trading firms are heterogeneous, i.e. they are not symmetric but differ on the bases of their characteristics (cost, lifespan, market share, asset size, etc.), decisions and strategies; such heterogeneity may define how trade impacts are distributed among them and the farmers and workers linked to them. This heterogeneity and the overall trade impacts of these trading firms are likely evident in the firms’ organization within their industry and the ways they handle trade opportunities and challenges.
Little is known, however, about the distribution of trade impacts among firms, and information about the organization and behaviour of agro-trading firms in developing countries is particularly scarce. To fill this void, the Australian Government and the Food and Agricultural Organization of the United Nations launched a series of in-depth studies on the theory and evidence linking the role of organization and behaviour of heterogeneous agro-trading firms to the size and distribution of trade impacts. The aim was to provide guidance for targeted policies and efforts to enhance agricultural trade benefits among firms and input owners in upstream links.
1.2 Objectives
The main purpose of the studies compiled in this report was to analyse the size and distribution of trade impacts among heterogeneous agro-trading firms in developing countries, with special attention given to the role of the organization and behaviour of these firms. These studies adopted a broad definition of “heterogeneity” but mainly emphasized the firms’ characteristics (size, age, operating costs, etc.) and their strategies and decision in facing market challenges and opportunities. The focus was on selected agro-export industries that contributed significantly to the countries’ agricultural export revenues. The results of the analysis were aimed at drawing implications for the size and distribution of trade benefits at levels of the firms and industry, the upstream links, and ultimately the input owners. The study had three specific objectives, described next.
The first objective was to review the theory and evidence regarding the structure of the agro-trading industry in developing countries, which included each of the following aims:
• To define and to describe a typology of the organization/structure of the agricultural trade industry in developing countries.
• To identify the prevailing structure(s) of the agricultural industry in developing countries.
• To analyse and to compare, based on the main types of industry structure, how new trading opportunities might affect the industry structure, and how trade benefits are likely to be distributed among firms within the agricultural industry.
Chapter 1: Introduction

4 Analysis of the size and distribution of the impacts of agricultural trade at the firm and industry levels in developing countries
• To identify technical challenges and proposed solutions in the estimation of the distribution of trade benefits for agro-industries in developing countries.
• To identify the factors influencing the entry and exit of trading firms, specifically the levels of entry barriers and other possible hindrances such as regulation, limit pricing, operating cost, and level of access to raw materials.
• To discuss the links between the main causes of the industry structure and the distribution of potential trade benefits.
The second objective was to analyse the organization and behaviour of selected agro-export industries in developing countries and their trading environments, which included each of the following aims:
• To identify the size of the export industry (in comparison with other agricultural exports) as well as conditions affecting export within the industry, such as regulations, comparative advantage, or abundance in factor endowment.
• To identify exporting firms as well as their input and output markets, degrees of integration, input sources, market destinations, and market shares.
• To determine the levels of industry concentration, competition among firms, market power, and entry and exit rates.
• To identify the exporters’ strategies to ‘win’ versus the importers, their strategies when dealing with inputs and service providers, and the size and distribution of trade gains.
• To document past successes of these exporters’ strategies, effectively enhancing trade gains for exporting firms and influencing the distribution of trade benefits.
• To explore the evidence for productivity effects (R&D spillover effects) of processed product export on the domestic country’s R&D stock and on the industry’s R&D.
• To identify trade policies and barriers in foreign markets.
• To perform a rapid assessment of current and past policies, including agricultural trade
policies (subsidy, taxation, regulations) for domestic markets, and to document how these policies affect (or might be expected to affect) industries’ and trading firms’ behaviour.
• To analyse how the trading environment and the firms’ responses might affect the distribution of trade benefits.
The third objective was to provide quantitative analyses of the main determinants of the size and distribution of trade, which included each of the following aims:
• To define valid and tractable indicators of trade benefits that arise from the data.
• To discuss all possible factors, including organization and behaviour, that influence the level and distribution of trade benefits among the heterogeneous firms.
• To describe how trade benefits spill from the trading firms to their upstream or downstream domestic links.
• To provide implications of the findings for the distribution of potential trade gains on upstream and downstream links.
• To use quantitative methods to determine what influences the level and distribution of trade benefits among firms and industries, with particular focus on the role of organization and behaviour of trading firms; and
• To discuss the implications of the findings for enhancing the ability of trading firms and their upstream and downstream links to capture trade benefits and opportunities.
1.3 Approach
The study relied on investigations of the heterogeneous firms’ activities to collect information that would provide the bases for quantitative analyses on the trade impacts at firm and industry levels. In the determination of the size and distribution of trade impacts, the main concern was to provide a standard methodology to ease the comparisons among these industries
5Chapter 1: Introduction
without losing sight of their specificities. The study proceeded in three phases.
• Phase 1. Preliminary and background research
This first phase consisted of a thorough and comprehensive literature review to identify the knowledge gaps in past studies on the distribution of trade impacts among agro-trading firms in developing countries. Specifically this phase included overviews of the theories and evidence of the structure and behaviour of the agro-trading industry in developing countries, to examine how such structure and behaviour affect the size and distribution of trade benefits. For instance, this background research addressed how to define a trade-impact indicator among firms, how trade impacts such as research and development and technology spillover from trade could be estimated, and what information was missing in the literature to perform such estimation. More important, this phase aimed to specify relevant hypotheses to be tested in the case studies and to refine the topics, activities and information needed for the survey and case studies.
• Phase 2. Survey design and preparation for the case studies
This second phase involved secondary data collection on firms and industries and preliminary surveys of key stakeholders. The aim of this second phase was to refine the approach and specify resources needs to make the investigation feasible. This second phase included the design of the case studies, preparation of the survey questionnaires, and especially the selection of case studies. The selection of the industries and countries for the case studies was based on the following criteria:
1. The importance of the agricultural trade industry in the country’s agricultural trade revenues and economy.
2. The presence of an agro-industry featuring heterogeneous firms that have been
increasingly involved in international trade in recent years.
3. The presence of at least one processing stage (e.g. treatment, storage, or packaging) within the export industries to illustrate the link between export firms and upstream links and to capture intra-industry trade.
4. Data availability and reliability.5. Geographical and regional diversity,
preferably spreading the studies between Africa and Asia.
• Phase 3. Case studies
The third and most important phase was the case studies themselves. Their main purposes were (i) to gather information on heterogeneous firms in agro-industries that had been involved in exporting or importing agricultural products in recent years, and (ii) to analyse the determinants of the size and distribution of trade impact, focusing on the role of organization and behaviour of the trading firms. The four countries and agro-industries selected for the case studies were:
• Ghana’s pineapple processing and export industry.
• Indonesia’s horticultural (vegetable and tropical fruit) export industry.
• the Philippines’s mango processing and export industry, and
• Tanzania’s cashew nut export industry.
All case studies started with formal surveys of key stakeholders. The surveys were carried out at three levels: the institutional (e.g. marketing boards, officials at the ministry of industries or trade), industrial (e.g. associations of traders, Chambers of Agriculture or Industry), and individual firm levels. Particular focus was put on the roles of the organization and behaviour of the trading firms. The surveys of individual firms included detailed inquiries about the firms’ production costs and output sales (including export revenues), as well as their strategies and interactions with other firms as they sought to benefit from arising trade opportunities.
6 Analysis of the size and distribution of the impacts of agricultural trade at the firm and industry levels in developing countries
The data obtained from the surveys were analysed using quantitative methods to estimate the size and distribution of trade impacts. The model took into account the heterogeneity of the trading firms and the role of their organization and behaviour. The analysis also highlighted the interactions of the decisions among trading firms and between the industry and other stakeholders (including the government) in capturing and distributing trade impacts.
1.4 Organization and overview of this report
Following this introductory chapter, Chapter two by Roehlano Briones provides a broad overview of information about agro-processing and agro-trading firms in developing countries. It mainly emphasizes the link between the organization of agro-business firms and agro-trading firms, demonstrating that agro-trading is often concentrated on few firms. It also reveals some of the key impact indicators commonly used in the literature. Chapter three by David Skully analyses how the macro and trade theory on the R&D spillover effect of trade can be considered to fit firm- and industry-level analyses. This chapter reviews the theories on growth and international trade in the literature and details the problems of applying these theories to the measure of productivity and R&D spillovers on agro-firms. These first two chapters, along with this introduction chapter, constitute Part one of this report. Taken together, they reveal that despite all interests in agro trade in developing countries, there is strikingly little information for decision making. This background work motivates the case studies.
Part Two of this document consists of a series of syntheses of the four case studies. By coincidence, all the agro-industries chosen for the analysis were tropical fruits (pineapple in Ghana, horticultural products in Indonesia, mango in the Philippines and cashew in Tanzania)1. In its
1 The Indonesia and Tanzania studies will be reported in a separate report.
conception, the collection of studies sought to cover a wider range of commodities including livestock products and food grains, but the preliminary investigations concluded that tropical products were more suitable. The three main reasons discovered at the preliminary phase were that (i) data on the structure and level of exports for these tropical products at the firm levels are more tractable than that for other commodities (such as livestock products); (ii) these commodities often involve more distinct, hence, more tractable processing stages before exports; and finally (iii) the agro-export industries for these tropical products had been least studied in the past and deserve greater attention because of their significant contribution to the local and national economies.
Chapter four opens the series of case studies and focuses on the pineapple export in Ghana. This study on pineapple export was performed by Julius Kariuki and his research team from the Accra-based African Center of Economic Transformation. This work chooses export (volume and value) shares as trade-impact indicators and attaches much importance to the link between the varietal shift of pineapple export since 2004 and pineapple export impacts (benefits and losses) in Ghana. It delves into how the structural changes in the pineapple export market marked lasting effects on the organization of producers and exporters of pineapple. Chapter five by Roehlano Briones and his team at the Philippines Institute of Development Studies analyses the size and distribution of the impacts of mango exports from the Philippines. The authors use both market shares and export unit margins as trade-impact indicators. This chapter analyses the link between vertical integration of the leading companies and the impacts that such structure has on the industry. The authors also looked into how external shocks in the world mango demand and prices may affect the Philippines’mango production and export.
Chapter six summarizes the main findings of the overall study and shows that there are many similarities among the case studies in both the structure of industries and the determinants of

7Chapter 1: Introduction
trade impacts. The last chapter also emphasizes the policy implications of the findings and hints at the direction that future studies should consider.


9Chapter 2: Trade and R&D spillover effects: Implications for firm-level analysis in the
agricultural sector
* This chapter was written by David Skully (FAO Consultant) and Manitra A. Rakotoarisoa (Economist, Trade and Markets Division, FAO). This chapter expresses the personal opinions of the authors.
Chapter 2: Trade and research and development spillover effects: implications for firm-level analysis in the agricultural sector *
2.1 Introduction
This paper provides a critical review of the economic literature on the relationship between international trade and research and development (R&D) spillovers with the aim of finding ways to track the spillover effects of agricultural trade at firm and industry levels. The term R&D spillover refers to the spread or diffusion of knowledge between countries, industries, or firms. New technological and managerial information can be used by firms to increase efficiency, which leads to improved aggregate income and welfare. Innovation and the application of knowledge is the central engine of economic growth in both the growth theory of the 1950s and 1960s and in endogenous growth theory, which emerged in the late1980s.
The first part of the paper focuses on the empirical macro-level analysis of international R&D spillovers, in which the country is the unit of analysis. The key relationship is between macro-level productivity and R&D, domestic and foreign. The central question is whether and how international trade causes or influences macro-level productivity growth through international R&D spillovers. The discussion opens with a description of the seminal empirical analysis, Coe and Helpman (1995). Subsequent sections provide the larger theoretical context (growth theory) and discuss the measurement of the key variables: total factor productivity, the stock of R&D capital and estimating spillovers. The first
part of the paper concludes with an assessment of the research to date. The assessment is that although the empirical evidence is consistent with the existence of trade-related R& spillovers hypothesized by endogenous growth theory, the macro-level data do not provide sufficient information to determine how R&D spillovers occur. Because of the limitations of macro-level data, in the last 10 years economists have turned to the construction of micro-level data and the application of micro-level statistical methods to investigate how trade influences productivity.
The second part of the paper turns to the micro-level analysis of productivity change where the individual firm is the unit of analysis. It focuses on heterogeneous-firm models of international trade. The starting point of this literature is the fact that firms differ: they have different productivity levels. This is contrary to the macro-analytical assumption that the economy is composed of multiple representative firms that are homogeneous in equilibrium. Firm-level analysis reveals that relatively few firms engage in international trade; and those that do tend to be larger and more productive than the average firm. Similarly, relatively few firms engage in R&D, and those that do are typically large and highly productive. A central empirical question is whether engaging in international trade causes firms to become more productive. The literature finds some evidence that engaging in trade leads to higher firm productivity through “learning effects” both post pre-trade and post-trade. But

10Analysis of the size and distribution of the impacts of agricultural trade at the firm and industry levels in developing countries
1 0[ ] = + ( ) + ( ) +& &TFP R D R Di i id
domestic if
foreign iβ β β ε
2 0[ ] = + ( ) + ( ) +& * &TFP R D m R Di i id
domestic im
i foreign iβ β β ε
the preponderance of evidence is for “selection effects”: high-productivity firms choose or self-select to engage in international trade. Trade is correlated with productivity growth, but the causal chain is primarily through trade inducing heightened competition and market selection; that is, by less productive firms exiting the market and the reallocation of resources among surviving and entering firms. Thus, the potential contribution of international R&D spillovers is greatly diminished when the trade-productivity relationship is examined at the firm level.
The third part of the paper summarizes the review and discussion, and anticipates some implications for future research. The application of the theory underlying the R&D spillovers of international trade in the agriculture sector in developing countries has remained puzzling. This review explores ways to assess the R&D spillovers of trade at sector and firm levels and contributes to the analysis of the size and impact of agricultural trade at firm and industry levels in developing countries.
2.2 Research and development spillovers: Macro-level analysis
Introduction
The 1980s witnessed two related innovations in economic theory. First, new trade theory emerged at the beginning of the 1980s. It introduced concepts from industrial organization into traditional trade theory; imperfect or monopolistic competition and scale economies play a central role. Second, building on the insights of new trade theory, new or endogenous growth theory emerged toward the end of the 1980s. Monopolistic competition is also central to endogenous growth theory: it provides a coherent incentive for innovative activity, commonly measured as R&D (research and development). Grossman and Helpman’s (1991) book, Innovation and Growth in the Global Economy, is a synthesis of new trade theory and new growth theory; it remains the canonical text, although subsequent empirical research has induced some changes in theory.
One of the first empirical tests of the many propositions derived by Grossman and Helpman (1991) is a paper by Coe and Helpman (1995), “International R&D Spillovers.” The hypothesis is that technological knowledge, measured as R&D, developed in one country spills over to other countries. The spill-in of knowledge can result in increased productivity and growth in the recipient country. Coe and Helpman (1995) test two related hypotheses: first, whether such R&D spillovers exist and second, whether R&D spillovers are positively related to trade. They estimate the following equations for a cointegrated panel of 22 developed countries for the years 1971-1990.2
The first equation expresses a country’s total factor productivity (in a given year, time subscripts are suppressed) as a function of the country’s own (domestic) stock of R&D capital and the combined stocks of R&D capital of the other 21 (foreign) countries. The coefficients for these two variables are found to be positive and significant. The former is consistent with a country’s own R&D contributing to its TFP growth; the latter is consistent with the existence of international R&D spillovers.
The second equation multiplies the foreign R&D term by mi, the country’s imports of goods and services as a proportion of its gross domestic product; this is a measure of a country’s import intensity. The coefficients for both variables are found to be positive and significant. For the import-intensity-weighted foreign-R&D variable, this finding is consistent with the hypothesis that there is a positive relationship between trade, measured as import intensity, and international R&D spill-ins.
The next several sections are devoted to de-constructing Coe and Helpman (1995) and
2 The paper also includes other specifications. Note: variables in the estimation equations are in logarithms.
11Chapter 2: Trade and R&D spillover effects: Implications for firm-level analysis in the
agricultural sector
3[ ] =Y A K Lt t t tk lβ β
4 0[ ] = + + +y k lt k t l t tβ β β ε
5 0[ ] = ( ) = + = − −tfp k lt t t t k t l tβ ε β β
placing the paper in its larger theoretical context; in particular, explaining why R&D spillovers are important in endogenous growth theory. Also discussed are problems in measuring the variables in the equations above: total factor productivity, stocks of knowledge or R&D capital, and the empirical representation of R&D spillovers.
TFP – total factor productivity and growth theory
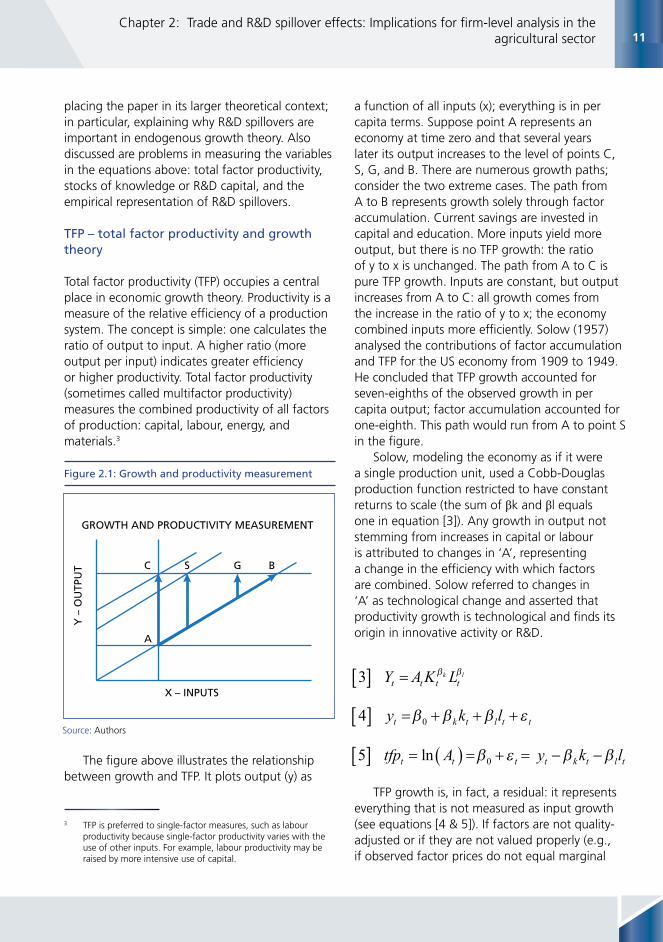
Total factor productivity (TFP) occupies a central place in economic growth theory. Productivity is a measure of the relative efficiency of a production system. The concept is simple: one calculates the ratio of output to input. A higher ratio (more output per input) indicates greater efficiency or higher productivity. Total factor productivity (sometimes called multifactor productivity) measures the combined productivity of all factors of production: capital, labour, energy, and materials.3
The figure above illustrates the relationship between growth and TFP. It plots output (y) as
3 TFP is preferred to single-factor measures, such as labour productivity because single-factor productivity varies with the use of other inputs. For example, labour productivity may be raised by more intensive use of capital.
a function of all inputs (x); everything is in per capita terms. Suppose point A represents an economy at time zero and that several years later its output increases to the level of points C, S, G, and B. There are numerous growth paths; consider the two extreme cases. The path from A to B represents growth solely through factor accumulation. Current savings are invested in capital and education. More inputs yield more output, but there is no TFP growth: the ratio of y to x is unchanged. The path from A to C is pure TFP growth. Inputs are constant, but output increases from A to C: all growth comes from the increase in the ratio of y to x; the economy combined inputs more efficiently. Solow (1957) analysed the contributions of factor accumulation and TFP for the US economy from 1909 to 1949. He concluded that TFP growth accounted for seven-eighths of the observed growth in per capita output; factor accumulation accounted for one-eighth. This path would run from A to point S in the figure.
Solow, modeling the economy as if it were a single production unit, used a Cobb-Douglas production function restricted to have constant returns to scale (the sum of βk and βl equals one in equation [3]). Any growth in output not stemming from increases in capital or labour is attributed to changes in ‘A’, representing a change in the efficiency with which factors are combined. Solow referred to changes in ‘A’ as technological change and asserted that productivity growth is technological and finds its origin in innovative activity or R&D.
TFP growth is, in fact, a residual: it represents everything that is not measured as input growth (see equations [4 & 5]). If factors are not quality-adjusted or if they are not valued properly (e.g., if observed factor prices do not equal marginal
GROWTH AND PRODUCTIVITY MEASUREMENT
Y –
OU
TPU
T
X – INPUTS
C S G B
A
Figure 2.1: Growth and productivity measurement
Source: Authors

12Analysis of the size and distribution of the impacts of agricultural trade at the firm and industry levels in developing countries
products) then TFP measurement will be biased. In the Cobb-Douglas construction, the benefits of increased ‘A’ are distributed proportionately across all factors in the economy. This is not how technological change manifests itself in the economy. Solow (1960, 1962) proposed the concept of ‘vintage capital’ to represent the stylized fact that new model capital equipment is more productive than earlier vintages. But heterogeneous capital proved difficult to reconcile with an aggregate production function; the concept went dormant and was revived in the 1980s in the microlevel research discussed in the second part of this paper.
There is a tension between accounting for productivity and explaining productivity. Growth accounting is intimately related to national income accounting; without national income accounting data it is impossible to measure macro-level productivity. Economists concerned with national income accounts are appropriately obsessed with proper measurement of inputs and outputs: accounts must balance: something does not come from nothing. A persistent problem is properly accounting for changes in the quality and variety of inputs and outputs. Solow’s (1957) estimates were not based on quality-adjusted input or outputs; Solow considered quality improvements to be a form of technical change.
Griliches (1963) identified several potential sources of error in aggregate TFP measurement. Equation [6] expresses TFP growth in terms of growth rates; s represents the factor share of capital, and (1-s) the factor share of labour.4 The sources of error are: the quantity and quality of labour (l); the quantity and quality of capital services (k); the relative factor share (s) measure; unmeasured inputs; and economies of scale.5
4 That is, k is the growth rate of capital, etc. This equation assumes constant returns to scale and no other productive factors than capital and labour.
5 Griliches’ (1963) notion of economies of scale is discussed in part II of this paper.
Jorgenson and Griliches (1969, 1972) acted on Griliches’ diagnosis. Adjusting inputs and outputs for changes in quality and factor-utilization and depreciation rates, they found that at least 70 percent of measured U.S. output growth could be attributed to factor accumulation. These adjustments shift the growth path rightward to point G in the figure. Jorgenson and Griliches emphasized that attributing growth to measured changes in input quality does not explain how or why the changes in quality occurred. But it clarifies the task of explaining growth because it distinguishes between measured contributions to growth and unmeasured contributions. They argued that only the latter, unmeasured (or immeasurable) elements belong in the productivity residual.
Debates over whether and how to adjust inputs for quality changes continue. For example, the information and communication technologies (ICT) sector is R&D intensive and exhibits large annual quality improvements. The average $1 000 2012 laptop computer is over 100 000 times more powerful than the mainframe computers of the early 1960s, which cost more than $10-million 2012 dollars. If the exponential decline in computing costs is not factored into the measure of ICT capital, then ICT capital is understated and the productivity residual is erroneously increased. Despite efforts to harmonize national income accounting systems, OECD countries still differ in methods of quality adjustment for national income accounts. For the 1990s, the U.S. ICT deflator averaged -20 percent annually, the U.K. deflator was -13 percent and for Germany, -8 percent. ICT prices are global: they differ little between countries; differences in ITC deflators result in enormous cumulative differences in measured factor accumulation.6 Thus, national differences in accounting methods contribute to differences in reported productivity residuals. Similarly, differences in tax systems can bias measured factors shares. In sum, the productivity residual, besides being the repository of
6 See Schreyer (2002) on ITC bias and Schreyer (2001, 2009) on OECD measurement standards.
6 1[ ] = − − − )tfp y sk s l
13Chapter 2: Trade and R&D spillover effects: Implications for firm-level analysis in the
agricultural sector
measurement errors, also contains essentially arbitrary information resulting from different national fiscal and accounting conventions. Even among OECD member nations TFP comparisons are fragile; and data quality tends to be more problematic outside the OECD.
Jorgenson has continued research on TFP measurement; Jorgenson and Vu (2011), for example, calculate a variant of equation [6] that includes factor quality and quantity and distinguishes between IT (information technology) capital and other capital for 122 countries. Better growth accounting and factor measurement reduces the productivity residual: Jorgenson and Vu find that input growth (factor accumulation) is by far the most important determinant of economic growth: the share contributed by TFP varies from country to country and period to period but it generally accounts for between 15 and 20 percent of growth. This is almost the exact complement of Solow’s initial calculations that TFP accounts for over 85 percent of growth. Although significant advances have been made in the conceptualization and measurement of TFP, our measurements, particularly at the aggregate level, lack precision; this limits their value in econometric analysis. Independent of the challenge of measuring TFP and quality changes in inputs and outputs is the challenge of explaining why change occurs. In the Solow growth model “technical change” is exogenous: it is caused by forces external to the economy. The problem for what is now called “exogenous” growth theory (the growth theory of the 1950s and 1960s) was to devise an aggregate-level economic theory of innovation, thus making “technical change” endogenous.
Knowledge, innovation and research and develpment spillovers
There was considerable economic research at the micro-level on the economics of innovation and inventive effort in the 1950s, but Arrow (1962) is regarded as the seminal contribution. Arrow identified the central problem in the economics of innovation: innovation is the generation of new
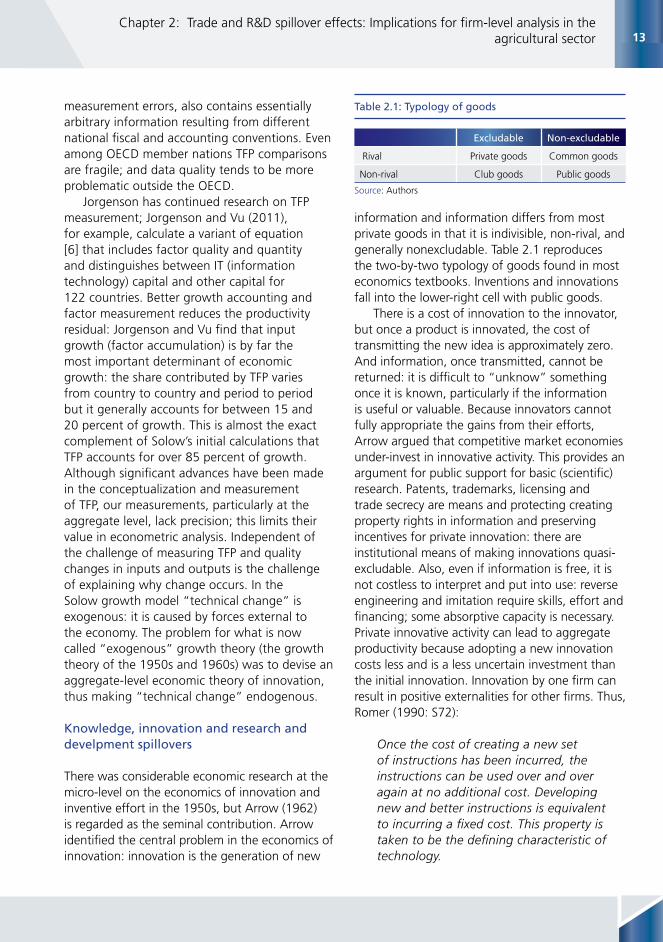
information and information differs from most private goods in that it is indivisible, non-rival, and generally nonexcludable. Table 2.1 reproduces the two-by-two typology of goods found in most economics textbooks. Inventions and innovations fall into the lower-right cell with public goods.
There is a cost of innovation to the innovator, but once a product is innovated, the cost of transmitting the new idea is approximately zero. And information, once transmitted, cannot be returned: it is difficult to “unknow” something once it is known, particularly if the information is useful or valuable. Because innovators cannot fully appropriate the gains from their efforts, Arrow argued that competitive market economies under-invest in innovative activity. This provides an argument for public support for basic (scientific) research. Patents, trademarks, licensing and trade secrecy are means and protecting creating property rights in information and preserving incentives for private innovation: there are institutional means of making innovations quasi-excludable. Also, even if information is free, it is not costless to interpret and put into use: reverse engineering and imitation require skills, effort and financing; some absorptive capacity is necessary. Private innovative activity can lead to aggregate productivity because adopting a new innovation costs less and is a less uncertain investment than the initial innovation. Innovation by one firm can result in positive externalities for other firms. Thus, Romer (1990: S72):
Once the cost of creating a new set of instructions has been incurred, the instructions can be used over and over again at no additional cost. Developing new and better instructions is equivalent to incurring a fixed cost. This property is taken to be the defining characteristic of technology.
Excludable Non-excludable
Rival Private goods Common goods
Non-rival Club goods Public goods
Table 2.1: Typology of goods
Source: Authors

14Analysis of the size and distribution of the impacts of agricultural trade at the firm and industry levels in developing countries
Research on the economics of innovation and R&D expanded in the 1960s and 1970s. Griliches and his students at Harvard and collaborators through NBER were central to this research program.7 Griliches (1979) modified the Solow model, rewriting equation [3] as:
In [7], for the i-th firm in an industry, the variable X represents all conventional inputs (capital and labour, properly measured and quality-adjusted); R represents the stock of R&D knowledge produced by the firm; and S represents the stock of ‘outside’ knowledge that the firm can draw upon, specifically, the R&D produced by other firms in the industry. Griliches imposed constant returns to scale on the firm’s own inputs (X and R) to emphasize that the knowledge spill-in of S can result in increasing returns. The summation of R&D in the industry, by construction, equals S; and the industry production function can be written as [8]:
This yields “an aggregate production function with the coefficient of aggregate knowledge capital being higher (β + ϒ) than at the micro level (β only), since at the aggregate level it reflects not only the private but also the social returns to research and development.”8 (Griliches (1979[1998:29]) Thus the R&D spillover was well-
7 Much of this work is collected in Griliches (ed.) (1984) and (1998); Terleckyj (1974) and Mansfield et al. (1977) are important contributions from this period.
8 Griliches continues, setting out the research program that is now being realized: “The above formula provides a framework for reconciling micro and macro results in this area. Of course, this formula is rather simplistic and is based on a whole string of untenable assumptions, the major ones being: the assumption of constant returns to scale with respect to Xi and R, and the assumption of common factor prices for all firms within an industry. These assumptions could be relaxed. This would add a number of “mix” terms to the equation, indicating how aggregate productivity would shift if the share of, say, the larger firms, were to increase (as in the case of economies of scale).”
defined by 1979. The means of appropriating R&D had been investigated by Levin et al. (1987) and Levin and Reiss (1988) but a consistent incentive mechanism for undertaking R&D was still missing.
Endogenous growth theory
The key to endogenizing innovation in growth theory was the revival of Chamberlin’s concept of monopolistic competition by Spence (1976) and Dixit and Stiglitz (1977). Dixit and Stiglitz devised a model of consumer demand for variety: it provided an elegant mathematical representation of the proliferation of similar yet distinct branded products (e.g., shampoos, breakfast cereals, running shoes). In their model, a firm developing a new variety can expect to recoup its costs and earn a reasonable profit from the premium charged to consumers. Such markets are not perfectly competitive; rather, each firm producing a distinct product enjoys a limited monopoly; thus, monopolistic competition.
New applications of their model were quickly realized.9 Krugman, Brander, Lancaster and Ethier (among others) employed the model to explain the existence of intra-industry trade, which had been an annoying anomaly in modern trade theory. Krugman (1979, 1980) showed the link between variety and scale economies.10 Ethier (1982) applied the demand for variety model to trade in intermediate inputs: when firms have a longer menu of inputs to choose from they have a greater chance of realizing productivity-improving input combinations; thus trade in intermediate goods is a potential source of TFP growth.
In the mid-1980s Romer (1986) and Lucas (1988) reignited interest in growth theory. Using competitive market assumptions, both authors proposed a source of positive aggregate
9 Wilfred Ethier (2004: 149) describes the Dixit-Stiglitz model as providing a versatile “tool”. Dasgupta and Stiglitz (1980a, 1980b) address the incentives for R&D under imperfect competition.
10 Economies of scale are a potential source of TFP growth but one excluded by the constant returns to scale assumption of Cobb-Douglas aggregate production functions used in growth theory.
7 1[ ] = −( )Y A X R Sit t it it itβ β γ
8 1[ ] = − +( )Y A X St t t tβ β γ

15Chapter 2: Trade and R&D spillover effects: Implications for firm-level analysis in the
agricultural sector
growth externalities. Lucas’s model is based on externalities from increases in human capital; Romer’s model is based on externalities from increases in the stock of knowledge. The conceptual synthesis came with Romer’s (1990) article, “Endogenous Technical Change”, which synthesized growth theory and monopolistic competition.
First, nonrival goods can be accumulated without bound on a per capita basis, whereas a piece of human capital such as the ability to add cannot. Each person has only a finite number of years that can be spent acquiring skills. When this person dies, the skills are lost, but any nonrival good this person produces … lives on after the person is gone. Second, treating knowledge as a nonrival good makes it possible to talk sensibly about knowledge spillovers, that is, incomplete excludability. These two features of knowledge—unbounded growth and incomplete appropriability—are features that are generally recognized as being relevant for the theory of growth.11
Endogenous growth models explicitly include knowledge, a nonrival input, in the aggregate production function of the economy. This relaxes the constant-returns-to-scale assumptions of Solow (exogenous) growth theory: the aggregate economy exhibits increasing returns to scale.12
Endogenous growth models have three sectors: the core is a monopolistic-competitive durable inputs sector that makes inputs that are used to make consumer goods by a competitive consumer goods sector (the second sector). The third sector is the competitive R&D sector; it is hired to design new technologies for the durable inputs sector. The monopolistic premiums earned by durable input producers provide the funds (and incentive) for contracting R&D work.
11 Romer (1990: S75).
12 Formally: let A be nonrival inputs and X be rival inputs, then F(A, λX) = λF(A,X) and F(λA,λX) > λF(A,X); the production function F (◦) is not homogeneous of degree one: it exhibits increasing returns to scale. Romer (1990:S76).
There are two variants of endogenous growth models – horizontal and vertical – based on the assumptions made about the innovation process. Horizontal models, such as Romer’s, are based on Dixit-Stiglitz assumptions about product variety: innovation results in additional products that are used in combination with existing products.13 An increasing number of products and an increasing stock of knowledge give rise to increasing growth externalities. Vertical models are based on a revival of Schumpeter’s concept of creative destruction: innovations result in higher-quality products or processes that render earlier products and processes obsolete.14 In contrast to horizontal models where the key variable is the number or quantity of product varieties, the key variable in vertical models is the average quality of products and processes. Vertical and horizontal models are formally parsimonious: they represent the endogenous innovation in an aggregate model with two parameters: one for the degree of monopolistic competition and the other for stock of innovation, measured vertically or horizontally, respectively.
In both models, agents invest resources to acquire the exclusive ability to manufacture a new product. Moreover, the R&D activity generates inappropriable spillovers in both cases. In the variety-based growth model, the R&D externality is quite explicit. Each completed product development project lowers the cost of later R&D efforts. In the quality-based model, the externality is implicit. When one improvement project succeeds, other researchers can quit their efforts to achieve that same innovation and begin to work on the next improvement. In both instances we have assumed that by observing the results from one innovative success, researchers can learn scientific and engineering facts that are useful in their own research endeavours.15
13 Romer (1986, 1990) is the classic horizontal formulation. See also, Chapter 3 of Grossman and Helpman (1991a).
14 The initial formulations of the vertical model are Segerstrom, Anant and Dinopolous (1990), Aghion and Howitt (1992) and Chapter 4 of Grossman and Helpman (1991a).
15 Grossman and Helpman (1991b: 54).

16Analysis of the size and distribution of the impacts of agricultural trade at the firm and industry levels in developing countries
The rate of growth of the stock of knowledge is the critical variable in the model. Here is Romer’s (1990: S83) explanation of the innovation process driving the model.
If the researcher possesses an amount of human capital Hj and has access to a portion Aj of the stock of knowledge implicit in previous designs, the rate of production of new designs by researcher j will be δHjAj, where δ is a productivity parameter.
At the aggregate level, the rate of growth in A is the summation over all Hj engaged in R&D: δHA. That higher knowledge growth follows from more human capital employed in R&D is no surprise; what is novel is that a larger stock of knowledge, A, results in a higher rate of growth in A. Again, Romer (1990: S84):
Linearity in A is what makes unbounded growth possible, and in this sense, unbounded growth is more like an assumption than a result of the model. … Whether opportunities in research are actually petering out, or will eventually do so, is an empirical question that this kind of theory cannot resolve. The specification here, in which unbounded growth at a constant rate is feasible, was chosen because there is no evidence from recent history to support the belief that opportunities for research are diminishing.
Subsequent empirical research has tested this proposition and found that there is no evidence for the strong scale effects hypothesized by the initial wave of endogenous growth models. A second generation of “semi-endogenous” growth models that includes diminishing return to R&D has developed in response; the research program continues but this goes beyond the topic of the current paper.16
16 The seminal refutation is Jones (1995); for surveys of the subsequent debate see Jones (2005) and Gustafsson and Segerstrom (2010), which incorporates heterogeneous firms. On econometric issues see Durlauf et al. (2005).
Measuring research and development and research and development spillovers
Equation [9], adapted from Levin and Reiss (1988), builds on Griliches’ formulation [7] and helps to clarify the chain of empirical challenges in measuring R&D and R&D spillovers. The impact of R&D in a production function is determined by the firm’s own R&D (R), the R&D of all other firms (S), and the degree of non-excludability of all others’ R&D (β):
The more other firms keep innovations secret or otherwise inhibit appropriation the lower the proportion of S that can be appropriated; this is represented by a lower value of β. This equation is a micro-level version of the Coe and Helpman (1995) equations discussed in the introduction. In the context of international R&D spillovers, the equation requires some elaboration. The coefficient β represents the proportion of S that could be appropriated by a given firm. The coefficient λ indicates how the stock of appropriable knowledge (βS) is utilized by the firm and realized as changes in cost reduction or TFP growth. In practice, it is difficult to measure the degree of non-excludability. Levin and Reiss (1988) had in-depth survey data with which to construct plausible micro-level measures of β, but such data are an exception. Also, there are other factors that reduce the effective stock of S to a given firm.17
These factors are enumerated below following the spillover channel from source to spill-in destination. These factors are formalized in [10] as a series of information or transmission filters, their joint product is the effective information available to spill-in to a recipient firm. Figure 2.2 illustrates the process and it organizes the discussion.
17 Thus, in estimation, errors in measuring β influence the value of λ: the two parameters are difficult to distinguish.
9 0 1[ ] ( ) ≤ ≤R Sα λβ β
10 0 11 2 3 4[ ] ( ) ≤ ≤R S iα λβ β β β β

17Chapter 2: Trade and R&D spillover effects: Implications for firm-level analysis in the
agricultural sector
Determining the relevant subset of knowledge
First consider S, the stock of knowledge: in principle the entire cumulative stock of human knowledge could be included in S; in practice one limits S to some relevant subset of all knowledge. Griliches (1998: 257ff) frames the problem as devising an appropriate weighting or distance function. For example, a firm producing paints is most likely to find the R&D of other paint producers of greatest potential value; varnish and lacquer producers would also qualify as close neighbors; and the segments of the chemical industry engaged in dyes and solvents would also be highly relevant. Other chemical segments and fluid-processing engineering are likely of slightly less value; but they would merit a positive weight. R&D in microprocessors and pharmaceuticals would probably be of little value and could be imputed a weight of zero. Thus, the relevant pool of outside R&D for a firm or industry is a weighted summation of neighboring industries. These weights can have some empirical grounding (input-output tables, econometric studies) but they inevitably contain arbitrary elements and value judgments.18
18 The work following Coe and Helpman’s (1995) example uses only ‘business sector’ R&D; that is, they exclude public R&D. In agricultural economics, the convention is to include only
The reported stock of R&D (how this is measured is discussed in Appendix A) is merely an indicator of the stock of knowledge. Much innovation occurs beyond what is officially reported as R&D. Of the factors that limit the transmission of the stock of knowledge, the first, the degree of non-excludability has been discussed above (Levin and Reiss).
Contact and communication
The second limiting factor is that there must be some way for a firm to be aware that the outside R&D exists; this involves contact and communication. The earliest applied work on technological spillovers occurred in the 1940s in the U.S. Corn Belt where farm-level data was abundant and technological change was rapid and observable. Ryan and Gross (1943, 1950), rural sociologists, observed that farm operators differed in their willingness to try or adopt new farming practices. Few would adopt immediately; a minority would adopt in the second or third season; the majority would adopt later; and a small remnant would never adopt. This pattern was observed across communities and innovations and led to a general model of the diffusion of innovation (Rogers 1962). The social status of the early adopters and their success or failure influenced the rate of diffusion in the community (Rogers and Beal 1958).
Griliches (1957) provided an economic explanation of the diffusion process for the adoption of hybrid corn. Hybrid corn was a break-through innovation, resulting in large yield increases and improving the effectiveness of mechanized harvesting equipment. The new technology (genetics) was embodied in hybrid seed. Because data on the area planted to hybrids and traditional corn were available at the micro level Griliches could track the spatial diffusion of hybrid corn. He could observe hybrids
agricultural R&D (public and private) although non-agricultural R&D obviously influences agricultural production: see, e.g., Alston (2002).
Figure 2.2: Knowledge spillovers: the narrowing
information channel
Reported R&D
Stock ofknowledge
Non-excludable
Known Understood Utilized
Reported DestinationSource
Source: Authors, adapted from Levin and Reiss 1988

18Analysis of the size and distribution of the impacts of agricultural trade at the firm and industry levels in developing countries
developed in Iowa spilling over into Nebraska and into Illinois, for example.19
In empirical work communication is represented by some indicator of the probability or flow of contact. For example, geographic distance is often used; this is the basis of gravity models, it is also the basis of agglomeration theory, an idea that dates back to Alfred Marshall and which was revived in the 1990s.20 Measures of the value of bilateral or unilateral trade capture similar information; this is the variable favoured in the literature following from Coe and Helpman (1995).
Human capital
There is enough evidence to give validity to the hypothesis that the ability to deal successfully with economic disequilibria is enhanced by education and that this ability is one of the major benefits of education accruing to people privately in a modernizing economy. - T.W. Schultz (1975: 843).
Human capital is the essential ingredient in innovation. Schultz, who invented the concept of human capital, viewed its primary economic function as the ability to adapt to change, to innovate and to learn. In Romer’s model of endogenous growth the R&D sector has one factor of production: human capital. The capacity of a country to generate domestic R&D depends directly on its accumulation of human capital, in particular human capital above a critical technical threshold. Human capital is the key variable in innovation diffusion models: it is positively related to access to information, social status, and the capacity to comprehend and utilize information. Nelson and Phelps (1966) made
19 Traxler and Byerlee (2001) apply this method to wheat spillovers within India. For a survey of earlier industrial applications see Nasbeth and Ray (1974); also see Jovanovic and Rob (1989). Keller (2004) is a literature survey of international diffusion of technology. Conley and Udry (2010) focuses on information flows through social networks among pineapple growers in Ghana.
20 Krugman (1991) initiated the revival; Glaser et al (1992) provided an additional boost. Fujita and Thisse (2002) is the standard survey and text. On R&D spillovers and geography see Jaffe et al. (1993) and Audretsch and Feldman (2004). Greenaway and Kneller (2008) examine the relationships between exporting, agglomeration and productivity.
explicit the relationship between human capital and technology adoption. Benhabib and Spiegel (1994, 2005) empirically verify the importance of these two roles of human capital in determining a country’s TFP growth.
The fact that human capital influences growth through two channels, innovation and learning adaptation, poses a conceptual problem for measuring R&D spillovers. The Griliches-Romer sense of an R&D spillover is limited to outside knowledge that is utilized in the formal R&D activities of firms and organizations. The goal of such R&D is the innovation of new products and inputs or improved production processes. Endogenous growth theory explicitly limits itself to formal R&D innovation; this is its source of TFP and its engine of growth. Learning beyond the walls of the R&D facility is embodied in the skill set of a particular person, which is rival-in-use (see Romer quotation above on page 15). Such learning is an augmentation of the stock of human capital and should be accounted as an increase in factor quality: it does not belong in the TFP residual. In practice, it is difficult to maintain this distinction; for example, Solow (1994: 177):
Bits of experience and conversation have suggested to me that it may be a mistake to think of R&D as the only ultimate source of growth in total factor productivity. I don’t doubt that it is the largest ultimate source. But there seems to be a lot of productivity improvement that originates in people and processes that are not usually connected with R&D.
One interpretation of Solow’s comment, consistent with the Griliches-Romer distinction, is that when non-R&D learning and adaptation results in new knowledge that is non-rival it may contribute to innovation and TFP growth; otherwise, when it is rival, it must be counted as an increase in human capital. The practical problem is that these distinctions are difficult to measure. In theory, an employee that spills-in outside knowledge and becomes more productive receives a proportionately higher wage (because wage equals marginal product in theory); the

19Chapter 2: Trade and R&D spillover effects: Implications for firm-level analysis in the
agricultural sector
increased wage bill measures the increase in human capital and thus is not counted in the TFP residual. In practice, the increment in labour productivity is difficult for the employer to observe and individual wages are not so readily changed; very likely the increase in human capital is unmeasured or under-estimated and all or some of the increase is counted as TFP growth.
Although the role of human capital is universally recognized, there is less agreement over how best to measure and represent it at the aggregate level. The average years of schooling measure has intuitive appeal; but in practice there are national differences in reporting accuracy and school quality, which must be accounted for. Wößmann (2003) surveys the literature; Cohen and Soto (2007) advance an improved comparable measure of human capital, which includes differential mortality rates, an important factor that had been neglected.
Institutional context
The operating environment of the firm bounds its ability to utilize absorbed outside knowledge in production, procurement and distribution. Local and national customs, laws and regulations, for example, can inhibit or prohibit implementing innovations. The “new institutional economics,” advanced by Douglass North and Oliver Williamson in the 1970s and 1980s, has been incorporated into formal economic theory by younger economists. Daron Acemoglu is perhaps the one individual most responsible for this contemporary synthesis. Acemoglu argues that institutions, formal and informal, are key determinants of economic growth, primarily through their ability to encourage or inhibit the efficient allocation of factors. Barriers to matching factors of production with firms can trap resources in low-valued uses and limit the optimal division of labour. Thus the structure of legal systems, the efficiency of public administration and law enforcement, the level of inter-personal trust, and ethnic, racial, gender and age discrimination (formal or informal), among many other “non-economic”
factors all influence the allocative efficiency of the economy.21
Legal systems, for example, vary in the rights provided to minority shareholders and to creditors. Common law systems provide more rights than civil law systems and this allows greater opportunities for corporations to raise capital (La Porta et al. 1999). Bloom and van Reenen (2007) find that countries with a tradition of primogeniture have a high proportion of inefficiently managed family-owned firms. If the executive candidate pool is limited to eldest sons or immediate blood relations the likelihood of recruiting a competent executive is greatly diminished. Similarly, employment protection laws can result in labour market rigidities that reduce the ability of firms to adapt to changing market conditions and reduce the likelihood of innovation (Saint-Paul 2002, OECD 2002b, Botero et al. 2004.)
2.3 Conclusions part I
The empirical literature on trade-related R&D spillovers since Coe and Helpman (1995) has updated and expanded the database, improved the econometrics,22 and tested alternative weighting systems for foreign R&D stocks. It has also incorporated additional explanatory variables, reviewed in the previous section. In estimation, the basic equation of Coe and Helpman (1995) (equation [2] above) is augmented with additional variables; the basic specification is:
21 Acemoglu et al. (2001) is the breakthrough article in this area. Acemoglu et al. (2005) is an excellent literature survey. Recent contributions directly relevant to R&D spillovers include: Acemoglu et al. (2006) and Acemoglu et al. (2007). Helpman (2008) is an edited volume devoted to institutions and trade. Barbosa and Faria (2011) is a recent overview of the links between institutions and innovation. Braguinsky et al. (2011) is a timely study of the impact of restrictive firing laws in Portugal on the size distribution of firms and stagnant productivitygrowth.
22 For more on innovations in panel data econometrics see Hsiao (2003) or Baltagi (2008).
11 0[ ] = + ( ) + ( ) +−lnTFP ln S
m ln S ln Hi i id
d if
i f ih
iβ β β β (( ) + ( ) +−β εiZ
f iZ ln S

20Analysis of the size and distribution of the impacts of agricultural trade at the firm and industry levels in developing countries
Stocks of R&D are represented by S where the subscript indicates d – domestic and f – foreign. The superscript on the foreign R&D term indicates the weighting system used to aggregate the R&D stocks of country I’s trading partners into a single R&D stock value. As in the 1995 paper, Sf
is interacted with mi, the ratio of imports to GDP. Human capital, represented by H, is invariably positive and significant and is now a standard in empirical application.
The additional variables are usually interacted with foreign R&D stocks, represented in equation [11] by the variable Z. The additional variables are indicators of institutional quality: the ease of doing business as measured by the World Bank index; the quality of tertiary education; the strength of intellectual property rights; and the origins of the legal system. These measures are usually divided into high and low scores, or into high, average and low scores, and included as dummy variables. The variables are generally significant and in the directions suggested in the literature. The ease-of-doing business term, for example, interacts positively and significantly with human capital; Coe et al. (2009) interpret this result to indicate that a more business-friendly environment, ceteris paribus, increases the capacity of human capital to realize R&D spillovers.
There are several rival weighting schemes for foreign R&D stocks. A bilateral-import weighting [12] is the most common form used in the literature for aggregating foreign R&D stocks. A bilateral import-to-GDP measure [13] is advanced by Lichtenberg and van Pottelsberghe de la Potterie (1998) as an alternative. In the expressions below Sj is the stock of R&D of the Jth country, Mij are I’s imports from J, and Y is GDP.
Coe et al. (2009) find little difference between the import weighting-scheme regressions, but
they favour import-weighting of external R&D stocks.23 Funk (2001) uses the form of equation [12] with bilateral export weights and finds that it performs as well as bilateral import weights. Xu and Wang (1997), argue that imports of capital goods may be more closely related to R&D spillovers than noncapital goods imports. They use the form of equation [12] but with capital goods imports in place of total imports and find that it yields a significantly larger coefficient than for the total imports ratio. Seck (2012), applying the analysis to developing countries, also finds that the capital-goods-import ratio performs better than total imports.24 Seck (2012) also finds significant effects for equation [12] using FDI to total investment; and finds varying significance for private, public and university R&D stocks.
These weighting schemes are designed to represent the relative likelihood of spillover from the many potential R&D sources being aggregated. Contact is the most important component of this likelihood. All of the measures discussed above are partial measures of contact; thus one expects each of them to be significant if used as the sole indicator of contact. Importing and exporting each provide opportunities for contact; Grossman and Helpman (1991: 165ff) are explicit on this point in their discussion of “international information flows”.25 They suggest that total (X+M) bilateral trade is the most appropriate measure and, following Arrow’s idea of learning-by-doing, that it should be calculated cumulatively. Grossman and Helpman, however, limit their discussion of information flows to activities linked directly to international trade. Commercial trade is only one of many potential means of contact between firms in different countries.
The central argument of this part of the paper is that aggregate measures of national-level total factor productivity and national stocks of
23 Coe et al. (1997) examines North-South R&D spillovers; which may account for preferring imports to exports.
24 It is possible that the capital-goods weighting captures distortions in capital and credit markets in the importing country which are erroneously counted as TFP growth.
25 The relevant passage is reproduced in appendix B of this paper.
12[ ] =−
≠ ≠∑Bilateral imports S
MM
SiBi M
j i
ij
i j ijjΣ
13[ ] =≠∑/Bilateral imports toGDP S
MY
Sim Y
j i
ij
jj
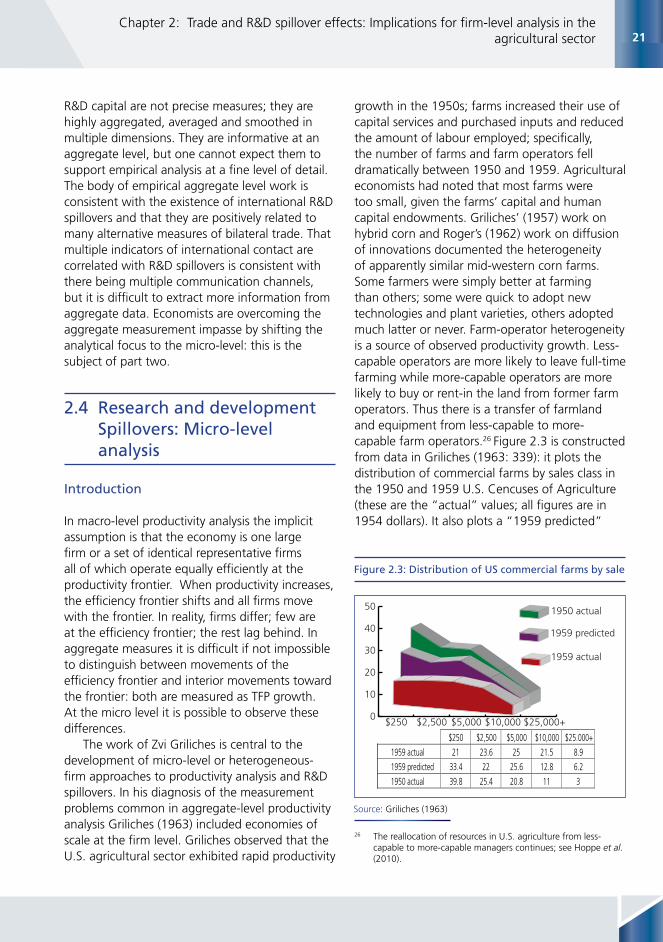
21Chapter 2: Trade and R&D spillover effects: Implications for firm-level analysis in the
agricultural sector
R&D capital are not precise measures; they are highly aggregated, averaged and smoothed in multiple dimensions. They are informative at an aggregate level, but one cannot expect them to support empirical analysis at a fine level of detail. The body of empirical aggregate level work is consistent with the existence of international R&D spillovers and that they are positively related to many alternative measures of bilateral trade. That multiple indicators of international contact are correlated with R&D spillovers is consistent with there being multiple communication channels, but it is difficult to extract more information from aggregate data. Economists are overcoming the aggregate measurement impasse by shifting the analytical focus to the micro-level: this is the subject of part two.
2.4 Research and development Spillovers: Micro-level analysis
Introduction
In macro-level productivity analysis the implicit assumption is that the economy is one large firm or a set of identical representative firms all of which operate equally efficiently at the productivity frontier. When productivity increases, the efficiency frontier shifts and all firms move with the frontier. In reality, firms differ; few are at the efficiency frontier; the rest lag behind. In aggregate measures it is difficult if not impossible to distinguish between movements of the efficiency frontier and interior movements toward the frontier: both are measured as TFP growth. At the micro level it is possible to observe these differences.
The work of Zvi Griliches is central to the development of micro-level or heterogeneous-firm approaches to productivity analysis and R&D spillovers. In his diagnosis of the measurement problems common in aggregate-level productivity analysis Griliches (1963) included economies of scale at the firm level. Griliches observed that the U.S. agricultural sector exhibited rapid productivity
growth in the 1950s; farms increased their use of capital services and purchased inputs and reduced the amount of labour employed; specifically, the number of farms and farm operators fell dramatically between 1950 and 1959. Agricultural economists had noted that most farms were too small, given the farms’ capital and human capital endowments. Griliches’ (1957) work on hybrid corn and Roger’s (1962) work on diffusion of innovations documented the heterogeneity of apparently similar mid-western corn farms. Some farmers were simply better at farming than others; some were quick to adopt new technologies and plant varieties, others adopted much latter or never. Farm-operator heterogeneity is a source of observed productivity growth. Less-capable operators are more likely to leave full-time farming while more-capable operators are more likely to buy or rent-in the land from former farm operators. Thus there is a transfer of farmland and equipment from less-capable to more-capable farm operators.26 Figure 2.3 is constructed from data in Griliches (1963: 339): it plots the distribution of commercial farms by sales class in the 1950 and 1959 U.S. Cencuses of Agriculture (these are the “actual” values; all figures are in 1954 dollars). It also plots a “1959 predicted”
26 The reallocation of resources in U.S. agriculture from less-capable to more-capable managers continues; see Hoppe et al. (2010).
Figure 2.3: Distribution of US commercial farms by sale
0
10
20
30
40
50 1950 actual
1959 predicted
1959 actual
$25,000+$10,000$5,000$2,500$250 $250 $2,500 $5,000 $10,000 $25.000+
1959 actual 21 23.6 25 21.5 8.9 1959 predicted 33.4 22 25.6 12.8 6.2 1950 actual 39.8 25.4 20.8 11 3
Source: Griliches (1963)

22Analysis of the size and distribution of the impacts of agricultural trade at the firm and industry levels in developing countries
distribution: this is constructed by applying the 21 percent rate of U.S. agricultural productivity growth rate observed for 1950-59 uniformly across the 1950 distribution. Contrasting the 1959 actual and predicted indicates that observed productivity change was not evenly distributed: the share of larger farms grew more than predicted and the share of farms in the smallest class declined more than predicted.
When black box of aggregate productivity analysis is opened and one examines the dynamics of individual firms, one finds exit, entry and reallocation: less successful firms tend to contract or exit; more successful firms tend to expand; new firms emerge; and most factors in the industry are reallocated within the industry. Productivity growth is not scale-neutral; it is not uniformly distributed across incumbent firms. Measuring and understanding these processes is the core of heterogeneous firm analysis.
Micro-level analysis of productivity
Micro panel data
Heterogeneous-firm analysis developed to explain the commonly observed distributions of the size, productivity and growth of firms within industries. These consistent patterns attracted the attention of statisticians and economists as quality data became available in the late 1800s. Early research focused on devising plausible stochastic (random) processes that would generate the observed size distributions and rates of firm exit, entry and growth.27
It required the construction of panel or longitudinal data sets, where a specific cross-section of individual firms or respondents is surveyed in multiple periods, to observe and analyse individual firm dynamics, particularly the decisions to expand or contract production and to enter or exit an industry. The pioneering work on panel data econometrics involved panels of farms: Hoch (1955, 1958, and 1962) worked
27 See Sutton (1997) for a literature survey; this was an active issue in economics in the 1950s and early 1960s: Adelman (1958), Simon and Bonini (1958), Mansfield (1962).
with a Minnesota farm panel; Mundlak (1961) worked with an Israeli farm panel. They proposed what is now called the fixed-effects model; this is a way of controlling for unobserved individual differences in farms, firms or individuals. Hoch referred to the unobservable variable as differential managerial ability or farm-specific technical efficiency; Mundlak likewise referred to individual differences in management and viewed fixed effects as a means of estimating production functions “free of management bias.”28 What Hoch and Mundlak identified and attempted to control for is the heterogeneity of firm (or farm) productivity. It was obvious by 1960 that the only way to understand the fundamental, firm-level basis of productivity change was to construct and analyse panel data sets.
Constructing panel data sets is expensive and often can only be accomplished by public authorities. One of the challenges to applied research is the confidentiality of much official survey and census data. In the United States the NBER has cooperated (after much negotiation) with the U.S. Bureau of the Census which allows analysis to be published so long as the confidentiality of individual respondents is preserved. National governments differ in the degree and terms of access offered to researchers.29 Data development, data access and panel econometrics developed in conjunction in the 1970s and 1980s.
By the early 1990s several stylized facts had been established.30 First, there are large and persistent differences in firm productivity within industries. Using Markov transition matrices, the common pattern observed is that highly productive firms tend to remain highly productive and less productive firms tend to remain less
28 The bias resulting from the endogenous choice of inputs was first identified by Marschak and Andrews (1944). For more on the development of panel data econometrics see Nerlove (2002).
29 Norway is unusually open in this regard and early empirical work used Norwegian data: Griliches and Ringstad (1971).
30 The seminal article is Baily et al. (1992). Bartelsman and Dom (2000) is an excellent survey on panel data analysis particularly as it relates to total factor productivity. Syverson (2011) covers the many subsequent innovations in the literature. Tybout (2000) surveys the literature on developing countries.

23Chapter 2: Trade and R&D spillover effects: Implications for firm-level analysis in the
agricultural sector
productive. Second, the risk of exit is inversely related to the level of productivity: that is, less productive firms are the most likely to exit. Third, entering firms, on average, have productivity levels similar to the average of incumbent firms. Fourth, despite considerable exit and entry of firms, factors (particularly labour) tend to remain in the industry; that is, former employees of exiting firms generally find employment with surviving or entering firms in the same industry: the reallocation of factors from less to more productive firms is a primary driver of productivity change at the industrial level. There are, of course, inter-industry factor movements, particularly out of industries in secular decline and into industries in secular growth; but these flows are small relative to intra-industry reallocation.
A series of papers by Bernard and Jensen (1995, 1999) analysed micro data on firms that export, focusing on firm productivity and entry-exit dynamics. Several important stylized facts emerged. Exporting (and importing) is relatively rare: few firms engage in it.31 Firms that trade tend to have higher productivity than firms in the same industry that only produce for the domestic market. Firms that trade also tend to be larger and better capitalized than non-exporters. These empirical findings, among others, are forcing fundamental changes in international trade theory. Prior to this seemingly anomalous empirical evidence, international trade theory implicitly assumed that all firms in an industry were homogeneous; if Portugal has a comparative advantage in wine production, relative to English cloth, then all wine producers in Portugal were implicitly assumed to export to England. In fact, the distribution of exporting is concentrated in a minority of relatively high-productivity firms. There is a now a “new new” trade theory, heterogeneous-firm trade theory, that is attempting to construct a theoretical framework that corresponds to the empirical patterns about firms that trade.32
31 Bernard et al. (2009): in 2000, 3.1 percent of U.S. firms exported; 2.2 percent imported; and 1.1 percent both imported and exported. Trade by value is highly concentrated: the largest 1 percent of exporters accounts for 81 percent of export sales; the analogous share for importers is 78 percent.
32 The last decade has been turbulent for international trade
One of the key questions in this emergent field, and the focus of this paper, is what accounts for the positive correlation between firm productivity and export status. Does exporting (or importing) cause a firm to become more productive? Perhaps trading firms have more contact with other countries and this provides greater access to information and thus leads to greater R&D spillovers which are then manifest in higher productivity. Or, perhaps trading firms are able to exercise greater market power than non-traders or to realize economies of scale not available to non-traders. These are the leading hypotheses underlying the causal arrow from trade to productivity. The causal arrow running the opposite direction, from productivity to trade, rests on selection, or self-selection: high-productivity firms are more likely to become exporters than low-productivity firms. All of these hypotheses are plausible and they are not logically mutually exclusive: they could be valid simultaneously, and this complicates empirical hypothesis testing. In the empirical literature reviewed below the trade-causes-productivity path is modeled as a series of learning effects and the productivity-causes-trade path is modeled as a series of selection effects.
The next section discusses some of the empirical tools employed in the analysis of firm-level dynamics within an industry; the extensions of these methods to firms that trade are discussed in the subsequent sections.
Heterogeneous firm dynamics: empirical methods
There are two stages in the analysis of productivity with panel data. First, one needs to measure productivity for each firm in each time period. Given these measures one can then analyse firm productivity dynamics; this section discusses productivity dynamics first and then turns to the measurement of productivity at the firm level.
theory: Redding (2010) is a recent, concise survey of theoretical developments. Bernard et al. (2009) provides a statistical ‘portrait’ of U.S. trading firms; it gives due attention to importers. The literature to date has emphasized exporters.
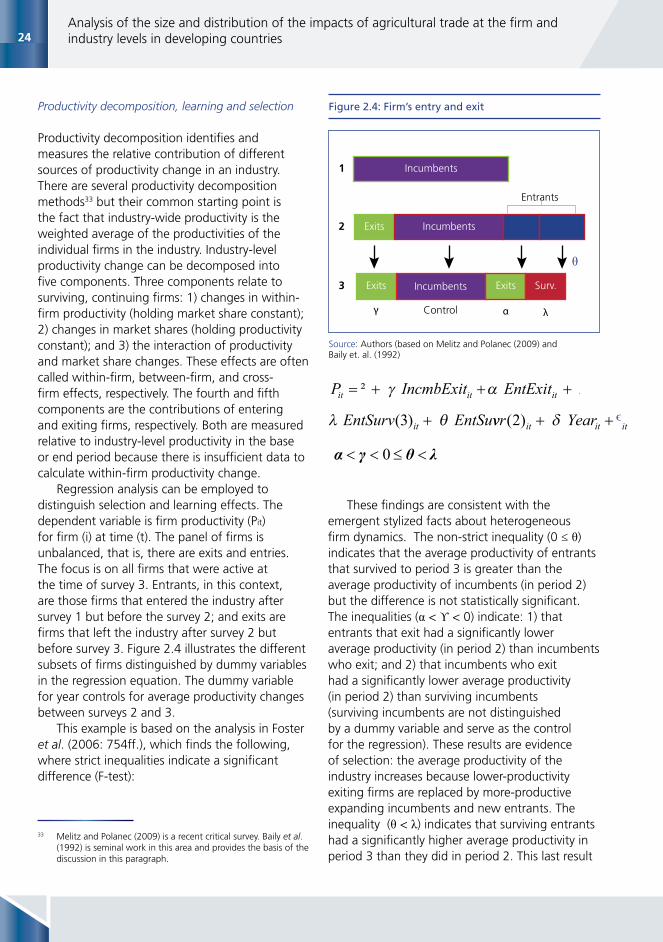
24Analysis of the size and distribution of the impacts of agricultural trade at the firm and industry levels in developing countries
Productivity decomposition, learning and selection
Productivity decomposition identifies and measures the relative contribution of different sources of productivity change in an industry. There are several productivity decomposition methods33 but their common starting point is the fact that industry-wide productivity is the weighted average of the productivities of the individual firms in the industry. Industry-level productivity change can be decomposed into five components. Three components relate to surviving, continuing firms: 1) changes in within-firm productivity (holding market share constant); 2) changes in market shares (holding productivity constant); and 3) the interaction of productivity and market share changes. These effects are often called within-firm, between-firm, and cross-firm effects, respectively. The fourth and fifth components are the contributions of entering and exiting firms, respectively. Both are measured relative to industry-level productivity in the base or end period because there is insufficient data to calculate within-firm productivity change.
Regression analysis can be employed to distinguish selection and learning effects. The dependent variable is firm productivity (Pit) for firm (i) at time (t). The panel of firms is unbalanced, that is, there are exits and entries. The focus is on all firms that were active at the time of survey 3. Entrants, in this context, are those firms that entered the industry after survey 1 but before the survey 2; and exits are firms that left the industry after survey 2 but before survey 3. Figure 2.4 illustrates the different subsets of firms distinguished by dummy variables in the regression equation. The dummy variable for year controls for average productivity changes between surveys 2 and 3.
This example is based on the analysis in Foster et al. (2006: 754ff.), which finds the following, where strict inequalities indicate a significant difference (F-test):
33 Melitz and Polanec (2009) is a recent critical survey. Baily et al. (1992) is seminal work in this area and provides the basis of the discussion in this paragraph.
These findings are consistent with the emergent stylized facts about heterogeneous firm dynamics. The non-strict inequality (0 ≤ θ) indicates that the average productivity of entrants that survived to period 3 is greater than the average productivity of incumbents (in period 2) but the difference is not statistically significant. The inequalities (α < ϒ < 0) indicate: 1) that entrants that exit had a significantly lower average productivity (in period 2) than incumbents who exit; and 2) that incumbents who exit had a significantly lower average productivity (in period 2) than surviving incumbents (surviving incumbents are not distinguished by a dummy variable and serve as the control for the regression). These results are evidence of selection: the average productivity of the industry increases because lower-productivity exiting firms are replaced by more-productive expanding incumbents and new entrants. The inequality (θ < λ) indicates that surviving entrants had a significantly higher average productivity in period 3 than they did in period 2. This last result
Figure 2.4: Firm’s entry and exit
0 < < ≤ <α γ θ λ
Exits
Exits
Incumbents
Incumbents
Control λαγ
Entrants
1
2
3 Exits Surv.Incumbents
θ
P IncmbExit EntExit EntSurv EntSuit it it it= + + + +γ α λ θ( )3 vvr Yearit it it( )2 + +δ
P IncmbExit EntExit EntSurv EntSuit it it it= + + + +γ α λ θ( )3 vvr Yearit it it( )2 + +δ ϵ
Source: Authors (based on Melitz and Polanec (2009) and Baily et. al. (1992)
25Chapter 2: Trade and R&D spillover effects: Implications for firm-level analysis in the
agricultural sector
is evidence of learning, even after controlling for year effects. Foster et al. (2006: 755) remark: “This pattern implies the surviving entering cohort exhibits more rapid productivity growth than more mature surviving incumbents over this same period. That is, these results are consistent with post-entry learning-by-doing effects playing a nontrivial and statistically significant role.”
Measuring firm productivity with panel data and selection
Estimating productivity at the firm level with panel data involves many of the same measurement problems encountered at the aggregate level; it also introduces problems that are masked by aggregation: simultaneity bias, selection bias and omitted price bias.34 The binding constraint is always the breadth and quality of the data. Firm-level data is often insufficient to estimate or calculate TFP. Data are often collected on revenue or sales; without sales price data revenue cannot be converted into physical unit terms. Multi-product firms require a firm-specific price index. Similar measurement problems exist in factor measurement. A common solution is to use labour productivity.35
Simultaneity bias emerges because a firm’s choice of variable input use is influenced by factors not observable to the econometrician, such as the firm’s knowledge of its productivity level and its expectations of market conditions. In estimating firm-level production functions the error term can be correlated with variable inputs and thus bias the estimated coefficients; this, in turn, results in biased productivity measurements.
Selection bias exists because the set of firms one observes is an outcome of a selection process. One does not observe firms that have chosen to exit the industry; nor does one observe firms that have chosen not to enter the industry, this
34 Van Beveren (2012) is a recent survey of the econometrics of TFP estimation with panel data; it is a good starting point for new variants of the Olley-Pakes algorithm.
35 Foster et al. (2008) explore three variant measures of firm-level TFP and evaluate their strengths and biases.
is an important consideration when the focus of analysis turns to firms that trade as they may differ from firms that produce but do not trade.
Olley and Pakes (1996) devised an estimation algorithm that addresses both the simultaneity and selection biases. The intuition behind the Olley-Pakes algorithm is that one can use observed information about a firm’s current and past investment decisions (net changes in capital) as an indicator of the firm’s unobserved productivity level. Including this derived measure in the regression takes care of the simultaneity bias. And, based on the plausible assumption that the probability of survival is increasing in productivity, the derived indicator also accounts for selection bias.
Underlying Olley-Pakes and its various extensions is a dynamic optimization process governing a firm’s investment programme and its discrete choices about entry and exit. This provides a transition to a discussion of the discrete choice of whether a non-exporting firm becomes an exporter and viceversa. The starting assumption is that there is a fixed sunk cost (F) for a non-exporter to become an exporter. The table below collapses and simplifies expected net present value calculations into a set of inequalities. The two rows contrast the decisions of exporters and non-exporters, both of which are assumed to be incumbent producing firms in the same industry. In the exit column, both exporters and non-exporters choose to exit if expected profits (π) are negative. If expected profits are positive exporters continue as exporters. Non-exporters with positive profits have the option of becoming exporters, but this is only economically rational if the expected discounted flow of future profits exceeds the fixed cost of becoming an exporter.
In reality these decisions are not as crisp and mechanical as portrayed in the table or in the models on which it is based (e.g., Roberts and
Initial state Exit Remain Export
Exporters π < 0 0 < π
Non-exporters π < 0 0 < π < F F < π
Table 2.2: Trader’s entry and exit
Source: Authors

26Analysis of the size and distribution of the impacts of agricultural trade at the firm and industry levels in developing countries
Tybout [1997]); these decisions are often modeled empirically in a probit framework. In this context, a probit model would express the probability that a non-exporter becomes an exporter as an increasing function of value of [π-F], among other variables.
Heterogeneous trading firm dynamics
The theoretical watershed in heterogeneous-firm trade theory is the Melitz (2003) model. The Melitz model is driven by a selection process similar to those described above (Foster, et al., Olley and Pakes and Roberts and Tybout) and embedded in a differentiated-product trade model. The Melitz model is the starting point for contemporary trade theory; this is an active area and there are numerous extensions. This section provides an intuitive description of its selection process with an emphasis on the model’s implications for the analysis of learning and spillovers.
Figure 2.5 is a flow chart of the transition to exporter status. The central feature of the model is represented by the oval labeled “productivity assignment.” Aspiring exporters select themselves from active non-exporters in a given industry. An aspiring exporter must incur a fixed sunk cost to be assigned a productivity level. Each aspirant’s productivity assignment is randomly drawn from a probability distribution. Aspiring exporters
are those who have made the expected net present value profit calculation and found that its expected value is positive.
When productivity assignments are made, aspirant exporters re-calculate their expected profits: those assigned lower productivities withdraw from the process and remain as non-exporters (less the fixed cost incurred). Those assigned higher productivities proceed to become new exporters and begin exporting. Their profitability in the first exporting period is determined by their productivity assignment and a market-wide stochastic element. The shaded cone at the right of the figure is meant to represent a distribution of profit outcomes for the cohort of new exporters. Each firm decides, based on its realized performance, whether to continue exporting. The horizontal line illustrates a potential cut-off point, threshold below which firms revert to non-exporter status.
The exit threshold is not fixed: it is determined by market conditions. For example, an export “boom” induces a rapid increase in output as well as proportionally rapid increases in derived factor demands. This drives up factor rental rates. Depending on the relevant elasticities in product and factor markets a boom could raise or lower the exit threshold.
The important point is that given parameter values one can simulate the evolution of the productivity distribution of the export industry. Similarly, one can derive the expected changes in the industry distribution following innovations in trade policy (e.g., tariff changes, domestic and or foreign) and innovations in factor and product markets.36 Any argument in an exporting firm’s profit function can shift the exit threshold.
The original (2003) Melitz model assumes that aspiring entrants are identical: the productivity assignment mechanism (i.e., the underlying Pareto distribution) is the initial source of exporter productivity heterogeneity; this initial distribution is then truncated (by low-productivity immediate
36 For example, Trefler (2004), examining the effects of Canadian tariff reductions, finds that high-productivity exporters expand market share and low-productivity firms contract or exit. Bernard et al. (2006) find a similar distribution of selection effects following a decline in transport costs.
Figure 2.5: A flow-chart interpretation of the Melitz
model
Aspiringexporters
Non-exporters
Productivityassignment
Exportperformance
Higher
Lower
Pay sunkcost: F
Newexporters
Source: Authors

27Chapter 2: Trade and R&D spillover effects: Implications for firm-level analysis in the
agricultural sector
exits) and modified by subsequent rounds of market selection and entry. These assumptions simplify the model: in reality firms self-select into becoming exporters.37 Figure 2.5 is constructed to include self-selection: this is represented by the arrow linking non-exporters and aspiring exporters.
Selection, learning, innovation and exporting firms
Clerides et al. (1998) helped frame the empirical question of the relative importance of selection and learning in accounting for the observed positive correlation between a firm’s export status and its productivity. From panel data they constructed characteristic cost trajectories for non-exporters and entering, exiting and continuing exporters. They found that the unit costs of entering exporters decline for several periods before they start exporting. At entry, entrants have approximately the same costs as continuing exporters and they are more efficient (lower-cost) than exiting exporters. This is the same pattern found by Foster et al. (2006) discussed above. They found little significant evidence that the post-entry cost profiles of entrants and continuing exporters differ, that is, little support for post-entry learning.38 If there is no post-entry learning then the narrative can be reduced to a pure selection-driven stochastic process, such as the Melitz model: if a non-exporting firm experiences a random productivity shock that shifts its productivity above a critical threshold then the firm starts to export with probability ‘p’; otherwise, it does not export. One can estimate the parameters governing the distribution of productivity shocks and closely replicate the observed distributions of exporting firms by productivity and by size.
37 The simplification is effectively parsimonious as the observed distribution of exporting firms corresponds closely to a Pareto distribution. The Pareto distribution is governed by one parameter; this allows changes in the distribution of firms to be tracked in one dimension. This is a powerful simplification and it seems to be emerging as “useful tool” in theory construction similar to the Dixit-Stiglitz mechanism.
38 Bernard and Jensen (1995) is the seminal paper in this area. Bernard and Jensen (1999) find very strong selection effects and no learning ffects for U.S. exporters.
López (2005, 2009) advances an alternate reading of the cost trajectories of entering exporters. He argues that the decision to export occurs several periods before a firm actually exports. Firms planning to export take productivity-improving actions prior to exporting. López refers to such actions as learning-to-export, as distinct from learning-by-exporting, which refers to post-entry increases in firm productivity.39
The López narrative asserts two causal channels between exporting and productivity pre-entry and post-entry learning. Self-selection still plays an important role in this story because some firms choose to plan to export and others choose not to.40
The standard empirical approach to investigating learning and selection is analogous to the analysis outlined above by Foster et al. (2006). An important difference is that the primary movement is between non-exporting and exporting. One can generally assume that exporting firms can be observed as active non-exporting firms before they become exporters and, if they cease exporting, that they often remain active in the domestic market rather than cease operations completely. Consequently it is possible to measure an exporting firm’s productivity pre-entry, post-entry (if it survives) and post-exit (if it does not survive as an exporter). Such firms can be compared with cohorts of non-exporters who do not become exporters. A sizeable empirical literature exists on this topic and there are two good literature surveys: Wallace (2007) and Greenaway and Kneller (2007); and in 2008 ISGEP (International Study Group on Exports and Productivity) published a pooled study of 14 countries. There is clear evidence of an
39 Learning-by-exporting is analogous to Arrow’s learning-by-doing. Following Arrow, the proper measure of a firm’s export experience for learning-by-exporting is not the length of time since entry (as it is usually measured in the empirical literature) but the cumulative volume of the firm’s exporting activity at a given moment. Fernandes and Isgut (2005) on Colombia is an exception: they follow Arrow and use a cumulative measure.
40 A major empirical problem is that one must observe when a firm decides to start preparing to export. To make valid comparisons one must also observe those firms that make preparations to export but never export. On self-section in exporting see the Olley-Pakes discussion on pages 21-22 above.

28Analysis of the size and distribution of the impacts of agricultural trade at the firm and industry levels in developing countries
“exporter productivity premium”: exporters have higher productivity than non-exporters; there is also uniformly strong evidence of self-selection, consistent with pre-entry learning; the evidence for post entry learning is weak, however.
One limitation of the standard approach is that it does not fully control for selection effects; it measures the difference between the average outcomes for non-exporters and new exporters. The ideal counterfactual for an exporting firm is the performance of the identical firm had it not become an exporter, an alternative reality that one cannot observe. A close approximation is to match otherwise similar exporters and non-exporters and examine the pair-wise differences in productivity trajectories.
Arnold and Hussinger (2005) use matching and find zero post-entry learning effects for German exporters. Girma et al. (2004) use matching and find positive evidence of post-entry learning for U.K. exporters. Yang and Mallick (2010) use matching and find significant post-entry learning effects in the second year of exporting for Chinese exporters. Generalization are not possible without a large body of similar studies, the limiting factor to the expansion of this promising empirical research program is the availability of quality micro data.
The statistical portrait of U.S. trading firms by Bernard et al. (2009) merits intensive study: the facts are illuminating and shed light on learning-to-export. Table 2.3 shows the distribution of exporting firms in 2000 by number of products exported and by the number of export
destinations.41 The typical or modal U.S. exporting firm exported one product to one country. The median is two products and one destination country. U.S. exporters are not atypical; similar distributions are found for France and for Colombia.42 In Colombia, where there is data on the number of customers an exporting firm has, the typical exporter exports one product to one customer in one country.
These statistics indicate that most entering exporters probably have a relationship with a specific foreign customer or customers prior to exporting. Consistent with the learning-to-export argument, such firms are likely to have made investments or undertaken some process or managerial improvements to meet contractual specifications for the new client. Some firms may take a speculative approach and attempt to export without a prior sales commitment; but this is rather risky given the costs involved.
Recent studies examine the distinction between exporting generally and exporting to a specific destination or destinations. Trofimenko (2010) and Park et al. (2010) find that exporting-firm productivity gains are more likely and stronger for firms exporting to rich, developed countries than for firms that export to lower-income developing countries. These findings are
41 Bernard et al. (2009) tables 14.4 and 14.6; Data are for 2000 and are rounded. The distributions for importing firms are similar to those for exporting firms.
42 See Eaton et al. (2011) and (2007), respectively. Relatively simple stochastic processes can simulate these distributions: Chaney (2011) is an indication of the direction of this line of research.
Number of products exported Number of export destinations
Number Firms (%) Value (%) Firms (%) Value (%)
1 38 1 57 4
2 16 1 15 2
3-4 16 2 12 3
5-9 15 4 9 5
10 16 93 8 86
Source: Adapted from Bernard et. al. (2009)
Table 2.3: Distribution of US exporting firms

29Chapter 2: Trade and R&D spillover effects: Implications for firm-level analysis in the
agricultural sector
consistent with learning-by-exporting, technology-transfer, and R&D spillover narratives; however, they are also consistent with self-selection: if exporting to richer markets requires a higher fixed entry cost then the observed differences by destination can be largely a result of selection.
The mixed evidence of post-entry gains in productivity for exporting firms is consistent with international R&D spillovers; but it does not provide direct or conclusive evidence. There is a small literature that examines the relationship between exporting status and R&D at the firm level. Several studies find evidence that firms invest in innovation (R&D) prior to exporting and in anticipation of trade liberalization.43 But the dominant direction of causality is from innovation to exporting: engaging in the former increases the probability of subsequently engaging in the latter. Once again, self-selection is at work here. Damijan et al. (2008) is exceptional in that it finds evidence of export-induced innovation. The study uses nearest-neighbor matching to control for selection effects; but the far stronger influence in this study, selection, is from innovating to exporting.
One reason why little evidence of a link between exporting and innovation (R&D) is observed is because few firms engage in either activity. Typically it is larger, well-capitalized, and relatively efficient firms that self-select into exporting and engaging in R&D; very few firms engage in both activities.44 The population of new exporters, in contrast, is largely comprised of small and medium sized firms that are unlikely to engage in R&D. The methods reviewed above treat individual cases equally; dummy variables capture the difference between the simple (un-weighted) average productivity changes of new exporters and non-exporters, for example. Thus, because of the low frequency of firms that export and innovate, one would expect the observed median R&D effect to be zero and the observed
43 Aw et al. (2008, 2011), Bustos (2011), Lileeva and Trefler (2010). The argument is that there is a simultaneous self-selection into (additional) innovation and exporting.
44 On the distribution of R&D among firms see, for example, Cohen and Klepper (1992).
average effect to be insignificantly different from zero.
Selection, learning and innovation at the industrial and national level
The Melitz model concerns the entire distribution of firms, not merely those that export. The previous sections focus on selection into exporting; but there is also a lower productivity threshold that determines entry to and exit from the domestic market. Both thresholds are endogenous to market conditions. Trade liberalization, for example, by increasing import competition and raising potential returns to exporting and importing, shifts the thresholds for trading but also shifts the exit threshold for non-exporters.
Competition and the distribution of x-efficiency
Leibenstein (1966) introduced the concept of x-efficiency to describe the common empirical observation that firms do not operate as efficiently as assumed in economic theory. Heterogeneous firm theory has revived and reinforced Leibenstein’s insight. Bloom et al. (2010a) measure the managerial practices employed by firms in 16 countries, finding a wide range of management-quality scores within each country, similar to the dispersion of firm-productivity scores found in other studies; and significant differences between mean country scores. They explain much of the variation in management quality by the degree of competition a firm faces, whether it is engaged in trade (trading firms have higher quality) and the formal education of managers. The degree of decentralization (how much discretion lower management is allowed) is also an important determinant; decentralized management is highly correlated with the degree of interpersonal trust in society; decentralized management is greater in common law countries than in civil law countries, for example.
Syverson (2004) and Bloom et al. (2010b) examine the relationship between competition and firm efficiency under conditions of spatial market power in two non-tradable markets:
30Analysis of the size and distribution of the impacts of agricultural trade at the firm and industry levels in developing countries
in cement production and public hospitals, respectively. They find that firm efficiency is largely determined by the proximity of competing firms. Bloom et al. (2011a) take a clinical trial approach to management quality in textile plants in India. Randomly selected firms were provided management consultant services for free for one month; control firms did not receive these services. The consultants’ recommendations primarily concerned three issues: quality control, inventory management, and the physical flow of work. The recommendations were not new ideas, they could be found in any management textbook published after 1960. Not all treated firms acted on the recommendations, but the average treatment effect was an 11 percent increase in productivity.
Hsieh and Klenow (2009) examine the distribution of x-efficiency (as measured by the misallocation of capital and labour) at the firm level in India, China, and the United States. They calculate what the net productivity gain would be if the efficiency distribution of firms at each industry at the four-digit level in China and India were to shift to the associated U.S. distribution. They note that this is essentially a Melitz model without trade liberalization: rather than measuring the impact of trade liberalization on the distribution of firms (as in the articles reviewed below) they estimate the maximum potential change. The central estimate is a 40 percent and 50 percent increase in aggregate TFP, for China and India respectively.
All of these studies above confirm and refine the earlier work of Nickell (1996) on competition inducing higher firm-level productivity. There is emerging line of research that takes trade liberalization events as natural experiments that increase competitive pressures in an economy and contribute to TFP growth. This literature is the focus of the next section.
Liberalization, competition and innovation
There is a growing empirical literature that treats trade liberalization events as natural experiments. The common causal path is that trade liberalization increases competitive pressures
in the domestic economy and induces domestic TFP growth, primarily through selection effects.
Pavcnik (2002) examines trade liberalization in Chile using firm-level data. She finds that surviving firms in import-competing sectors realized significantly higher productivity gains (4.6 percent annually) than in export-oriented (3.6 percent annually) and non-tradable (0.1 percent annually) sectors. Exit is an important factor: in aggregate, 70 percent of productivity gains can be attributed to the reallocation of factors among firms. She also finds that the relative lack of barriers to exit in Chile facilitated factor reallocation; restrictions on bankruptcy, plant closing and redundancy inhibit productivity gains.
Trefler (2004) examines the impact of the Canada-U.S. FTA on Canadian-firm labour productivity. Import-competing industries experienced increased firm exit and reduced employment. This was more than offset by unusually high rates of labour-productivity growth among surviving firms. Trefler finds that about half the productivity gain can be attributed to exit and inter-firm factor reallocation and half to within-firm increases in technical efficiency.
Amiti and Konings (2007) examine the impact of tariff liberalization on Indonesian firms. They construct firm- and industry-specific measures of the change in the effective rate of protection effected by liberalization: that is, specifying weighted indicators of both output and input tariff changes. They find that reductions in input tariffs generate substantially higher within-firm productivity gains than reductions in output tariffs. They also control for industry-level competition by including a Herfendahl index alone and interacted with the output-tariff change variable. They find that within-firm productivity growth is negatively related to the degree of industry concentration; output tariff reduction induces productivity growth only for firms in competitive industries. This finding does not conform to the assumption of the endogenous growth theory that imperfect competition is positively associated with innovative activity and within-firm productivity gains.
Lileeva and Trefler (2010) examine how the Canada-U.S. FTA (Free Trade Agreement)

31Chapter 2: Trade and R&D spillover effects: Implications for firm-level analysis in the
agricultural sector
influenced the export-entry decision by Canadian firms. They find that export entrants are disproportionately lowerand mid-productivity firms that were induced by import competition to invest in new technology, make process innovations and improve management; such firms undertake these changes at significantly higher rates than similar non-exporting firms. Export entrants not only exhibit within-firm productivity gains but also expand output volume and sales to the domestic (Canadian) market. This expansion, in turn, increases domestic competition and raises the exit rate.
Eslava et al. (2009) examine the impact of tariff liberalization in Colombia. Their Colombian data permits estimation of firm-level TFP. Their results are consistent with the other studies reviewed in this section. What is novel is that they use their statistical results to simulate the counterfactual rate of exit (as a function of firm TFP) using pre-reform tariffs. Comparing the counterfactual with realized exit provides a measure of the change in the exit threshold: liberalization causes a significant increase in the minimum threshold of firm TFP required for firm survival.
Bloom et al. (2011b) examine the impact of China’s entry into the WTO on firm-level innovation, exit, and productivity in the EU-12. Consistent with the other studies, greater exposure to Chinese imports induces greater levels of innovation, investment in information technology and improvements in managerial practices. Chinese imports also led to differential selection: the incidence of exit increased for lower-technology firms relative to higher-technology firms, and the latter increased domestic market share. One important aspect of this study is that it underscores the role of increased competition in inducing innovation and productivity growth. Because the trade flow is South-North, from China to the EU, one expects there to be very little of the R&D spillovers or technological transfer assumed to exist when the import shock is largely North-South.
Similarly, Iacovone et al. (2011) examine the impact of Chinese imports on Mexican firms. They find a similar differential response: import competition induces a greater productivity
response from ex ante higher-productivity firms than from lower-productivity firms. Moreover, the increased productivity does not result from innovation or R&D spillover, but from investing in improvements in quality control and inventory and personnel management. These are the same mundane sources of intra-firm productivity growth adopted by Indian textiles firms in Bloom et al. (2011a).
Bloom et al. (2011b), Iacovone et al. (2011) and Amiti and Khandelwal (2009) utilize liberalization events to investigate empirically the inverted-U relationship between competition and innovation advanced by Aghion et al. (2005) and Acemogul et al. (2006). The inverted-U is the vertical summation of two opposing effects.45 For firms far from the technology frontier, an increase in competition reduces the incentive to innovate because the gains from innovation are likely to be reduced by entry, but for firms near the technology frontier an increase in competition encourages innovation.
Heterogeneous trading firms and related-party trade
About two-thirds of the value of world trade consists of intermediate products. About one-third of world trade is intra-firm trade, most of which is of intermediate products. Heterogeneous-firm trade theory has drawn on organizational theory to explain the increasing international fragmentation of production and the growing importance of related-party trade. FDI is a potential channel for R&D spillovers; there is an empirical literature on this topic, reviewed by Görg and Greenaway (2004), but with inconclusive findings. This short section merely outlines the theoretical framework of this emerging strand of research.46
45 Specifically, measures of innovation are approximately quadratic in the Lerner index; the Lerner index ranges from zero (perfect competition) to one (perfect monopoly).
46 The key papers in this literature are Antràs (2003), Antràs and Helpman (2004 and 2008), and Helpman et al. (2004); the studies reviewed in Görg and Greenaway predate these theoretical innovations. Keller (2010) reviews the subsequent literature. Grossman and Rossi-Hansberg (2008) advance a theory of production fragmentation based on trade in tasks.
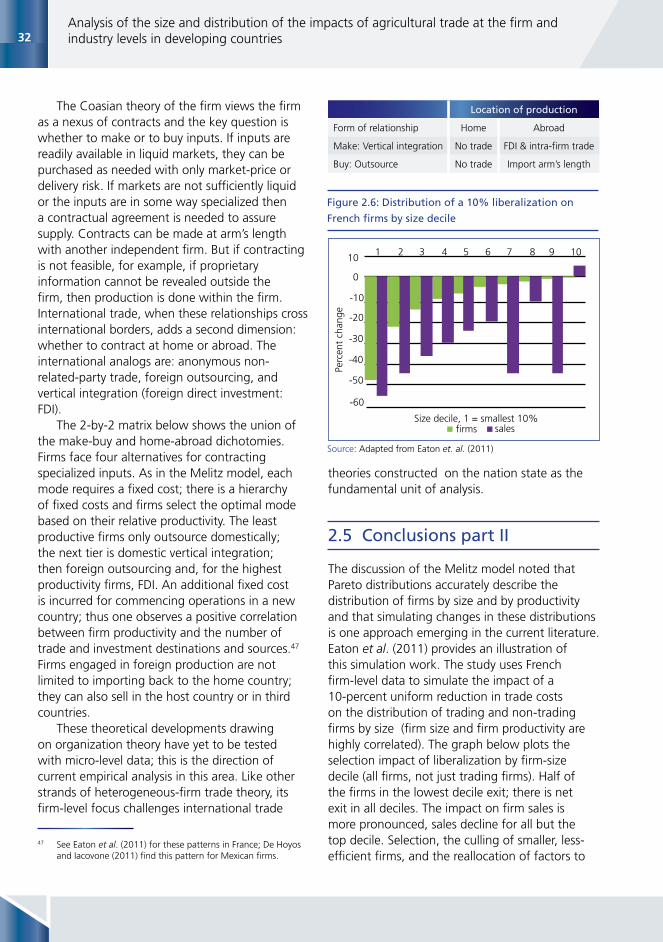
32Analysis of the size and distribution of the impacts of agricultural trade at the firm and industry levels in developing countries
The Coasian theory of the firm views the firm as a nexus of contracts and the key question is whether to make or to buy inputs. If inputs are readily available in liquid markets, they can be purchased as needed with only market-price or delivery risk. If markets are not sufficiently liquid or the inputs are in some way specialized then a contractual agreement is needed to assure supply. Contracts can be made at arm’s length with another independent firm. But if contracting is not feasible, for example, if proprietary information cannot be revealed outside the firm, then production is done within the firm. International trade, when these relationships cross international borders, adds a second dimension: whether to contract at home or abroad. The international analogs are: anonymous non-related-party trade, foreign outsourcing, and vertical integration (foreign direct investment: FDI).
The 2-by-2 matrix below shows the union of the make-buy and home-abroad dichotomies. Firms face four alternatives for contracting specialized inputs. As in the Melitz model, each mode requires a fixed cost; there is a hierarchy of fixed costs and firms select the optimal mode based on their relative productivity. The least productive firms only outsource domestically; the next tier is domestic vertical integration; then foreign outsourcing and, for the highest productivity firms, FDI. An additional fixed cost is incurred for commencing operations in a new country; thus one observes a positive correlation between firm productivity and the number of trade and investment destinations and sources.47
Firms engaged in foreign production are not limited to importing back to the home country; they can also sell in the host country or in third countries.
These theoretical developments drawing on organization theory have yet to be tested with micro-level data; this is the direction of current empirical analysis in this area. Like other strands of heterogeneous-firm trade theory, its firm-level focus challenges international trade
47 See Eaton et al. (2011) for these patterns in France; De Hoyos and Iacovone (2011) find this pattern for Mexican firms.
theories constructed on the nation state as the fundamental unit of analysis.
2.5 Conclusions part II
The discussion of the Melitz model noted that Pareto distributions accurately describe the distribution of firms by size and by productivity and that simulating changes in these distributions is one approach emerging in the current literature. Eaton et al. (2011) provides an illustration of this simulation work. The study uses French firm-level data to simulate the impact of a 10-percent uniform reduction in trade costs on the distribution of trading and non-trading firms by size (firm size and firm productivity are highly correlated). The graph below plots the selection impact of liberalization by firm-size decile (all firms, not just trading firms). Half of the firms in the lowest decile exit; there is net exit in all deciles. The impact on firm sales is more pronounced, sales decline for all but the top decile. Selection, the culling of smaller, less-efficient firms, and the reallocation of factors to
Figure 2.6: Distribution of a 10% liberalization on
French firms by size decile
Location of production
Form of relationship Home Abroad
Make: Vertical integration No trade FDI & intra-firm trade
Buy: Outsource No trade Import arm’s length
Perc
ent
chan
ge
Size decile, 1 = smallest 10%firms sales
21 3 4 5 6 7 8 9 1010
0
-10
-20
-30
-40
-50
-60
Source: Adapted from Eaton et. al. (2011)

33Chapter 2: Trade and R&D spillover effects: Implications for firm-level analysis in the
agricultural sector
larger, more productive firms is a major source of productivity growth. This is what Griliches (1963) identified as a source of aggregate productivity growth; a source of growth excluded by assumption in aggregate growth models. It is impressive that after 50 years the economics profession has access to the data and has developed models that are beginning to explain aggregate productivity growth from the micro level.
The R&D spillover theories discussed in Part I are compelling narratives if one assumes universal technical efficiency at the firm level. If all firms operate on the efficiency frontier, then the only possible source of TFP growth is a positive shift in the frontier: that is, all observed growth is the direct result of technical innovation generated by R&D. But the empirical evidence review in Part II does not support the distribution of technical efficiency assumed in exogenous and endogenous growth models. It finds that most firms operate far inside the efficiency frontier: X-efficiency is pervasive. Most of what is observed as TFP growth at the national and industrial level is selection-driven and involves movements toward the technology frontier, rather than movements with the frontier. The frontier does shift because of R&D-driven innovation, but this is only one of several factors that influence aggregate productivity.
2.6 Conclusions and implications for future research and agricultural trade
The objective of this paper is to provide a critical literature review as background to applied research on the benefits of agricultural trade to firms in developing countries, and specifically on trade-related R&D spillovers. Part I of the paper reviews the literature on R&D spillovers at the macro-level, where the nation economy is the unit of analysis. Part II reviews several emerging lines of micro-level research where the firm is the unit of analysis, that focus on the relationship between international trade and firm level and industry-
level productivity. Both parts share a focus on the relationship between trade and productivity growth but the causal channels the two bodies of research identify differ fundamentally. R&D is central to the macro-level literature reviewed in Part I. In micro-level studies R&D is at best peripheral: selection and learning are the primary causal channels between trade and productivity at the firm level.
The difference between the macro and micro literatures follows directly from differences in the assumptions and definitions employed. The macro-level analyses are part of the endogenous economic growth literature. In this framework economic growth can be attributed to two causes: 1) increases in factors and 2) technological change, which is the direct product of R&D. Thus, total factor productivity growth (that is, growth net of growth in productive factors) is determined by R&D. International trade is hypothesized to increase the effectiveness of national-level R&D by increasing the likelihood of R&D spillovers from trading partners. An international R&D spillover is narrowly defined: it is the flow of knowledge from one country to another that leads to the production of new knowledge in the recipient country. There is confusion in the literature about R&D spillovers, as Zvi Griliches has noted.48
[T]here are two distinct notions of R&D “spillovers” here which are often confused in the literature. In the first, R&D intensive inputs are purchased from other industries at less than their full “quality” price. … If capital equipment purchase price indices reflected fully the improvements in their quality, i.e., were based on hedonic calculations, there would be no need to deal with it. As currently measured, however, total factor productivity in industry i is affected not only by its own R&D but also by productivity improvements in industry j to the extent of its purchases from that industry and to the extent that
48 This quotation from Griliches 1992 is an almost verbatim repetition of Griliches 1979 (1998: 30-31): the confusion in the literature is now in its fourth decade.

34Analysis of the size and distribution of the impacts of agricultural trade at the firm and industry levels in developing countries
the improvements in j have not been appropriated by its producers and/or have not been incorporated in the official price indices of that (i) industry by the relevant statistical agencies. The use of purchase-flow-weighted R&D measures assumes that social returns in industry j are proportional to its R&D investment levels and that the amount of such returns transferred to industry i is proportional to its purchases from industry j.
But these are not real knowledge spillovers. They are just consequences of conventional measurement problems. True spillovers are the ideas borrowed by the research teams of industry i from the research results of industry j. It is not clear that this kind of borrowing is particularly related to input purchase flows.49
The confusion between the two notions of R&D spillover noted by Griliches has been common in the literature measuring the social returns to public agricultural R&D. The assumption is that there is a compelling market failure in R&D for agriculture. Because it is not economically rational for individual farmers to undertake R&D and because the private returns from agricultural R&D are assumed to be largely unappropriable, private agents will under-invest in agricultural R&D. This is rationale for public provision of agriculture R&D. To justify this use of public funds agricultural economists at public institutions estimate the social benefits and the social rate of return of these public investments. In calculating the increase in producers’ and consumers’ surplus from the adoption and diffusion of, for example, an improved variety developed by a public research station, one does not quality-adjust the new variety: it is the social value of the publically-financed quality improvement that one is attempting to measure. When new varieties diffuse across state or national borders a spillover
49 Griliches 1998 [1992]: 257-58.
exists. Such spillovers were often referred to as R&D spillovers; however, such spillovers are not pure knowledge spillovers as defined by Griliches and as used in endogenous growth theory. They are, in fact, unapproriated quality improvements in inputs adopted by private agents in the agricultural sector. To eliminate confusion, in light of endogenous growth theory, agricultural economists now refrain from using “R&D spillover”: they use the term “technology spillover” to refer to the cross-border diffusion and adoption of inputs embodying R&D; and they use “knowledge spillover” to refer to pure knowledge spillovers.
With this distinction in mind one can restate the conclusion of Part I: the empirical approach of the macro literature, regressing national TFP growth on various international purchase-flow-weighted R&D measures, conflates knowledge spillovers and technology spillovers. The finding that capital good- import-weighted R&D generates the best regression coefficients is consistent with the insufficient quality adjustment of imported capital goods. It is likely that some or much of what is being measured is unappropriated productivity improvements by foreign suppliers of capital goods and other inputs. This problem is to be expected when an indirect indicator of innovation derived from aggregate secondary data (TFP growth) is used. Credible evidence of international knowledge spillovers requires direct or more proximate observation of institutions engaged in R&D; if this is an important hypothesis then funding for primary data collection should become a priority.
The micro-level research surveyed in Part II is more inductive and exploratory than theoretically derived The underlying common denominator is an attempt to identify sources of the dynamic gains from trade. Dynamic in this context is opposed to static: dynamic gains are those in excess of the static gains. In terms of the standard welfare-gains-from-trade diagram, static gains result from movements along fixed domestic supply and demand curves; dynamic gains follow from movements in the curves. Given the firm-level panel data available, the

35Chapter 2: Trade and R&D spillover effects: Implications for firm-level analysis in the
agricultural sector
focus is on the sources of productivity gains on the supply side; on whether, how and to what extent the domestic supply curve shifts rightward. The dominant importance of selection effects, especially the reallocation of productive factors from less productive exiting firms to more productive surviving firms, is consistent with a rightward/downward shift of the domestic supply curve. Learning effects are also consistent with dynamic gains. Thus a consistent, empirically-grounded narrative emerges: increased international competition induces selection and productivity-improving investment, pre-trade and sometimes post-trade. The panel data sets that provide the empirical base do not provide evidence of international spillovers, whether of technical spillovers or knowledge spillovers. That many of the panel-data based studies use labour productivity rather than total factor productivity leaves scope for technical spillovers. It is unlikely that knowledge spillovers play a major role in the productivity gains observed in the panel studies, given the low proportion of firms that engages in R&D. Focusing a study on firms that do engage in R&D would allow one to gauge the relative magnitude of the international knowledge spillovers.
The key question facing the FAO project on analyzing the benefits of agriculture trade to developing countries based on firm and industry behaviour is whether to restrict its empirical investigation into international R&D spillovers to knowledge spillovers. The propensity of agro-industrial firms in developing countries to engage in R&D is even less than in developed countries. This limits the likely importance of knowledge spillovers as a benefit of trade, but the small number of R&D-engaged firms in any given developing country may make comprehensive in-depth surveys and interviews feasible. The alternatives are to broaden the scope slightly to allow technical spillovers or broaden the scope even further to allow the full range of causal channels under the heading of dynamic gains from trade.
Invariant of the choice of these three alternatives, there are some methodological lessons that can be drawn from empirical
analyses reviewed in parts I and II. First, adopt a micro-level, firm-based focus; the weaknesses of macro-level analysis have been noted many times in this paper. Second, collect primary data. Most of the studies reviewed in Part II are based on panel data sets constructed by national governments or multi-lateral development institutions. The cost and years involved makes a panel infeasible; but another panel is not necessary. The stylized facts are well-established: there are selection effects and learning effects and these can be examined in a small, well-designed sample that matches trading and non-trading firms, for example. Third and most important, what is missing from almost all of the studies reviewed in this paper is qualitative data. The quantitative results indicate that firms do things that make them more productive prior to engaging in trade and sometimes once they are engaged in trading: but this is merely statistical inference. Few studies engage firms directly and ask executives and managers what they did, why they did it, when they did it, and what they might have done had the institutional environment been different. The answers to questions like these, which cannot be posed to a secondary data set, have the potential to move the research program forward and inform and refine future research.
Van Biesebroeck (2005) is one of the few studies to find strong and significant evidence of postentry productivity gains by exporters. The study is of a panel of manufacturing firms in nine Sub-Saharan countries. The study is exceptional in that it uses qualitative data in addition to quantitative data. Van Biesebroeck’s argument, based on a (qualitative) survey of panel firm executives, is that contract enforcement in the home market is weak. In contrast, the risk of non-payment by foreign customers is very low. Thus new exporters gain increased access to credit and realize in the export market economies of scale that had been limited by a lack of reliable domestic customers. This is a post-entry, export-induced productivity effect but it is neither a knowledge (R&D) spillover nor a technology spillover nor does it qualify as a learning effect. It is a causal path that

36Analysis of the size and distribution of the impacts of agricultural trade at the firm and industry levels in developing countries
one could not have inferred from quantitative results alone. Such qualitative findings enrich the emerging narrative about the variety of benefits of trade to developing countries and about local
impediments to development; such finding are important because they inform the direction of data collection, theory construction and empirical analysis.

37Chapter 2: Trade and R&D spillover effects: Implications for firm-level analysis in the
agricultural sector
The stock of knowledge (R&D) is constructed from periodic (usually annual) R&D expenditure data, a flow value, using the Perpetual Inventory Method (PIM).50 The R&D stock (St ) at the end of period t is equal to the beginning stock (St-1) plus R&D expenditure during the year (Rt), minus depreciation of the beginning stock (δSt-1), where δ is the annual depreciation rate.
St = (1-δ)St-1 + Rt
The stock of R&D in the initial year (S0) is constructed thus: S0 = R1/ (δ + g); where g is the average annual logarithmic growth rate of R&D from the initial year to the present. The initial stock is not observed, it is constructed based on the assumption that R&D spending and depreciation prior the initial period is the same as the average rates after the initial period. The absolute stock of R&D is sensitive to the validity of this assumption.
The depreciation rate is generally assumed to be 5%; this means it takes 13.5 years for a given stock to depreciate by half and 45 years to depreciate by 90%. If one takes endogenous growth theory seriously then the depreciation rate should be zero for the horizontal (Dixit- Stiglitz product variety) model: knowledge once created is assumed to be immortal and demand for increasing variety literally implies that no product becomes obsolete. The depreciation rate for the vertical model, which assumes continual creative destruction, rendering existing stocks of knowledge obsolete, should logically have a relatively high rate of depreciation; it would likely vary considerably year-to-year as well.51
Agricultural economists have a distinct approach to constructing agricultural R&D stocks. The convention is to assume agricultural research (e.g., plant breeding) takes several years to before any useful research product becomes available. The new product then needs to tested and, if viable, scaled up. Thus R&D is lagged several years, its effective value increases gradually, reaches a peak or plateau in its mature phase, and then becomes obsolete as new, improved varieties are released or as it ceases to be resistant to pests and diseases. The time profile of agricultural R&D is usually a trapezoid or a gamma distribution density function.52
50 The OECD MSTI (Main Science and Technology Indicators) database is the standard source. The methodology of the indicators is elaborated in the Methodology of the Frascati Manual, OECD (2002a)
51 Coe et al. (2009), for example, assume a horizontal model and use 5 percent depreciation. They test whether their results are sensitive to this assumption and find that they are not (they test δ = .0 and .2). This further supports the argument presented in the conclusion of part I about the low precision of R&D data.
52 There is a huge literature on this topic; Sheng et al. (2011) has an excellent applied discussion of the construction R&D (knowledge) stocks for agricultural research and a good bibliography; it also examines R&D spillovers into Australian agriculture. Adams (1990) provides empirical evidence of long (15-20 year) lags for basic research. Pakes and Schankerman (1984) explore obsolescence and gestation lags.
APPENDIX A: MEASURING STOCKS OF KNOWLEDGE

38Analysis of the size and distribution of the impacts of agricultural trade at the firm and industry levels in developing countries
The passage below is from Grossman and Helpman (1991) Innovation and Growth in the Global Economy; pp. 166-67.
It is plausible to suppose that the foreign contribution to the local knowledge stock increases with the number of commercial interactions between domestic and foreign agents. That is, we may assume that international trade in tangible commodities facilitates the exchange of intangible ideas. This assumption can be justified in several ways. First, the larger the volume of international trade, the greater presumably will be the number of personal contacts between domestic and foreign individuals. These contacts may give rise to an exchange of information and may cause the agents from the small country to acquire novel (for them) perspectives on technical problems. Second, imports may embody differentiated intermediates that are not available in the local economy. The greater the quantity of such imports, the greater perhaps will be the number of insights that local researches gain from inspecting and using these goods. Third, when local goods are exported, the foreign purchasing agents may suggest ways to improve the manufacturing process. In the context of our model, the recommendations might take the form of ideas for new intermediate inputs. The number of such suggestions is likely to increase with the quantity of goods exported. It seems reasonable to assume therefore that the extent of the spillovers between any two countries increases with the volume of their bilateral trade. To pursue the implications of this hypothesis, we let Kn(t) denote the stock of knowledge capital in the small country, and suppose that the growth of Kn depends not only on spillovers from local research but also on those international contacts. In particular, we specify Kn(t) = G[n(t), T(t)], where T represents the cumulative volume of trade (exports plus imports) up to time t.
APPENDIX B: GROSSMAN AND HELPMAN ON WEIGHTINGINTERNATIONAL INFORMATION FLOWS

39Chapter 2: Trade and R&D spillover effects: Implications for firm-level analysis in the
agricultural sector
References
Acemoglu, D., Aghion, P. & Zilibotti, F. 2006. Distance to frontier, selection and economic growth. Journal of the European Economic Association, 4(1): 37-74.
Acemoglu, D., Antràs, P. & Helpman, E. 2007. Contracts and technology adoption. American Economic Review, 97(3): 916-943.
Acemoglu, D., Johnson, S. & Robinson, J.A. 2001. The colonial origins of comparative development: an empirical investigation. American Economic Review, 91(5): 1369-1401.
Acemoglu, D., Johnson, S. & Robinson, J.A. 2005. Institutions as a fundamental cause of long-run growth. In P. Aghion & S. Durlauf, eds. Handbook of Economic Growth, Volume 1A, pp. 385-472. Amsterdam, NL, Elsevier.
Acharya, R.C. & Keller, W. 2008. Estimating the productivity selection and spillover effects of imports. NBER working paper 14079. Cambridge, MA, USA, NBER Press.
Adams, J.D. 1990. Fundamental stocks of knowledge and productivity growth. Journal of Political Economy, 98(4): 673-702.
Adelman, I.G. 1958. A stochastic analysis of the size distribution of firms. Journal of the American Statistical Association, 53(284): 898-904.
Aghion, P., Bloom, N., Blundell, R., Griffith, R. & Howitt, P. 2005. Competition and innovation: an inverted-u relationship. Quarterly Journal of Economics, 120 (2): 701–728.
Aghion, P. & Howitt, P. 1992. A model of growth through creative destruction. Econometrica, 60(2): 323–51.
Alston, J.M. 2002. Spillovers. Australian Journal of Agricultural and Resource Economics, 46(3): 315-46.
Amiti, M. & Konings, J. 2007. Trade liberalization, intermediate inputs, and productivity. American Economic Review, 97(5): 1611-38.
Amiti, M. & Khandelwal, A.K. 2009. Import competition and quality upgrading. NBER working paper 15503. Cambridge, MA, USA, NBER Press.
Arnold, J.M. &. Hussinger, K. 2005. Export behaviour and firm productivity in German manufacturing: a firm-level analysis. Review of World Economics, 141: 219-243.
Antràs, P. 2003. Firms, contracts, and trade structure. Quarterly Journal of Economics, 118(4): 1375-1418.
Antràs, P. & Helpman, E. 2004. Global sourcing, Journal of Political Economy, 112(3): 552-80.
Antràs, P. & Helpman, E. 2008. Contractual frictions and global sourcing. In E. Helpman, D. Marin & T. Verdier, eds. The Organization of Firms in a Global Economy, pp. 9-54. Cambridge, MA, USA, Harvard University Press.
Arrow, K. (1962) Economic welfare and the allocation of resources for invention. In R. Nelson, ed. The Rate and Direction of Inventive Activity: Economic and Social Factors, pp. 609-625. Princeton, NJ, Princeton University Press.
Asplund, M. & Nocke, V. 2006. Firm turnover in imperfectly competitive markets. Review of Economic Studies, 73(2): 295-327.
Audretsch, D. & Feldman, M. 2004. Knowledge spillovers and the geography of innovation. In: J.V. Henderson and J.F. Thisse, (eds), Handbook of Regional ad Urban Economics, Volume IV, pp. 2714-2739. Amsterdam, NL, North-Holland.

40Analysis of the size and distribution of the impacts of agricultural trade at the firm and industry levels in developing countries
Aw, B.Y., Chen, X. & Roberts, M.J. 2001. Firm-level evidence on productivity differentials and turnover in Taiwanese manufacturing. Journal of Development Economics, 66(1): 51-86.
Aw, B.Y., Roberts, M.J. & Xu, D.Y. 2008. R&D investments, exporting, and the evolution of firm productivity. American Economic Review, 98(2): 451-456.
Aw, B.Y., Roberts, M.J. & Xu, D.Y. 2011. R&D investment, exporting and productivity dynamics, American Economic Review, 101(4): 1312-1344.
Baily, M. N., Hulten, C. & Campbell, D. 1992. Productivity dynamics in manufacturing plants. Brookings Papers on Economic Activity, Microeconomics, 1992: 187–249.
Baltagi, B.H. 2008. Econometric Analysis of Panel Data, 4th edition. Chichester, UK, John Wiley & Sons.
Barbosa, N. & Faria, A.P. 2011. Innovation across Europe: how important are institutional differences? Research Policy, 40(9): 1157-1169.
Bartelsman, E. J., & Doms, M. 2000. Understanding productivity: lessons from longitudinal microdata. Journal of Economic Literature, 38 (3), 569–594.
Bartelsman, E. J., Haskel, J. & Martin, R. 2008. Distance to which frontier? Evidence on productivity convergence from international firm-level data. CEPR Discussion Paper 7032.
Benhabib, J. & Spiegel, M. 1995. The role of human capital in economic development: evidence from aggregate cross-country data. Journal of Monetary Economics, 34: 143-173
Benhabib, J. & Spiegel, M. 2005. Human capital and technological diffusion. In P. Aghion & S. Durlauf, eds. Handbook of Economic Growth, Volume 1A, pp. 935-966. Amsterdam, NL, Elsevier.
Bernard A.B. & Jensen, J.B. 1995. Exporters, jobs, and wages in US manufacturing: 1976-87. Brookings Papers on Economic Activity: Microeconomics, 1995: 67-112.
Bernard, A. B. & Jensen, J.B. 1999. Exceptional exporter performance: Cause, effect, or both? Journal of International Economics, 47 (1): 1–25.
Bernard, A. B. & Jensen, J. B. 2004. Why some firms export. Review of Economics and Statistics, 86(2): 561–569.
Bernard A.B., Eaton, J., Jensen, J.B. & Kortum, S.S. 2003. Plants and productivity in international trade. American Economic Review, 93(4): 1268-90.
Bernard, A.B., Jensen, J.B., Redding, S. & Schott, P. 2007. Firms in international trade. Journal of Economic Perspectives, 21(3):105-130.
Bernard A.B., Jensen, J.B. & Schott, P.K. 2009. Importers, exporters and multinationals: a portrait of firms in the U.S. that trade goods. In T.Dunne, J.B. Jensen & M.J Roberts, eds. Producer Dynamics: New Evidence from Micro Data, pp. xxxxxx. Chicago, IL, USA, University of Chicago Press.
Bernard, A.B., Jensen, J.B. & Schott, P.K. 2006. Trade costs, firms and productivity. Journal of Monetary Economics, 53(5): 917-937.
Bernard, A.B., Jensen, J.B., Redding, S.J & Schott, P.K. 2011. The empirics of firm heterogeneity and international trade. NBER working paper 17627. Cambridge, MA, USA, NBER Press.
Bloom, N. & Van Reenen, J. 2007. Measuring and explaining management practices across firms and countries, Quarterly Journal of Economics 122(4): 1351-1408.

41Chapter 2: Trade and R&D spillover effects: Implications for firm-level analysis in the
agricultural sector
Bloom, N., Sadun, R. & Van Reenen, J. 2010a. Recent advances in the empirics of organization economics. Annual Review of Economics, 2: 105-37.
Bloom, N., Propper, C., Seiler, S. & Van Reenen, J. 2010b. The impact of competition on management quality: evidence from public hospitals. NBER working paper no. 16032.
Bloom, N., Eifert, B., Mahajan, A., McKenzie, D. & Roberts, J. 2011a. Does management matter? Evidence from India. NBER working paper no. 16658. Cambridge, MA, USA, NBER Press.
Bloom, N., Draca, M., & Van Reenen, J. 2011b. Trade induced technical change? The impact of Chinese imports on innovation, IT and productivity. NBER working paper no. 16717. Cambridge, MA, USA, NBER Press.
Botero, J. C., Djankov, S., La Porta, R., Lopez-de-Silanes, F. & Shleifer, A. 2004. The regulation of labour. Quarterly Journal of Economics, 119(5): 1339-1382.
Braguinsky, S., Branstetter, L. & Regaterio, A. 2011. The incredible shrinking Portuguese firm. NBER Working Paper No. 17265. Cambridge, MA, USA, NBER Press.
Bustos, P. 2011. Trade liberalization, exports and technology upgrading: evidence on the impact of MERCOSUR on Argentinian firms. American Economic Review, 101(1): 304-40.
Caves, R.E. 1998. Industrial organization and new findings on the turnover and mobility of firms. Journal of Economic Literature, 36(4): 1947-1982.
Chamberlin, E.H. 1933. The Theory of Monopolistic Competition. Cambridge, MA, USA, Harvard University Press.
Chaney, T. 2008. Distorted Gravity: The intensive and extensive margins of international trade. American Economic Review, 98(4): 1707-21.
Chaney, T. 2011. The network structure of international trade. NBER working paper 16753. Cambridge, MA, USA, NBER Press.
Clerides, S., Lach, S. & Tybout, J. 1998. Is Learning-by-exporting important? Micro-dynamic evidence from Colombia, Morocco, and Mexico. Quarterly Journal of Economics, 113(3): 903-47
Coe, D.T. & Helpman, E. 1995. International R&D spillovers. European Economic Review, 39(5): 859-887.
Coe, D.T., Helpman, E. & Hoffmaister, A. 1997. North-South R&D spillovers. Economic Journal, 107(440): 134-49.
Coe, D. T., Helpman, E. & Hoffmaister, A.W. 2009. International R&D spillovers and institutions. European Economic Review, 53(5): 723–741. Cohen, D. & Soto, M. 2007. Growth and human capital: good data, good results. Journal of Economic Growth, 12(1): 51-76.
Cohen, W. M. & S. Klepper. 1992 The anatomy of industry R&D intensity distributions. American Economic Review, 82(4): 773–88.
Cohen, W.M. & Levinthal, D.A. 1989. Innovation and learning: the two faces of R&D. Economic Journal, 99(4): 569-596.
Conley, T. G., & Udry, C.R. 2010. Learning about a new technology: pineapple in Ghana. American Economic Review, 100(1): 35–69
Costantini, J.A. & Melitz, M.J. 2008. The dynamics of firm-level adjustment to trade. In E. Helpman, D. Marin & T. Verdier, eds. The Organization of Firms in a Global Economy, pp. 107-142. Cambridge, MA, USA, Harvard University Press.
Damijan, J.P., Kostevc, C. & Polanec, S. 2008. From innovation to exporting or vice versa? Causal link between innovation activity and

42Analysis of the size and distribution of the impacts of agricultural trade at the firm and industry levels in developing countries
exporting in Slovenian microdata. Leuven, BE, LICOS discussion paper 20408.
Dasgupta, P. & Stiglitz, J.E. 1980a. Uncertainty, industrial structure, and the speed of R&D. Bell Journal of Economics, 11(1): 1-28.
Dasgupta, P. & Stiglitz, J.E. 1980b. Industrial structure and the nature of innovative activity. Economic Journal, 90(358): 266-293.
De Hoyos, R. E. & Iacovone, L. 2011. Economic performance under NAFTA : a firm-level analysis of the trade-productivity linkages. Washington, DC, World Bank Policy Research Working Paper Series no. 5661
Davis, S. J. & Haltiwanger, J. 1999. Gross job flows. In O. Ashenfelter & D. Card, eds. Handbook of Labour Economics, vol. 3B, pp. 2711–2805. New York, NY, USA, Elsevier Science.
Dixit, A.K. & Stiglitz, J.E. 1977. Monopolistic competition and optimum product diversity. American Economic Review, 67(3): 297–308.
Dunne,T., Roberts, M. & Samuelson, L. 1989. The growth and failure of US manufacturing plants. Quarterly Journal of Economics, 104(4): 671-698.
Durlauf, S.N, Johnson, P. & Temple, P. 2005. Growth econometrics. In P. Aghion & S. Durlauf, eds. Handbook of Economic Growth vol 1A, pp. 555-677. Amsterdam, NL, Elsevier.
Eaton, J., Kortum, S. & Kramarz, F. 2011. An anatomy of international trade: evidence from French firms. Econometrica, 79(5): 1453-1498.
Engelbrecht, H.J. 1997. International R&D spillovers, human capital and productivity in OECD economies: an empirical investigation. European Economic Review, 41(8): 1479-1488.
Eslava, M., Haltiwanger, J.C., Kugler, A.D. & Kugler, M. 2009. Trade reforms and market selection: evidence from manufacturing plants in Colombia. NBER working paper 14935. Cambridge, MA, USA, NBER Press.
Ethier, W. J. 1982. National and international returns to scale in the modern theory of international trade. American Economic Review, 72(3): 389-405.
Ethier, W.J. 2004. Dixit-Stiglitz, trade and growth. In S. Brakman & B.J. Heijdra, eds.:The Monopolistic Competition Revolution in Retrospect, pp. 149-156. New York, NY, USA, Cambridge University Press.
Fernandes, A. M. & Isgut, A.E. 2005. Learning-by-doing, learning-by-exporting, and productivity: evidence from Colombia. Washington, DC, World Bank Policy Research Working Paper Series no. 3544.
Foster, L., Haltiwanger, J. & Krizan, C.J. 2001. Aggregate productivity growth: lessons from microeconomic evidence, in E. Dean, M. Harper & C. Hulten, eds. New Developments in Productivity Analysis, pp. 303-363. Chicago,IL, USA, University of Chicago Press.
Foster, L., Haltiwanger, J. & Krizan, C.J. 2006. Market selection, reallocation, and restructuring in the U.S. retail trade sector in the 1990s. Review of Economics and Statistics, 88(4): 748-58.
Foster, L., Haltiwanger, J. & Syverson, C. 2008. Reallocation, firm turnover, and efficiency: selection on productivity or profitability? American Economic Review, 98(1): 394-425.
Fujita, M. & Thisse, J.F. 2002. Economics of Agglomeration. Cities, Industrial Location and Regional Growth. New York, NY, USA, Cambridge University Press.

43Chapter 2: Trade and R&D spillover effects: Implications for firm-level analysis in the
agricultural sector
Funk, M. 2001. Trade and international R&D spillovers among OECD countries. Southern Economic Journal, 67(3): 725-736.
Girma, S., Greenaway, D. & Kneller, R. 2004. Does exporting increase productivity? A microeconometric analysis of matched firms. Review of International Economics, 12(5): 855–66.
Glaeser, E.L., Kallal, H.D., Scheinkman, J.A. & Shleifer, A. 1992. Growth in cities. Journal of Political Economy, 100(6): 1126-52.
Görg, H. & Greenaway, D. 2004. Much ado about nothing? Do domestic firms really benefit from foreign direct investment? World Bank Research Observer, 19(2): 171-197.
Greenaway, D. & Kneller, R.A. 2008. Exporting, productivity and agglomeration. European Economic Review, 52(5): 919-939.
Griliches, Z. 1957. Hybrid corn: An exploration in the economics of technological change. Econometrica, 25(4): 501-22.
Griliches, Z. 1979. Issues in assessing the contribution of research and development to productivity growth. The Bell Journal of Economics, 10 (1): 92–116.
Griliches, Z., ed. 1984. R&D, Patents and Productivity. Chicago, IL, USA, University of Chicago Press.
Griliches, Z. 1998. R & D and Productivity: The Econometric Evidence. Chicago, IL, USA, University of Chicago Press.
Griliches, Z. & Ringstad, V. 1971. Economies of Scale and the Form of the Production Function. Amsterdam, NL, North-Holland
Grossman, G. M. & Helpman, E. 1991a. Innovation and Growth in the Global Economy. Cambridge, MA, USA, MIT Press.
Grossman, G. M. & Helpman, E. 1991b. Quality ladders in the theory of growth. Review of Economic Studies, 58(1): 43-61.
Grossman G.M. & Rossi-Hansberg, E. 2008. Trading tasks: a simple theory of offshoring. American Economic Review, 98(5): 1978-97.
Gustafsson, P. & Segerstrom, P. 2010. Trade liberalization and productivity growth. Review of International Economics, 18(2): 207-228.
Helpman, E., ed. 2008. Institutions and Economic Performance. Cambridge, MA, USA, Harvard University Press.
Helpman E, Melitz, M.J. & Rubinstein, Y. 2008. Estimating trade flows: trading partners and trading volumes. Quarterly Journal of Economics, 123(2): 441-87.
Helpman E, Melitz, M.J. & Yeaple, S.R. 2004. Export versus FDI with heterogeneous firms. American Economic Review, 94(1): 300-16.
Hoch, I. 1955. Estimation of production function parameters and testing for efficiency. Econometrica, 23(3): 325-326.
Hoch, I. 1958. Simultaneous equations bias in the context of the Cobb-Douglas production function. Econometrica, 26(1): 566-578.
Hoch, I. 1962. Estimation of production function parameters combining time-series and crosssectional data. Econometrica, 30(1): 34-53.
Hopenhayn, H. 1992. Entry, exit, and firm dynamics in long run equilibrium. Econometrica, 60 (5): 1127–50.
Hoppe, R.A., MacDonald, J.M. & Korb, P. 2010. Small farms in the United States: persistence under pressure, EIB 63. Washington, DC, USDA, Economic Research Service.
44Analysis of the size and distribution of the impacts of agricultural trade at the firm and industry levels in developing countries
Hsiao, C. 2003. Analysis of Panel Data, 2nd edition. New York, NY, USA, Cambridge University Press.
Hsieh, C-T. & Klenow P. 2009. Misallocation and manufacturing TFP in China and India. Quarterly Journal of Economics, 124(4):1403–48.
Iacovone, L., Keller, W. & Rauch, F. 2011. Innovation responses to import competition, Seminar paper, Department of Economics, Princeton University.
ISGEP. 2008. Understanding cross-country differences in exporter premia: comparable evidence for 14 countries. Review of World Economics, 144(4): 596-635.
Jaffe, A.B. 1986. Technological opportunity and spillovers of R&D: evidence from firms patents, profits, and market value. American Economic Review, 76(5): 984–1001.
Jaffe, A. B., Trajtenberg, M. & Henderson, R.M. 1993. Geographic localization of knowledge spillovers as evidenced by patent citation. Quarterly Journal of Economics, 108(3): 577- 598.
Jones, C. 1995. Time series tests of endogenous growth models. Quarterly Journal of Economics, 110(2): 495-525.
Jones, C. 2005. Growth and ideas. In P. Aghion & S. Durlauf, eds. Handbook of Economic Growth Vol 1B, pp. 1063-1111. Amsterdam, NL, Elsevier.
Jorgenson, D.W. & Griliches, Z. 1967. The explanation of productivity change. Review of Economic Studies, 4(3): 249-83.
Jorgenson, D.W. & Griliches, Z. 1972. Issues in growth accounting: A Reply to Edward F. Denison. Survey of Current Business, 52(5-Part II): 65-94.
Jorgenson, D.W. & Vu, K.M. 2011. The rise of developing Asia and the new economic order. Journalof Policy Modeling, 33: 698–745.
Jovanovic, B. (1982) Selection and the evolution of industry, Econometrica 50 (3): 649–70.
Jovanovic, B. & Rob, R. 1989. The growth and diffusion of knowledge. Review of Economic Studies, 56 (4): 569–82.
Keller, W. 1998. Are international R&D spillovers trade-related? Analyzing spillovers among randomly matched trade partners. European Economic Review, 42(8): 1469-1481.
Keller, W. 2004. International technology diffusion. Journal of Economic Literature, 42(3): 752- 782.
Keller, W. 2010. International trade, foreign direct investment, and technology spillovers. In B.H. Hall & N. Rosenberg, eds. Handbook of the Economics of Innovation, pp. 793-829. Amsterdam, NL, Elsevier.
Krugman, P.R. 1979. Increasing returns, monopolistic competition, and international trade. Journal of International Economics, 9(4): 469-479.
Krugman, P.R. 1980. Scale economies, product differentiation, and the pattern of trade. American Economic Review, 70(5): 950-959.
Krugman, P.R. 1991. Increasing returns and economic geography. Journal of Political Economy, 99(3): 483-499.
La Porta, R., Lopez-de-Silanes, F. & Shleifer, A. 1999. Corporate ownership around the world. Journal of Finance, 54 (2): 471–517.
Leibenstein, H. 1966. Allocative efficiency vs. X-efficiency. American Economic Review, 56 (3): 392–415.
Levin, R. & Reiss, P. 1984. Tests of a Schumpeterian model of R&D and market structure. In Z. Griliches, ed. R&D, Patents and Productivity, pp. 175-208. Chicago, IL, USA, University of Chicago Press.

45Chapter 2: Trade and R&D spillover effects: Implications for firm-level analysis in the
agricultural sector
Levin, R. & Reiss, P. 1988. Cost-reducing and demand-creating R&D with spillovers. Rand Journal of Economics, 19(4): 538-56.
Levin, R.C., Klevorick, A., Nelson, R.R. & Winter, S.C. 1987. Appropriating the returns from industrial R&D. Brookings Papers on Economic Activity, 1987(3): 783-820.
Levinsohn, J. & Petrin, A. 2003. Estimating production functions using inputs to control for unobservables. Review of Economic Studies, 70(2): 317-41.
Lichtenberg, F. & van Pottelsberghe de la Potterie, B. 1998. International R&D spillovers: a comment. European Economic Review, 42(8): 1483-1491.
Lileeva, A. & Trefler, D. 2010. Improved access to foreign markets raises plant-level productivity for some plants. Quarterly Journal of Economics, 125(3): 1051-99.
Liu, L. & Tybout, J.R. 1996. Productivity growth in Chile and Columbia: the role of entry, exit and learning. In M. J. Roberts & J. R. Tybout, eds. Industrial evolution in developing countries: Micro patterns of turnover, productivity and market structure, pp. 73–103. New York, NY, USA, Oxford University Press.
López, R. A. 2005. Trade and growth: reconciling the macroeconomic and microeconomic evidence. Journal of Economic Surveys, 19(4): 623-648.
López, R. A. 2009. Do firms increase productivity in order to become exporters? Oxford Bulletin of Economics and Statistics, 71(5): 621-642.
López, R. A. & Yadav, N. 2010 Imports of intermediate inputs and spillover effects: evidence from Chilean plants. Journal of Development Studies, 46 (8): 1385-1403.
Lucas, R.E. 1978. On the size distribution of business firms. Bell Journal of Economics, 9(2): 508-523.
Lucas, R. E. 1988. On the mechanics of economic development. Journal of Monetary Economics, 22 (1): 3-42.
Mansfield, E. 1962. Entry, Gibrat’s Law, innovation, and the growth of firms. American Economic Review, 52(5): 1023-51.
Mansfield, E., Rapoport, J., Romeo, A., Wagner, S. & Beardsley, G. 1977. Social and private rates of return from industrial innovations. Quarterly Journal of Economics, 91(2): 221-240.
Marschak, J. & Andrews, W.H. 1944. Random simultaneous equations and the theory of production. Econometrica, 12 (1): 143-205.
Mundlak, Y. 1961. Empirical production functions free of management bias. Journal of Farm Economics, 43(1): 44-56.
Nasbeth, L. & Ray, G. eds. 1974. The Diffusion of New Industrial Processes: an International Study. Cambridge, UK, Cambridge University Press.
Nelson, R. & Phelps, E. 1966 Investment in humans, technological diffusion, and economic growth. American Economic Review, 56(1): 69-75.
Nerlove, M. 2002. The history of panel data econometrics, 1961-1997. In M.Nerlove, ed. Essays in Panel Data Econometrics, pp. 1-114. Cambridge, UK, Cambridge University Press.
Nickell, S. 1996. Competition and corporate performance. Journal of Political Economy, 104(4):724–746.
Olley, G. S. & Pakes, A. 1996. The dynamics of productivity in the telecommunications equipment industry. Econometrica, 64 (6): 1263–97.

46Analysis of the size and distribution of the impacts of agricultural trade at the firm and industry levels in developing countries
OECD. 2002a. Methodology of the Frascati Manual. Paris, OECD. (also available at www.oecd. org/sti/frascatimanual).
OECD. 2002b. Productivity and innovation: the impact of product and labour market policies.
OECD. Economic Outlook 71.
Pakes, A. & Schankerman, M.A. 1984. The rate of obsolescence of patents, research gestation lags, and the private rate of return to research resources. In Z. Griliches, ed. R&D, Patents, and Productivity, pp. 209-232. Chicago, IL, USA, University of Chicago Press.
Park, A., Yang, D., Shi, X & Jiang, Y. 2010. Exporting and firm performance: Chinese exporters and the Asian financial crisis. Review of Economics and Statistics, 92(4): 822-842.
Pavcnik, N. 2002. Trade liberalization, exit, and productivity improvement: evidence from Chilean plants. Review of Economic Studies, 69(1): 245-76.
Redding, S.J. 2010. Theories of heterogeneous firms and trade. NBER working paper 16562, Cambridge, MA, USA, NBER Press.
Roberts, M. & Tybout, J. 1997. Producer turnover and productivity growth in developing countries. World Bank Research Observer, 12(1): 1–18.
Rogers, E.M & Beal, G.M. 1958. Reference group influences in the adoption of agricultural technology. Report 1236. Ames, IA, USA, Iowa Agricultural and Home Economics Experiment Station.
Rogers, E.M. 1962. Diffusion of Innovations, Glencoe, IL, USA, Free Press.
Romer, P. M. 1986. Increasing returns and long-run growth. Journal of Political Economy, 94 (5): 1002-1037.
Romer, P.M. 1990. Endogenous technical change. Journal of Political Economy, 98(5-Part 2): S71-S102.
Ryan, B. & Gross, N.C. 1943. The diffusion of hybrid seed corn in two Iowa communities. Rural Sociology, 8: 15–24.
Ryan, B. & Gross, N.C. 1950. Acceptance and diffusion of hybrid corn seed in two Iowa communities. Research Bulletin 372, Ames, Iowa, USA, Iowa Agricultural Experiment Station.
Saint-Paul, G. 2002. Employment protection, international specialisation and innovation. European Economic Review, 46(2): 375-395.
Schreyer, P. 2001. OECD Manual: Measuring Productivity: Measurement of Aggregate and Industry-Level Productivity Growth. Paris: OECD.
Schreyer, P. 2002. Computer price indices and international growth and productivity comparisons. Review of Income and Wealth, 48: 15–31.
Schreyer, P. 2009. OECD Manual: Measuring Capital. Paris: Organisation for Economic Development and Cooperation.
Schultz, T.W. 1975. The value of the ability to deal with disequilibria. Journal of Economic Literature, 13(3): 827–846.
Seck, A. 2012. International technology diffusion and economic growth: explaining the spillover benefits to developing countries. Structural Change and Economic Dynamics, 23(in press).
Segerstrom, P.C., Anant, T.C.A. & Dinopolous, E. 1990. A Schumpeterian model of the product life cycle. American Economic Review, 80(5): 1077-91.
Sheng, Y., Gray, E.M., Mullen, J.D. & Davidson, A. 2011. Public Investment in Agricultural R&D

47Chapter 2: Trade and R&D spillover effects: Implications for firm-level analysis in the
agricultural sector
and Extension: An Analysis of the Static and Dynamic Effects on Australian Broadacre Productivity. Canberra, AU: Australian Bureau of Agricultural and Resource Economics and Sciences.
Simon, H.A. & Bonini, C.P. 1958. The size distribution of business firms. American Economic Review, 48(4): 607-617.
Solow, R. M. 1957. Technical change and the aggregate production function. Review of Economics and Statistics, 39(3): 312-20.
Solow, R. M. 1960. Investment and technical progress. In K.J.Arrow, S.Karlin & P.Suppes, eds. Mathematical Methods in the Social Sciences, pp. 89-104. Palo Alto, CA, USA, Stanford University Press.
Solow, R. M. 1962. Substitution and fixed proportions in the theory of capital. Review of Economic Studies, 29(2): 207-218.
Solow, R.M. 2001. After ‘Technical progress and the aggregate production function’. In C.R. Hulten, E.R. Dean & M.J. Harper, eds. New Developments in Productivity Analysis, pp. 173-178. Chicago, IL, USA, University of Chicago Press.
Spence, M. 1976. Product selection, fixed costs, and monopolistic competition. Review of Economic Studies, 43(2): 217-35.
Sutton, J. 1997. Gibrat’s legacy. Journal of Economic Literature, 35(1): 40-59.
Syverson, C. 2004. Market structure and productivity: a concrete example. Journal of Political Economy, 112(6): 1181-1222.
Syverson, C. 2011. What determines productivity? Journal of Economic Literature, 49(2): 326-65.
Terleckyj, N. 1974. Effects of R&D on the
Productivity Growth of Industries: An Exploratory Study. Washington, DC, National Planning Association.
Traxler, G. & Byerlee, D. 2001. Linking technical change to research effort: An examination of aggregation and spillover effects. Agricultural Economics, 24: 235–246.
Treffler, D. 2004. The long and short of the Canada-U.S. free trade agreement. American Economic Review, 94(4): 870-895.
Trofimenko, N. 2008. Learning by exporting: does it matter where one learns? evidence from Colombian manufacturing firms. Economic Development and Cultural Change, 56(4): 871-894.
Tybout, J. R. 1996. Heterogeneity and productivity growth: assessing the evidence. In J. Roberts & J. R. Tybout, eds. Industrial Evolution in Developing Countries: Micro Patterns of Turnover,Productivity, and Market Structure, pp. 43–72. New York, NY, USA, Oxford University Press.
Tybout, J.R. 2000. Manufacturing firms in developing countries: how well do they do, and why? Journal of Economic Literature, 38(1): 11-44.
Van Beveren, I. 2012. Total factor productivity estimation: a practical review. Journal of Economic Surveys, 26(1): 98-128.
Van Biesebroeck, J. 2005. Exporting raises productivity in Sub-Saharan African manufacturing firms. Journal of International Economics, 67 (2): 373–391.
Verhoogen, E. 2008. Trade, quality upgrading and wage inequality in the Mexican manufacturing sector. Quarterly Journal of Economics, 123(2): 489-530.

48Analysis of the size and distribution of the impacts of agricultural trade at the firm and industry levels in developing countries
Wallace, J. 2007. Exports and productivity: a survey of the evidence from firm-level data. The World Economy, 30(1): 60-82.
Wößmann, L. 2003. Specifying human capital. Journal of Economic Surveys, 17(1): 239–270.
Yang, Y. & Mallick, S. 2010. Export premium, self-selection and learning-by-exporting: evidence for Chinese matched firms. The World Economy, 33(10): 1218-1240.

49Chapter 3: Investigating the structures of agricultural trade industry in developing countries
CHAPTER 3: INVESTIGATING THE STRUCTURES OF THE AGRICULTURAL TRADE INDUSTRY IN DEVELOPING COUNTRIES *
* This chapter was written by Roehlano M. Briones (Research Fellow, Philippine Institute for Development Studies) and Manitra A. Rakotoarisoa (Economist, Trade and Markets Division, FAO). This chapter expresses the personal opinions of the authors.
3.1 Introduction
The globalization of agricultural and food trade has been hailed as a “big opportunity” for farmers and agribusiness entrepreneurs. However, considerations of quality, timeliness, and economies of scale have posed special challenges to smallholders (World Bank, 2008). The UN Special Rapporteur on the Right to Food (2009) sounds the oft-repeated alarm that “concentration in food production and distribution chains has been significantly increasing over the past years. The resulting market structure gives buyers considerable bargaining strength over their suppliers, with potentially severe implications for the welfare both of producers and consumers (p. 5).” Benefits from growing international trade in agricultural products are believed to have been captured by a few firms that dominate key nodes of the global value chain, to the exclusion of small farmers and producers at the primary level, whilst undermining food affordability at the retail level.
However, detailed information about the organization of agro-industry firms engaged in international trade is scarce. Understanding how trading firms have been organized based on empirically verifiable facts and causal factors is important for analyzing the distribution of trade benefits among firms and among their upstream or downstream links. This study, part
of a wider analysis on the determination of the distribution of agricultural trade benefits among firms and stakeholders in developing countries, seeks to compile and synthesize related literature on the structure of agricultural trade industry in developing countries.50 The objectives are:
1. To review the theory and evidence on the structure of agricultural trade industry in developing countries.
2. Based on a literature survey, to determine what causes the industry structure and how it affects the distribution of trade benefits among firms.
Regarding objective 1, the hypothesis is that trade in agricultural products is dominated by a small number of large firms receiving most of the trade gains. Under this objective, the study would attempt to describe a typology of organization/structure of agricultural trade industry, and characterize the actual organization of agricultural trade industry in developing countries (focusing on the main commodities) based on the typology.
Regarding objective 2, the study seeks to understand the factors behind the formation of the observed industry structures in agricultural trade, such as regulatory barriers, access to markets (i.e. raw materials), limit pricing, and
50 Here “trade” denotes cross-border exchange of goods that can be adequately documented; informal trade across porous borders is, for lack of data, excluded.

50 Analysis of the size and distribution of the impacts of agricultural trade at the firm and industry levels in developing countries
so on. It would also draw implications for the distribution of trade benefits.
Unfortunately there are very few systematic studies on the shares of agribusiness firms, particularly large ones, in international trade; market concentration would have to be inferred from “partial evidence” (Dy, 2009). The insights and findings from the literature on agribusiness structure are therefore relevant to agricultural trade. Hence the broader literature on agribusiness structure is still covered in our literature survey.
The rest of the paper is organized as follows: Section 2 provides a setting and context by presenting patterns and trends in agricultural trade and agribusiness. Section 3 addresses Objective 1 by describing a typology of agribusiness organization and tracing the structure and evolution of agricultural industry in terms of this typology, which provides insight into the structure of agricultural trade (exporters and importers of agricultural products) in developing countries. Section 4 addresses Objective 2 and analyses causes and distributional effects of agricultural industry structure. It provides a schema for categorizing the causes and outcomes of industry structure and reviews available evidence of the hypothesized interactions. Section 5 concludes.
3.2 Agriculture, agribusiness and trade
Agriculture together with agribusiness combine to account for a prominent share of output in developing economies. As income increases the size of agribusiness rises relative to that of primary agriculture.
In the developing world, it is well-known that agriculture remains a sizable part of the economy; less publicized is the fact that agribusiness is also significant, perhaps more so as a share in GDP. While most farms (up to 85 percent) fall in the smallholder category of below 2 ha (von Braun and Diaz-Bonilla, 2008), large swathes of agribusiness can be
Agriculture Agribusiness
Cameroon 40 17
Cote de Ivoire 28 26
Ethiopia 56 30
Ghana 44 19
Kenya 26 23
Nigeria 42 16
Indonesia 20 33
Thailand 11 43
Philippines 12 15
Agri-based countries 39 22
Source: Wilkinson and Rocha (2009); Philippines - from Balisacan
et al., (2011)
Table 3.1: Share of agriculture and agribusiness in
GDP, selected developing countries, recent years (%)
controlled by just a handful of firms. Following Wilkinson and Rocha (2009), “agribusiness” refers to agriculture-related activities that provide inputs to farmers, and connects them to consumers through the handling, processing, transportation, marketing, and distribution of agricultural products. Their data suggest that in agriculture-based, low-income countries, the ratio of agriculture to agribusiness is around 0.6 (Table3.1). The ratio increases to somewhere below 2 for “transforming” countries, and around 3 for urbanized developing countries (in a developed country such as the US the ratio is about 13).
Trade in agricultural products has been increasing, even over the period of declining real commodity prices (1980s – 1990s). During this period the structure of commodity trade had been shifting from traditional products to newer products such as horticulture and seafood.
Global exports of agricultural products has been increasing since the 1960s. This is seen in Figure 3.1, which uses FAO data (http://.faostat.fao.org). Since the 1960s, growth of exports (in real terms) has averaged about 3.6 percent. In the 1980s to 1990s, world commodity prices had been on a long term relative decline (FAO, 2004),
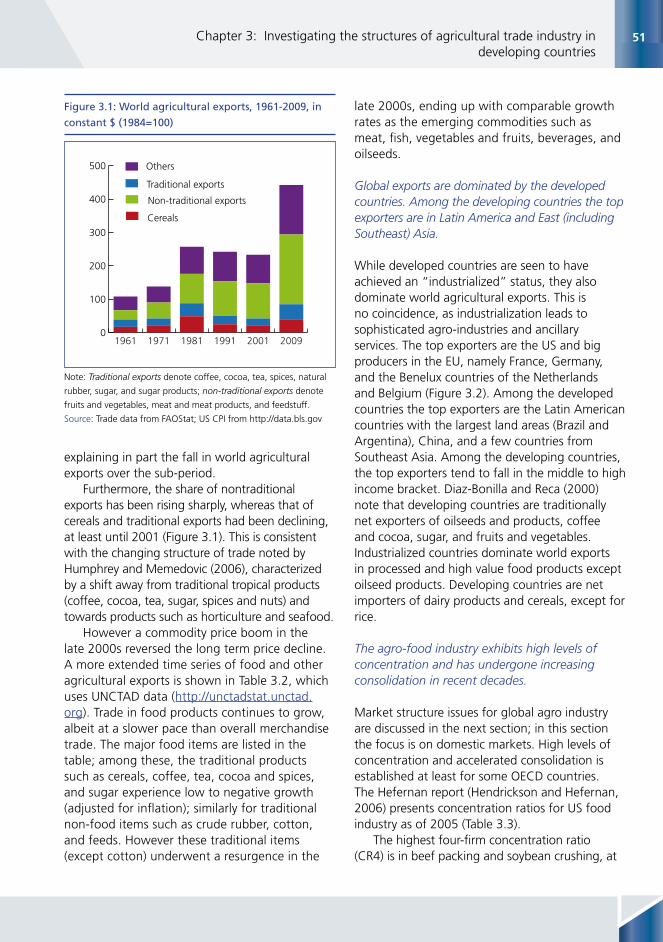
51Chapter 3: Investigating the structures of agricultural trade industry in developing countries
Note: Traditional exports denote coffee, cocoa, tea, spices, natural
rubber, sugar, and sugar products; non-traditional exports denote
fruits and vegetables, meat and meat products, and feedstuff.
Source: Trade data from FAOStat; US CPI from http://data.bls.gov
Figure 3.1: World agricultural exports, 1961-2009, in
constant $ (1984=100)
explaining in part the fall in world agricultural exports over the sub-period.
Furthermore, the share of nontraditional exports has been rising sharply, whereas that of cereals and traditional exports had been declining, at least until 2001 (Figure 3.1). This is consistent with the changing structure of trade noted by Humphrey and Memedovic (2006), characterized by a shift away from traditional tropical products (coffee, cocoa, tea, sugar, spices and nuts) and towards products such as horticulture and seafood.
However a commodity price boom in the late 2000s reversed the long term price decline. A more extended time series of food and other agricultural exports is shown in Table 3.2, which uses UNCTAD data (http://unctadstat.unctad.org). Trade in food products continues to grow, albeit at a slower pace than overall merchandise trade. The major food items are listed in the table; among these, the traditional products such as cereals, coffee, tea, cocoa and spices, and sugar experience low to negative growth (adjusted for inflation); similarly for traditional non-food items such as crude rubber, cotton, and feeds. However these traditional items (except cotton) underwent a resurgence in the
late 2000s, ending up with comparable growth rates as the emerging commodities such as meat, fish, vegetables and fruits, beverages, and oilseeds.
Global exports are dominated by the developed countries. Among the developing countries the top exporters are in Latin America and East (including Southeast) Asia.
While developed countries are seen to have achieved an “industrialized” status, they also dominate world agricultural exports. This is no coincidence, as industrialization leads to sophisticated agro-industries and ancillary services. The top exporters are the US and big producers in the EU, namely France, Germany, and the Benelux countries of the Netherlands and Belgium (Figure 3.2). Among the developed countries the top exporters are the Latin American countries with the largest land areas (Brazil and Argentina), China, and a few countries from Southeast Asia. Among the developing countries, the top exporters tend to fall in the middle to high income bracket. Diaz-Bonilla and Reca (2000) note that developing countries are traditionally net exporters of oilseeds and products, coffee and cocoa, sugar, and fruits and vegetables. Industrialized countries dominate world exports in processed and high value food products except oilseed products. Developing countries are net importers of dairy products and cereals, except for rice.
The agro-food industry exhibits high levels of concentration and has undergone increasing consolidation in recent decades.
Market structure issues for global agro industry are discussed in the next section; in this section the focus is on domestic markets. High levels of concentration and accelerated consolidation is established at least for some OECD countries. The Hefernan report (Hendrickson and Hefernan, 2006) presents concentration ratios for US food industry as of 2005 (Table 3.3).
The highest four-firm concentration ratio (CR4) is in beef packing and soybean crushing, at
0
100
200
300
400
500 Others
Non-traditional exports
Traditional exports
Cereals
200920011991198119711961

52 Analysis of the size and distribution of the impacts of agricultural trade at the firm and industry levels in developing countries
Exports (in $ billions) Average growth, real terms (%)
1995 2000 2005 2010 1995-2005 1995-2010
Total all products 5 121 6 368 10 457 15 148 5.5 5.5
Food (including preparations) 460 426 681 1 143 1.7 4.1
Meat 48 45 75 119 2.2 4.1
Fish, crustaceans, molluscs 48 51 73 109 1.9 3.4
Cereals 56 50 73 129 0.1 3.5
Vegetables and fruits 71 70 117 184 2.9 4.4
Sugar, sugar preparations 21 15 24 48 (1.0) 3.6
Coffee, tea, cocoa, spices 33 28 45 86 0.6 4.5
Oil seeds and fruits 13 14 23 56 3.7 8.4
Miscellaneous 19 19 36 57 4.3 5.4
Beverages 33 34 58 80 3.7 4.0
Crude rubber 14 10 22 46 2.5 6.4
Cotton 12 8 11 19 (3.6) 0.7
Animal and vegetable oils 27 19 39 83 1.2 5.7
Feedstuff for animals 21 20 31 61 1.8 5.5
Tobacco 25 22 26 36 (2.3) 0.0
Note: Growth rates have been adjusted for annual inflation of the US CPI
Source: Trade data from UNCTADStat; CPI data from http://data.bls.gov
Table 3.2: World merchandise exports, total and selected item, 1995–2010
Figure 3.2: Top ten agricultural exporters , by country category, 2009 ($ billions)
Source of basic data: FAOStat.
0 20 40 60 80 100 120
Australia
UK
Canada
Spain
Italy
Belgium
France
Germany
Netherlands
USA
0 10 20 30 40 50 60Ukraine
Turkey
Mexico
India
Malaysia
Thailand
Indonesia
Argentina
China
Brazil
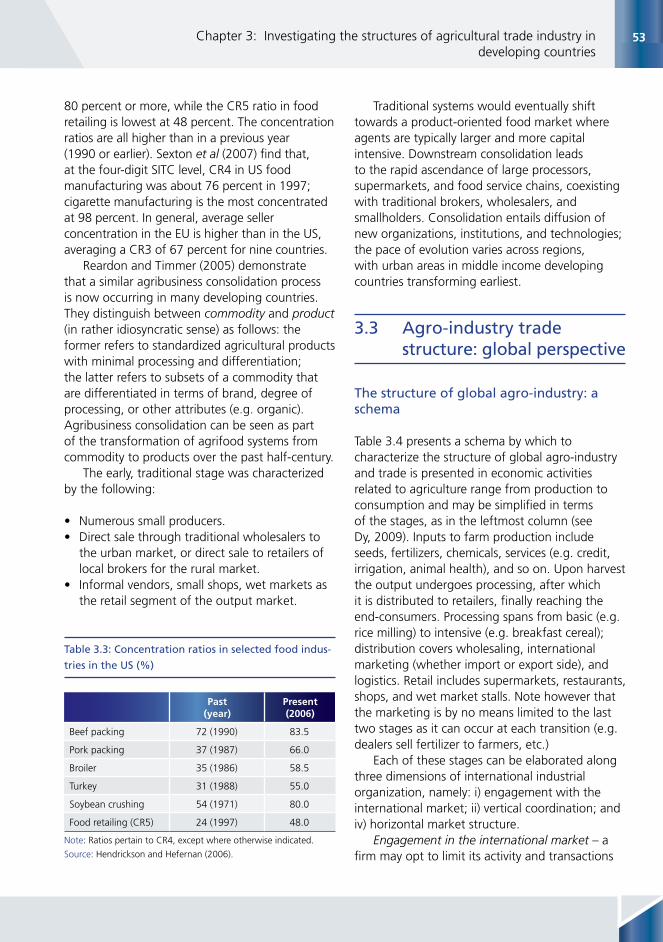
53Chapter 3: Investigating the structures of agricultural trade industry in developing countries
80 percent or more, while the CR5 ratio in food retailing is lowest at 48 percent. The concentration ratios are all higher than in a previous year (1990 or earlier). Sexton et al (2007) find that, at the four-digit SITC level, CR4 in US food manufacturing was about 76 percent in 1997; cigarette manufacturing is the most concentrated at 98 percent. In general, average seller concentration in the EU is higher than in the US, averaging a CR3 of 67 percent for nine countries.
Reardon and Timmer (2005) demonstrate that a similar agribusiness consolidation process is now occurring in many developing countries. They distinguish between commodity and product (in rather idiosyncratic sense) as follows: the former refers to standardized agricultural products with minimal processing and differentiation; the latter refers to subsets of a commodity that are differentiated in terms of brand, degree of processing, or other attributes (e.g. organic). Agribusiness consolidation can be seen as part of the transformation of agrifood systems from commodity to products over the past half-century.
The early, traditional stage was characterized by the following: • Numerous small producers. • Direct sale through traditional wholesalers to
the urban market, or direct sale to retailers of local brokers for the rural market.
• Informal vendors, small shops, wet markets as the retail segment of the output market.
Past (year)
Present (2006)
Beef packing 72 (1990) 83.5
Pork packing 37 (1987) 66.0
Broiler 35 (1986) 58.5
Turkey 31 (1988) 55.0
Soybean crushing 54 (1971) 80.0
Food retailing (CR5) 24 (1997) 48.0
Note: Ratios pertain to CR4, except where otherwise indicated.
Source: Hendrickson and Hefernan (2006).
Table 3.3: Concentration ratios in selected food indus-
tries in the US (%)
Traditional systems would eventually shift towards a product-oriented food market where agents are typically larger and more capital intensive. Downstream consolidation leads to the rapid ascendance of large processors, supermarkets, and food service chains, coexisting with traditional brokers, wholesalers, and smallholders. Consolidation entails diffusion of new organizations, institutions, and technologies; the pace of evolution varies across regions, with urban areas in middle income developing countries transforming earliest.
3.3 Agro-industry trade structure: global perspective
The structure of global agro-industry: a schema
Table 3.4 presents a schema by which to characterize the structure of global agro-industry and trade is presented in economic activities related to agriculture range from production to consumption and may be simplified in terms of the stages, as in the leftmost column (see Dy, 2009). Inputs to farm production include seeds, fertilizers, chemicals, services (e.g. credit, irrigation, animal health), and so on. Upon harvest the output undergoes processing, after which it is distributed to retailers, finally reaching the end-consumers. Processing spans from basic (e.g. rice milling) to intensive (e.g. breakfast cereal); distribution covers wholesaling, international marketing (whether import or export side), and logistics. Retail includes supermarkets, restaurants, shops, and wet market stalls. Note however that the marketing is by no means limited to the last two stages as it can occur at each transition (e.g. dealers sell fertilizer to farmers, etc.)
Each of these stages can be elaborated along three dimensions of international industrial organization, namely: i) engagement with the international market; ii) vertical coordination; and iv) horizontal market structure.
Engagement in the international market – a firm may opt to limit its activity and transactions
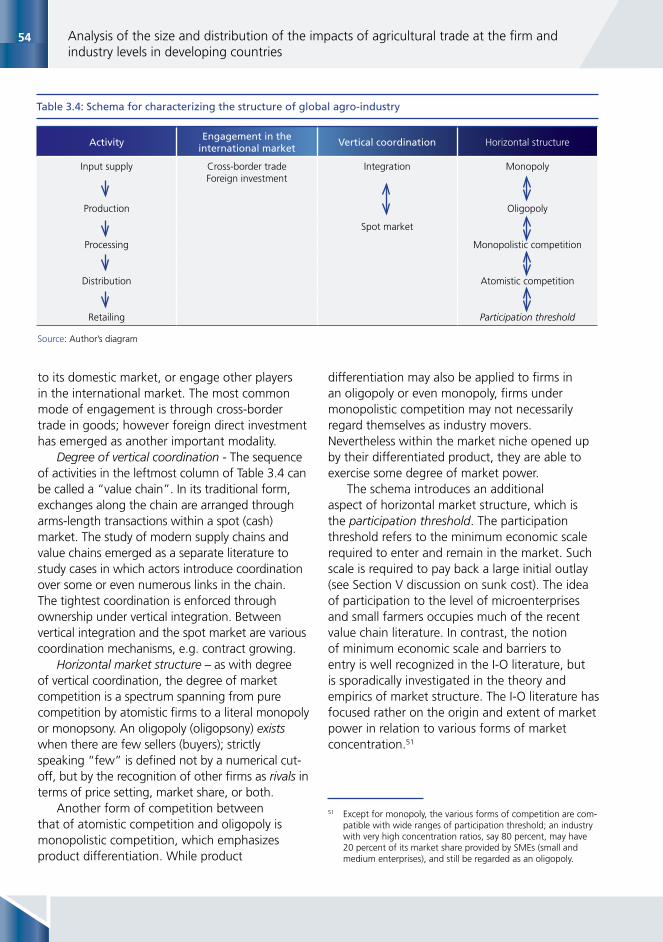
54 Analysis of the size and distribution of the impacts of agricultural trade at the firm and industry levels in developing countries
Source: Author’s diagram
ActivityEngagement in the
international marketVertical coordination Horizontal structure
Input supply Cross-border tradeForeign investment
Integration Monopoly
Production Oligopoly
Spot market
Processing Monopolistic competition
Distribution Atomistic competition
Retailing Participation threshold
Table 3.4: Schema for characterizing the structure of global agro-industry
to its domestic market, or engage other players in the international market. The most common mode of engagement is through cross-border trade in goods; however foreign direct investment has emerged as another important modality.
Degree of vertical coordination - The sequence of activities in the leftmost column of Table 3.4 can be called a “value chain”. In its traditional form, exchanges along the chain are arranged through arms-length transactions within a spot (cash) market. The study of modern supply chains and value chains emerged as a separate literature to study cases in which actors introduce coordination over some or even numerous links in the chain. The tightest coordination is enforced through ownership under vertical integration. Between vertical integration and the spot market are various coordination mechanisms, e.g. contract growing.
Horizontal market structure – as with degree of vertical coordination, the degree of market competition is a spectrum spanning from pure competition by atomistic firms to a literal monopoly or monopsony. An oligopoly (oligopsony) exists when there are few sellers (buyers); strictly speaking “few” is defined not by a numerical cut-off, but by the recognition of other firms as rivals in terms of price setting, market share, or both.
Another form of competition between that of atomistic competition and oligopoly is monopolistic competition, which emphasizes product differentiation. While product
differentiation may also be applied to firms in an oligopoly or even monopoly, firms under monopolistic competition may not necessarily regard themselves as industry movers. Nevertheless within the market niche opened up by their differentiated product, they are able to exercise some degree of market power.
The schema introduces an additional aspect of horizontal market structure, which is the participation threshold. The participation threshold refers to the minimum economic scale required to enter and remain in the market. Such scale is required to pay back a large initial outlay (see Section V discussion on sunk cost). The idea of participation to the level of microenterprises and small farmers occupies much of the recent value chain literature. In contrast, the notion of minimum economic scale and barriers to entry is well recognized in the I-O literature, but is sporadically investigated in the theory and empirics of market structure. The I-O literature has focused rather on the origin and extent of market power in relation to various forms of market concentration.51
51 Except for monopoly, the various forms of competition are com-patible with wide ranges of participation threshold; an industry with very high concentration ratios, say 80 percent, may have 20 percent of its market share provided by SMEs (small and medium enterprises), and still be regarded as an oligopoly.

55Chapter 3: Investigating the structures of agricultural trade industry in developing countries
Input supply
The 25 top global suppliers of inputs (except feeds) listed in UNCTAD (2009) are all based in developed countries, with eight based in the United States. The top ten are shown in Table 3.5. The top five have assets of approximately $ ten billion or more; foreign sales account for the bulk of sales (except for one US-based company). Many are large business conglomerates with diversified interests in manufactures, e.g. BASF, Dow (the top two chemical companies worldwide), Bayer (the 3rd-largest pharmaceutical), and Du Pont. Others are agriculture-specialized industries, such as Monsanto (seed, GMOs), Syngenta (pesticides, seeds), Potash Corp (fertilizer), and Kubota (farm machinery).
Fuglie et al (2011) presents concentration measures for the global agricultural input market (Table 3.6). The top 8 companies account for over half of global sales of pesticides, seeds, farm machineries, and animal health products; the market share of the top eight has risen substantially over the past 15 years, attesting to rising industry concentration at the global level. The big agricultural input companies tend to be specialized and do not exhibit vertical integration downstream with production. The specialized input companies appear to rely heavily on foreign sales (e.g. Syngenta, Yara, Potash); however
Total assets Foreign salesForeign sales as share
of total (%)
BASF AG Germany 44 633 49 520 58
Bayer AG Germany 24 573 24 746 52
Dow Chemical USA 23 071 35 242 66
Deere & Company USA 13 160 7 894 33
Du Pont USA 9 938 18 101 62
Syngenta AG Switzerland 9 065 9 281 95
Yara International ASA Norway 8 009 9 939 95
Potash Corporation Canada 6 079 3 698 66
Kubota Corporation Japan 5 575 4 146 43
Monsanto Company USA 4 040 3 718 43
Source: UNCTAD (2009)
Table 3.5: Size indicators of top global input suppliers, 2007 (USD million)
this does not necessarily denote domination of cross-border trade, as the sales may have been generated through FDI in overseas markets.
Production
The top twenty global companies with core business in plantations (including livestock production) as of 2007 are listed in Table 3.7.
1994 2009
Crop protection chemicals
- CR8 28.5 53.0
- Herfindahl 398.0 937.0
Crop seed
- CR8 21.1 53.9
- Herfindahl 171.0 991.0
Animal health
- CR8 32.4 50.6
- Herfindahl 510.0 827.0
Farm machinery
- CR8 28.1 50.1
- Herfindahl 264.0 791.0
Source: Fuglie et al., (2011)
Table 3.6: Concentration indicators in agricultural input
industries, global markets, 1994 and 2009

56 Analysis of the size and distribution of the impacts of agricultural trade at the firm and industry levels in developing countries
The country most represented is Malaysia (six companies) followed by the United States (five). Two other Southeast Asian countries make the list (Thailand and Indonesia). The other top companies are based in developed countries. All these plantation companies are vertically integrated forward to processing. The processed output is in turn marketed whether domestically or overseas by an integrated international distributor. For the top companies the forward integration may reach as far as branded consumer products, though seldom to the retail level (one exception being CP Foods). The commodity types include fruit crops (banana, pineapple), edible oils, processed food, and non-food products (rubber).
Engagement in international markets takes the form of both foreign investment, with sales directed to domestic markets abroad, or to export markets. The range of FDI exposure of the plantation companies varies widely (2 to 99 percent); likewise the reliance on overseas sales (6 to 99 percent). There is little pattern discernible in FDI or foreign sales.
Processing
Overview
Food manufacturing firms producing branded products figure prominently to the retail level. The top fifty food manufacturing companies
Company
Assets ($ millions) Sales ($ millions)
HQ LocationTotal
Of which foreign (%)
Total Of which foreign
(%)
Sime Darby 10 879 43 10 296 63 Malaysia
Dole Food 4 643 56 6 931 60 USA
Del Monte 2 122 83 3 366 55 USA
Socfinal 1 285 85 491 94 Luxembourg
CP Foods 3 012 34 4 002 34 Thailand
Chiquita Brands 2 678 29 4 663 57 USA
KL Kepong 2 052 37 1 487 80 Malaysia
KWS Saat 802 72 727 75 Germany
Kulim 1 677 29 829 67 Malaysia
Camella PLC 1 253 33 322 56 United Kingdom
Seaboard 2 094 19 3 213 71 USA
Sipef 343 83 222 99 Belgium
Anglo-Eastern 263 99 127 100 United Kingdom
Tyson Foods 10 227 2 26 900 6 USA
PPB Group 3 623 5 904 16 Malaysia
Carsons Cumberbatch 185 56 78 42 Sri Lanka
TSH Resources 359 26 261 13 Malaysia
Multi Vest Resources 121 65 15 - Malaysia
Bakrie and Brothers 1 485 5 563 13 Indonesia
PGI Group 68 96 37 70 United Kingdom
Source: UNCTAD (2009)
Table 3.7: Top twenty companies with agricultural production as core business, 2007
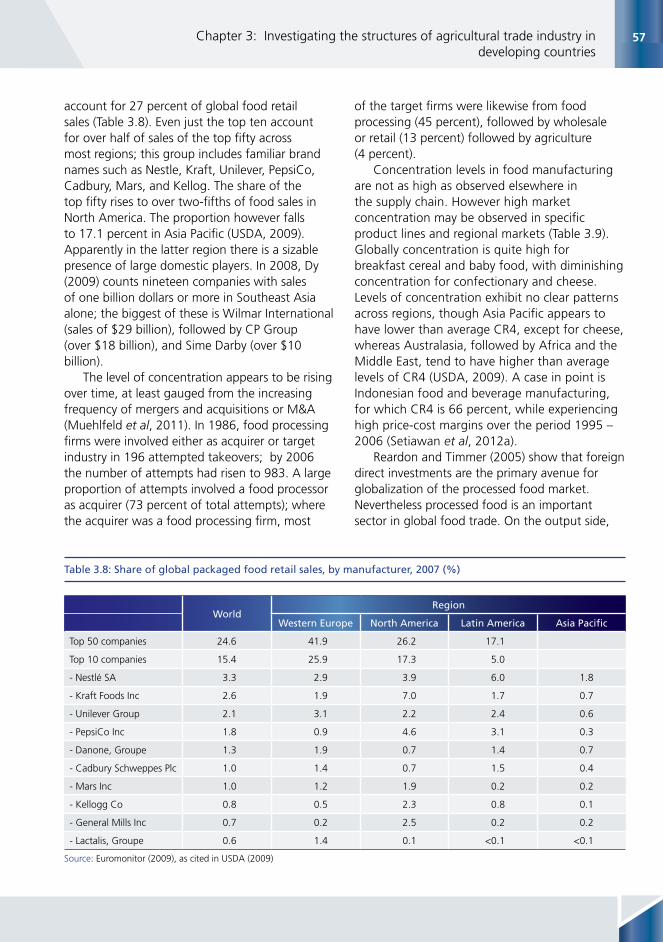
57Chapter 3: Investigating the structures of agricultural trade industry in developing countries
WorldRegion
Western Europe North America Latin America Asia Pacific
Top 50 companies 24.6 41.9 26.2 17.1
Top 10 companies 15.4 25.9 17.3 5.0
- Nestlé SA 3.3 2.9 3.9 6.0 1.8
- Kraft Foods Inc 2.6 1.9 7.0 1.7 0.7
- Unilever Group 2.1 3.1 2.2 2.4 0.6
- PepsiCo Inc 1.8 0.9 4.6 3.1 0.3
- Danone, Groupe 1.3 1.9 0.7 1.4 0.7
- Cadbury Schweppes Plc 1.0 1.4 0.7 1.5 0.4
- Mars Inc 1.0 1.2 1.9 0.2 0.2
- Kellogg Co 0.8 0.5 2.3 0.8 0.1
- General Mills Inc 0.7 0.2 2.5 0.2 0.2
- Lactalis, Groupe 0.6 1.4 0.1 <0.1 <0.1
Source: Euromonitor (2009), as cited in USDA (2009)
Table 3.8: Share of global packaged food retail sales, by manufacturer, 2007 (%)
account for 27 percent of global food retail sales (Table 3.8). Even just the top ten account for over half of sales of the top fifty across most regions; this group includes familiar brand names such as Nestle, Kraft, Unilever, PepsiCo, Cadbury, Mars, and Kellog. The share of the top fifty rises to over two-fifths of food sales in North America. The proportion however falls to 17.1 percent in Asia Pacific (USDA, 2009). Apparently in the latter region there is a sizable presence of large domestic players. In 2008, Dy (2009) counts nineteen companies with sales of one billion dollars or more in Southeast Asia alone; the biggest of these is Wilmar International (sales of $29 billion), followed by CP Group (over $18 billion), and Sime Darby (over $10 billion).
The level of concentration appears to be rising over time, at least gauged from the increasing frequency of mergers and acquisitions or M&A (Muehlfeld et al, 2011). In 1986, food processing firms were involved either as acquirer or target industry in 196 attempted takeovers; by 2006 the number of attempts had risen to 983. A large proportion of attempts involved a food processor as acquirer (73 percent of total attempts); where the acquirer was a food processing firm, most
of the target firms were likewise from food processing (45 percent), followed by wholesale or retail (13 percent) followed by agriculture (4 percent).
Concentration levels in food manufacturing are not as high as observed elsewhere in the supply chain. However high market concentration may be observed in specific product lines and regional markets (Table 3.9). Globally concentration is quite high for breakfast cereal and baby food, with diminishing concentration for confectionary and cheese. Levels of concentration exhibit no clear patterns across regions, though Asia Pacific appears to have lower than average CR4, except for cheese, whereas Australasia, followed by Africa and the Middle East, tend to have higher than average levels of CR4 (USDA, 2009). A case in point is Indonesian food and beverage manufacturing, for which CR4 is 66 percent, while experiencing high price-cost margins over the period 1995 – 2006 (Setiawan et al, 2012a).
Reardon and Timmer (2005) show that foreign direct investments are the primary avenue for globalization of the processed food market. Nevertheless processed food is an important sector in global food trade. On the output side,

58 Analysis of the size and distribution of the impacts of agricultural trade at the firm and industry levels in developing countries
SoupBreakfast
cerealBaby food Pet food Confectionery Cheese
World 50.4 62.3 60.0 45.8 32.9 20.2
Africa, Middle East 71.5 55.9 55.7 60.4 38.3 28.2
Asia Pacific 42.9 61.9 43.3 29.9 26.0 43.1
Australasia 91.1 87.8 91.5 59.0 74.1 70.1
Eastern Europe 66.5 40.0 55.2 58.2 36.6 17.5
Latin America 75.0 75.0 84.1 51.3 42.3 15.0
North America 68.3 82.3 88.0 48.6 56.8 43.2
Western Europe 55.6 61.3 73.9 45.5 37.8 21.5
Source: Euromonitor (2009), as cited in USDA (2009)
Table 3.9: Four-firm concentration ratios (CR4) in selected food products, 2007 (%)
the share of processed food in world agricultural exports has grown from 32 percent in 1980 to 51 percent in 2006. Developing countries’ share in processed food exports tripled over the same period, though this expansion occurred mostly in middle to upper middle income countries, which account for 90 percent of processed food exports from developing countries (Jongwanich, 2009).
On the input side, for some commodities production of agricultural raw material may be sourced from independent suppliers, which may be located abroad. This appears to be the case for some traditional bulk exports such as coffee, tea, and cotton in which raw materials are imported. Large, export-oriented processors would typically have their own distribution activities and allied business interests (see below). The following highlights several commodity cases.
Examples
For the main traditional bulk exports, the review of Poulton (2009) finds the following features of global trade: • Cocoa: worldwide there are four main
processors in the world chocolate market, three of whom dominate the trade.
• Coffee: Outside the specialty market (i.e. regular coffee), roasting is highly concentrated with CR3 = 0.45 in 2005. Main traders linked closely with the major roasters.
• Tea: there are four main packers in 2005; the biggest may have up to 60 percent share of the global tea market.
In the case of cocoa, processing begins from roasting, to grinding from which a variety of products may result, i.e. cocoa liquor, cocoa butter, cocoa powder, and cocoa cake. The cocoa liquor is further processed into industrial chocolate or couverture which is the raw material for finished chocolate. Two-thirds of grinding are done by just ten firms, with the top three – ADM, Cargill, and Barry Callebaut (Switzerland), dominating the market (40 percent share in the grinding market). Interestingly, Cargill and ADM have entered the processing segment fairly recently; they consolidated the activities of traditional trading companies (such as Gill & Duffus, Berisford and Sucden), by displacement or outright acquisition (UNCTAD, 2008).
For tea, the downstream portion of the supply chain is extremely concentrated (van der Wall, 2008). World trade is mostly divided across four companies, namely: Unilever (UK), Van Rees (the Netherlands), James Finlay (UK), and Tata/Tenley (UK). About 90 percent of Western tea trade is controlled by just seven multinational companies. The big tea traders and processors typically own large plantations; however in the biggest tea exporting countries (Sri Lanka and Kenya), tea is now mostly produced by smallholders (respectively, 65 and 62 percent).
Meanwhile for livestock, Dyck and Nelson (2003) note that, while hundreds of firms of various sizes participate in international meat trade, only a few very large firms are market
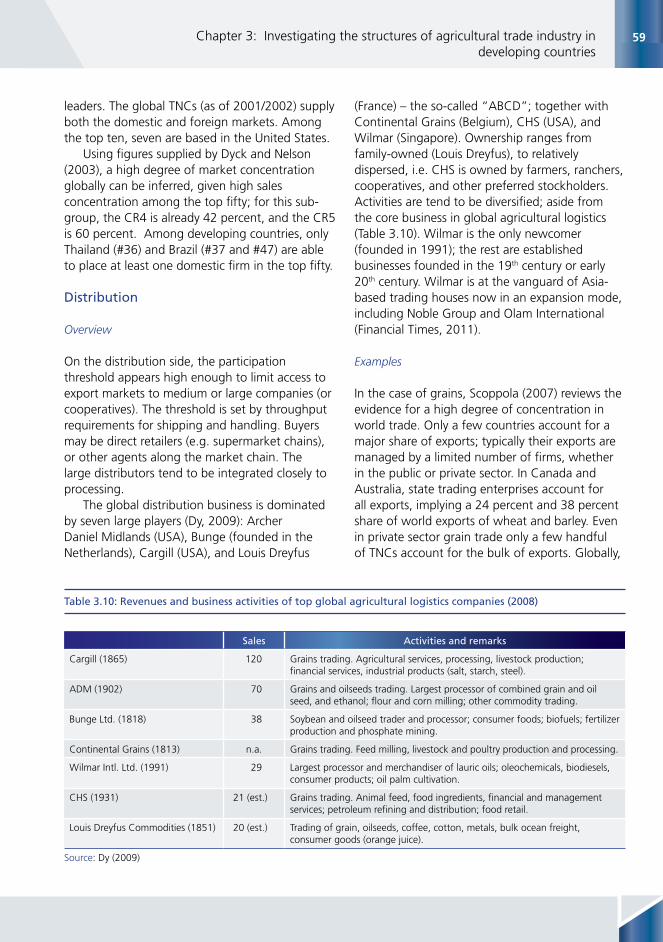
59Chapter 3: Investigating the structures of agricultural trade industry in developing countries
leaders. The global TNCs (as of 2001/2002) supply both the domestic and foreign markets. Among the top ten, seven are based in the United States.
Using figures supplied by Dyck and Nelson (2003), a high degree of market concentration globally can be inferred, given high sales concentration among the top fifty; for this sub-group, the CR4 is already 42 percent, and the CR5 is 60 percent. Among developing countries, only Thailand (#36) and Brazil (#37 and #47) are able to place at least one domestic firm in the top fifty.
Distribution
Overview
On the distribution side, the participation threshold appears high enough to limit access to export markets to medium or large companies (or cooperatives). The threshold is set by throughput requirements for shipping and handling. Buyers may be direct retailers (e.g. supermarket chains), or other agents along the market chain. The large distributors tend to be integrated closely to processing.
The global distribution business is dominated by seven large players (Dy, 2009): Archer Daniel Midlands (USA), Bunge (founded in the Netherlands), Cargill (USA), and Louis Dreyfus
(France) – the so-called “ABCD”; together with Continental Grains (Belgium), CHS (USA), and Wilmar (Singapore). Ownership ranges from family-owned (Louis Dreyfus), to relatively dispersed, i.e. CHS is owned by farmers, ranchers, cooperatives, and other preferred stockholders. Activities are tend to be diversified; aside from the core business in global agricultural logistics (Table 3.10). Wilmar is the only newcomer (founded in 1991); the rest are established businesses founded in the 19th century or early 20th century. Wilmar is at the vanguard of Asia-based trading houses now in an expansion mode, including Noble Group and Olam International (Financial Times, 2011).
Examples
In the case of grains, Scoppola (2007) reviews the evidence for a high degree of concentration in world trade. Only a few countries account for a major share of exports; typically their exports are managed by a limited number of firms, whether in the public or private sector. In Canada and Australia, state trading enterprises account for all exports, implying a 24 percent and 38 percent share of world exports of wheat and barley. Even in private sector grain trade only a few handful of TNCs account for the bulk of exports. Globally,
Sales Activities and remarks
Cargill (1865) 120 Grains trading. Agricultural services, processing, livestock production; financial services, industrial products (salt, starch, steel).
ADM (1902) 70 Grains and oilseeds trading. Largest processor of combined grain and oil seed, and ethanol; flour and corn milling; other commodity trading.
Bunge Ltd. (1818) 38 Soybean and oilseed trader and processor; consumer foods; biofuels; fertilizer production and phosphate mining.
Continental Grains (1813) n.a. Grains trading. Feed milling, livestock and poultry production and processing.
Wilmar Intl. Ltd. (1991) 29 Largest processor and merchandiser of lauric oils; oleochemicals, biodiesels, consumer products; oil palm cultivation.
CHS (1931) 21 (est.) Grains trading. Animal feed, food ingredients, financial and management services; petroleum refining and distribution; food retail.
Louis Dreyfus Commodities (1851) 20 (est.) Trading of grain, oilseeds, coffee, cotton, metals, bulk ocean freight, consumer goods (orange juice).
Source: Dy (2009)
Table 3.10: Revenues and business activities of top global agricultural logistics companies (2008)

60 Analysis of the size and distribution of the impacts of agricultural trade at the firm and industry levels in developing countries
15 percent of grain exports are exported by Louis Dreyfus. In the US market just two firms, Cargill and Continental, accounted for 35 percent of US grain and oilseeds exports in the late 1990s. According to Dy (2009), Cargill alone exported 25 percent of grain exports of Argentina.
For rice, Calpe (2007) notes that a large proportion of international trade is conducted through large international trading companies. Volatility in world trade has led to a turnover in the major players. Back in the 1990s, the main rice trading firms were Continental, Richco (Glencore) and Cargill; by the 2000s, these had downscaled or abandoned their rice trade operations. The big companies still in rice trading include ADM, Louis Dreyfus, and Olam. Other major trading companies are mentioned in Box 3.1. Unlike maize or wheat, rice is not standardized, hence brokers play an important role in facilitating trade. Examples of brokerage houses are: Jacksons, Marius Brun et Fils (Europe); Creed Rice (USA); Western Rice Mills (Canada).
For maize, in the 1990s the global market underwent rapid consolidation, mainly through mergers and acquisitions by grain firms. These tend to be relatively new companies; only a few major companies in the 1980s are still active in the trade (Abbassian, 2007).
The main sources of vegetable oils are oil palm, soybean, and rapeseed. Thoenes (2007) notes that the global soybean economy is shaped by a relatively small number of countries and international business conglomerates. Nevertheless he views the market as highly competitive despite high levels of market concentration, and expected consolidation. Some of the large vegetable oil traders (other than the big seven global distributors mentioned earlier) are shown in Box 3.2.
For fruits and vegetables, the global value chain is characterized as buyer-driven (Fernandez-Stark et al, 2011). The buyers are large supermarket chains in both EU, US, and increasingly in emerging markets. Stringent quality standards are imposed by these chains upon its suppliers, big or small, worldwide. The horticulture industry is increasingly organized by long term relationships and tighter links between
producer and exporter firms. The latter consist of a few large transnationals, together with domestic firms of varying sizes.
Box 3.1: Other rice trading companies
Box 3.2: Other major vegetable oil traders
Ascot Commodities (Switzerland): specializing in rice
sales to Africa; other Swiss companies include Rustal
and Novel.
Churchgate (India): active in Nigeria.
Nidera (the Netherlands): major operations in Latin
America
American Rice Inc. (USA): accounts for about 4
percent of the world rice market; markets . It markets
around one fifth of US rice, and also has a joint venture
with Vinafood I, one of Viet Nam’s major rice exporters.
_________________
Sources: Calpe (2007); FAO (2003)
Alimenta SA (Switzerland): among others, a partner of ADM
in Golden Peanut Cy, the world’s largest groundnut company.
Bunge Group (Argentina): responsible for about a
fifth of world trade in oilseeds and oils. It is the largest
soybean processor in the western hemisphere, with
significant interests in Brazil and Argentina.
Kuok Oils and Grains (Singapore): large operations in
palm and coconut oil, and in feed grains.
Nidera (the Netherlands): a family firm trading annually
18 million tons of soybeans, wheat, maize, rice and
other grains; major operations in Latin America.
ZenNoh (Japan): the third largest soybean and oil exporter.
The federation represents over a thousand cooperatives
covering most of Japan’s 4.7 million farming households.
___________________
Source: FAO (2003)

61Chapter 3: Investigating the structures of agricultural trade industry in developing countries
Exporters may engage small and medium size domestic suppliers as contract growers. Between 1980 and 2000, the low and middle income countries have managed to corner a greater share of fresh produce export market. Recently, developing country exporters are increasingly taking over packing and processing, thereby moving up the value chain. For instance, a wide variety of fruit and vegetables in supermarkets are shipped in as ready-to-eat convenience packs.
Retail
Worldwide the leading form of retail outlet is the supermarket or hypermarket (Figure 3.3). While modern outlets (supermarkets, hypermarkets, convenience sores, discounters) are seen to be largely a rich country phenomenon, Reardon and Timmer (2007) observe a rapid diffusion of modern retail centers in developing countries since the 1990s.
In Latin America, North-Central Europe, and East Asia (outside Japan and China), the share of supermarkets (shorthand for modern retail) rose from just 10-20 percent of food retail in 1990, to 50 percent or more by the early 2000s. Another wave came in the late 1990s to early 2000s, where supermarkets started from practically nil to about 10-20 percent share in food retail; these include parts of South and Central America, Southeast Asia (e.g. Vietnam), China, and Russia.
The modern retail business appears to be highly concentrated. For hypermarkets the share of the top 15 retailers worldwide is 74 percent; for convenience stores the share is 69 percent, and for discounters, 58 percent. The top retailers are well-known for their global chains, established by extensive FDI in middle- to high-income markets (Table 3.11).
Based on UNCTAD (2009), retailers with the largest share of revenue from foreign sales are Metro (59 percent), Ahold (55 percent), and Carrefour (54 percent). The world’s biggest retailer, Wal-Mart, still depends mostly on its domestic market; nevertheless foreign sales account for 24.2 percent of revenue. TNC retailers source goods mostly from domestic processors; imports account for only a small
portion of their products (Dy, 2009). However there has been a growing tendency to use platforms in developing countries to export to
Note: 1. Supermarkets - selling area 400 - 2,500 m2, at least 70 percent
foodstuffs and everyday commodities2. Hypermarkets – selling area > 2,500 m2, at least 35 percent of
selling space devoted to food3. Discounters - typically 300-900 m2 with < 1 000 product lines
(mostly packaged groceries); 4. Convenience shops - selling a wide range of goods with
extended hours.Source: Euromonitor, cited in USDA (2009)
Figure 3.3: Shares in the global food retail market by
type of retail outlet, 2009
Annual sales
Wal-Mart (US) 312.4
Carrefour (France) 92.6
Tesco (UK) 69.6
Metro Group (Germany) 69.3
Kroger (USA) 60.6
Ahold (Netherlands) 55.3
Costco (USA) 52.9
Rewe (Germany) 51.8
Schwartz (Germany) 45.8
Aldi (Germany) 45.0
Source: Hefernan (2006)
Table 3.11: Annual sales of top ten global retailers, in
$ billions, 2006
Other (16)
Discounters (9)
Convenience stores (7)
Independent food stores (17)
Supermarkets and hypermarkets (52)
52%
16%
9%
7%
17%
62 Analysis of the size and distribution of the impacts of agricultural trade at the firm and industry levels in developing countries
outlets worldwide. This is a very recent trend particularly for fresh produce and opens up export opportunities for developing country farmers (Reardon et al, 2009).
3.4 Developing country perspective
So far characterization has covered global agro-industry systems and trade. The following shifts to a developing country perspective in examining agricultural trade industry based on focal commodities for which information on market structure is available.
Major export industries
Rice
The top two exporters of rice are Thailand and Vietnam. Thailand rice exports are mostly done by the private sector, with the top 25 companies accounting for 90 percent of Thailand’s exports (Alavi et al, 2011). Contrary to the usual trend toward consolidation, the current set-up is more dispersed compared to the pre-war era; in the 1930s, only five families accounted for 44 percent of rice milled (Goss and Burch, 2001).
Shigetomi (2009) classifies the large Thai rice traders as follows: Group A firms were active in World War 2 or earlier; Group B firms comprised the “Five Tigers” that attempted to wrest control from Group A through cooperation (e.g. sharing of orders); Group C and D firms are those that emerged in the 1960s and 1970s. The latter group are exemplified by Soon Hua Seng, Capital Rice, and Chaiyaporn rice; these exporters are known for pioneering the African Middle Eastern markets.
In contrast, in Vietnam the government maintains a highly interventionist stance. Only 10 percent of exports are from the private sector. The remaining 90 percent is contributed by public sector companies, most prominent being VINAFOOD1 (exports from northern Vietnam) and VINAFOOD2 (exports from southern Vietnam). The latter accounts for 50 percent of the country’s
rice exports, and is responsible for most public procurement of rice. Exports are tightly regulated through the Vietnam Food Association (VFA), a government-controlled body, primarily to deflect rice supplies from the foreign to the domestic market. The VFA sets a discretionary minimum export price, which discourages private traders owing to its unpredictability. All export contracts need to be registered with VFA, hence the simple expedient of not recognizing these contracts can prohibit exportation. This transpired in early 2008 when Vietnam stopped private rice exports; in the meantime, VINAFOODS2 continued to export under government-to-government arrangement (with the Philippines), effectively turning into a trade monopoly (Alavi et al, 2011).
Vegetable oil export industry
The largest category in the vegetable oil export market is palm oil, for which the top two exporters are Indonesia and Malaysia. The Indonesian palm oil industry, according to Chalil (2008), supplies 75 percent of its output to the cooking oil industry, which is largely for domestic consumption, leaving 25 percent for export. Supply originates from three sources: government; a private group consisting of ten conglomerates; and smallholders (farm size below 200 ha). The last accounts for only a 40 percent share. Cooking oil is regarded as a food security item; government subsidizes for cooking oil, and imposes an export tax on the palm oil industry. The cooking oil industry is itself highly concentrated, with CR4 of 53 percent in 2005 (Muslim, Ertina, and Nurcahyo, 2008).
Unlike in Indonesia, palm oil in Malaysia is mostly exported, with only 10 percent for domestic consumption. As with Indonesia, government retains high levels of state ownership: about 30 percent of palm oil area is run by government agencies. The Federal Land Development Authority (FELDA) alone accounts for about 18 percent of area planted in 2002. About 60 percent of landholdings are under private estates, with estate sizes ranging from a few hundred ha to hundreds of thousands of ha. The PNB, the government’s investment arm,

63Chapter 3: Investigating the structures of agricultural trade industry in developing countries
owns large portions of equity in some of the industry giants such as Sime Darby Berhad, which has been mentioned earlier as world’s largest plantation company (see Box 3.3). Less than 10 percent of farms are owned by smallholders (under a rather generous definition of “small”, as in Indonesia).
The next important source of vegetable oil is soybean, for which the top two exporters are Argentina and Brazil. Lopez, Ramos, and Simkievich (2008) deals with the soybean complex in the former. Conveniently, little of soybean production (whether grain or oil) is consumed domestically; hence the industry market structure is the same as for the export market. Over the period 1995 to 2006, the soybean industry exhibited strong growth, with output growing over three-fold to 40.4 million tonnes, and area more than doubling to 15.4 million ha (half of total area harvested in the country). This period was accompanied by massive consolidation (Table 3.12).
The Argentinian soybean oil industry is seen to be the most efficient in the world. This is attributed to high farm productivity, owing to use of latest technologies (transgenics, and zero
tillage); large scale of its plants (90 percent of oil is processed in plants with average capacity of 7 500 tonnes/day); and proximity to ports (on average, production is only 300 km from the nearest port).
Similarly in Brazil, the industry underwent rapid concentration since 1995, with the acquisition of large domestic firms by four multinationals, namely Bunge, Dreyfus, ADM, and Cargill. The CR4 rose to 43 percent in 1997, from 31 percent in 1995. In crushing, the CR8 reached 55 percent compared to 47 percent in 1995 (Thoenes, 2007).
Orange juice export industry
Brazil is also a prominent fixture in the global orange juice industry, being the second largest producer worldwide. In the major traded product, frozen concentrated orange juice, the country accounts for over 80 percent of total world trade. Growth of export production averaged about 1.8 percent per year in 2001 – 2007. The industry generates about $4 billion a year and provides employment, directly or indirectly, to over 500 000 people. The export market is strongly concentrated: in 2001 the CR4 was 66.7 percent; by 2003 the ratio had risen to 78.2. By 2007 it may have reached 90 percent.
About 80 percent of harvested oranges are sold to processors (the remainder going to the fresh fruit market). Oranges for processing are mostly obtained from contract farmers, accounting for 55 to 65 percent of the export industry’s output. Contracts are either on a fixed price basis (majority of contracted oranges), or
Box 3.3: Sime Darby Berhad
Sime Darby Berhad began with rubber farms in 1910, later
diversifying to palm oil and cocoa. Plantations in Malaysia and
Indonesia total 630 000 ha, of which 531 000 ha are planted
to oil palm. Outside Asia, it has expanded to Liberia, with a
220 000 ha concession planted to oil palm. It is integrated
forward to production of crude palm oil, refined palm oil,
and branded consumer products such as cooking oil. It
has also diversified into real estate and industrial products.
The company started out under British ownership, but was
acquired by Malaysian investors (including PNB) in the 1980s.
In 2007, a merger of three industry giants, namely Golden
Hope, Guthrie, and Sime Darby, became what is now known
as Sime Darby Berhad.
____________________
Sources: Dy (2009); www.simedarby.com.covering most of Japan’s
4.7 million farming households
1995 2000 2006
Number of firms 22 27 20
Installed capacity (t/day) 58 902 94 258 149 318
Exports per firm (tons) 66 931 116 385 303 917
CR5 53.0 66.6 80.0
CR10 87.8 90.9 98.5
Source: Lopez, Ramos, and Simkievich (2008)
Table 3.12: Indicators of Argentina export industry,
selected years

64 Analysis of the size and distribution of the impacts of agricultural trade at the firm and industry levels in developing countries
flexible price (combining both a fixed and varying component depending on world prices). The next most important source is company-owned orchards (18 – 22 percent). The remainder is made up of other supply schemes, i.e. lease arrangements, partnerships, etc. (Neves, 2007).
Meat export industry
As mentioned earlier, of the top meat producer companies the only developing country firms are from Brazil and Thailand. For the former, concentration ratio for the export industry is available from Jank et al, (2001). Exports of poultry remained highly concentrated, with at about 82-85 percent in the 1990s. Concentration in the domestic market is not as high but has been increasing over the same period (CR5 of 32 percent rising to 38 percent). Meanwhile for pork the domestic concentration ratio rose from 61 to 68 percent. There is however an important exception in the trend of rising concentration, and that is for beef; concentration has been falling based on CR4 (55 percent down to 48 percent from 1990 to 1998). At the same time, the beef sector also suffered a decline in export volume.
In the case of Thailand, there is less evidence of rising concentration during a period of rapid production growth (4.3 percent annually from 1983 to 2001). In 1981, the CR3 was 92.8 percent; the top exporter then was CP Bangkok Livestock Trading, part of CP Foods (Box 3.4). At the time only 7.6 percent of output was exported. By 2003 up to 69 percent of broilers were exported as foreign markets became the main driver of demand. The market is controlled by a few integrators who span the supply chain from grandparent stock breeding to the export market. Nevertheless the CR3 declined to 52 percent (Poangpongsakorn et al, 2003). It is possible that as the broiler market grew, new firms entered, or some of the older companies managed to grow and take away market share from the older players. Production also appears to be concentrated, with farms of over 2 000 birds accounting for the bulk of all broilers. Very large scale production and high efficiencies were introduced through new technologies, mainly
EVAP (evaporative) systems, which introduces strict temperature and environmental controls within closed facilities (Costales, 2004).
Africa country cases
In the foregoing the discussion has been organized around large developing country exporters, who are all from Asia and Latin America. The following shifts the discussion to Africa given its potential for sustained growth through modernizing value chains.
Bulk commodities
African exports have often been associated with bulk commodities, e.g., cotton, coffee, and cocoa,
Box 3.4: The case of CP foods
CP Foods is one of the largest integrated poultry, livestock,
and aquaculture producers in the world. It is engaged in
the production of feeds, animal breeds, raising of livestock,
poultry, and fish, as well as food processing. Its associated
business (CP All) has a significant retailing presence in
Thailand and serves as outlet for its branded food products.
The business was established in 1923 by Chinese
immigrants as an agro-input company, later expanding
to feeds in the 1950s. In the 1960s is pioneered
contract growing of poultry in Thailand to stoke
demand for its animal feeds; it also established a
poultry processing plant as well as provision of breeds,
veterinary inputs, and financing. The “defining
moment” of agribusiness expansion, not just for the
company but for Thailand as well, was the entry of its
poultry products into Japan in the 1970s. In the 1980s it
branched out to aquaculture. As of 1993 the company
had become the world’s second largest poultry
producer, the the third largest producer of animal feed,
and the largest producer of prawn feed. It is the largest
agribusiness company in Southeast Asia, with significant
investments outside Thailand, particularly in China.
________________
Sources: Burch (2010); Goss and Rickson (2000)

65Chapter 3: Investigating the structures of agricultural trade industry in developing countries
which have been analysed by Porto, Chauvin, and Olarreaga (2011), on which the following discussion is based. The export supply chains tend to be concentrated, most strikingly for cotton in Burkina Faso and Zambia, as well as and coffee in Rwanda (Figure 3.4).
In Burkina Faso, cotton is the main cash crop and accounts for 40 percent of all exports. Most cotton farms are small-scale (3 – 5 ha). Nearly all cotton lint is exported, mainly to Southeast Asia (66 percent). Production is “semi-privatized”, with private sector involvement commencing in 1998 when government sold some of its shares to the domestic producer’s organization. Until recently price-setting has been guided by a guaranteed base price set in the previous year; currently a more flexible scheme is in place, though price fluctuations trigger payments from a stabilization fund.
Cotton is one of Zambia’s most important cash crops, involving 11 percent of all farmers, most of whom are small-scale. Until 1994, processed cotton production was dominated by LINTCO, a state-owned monopoly. Following break-up and liberalization, sector underwent rapid growth, expanding five-fold in just three years, but more
slowly and erratically thereafter. the sector remains highly concentrated, with Dunavant and Cargill as the biggest players (accounting for 76 percent of exports). In 2006, exports contracted owing to rapid currency appreciation; the largest farmer organization, the Cotton Association of Zambia, attempted to negotiate for the first time the prices paid by ginners.
Coffee (Arabica variety) was the main export commodity of Rwanda during the colonial period. Upon independence coffee exports were under the Rwanda Coffee Authority, a state monopoly. In the 1990s liberalization was pursued; since then coffee marketing board has withdrawn from commercial activity, although it continues to issue licenses for coffee traders, provides certification on quality standards, and distributes seedlings and insecticides. Production is in the hands of 400 000 smallholders; there is no large estate farm in the coffee business.
Meanwhile in Uganda most of the coffee grown (90 percent) is Robusta. It used to account for nearly all of the country’s export income; currently it still employs 500 000 smallholder families and accounts for a fifth of export revenues. All exports were previously under a state monopoly, called the Coffee Marketing Board (CMB). In 1991, the monopoly was abolished; the CMB continued to operate as a commercial entity, CMB Ltd. Regulation and licensing is spun off to a separate government entity, the Uganda Coffee Development Authority (UCDA). Over 90 percent of exports are handled by 10 companies; roasting is even more concentrated, with only four companies registered under UCDA.
For cocoa, Africa is the largest supplier, accounting for about 72 percent of global production in 2005. Whereas about 90 percent of the world’s cocoa output (since the 1990s), was produced in smallholdings under 5 ha., the export market is heavily concentrated. In Cameroon for example, over 60 percent of exports in 2006-2007 were handled by just four exporters. The major exporters in Cameroon are subsidiaries or otherwise closely tied to the transnationals handling world cocoa trade (UNCTAD, 2008). The same global traders tend to integrate vertically into
Figure 3.4: Export supply chain concentration ratios,
selected countries
Source: Porto, Chauvin, and Olarreaga (2011).
Note: Note: Concentration ratios are CR4, with the exception of
Cotton, Burkina Faso, which is CR3
Netherlands
Switzerland
Italy
Germany
France
40%
5%
41%
5%11%

66 Analysis of the size and distribution of the impacts of agricultural trade at the firm and industry levels in developing countries
processing; very few international firms specialize solely on trading. Most of Africa’s cocoa is exported to the Europe for processing into chocolate.
The top cocoa exporter worldwide is Côte d’Ivoire, accounting for 40 percent of global supply. Cocoa is a major source of employment, providing jobs for 35 percent of all households. Upon independence, a state monopoly was established to regulate producer and export prices. A series of reforms commenced in the 1980s, culminating in full producer price liberalization and abolition of the state agency in 1999. The export share of the top 14 firms rose from 75 percent to 85 percent over a three-year period (2000 – 2003). Some of the TNCs in exporting managed to integrate backwards to processing. Despite liberalization, the export sector is hobbled by an onerous tax burden, from which government derives one-fifth its total revenue.
At second place is Ghana, previously the world’s top cocoa exporter, and still responsible for one-fifth of global supplies. Since the late 1940s marketing was monopolized by the Cocoa Marketing Board, which also provided input subsidies, extension services, even road construction to cocoa-growing communities. From the late 1980s, the domestic market was liberalized, allowing licensed private traders to operate; input subsidies were scaled down. However the sector remains tightly regulated, and exports remain a state monopoly. Licensed traders can be divided into four groups: government; domestic private sector; farmer-based (under a fair trade cooperative); and international. The latter is composed of just two companies, namely Olam (Singapore) and Armarjaro (Britain). The government reduced its market shares in recent years; market shares of the cooperative and international companies have also fallen, whereas that of the domestic private sector has increased.
Fruit and vegetable exports
In decades, diversification has gradually been underway from traditional bulk exports to horticultural crops. In Kenya, the fresh fruits and vegetables sector accounts for nearly $1 billion worth of exports, or 21 percent of export
revenue. During its rapid growth period (1970s to the mid-2000s), production was smallholder-based, accounting for 60 percent of exports by 2004. Output is then funnelled to about a dozen exporters with their own packing installations and modern logistics, including cold chains. These exporters are all domestically based; foreign firms play a limited role, e.g. Del Monte has specialized in pineapple production and processing. Similarly in Morocco, fruits and vegetables are a billion dollar industry; by 2007, only seven exporters accounted for 70 percent of fresh fruit and vegetable exports of Morocco. The top five firms are all vertically integrated throughout the chain, from production, to logistics, and marketing (Fernandez-Stark, 2011).
Fresh fruits and vegetables are now the fourth main primary sector in Senegal, with specialization in French beans (42 percent of export volume of the sector) and cherry tomato (23 percent of export volume). Only a dozen companies account for 40 percent of French beans and 82 percent of cherry tomato market. These companies are almost all domestically-owned; there is one large TNC operating in the country, which mainly exports tomatoes (Maertens, 2009). Somewhat at the extreme is the case of Madagascar highlands vegetables; almost 10 000 farmers produce high value vegetables for export, but most exports pass through just one company. The company sells 2/3 of its produce to European supermarkets; of this, half of this is sold to seven main supermarket chains.
The import side: parastatals in developing countries
The discussion has so far focused on the export side of agricultural trade industry. The earlier discussion on global distribution partly relates to imports, as the large distribution companies also handle imports for developed countries. Systematic market structure analysis of the import side of trade is however much sparser than that of export side.
Available information on market structure on the import side for developing countries often relates to the regime of marketing boards. This kind of structure reduces to monopoly (similar

67Chapter 3: Investigating the structures of agricultural trade industry in developing countries
to the export marketing boards discussed above for bulk commodities). For importables, the commodity covered typically included the major grain staple; other commodities deemed crucial for food security were also covered.
In addition to import monopoly, marketing boards would often also impose price restrictions, quantity restrictions, and engage in direct marketing activities. Table 3.13 presents some cases from developing countries.
3.5 Agro-industry trade structure: causes and consequences
Having characterized the organization of global agro-industry, discussion now turns to the causes and consequences (particularly for equity) of such industrial organization. Following the schema, the following issues are addressed, namely: horizontal integration (market concentration), vertical integration; and the international dimension of industrial structure.
Perspectives on market structure
Institutionalist economics and mainstream economics perspectives
Much of the concern with horizontal integration relates to the sheer size, and corollary fears of economic “power” leading to skewed distribution of economic benefits and wealth. Concerns
over power in economic relations are a basis of the institutionalist critique of the market economy, which emphasized the acquisition and exercise of power, in its political economy sense. The objection posed by prominent civil society organizations such as Oxfam e.g. SAC (2012) to some extent derives from this critique.
An institutional economics approach may consider vertical integration as an extension of market consolidation by big business, asserting control over its input suppliers and downstream buyers even more complete than through the exercise of market power. Finally, firms may opt to expand their markets in terms of either materials sources, or product outlets, leading to an international dimension in their exercise of power.
Mainstream economics does take seriously the possibility of departure from price taking behaviour associated with perfect competition. The earlier “structure-conduct-performance” (SCP) school of industrial organization popular in the 1950s and 1960s, saw market concentration as a source of “market power” in the sense of an ability to influence the market price. This in turn permits the dominant firms to earn above-normal profits.
However later studies probe deeper into the extent and degree competition despite high levels of observed concentration, as well as explanations of concentration other than ad hoc explanations based on “power”. For instance, Demsetz (1973) notes that the correlation of above-normal profits in concentrated industries
Country Intervention
Ethiopia Grain trade controlled, ban on private trading; producer quotas; distorted prices
Mali Monopoly parastatal for coarse grain and rice (lifted in 1980s)
Tanzania Monopolistic parastatal for maize; coffee board controlled marketing, provided credit, extension
India Food Corporation of India has import monopoly over cereals
Indonesia Bulog stabilizes prices for strategic foods (rice, sugar, cooking oil); import monopoly
Philippines National Food Authority has rice import monopoly, maintains buffer stock, price stabilization
Mexico Parastatal maintained producer prices, subsidized inputs and consumer prices (eliminated 1995)
Colombia Federación controls coffee marketing
Source: Lundberg (2005); Rashid et al (2008)
Table 3.13: Marketing boards for importables in selected developing countries

68 Analysis of the size and distribution of the impacts of agricultural trade at the firm and industry levels in developing countries
need not be due to market power, but rather to production efficiencies that allow firms to realize lower costs. This perspective is not unique to economists; agribusiness researchers also tend to view firm and commodity system governance structure and strategy decisions as responses to technological, demographic, and social changes at the institutional environment (Cook and Chaddad, 2000).
Horizontal integration
For horizontal integration, the main explanation from mainstream economics is economies of scale and barriers to entry.52 One class of entry barriers is policy-induced, perhaps inadvertently. For instance, import licenses may impose minimum standards on logistics facilities under the licensee’s ownership. This may exclude other companies who are capable of importing without meeting the asset requirements (e.g. they are able to outsource their logistics).
However regulation is not the only source of entry barriers. A firm may enjoy differential access to technology owing to secrecy or patent protection. An important entry barrier is sunk cost. Such cost can be endogenous, e.g. when a firm selects the level of capacity or R&D investment, with greater capacity or investment being associated with superior product qualities or sharper product differentiation (Sutton, 2007). Other forms of sunk cost include: outlays for physical capital, i.e. cold chains, farm-to-port roads, etc.; or investments in intangibles, such as brand reputation.
Vertical integration
As with horizontal integration, vertical integration (and its variants) need not be merely an extension or manifestation of market power, but rather may be explained by a deeper
52 The theory of “contestable markets” (Baumol, 1982) has shown though the latter factor is the more fundamental basis of market power. According to this theory, in the absence of sunk costs, entry and exit barriers, and identical technologies, large incumbents (who may enjoy economies of scale) may still behave competitively owing to the threat of potential (rather than actual) entry.
economic rationale. The agency literature is based on private knowledge known only to one party, typically an agent expected to undertake a certain action (Sexton and Lavoie, 2001). If the private information is a property of the agent (e.g. being a high-cost producer) then the problem reduces to adverse selection; if an unobserved choice of the agent, the problem is one of moral hazard. This strand of literature formulates coordination as a principal-agent problem in which the principal, acting as a Stackelberg leader, proposes an incentive scheme for the agent. The scheme maximizes the principal’s objective function, subject to an incentive compatibility constraint (the agent also maximizes his or her pay-off function given the scheme) and a participation constraint. The incentive scheme can incorporate a variety of features, such as nonlinear payment (e.g. penalties for delivery below a quota) and quality standards.
Another strand is the transaction cost theory of the firm. As summarized by Klein (2005), agreements between transacting parties run into a complex set of risks and circumstances. Contingencies cannot be fully anticipated leading to incomplete contracts, where adapting (or failing to adapt) to unexpected contingencies introduces transaction costs. A particularly acute problem is that of asset specificity: when two parties invest in assets which generate higher value when combined than when separated, the possibility of holdup arises in which one party would threaten exit to extract rent from a joint activity.
Transaction cost theory is fairly general as it is essentially a study of alternative governance structures to address the incomplete contracting problem. The three basic types of governance structure are markets, hierarchies, and hybrids. Within this literature, the contrast is often made between high powered incentives offered by market prices, but with risk of holdup; hierarchies are an extreme solution as it simply vests ownership of assets in one party to eliminate holdup (while eliminating or attenuating the high powered market incentive). Alternatively, partial alignment is available from a hybrid form such as

69Chapter 3: Investigating the structures of agricultural trade industry in developing countries
a franchise, long term contract, network, or other arrangement, which seeks to combine both high powered market incentives with protection for specific investments.
Drivers of agribusiness consolidation
Reardon and Barret (2000) identify a set of factors classified under “meta trends”, “global changes”, and “developing country changes”, together with “indicators” of outcomes. In the following this list serves as take-off point for identifying supply drivers, demand drivers, and changes in the policy and institutional environment, as factors underlying increasing concentration both horizontally and vertically.
Supply drivers
Hayami (2002) has argued that in general small family farms are economically efficient compared to plantations, up to the level of primary production. Rather, economies of scale are found downstream at the processing and marketing stages. To account for plantation agriculture, he reviews historical experience showing that, during the colonial period, industrialists sought to expand sources of raw materials from the territories. Plantations had to be established often in unsettled or sparsely unsettled areas with little or no infrastructure or facilities. Establishment of plantations and farm worker family communities then had to be internalized by plantation firms, accounting for large estate sizes to justify the enormous capital outlays. This implies furthermore, that family farms are efficient as long as settlements are already in place, with access to public and quasi-public goods such as road infrastructure, utilities, community facilities, and so forth – provision of which is normally the role of the public rather than private sector.
Technological change has furthermore transformed each stage of production in the value chain, increasing the degree of scale economies (e.g. capital requirements), intensifying consolidation. Technological change affects the chain all the way back up to the input stage, where biotechnology and improvements in
chemical processing has raised the profile of some transnational seed and other input suppliers (Reardon and Barret, 2000). In distribution up to retailing, a major driver is technological change in logistics and information, requiring further capital outlays and larger scale of operations. Improvements in shipping and storage technologies in the 1980s allowed shipping of fresh produce from the southern hemisphere to northern markets. Modern logistics platforms allows large volume procurement, with its geographic reach widened by modern telecommunications. Computerized systems of supermarket chains permit reduction of inventory, paperwork, and accelerated order cycles, with heavy reliance on automated processes (i.e. barcodes) and electronic data interchange. Lastly, procurement tended to be more centralized within each chain: while this increases transport cost, the transaction costs are reduced as the system allows automation, coordination between warehouses and outlets, and other best practices in storage and logistics (Reardon and Timmer, 2007).
Demand drivers
The major demand drivers involve shifts towards preference for modern retail service outlets (Reardon and Timmer, 2007). One is rising per capita real incomes and an expanding middle class, particularly in some fast-growing developing countries. Diet diversification would naturally result owing to Bennet’s law (declining share of staple food in calorie intake as per capita income rises). It is furthermore possible or even likely that consumer preferences are shifted towards these modern products and retail services, owing to their wider availability, as well as aggressive promotional and advertising efforts.
Another is growing urbanization and separation of households from farm production, as well as entry of women into the workforce, thereby raising the opportunity cost of home production and food preparation. Falling prices and greater availability of cars, modern transport, and modern appliances also play an important role in shifting preferences away from having

70 Analysis of the size and distribution of the impacts of agricultural trade at the firm and industry levels in developing countries
to shop daily in traditional retail outlets. These drivers together fueled demand for greater variety of goods, of high quality and safety, as well as of convenience foods. This in turn motivated the modern retailers (i.e. supermarkets) to source processed food products mainly from large scale manufacturers to reduce transaction cost, maintain product flow, and provide quality assurance. Hence in the 1990s and 2000s, a wave of consolidation transformed food processing through M&A of small and medium size companies, transnationalization through FDI, and specialization among the surviving smaller processors in market niches (Wilkinson, 2004).
Policy change
Changes in policies have likewise been a key determinant of market concentration and production relations. Plantation agriculture underwent a dramatic transformation from the colonial period, where little domestic processing took place. In the 20th century, large plantations took the brunt of nationalization policies, land reform, and related restrictions. While large farm producers still persist, they now mostly operate through non-equity forms such as contract farming, opening up participation in the global chain to small farmers. In Southeast Asia and other regions, several plantation-based companies have transitioned to domestic manufacturing during the nascent industrialization phase of their host countries (UNIDO, 2009) .
In a set of case study countries reviewed in Reardon and Huang (2008), in the mid-20th century traditional food systems were transformed by a wave of public sector interventions; this has been reviewed this earlier in the discussion of parastatal controls over export and import trade. The brunt of intervention fell on pricing and marketing, but was also felt in FDI restrictions in manufacturing. These would eventually give way to liberalization, also typical of many developing countries. Stabilization and structural adjustment programs from the 1980s onwards led to downsizing, or outright dismantling or privatization of parastatals, repeal of price
controls, and restrictions on geographic movements of goods. Subsequently processing and later, retailing was opened up to FDI, which proved decisive in restructuring of the agro-food industry, in retail and food manufacturing.
Previously, section IV presented some real world examples of policy evolution from parastatals to more open trade in many developing countries. Nevertheless, government intervention in agricultural trade in selected crops and countries persists, with a tendency to monopolize trade under a parastatal agency. Interventions may be motivated by food security (i.e. insulating the domestic market from global instability in supply or price), or even strategic trade policy i.e. export subsidies or other interventions for exploiting imperfect competition in international trade (Branden and Spencer, 1985).
Institutional change
As a response to, and further reinforcing the above-mentioned drivers, is institutional change and restructuring among market participants. One interesting development is the adoption of grades and standards by private sector players on a more systematic basis; and increasingly, on an industry-wide basis (Reardon et al 2001). And while technological change and scale economies are leading to consolidation on one hand, specialization in logistics and distribution has motivated retail chains towards outsourcing of logistics and distribution, often under joint venture arrangement.
The most crucial transformation in institutional arrangements is the shift away from traditional spot market-type transactions towards more vertically coordinated contractual or at least relational arrangements in modern supply chains (Reardon and Timmer, 2007). For retail chains, procurement has shifted towards specialized, nontraditional wholesalers, especially for fresh produce. In case of imported produce, they tend to rely increasingly on specialized importes with similar function as nontraditional wholesalers. These non-traditional wholesalers exclusively cater mainly

71Chapter 3: Investigating the structures of agricultural trade industry in developing countries
to supermarkets and specialize in a product category. Through these specialized wholesalers the large retailers enforce their exacting product and delivery requirements, all the way down the supply chain.
Effects
The effects of horizontal concentration and vertical integration/coordination in agro-industry trade are analysed in terms of market power, equity, and innovation, for which quantitative assessment is based on indicators. For market power the main indicator is price-cost mark-up, i.e. the excess of marginal cost over price as a proportion of price.53 Alternatively one may examine symmetry in foreign-to-domestic price transmission. Equity may be gauged by share in total value added by stage in the value chain; and benefit in terms of employment or earnings for small farmers, farm workers, and rural poor. For innovation the usual indicators are (changes in) total factor productivity, partial factor productivity, or technical efficiency. Some of these indicators are only loosely related to the effects they are intended to measure, as shall be made clear in the discussion below, though given scarcity of empirical work these seem to be the more common indicators reported.
Market power
The first inference from market concentration is market power. However as discussed previously, market concentration does not necessarily imply departure from competitive behaviour, as concentration may be attributable to deeper economic rationale. The presence and strength of market power should first be established, and only then related to concentration.
In the area of international trade, Morisset (1998) finds that transmission from world to domestic prices exhibits a curious asymmetry: there is a greater tendency for increases to be transmitted compared to declines. He interprets
53 Technically known as the Lerner index. A zero value implies a competitive market.
this to be the result of the exercise of market power by large global trading companies. Similarly, Sexton et al (2007) cite the case of Mozambique cashew where export taxes were lifted, but pass-through to farmgate prices was far lower than earlier projected; this is attributed to monopsony power on the part of traders, who managed to capture most of the gains from lifting the export tax. This case illustrates their argument for incorporating market power in evaluating the impact of agricultural trade liberalization, which they substantiate using simulation modeling.
However direct empirical evidence is at best mixed. Sheldon and Spirling (2003) compiles estimates of the mark-up over (marginal) cost as percentage of price. Industries with low to moderate mark-ups are: US sugar (0.05), US textiles (0.05), Canadian food processing (0.12), German bananas (0.18). Meanwhile industries with high mark-ups include: US tobacco (0.65), UK bread (0.84), US livestock oligopsony (1.10). Market power is evident in some of the more heavily concentrated industries, but high levels of concentration are also consistent with moderately or even highly competitive environments.
Consider some developing country examples (also covered in Sheldon and Sperling’s review): the rice export market has a mark-up of 0.11 (Karp and Perloff, 1989); cocoa in Cote d’Ivoire has a market-up ranging from 0.25 to 0.37 (Wilcox and Abott, 2004); and Philippine coconut oil reaches a mark-up of 0.89 up to the 1980s (Buschena and Perloff, 1991). Again there are variations from moderate to high. The last two country cases highlight the role of government policy; in both cases the subject country was a dominant producer of the export crop; export taxes and other restrictions allowed the industry to exploit the country’s market position.
However it is unclear whether the quest for market power is a reliable guide for policy given the prospect of new entries, and (particularly for coconut), the prevalence of substitute products. Reimer (2006) finds that international food and agricultural markets do exhibit oligopolistic behaviour; however the price-cost mark-ups are

72 Analysis of the size and distribution of the impacts of agricultural trade at the firm and industry levels in developing countries
small or non-existent. This leaves little or no basis to pursue strategic trade policy. Branden and Spencer (2008) themselves downplay the activist stance, advocating multilateral trade disciplines precisely to prevent strategic “beggar-thy-neighbor” policies.
So far the focus has been on horizontal market structure. The relationship between market power and vertical integration has been long been suspected, though only recently been the focus of empirical work. For instance, in contract farming systems, buyers can coordinate to avoid strategic default by suppliers. This may create informal cartel-like arrangements to exchange information about their borrowers and prevent side selling (Swinnen and Vandeplas, 2006). In the US soybean seed market, biotech firms are endowed with market power in terms of intellectual property over parent material. They may either license production to seed companies, or integrate forward to seed production. A quantitative analysis confirms that vertical integration strengthens market power in a differentiated seed industry; vertical integration tends to raise mean seed price by 1.87 to 13.6 percent (Shi and Chavaz, 2011).
Equity and inclusiveness of value chains
In an industry with identical average costs, a high concentration ratio implies concentration as well of profit among a few firms. It is not necessarily the case though that gross returns per unit capital is higher in these industries; furthermore the implications for the size income distribution requires further analysis of ownership structure. Inequality has also been characterized along the value chain. According to Moir (2007), coffee producers account for 10 percent of value added of the finished product, whereas processors, roasters, and retailers may receive between 20 to 30 percent; the split is similar for cocoa, where producers may receive about 15 percent. Banana, despite low levels of processing, likewise generates just about 10 percent of value added for plantations, whereas retailers may receive up to 40 percent. If however such concentration of income or value is an outcome of efficient market relations, then attempts to
force more “equitable” outcomes may introduce distortions that undermine allocative efficiency. This is precisely the argument by Gilbert (2008); he finds that the value shares in the coffee and cocoa value chains, though apparently skewed against producers, is not the outcome of market power, and should not be the object of countervailing regulations such as antitrust measures.
Related to equity is another significant pre-occupation in the literature, which the degree to which small producers are included in agro-industrial value chains. Research under this rubric has witnessed an explosion of studies over the past decade. Expanding on the framework in Section 3, the following may be posited:
1. There is a minimum efficient scale of production that tends to exclude the smallest farmers from supplying to modern agro-industrial value chains.
2. Farmers can group into associations, e.g. cooperatives, to realize economies of scale and supply to modern value chains under closely coordinated arrangements by contract.
3. Farmers who gain access to the value production in the modern chain is better off than the farmer supplying the traditional trading outlet. In this manner the rise of the modern value chain may be contributing to poverty alleviation.
Watanabe et al (2009) offer a macro level view of the impact of agro-processing on poverty in the case of Thailand. They use education (less than half of mandatory schooling attainment) as a proxy for identifying the poor. Using national input-output data combined with the labor force survey, they find that agro-processing industry employs the largest number of the poor among the manufacturing industries, High employment contribution for the poor is due not only due to the large size of the industry, but also the higher intensity of demand for labor of the poor.
Most of the relevant studies in this field however rely on micro case studies. Results from ten case studies in developing countries is summarized in Huang and Reardon (2008). For

73Chapter 3: Investigating the structures of agricultural trade industry in developing countries
horticulture crops studied, average farm sizes are small in nearly all the countries, falling to as low as 0.5 ha in China, with a one ha or so plots being somewhat typical. Accordingly, in six out of ten cases, evidence of small farm exclusion from the modern market channels is absent.
What varies substantially however is access to productive assets. Productive capital is the clearest and strongest variable affecting access to modern channels. Cooling tanks, herds, greenhouses, and irrigation investments - assets affecting quality, consistency, and volume – are found to have the most significant effects. In contrast, variations in human capital – schooling, age, and experience – were less less pronounced among modern chain suppliers. Lastly, evidence on the importance of group membership is mixed. In only half of the cases, groups such as associations or cooperatives facilitated the participation of their members in the modern chain. Of these, only in two cases was cooperative membership found to have a positive effect.
The importance of endowments is exemplified by the fresh fruits and vegetables industry in Kenya (Fernandez-Stark et al, 2011). Land redistribution policies created a smallholder system throughout the country; cultivators, already owning their own family plots, were favoured by a good climate as well as access to modern technologies such as irrigation facilities and greenhouses. Furthermore market linkages opened up opportunities through ethnic and family ties among South Asians in Kenya and UK.
Meanwhile, the case of Madagascar vegetable exports presented earlier in Minten (2009) illustrates the importance of institutional support along the supply chain. In this case, such support may even supplant farmer organizations as well as other disadvantages of the business climate (inadequate infrastructure, resource-poor cultivators, etc.). Individual farmers are intensively supervised by the main exporter; about 300 extension employees supervises about 30 farmers, who in turn coordinates about 5-6 extension assistants residing in the village. Every farmer is visited more than once a week, to ensure correct production management and avoid side-selling. For some aspects, such as
pesticide application, company reps may even intervene directly in farm production.
However, buyer support may not be sufficient; to ensure participation of small farmers. On average, heads of contract farm households are better educated. About 64 percent have finished primary schooling, compared with 50 percent illiteracy rate for the average household. Contract farmers have been supplying regularly for an average of 8 years; 27 percent are members of a farmer organization. Small farmers that participate in these contracts have higher welfare, mainly realized through better income stability and shorter lean periods. Contract farmers tend to adopt better farm technologies (e.g. composting) that spill over into on the productivity of the staple crop rice. The case highlights the following: very poor farmers, in a low income developing country with poor institutions and infrastructure, and facing a monopsonistic marketing company, can benefit very significantly from integration in global value chains.
Other contexts point to the importance of farmer organizations or change agents for community organizing, e.g. through an NGO. Agro-industrialization in China has strengthened farmers’ access to the modern agrofood chain via farmer professional cooperatives (Jia et al 2010). An NGO case is described in Escobal and Covero (2011), for agro-industrial demand for potato as chips for food manufacturing in Peru. The agro-industrial chain offers an alternative marketing channel to the traditional market. The main industry firm has the incentive to source high quality potato from an area (Mantaro Valley) during the potato off-season. However, the highly fragmented and disperse nature of farm land in this area adds huge costs to vertical integration. Instead, it opts to deploy existing farmers in the Valley as suppliers. The firm contracts directly with medium-size growers, but also contracts with small producers through an NGO intermediary. The NGO reduces monitoring costs, and provides access to technical assistance and new marketing opportunities for small farmers.
The producers selling to the agro-industry have on average two more years of schooling than those selling their crop elsewhere. Also,
74 Analysis of the size and distribution of the impacts of agricultural trade at the firm and industry levels in developing countries
their average land holding is also greater (more than double), as well as the average value of their productive assets. Small farmers benefit from guaranteed sales and predictable time horizons of production sales; they experience a 76 percent gain in net income per ha for shifting from traditional spot to modern contractual arrangement. This illustrates, among other cases that some degree of outside financial and technical assistance, is often required for producer groups to form and operate successfully.
However, this can introduce problems with sustainability; Markelova et al (2009) highlight the issue of dependency on external assistance, well as the need for public and private sectors to sustainability through policies and programmes that allow farmers to access stable and competitive markets. In general, across various commodities and countries, contract farming is characterized by high turnover from one year to the next, both on the buyer’s side and on the supplier’s side. This is both a source and an effect of contract risk; unfortunately little is known about medium to long term sustainability of participation (Barret et al, 2011).
Exclusion of small farmers does not however entirely preclude participation of the poor. Based on the case of Senegal, Maertens (2009) demonstrates that modern chains employ a significant number of workers – in fact for every one smallholder farmer selling to the chain, there are fifteen workers in the fields and processing centres. Earnings from employment in the horticulture export industry are invested in part in the farm, ultimately raising farm incomes through alleviation of credit and input constraints. In short, analysis of welfare implications of horticulture exports and agro-industrialization should also pay attention to indirect, off-farm linkages.
Innovation
Another important strand of literature relates horizontal or vertical consolidation with technology or technical efficiency. Under the Schumpeterian thesis, innovation is associated with larger firms, and therefore
higher concentration; however the “quiet life” hypothesis relates high concentration with lack of competition and weaker drive towards innovation. For Indonesian food and beverage manufacturing, higher industrial concentration is associated with greater technical inefficiency, tending to confirm the latter hypothesis (Setiawan et al, 2012b). This contrasts with an earlier finding by Karantinis et al (2008) which detects economies of size in product innovation, for the case of Danish food manufacturing. Moreover, the greater the market power of a firm, the more products it tends to introduce, i.e. it tends to be more innovative. Firms which indicate higher vertical integration tended to innovate more.
The relationship between vertical coordination and innovation has been explored under the more general rubric of “vertical spillovers” Gorg and Greenaway (2004) examines spillover effects from FDI to domestic firms (not necessarily agribusiness-based), through several channels. Vertical linkages are one transmission channel as foreign investors both compel and equip (using technical assistance) their suppliers to upgrade their product quality and processes; another is through horizontal spillovers, e.g. imitation. He finds that FDI impacts are only weakly attributed to horizontal spillovers; the more important source are vertical spillovers. Moreover the ability of domestic firms to benefit from these linkages varies, depending on their initial level of technology, and access to skilled labor. The importance of vertical spillovers has also been higlighted by Alvarez and Lopez (2008), though the source of innovation in his study are not TNCs per se but rather exporters.
3.6 Conclusion
Globalization in agriculture has witnessed the increasing participation of developing countries in world agro-trade. Concerns have been raised owing to high levels of concentration and increasing consolidation of agro-industry trade in recent decades. This is most evident in developed
75Chapter 3: Investigating the structures of agricultural trade industry in developing countries
countries; it should be no surprise to observe similar patterns and trends in developed countries. This paper reviews the relevant literature to characterize and explain the structure of agro-trade in developing countries, and draw implications on the distribution of trade benefits.
Our review finds that, while the related literature is extensive, little systematic evidence is available to offer a comprehensive portrait of agro-trade of developing countries. Evidence for impacts of horizontal and vertical structure is a fortiori even patchier. Nevertheless we are able to draw some tentative conclusions, which serves as basis for some hypotheses for further research to be presented below.
Among the stages of the global value chain, it appears the dominance of large-scale operations is more pronounced in the downstream stages, compared to primary stages. Horizontal concentration arises from economies of scale together with entry barriers. These factors are becoming more important worldwide, including in developing countries, owing to supply drivers, demand drivers, policies, and institutional changes.
There is some evidence for significant market power being exercised among the more concentrated value chains, and that market concentration can also be leveraged via vertical coordination to widen the scope of market power. Nevertheless concentration is not sufficient to establish market power. There is mixed evidence suggestion that concentration and coordination promote better technologies and innovation. At the farm level, the evidence implies that that human capital, farm management practices, and other assets such as equipment and irrigation facilities would tend to differentiate participants from non-participants in the value chain; smallholders are not per se excluded from participation.
Further research may be structured around the following set of hypotheses:
• Global agro-trade is being increasingly driven by discriminating preferences of middle- to high-income consumers both in developed and developing countries, together with the need
to coordinate across far-flung global supply chains;
• The heightened need for coordinated production and transaction flows are a major determinant of agro-trade consolidation both in terms of horizontal concentration and vertical coordination;
• Nevertheless, for selected countries and products (e.g. key staples and export crops), policy distortions continue to perpetuate monopolistic market structures;
• Where coordination economies drive the agro-trade structure, benefits of trade would tend to be skewed towards participants in the chain exhibiting greater capacity to comply with externally-driven performance standards.54
Future research should be directed towards compiling market concentration measures, describing vertical coordination mechanisms, at various stages of the value chain for widely traded products produced and imported by developing countries. A worthwhile research thrust would be to provide an in-depth analysis of the underlying causes of market consolidation and vertical coordination. Entry barriers should be identified and described in terms of technology, branding, policy (i.e. regulations, subsidies, guarantees), sunk costs, and other factors. Likewise, the factors underlying vertical integration or other coordination mechanisms should be elaborated.
Another fertile ground for research is determining the effects of market consolidation, both horizontally and vertically, as well as across borders, in terms of efficiency, equity of distribution of benefits from trade, and participation of smallholders and SMEs in the global value chain. One basis for determining distribution of benefits is market power, a feature that needs to be empirically verified, rather than automatically inferred from high market concentration. Ideally the measurement of market power should be based on price-cost information. In the absence of detailed information about net
54 On the other hand, where policies are the main determinants of market consolidation, it can be surmised that benefits of trade flow in line with political connections.

76 Analysis of the size and distribution of the impacts of agricultural trade at the firm and industry levels in developing countries
margins, other means of inferring market power (such as patterns and trends in price spreads) should be explored. The relationship between market power and benefit incidence should as much as possible be related to entry barriers that give rise to market concentration, as well as exclusion of small producers from the value chain. Such information and analysis could perhaps pave way towards design of policies towards more equitable and yet productive and efficient global value chains.
References
Abbassian, A. 2007. Maize - international commodity profile. Background paper for the Competitive Commercial Agriculture for Sub-Saharan Africa (CCA-SSA) Study. FAO, Rome.
Alavi, H., Htenas, A. Kopicki, R. Shepherd, A. & Clarete, R. 2012. Trusting Trade and the Private Sector for Food Security in Southeast Asia.
Alvarez, R. & Lopez, R. 2008. Is Exporting a Source of Productivity Spillovers? Review of World Economics (Weltwirtschaftliches Archiv), Springer, vol. 144(4), pages 723-749.
Balisacan, A., Fuwa, N., Mapa, D., Piza, S., Sombilla, M. & Santos, C. 2011b. Inclusive Agribusiness Growth in the Philippines: The Role of Direct and Indirect Channels with a Focus on the Labor Market. Report submitted to World Bank . Asia Pacific Policy Center, Quezon City.
Barrett, C., Bachke, M., Bellemare, M., Michelson, H., Narayanan, S. & Walker, T. 2011. Smallholder Participation in Contract Farming: Comparative Evidence from Five Countries. World Development, doi:10.1016/j.worlddev.2011.09.006
Baumol, W. 1982. Contestable Markets: An Uprising in the Theory of Industry Structure American Economic Review 72(1): 1-15.
Burch, D. 2010. Growth and Concentration in the Poultry-Animal Feed Complex: The Charoen Pokphand Group and Agri-Food TNCs in the Asia-Pacific Region. In: Agribusiness and Public Policies: Navigating the Changing Agri-Food Systems in the Asia Region. Agribusiness Action Initiatives – Asia and Oxfam, Hong Kong.
Buschena, D.E. & Perloff, M.J. (1991). The Creation of Dominant Firm Market Power in the Coconut Oil Export Market. American Journal of Agricultural Economics 73: 1000-08.
Brander, J. & Spencer, B. 1985. Export subsidies and international market share rivalry. Journal of International Economics 18, 83-100.
Brander, J. & Spencer, B. Strategic trade policy. In: The New Palgrave Dictionary of Economics, S. Durlauf and L. Blume, eds. Palgrave Macmillan.
Calpe, C. 2007. Rice: International commodity profile. Background paper for the CCA-SSA. FAO, Rome.
Cook, M. & Chaddad, F., 2000. Agroindustrialization of the global agrifood economy: bridging development economics and agribusiness research. Agricultural Economics 23 (3) 207-218.
Costales, A. 2004. A review of the Thailand poultry sector. Livestock Sector Report Thailand. FAO, Rome.
Demsetz, H. 1973. Industry structure, market rivalry and public policy. Journal of Law and Economics 16(1):1-9.
Diaz-Bonilla, E. & Reca, L. 2000. Trade and agroindustrialization in developing countries: trends and policy impacts. Agricultural Economics 23 (3) 219-229.

77Chapter 3: Investigating the structures of agricultural trade industry in developing countries
Dy, R. 2009. Food for Thought: How Agribusiness is Feeding the World. (With Special Focus on the ASEAN). University of Asia and the Pacific and Comprehensive Initiative for the Transformation of Organizations Foundation, Manila.
Dyck, J., & Nelson, K. 2003. Structure of the global markets for meat. Economic Research Service Agriculture Infomration Bulletin No. 785. USDA.
Escobal, J. & Cavero, D. 2011. Transaction Costs, Institutional Arrangements and Inequality Outcomes: Potato Marketing by Small Producers in Rural Peru. World Development 40 (2): 329–341.
FAO. 2003. Financing normal levels of commercial imports of basic foodstuffs. http://www.fao.org/docrep/006/y5109e/y5109e00.htm#Contents
FAO. 2004. The State of Agricultural and Commodity Markets (SOACM) 2004. FAO, Rome.
Fernandez-Stark, K., Bamber, P., Gereffi, G. 2011. The Fruit and Vegetables Global Value Chain: Economic Upgrading and Workforce Development. Center on Globalization, Governance and Competitiveness, Duke University.
Fuglie, K., P. Heisey, J. King, C. Pray, K. Day-Rubenstein, D. Schimmelpfennig, L.W. Sun, and R. Karmarkar-Desmukh. 2011. Research Investments and Market Structure in the Food Processing, Agricultural Input, and Biofuel Industries Worldwide. ERR-130. Economic Research Service, United States Department of Agriculture.
Gilbert, C. 2008. Value chain analysis and market power in commodity processing with application to the cocoa and coffee sectors. In: FAO Commodity Market Review 2007. FAO, Rome, 5-34.
Gorg, H., & Greenaway, D. 2004. Much ado about nothing? Do domestic firms really benefit from foreign direct investment? World Bank Research Observer 19(2): 171 – 197.
Goss, J., Burch, D. & Rickson, R.E. 2000 Agri-food restructuring and Third World transnationals: the case of CP, Thailand and the global shrimp industry. World Development, 28(3) 513-530.
Hayami, Y. 2003. Family farms and plantations in tropical development. Asian Development Review 19(2):67-89.
Hendrickson, M. & Heffernan, W. 2007. Concentration of Agricultural Markets. Department of Rural Sociology, University of Missouri.
Huang, J. & Reardon, T. 2008. Small-scale producers in modern agrifood markets: Synthesis report microstudy. International Institute for Environment and Development (IIED).
Humphrey, J. & Memedovic, 0. 2006. Global value chains in the agrifood sector. UNIDO Strategic Research and Economics Branch Working Paper, UNIDO: Vienna.
Jank, M. S., Franco, M., Leme, P. & Nassar, A.M. 2001. Concentration and Internationalization of Brazilian Agribusiness Exporters. International Food and Agribusiness Management Review, 2(3/4): 359–374.
Jia, X., Huang,J., Xu, Z. 2010. Marketing of farmer professional cooperatives in the wave of transformed agrofood market in China. China Economic Review, doi:10.1016/j.chieco.2010.07.001.
Jongwanich, J. 2009. The impact of food safety standards on processed food exports from developing countries. Food Policy 34 (2009) 447–457.

78 Analysis of the size and distribution of the impacts of agricultural trade at the firm and industry levels in developing countries
Karantininis, K., Sauer, J., Furtan, W. 2010. Innovation and integration in the agri-food industry. Food Policy 35 (2) 112–120.
Karp, L.S. & Perloff, J.M. 1989. Dynamic Oligopoly in the Rice Export Market. Review of Economics and Statistics 71: 462-70.
Klein, P. 2005. The make-or-buy decision: lessons from empirical studies. C. Menard and M. Shirley (eds.), Handbook of New Institutional Economics. Springer, 435–464.
Lopez, A., Ramos, D. & Simkievich, C. 2008. Soybean value chain analysis: final report. The Impact of China’s Global Economic Expansion on Latin America Working Paper No. 2. World Economy and Finance Research Programme.
Lundberg, M. 2005. Agricultural Market Reforms. In: Analyzing the Distributional Impact of Reforms: A practicioner’s guide to trade, monetary and exchange rate policy, utility provision, agricultural markets, land policy, and education. A. Coudouele and S. Paternostro, eds. World Bank: Washington D.C., 145 - 212
Maertens, M. 2009. Horticulture exports, agro-industrialization, and farm–nonfarm linkages with the smallholder farm sector: evidence from Senegal. Agricultural Economics 40 (2) 219–229.
Markelova, H., Meinzen-Dick, R., Hellin, J. & Dohrn, S. 2009. Collective action for smallholder market access. Food Policy 34 (1) 1–7.
Moir, B. 2007. Introductory note. In: Governance, coordination and distribution along commodity value chains. Trade and Markets Division. FAO, Rome.
Morisset, J. 1998. Unfair trade? the increasing gap between world and domestic prices in commodity markets during the past 25 years. World Bank Economic Review 12(3): 503 – 526.
Minten, B., Randrianarison, L., Swinnen, J. 2009. Global Retail Chains and Poor Farmers: Evidence from Madagascar. World Development 37 (11), pp. 1728–1741.
Muslim, E., Evertina, V. & Nurcahyo, R. 2008. Structure, conduct, and performance analysis in palm cooking oil industry in Indonesia using structure conduct performance paradigm (SCP). Proceeding, International Seminar on Industrial Engineering and Management Santika Hotel, Jakarta, 25 October.
Neven, D., Odera, M., Reardon, T. & Wang, H. 2009. Kenyan Supermarkets, Emerging Middle-Class Horticultural Farmers, and Employment Impacts on the Rural Poor. World Development 37 (11), pp. 1802–1811.
Neves, M. 2008. The Brazilian orange juice chain. In: FAO Commodity Market Review 2007. FAO, Rome, 85 – 100.
Poapongsakorn, N., Viroj, N, Delgado, C., Narrod, C., Siriprapanakul, P., Srianant, N., Goolchai, P., Ruangchan, S., Methrsuraruk, S., Jittreekhun, T., Chalermpao, N., Tiongco, M. & Suwankiri, B. 2003. Annex IV: Livestock Industrialization Project: Phase II - Policy, Technical, and Environmental Determinants and Implications of the Scaling-Up of Swine, Broiler, Layer and Milk Production in Thailand. Paper submitted to Phase II of an IFPRI-FAO project entitled Livestock Industrialization, Trade and Social-Health-Environment Impacts in Developing Countries, funded by the Department for International Development (DFID), U.K., through the Livestock, Environment and Development (LEAD) initiative at FAO.
Porto, G., Chauvin, N. & Olarreaga, M. 2011. Supply Chains in Export Agriculture, Competition, and Poverty in Sub-Saharan Africa. World Bank: Washington, D.C.

79Chapter 3: Investigating the structures of agricultural trade industry in developing countries
Poulton, C. 2007. Bulk Export Commodities: Trends and Challenges. Background Paper for the World Development Report 2008.
Rashid, S., Gulati, A., & Cummings Jr, R. 2008. Grain marketing parastatals in Asia: Why do they have to change now? In S. Rashid, A. Gulati, and R. Cummings, eds. From Parastatals to Private Trade: Lessons from Asian Agriculture, 51–76. Baltimore: John Hopkins University Press.
Reardon, T. & Barrett, C. 2000. Agroindustrialization, globalization, and international development: An overview of issues, patterns, and determinants. Agricultural Economics 23 (3) 195-205.
Reardon, T., Barrett, C., Berdegue, J., & Swinnen, J., 2009. Agrifood Industry Transformation and Small Farmers in Developing Countries. World Development, doi:10.1016/j.worlddev.2008.08.023
Reardon, T., Codron, J.M., Busch, L., Bingen, J. & Harris, C. 2001. Global Change in Agrifood Grades and Standards: Agribusiness Strategic Responses in Developing Countries. International Food and Agribusiness Management Review, 2(3/4): 421–435.
Reardon, T. & Huang, J. 2008. Meso‐Level Restructuring of the Food Industry in Developing Countries: A First Synthesis Report of Component 1: Meso Study. International Institute for Environment and Development (IIED).
Reardon, T. & Timmer, P., 2005. Transformation of Markets for Agricultural Output in Developing Countries Since 1950: How Has Thinking Changed?. In Evenson, R.E., Pingali, P., Schultz, T.P., (eds.) 2005. Handbook of Agricultural Economics: Agricultural Development: Farmers, Farm Production and Farm Markets, vol. 3.
Reardon, T., Timmer, P. & Berdegue, J. 2004. The Rapid Rise of Supermarkets in Developing Countries: Induced Organizational, Institutional, and Technological Change in Agrifood Systems. e-Journal of Agricultural and Development Economics 1 (2), pp. 168-183.
SAC. 2012. Power in Agriculture: A Vital Report on the Future of Farming. Oxford Farming Conference.
Scoppola, M. 2007. Economies of scale and market structure in international grain trade. Agricultural Economics 37 (2-3) 277–291.
Setiawan, M., Emvalomatis, G. & Lansink, A.O., 2012. The relationship between technical efficiency and industrial concentration: Evidence from the Indonesian food and beverages industry. Journal of Asian Economics, doi:10.1016/j.asieco.2012.01.002.
Setiawan, M., Emvalomatis, G. & OudeLansink, A. 2012. Industrial concentration and price-cost margin of the Indonesian food and beverages sector. Applied Economics 44() 3805–3814.
Shi, G. & Chavas, J. 2011. The Effects of Vertical Organization on the Pricing of Differentiated Products. Journal of Agricultural and Resource Economics 36(3):448–464
Sutton, J. 2007. Market Structure: Theory and Evidence. In: Handbook of Industrial Organization vol. 3. Elsevier, North Holland
Sexton, R. & Lavoie, N. 2001. Food Processing and Distribution: An Industrial Organization Approach. In Gardner, B., Rausser, G. (eds.), Handbook of Agricultural Economics, Volume 1B Marketing, Distribution and Consumers. Elsevier Science BV, Amsterdam, Netherlands. pp. 863-932.
Sexton, R., Sheldon, I., McCorriston, S. & Wang, H. 2007. Agricultural trade liberalization and economic development: the role of

80 Analysis of the size and distribution of the impacts of agricultural trade at the firm and industry levels in developing countries
downstream market power. Agricultural Economics 36 (2) 253–270.
Sheldon, I.M. & Sperling, R. 2003. “Estimating the Extent of Imperfect Competition in the Food Industry: What Have We Learned?” Journal of Agricultural Economics 54 (2003): 89-110.
Shigetomi, S. (2009). Thailand: Toward a developed rice-exporting country. The World Food Crisis and the Strategies of Asian Rice Exporters. Shigetomi, S., K. Kubo, and K. Tsukeda, eds. IDE Spot Survey 32. Tokyo, Institute of Developing Economies.
Swinnen, J. & Vandeplas, A. 2007. Contracting, competition, and rent distribution in commodity value chains. In: Governance, coordination and distribution along commodity value chains. FAO Commodities and Trade Proceedings.
Thoenes, P. 2007. Soybean international commodity profile. Background paper for CCA-SSA. FAO, Rome.
UNCTAD. 2008. Cocoa Study: Industry Structures and Competition. UNCTAD, Geneva.
UNCTAD. 2009. World Investment Report 2009: Transnational Corporations, Agricultural Production and Development. UNCTAD, Geneva.
United Nations Special Rapporteur. 2009. Agribusiness and the right to food. Report of the Special Rapporteur on the right to food.
USDA. 2009. Global Food Markets Industry Structure. http://www.ers.usda.gov/Briefing /GlobalFoodMarkets/Industry.htm
van der Wall, S. 2008. Sustainability Issues in the Tea Sector: A Comparative Analysis of Six Leading Producing Countries. Centre for Research on Multinational Corporations, Amsterdam.
von Braun, J. & Diaz-Bonilla, E. 2008. Globalization of agriculture and food: Causes, consequences, and policy implications . In von Braun, J., Diaz-Bonilla, E., (eds.). Globalization of food and agriculture and the poor, Chapter 1. New Delhi, India: Oxford University Press. pp. 1-46.
Watanabe, M., Jinji, N. & Kurihara, M. 2009. Is the development of the agro-processing industry pro-poor? The case of Thailand. Journal of Asian Economics 20 (4) 443–455.
Wilcox, M. & Abott, P. 2004. Market Power and Structural Adjustment: The Case of West African Cocoa Market Liberalization. Paper presented at the American Agricultural Economics Association Annual Meeting, Denver, Colorado, 1 – 4 August.
Wilkinson, J. 2004. The Food Processing Industry, Globalization and Developing Countries. Electronic Journal of Agricultural and Development Economics 1 (2): 184-201.
Wilkinson, J. & Rocha, R. 2009. Agro-industry trends, patterns, and development impacts. In: Agro-Industries for Deveopment. C. da Silva, D. Baker, A. Shepherd, C. Jenane, and S. Miranda-da-Cruz, eds. FAO, UNIDO, and CABI International: Wallingford, 46 – 91.

PART
TWO
©FAO/G
iuseppe Bizzarri

83Chapter 4: Analysis of trade impacts on the fresh pineapple sector in Ghana
4.1 Introduction
Background
Like many other food industries in West Africa, Ghana’s pineapple industry rose to the hope of expanding exports of processed food to acquire a footing in the international markets. Value of fruits and vegetable contribution to Ghana’s export increased significantly from the early 1990s and reached its peak at more than USD 30 million in the mid 2000’s. It is known that the pineapple industry, from plantation and collection, to processing and export, employed small-scale farmers and poor workers. The success of the pineapple industry had been touted in the past as an example of how a strong and direct link between the producers and processors in the fruits and vegetable market is a tool to reduce poverty and create employment.
However, Ghana’s pineapple industry is now in the midst of an unprecedented crisis. One of the problems facing the industry is that the pineapple market and processors require flexibility to the frequent changes in variety of the pineapple fruits demanded, while local pineapple planters are often unable to switch rapidly from one variety to another. This lack of flexibility is due to low technological adoption and poor agricultural extension. Recently, the processors/exporters wanted to process the variety MD2 (a South American variety) but farmers have still stuck with the variety Smooth Cayenne. The mismatch
between which variety of pineapple processors actually want and what producers can rapidly offer has shrunk the industry’s profit. Many processors and growers have already gone out of business, and the few that survive have attempted to re-organize but faced continuing and steep competition with other suppliers from the rest of West Africa and especially from Latin America.
These challenges have led to the government’s decision to encourage remaining processors to focus on the domestic market and foreign low-end market niches and to the introduction of measures enabling farmers to increase productivity and be flexible to market requirements. How these challenges and official policy responses have affected the organization and the decision of the industry’s farms and firms on resource allocation and sale strategies by farms and firms in the industry remain unclear. The lack of such information on the size and distribution of trade impacts limits policy makers’ ability to formulate trade policies consistent with their development objectives to avoid the collapse of the pineapple industry.
Objective
The objective of this report is to determine, analyse and establish the level and distribution of trade impacts (benefits or losses) for firms and farmers engaged in the production and export of fresh pineapple from Ghana. To achieve this objective, interviews of firms and farmers were
CHAPTER 4: ANALYSIS OF TRADE IMPACTS ON THE FRESH PINEAPPLE SECTOR IN GHANA *
* This chapter was written by Julius Gatune Mitchris, Chapman-Kodam Kwesi Korboe, Francis Mulangu (African Centre for Economic Transformation) and Manitra A. Rakotoarisoa (Economist, Trade and Markets Division, FAO). This chapter expresses the personal opinions of the authors.
84 Analysis of the size and distribution of the impacts of agricultural trade at the firm and industry levels in developing countries
conducted, as well as desk research and data collected on the following:
1. The structure/organization of the fresh pineapple export sector in Ghana:
a. Identify the size of the pineapple export industry (in comparison with other agricultural exports); sources of the export ability of the industry (regulations, comparative advantage, or abundance in factor endowment).
b. Identify exporting firms; their input and output markets; degree of integration; input sources; market destinations; market shares.
c. Determine the level of industry concentration; level of competition among firms; level of market power.
d. Investigate the presence of market power and especially the sources of market power (regulations, proximity, procurement of inputs) for firms.
2. Determining how the trading environment (policies, trade agreements) affects the pineapple export industry behaviour, and especially the exporting firms’ behaviour:
a. Perform inventories of current and past policies, including agricultural trade policy (subsidy, taxation, regulations) on domestic market.
b. Identify policy bottlenecks and barriers in foreign markets and document how these constraints affect firms’ behaviour.
c. Investigate the link between exporting firms and their clients (importers) including the bargaining power between exporters and importers; investigate how changing pineapple export demand affects the behaviour of Ghana’s pineapple producers and exporters.
d. Document past experiences, if any, when the exporters’ strategies worked effectively, enhanced trade gains for exporting firms and influenced the distribution of trade benefits.
3. Collect data on selected and key indicators of exporting firms to establish whether they are determinants to achieve positive trade benefits:
a. Export performance of selected firms.b. Firm’s legal status (Registered or not). c. Number of workers.d. Wages of workers (average salaries);e. Association membership (SPEG or any other
association).f. Free Zone Board membership.g. Access to finance (from EDIF or any other).h. Size of pineapple cultivated land.i. Type of pineapple variety cultivated (MD2 or
any other).j. Irrigation facility or rain fed farming.k. Type of exporter (fair-trade, organic, etc.).
Approach and methodology
Literature review: This involved extensive desktop research and review of various reports on the pineapple sector in Ghana funded by Donors, Non-Governmental Organizations, the private sector, and the Government of Ghana.
Qualitative and quantitative analysis: In order to establish the impact of trade on selected pineapple firms in Ghana, the aims were to look at the impact of conversion to MD2, controlling for characteristic variables (such as firm size, and age of the firm) on firms’ export volumes and hence their market shares. Three models are tested. (i) The difference-in-difference model shows the impact of conversion to MD2 on firms’ export volumes; (ii) the Chow’s test for structural change is used to establish whether there has been a structural change in pineapple exports after the 2005 shock; and (iii) a final model tests the determinants of export, export per worker, export share, and capital intensity among pineapple firms in Ghana.
Consultations/interviews/field visits: As a follow up to the desk review, consultations, interviews and field visits were held with key players involved in the sector, which are detailed in Table 4.1.

85Chapter 4: Analysis of trade impacts on the fresh pineapple sector in Ghana
Chapter structure
The report is made up of seven sections including an introduction. Section 2 describes the evolution and development of the pineapple export industry in Ghana. Section 3 describes the structure of the pineapple industry in Ghana. Section 4 presents findings from data analysed in determining the impact of trade on the pineapple sector. Section 5 discusses policy and trade affecting the pineapple industry in Ghana. Section 6 covers a detailed SWOT analysis of the pineapple industry. Section 7 covers the conclusions of this study, policy recommendations, and areas of future research.
4.2 Evolution of the pineapple export industry in Ghana
Ghanaian firms began exporting the Smooth Cayenne variety of fresh pineapple to Europe - which was and still is the major destination - by
air in very small quantities in the mid1980s by sourcing from smallholder farmers in the Akuapim South District in Ghana. These smallholder farmers initially supplied the Nsawam Canneries Ltd, a Government owned fruit processing firm engaged in canning pineapple juice for the local and export markets. The early 1980s saw the development of commercial indigenous farms by Ghanaian entrepreneurs from diverse professional and business backgrounds.
The production of these commercial farms was principally to complement purchases from the smallholder farmers and focused on the Smooth Cayenne variety of pineapple, though the Sugar Loaf variety of pineapple existed but was only grown in small quantities in the Central Region of the country for local consumption. The Queen variety of pineapple was also introduced to Ghana in 1999 by Jei River Farms but, like the Sugar Loaf, was also very limited in production to a few commercial farmers having very limited market opportunities in Europe. Some of these farms
Function Actors Issues for discussions
Exporters/Farms* • Greenspan Farms Ltd• Chartered Impex Ltd• Koranco Farms Ltd• Bomarts Farms Ltd• Bomarts Farms Ltd• Golden Exotics Ltd• Jei River Farms
• No of workers• Land size• Infrastructure• Production performance• Export performance • Turnover• Profitability• Operational Cost• Margin Analysis• Marketing arrangements• Supply arrangements of agric inputs• Detail of outgrower schemes • Policy & regulatory issues
Trade Association • Sea-Freight Pineapple Exporters of Ghana (SPEG)
• Overview of pineapple sector- Policy- Regulations- Market conditions- Issues affecting sector
Government • Ministry of Trade and Industry• Ghana Export Promotion Authority• Ministry of Food & Agriculture
• Policy and Regulatory Issues• Support to Industry
Agric Input Companies • Chemico Ltd• Agrimat Ltd• Wienco Ltd
• Supply arrangements with farms
Table 4.1: List of Interviewees
* There are currently fourteen exporting farms in Ghana
Source: Authors

86 Analysis of the size and distribution of the impacts of agricultural trade at the firm and industry levels in developing countries
were Combined Farmers Ltd located near Obodan in the Akuapim South District (which in the 1980s and early 1990s was the largest producer and exporter of fresh pineapple in Ghana) and Jei River Farms Ltd at Ofaakor in the Awutu Effutu Senya District.
Development of pineapple export in Ghana
The export industry developed because commercial cargo airplanes were in the practice of delivering part accessories to the oil fields in Nigeria, and then flying northbound to Europe empty. This offered the opportunity for fresh pineapple exporters – led by Combined Farmers Ltd, Koranco Farms Ltd and Farmex Ltd – to establish freight companies and charter cargo planes.
Market share: Ghana has, over the period, been the largest exporter of fresh pineapple by air due to this distinct advantage. The industry experienced growth from 1994 to 2004 especially from 1999 to 2004 at a cumulative annual growth rate of 172 percent. This resulted in increased market share of fresh Ghanaian pineapples in Europe from 7-8 percent in 1999 to its highest level in 2004 of 10 percent.
Smallholder contribution: Based on analysis of export data received and contribution of selected exporters and Farmapine GH Ltd from Sea Freight Pineapple Exporters of Ghana (SPEG), it is estimated that smallholder farmers who had formed some degree of relationships with the majority of the exporting firms contributed about 50 percent of export volumes from Ghana. Sea-freighted pineapples after 1999 contributed more to export volumes from Ghana than air-freighted fresh pineapples, with the Smooth Cayenne pineapple variety being the preferred choice of air-freighted pineapples.
Export activities: between 2001 and 2004, average number of exporters was about 50 with about 40 percent of them not engaged in direct pineapple production but relying on smallholder farmers for supply. Few exporters had established pack houses to clean, pack and palletize fruits for exports against a backdrop of absence of traceability and standards for exports. Most of the fruits purchased from smallholders were packed in fields, with resultant bruising of fruits and damage to cartons. Most of the fresh pineapples shipped by sea were destined for wholesale markets and on a consignment basis. Exporters were not offered a minimum guaranteed price and only received statements of account after sales and receipt of receivables by importers. Fruits shipped by air did attract a high premium price mainly because of the shorter transit time which offered exporters the opportunity to harvest fruits at specified brix55 and colour demanded by the markets and reached destinations fresh.
Nucleus – outgrowers relationships: Existing relationships between exporters and outgrowers were loosely defined with the exception of cooperatives of Farmpine Ltd, a marketing company with cooperatives as shareholders, which is detailed below. Some exporters had a core of outgrowers who were provided with production support with prices
55 The Brix value measures the percent of sugar solids in a product, providing an approximate measure of sugar content. It gives an indirect estimate of the degree of fruit ripeness.
Figure 4.1: Export volumes of sea and air freighted
pineapples from Ghana (1994 – 2011)
Source: SPEG
0
10 000
20 000
30 000
40 000
50 000
60 000
70 000
80 000Total volume exported
Air freight Volume Sea freight volume
100806040200989694
(To
nn
es)
87Chapter 4: Analysis of trade impacts on the fresh pineapple sector in Ghana
agreed on before production. More often than not, the exporters were responsible for de-greening fruits, harvesting and packing for exports. Initial payments were effected after harvest and validation of weight, with the balance paid after a minimum of six weeks for sea-freighted pineapples. Growers of fruits purchased for air-freight (unlike the ones for sea-freight) were typically paid in full with minimal delay. Payments were effected after harvesting and validation of weight. Because of lack of infrastructure such as pack houses in production areas and poor post-harvest procedures, the quality of sea-freighted pineapples suffered with values obtained not commensurate with equivalent volumes. A number of factors were critical to Ghana’s export performance during that period.
Factors impacting on Ghana’s export performance
The introduction of sea-freight for exports of pineapple in 1994 under the new body Sea-Freight Pineapple Exporters of Ghana (SPEG)
This initiative was developed under the USAID Trade and Investment Program executed by AMEX International, a US based consulting group in close collaboration with some selected members of the Horticulturists’ Association of Ghana (HAG), which was at the time the association representing the pineapple sector in Ghana. The introduction of sea-freight culminated in the setting up of the Sea-Freight Pineapple Exporters of Ghana (SPEG) in 1994.
This association was mandated to coordinate logistics of members, vessels and operators and to liaise with government agencies such as the Ghana Ports and Harbours Authority (GPHA), Ghana Export Promotion Council (GEPC), etc. At the peak of its operations, SPEG had 52 members but currently has 30 members with 14 regular shippers.
The initial members of SPEG were Combined Farmers Ltd, Integral Farms Ltd, John Lawrence Farms, Greentex Farms Ltd and Jei River Farms Ltd who were at the time also
members of the Horticulturists’ Association of Ghana (HAG). This initiative was introduced due to the cost of airfreight which cost 3.5 times more than sea-freight with the former, limited niche air market and huge potential and opportunities in the European market for sea-freighted fresh pineapples. Currently, airfreight costs 4.5 times more than sea-freight in Ghana.
Donor/government funded programmes: A number of programmes were initiated with funding from donors and the Government of Ghana to support the pineapple sector in the 1980s and 1990s.
• Pineapple Production Expansion program was implemented from 1987 to 1990 by the Ministry of Trade and Industry (MoTI) and the GEPC. The main objectives of the program were to expand production of pineapples for export, provide soft loans and assistance in accessing Smooth Cayenne variety of planting material from Ivory Coast, and technical assistance in production and exports of pineapple from Ghana.
• Agriculture Diversification Project - Horticulture Development Component implemented from 1991-1999 initially by GEPC, but with responsibility subsequently transferred to the Ministry of Food and Agriculture (MoFA). The project design began in 1988 and was implemented with funding of USD 16.5 million from the World Bank, IDA credit. The fund was also used to create the Horticulture Unit of MoFA to serve as a project implementation unit.
• Trade and Investment Programme (TIP): AMEX International implemented TIP from
• 1993 to 1998 with funding from the USAID. The project was aimed at providing support to individual enterprises engaged in:
1. Non-traditional exports such as horticulture ,textiles, value added wood.
2. Support to export industry associations.3. Financing support to the industry
stakeholders.

88 Analysis of the size and distribution of the impacts of agricultural trade at the firm and industry levels in developing countries
• Trade and Investment Reform Programme - Increased Private Enterprise Performance component (TIRP): TIRP, which was a continuation of the objectives of TIP but with a greater focus on integrating the private sector, was implemented by AMEX International, Technoserve and CARE International from 1998 to 2004 with funding of about USD 60 million from USAID. The focus on the private sector was intended to increase the capacity of micro-enterprises and to link microenterprises/small farmers into the production-marketing chain for exports.
Demand for pineapple in Europe. Consumer demand for pineapples in Europe increased from339 000 MT in 1999 to 526 000 MT56 at a cumulative annual growth rate of 55 percent by 2004 which provided the opportunity for increased production and exports from Ghana. This was a result of a decline in production and export in Cote d’Ivoire because of political instability in 1999 and a civil war in 2002.
Blue Skies Ltd. Blue Skies has been producing fresh fruit products (fresh fruit cut) since1998 from its factory located near Nsawam in Ghana and in 2004 commenced the production of fresh juice for foreign and local markets. The company started by exporting premium quality freshly cut fruits to supermarkets in Europe, which stimulated demand for fresh pineapples locally. Their initial requirement was estimated at about 3000 MT of Smooth Cayenne variety of pineapple annually. They sourced mainly from smallholder farmers at prices competitive to those being offered by exporters. What this did was to offer greater market access to smallholder farmers and stimulate production of the Smooth Cayenne variety of pineapple. They also sourced fruits from a limited number of commercial farms whose fruits were not exported in large quantities due to aesthetic qualities such as size and colour than brix, internal color and texture.
56 Eurostat
Farmapine GH Ltd. The creation of a cooperative-based export company made up of five pineapple cooperatives comprising 450 farmers in the Akuapim South district and two existing small- medium producer-exporter companies (Gabrho Ltd and Kokobin Farms Ltd) took place in 1999. The World Bank through the Ministry of Finance provided a loan of USD 1.5 million to the cooperatives as start-up capital, which translated into 80 percent shares in the company. The assets, markets and expertise of the two producer exporters were valued, and they were given the remaining shares. Management was then recruited to manage the company. Farmapine between the periods of 1999 to 2004 became one of the largest exporters accounting for about 23.5 percent of fresh pineapple exports from Ghana at its peak of operations and offered cooperatives direct access to markets in Europe. The impact of Farmapine’s operations was to create more market access for cooperatives and exporters who did not have farms commenced their own production and reduced their reliance on some of the cooperatives that served the fulcrum of Farmapine’s operations.
Fairtrade Certification: About nine of the exporters are Fairtrade certified (Table 4.2), which have sustained exporters through obtaining premium prices through the varietal shift on the European market with Golden Exotics Ltd in process of acquiring certification. The exporters who had acquired Fairtrade certification explained that access to that market was a way to compete with exports from Costa Rica into the European market. This is because the Fairtrade57 market offers a relatively higher price, at about 20 percent, than the conventional market though it constituted about 15 percent of export volumes, resulting in overall improved average price per carton58 of fruit. Additionally, it also made available to workers of these companies a premium of four Euro Cents per kilogram to promote and execute social programs for the benefit of workers and the resident communities.
57 www.fairtrade.net
58 www.average weight of carton is 12 kilos

89Chapter 4: Analysis of trade impacts on the fresh pineapple sector in Ghana
Decline in fresh pineapple exports
The fresh pineapple export industry since2004 has, however, experienced declined volume in exports due to a number of reasons, principally due to a shift in market demand in Europe to the MD2 variety of pineapple produced primarily in Costa Rica by Del Monte. Because of this shift in market demand for MD2 (instead of the Smooth Cayenne variety of pineapple), Ghana has seen a decline in the number of exporters from an average of 60 before 2004 to about 14 at present. Though the decline of exports of fresh pineapples started in 2005, it should be pointed out that export of Smooth Cayenne by sea ceased
in 2006 and this explains the sharp decline from 2006 to 2007. The reason for the shift in demand can be attributed to the following factors elicited through interviews with buyers and importers of pineapple in Europe.
• During sea freight, the MD2 variety travels best and is not affected by browning59 due to low acidity, compared to the Smooth Cayenne variety.
• The shape of the fruit sits well on supermarket shelves and occupies less space as compared to the Smooth Cayenne variety which cannot sit.
• The MD 2 variety has a longer shelf life due to its low acidity coupled with the logistic arrangements of post-harvest handling (usage of packing lines and cooling facilities available in Costa Rica) compared to post-harvest handling of the Smooth Cayenne variety of pineapple in Ghana and Cote d’Ivoire.
Interventions in response to varietal change
The decline in export volumes was further exacerbated by the delay in response of the industry to market shifts due to the following reasons: The firms exporting the Smooth Cayenne variety of pineapple, were saddled with leftover planting stock and work in progress in the fields did not have enough capital available to invest in true type seed material. The initial cost of suckers and tissue-cultured material was priced at 70 US cents in 2004 to 2006 compared to Smooth Cayenne suckers priced at a mere three US cents. Also, technical knowhow amongst Ghanaian producers both large and small on the agronomy of the MD 2 variety was non-existent. The greatest impact of the shift was felt by smallholder farmers who contributed 50 percent of export volume of pineapple before 2004 and are no longer in the production of pineapple for
59 Browning or Internal Browning is a physiological disorder that turns the colour of the interior of harvested pineapple fruit into brown and rapidly reaches the core of the fruit. It is caused by several factors including cultural conditions (e.g. varieties, soil acidity and content in minerals), and postharvest treatments (e.g. temperature and duration of storage).
Figure 4.2: Number of fresh pineapple exporters in Ghana
Source: SPEG
List of exporting firms that are fairtrade certified
Prudent Exports
Milani Ltd.
Georgefields Farms
Jei River Farms
Bio Exotica Co. Ltd.
Volta River Estates Ltd.
Bomarts Farms
Gold Coast Fruits
Table 4.2: Fairtrade certified pineapple exporters
Source: SPEG
10
20
30
40
50
60
70
80 No. of exporters
110907050301999795

90 Analysis of the size and distribution of the impacts of agricultural trade at the firm and industry levels in developing countries
exports today, felt the greatest impact of the shift. Interventions were made by donors and Government of Ghana to address availability of MD2 suckers for commercial and smallholder farmers from 2005 to 2007.
For example, Government of Ghana in 2005 provided a two million dollar grant to the pineapple industry to procure planting material. Other remedial measures were the setting up of Bio Plantlets Ltd, a commercial tissue culture laboratory at the Ghana Atomic Energy Commission (GAEC) funded by USAID. Also, under the Horticulture Export Industry Initiative (HEII), there was collaboration with a private tissue culture laboratory Bomarts Ltd and Bio Plantlets Ltd to make available tissue-cultured plantlets of MD2 variety to commercial smallholder farmers. Smallholder farmers who had lost incomes due to lack of sales and inability of exporters to pay them due to losses incurred in Europe, were expected to multiply field suckers which required additional capital on their part. This, coupled with their lack of necessary agronomic skills to produce MD2, further compounded the situation.
4.3 Structure/organization of the pineapple export industry
The pineapple value chain (Figure 4.3) based on production data for 2011 and current situation in 2012 has a large number of commercial farmers producing about 90 percent of pineapple in the country currently. MD2 constitutes about 90 percent of total production in Ghana, with smallholders accounting for about 2 percent of current production volumes. It is estimated that Ghana currently produces about 70 000 MT of MD2 variety of pineapples equivalent to about 5000 acres of production land, based on data collected for exports, interviews with producers/ exporters and visits to their farms and analysis of their planting and production records, Blue Skies and major processing firms. About 50 to 60 percent are exported by sea with the rest sold to Blue Skies Ltd (6000 MT), Peelco Ltd in Bawjiase, domestic markets, processing firms engaged in juice production such as Pinora and
drying firms such as HPW which projects to consume about 2 700 MT per annum. Not more than 10 percent of pineapple production as indicated above is targeted at Smooth Cayenne production, which is limited to a few commercial farms such as Jei River Farms and Unifruit Farms and mostly grown by smallholders. The bulk of Smooth Cayenne variety is exported by air with about 4000 MT sold to Blue Skies. Blue Skies sources its Smooth Cayenne from smallholders (70 percent) and two other commercial farms - Jei River Farms and Unifruit Farms (30 percent).
Due to low production of Smooth Cayenne in the country, Blue Skies on a number of occasions have to source from Togo, Benin and Cote D’Ivoire. The conversion rate for processing fresh pineapple to fresh cut is about 26 percent. It is estimated that smallholder farmers incur a production cost of USD 1 250/acre without using mulch and make a return of 70 percent over a period of 14 months after harvest and sales at 40 Ghanaian pesewas (or USD 0.80) a kilogram. Prices offered by exporters and processors vary with respect to the variety of pineapple on offer and from which they export or process into. Blue Skies offers presently to suppliers, 0.40 Ghanaian pesewas per kilo for Smooth Cayenne and 0.20 Euro cents/0.46 Ghanaian pesewas per kilo for MD2. Most of the processing firms which buy pineapple for juice pay 0.26 Ghanaian pesewas (or USD 0.52) per kilo ex-factory for the two varieties. The bulk of air-freight pineapples are shipped through cargo airlines coordinated by Air Ghana twice a week unlike Blue Skies which ships everyday on commercial airlines going to Europe. For processed pineapple juice, most of the processing is done by small-scale firms for local consumption. Blue Skies Ltd also processes juice for both exports and local consumption. Pinora Ltd is the only company engaged in processing and export of fresh pineapple into juice concentrate and offers USD 130/MT at farm gate. It has had major challenges in procuring fresh pineapples for processing and so had not had continuous operations for the past four years.
Currently, exports of fresh pineapples from Ghana are done by 14 companies, most of them located in the Awutu Senya District of the Central

91Chapter 4: Analysis of trade impacts on the fresh pineapple sector in Ghana
Region with two – Koranco Farms and Greenspan Farms – located in the Akuapim South District in the Eastern Region. For fresh cut fruits, Blue Skies based in Nsawam in the Akuapim South District has been the leader (95 percent) with Peelco Ltd, which operates in Bawjiase in the Awutu Senya district having limited operations. All their products are air freighted using commercial passenger air lines such as British Airways, KLM, etc with the bulk of Blue Skies products consigned to British supermarkets and Peelco to German supermarkets. Eight key exporters (Table 4.3) account for about 93 percent of sea-freighted pineapples as of 2011. Blue Skies unlike Peelco has an extensive outgrower system in place and are Global G.A.P certified as a group.
Most of these farms are in the region of 60 km from the main port of Tema. Exports of fresh pineapples are all year round with peak exports from October to March. With the exception of Bomarts Farms, Milani Ltd., Gold Coast Fruits Ltd, Georgefields Farms and Prudent Farms that have limited number of outgrowers, all the other exporters rely on their own production for export.
Estimates of workers and farmers engaged in primary production of pineapples have been
Figure 4.3: Value chain map of fresh Pineapple exports
Exporting firms and contribution to exports of fresh pineapples
%
Bomarts Farms 15
Georgefields Farms 5
Gold Coast Fruits 8
Golden Exotics Ltd 26
Jei River Farms 12
Koranco Farms 7
Milani Ltd 14
Prudent Farms 6
Source: SPEG
Table 4.3: List of major fresh pineapple exporters
done based on interviews, review of exiting literature and discussion with local consultants who have worked with smallholders under various donor-funded programs. Based on the above and the current program to introduce healthy, disease-free field suckers of Smooth Cayenne variety of pineapple, it is estimated that about 30 large and less than 200 smallholders’ farmers are currently engaged in commercial pineapple production in Ghana.
Source: Authors
Fresh & juice processing
Smooth Cayenne: 3
Fresh-cut3 000MT
Sea freightMD2:
35 000MT
2 Fresh-cut processorsSmooth Cayenne: 6 000MT
Smallholder (200 outgrowers)Smooth cayenne: 12 000MT
MD2: 2 500MT
EXPORT MARKETLOCAL MARKET
14 Large-scale farmers (nucleus farmers/exporters)Smooth cayenne: 5 000MT
Air freightSmooth
Cayenne: 10 000MT
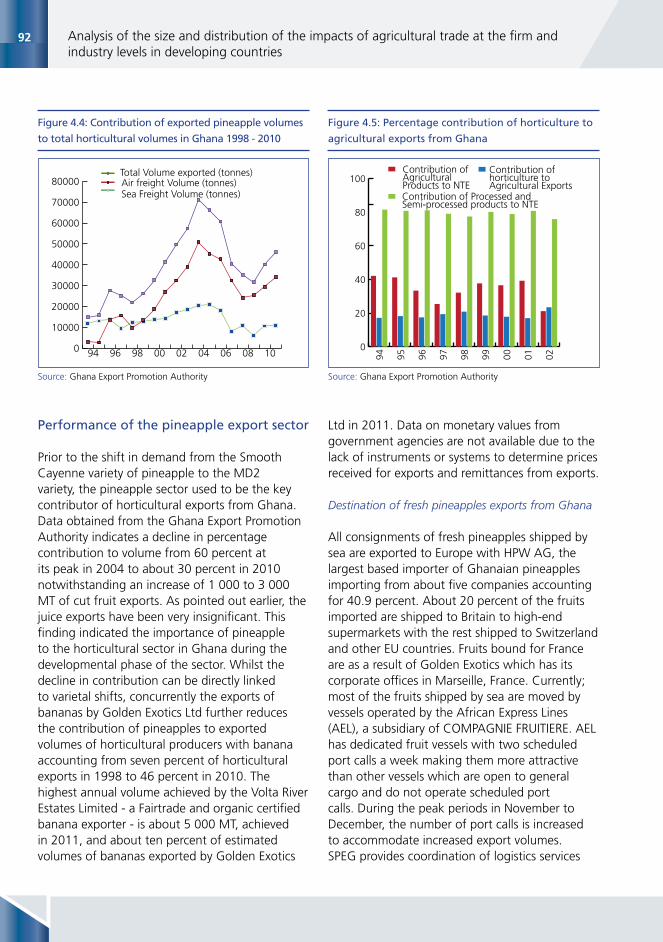
92 Analysis of the size and distribution of the impacts of agricultural trade at the firm and industry levels in developing countries
Figure 4.4: Contribution of exported pineapple volumes
to total horticultural volumes in Ghana 1998 - 2010
Source: Ghana Export Promotion Authority
Performance of the pineapple export sector
Prior to the shift in demand from the Smooth Cayenne variety of pineapple to the MD2 variety, the pineapple sector used to be the key contributor of horticultural exports from Ghana. Data obtained from the Ghana Export Promotion Authority indicates a decline in percentage contribution to volume from 60 percent at its peak in 2004 to about 30 percent in 2010 notwithstanding an increase of 1 000 to 3 000 MT of cut fruit exports. As pointed out earlier, the juice exports have been very insignificant. This finding indicated the importance of pineapple to the horticultural sector in Ghana during the developmental phase of the sector. Whilst the decline in contribution can be directly linked to varietal shifts, concurrently the exports of bananas by Golden Exotics Ltd further reduces the contribution of pineapples to exported volumes of horticultural producers with banana accounting from seven percent of horticultural exports in 1998 to 46 percent in 2010. The highest annual volume achieved by the Volta River Estates Limited - a Fairtrade and organic certified banana exporter - is about 5 000 MT, achieved in 2011, and about ten percent of estimated volumes of bananas exported by Golden Exotics
Ltd in 2011. Data on monetary values from government agencies are not available due to the lack of instruments or systems to determine prices received for exports and remittances from exports.
Destination of fresh pineapples exports from Ghana
All consignments of fresh pineapples shipped by sea are exported to Europe with HPW AG, the largest based importer of Ghanaian pineapples importing from about five companies accounting for 40.9 percent. About 20 percent of the fruits imported are shipped to Britain to high-end supermarkets with the rest shipped to Switzerland and other EU countries. Fruits bound for France are as a result of Golden Exotics which has its corporate offices in Marseille, France. Currently; most of the fruits shipped by sea are moved by vessels operated by the African Express Lines (AEL), a subsidiary of COMPAGNIE FRUITIERE. AEL has dedicated fruit vessels with two scheduled port calls a week making them more attractive than other vessels which are open to general cargo and do not operate scheduled port calls. During the peak periods in November to December, the number of port calls is increased to accommodate increased export volumes. SPEG provides coordination of logistics services
Figure 4.5: Percentage contribution of horticulture to
agricultural exports from Ghana
Source: Ghana Export Promotion Authority
0
10000
20000
30000
40000
50000
60000
70000
80000Total Volume exported (tonnes)Air freight Volume (tonnes)Sea Freight Volume (tonnes)
1008060402009896940
20
40
60
80
100
Contribution of Processed and Semi-processed products to NTE
Contribution of Agricultural Products to NTE
Contribution of horticulture to Agricultural Exports
020100999897969594

93Chapter 4: Analysis of trade impacts on the fresh pineapple sector in Ghana
to the producers to ensure timely delivery at the port for shipment. AEL makes port calls to four destinations in Europe with about 50 percent of fruit exported discharged in Antwerp. The cost of freight has, over the past four years, remained steady at USD 227 and is currently about USD 257 per pallet of 80 cartons. Golden Exotics Ltd has the highest number of farm employees and land size which is logical when juxtaposed against (their) being the largest exporters of fresh pineapples from Ghana (Table 4.4).
Though Jei River Farms has the next largest landholding, it is the fourth largest contributor to exports of fresh pineapples from Ghana. The reason for its large land size is that, unlike most of the Ghanaian and indigenous companies which commenced operations in the 1980s, Jei River Farms Ltd was established by a multinational trading company Société Commerciale de l’Ouest Africain (SCOA) in the 1970s when land accessibility was easy. Critical analysis of export volumes in Ghana by commercial farms in relation to their land size indicate a land utilization rate of 15 percent for pineapple production and in resonance with long fallow practices seen in Ghana, unlike in Costa Rica.
Figure 4.7: Destination of fresh pineapple exports
from Ghana
Source: SPEG
Figure 4.6: Destination ports in Europe receiving sea
freighted pineapples from Ghana
Source: See Pineapple Exporters of Ghana (SPEG)
Exporting firms and contribution to exports of fresh pineapples
Company Staff Strength Total Land Ha
Bio Exotica Ltd. 80 1 000
Bomarts Farms 650 3 000
Chartered Impex 150 2 000
Georgefields Farms 250 2 600
Gold Coast Fruits 210 1 260
Golden Exotics 1 200 6 000
Greenspan Farms 75 750
Jei River Farms 435 5 800
Koranco Farms 230 2 500
Mashaco Farms 45 483
Pioneer Quality Farms 50 400
Prudent Exports 160 2 000
Unifruit Ltd 150 1 800
Volta River Estate Ltd. 100 1 000
TOTAL 3 785 30 593
Source: SPEG
Table 4.4: Land size and staff strength of current
exporters of fresh pineapples
Dover - UK
Vado - Italy
Vendres - France
Antwerp - Belgium
Netherlands
Switzerland
Italy
Germany
France
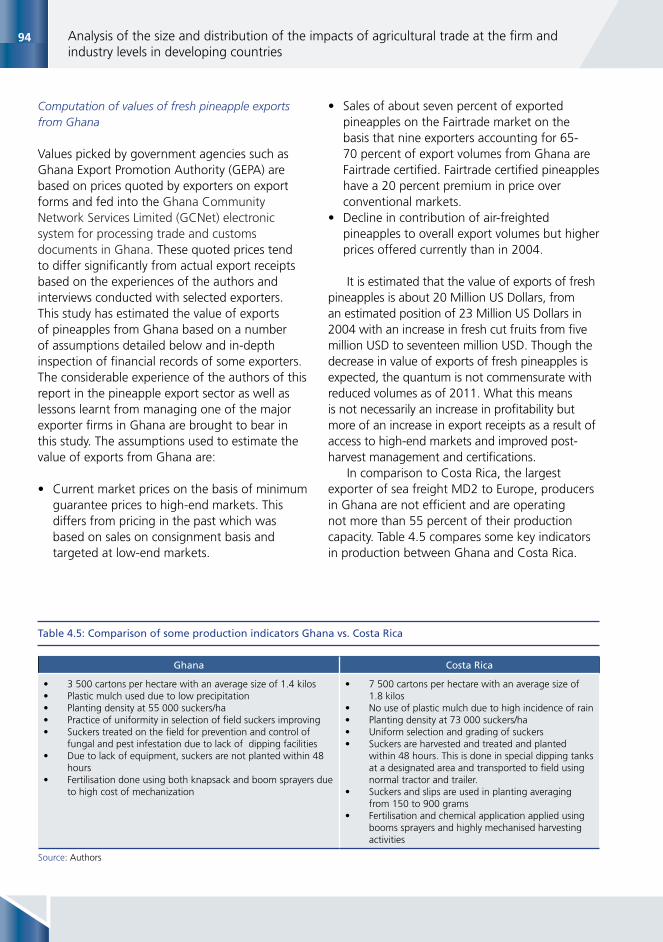
94 Analysis of the size and distribution of the impacts of agricultural trade at the firm and industry levels in developing countries
Computation of values of fresh pineapple exports from Ghana
Values picked by government agencies such as Ghana Export Promotion Authority (GEPA) are based on prices quoted by exporters on export forms and fed into the Ghana Community Network Services Limited (GCNet) electronic system for processing trade and customs documents in Ghana. These quoted prices tend to differ significantly from actual export receipts based on the experiences of the authors and interviews conducted with selected exporters. This study has estimated the value of exports of pineapples from Ghana based on a number of assumptions detailed below and in-depth inspection of financial records of some exporters. The considerable experience of the authors of this report in the pineapple export sector as well as lessons learnt from managing one of the major exporter firms in Ghana are brought to bear in this study. The assumptions used to estimate the value of exports from Ghana are:
• Current market prices on the basis of minimum guarantee prices to high-end markets. This differs from pricing in the past which was based on sales on consignment basis and targeted at low-end markets.
• Sales of about seven percent of exported pineapples on the Fairtrade market on the basis that nine exporters accounting for 65-70 percent of export volumes from Ghana are Fairtrade certified. Fairtrade certified pineapples have a 20 percent premium in price over conventional markets.
• Decline in contribution of air-freighted pineapples to overall export volumes but higher prices offered currently than in 2004.
It is estimated that the value of exports of fresh pineapples is about 20 Million US Dollars, from an estimated position of 23 Million US Dollars in 2004 with an increase in fresh cut fruits from five million USD to seventeen million USD. Though the decrease in value of exports of fresh pineapples is expected, the quantum is not commensurate with reduced volumes as of 2011. What this means is not necessarily an increase in profitability but more of an increase in export receipts as a result of access to high-end markets and improved post-harvest management and certifications.
In comparison to Costa Rica, the largest exporter of sea freight MD2 to Europe, producers in Ghana are not efficient and are operating not more than 55 percent of their production capacity. Table 4.5 compares some key indicators in production between Ghana and Costa Rica.
Ghana Costa Rica
• 3 500 cartons per hectare with an average size of 1.4 kilos • Plastic mulch used due to low precipitation• Planting density at 55 000 suckers/ha• Practice of uniformity in selection of field suckers improving• Suckers treated on the field for prevention and control of
fungal and pest infestation due to lack of dipping facilities • Due to lack of equipment, suckers are not planted within 48
hours• Fertilisation done using both knapsack and boom sprayers due
to high cost of mechanization
• 7 500 cartons per hectare with an average size of 1.8 kilos
• No use of plastic mulch due to high incidence of rain• Planting density at 73 000 suckers/ha• Uniform selection and grading of suckers• Suckers are harvested and treated and planted
within 48 hours. This is done in special dipping tanks at a designated area and transported to field using normal tractor and trailer.
• Suckers and slips are used in planting averaging from 150 to 900 grams
• Fertilisation and chemical application applied using booms sprayers and highly mechanised harvesting activities
Source: Authors
Table 4.5: Comparison of some production indicators Ghana vs. Costa Rica

95Chapter 4: Analysis of trade impacts on the fresh pineapple sector in Ghana
4.4 Some quantitative analyses of trade impacts
In order to establish the impact of trade benefits on selected pineapple firms in Ghana, three types of analysis were conducted. The aims were to look at the impact of Year of Conversion to MD2, Firm Size, and Age of the Firm on Firms’ Export Volumes and hence their Market Shares. Three Models are tested. The difference-in-difference model shows the impact of conversion to MD2 on firms’ export volumes, the Chow’s test for structural change is used to establish whether there has been a structural change in pineapple exports after the 2005 shock. A third model used Ordinary Least Square (OLS) to estimate the determinants of export, export per worker, export share, and capital intensity among pineapple firms in Ghana.
Four sets of empirical results are presented below. Firstly, an estimation of the correlations
between the different variables of interest is hereby presented. Secondly, an estimate of a dynamic difference-in-differences model to evaluate the impact of the trade shock on firm exports. Thirdly, an ad hoc robustness test by testing for structural change is presented. This is done by empirically verifying if there is evidence that the slope and constant of the export volume regression line are statistically different before and after 2005. Lastly, an evaluation of the determinants of trade by estimating a series of OLS regressions is also done.
Correlations
Number of workers has a positive relationship with export share of the firms and this is very significant at 1 percent level. This means that the export share of a firm will increase as the firm increases its number of workers. This may also mean that larger firm (or perhaps more
Export shares
Adjusted price
Export per worker
No of workers
LandYrs per harvest
MD2 Age
Export shares 1
Adjusted Price -0.4068 1
(0.0317)
Export Per Worker 0.5564 -0.5327 1
(0.0252) (0.0336)
No of Workers 0.8517 -0.2049 0.4221 1
(0.00) (0.3602) (0.1034)
Land 0.8234 -0.3546 0.2025 0.8975 1
(0.00) (0.1363) (0.4875) (0.00)
Yrs P-Harvest 0.776 -0.4744 0.7426 0.7095 0.5567 1
(0.0003) (0.0543) (0.0088) (0.0021) (0.0311)
MD2 0.6103 -0.7151 0.7351 0.3547 0.487 0.7927 1
(0.0026) (0.0002) (0.0018) (0.1147) (0.0345) (0.0001)
Age -0.09 0.0618 -0.2086 -0.1282 -0.2569 -0.1859 0.1431 1
(0.6621) (0.7644) (0.4555) (0.5901) (0.2883) (0.4751) (0.536)
Table 4.6: Correlation
Source: Authors

96 Analysis of the size and distribution of the impacts of agricultural trade at the firm and industry levels in developing countries
fact that newer firms established prior to varietal shift did not have huge cultivations of SC variety of pineapple unlike the older firms. This put them in a position to commence production of MD2 variety of pineapple and more importantly, acquire equipment more suited to MD2 production.
Difference-in-differences
A robust standard error dynamic difference-in-difference model using a year fixed effect model showing the year by year differences is estimated. The model specification used to carry out the analysis is presented in equation (1) below.
Y: Outcome variables (export volumes or export shares)
D: Year dummies (t=2006,… ,2011)X: Export dummy: X = 1, if firm is a strictly
pineapple export firm and 0 otherwiseZ: Time-varying independent variables (j=
Adjusted price, MD2 adopted, Post-Harvest)ε is the error terms and β, δ, γ, μ are parameters.
Table 4.7 presents the results where the dependent variable is the quantity of pineapple exported. The results state that varietal shift from SC to MD2 variety of pineapples which peaked in 2005 has had negative impact on pineapple exports from Ghana well beyond 2005. The relationship between pineapple exports and the independent variable is sensible. While adjusted price has a negative relationship with export quantity, firm converting production from SC to MD2 variety of pineapple and Post-Harvest infrastructure are positively related to exports of pineapple from Ghana.
Further analysis indicates (Table 4.8) the number of years that firms converted to MD2 has a heterogeneous impact on export volume. For instance, firms that converted to MD2 in 2005 exported 1 176 more pallets than firms that did not convert to MD2 in that year. This impact differs by year of adoption such that it becomes 2163, 1208, and 391 pallets in 2006, 2007, and 2008 respectively but loses statistical significance
labour intensive firms) may have greater export return. This fact is further reflected in the positive relationship that exists between export share per worker and export share of the individual firms. Period of conversion to MD2 variety of pineapple has a positive correlation with firms’ export shares and is significant at 1 percent level. This means that firms who converted early to MD2 have bigger export shares than those who converted later. This is because market demand in Europe after 2005 shifted from SC to MD2 variety of pineapple. Firms that converted late definitely lost market shares as a result of lack of fruits for exports resulting in losing importers to other exporters. The results further show a negative relationship between the year of converting to MD2 and the FOB price of pineapples; this relationship is significant at 1 percent level. This means that farmers who converted early to the MD2 variety of pineapple obtained higher FOB prices for their pineapples than late converters because they had secured and cemented relationships with importers and importantly, used the period to improve quality of exported fruits to meet market specifications unlike their competitors who converted late. Year of obtaining post-harvest facility shows a positive relationship with export share of individual firms and is significant at 1 percent level. This finding means that firms who acquired post-harvest facility with installed packing lines and cooling facilities early increased their export shares than firms who acquired post-harvest facility late.
This is because unlike the SC variety of pineapple, the MD2 variety requires cleaning, waxing, sorting (weight and colour) using packing lines and pre and post cooling handling. This minimises bruising, increases shelf life and maintain colour attractiveness for consumers in Europe. Availability of such facility offer firms the opportunity to improve quality of fruits exported over a period and maintain secure importers in Europe.
The age of firm has a negative relationship with export shares of firms and this relationship was also not statistically significant; this means that older firms have smaller export shares than younger firms. This could be attributed to the
Yt = β0 + t∑ βt.Dt +γX.X + δt (Dtt∑ .X)+ µ jZ jj∑ +εt

97Chapter 4: Analysis of trade impacts on the fresh pineapple sector in Ghana
Variables Coefficients Robust S. E. t P-value
Export 1705.455*** 123.366 13.82 0.000
Export*year 2006 -892.8609*** 117.0119 -7.63 0.000
Export*year 2007 -351.4997** 138.0467 -2.55 0.026
Export*year 2008 -635.5918*** 209.6132 -3.03 0.010
Export*year 2009 (omitted) (omitted)
Export*year 2010 (omitted) (omitted)
Export*year 2011 (omitted) (omitted)
Adjusted price -627.5093*** 155.6578 -4.03 0.002
MD2 adopted 574.026* 318.9974 1.80 0.097
Post-Harvest 3089.844*** 739.0243 4.18 0.001
Constant 810.3751** 294.5835 2.75 0.018
Fixed Effect Yes
* p < 0.10, ** p < 0.05, *** p < 0.01
Table 4.7: Impact of MD2 shock on export volumes (in pallets)
Table 4.8: Impact of MD2 shock on export volumes (a deeper look at the effect of MD2 conversion)
Variables Coefficients Robust S. E. t P-value
Export 1737.427*** 143.1349 12.14 0.000
MD2* year 2005 1176.607*** 59.82105 19.67 0.000
MD2* year 2006 2163.017*** 106.2 20.37 0.000
MD2* year 2007 1208.843*** 127.8657 9.45 0.000
MD2* year 2008 391.8077* 224.711 1.74 0.107
MD2* year 2009 79.22052 309.0134 0.26 0.802
MD2* year 2010 -148.0853 382.6423 -0.39 0.706
MD2* year 2011 (omitted) (omitted)
Export*year 2006 -1613.221*** 142.3333 -11.33 0.000
Export*year 2007 -434.0941** 173.5214 -2.50 0.028
Export*year 2008 -653.8792*** 231.1459 -2.83 0.015
Export*year2009 (omitted) (omitted)
Export*year2010 (omitted) (omitted)
Export*year 2011 (omitted) (omitted)
Adjusted price -658.1494*** 138.2472 -4.76 0.000
MD2 Conversion -191.9983*** 59.78368 -3.21 0.007
Post-Harvest 3292.536*** 798.5128 4.12 0.001
Constant 919.4139*** 252.6136 3.64 0.003
Fixed Effect Yes
* p < 0.10, ** p < 0.05, *** p <0.01
Source: Authors
Source: Authors

98 Analysis of the size and distribution of the impacts of agricultural trade at the firm and industry levels in developing countries
after 2008. This means that conversion to MD2 after 2008 does not significantly enhance export volume. This is because the production cycle of MD2 variety of pineapple is about fifteen months. After fruit harvest, the plant produces field suckers for replanting, over a period of six months. In order to make any significant impact on export volumes, a firm needs to complete three full cycles of production, which is equivalent to a period of about five years. Therefore, any firm that converted to MD2 after 2008, based on the period of analysis will not have any significant impact on its export volumes.
The impact of the shock on export shares (Table 4.9) is also negative and statistically significant. Incidentally, the impact worsens every year implying that the industry may be on the verge of decline. Export shares of pineapple firms have been declining by an average rate of 26 percent per year.
In the case of export shares (Table 4.10), MD2 conversion after 2009 loses its positive impact on export shares. Firms that converted to MD2 between the years of 2006 and 2008 are the only ones who experienced a positive impact on their export shares from trade and this is explained above as a result of period of production cycle.
Test for structural change
The main test statistic for the structural change test is the Chow test (Tables 4.11, 4.12, 4.13, 4.14).
For the Chow Test, an interaction term of the regressor “adjusted price” and the dummy variable “year 1” which is equal to 1 if the year of observation is after 2005 and 0 otherwise was created. The coefficient of “year 1” is the deviation of the post 2005 period intercept from the baseline intercept (year 1=0). Likewise, the coefficient of “adjusted price” is the slope of the baseline period, and the coefficient of the interaction terms of “adjusted price” and “year 1” is the deviation of the second period slope from the baseline slope.
The Chow Test is conducted such that the null hypothesis is that two periods have equal parameters for “adjusted price” and intercept; deviations of the slope and intercept are not statistically discernible from zero. Before estimating the Chow Test, the export figures were de-trended to remove potential bias. The results reject the null hypothesis and suggest that there have been a structural change in pineapple export after the 2005 shock.
Variables Coefficients Robust S.E. t P-value
Export 0.035591*** 0.00129 27.59 0.000
Export*year 2006 -0.0106516*** 0.003248 -3.28 0.007
Export*year 2007 -0.0116738*** 0.003174 -3.68 0.003
Export*year 2008 -0.0160949*** 0.003966 -4.06 0.002
Export*year 2009 -0.0173662** 0.006743 -2.58 0.024
Export*year 2010 -0.02611*** 0.008319 -3.14 0.009
Export*year 2011 (omitted) (omitted)
Adjusted price -0.0145136*** 0.003455 -4.20 0.001
MD2 adopted 0.0113871 0.008247 1.38 0.193
Post-Harvest 0.0985803*** 0.023168 4.25 0.001
Constant 0.0249342*** 0.007269 3.43 0.005
Fixed Effect Yes
* p < 0.10, ** p < 0.05, *** p < 0.01
Table 4.9: Impact of MD2 shock on export shares
Source: Authors
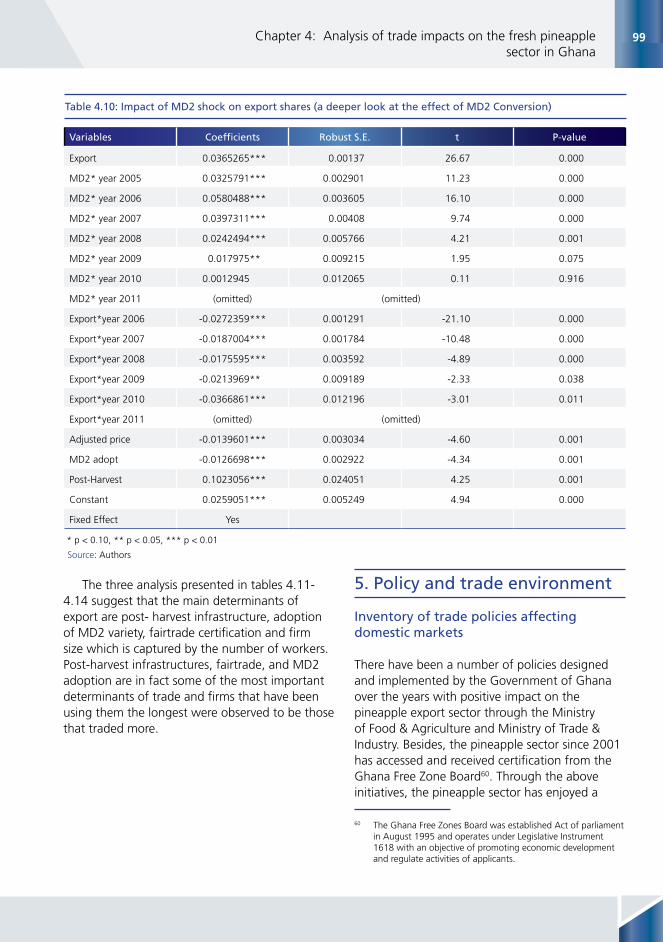
99Chapter 4: Analysis of trade impacts on the fresh pineapple sector in Ghana
Table 4.10: Impact of MD2 shock on export shares (a deeper look at the effect of MD2 Conversion)
Variables Coefficients Robust S.E. t P-value
Export 0.0365265*** 0.00137 26.67 0.000
MD2* year 2005 0.0325791*** 0.002901 11.23 0.000
MD2* year 2006 0.0580488*** 0.003605 16.10 0.000
MD2* year 2007 0.0397311*** 0.00408 9.74 0.000
MD2* year 2008 0.0242494*** 0.005766 4.21 0.001
MD2* year 2009 0.017975** 0.009215 1.95 0.075
MD2* year 2010 0.0012945 0.012065 0.11 0.916
MD2* year 2011 (omitted) (omitted)
Export*year 2006 -0.0272359*** 0.001291 -21.10 0.000
Export*year 2007 -0.0187004*** 0.001784 -10.48 0.000
Export*year 2008 -0.0175595*** 0.003592 -4.89 0.000
Export*year 2009 -0.0213969** 0.009189 -2.33 0.038
Export*year 2010 -0.0366861*** 0.012196 -3.01 0.011
Export*year 2011 (omitted) (omitted)
Adjusted price -0.0139601*** 0.003034 -4.60 0.001
MD2 adopt -0.0126698*** 0.002922 -4.34 0.001
Post-Harvest 0.1023056*** 0.024051 4.25 0.001
Constant 0.0259051*** 0.005249 4.94 0.000
Fixed Effect Yes
* p < 0.10, ** p < 0.05, *** p < 0.01
The three analysis presented in tables 4.11-4.14 suggest that the main determinants of export are post- harvest infrastructure, adoption of MD2 variety, fairtrade certification and firm size which is captured by the number of workers. Post-harvest infrastructures, fairtrade, and MD2 adoption are in fact some of the most important determinants of trade and firms that have been using them the longest were observed to be those that traded more.
5. Policy and trade environment
Inventory of trade policies affecting domestic markets
There have been a number of policies designed and implemented by the Government of Ghana over the years with positive impact on the pineapple export sector through the Ministry of Food & Agriculture and Ministry of Trade & Industry. Besides, the pineapple sector since 2001 has accessed and received certification from the Ghana Free Zone Board60. Through the above initiatives, the pineapple sector has enjoyed a
60 The Ghana Free Zones Board was established Act of parliament in August 1995 and operates under Legislative Instrument 1618 with an objective of promoting economic development and regulate activities of applicants.
Source: Authors

100 Analysis of the size and distribution of the impacts of agricultural trade at the firm and industry levels in developing countries
number of incentives detailed below to improve their competiveness.
These include:
1. Zero input duties on inputs.2. Zero Value Added Tax (VAT) and National
Health Insurance Levy (NHIL) on inputs.3. Low-level corporate income tax of 8 percent.4. Zero VAT and NHIL on imported packaging
material.5. Zero import duties on farm machinery.6. Subsidies on port handling charges between
1994 and 2009.7. Benefits under Free Zone i.e. Non-Payment of
Duties and Levies.
To further support the development and promotion of the export trade, the Government of Ghana established, by Act 582 dated 04 October 2000, a fund – the Export Development Agriculture and Investment Fund (EDAIF) – to provide financial resources for exporters in Ghana. The core mission is to finance the development and promotion of Ghana’s non-traditional exports on concessionary terms that promote the growth and prosperity of export firms, improve export competitiveness and enable the export sector to contribute towards the economic growth and development of Ghana.
The Fund has two main facilities which can be accessed by applicants for funding, namely the Export Development and Promotion Facility (EDPF) and the Credit Facility (CF).The Credit Facility (loans) can be accessed through Designated Financial Institutions (DFIs) with credit for more than five years. The Export Development and Promotion Facility (EDPF) support activities of groups and institutions in the development and promotion of export products and provision of services to the export sector.
Finally, the industry benefits from the fertiliser subsidy program instituted by the Government of Ghana for the agricultural sector since 2008. Under this program, the government absorbs 35 percent of the retail price of three types of fertilizers, NPK, Urea and Sulphate of Ammonia used by farmers in the country. Farmers are
registered in districts and are issued coupons which are presented to agents of importing firms in their locality to be redeemed by the government agency responsible for the program. The effects of these policies resulted in (has been to) reducing the cost of production, and freeing up more capital for investment and expansion.
Policy bottlenecks and market barriers affecting exports of pineapples from Ghana
Nature of policy bottlenecks and market barriers
Under the Cotonou Agreement, ACP countries including Ghana are allowed to export most of their goods including fresh produce to the EU duty-free on a non-reciprocal basis. This Agreement expired at the end of 2007 and negotiations commenced to develop a new framework, the Economic Partnership Agreement (EPA). In order to avoid imposition of tariffs, the 27 European countries represented by the European Commission (EC) and Ghana signed the “Stepping Stone” Economic Agreement or the LIGHT EPA in December, 2007. Ghana was the second after Cote D’Ivoire to sign the agreement. The LIGHT EPA was to ensure that Ghana continued to export duty-free to the EU until the final EPA was signed. Opportunities for Ghana are varied and depending on comprehensive (homework) planning, Ghana could benefit from the Agreement, which could later lead to a more permanent arrangement i.e. the EPA. There are equal challenges associated with the agreements, particularly the fact that the local economy could be overtaken by events and reduced to a consumer economy if immediate steps are not taken to secure local industries and productivity.
The other advantage is that the agreement is a contract between the two parties and not a preferential treatment. This means it carries with it a greater amount of transparency, security and the predictability of a binding contract. Secondly, it offers the country the reprieve to thoroughly do its homework to enable it become competitive. The Ghana Government is yet to sign the final EPA. In its negotiations, Ghana has to be able to determine the imports from the EU which contribute

101Chapter 4: Analysis of trade impacts on the fresh pineapple sector in Ghana
Var
iab
les
Co
-ef
fici
ents
S.E.
Co
-ef
fici
ents
S.E.
Co
-ef
fici
ents
S.E.
Co
-ef
fici
ents
S.E.
Co
-ef
fici
ents
S.E.
Co
-ef
fici
ents
S.E.
Co
-ef
fici
ents
S.E.
Adj
uste
d pr
ice
-2.9
0***
1.23
0.12
1.19
Year
s w
ith
P-H
arve
st1.
77**
*0.
530.
90**
0.42
Year
s w
ith
MD
21.
40**
*0.
360.
82**
*0.
34
Land
siz
e0.
002
0.00
2
Age
of
the
firm
-0.1
20.
15
Fairt
rade
4.52
**1.
92
Con
stan
t12
.75*
**3.
152.
75**
1.33
-1.9
02.
175.
53**
*1.
738.
37**
*3.
213.
41**
1.36
-0.3
84.
07
* p
< 0
.10,
**
p <
0.0
5, *
** p
< 0
.01
Tab
le 4
.11:
Det
erm
inan
ts o
f ex
po
rt p
er w
ork
er
Tab
le 4
.12:
Det
erm
inan
ts o
f ex
po
rt v
olu
me
Var
iab
les
Co
-ef
fici
ents
S.E.
Co
-ef
fici
ents
S.E.
Co
-ef
fici
ents
S.E.
Co
-ef
fici
ents
S.E.
Co
-ef
fici
ents
S.E.
Co
-ef
fici
ents
S.E.
Co
-ef
fici
ents
S.E.
Co
-ef
fi-
cien
ts
S.E.
Adj
uste
d pr
ice
-119
0.76
***
504.
5827
1.43
487.
24
Year
s w
ith
P-H
arve
st13
56.6
7***
616.
6844
8.77
298.
4
Year
s w
ith
MD
262
3.92
***
261.
62-1
21.3
623
1.73
Land
siz
e4.
31**
*1.
48-0
.62
1.29
Age
of
the
firm
-35.
4910
4.12
Num
ber
of
wor
kers
9.05
***
0.52
9.05
***
2.46
Fairt
rade
1203
.48
970.
97
Con
stan
t47
13.6
3***
1855
.46
-213
657.
62-1
323.
9210
46.5
-428
.21
659.
9721
55.6
2280
-345
.61*
**18
0.78
794.
6431
-781
.12
1839
.46
* p
< 0
.10,
**
p <
0.0
5, *
** p
< 0
.01
Sour
ce: A
utho
rs
Sour
ce: A
utho
rs

102 Analysis of the size and distribution of the impacts of agricultural trade at the firm and industry levels in developing countries
Tab
le 4
.13:
Det
erm
inan
t o
f ex
po
rt s
har
es
Tab
le 4
.14:
Det
erm
inan
t o
f ca
pit
al in
ten
sity
(La
nd
siz
e/N
um
ber
of
wo
rker
)
Vari
able
sCo
-ef
ficie
nts
S.E.
Co-
effi
cien
tsS.
E.Co
-ef
fici
ents
S.E.
Co-
effi
cien
tsS.
E.Co
-ef
fici
ents
S.E.
Co-
effi
cien
tsS.
E.Co
-ef
fici
ents
S.E.
Co-
effi
cien
tsS.
E.
Adj
uste
d pr
ice
-0.0
3***
0.01
0.00
220.
0054
Year
s w
ith P
-Har
vest
0.04
***
0.01
60.
012*
*0.
0059
Year
s w
ith M
D2
0.01
8***
0.00
68-0
.004
50.
0043
Land
siz
e0.
00**
*0.
00-0
.000
030.
0000
2
Age
of t
he fi
rm0.
000.
00
Num
ber o
f wor
ker
0.00
02**
*0.
0000
050.
0003
***
0.00
005
Fairt
rade
0.05
*0.
02
Con
stan
t0.
120.
05-0
.003
0.01
-0.0
390.
022
-0.0
10.
012
0.05
60.
061
-0.0
060.
0071
0.02
0.02
0.00
019
0.02
5
* p
< 0.
10, *
* p
< 0.
05, *
** p
< 0
.01
Var
iab
les
Co
-ef
fici
ents
S.E.
Co
-ef
fici
ents
S.E.
Co
-ef
fici
ents
S.E.
Co
-ef
fici
ents
S.E.
Co
-ef
fici
ents
S.E.
Co
-ef
fici
ents
S.E.
Adj
uste
d pr
ice
0.03
0.3
-0.1
80.
57
Year
s w
ith P
-Har
vest
-0.1
40.
15-0
.11
0.27
Year
s w
ith M
D2
-0.1
40.
13-0
.08
0.36
Age
of
the
firm
-0.0
10.
03-0
.01
0.04
Fairt
rade
-0.2
10.
47
Con
stan
t2.
49**
*0.
812.
9***
0.34
3.30
***
0.79
2.85
***
0.57
2.67
0.34
***
3.97
2.47
* p
< 0
.10,
**
p <
0.0
5, *
** p
< 0
.01
Sour
ce: A
utho
rs
Sour
ce: A
utho
rs

103Chapter 4: Analysis of trade impacts on the fresh pineapple sector in Ghana
significantly to national revenue generation. These items should then be pushed to later years for liberalization. There are also the input items which serve as raw materials for domestic production. These items could be included in the first batch of items to be zero-rated.
Civil society groups particularly the Third World Network, Oxfam and indigenous ones like the Ghana Trade and Livelihoods Coalition (GTLC) have advocated against signing any reciprocal and non-preferential trade agreement between ACP and the EU.
The EU is the principal market for Ghanaian fresh produce exports. The EU is also a significant market for non-traditional exports in general taking an average of between 50 percent and 60 percent of total NTEs every year, reaching USD 2.4 billion in 2011.
With respect to non-tariff barriers, there is no formal legislation in place in the EU. The key barriers are certification standards imposed by supermarkets such as the wholesale GlobalG.A.P certification and those imposed by individual supermarkets such as Tesco Nature Choice (TNC) by Tesco, Field to Fork by Marks & Spencer, etc which an exporter requires in order to access their shops. Another issue is the lack of a framework to assess quality of exported fruits and the absence of exporters’ agent on the market to conduct and verify quality reports.
Effects of policy bottlenecks and market barriers on behaviour of firms
It is to be noted that switching away from the EU market will be extremely difficult not only because of the investments that have already been targeted at the EU, but also because of the difficulty of accessing other markets because of logistical and other challenges and weaknesses. Horticultural exports continue to have free access to the EU market pending the finalization and execution of the EPA. Ghana’s pineapple share of about 4 percent in the EU is currently safe and efforts are being made to expand the share. Industry disruptions have been avoided since the signing of the Light EPA and the likely signing of the full EPA. The
export-led economic development as reflected in the country’s Growth and Poverty Reduction Strategy (GPRS II) and Ghana Shared Growth and Development Agenda (GSGDA) will also not be affected. Information received from the Ministry of Trade and Industry (MOTI) indicates that plans are far advanced for the Ghana Government to sign the EPA and this is welcome news for the horticultural sector.
With respect to the market barriers, the cost for producers and exporters as result of instituting systems with attendant cost in investment and human resource is quite high but beneficial access to markets. These certifications require annual audits and often go through modifications without full participation of exporters and producers in third world countries. Also, exporters are at the mercy of buyers’ quality assessment reports and cannot vouch for their integrity, resulting in lower than expected receipts remitted to them as a result of classification of fruits as poor quality. This greatly affects the revenue base of the firms, resulting in reduced cashflow and reduction in the necessary investment especially in the face of difficulties in varietal shift in response to the market in the EU.
The industry has in response to varietal shift on the market commenced various initiatives, which have brought in its wake, synergies to offset the negative impact of this shift under the umbrella of their association SPEG and on individual basis. First is a joint program executed and managed by SPEG which is currently the umbrella body for the pineapple exporters group. It covers various aspects of the industry ranging from production to market-related issues and is often supported by internally generated funds complemented with donor support.
1. Negotiating for freighting services for members with African Express Line (AEL), the main vessel operators responsible for movement of horticultural products by sea. These negotiations are conducted on an annual basis where projections are made and prices agreed to with the vessel operators.
2. Spearheading and coordinating group marketing for members; this started in

104 Analysis of the size and distribution of the impacts of agricultural trade at the firm and industry levels in developing countries
March 2012. SPEG identifies buyers and negotiates prices and payment terms. Based on buyers’ specifications, a quality control team visits and conducts inspection of farms and packhouses which meet the standards and specifications demanded by the buyers. A common brand has been developed – “Sankofa” – with seven exporters participating. Participating exporters are given a code number for identification. Current markets are Italy, France, Denmark and the UK, with an amount of 1 400 MT shipped as at the end of August 2012. The objective of this program is to promote Ghanaian fresh pineapples and reduce logistic cost in procuring cartons using common branded cartons.
3. Agronomic support through training of their members’ personnel, coordination of certification and, in collaboration with MoFA and other research institutions, carrying out joint research on farms of members.
4. Coordinating trucking services to members for the timely conveyance of containerized fruits from farms to the port of Tema, resulting in lower cost than if individual members negotiated on their own. This service was started in 2011 with about ten exporters currently participating in the scheme. Members pay for the services directly to the haulage firm with SPEG providing a guarantee.
5. Coordinating and organizing supply of fertilizer, plastic mulch and packaging cartons for members. This scheme commenced in 2010 procuring original inputs, better pricing and receiving inputs at required times. Payments are currently being made through export receipts from the group marketing schemes. Goods are stocked in designated warehouses of members with an officer designated to manage the scheme.
The second form of support is the promotion of various levels of collaboration between exporting firms covering various aspects of the sector. Collaboration is on-going on agronomic practices and harmonisation of fertilizer regimes,
joint marketing and input support. The industry has seen various collaborations over the years. In 2006 for example, four companies including Bomarts which was the initial and only source for HPW AG, a large Swiss based importer of horticultural products from Africa and the Far East, formed a marketing relationship with Jei River Farms, Georgefields and Milani Ltd. to supply HPW AG. This involved sourcing uniform cartons with codes representing each of the four companies under a common brand developed earlier between Bomarts Farms Ltd and HPW AG. Inspection and quality programs jointly funded by the four companies with the support of the importer were developed and meetings held jointly to plan export programs through production forecasts and projections.
Linkage between exporting firms and clients
Unlike the fresh cut fruits exported by Blue Skies, Ghanaian exporters of fresh pineapples shipped on consignment basis where sales were determined after sales of products on the wholesale market and dependent on the demand and supply situation prevailing at the time of sale. For the past six years, most exporters have, been able to access the high end of the market. This has resulted in bulk of sales on a minimum guarantee price basis which is negotiated between exporters and importers in the EU but which also imposes on exporters, a higher level of professionalism in agreeing on specifications and projection of supply over a longer period.
This has improved the ability of exporters to negotiate with importers in the EU, to a certain degree, though it must be pointed out that in terms of preference, most importers offer a better premium to imports from Costa Rica than from Ghana due to the former’s consistency in supply, product quality and huge export volumes of fresh pineapples.
Despite agreement on a fixed price basis, importers often during periods of supply glut look for reasons to avoid their obligations on prices. This takes the form of raising quality issues which in periods of demand deficits is not an issue. To

105Chapter 4: Analysis of trade impacts on the fresh pineapple sector in Ghana
overcome this situation, exporters in an effort to strengthen their position have done the following:
• Exporters working individually and under the umbrella of SPEG with a host of importers who are specialised in taking all types of specification vis-à-vis size, colour and brix.
• Participating in group marketing to use increased volumes as a leverage to attract major importers who need a critical mass of volume to economize on their infrastructure.
• Improved the quality of their exported products through proper post-harvest management.
Whilst exporters conduct regular meetings
with their importers in EU in the form of visits, the Fruit Logistica61 which is held in Berlin, Germany, remains the major fruit and vegetable trade show in Europe. Most Ghanaian exporters do visit the trade show on an annual basis to engage their importers and have a better understanding of new trends in the industry.
Past experiences of exporters’ strategies
One of the key strategies employed by the major exporters of pineapple has been to acquire Fairtrade and other certification. This required large initial investments in infrastructure, trainings, and adherence to compliance criteria such being first buyer at FOB. But at the end, it paid off as it gave exporters access rather exclusive markets. Currently, six of the major fresh pineapple exporters are Fairtrade certified with the largest, Golden Exotics Ltd, in the process of acquiring its certification. This strategy of exporting firms in obtaining and selling fruits under Fairtrade label which has 20 percent higher prices in comparison to conventional fruits have reduced to an extent, the negative effect on turnover of reduced volumes as a result of the shift of variety from Smooth Cayenne to MD2. This was confirmed by all the exporters interviewed during the development of this report during our field visits. One major benefit of Fairtrade has been the premium of four euro cents per kilo paid for
61 http://www.fruitlogistica.de/en/
promoting social programs for workers and those living in their communities. Some of the benefits to workers, their families and friends in the rural areas have been as follows:
• Provision of toilet facilities in their communities.• Supply of computers and books for schools. • Credit schemes to assist workers.• Institution of scholarship schemes to support
brilliant but disadvantaged children.
Estimates from 2006 to present indicate a premium of USD 1 000 000 accrued to workers of Fairtrade certified companies, their families and friends in their communities for their developmental and social programs. Another strategy has been the participation of members of SPEG in joint marketing using a standardized carton for all participants resulting in savings of five euro cents per carton (compared with sourcing individually). In fact, through SPEG, an umbrella institution, companies were able to negotiate with logistic companies and obtained preferential tariffs and rates.
Figure 4.8: Profitability analysis Ghana vs. Costa Rica HA
Source: Authors
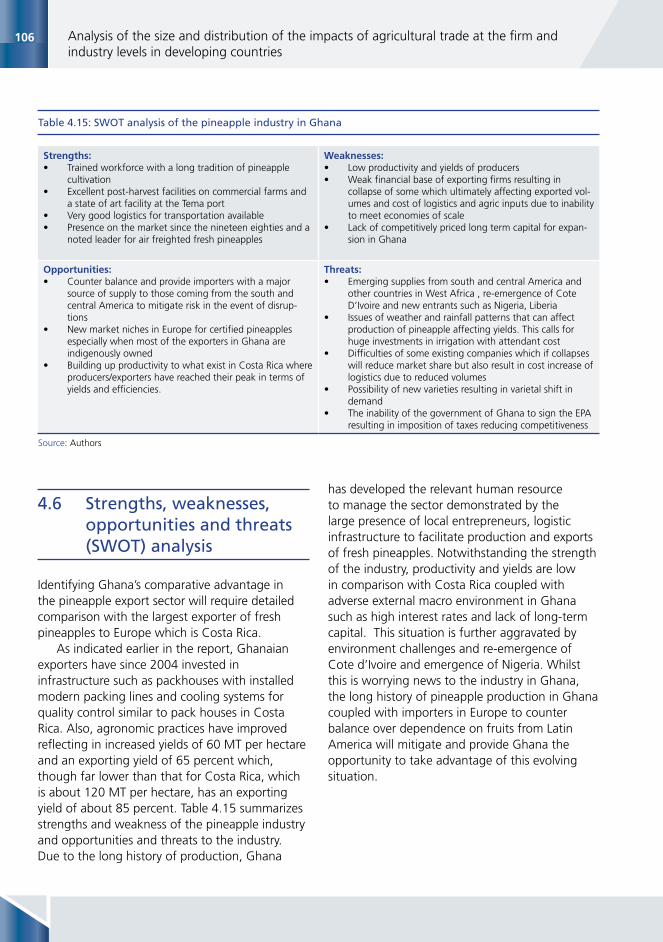
106 Analysis of the size and distribution of the impacts of agricultural trade at the firm and industry levels in developing countries
4.6 Strengths, weaknesses, opportunities and threats (SWOT) analysis
Identifying Ghana’s comparative advantage in the pineapple export sector will require detailed comparison with the largest exporter of fresh pineapples to Europe which is Costa Rica.
As indicated earlier in the report, Ghanaian exporters have since 2004 invested in infrastructure such as packhouses with installed modern packing lines and cooling systems for quality control similar to pack houses in Costa Rica. Also, agronomic practices have improved reflecting in increased yields of 60 MT per hectare and an exporting yield of 65 percent which, though far lower than that for Costa Rica, which is about 120 MT per hectare, has an exporting yield of about 85 percent. Table 4.15 summarizes strengths and weakness of the pineapple industry and opportunities and threats to the industry. Due to the long history of production, Ghana
Strengths:• Trained workforce with a long tradition of pineapple
cultivation• Excellent post-harvest facilities on commercial farms and
a state of art facility at the Tema port• Very good logistics for transportation available• Presence on the market since the nineteen eighties and a
noted leader for air freighted fresh pineapples
Weaknesses:• Low productivity and yields of producers• Weak financial base of exporting firms resulting in
collapse of some which ultimately affecting exported vol-umes and cost of logistics and agric inputs due to inability to meet economies of scale
• Lack of competitively priced long term capital for expan-sion in Ghana
Opportunities:• Counter balance and provide importers with a major
source of supply to those coming from the south and central America to mitigate risk in the event of disrup-tions
• New market niches in Europe for certified pineapples especially when most of the exporters in Ghana are indigenously owned
• Building up productivity to what exist in Costa Rica where producers/exporters have reached their peak in terms of yields and efficiencies.
Threats:• Emerging supplies from south and central America and
other countries in West Africa , re-emergence of Cote D’Ivoire and new entrants such as Nigeria, Liberia
• Issues of weather and rainfall patterns that can affect production of pineapple affecting yields. This calls for huge investments in irrigation with attendant cost
• Difficulties of some existing companies which if collapses will reduce market share but also result in cost increase of logistics due to reduced volumes
• Possibility of new varieties resulting in varietal shift in demand
• The inability of the government of Ghana to sign the EPA resulting in imposition of taxes reducing competitiveness
Source: Authors
Table 4.15: SWOT analysis of the pineapple industry in Ghana
has developed the relevant human resource to manage the sector demonstrated by the large presence of local entrepreneurs, logistic infrastructure to facilitate production and exports of fresh pineapples. Notwithstanding the strength of the industry, productivity and yields are low in comparison with Costa Rica coupled with adverse external macro environment in Ghana such as high interest rates and lack of long-term capital. This situation is further aggravated by environment challenges and re-emergence of Cote d’Ivoire and emergence of Nigeria. Whilst this is worrying news to the industry in Ghana, the long history of pineapple production in Ghana coupled with importers in Europe to counter balance over dependence on fruits from Latin America will mitigate and provide Ghana the opportunity to take advantage of this evolving situation.

107Chapter 4: Analysis of trade impacts on the fresh pineapple sector in Ghana
4.7 Conclusions and recommendations
In 2004, it was estimated that Ghana earned an amount of USD 23 million from exports of fresh pineapples to the EU, its major market. In 2011, it is estimated that export receipts has reduced to USD 20 million. Based on pre 2004 export performance at annual growth rate of 22 percent, Ghana was projected to export about 250 000 MT of pineapples by 2011 with an estimated foreign exchange receipt value of about USD 100 million.
However the pineapple export sector has been affected by varietal shift in demand in Europe, a shock that had a devastated the industry. Ghana has lost its market share of fresh exports which was 10 percent in 2004 and 4 percent in 2011 whilst during the period, imports for fresh pineapples by sea in the EU has increased. Results obtained from data analysed indicated that varietal shift from SC to MD2 variety of pineapples which peaked in 2005 had negative impact on pineapple exports from Ghana well beyond 2005.
The biggest loser has been the smallholder sector. The shift in demand to MD2 in preference to Smooth Cayenne (SC) variety of pineapple also resulted in the displacement of a great number of smallholder farmers. By 2004, it is estimated that smallholders contributed about 50 percent to export volumes. Our estimates based on review of the sector through discussions with outgrowers, and other stakeholders indicate a huge reduction in smallholders engaged in commercial pineapple production.
Large-scale commercial sector was largely able to weather the storm. Therefore, size matters for export competitiveness. The number of workers had a positive relationship with export share of the firms and was very significant at 1 percent level. Responsiveness (flexibility) is also key. Those firms that converted production from SC to MD2 variety of pineapple early, acquired Post-Harvest infrastructure maintained their export share and had a heterogeneous impact on export volumes.
However while size matters, how the firm/farm is organized also matters. Farmapine GH Ltd, working with close to 450 smallholders organized under five cooperatives was the model for organizing small-holders farmers into large entities. Based on a price of 11 US cents per pineapple unit offered by Farmapine to its outgrowers, it estimated that its outgrowers between 1999 and 2004 realized direct sales of USD 3.1 million. In widening net gains by smallholder, it is estimated that they obtained about USD 3.8 million from supplying pineapples to fresh pineapple exporters in just 2004. Under the MCA Program, close to over 1 600 farmers in Akuapim South district were identified and registered as outgrowers formally engaged in the production of pineapples. However Farmpine was unable to withstand the MD2 shock.
It is clear that while the bigger producers have weathered the MD2 shock, they are still very uncompetitive. The productivity of Ghana farms is 60 T/Ha compared to 120 T/Ha for Cost Rica which also enjoys a much higher quality as attested by export yield of 85 percent compared to 65 percent for Ghana.
A strategy that targets high end niche markets is the most viable alternative for the Ghana export sector to overcome the huge disadvantage in productivity. Indeed, the biggest winners have been the niche marketers. Our analysis shows that fairtrade certification has been a key determinant of good export performance and indeed the top six large exporters are fairtrade certified while fresh cut pineapple exporters have seen sales volumes have increased threefold the period after the MD2 shock. The result of better performance of niche marketers has been the fact that fall in receipts of pineapple exports has been less than fall in volumes.
It goes without saying that infrastructure and finance for the sector are critical going forward. Every hour of delay in cooling can lose shelf life by one day in EU (Fould and Gough 2008). Further estimates puts fruits lost due to rough roads at 10 percent. Some intervention specific to pineapple industry include support in development of cold chains from farm to port. Tax breaks and subsidies on refrigeration equipment is a potential intervention.
108 Analysis of the size and distribution of the impacts of agricultural trade at the firm and industry levels in developing countries
More innovative financing models are needed. The current model under Export Development Agricultural and Investment Fund (EDIAF) needs to be re-examined. The model which provides loans to agricultural export sector fails to address the critical market failure that makes bank not lend to agricultural sector in the first place. Under current arrangement EDIAF provides funds at subsidized interest rates (12.5 percent) but the loans are administered through commercial banks which collect 10 percent of the interest as fees (leaving 2.5 percent for EDIAF). However the banks are asked to bear the full risk. Banks are reluctant to lend EDIAF funds as they can lend their own funds at high interest rates which is commensurate with the risk they are taking. Banks thus tend to undersell the EDIAF facility. EDIAF has made the wrong assumption that liquidity is that issue while interviews with banks indicates that banks have cash. The challenge is the risk that comes to lending to the sector and EDIAF should be subsidizing the risk. A rethinking of the funding model so that EDIAF take a more venture capitalist approach is needed.
Going forward, Ghana should adopt a two pronged strategy mainly targeting niche export markets.
Support large scale commercial farms targeting organic and fairtrade market niches
Ghana should put more effort in supporting the emergence of large scale pineapple growers. It is clear that size and flexibility will continue to matter as the export markets continue to be dominated by a few supermarkets that demand consistent supply and flexibility.
Thus to stay competitive in export markets and be responsive to changing demand, the presence of large diversified multinational fruit companies is needed. Only a few supermarkets and retailers define the market for fruits in Europe. When Tesco, Marks and Spencer, and the other chains in Europe began demanding MD2, the Ghanaian exporters, and the industry as a whole went into a tailspin. Ability to work closely with these chains in defining standards or designing
products will be a key success factor for years to come. Therefore highly integrated producers like Del Monte, Dole etc. will continue to define the industry standards forcing small players to continue playing catch up. Their presence helps open markets and also develops export logistics that become available to industry as a whole. The Ghana pineapple industry relies on banana export logistics developed by Companie Fruitiere (a subsidiary of dole).62
However attracting the larger global fruit companies to set-up shop in Ghana will be an uphill struggle due the difficulty of acquiring an appropriate piece of land that is big enough to attract such concerns. Developing a package of incentives (including needed infrastructure and sophisticated financial sector) that will attract can be politically contentious63 and costly. This has all the same been done, as the presence of Companie Fruitiere (Golden Exotics) attests, and this path could therefore be pursued. However, this can only be a longer-term strategy.
In the short to medium term, supporting existing commercial farms to become bigger and more competitive in niche markets offered by fairtrade and organic certification seems to be the best strategy going forward. This can be implemented by building capacity in the sector through training, and by support in defraying the huge costs of going through the certification and auditing processes.
The government needs to upgrade the existing standards authority so that they can have the globally recognized credentials for certifying. Export Development Agricultural and Investment Fund (EDIAF) should develop special funding facilities to help firm become certified as organic or fairtrade.
62 Note that Golden Exotics, has built the banana export sector from almost nothing (first exports in 2006) to become the one of the leading exports commodity. This is a testimony to the power of integrated global fruits companies. Golden is established by Companie Fruitiere which is 40 percent owned by Dole.
63 There are already complaints that incentives (tax holidays and duty exemptions in imported inputs and equipment) given to attract cocoa processing companies have been too generous and given the benefits they bring.
109Chapter 4: Analysis of trade impacts on the fresh pineapple sector in Ghana
Support development of fresh cut pineapple exports industry
Perhaps the most dynamic sector in the wake of MD2 crisis was the development of a fresh cut fruits sectors using mostly the SC variety and sourcing from small-scale farmers. This sector has the best chance of keeping smallholders in the export sector.
Therefore, continued help to revamp the small-scale sector is needed. As fresh cut sector can use the SC variety that smallholder sector is conversant in growing, the greater effort will be in building trust between small producers and processors as the past experience that saw many smallholder left without market of SC has created a level of mistrust. There is need for development and enforcement of contract models and some kind of insurance to shield smallholders from opportunistic behaviour of processors. Some farmers claim that when processors have enough fruit they tend to have a higher level of rejection rate of fruit supplied by smallholders so that they do not have to pay. An independent testing and measuring body is needed to guarantee farmers get their due and to reduce mistrust.
Selling fresh fruits to supermarkets chains has very strict and exacting requirements to guarantee product safety. However, interviews with stakeholders indicate that some the challenges facing the sector include:
• Testing and Certification (to sell to European markets)
- It costs more to get a thermometer certified by Ghana Standards Authority(GSA) than it cost to buy a new thermometer in Europe.
- GSA collects samples and stores them at room temperature and it takes 21 days to get results, yet the products need to be refrigerated and have a 7 days shelf life.
- Yearly certification from EU is required which costs about EU 10 000 to bring auditors from Europe. If Ghana
Standards Authority can be accredited to international standards, part of this cost can be defrayed. Ghana labelling requirements are higher than European, however, GSA is not very rigorous in testing the packaging containers.
• Logistics
- Traffic in Accra can cause serious delays; there is potential loss of EU 15 000 if a truck does not get to airport on time (plus cost of unhappy customers). Police escort in case of traffic emergency can help.
- There is only one cold room at the airport and this is set at one temperature yet different fruits require different temperature settings for optimum preservation for export. Thus, expansion of cold storage facilities at the airport is needed.
Limitations and future research
The present analysis sought to evaluate the impact of trade on Ghana pineapple exports. Unlike previous analysis, the present work stands out by its rigorous analysis using firm level data. However, the quality of the data prevented the inclusion of all possible determinants in the analytical model. In fact, the trade impact was estimated by comparing trade outcomes between pineapple exporting and non-exporting firms before and after the year of the trade shock. However, ignoring the extent to which non-exporting firm interact with exporting ones could have undermined the robustness of the analytical results. Some non-exporting firms could be indirectly exporting by supplying pineapples to exporting firms and thus may be victim of second order trade effects. Unfortunately, limited information on the different actors involved in each firms supply chain did not fully reveal these effects.
Second the lack of reliable data on smallholder pineapple farmers involved in exports limited the paper from expanding its trade impact analysis to pineapple producers. The lack of flexibility among
110 Analysis of the size and distribution of the impacts of agricultural trade at the firm and industry levels in developing countries
smallholder farmers to quickly switch to MD2 has been identified as one of the main reasons behind the collapse of the industry. The data limitation obscures the determinants of this lack of flexibility which could have guided the design of applicable policy deliberations. Also the change in the market structure of exporting firms imposed greater oligopolistic pressures on smallholder farmers who in exchange saw their influence in price determination vanished. In the past farmers had a choice between a large number of exporting firms. But now their bargaining power has dropped along with the reduced number of firms and the data was too weak to capture this effect.
For future research, evaluation of innovative activities that firms do to reduce their vulnerability to trade shocks is important. Innovation and adoption of new technologies are one of the most effective ways to keep a business strong and resilient against shocks. It is therefore important to carefully study these innovative activities and initiatives and measure the extent to which they have helped existing pineapple firms weather the effect of trade shocks and why other firms did not adopt them. For the case of pineapples, all of the exporters now produce their own pineapples and no longer rely on smallholder farmers. Is this an optimal adaptation strategy? What can policy do to allow smallholders to re-enter the export market? These are key questions to be answered.
References
Afari-Sefa V. 2007. The dynamics of horticultural export value chains on the livelihood of small farm households in Southern Ghana. African Journal of Agricultural Research Vol. 2 (9), pp. 435- 440.
AMEX International. 2003. An Appraisal of the Ghana Pineapple and Mango Industries: Opportinities and Challenges. USAID Ghana Trade and Investment Programme, Accra 2003.
Barrett, H. & Browne, A. 1996. Export horticultural production in sub-Saharan Africa. The incorporation of the Gambia, 1996.
Cassidy, M. & O’Brien, D. 2005. Export Performance and Competitiveness of the Irish Economy 2005. Quarterly Bulletin No. 3.
Dixie, G & Sergeant, A. 1998. The Future of the Ghanaian Horticultural Industry. Accord Associates, 1998.
Easterling, T., Fox W.J. & Sands B.F. 2008. Factors affecting economic growth in Ghana: Bases for a new USAID approach to economic growth. Sibley International
Federation Associations of Ghanaian Exporters. 2009. Market intelligence report in pineapple. Federation Associations of Ghanaian Exporters and United States Agency for International Development 2009.
Institute of Statistical Social and Economic Research. 2010. State of the Ghanaian Economy in 2009. Institute of Statistical Social and Economic Research Accra, 2010.
Jaeger, P. 2008. Ghana exports horticulture cluster strategic profile study-scoping review. Prepared for Worl Bank Sustainable Development Network (WD-SDN), Africa Region Agriculture and Rural Development (AFTER), Ministry of Food and Agriculture (MoFA), and all ACP agricultural Commodities Programme (EU-AAACP) 2008.
Ketels, C. 2010. Export Competitiveness: Reversing the Logic. Harvard Business School Working Knowledge weekly newsletter. Harvard Business School, 2010.
Korboe, K. 2010. Impact of Donor Support on the Horticulture Export Sector in Ghana 1994 – 2009. Thesis submitted to the University of Ghana towards award for M.A. Economic Policy Management
Ministry of Food and Agriculture. 2007. Food and Agriculture Development Policy (FASDEP II) Accra : Republic of Ghana, 2007.

111Chapter 4: Analysis of trade impacts on the fresh pineapple sector in Ghana
Ministry of Food and Agriculture. 2004. Horticulture Export Industry Initiative Detailed Work plan. Ministry of Food and Agriculture, Accra 2004.
Sackey, H.A. 2001. External Aid Inflows and the Real Exchange Rate in Ghana. The African Economic Research Consortium, Nairobi 2001.
Sesay, A.A. 2006. The Expansion of a Pineapple Plantation in Ghana. Eastern Mediterranean University Cyprus, 2006.
Technoserve. 2004. Study of Mango Industry in Northern Ghana Technoserve, Z 75 Volta street Accra , 2004.
Todaro. M.P. & Smith, S.C. 2008. Economic Development . Addison - Wesley, 2008. 10th Edition.
United Nations Conference on Trade and Development. 2008. Export competitiveness and development in LDCs: policies,issues and priorities for least developed countries for action. United Nations Conference on Trade and Development, Geneva, 2008.
Voisard, J.M. & Jaeger, P. 2003. Ghana Horticulure Sector Development Study. World Bank, 2003.
Whitfield, L. 2010 Pineapple Export Industry in Ghana. Production and Poverty research programme. Elites, Accra, 2010.
Whitfield, L. 2011. DIIS Working Paper 2011:29 Political Challenges to Developing Non-Traditional Exports in Ghana: The Case of Horticulture Exports
Winogrond, W. Barinkova S., Martirosyan, K., 2006. Fresh Produce Market Competitiveness Study. Abt Associates Inc. Suite 600, 4800 Montgomery Lane, Bethesda, MD 20814-5341, 2006.


113Chapter 5: Market structure and distribution of benefits from agricultural exports: The case of the Philippine Mango Industry
CHAPTER 5: MARKET STRUCTURE AND DISTRIBUTION OF BENEFITS FROM AGRICULTURAL EXPORTS: THE CASE OF THE PHILIPPINE MANGO INDUSTRY *
* This chapter was written by Roehlano M. Briones (Senior Research Fellow, Philippine Institute for Development Studies), Peter A. Turingan, (Supervising Legislative Staff Officer, Senate Economic Planning Office, Republic of the Philippines), and Manitra A. Rakotoarisoa (Economist, Trade and Markets Division, FAO).
5.1 Introduction
Overview
The Philippines derives considerable export revenues from agriculture. As of 2011, agricultural exports reached USD 5.9 billion, equivalent to 10.7 percent of total exports. Among food exports, the single biggest source of earnings is edible fruits, valued at USD 940 million.
The tropical fruit industry in the country has had a long history of globalization, both in terms of trade and foreign direct investment. Globalization critics have long suspected that the benefits of the world trading system are confined to only a few large companies, i.e. transnationals and their local allies. On the other hand the benefits from the export market may turn out to be widely diffused over the supply chain, reaching numerous small and medium enterprises and growers. A study of the role of market structure in the distribution of export benefits would illuminate the contribution of the agro- export industry in inclusive growth.
This study examines the case of the Philippine mango industry, the third largest fruit export of the country after banana and pineapple. A diverse set of market players are active in the export trade. The mango industry is a case study of a dispersed industrial organization, in contrast to banana and pineapple, which tend to be dominated by large agribusiness interests.
Aims and scope
The case study approach will rely on quantitative and qualitative information, derived from desk review, focus group discussions, and key respondent interviews, using both structured questionnaires and informal question guide. The objectives are three-fold:
1. Characterize the mango export industry at the institution, industry, and firm levels.
2. Provide qualitative analyses of the main determinants of the level and distribution of trade benefits among firms.
3. Undertake quantitative analyses of the main determinants of the level and distribution of trade benefits among firms.
Subject to data availability, characterization and qualitative analysis would cover the following:
• Identify the size of the tropical fruits export industry (in comparison with other agricultural exports); sources of the export ability of the industry (regulations, comparative advantage, or abundance in factor endowment).
• Describe the industry and its firms and their link to the country’s agricultural sector and economic activity.

114 Analysis of the size and distribution of the impacts of agricultural trade at the firm and industry levels in developing countries
• Identify exporting firms; their input and output markets; degree of integration; input sources; market destinations; market shares;
• Determine the level of industry concentration; level of competition among firms; market power; entry and exit rates.
• Identify the exporters’ strategies to ‘win’ over the importers and the strategies when dealing with inputs and service providers; the size and distribution of the trade gain.
• Document past experiences, if any, when these exporters’ strategies worked and effectively enhanced trade gains for exporting firms and influenced the distribution of trade benefits.
• Discuss all possible factors, including organization and conduct, that influence the level and distribution of trade benefits among the heterogeneous firm.
• Describe how trade benefits spill from the trading firms to their upstream or downstream domestic links.
• Provide implications of the findings for the distribution of potential trade gains on upstream and downstream links.
Accordingly, the following will be discussed in relation to the quantitative analysis:
• Determine what influences the level and distribution of trade benefits among firms and industries; particular focus will be on the role of organization and behaviour of trading firms.
• Discuss the implications of the findings for enhancing the ability of trading firms and their upstream and downstream links to capture trade benefits and opportunities.
The remainder of the report is organized as follows: Section 2 characterizes the industry and based on review of industry trends and previous research. The case study method is described in Section 3, which discusses valid and tractable indicators of trade benefits that arise from the data. Key findings are presented Section 4. Section 5 summarizes and discusses implications for enhancing ability of firms to capture benefits from exporting.
5.2 Philippine mango industry: review of past trends and studies
Trends
The Philippine mango industry has been consistently expanding, judging by trends in area harvested (Figure 5.1). From below 80 000 ha in 1990, area has been increasing, approaching 200 000 ha by 2009. Initially, yield was also increasing, from 6 t/ha in 1990 to 8 t/ha in 1997, before plummeting to current levels of only 4 t/ha. Aggregate production reached 1 million tonnes in the late 1990s (Figure 5.2), and again in 2007, before dropping to below 800 000 tonnes in 2011. Climate and pests remain major drivers of production; in 2008 for instance the drop in production was traced to typhoons, wind damage, anthracnose, bacterial wilt, fruit flies, and leaf hoppers, according to Bureau of Agricultural Statistics or BAS (2008).
The climatic conditions for mango production are summarized as follows (Bally, 2006, p. 7):
Mango grows over a wide range of frost-free climates. The trees produce best in climates that have a well defined, relatively cool dry season with high heat accumulation during the flowering and fruit development period. Rain or free moisture (high humidity, heavy dew, and fog) during the flowering and fruiting period is conducive to the development of fungal diseases that cause flower and fruit drop.
Climate and geography of the Philippines is described in Box 5.1. Luzon possesses the climate ideal for mango growing; according to Figure 5.2, Luzon is by far the largest producer, with more than half of its output coming from Ilocos Region. The bulk of Luzon’s output is harvested during the hot dry season of March to May. Year-round production is obtained from Visayas and Mindanao. Mindanao has the unique advantage of being mostly free from the typhoons, which routinely strike about twenty times a year in the

115Chapter 5: Market structure and distribution of benefits from agricultural exports: The case of the Philippine Mango Industry
The Philippines is divided into three major island groups: Luzon, Visayas, and Mindanao, respectively: North, Central, and Southern Philippines. The north and central part is affected by monsoon rainfall beginning about May – June up to October – November, with a dry season from December to April. The northwestern part has a more pronounced dry and wet pattern compared to the rest of the country. The eastern part has no dry season but has a pronounced rainy season in December to February. Mindanao is characterized by uniform rainfall year-round. The rainy season is accompanied by typhoons (averaging twenty per year); which pass through a typhoon belt that basically bypass Mindanao.
Each island group is divided into administrative regions, the Ilocos Region highly suitable for mango growing. The list of regions of
the Philippines is as follows:
LUZON
NCR: National Capital Region (Metro Manila)
CAR: Cordillera Administrative Region
Region I: Ilocos
Region II: Cagayan Valley
Region III: Central Luzon
Region IVA: CALABARZON
Region IVB: MIMAROPA
Region V: Bicol Visayas
Region VI: Western Visayas - Region VII: Central Visayas
Region VIII: Eastern Visayas Mindanao
Region X: Northern Mindanao
Region XI: Davao
Region XII: Central Mindanao (SOCCSKSARGEN)
Region XIII: Caraga
ARMM: Autonomous Region in Muslim Mindanao
Box. 5.1
The Philippines
Figure 5.1: Area (in ‘000 ha) and yield (t/ha) of mango,
1990 – 2010
Figure 5.2: Mango production in the Philippines by
island group, 1990 - 2011 (‘000 t)
Source: CountrySTAT Source: CountrySTAT
0
1
2
3
4
5
6
7
8
9
0
40
80
120
160
200 Yield Area
2010
2008
2006
2004
2002
2000
1998
1996
1994
1992
1990
0
200
400
600
800
1000
1200Mindanao
Visayas
Other Luzon
Ilocos Region
2010
2008
2006
2004
2002
2000
1998
1996
1994
1992
1990
Source: http://kidlat.pagasa.dost.gov.ph/cab/climate.htm; Bally (2006)

116 Analysis of the size and distribution of the impacts of agricultural trade at the firm and industry levels in developing countries
rest of the country.Exports of mango by volume took off in the
1990s (Figure 5.3). Even at peak exports, the domestic market still absorbed 95 percent of domestic production. Note that mango exports followed overall trends in production in the 1990s; however in the 2000s, mango exports fell off quite steeply in terms of volume.
A different story emerges however from considering export value (Figure 5.4), which suggests a shift from exports of fresh mango towards the more rapidly growing processed sector (Digal and Concepcion, 2004). There is no clear declining trend in the 2000s, but rather one of fluctuation; the year of peak production (2007) does not coincide with the highest export earnings, which in fact peaked in 2011, approaching USD 100 million. The country’s mango industry has achieved such spectacular growth owing to a robust world market together with a shift in higher value products.
By destination, the biggest markets have traditionally been Japan followed by Hong Kong. In the last few years though, export markets have diversified quite dramatically, with the US now being the biggest market destination, though Japan and Hong Kong continue to command significant export shares.
Farming practices
Mango production is input-intensive (Table 5.1). Farm inputs take up nearly a third of production cost; imputed costs of labor and capital account for another third. Profit per kg is P10.00.
Production is typically small-scale; in the last agricultural Census (2002), average farm size nationwide was only 1.64 ha (Figure 5.5). There are however large variations across regions: the largest farm sizes are found in Mindanao (in the 2 to 4 ha range, except for Autonomous Region in Muslim Mindanao or ARMM). Farm sizes in Ilocos Region (1.2 ha) are even lower than the national average.
A mango industry survey reported in BAS (2002) covers 200 farms, found in all the island groups (Table 5.2). Nearly three-quarters have farms of under 1 ha, while only 6 percent farm above 5 ha. The vast majority (over four-fifths) own their own mango farms, whereas tenants account for only 12 percent.
Farmers enter into three main types of contracts (De la Cruz, 2007):
Leasehold – the owner agrees to lease trees to a producer, who undertakes all commercial activities
Figure 5.3: Area (in ‘000 ha) and yield (t/ha) of mango,
1990 – 2010
Figure 5.4: Mango production in the Philippines by
island group, 1990 - 2011 (‘000 t)
0
10000
20000
30000
40000
50000 Other countries
Hong Kong, China
Japan
United States of America
2011
2010
2009
2008
2007
2006
2005
2004
2003
2002
2001
Note: Mangosteen and guava exports are negligible
Source: Trademap (www.trademap.org)Source: FAOStat
0
10000
20000
30000
40000
50000
60000
2006
2002
1998
1994
1990
1986
1982
1978
1974
1970
1966
1962
Mangoes, mangosteens, guavas
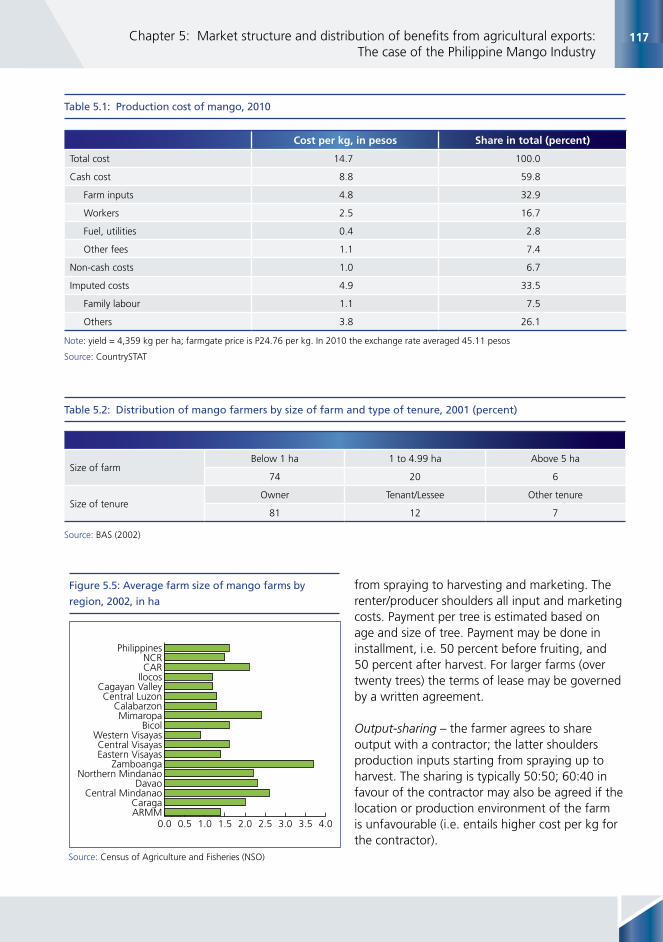
117Chapter 5: Market structure and distribution of benefits from agricultural exports: The case of the Philippine Mango Industry
from spraying to harvesting and marketing. The renter/producer shoulders all input and marketing costs. Payment per tree is estimated based on age and size of tree. Payment may be done in installment, i.e. 50 percent before fruiting, and 50 percent after harvest. For larger farms (over twenty trees) the terms of lease may be governed by a written agreement.
Output-sharing – the farmer agrees to share output with a contractor; the latter shoulders production inputs starting from spraying up to harvest. The sharing is typically 50:50; 60:40 in favour of the contractor may also be agreed if the location or production environment of the farm is unfavourable (i.e. entails higher cost per kg for the contractor).
Figure 5.5: Average farm size of mango farms by
region, 2002, in ha
Source: Census of Agriculture and Fisheries (NSO)
Cost per kg, in pesos Share in total (percent)
Total cost 14.7 100.0
Cash cost 8.8 59.8
Farm inputs 4.8 32.9
Workers 2.5 16.7
Fuel, utilities 0.4 2.8
Other fees 1.1 7.4
Non-cash costs 1.0 6.7
Imputed costs 4.9 33.5
Family labour 1.1 7.5
Others 3.8 26.1
Table 5.1: Production cost of mango, 2010
Note: yield = 4,359 kg per ha; farmgate price is P24.76 per kg. In 2010 the exchange rate averaged 45.11 pesos
Source: CountrySTAT
Size of farmBelow 1 ha 1 to 4.99 ha Above 5 ha
74 20 6
Size of tenureOwner Tenant/Lessee Other tenure
81 12 7
Table 5.2: Distribution of mango farmers by size of farm and type of tenure, 2001 (percent)
Source: BAS (2002)
0.0 0.5 1.0 1.5 2.0 2.5 3.0 3.5 4.0ARMMCaraga
Central MindanaoDavao
Northern MindanaoZamboanga
Eastern VisayasCentral Visayas
Western VisayasBicol
MimaropaCalabarzon
Central LuzonCagayan Valley
IlocosCARNCR
Philippines

118 Analysis of the size and distribution of the impacts of agricultural trade at the firm and industry levels in developing countries
Contract buying – the contractor simply purchases fruit from the farmer at pre-determined rates; however the buyer is not involved in production. The agreement may be reached at the fruiting stage, or around harvest season.
The contracts differ in risk exposure and asset protection. Leasehold offers the least risk to farmers, but also the least protection of their assets – the lessor may “abuse” the trees by over-spraying, while the lessee has difficulty monitoring such behaviour. Contract buying offers maximum protection for the trees and land, but also shifts risk entirely on the farmer. Output sharing appears to be the middle ground to balance risk and asset protection, and has emerged as a “very popular” form of production contract.
Value chain
Summarizing previous studies, Digal (2005) describes the various marketing channels for the mango value chain (Figure 5.6). The farmer may sell directly to an exporter or even the consumer (especially for small local markets); however the
most common route is through a contract buyer. From the buyer the product passes through either a wholesaler-retailer, or wholesalers, who then send the product to a retailer or to an exporter.
One complication is the introduction of processing (dried mango, mango juice, mango pulp), which caters to the export or domestic market. Furthermore between the farmer and retailer there may be multiple layers of traders as described in BAS (2002). The categories are:
• Assembler: focuses on procurement from farmers or other traders; typically sells to one (primary) buyer. Can be distinguished by geographic level of sources: barangay, municipal, provincial, regional, interregional.
• Distributor: focuses on selling to multiple buyers. Can be distinguished by size, i.e. small, medium, and large distributor.
• Assembler-distributor: equal attention to procurement and sales. Can distinguish both by level of procurement operation, and size.
Figure 5.6. Marketing channels for the mango value chain
Source: Adapted from Digal (2005)
Retailer
Wholesaler
Contract Buyer
Wholesale Retailer
Exporter
Consumer
Farmer

119Chapter 5: Market structure and distribution of benefits from agricultural exports: The case of the Philippine Mango Industry
Digal (2005) provides a simple breakdown of the price margins for mango, with a comparison with the export price (Table 5.3). Note that the export price has only a slight edge over the retail price. The price differential accounts for 27 percent of the retail price and as much as 44 percent of the wholesale price.
The differentials may be explained at least in part by marketing costs, described in detail in BAS (2002) based on a marketing cost survey. Marketing costs incurred by traders within a province (transportation, labor, materials, etc.) are shown in Table 5.4. The shares appear to be sizable relative to the farmgate price. Davao City has the highest cost owing to the airplane fare for transport to Metro Manila markets. Pangasinan cost is high owing to high cost of depreciation and labor; for Guimaras the largest cost components are miscellaneous expenses, materials, and labor.
A more recent survey on marketing costs is reported in Sarmiento et al (2012). Their study
highlights the role of the export trader, as their pricing is higher compared with that of the local trader, inducing growers to improve the quality of their produce to export grade. The survey is limited to Davao City, Digos City (in Davao del Sur province), and Island Garden City of Samal (IGACOS, an island accessible by short boat trip from Davao City). The net margins by stage of the marketing chain are summarized in Table 5.5. In Davao City, retailers earned the highest margins; the city hosts large markets such as Bankerohan. In Digos City meanwhile, wholesalers earn the highest net margin owing to proximity to mango growers in Davao del Sur, reducing their transport costs. In IGACOS, it is the farmers which earn a higher net margin compared to retailers (no wholesalers operate in the area). The markets stalls in the area are still small; most of the mangoes are shipped directly to Davao City and other neighboring provinces.
Price USD Margin (over previous level)
Export (f.o.b.) 0.84 not available
Retail 0.81 27
Wholesale 0.59 44
Farm 0.33 not applicable
Table 5.3: Price margins for mango by market level, in percent, 2002
Source: Digal (2005)
Cash cost Non-cash cost TOTAL Farmgate price
Pangasinan, Ilocos 5.25 3.25 9.02 21.25
Guimaras, Eastern Visayas 5.77 3.25 9.02 24.51
Iloilo, Eastern Visayas 4.76 0.40 5.17 20.33
Cebu, Central Visayas 3.37 0.10 3.47 22.74
Davao City, Davao 10.02 0.01 10.03 14.41
Davao del Sur, Davao 4.16 0.04 4.2 21.35
General Santos, SOCCSKSARGEN 3.29 0.08 3.37 13.59
Table 5.4: Marketing costs and farmgate price of mango in selected provinces, in P/kg (2001)
Note: The exchange rate in 2001 was P51/$1
Source: BAS (2002)

120 Analysis of the size and distribution of the impacts of agricultural trade at the firm and industry levels in developing countries
Export business
Aveno and Orden (2004) describe the business of four exporters operating in Luzon. Peak export months are from March to May; canvassing for supplies begins in December. Procurement is done through roving agents, though growers/cooperatives are also entertained.
A farmer may opt for classified pricing, in which mango pieces are sorted for export and local grade; the alternative is straight pricing, in which no sorting is done and payment is made according to total quantity. Export grade mangos should meet quality requirements, i.e. maturity, absence of scabs, molds, burns, marks, and scratches; fruits are further distinguished by size, i.e. small, medium, large, and extra large.
Fatajo et al (2006) discuss the Hong Kong export market. One motivation to export to Hong Kong is the absence of tariff or taxes in that city state; its regulatory imposition is modest, requiring only certification of fitness for human consumption from the Department of Health. Prices are predetermined by the exporter and consignee (the importing agent) before shipment. The landed cost of the fruit in Hong Kong was equivalent to P66 per kg in March 2002; at peak shipment (April and May) the price can drop to as low as P35 per kg, but can rise to 133 per kg from February to September.
A comprehensive value chain analysis is available for the processed mango industry as of
mid-2000s (Pearl2 Project, 2004). The industry is composed of a variety of products including dried mango, puree, juice, nectar, slices, and halves. Processed mango exports are dominated by dried mangoes, accounting for 46 percent by value; this is followed by puree, accounting for 40 percent. Processors are actively introducing new products such as fruit blending (i.e. mango and tamarind), mango leather (dried puree), etc.
Most firms are small- and medium-sized. There are about 85 mango processing firms, majority of whom (66 percent) produce puree, and are clustered in Metro Manila. Thirteen firms, mostly processors of dried mango, are in Cebu. Numerous small processors specializing in other mango products such as sauces and preserves operate in and around Metro Manila and Metro Cebu. Fresh mango for processing is typically procured from the “open market”. Only 23 percent of processors obtain mango from their own farm or by contract arrangements.
Philippine mango is well known worldwide for superior taste, which carries over into the processed product. This corresponds to a price premium over its major competitors, namely Thailand, followed by India, China, Malaysia, Vietnam, and Indonesia. However competitiveness can be improved by reducing the cost of raw materials, especially mangoes and sugar. The report identifies the major issue of the industry being the “lack of good-quality mangoes at reasonable prices”.
NPrice (P/kg)
Net margin (P/kg)
Davao City Farmer 21.66 2.83
Wholesaler 40.00 14.96
Retailer 50.00 19.72
Digos City Farmer 22.83 6.35
Wholesaler 35.00 17.35
Retailer 52.50 16.15
IGACOS Farmer 20.60 8.93
Wholesaler n/a n/a
Retailer 45.00 4.41
Table 5.5: Net margins by stage of marketing chain, selected locations
Source: Sarmiento et al (2012)
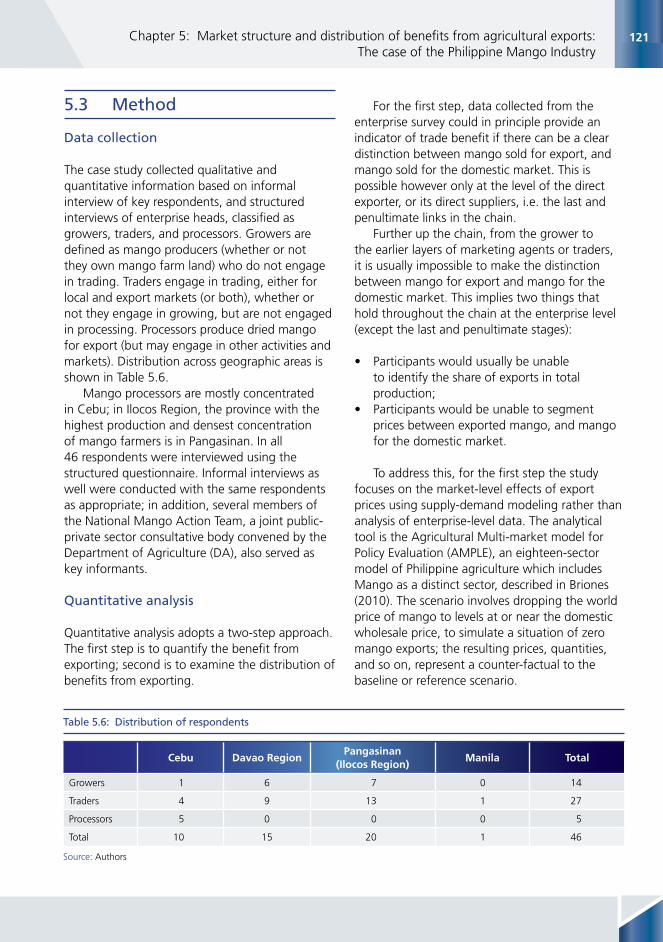
121Chapter 5: Market structure and distribution of benefits from agricultural exports: The case of the Philippine Mango Industry
5.3 Method
Data collection
The case study collected qualitative and quantitative information based on informal interview of key respondents, and structured interviews of enterprise heads, classified as growers, traders, and processors. Growers are defined as mango producers (whether or not they own mango farm land) who do not engage in trading. Traders engage in trading, either for local and export markets (or both), whether or not they engage in growing, but are not engaged in processing. Processors produce dried mango for export (but may engage in other activities and markets). Distribution across geographic areas is shown in Table 5.6.
Mango processors are mostly concentrated in Cebu; in Ilocos Region, the province with the highest production and densest concentration of mango farmers is in Pangasinan. In all 46 respondents were interviewed using the structured questionnaire. Informal interviews as well were conducted with the same respondents as appropriate; in addition, several members of the National Mango Action Team, a joint public-private sector consultative body convened by the Department of Agriculture (DA), also served as key informants.
Quantitative analysis
Quantitative analysis adopts a two-step approach. The first step is to quantify the benefit from exporting; second is to examine the distribution of benefits from exporting.
For the first step, data collected from the enterprise survey could in principle provide an indicator of trade benefit if there can be a clear distinction between mango sold for export, and mango sold for the domestic market. This is possible however only at the level of the direct exporter, or its direct suppliers, i.e. the last and penultimate links in the chain.
Further up the chain, from the grower to the earlier layers of marketing agents or traders, it is usually impossible to make the distinction between mango for export and mango for the domestic market. This implies two things that hold throughout the chain at the enterprise level (except the last and penultimate stages):
• Participants would usually be unable to identify the share of exports in total production;
• Participants would be unable to segment prices between exported mango, and mango for the domestic market.
To address this, for the first step the study focuses on the market-level effects of export prices using supply-demand modeling rather than analysis of enterprise-level data. The analytical tool is the Agricultural Multi-market model for Policy Evaluation (AMPLE), an eighteen-sector model of Philippine agriculture which includes Mango as a distinct sector, described in Briones (2010). The scenario involves dropping the world price of mango to levels at or near the domestic wholesale price, to simulate a situation of zero mango exports; the resulting prices, quantities, and so on, represent a counter-factual to the baseline or reference scenario.
Cebu Davao RegionPangasinan
(Ilocos Region)Manila Total
Growers 1 6 7 0 14
Traders 4 9 13 1 27
Processors 5 0 0 0 5
Total 10 15 20 1 46
Table 5.6: Distribution of respondents
Source: Authors
122 Analysis of the size and distribution of the impacts of agricultural trade at the firm and industry levels in developing countries
For the second step, distribution of benefit from export trade is analysed at the firm level using micro-data from the enterprise survey. Analysis focuses on the relationship between an indicator of benefit from exporting and indicator of enterprise size – conditional on a positive relationship, the greater the impact of enterprise size on benefit from exporting, the less equitable the distribution of trade benefit.
The ideal firm-level indicator is the impact of export trading on enterprise income or profitability. However, within the limited time frame of the study, measuring profit at the enterprise level would be time consuming as this would require information on cost. This does not seem necessary for two reasons:
• There seems to be no separate production technology targeting the export market; rather a set of good practices that produce high quality mango either for domestic or export market.
• There is relatively adequate information from previous studies reviewed in Section 2 for production cost and returns throughout the marketing chain.
Instead of differences in profitability, the study focuses on the difference in revenue due to exporting. However this confronts another difficulty, the widespread practice of “all-in” pricing mixes together both domestic grade and export grade mango, under a single price. Hence high export prices can indirectly affect the average price along the chain. This implies market segmentation between export and domestic outlets, with the former commanding a higher price, but imposing more stringent entry barriers in the form of quality standards and sales networks. Larger firms may have greater capability to overcome these entry barriers, allowing them to sell a larger share of output to the export market.
In short, a suitable indicator of trade benefit is average price or unit revenue:
Given the cross-section nature of the data, the most important factor distinguishing unit revenue across firms, is access to the export market.
Exporting allows the enterprise to gain access to a premium price, hence increasing unit revenue.
Hypotheses for quantitative analysis
The first key hypothesis of the study pertains to horizontal structure: the bigger the firm, the greater the unit revenue. The implication of this for equity is that the bigger firms are better able to gain access to a lucrative export market. The indicator of enterprise size is value of fixed assets.
The second pertains to vertical linkages: relationship-based supply or purchase transaction promotes greater access to the export market and therefore higher unit revenue. The indicator of vertical linkages, denoted “Relation”, pertains to a relationship-based supply or buying arrangement, or outright vertical integration (i.e. a grower-trader). This is represented as a binary variable (value of 1 for vertical linkages and zero for spot market transactions.) The presence of vertical linkages allows greater control over product quality, which facilitates exporting.
The relationship between revenue per kilogram (RKG) and enterprise size and vertical linkages is initially explored using simple summary charts. This is complemented by multiple regression analysis, incorporating other control variables such as characteristics of enterprise head (years of schooling, and years of experience in mango business). With unit revenue as the dependent variable, an important set of controls relates to indicators of market segmentation, both horizontal (e.g. type of product or market destination) and vertical (portion of the supply chain specialized). The segmentation leads to differences in unit revenue that embody the joint effects of both supply and demand factors.
For horizontal segmentation the relevant variables are:
• Processor (binary).• Fresh mango exporter to Japan or Europe
(binary; “Freshnorth”).
Unit revenue =Annual sales (in pesos)
Mango input (in kg)

123Chapter 5: Market structure and distribution of benefits from agricultural exports: The case of the Philippine Mango Industry
• Fresh mango exporter to other countries (binary; “Freshother”).
The prices commanded by Freshnorth are expected to be the highest, followed by Freshother, and then Processor.
For vertical segmentation the relevant variables are:
• Trader of fresh mango (binary).• Exporter, whether direct or indirect (binary).• Percent of output exported (continuous;
“Pctexp”).
Traders and Processors are expected to earn greater unit revenue than growers. The Exporter category tags firms that sell directly to a foreign buyer, or to an exporter; this is further qualified by Pctexp that measures the degree of participation in the export market. For Exporters and for higher Pctexp the unit revenue is expected to be higher. As discussed previously, the last two variables may be prone to measurement error.
5.4 Results
Benefits from exporting: national level analysis
As described in Section 4, the first step to analyzing benefits from exporting is a national level analysis using AMPLE. The AMPLE data set records exports of mango at 26 000 t (fresh weight equivalent), which is a 3-year average (2009-2011). This accounts for only 3 percent of total mango production of 795 000 t. Export price is about 210 percent higher than the estimated domestic wholesale price (P90 vs P43 per kg). As explained in Briones (2010), the supply for export and domestic markets are treated as differentiated goods, within a constant elasticity of transformation framework (fairly standard in computable general equilibrium models). Given the proportions involved, even a massive export price shock would likely have only small effect on market outcomes of the industry.
The AMPLE Reference scenario captures baseline trends for the agricultural sector and
Philippine economy, similar to that of Briones (2012). Projection occurs over the horizon 2010 – 2020. World mango prices in real terms are assumed to rise gently (by 0.5 percent per year in constant dollars) over the horizon. The comparison scenario involves reducing export price to levels that drive exports to approximately zero over the horizon. The shock introduced for 2010 is -32 percent, followed by fixed prices in real terms thereafter. The constant elasticity of transformation (CET) for mango is set at 2.0.
Results for mango exports are shown in Figure 5.7. Exports are projected to rise from 26 000 to 31 000 by 2020 corresponding to an annual growth of about 1.9 percent. Production is shown for both reference and no-export scenarios (Figure 5.8).
Production in the latter is uniformly lower by about 41 000 – 54 000 t or an average of 5 percent. Impact on producer prices is even less perceptible; on average producer prices are 0.3 percent lower in the alternative scenario. Clearly a more disaggregated analysis, focusing on the subset of firms that do gain significantly from exporting, is needed to better understand the importance and distribution of benefits of export trade. As a check, a sensitivity analysis is conducted by varying the CET for alternative values 3.0 (Figures 5.9 and 5.10) and 1.5 (Figures 5.11 and 5.12).
The reference scenarios (whether for output, exports, or producer prices) are almost identical regardless of the value for the CET. The differences appear in the impact alternative zero-export scenario. For CET = 3.00, export price needs to fall by only 19 percent (much smaller than the 32 percent decline with CET = 2); meanwhile for CET = 1.50, export price needs to fall by as much as 45 percent to approximate zero exports. For CET = 3.00, output under the alternative scenario rises to 888 000 tons (slightly above 880 000 tons projected under the alternative scenario when CET = 2.00). For CET = 1.5, output rises to 834 000 tons (slightly lower than when CET = 2.00). The differences in producer price between reference and alternative scenarios are likewise minimal regardless of the CET value.

124 Analysis of the size and distribution of the impacts of agricultural trade at the firm and industry levels in developing countries
Figure 5.7: Exports under the reference and alternative
scenario, ‘000 t
Figure 5.9: Exports under the reference and alternative
scenario, ‘000 t
Figure 5.8: Production under reference and no-export
scenarios, ‘000 t
Figure 5.10: Production under reference and no-export
scenarios, ‘000 t
Source: Authors
Note: CET = 2.00; export price falls by 32%
Source: Authors
Note: CET = 2.00; export price falls by 19%
Source: Authors
Note: CET = 2.00; export price falls by 32%
Source: Authors
Note: CET = 2.00; export price falls by 19%
0
5
10
15
20
25
30
35
Alternative Reference
2020
2019
2018
2017
2016
2015
2014
2013
2012
2011
2010
0
200
400
600
800
1000 Alternative Reference
2020
2019
2018
2017
2016
2015
2014
2013
2012
2011
2010
0
5
10
15
20
25
30
35 Alternative Reference
2020
2019
2018
2017
2016
2015
2014
2013
2012
2011
2010
0
200
400
600
800
1000 Alternative Reference
2020
2019
2018
2017
2016
2015
2014
2013
2012
2011
2010
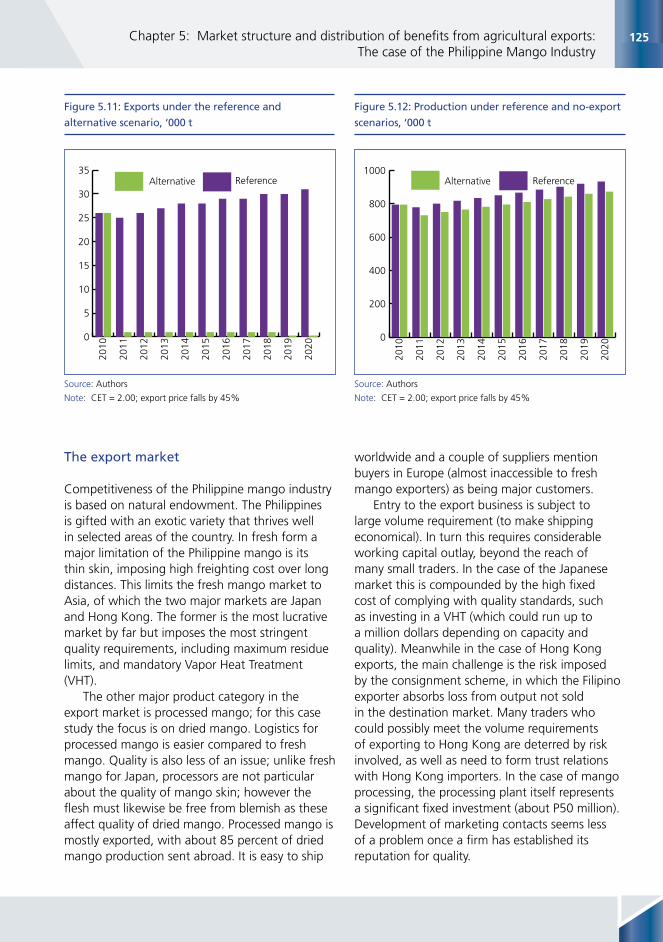
125Chapter 5: Market structure and distribution of benefits from agricultural exports: The case of the Philippine Mango Industry
The export market
Competitiveness of the Philippine mango industry is based on natural endowment. The Philippines is gifted with an exotic variety that thrives well in selected areas of the country. In fresh form a major limitation of the Philippine mango is its thin skin, imposing high freighting cost over long distances. This limits the fresh mango market to Asia, of which the two major markets are Japan and Hong Kong. The former is the most lucrative market by far but imposes the most stringent quality requirements, including maximum residue limits, and mandatory Vapor Heat Treatment (VHT).
The other major product category in the export market is processed mango; for this case study the focus is on dried mango. Logistics for processed mango is easier compared to fresh mango. Quality is also less of an issue; unlike fresh mango for Japan, processors are not particular about the quality of mango skin; however the flesh must likewise be free from blemish as these affect quality of dried mango. Processed mango is mostly exported, with about 85 percent of dried mango production sent abroad. It is easy to ship
worldwide and a couple of suppliers mention buyers in Europe (almost inaccessible to fresh mango exporters) as being major customers.
Entry to the export business is subject to large volume requirement (to make shipping economical). In turn this requires considerable working capital outlay, beyond the reach of many small traders. In the case of the Japanese market this is compounded by the high fixed cost of complying with quality standards, such as investing in a VHT (which could run up to a million dollars depending on capacity and quality). Meanwhile in the case of Hong Kong exports, the main challenge is the risk imposed by the consignment scheme, in which the Filipino exporter absorbs loss from output not sold in the destination market. Many traders who could possibly meet the volume requirements of exporting to Hong Kong are deterred by risk involved, as well as need to form trust relations with Hong Kong importers. In the case of mango processing, the processing plant itself represents a significant fixed investment (about P50 million). Development of marketing contacts seems less of a problem once a firm has established its reputation for quality.
Figure 5.11: Exports under the reference and
alternative scenario, ‘000 t
Figure 5.12: Production under reference and no-export
scenarios, ‘000 t
Source: Authors
Note: CET = 2.00; export price falls by 45%
Source: Authors
Note: CET = 2.00; export price falls by 45%
0
5
10
15
20
25
30
35 Alternative Reference
2020
2019
2018
2017
2016
2015
2014
2013
2012
2011
2010
0
200
400
600
800
1000 Alternative Reference
2020
2019
2018
2017
2016
2015
2014
2013
2012
2011
2010

126 Analysis of the size and distribution of the impacts of agricultural trade at the firm and industry levels in developing countries
Profile of exporters
Exporters whose destination market is Japan must have a VHT; the biggest clusters of VHT plants are found in the agro-industrial park of Food Terminal Inc. (FTI), a government-owned corporation. The park is located in the Taguig, eastern part of Metro Manila, in which there are only three locators.
For mango processing, there is one cluster located in Metro Cebu. About a dozen processors remain active; there is a single dominant firm, accounting for roughly 85 percent of output. The dominant firm has a capacity is 1 000 t of fresh mango input a day, whereas other processors can handle only a tenth of this; The dominant firm also produces puree and juice.
Characteristics of enterprise heads are summarized in Table 5.7. Most have been at least two decades in the business; processors are the oldest firms in the business. Enterprise heads have mostly reached tertiary level of education, with majority having finished college; processors also tend to have the most years of schooling.
Nearly half of the respondents got their start in the mango industry as part of the family business; the proportion rises to 60 percent for processors. Two-thirds of the respondents are members of a mango business association; the proportion rises to 100 percent in the case of the processors.
Majority of enterprise heads received technical assistance, mainly for mango production; however none of the processors received technical assistance. Respondents were not always able to pinpoint whether the technical assistance was from government or not; however a significant
number (5 out of the 26) specifically singled out chemical companies as source of technical assistance.
Two-thirds of enterprises were part of vertical commercial linkages. All the processors engaged in either or both contract buying and contract selling. As for the traders, as many as 21 out of the 27 are also growers, implying vertical integration between production and marketing; the rest of the 27 were engaged in informal contracts for purchasing mangoes.
Lastly, a small proportion (3 out of 14) of growers were also contracted as regular suppliers. Of these, only two out of the three receive advances for materials from the buyer. Many of the traders report having engaged in such “putting out” contracts in the past, but had discontinued these contracts due to difficulty in recovering their advances. Hence supply arrangements gravitate to either spot contract or outright integration.
Challenges of exporting
As discussed in Section 2 there is considerable benefit from exporting, for the few enterprises that manage to break through to the export market. Exporting however faces some daunting challenges. First, as in selling to the domestic market, mango exporting is subject to seasonality of supply. Luzon harvest season of March to May requires large capacity of VHT plant to handle deliveries; for the rest of the year though equipment is largely idle. During off-season, supplies must come from Visayas and Mindanao. Similarly, processors have to contend with
Category NumberYears in business
Years schooling (average)
Started in family business
(number)
Membership in association
Had technical assistance (number)
With vertical linkage
Processor 5 31 15 3[ 60] 5 [100] 0 [0] 5 [100]
Trader 27 19 13 12 [44] 15 [56] 16 [59] 10 [37]
Grower 14 26 15 7 [50] 11 [79] 10 [71] 4 [28]
Total 46 23 14 22 [48] 31 [67] 26 [56] 19 [46]
Table 5.7: Characteristics of enterprises average and enterprise heads
Source: Authors

127Chapter 5: Market structure and distribution of benefits from agricultural exports: The case of the Philippine Mango Industry
seasonality. Capacity is expanded to accommodate the Luzon harvest (which arrives with little difficulty in Cebu). During the lean months however, processor’s agents must comb the Visayas and Mindanao regions to gather enough raw material.
In general, the main constraint identified by the Pearl2 (2004) report, applies even today and for both fresh and processed mango: exporters and traders mostly identify adequacy of supply of export grade mango as a constraint. Processors in particular are unconstrained by lack of orders from importers; rather lack of raw material compels them to turn down purchase orders from their buyers. Likewise growers mention difficulties in maintaining output levels, mentioning pest infestation and bad weather as culprits.
The second main problem is high cost of inputs. One trader was vocal in attributing high cost of inputs to government regulation, mainly in the form of regulatory barriers imposed by the Fertilizer and Pesticide Authority (FPA, an attached agency of DA). Among processors, high cost of sugar (a major input in dried mango production) has also been cited as a problem. This in turn is traced to high tariffs and regulatory barriers to sugar importation. Moreover, destination countries (such as China) would themselves maintain trade barriers against Philippine mango
products, as reciprocity to similar trade barriers imposed by the Philippines on destination country exports (such as vegetables from China).
Lastly, for the processed sector, recognition in a crowded world market for preserved fruit requires more than just capitalizing on the superior taste of Philippine mango. Processors need to maintain high quality and offer variety of export items, which entails continuous research and product development. This is most evident in the dominant firm, which produces a wide array of products in its dried line, not to mention extensive offerings in its juice and puree lines.
Distribution of benefits from exporting: enterprise-level analysis
The following presents findings on distribution of benefits from exporting based on a more systematic quantitative analysis. Consider first a scatterplot between enterprise assets and unit revenue (Figure 5.13). Most enterprises are relatively small (assets of P10 million and below). Nevertheless there is a tendency for asset size to be associated with increasing RKG. The plot suggests important non-linearities, which we can adjust by performing a scatterplot on the natural logarithms of RKG and assets (Figure 5.14). The
Figure 5.13: Scatterplot diagram between unit revenue
(RKG) and enterprise assets
Figure 5.14: Scatterplot diagram between unit revenue
(RKG) and enterprise assets, in natural logarithm
5 9 13 17 21 230
10
20
30
40
50
60
70
LnAssests
LnR
KG
Source: Authors Source: Authors
0 3000.0 6000.0 8000.00
10
20
30
40
50
60
70
Enterprise Assets (Php ‘000)
RKG
(Php
/Kg)

128 Analysis of the size and distribution of the impacts of agricultural trade at the firm and industry levels in developing countries
positive relationship is much clearer; also drawn is a linear trend line which suggests a strategy for multiple regression.
As indicated in the Methods section, other variables that may also be correlated with unit revenue are enterprise head characteristics, enterprise category variables, and a binary variable for vertical linkages (whether forward or backward). Summary statistics and pairwise correlation coefficients are shown in Table 5.8 and Table 5.9. The average of Assets is large (equivalent to about USD 1.4 million at current exchange rates), but the standard deviation is also large (5.7 times as large as the mean). A sizable proportion of the respondents have
vertical linkages, are traders, and export directly or indirectly; only a small proportion are processors; an insignificant fraction export to the North or even to other overseas markets.
These variables are dropped in the pairwise correlation matrix. Unit revenue is noticeably correlated with Asset, but only moderately so for Relation. The latter though is strongly correlated with Exporter and especially Pctexp. This may complicate econometric analysis owing to possible multicollinearity.
Ordinary least squares regression isolates the importance of enterprise size and vertical linkages by incorporating various potentially influential variables. The following regressions and
Variable Average Standard deviation Minimum Maximum
RKG 40.32 33.29 9.64 178.50
Asset (‘000 pesos) 59 729 338 578 0.00 2 300 000 000
Relation 0.41 0.50 0.00 1.00
Experience (years) 22.54 9.85 0.00 42.00
Schooling (years) 13.81 2.89 5.00 18.00
Processor 0.11 0.31 0.00 1.00
Trader 0.59 0.50 0.00 1.00
Exporter 0.67 0.47 0.00 1.00
Pctexp 0.34 0.31 0.00 1.00
Freshnorth 0.02 0.15 0.00 1.00
Freshoth 0.07 0.33 0.00 1.00
Table 5.8: Summary statistics of the enterprise variables
Source: Authors
1 2 3 4 5 6 7 8 9
1 Unit revenue 1.00
2 Asset 0.27 1.00
3 Relation 0.41 0.20 1.00
4 Experience 0.11 0.18 0.20 1.00
5 Schooling 0.05 0.07 0.00 -0.03 1.00
6 Processor 0.26 0.45 0.42 0.31 0.15 1.00
7 Trader 0.02 -0.18 -0.10 -0.44 -0.25 -0.41 1.00
8 Exporter 0.24 0.12 0.49 0.25 -0.25 0.24 0.08 1.00
9 Pctexp 0.50 0.27 0.68 0.31 -0.09 0.41 -0.16 0.77 1.00
Table 5.9: Pairwise correlation coefficients of selected enterprise variables
Source: Authors

129Chapter 5: Market structure and distribution of benefits from agricultural exports: The case of the Philippine Mango Industry
statistical tests are performed using STATA. The first specification directly applies the variables in Table 5.8 directly as independent variables in the regression. The results are shown in Table 5.10.
The coefficient of Assets is both quantitatively and statistically insignificant. In fact none of the coefficients are statistically significant, except for the Vertical linkage variable. The regression passes the F-test for joint significance, with a moderate goodness-of-fit based on adjusted R2 of 0.25.
The mediocre fit of the simple linear model to the data suggests a specification problem, namely failure to account for non-linearities in the data, which is already evident from the scatterplot of Figure 5.14. This failure is corrected by running a log-linear regression, results of which are shown in Table 5.11.
The goodness-of-fit dramatically improves with adjusted-R2 of 0.56. The Breusch-Pagan test for heteroscedasticity (null hypothesis of constant variance) yields χ2 = 0.010 corresponding to P(χ2 ˃ χ2 ) = 0.75, i.e. failure to reject the null. The Ramsey reset test (null of no omitted variables) yields an F-value of 1.98 or P(F ˃ Fc) = 0.25, i.e. failure to reject the null at 0.05 level of significance. That is, standard tests fail to detect fundamental problems in model specification.
Moreover the asset variable is now significant with high t-value. The coefficient value implies
that every 1 percent increase in assets increases RKG by 0.1 percent. In short, the quantitative analysis based on enterprise-level data confirms the first hypothesis, that larger enterprises tend to earn higher average revenue due to greater access to export markets.
However there is no confirmation of the second hypothesis, that vertical linkages contribute to gaining access to export markets. The coefficient of Relation is positive but not significant at the 5 percent level.
Other significant coefficients pertain to Pctexp (positive) and Freshoth (negative). The significance of the former suggests a multicollinearity issue affecting the coefficient of Relation. Moreover there is the possibility of Pctexp being prone to measurement error. As a check, another least squares regression is implemented with Pctexp dropped (Table 5.12). Coefficient values are similar, except for Relation, whose magnitude as well as t-value rises; it is now statistically significant (at 5 percent level). This may be seen as preliminary but inconclusive confirmation of the second hypothesis. The mechanism is likely to be the improved enforcement of quality standards and volume requirements, compared to spot market, consistent with the authors’ qualitative impressions from field interviews. The second hypothesis is indeed plausible and certainly cannot
Variable Coefficient t-value P(t ˃ tc)
Assets 0.000002 -0.15 0.88
Relation 2.013 0.20 0.84
Experience 0.043 0.10 0.92
Schooling 0.645 0.49 0.63
Processor 28.358 1.53 0.14
Trader 15.158 1.64 0.11
Exporter -24.904 -1.91 0.07
Pctexp 68.049 2.99 0.01
Freshnorth -28.327 -1.06 0.30
Freshoth -18.681 -1.32 0.20
Constant 9.534 0.39 0.70
Table 5.10: Results of least squares regression on unit revenue
Source: Authors Note: F-test of joint significance of coefficients yields an F-value of 2.39, P(F > Fc) = 0.03; adjusted R2 = 0.25
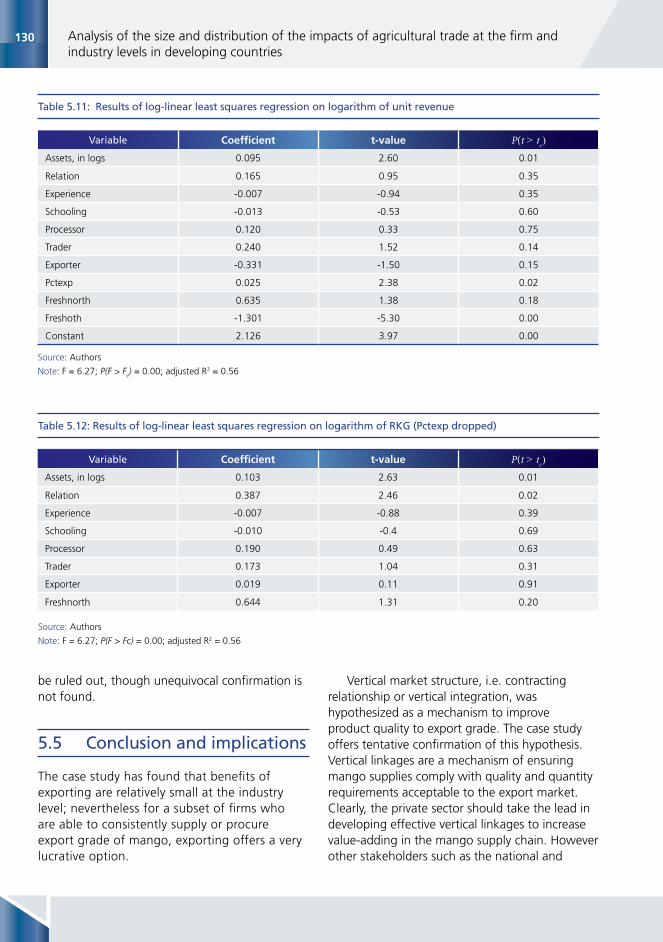
130 Analysis of the size and distribution of the impacts of agricultural trade at the firm and industry levels in developing countries
Table 5.11: Results of log-linear least squares regression on logarithm of unit revenue
Variable Coefficient t-value P(t ˃ tc)
Assets, in logs 0.095 2.60 0.01
Relation 0.165 0.95 0.35
Experience -0.007 -0.94 0.35
Schooling -0.013 -0.53 0.60
Processor 0.120 0.33 0.75
Trader 0.240 1.52 0.14
Exporter -0.331 -1.50 0.15
Pctexp 0.025 2.38 0.02
Freshnorth 0.635 1.38 0.18
Freshoth -1.301 -5.30 0.00
Constant 2.126 3.97 0.00
Source: Authors
Note: F = 6.27; P(F > Fc) = 0.00; adjusted R2 = 0.56
Table 5.12: Results of log-linear least squares regression on logarithm of RKG (Pctexp dropped)
Variable Coefficient t-value P(t ˃ tc)
Assets, in logs 0.103 2.63 0.01
Relation 0.387 2.46 0.02
Experience -0.007 -0.88 0.39
Schooling -0.010 -0.4 0.69
Processor 0.190 0.49 0.63
Trader 0.173 1.04 0.31
Exporter 0.019 0.11 0.91
Freshnorth 0.644 1.31 0.20
Source: Authors
Note: F = 6.27; P(F > Fc) = 0.00; adjusted R2 = 0.56
be ruled out, though unequivocal confirmation is not found.
5.5 Conclusion and implications
The case study has found that benefits of exporting are relatively small at the industry level; nevertheless for a subset of firms who are able to consistently supply or procure export grade of mango, exporting offers a very lucrative option.
Vertical market structure, i.e. contracting relationship or vertical integration, was hypothesized as a mechanism to improve product quality to export grade. The case study offers tentative confirmation of this hypothesis. Vertical linkages are a mechanism of ensuring mango supplies comply with quality and quantity requirements acceptable to the export market. Clearly, the private sector should take the lead in developing effective vertical linkages to increase value-adding in the mango supply chain. However other stakeholders such as the national and
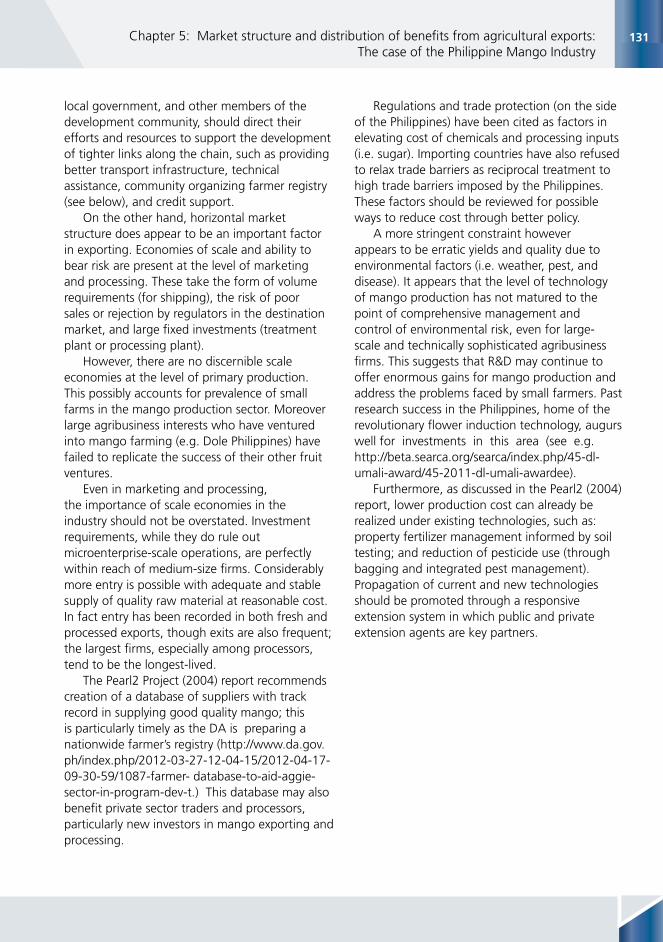
131Chapter 5: Market structure and distribution of benefits from agricultural exports: The case of the Philippine Mango Industry
local government, and other members of the development community, should direct their efforts and resources to support the development of tighter links along the chain, such as providing better transport infrastructure, technical assistance, community organizing farmer registry (see below), and credit support.
On the other hand, horizontal market structure does appear to be an important factor in exporting. Economies of scale and ability to bear risk are present at the level of marketing and processing. These take the form of volume requirements (for shipping), the risk of poor sales or rejection by regulators in the destination market, and large fixed investments (treatment plant or processing plant).
However, there are no discernible scale economies at the level of primary production. This possibly accounts for prevalence of small farms in the mango production sector. Moreover large agribusiness interests who have ventured into mango farming (e.g. Dole Philippines) have failed to replicate the success of their other fruit ventures.
Even in marketing and processing, the importance of scale economies in the industry should not be overstated. Investment requirements, while they do rule out microenterprise-scale operations, are perfectly within reach of medium-size firms. Considerably more entry is possible with adequate and stable supply of quality raw material at reasonable cost. In fact entry has been recorded in both fresh and processed exports, though exits are also frequent; the largest firms, especially among processors, tend to be the longest-lived.
The Pearl2 Project (2004) report recommends creation of a database of suppliers with track record in supplying good quality mango; this is particularly timely as the DA is preparing a nationwide farmer’s registry (http://www.da.gov.ph/index.php/2012-03-27-12-04-15/2012-04-17-09-30-59/1087-farmer- database-to-aid-aggie-sector-in-program-dev-t.) This database may also benefit private sector traders and processors, particularly new investors in mango exporting and processing.
Regulations and trade protection (on the side of the Philippines) have been cited as factors in elevating cost of chemicals and processing inputs (i.e. sugar). Importing countries have also refused to relax trade barriers as reciprocal treatment to high trade barriers imposed by the Philippines. These factors should be reviewed for possible ways to reduce cost through better policy.
A more stringent constraint however appears to be erratic yields and quality due to environmental factors (i.e. weather, pest, and disease). It appears that the level of technology of mango production has not matured to the point of comprehensive management and control of environmental risk, even for large-scale and technically sophisticated agribusiness firms. This suggests that R&D may continue to offer enormous gains for mango production and address the problems faced by small farmers. Past research success in the Philippines, home of the revolutionary flower induction technology, augurs well for investments in this area (see e.g. http://beta.searca.org/searca/index.php/45-dl-umali-award/45-2011-dl-umali-awardee).
Furthermore, as discussed in the Pearl2 (2004) report, lower production cost can already be realized under existing technologies, such as: property fertilizer management informed by soil testing; and reduction of pesticide use (through bagging and integrated pest management). Propagation of current and new technologies should be promoted through a responsive extension system in which public and private extension agents are key partners.

132 Analysis of the size and distribution of the impacts of agricultural trade at the firm and industry levels in developing countries
References
Aveno, J. & Orden, M. 2004. Hot water treatment of mango: a study of four export corporations in the Philippines. King Mongkut Institute of Technology Ladkrabang Journal 4(1).
Bally, I. 2006. Mangifera indica (mango). Special Profiles for Pacific Island Agroforestry. www. traditionaltree.org.
Bureau of Agricultural Statistics. 2002. Marketing Costs Structure for Mango. Marketing Costs Structure Study Series No. 3. Agricultural Marketing Statistics Analysis Division, BAS, Quezon City, Philippines.
Briones, R. 2010. Scenarios and Options for Productivity Growth in Philippine Agriculture: An Application of the Agricultural Multimarket Model for Policy Evaluation (AMPLE). Discussion Paper No. 2010-05. PIDS, Makati.
Briones, R. 2012. Philippine Agriculture to 2020: Threats and Opportunities from Global Trade. Discussion Paper No. 2013-14. Philippine Institute for Development Studies, Makati, Philippines.
De la Cruz, A. 2007. Contractual Arrangements in Agriculture (Northern and Central Luzon Component). Discussion Paper Series No. 2007 – 21. Philippine Institute for Development Studies, Makati, Philippines.
Digal, L. 2005. Benefit Diffusion and Linkage Development in the Philippine Tropical Fruits Sector. Paper presented at a conference on “Closing the Productivity Gap”, World Bank and the National Economic and Development Authority, Asian Institute of Management Policy Center, 27 June.
Fatajo, L, Galang, L., Jamandre, M. & Panela, W. 2006. Analysis of the Price System and Trade Related Concerns of Philippine Mango. Research Paper, Central Luzon State University, Munoz, Philippines. National Statistics Office [NSO], 2010. Census of Agriculture and Fisheries 2002. NSO, Manila.
Pearl2 Project. 2004. State of the Sector Report – Philippine Processed Mango. Technical Paper No.1.
Sarmiento, J., Aguinaldo, R., Digal, L., Castillo, A. & Balgos, C. 2012. Mango Production in Major Areas in Davao Region: Value Chain and Net Margin Analyses. Paper presented at the End-of- Program Conference and Dinner for the ACIAR-PCAARRD Southern Philippine Fruits and Vegetables Programs, July 1-3, Cebu Parklane International Hotel.
133Chapter 6: Conclusions and implications
CHAPTER 6: CONCLUSIONS
The analysis of the size and distribution of agricultural trade impacts in developing countries interests more than just the traders. Many of the owners of inputs (especially poor workers and farmers) linked to the industries rely on trade revenues for a living. Trade impacts are often explained or discussed at an aggregate level, but the studies compiled in this report have provided an opportunity to track trade impacts at the level of the actual actors, the trading firms. The aim was to discover strategies for enhancing agricultural trade benefits to firms and also to the owners of inputs. The investigations focused on the firms’ heterogeneity on the bases of their characteristics, practices, and especially their decisions and strategies within the industry. The main approach has been to employ both qualitative and quantitative information taken from sample surveys and interviews to reveal how agro-trading firms in developing countries were organized and how, through their individual or collective actions, they responded to internal and external shocks, including policy shocks, weather risks, and price risks.
The main focus was, therefore, on the organization and behaviour of trading firms in agro-export in selected developing countries. The case studies dealt with the exports of pineapple in Ghana, horticulture products in Indonesia, mango in the Philippines, and cashew nut in Tanzania.64 About 120 firm managers (including heads of exporters’ associations), 10 government
64 The Indonesia and Tanzania studies will be fully reported in a separate document.
officials, and 4 trade worker unions were directly interviewed. Several farmers and workers supplying raw materials to and working for the agro-trading industries were also either directly interviewed or asked to send in their written responses to questionnaires. Prior to the case studies, preliminary research identifying the knowledge gaps in the theories and estimation of trade impacts was conducted. The preliminary research also helped define the relevant trade-impact indicators to be employed and posited some main hypotheses to be tested in the case studies.
One of the challenges in the case studies was to track the trade-impact indicators at firm and industry levels. Because the focus was on the structure (organization) of the agro-export industry, market (export volume or value) share was widely chosen. Unit margin (a proxy for revenue or profit) was used particularly in the case of mango export of the Philippines. Export (in volume or value) per unit of input were also used as trade-impact indicators as this may be used as proxy to productivity of the input, especially to compare if smaller firms are as input productive as larger firms. In addition to studying these formal indicators, all the research teams in the case studies investigated the entries and exits of exporting firms over the last 5 to 10 years. The quantitative analyses in the case studies employed different methods, ranging from simple correlation analyses to econometric models and partial equilibrium analysis. Although the selected industries had different characteristics that affect trade impacts, they shared many similarities in

134 Analysis of the size and distribution of the impacts of agricultural trade at the firm and industry levels in developing countries
how their firms organize themselves, strategize, and make decisions to face challenges and opportunities in international markets.
6.1 Main findings
The existing literature on trade impacts at agro-trading firms in developing countries was thin
• The literature has remained scarce on the size and distribution of trade impacts among firms for developing countries, and even more so on the role of the organization and behaviour of trading firms. The preliminary research revealed, however, new entries of firms exporting processed or semi-processed agricultural products in developing countries, confirming that the industry is slowly moving away from exporting of raw materials towards more processing, thereby boosting agricultural value added. In Asia for instance, the emergence of new and diversified markets (e.g. China, India, Singapore) and technological progress at the firm and industry levels contributed to this trend. However, there were signs that this trend was receiving only limited institutional, financial, and material supports, reducing the extent of the trade impacts.
• There were early indications from the preliminary research and literature review that firms were engaged in various forms of cooperation to enhance trade gains. The information on organization of the industries pointed towards the existence of a few large firms. These early indications had to be confirmed in the case studies.
• Several trade-impact indicators were considered, but the survey results indicated that export volume and revenue, export shares, and export profit per kilogram of raw materials were the most accessible and tractable indicators. Input (e.g. labor or land) productivity of exporting firms was also used, though less often, as an indicator of trade impacts.
• The review of the literature pointed to the difficulties of applying the macro-economic theories of trade impacts such as R&D spillover effects of trade at the industry or firm levels. It was, however, clear that trade benefits were self-fulfilling in that firms with higher productivity could benefit more from trade.
The organization and behaviour of firms showed a concentration of export industries but no cartels
• The selected agro-processing and exporting industries in the countries considered in the case studies were dominated by a few large firms holding large export shares. Economies of scale rather than regulation and greater access to input (including raw material) and output markets seemed to be one explanation of such industry structure.
• These few large firms had not acted as a cartel, as they had no absolute power in both output and input markets. For instance, although they were geographically dispersed, the large firms faced strong competition to have the best quality raw materials. The exception was the case of Tanzania’s cashew nut industry, where the large exporting firms were also subsidiaries of large importing companies based in India and had market power on raw cashew purchase; their markup was relatively high.
• The cooperation among the larger firms in the case studies (especially in Ghana and the Philippines) focused generally not on controlling prices but on taking collective actions to negotiate for better export prices and favourable export policies (especially low export tax) with their buyers and local governments. Such collusion also served as a platform for exchanges of market information and knowledge sharing. For instances, managers of pineapple exports in Ghana confirmed that their industry overcame some of the negative impacts of the change in pineapple variety from Smooth Cayenne to MD2 through large consultations and dialogue among the exporting firms and between the

135Chapter 6: Conclusions and implications
exporters and the growers. Similar claims were made by managers in the other case studies.
• The few large agro-processing and exporting firms seemed to have been in business for longer periods (some more than 60 years). They were more resilient to shocks and to other structural changes that the industries had experienced.
• Small- or medium-sized firms had also thrived in recent years because of new openings in emerging economies in Asia (especially China). Although their average durations of stay in the export business were short because of greater vulnerability to shocks, these small firms persistently return back to business when the industry profits picked up (e.g. during periods of high demand). Their low hiring and firing costs contributed to their frequent exits and entries and enabled them to enter and act as fringe firms when markets thrived.
• Firms’ collective action (their behaviour and linkages) contributed greatly to their coping with trade and marketing risks and their taking advantage of trade opportunities. This was evidenced mostly in the Philippines’ mango and Ghana’s pineapple cases, where large and small firms often cooperated to share and honor large import orders that neither of them alone could deliver on time.
• For the selected industries in this study, vertical integration was present but did not play much role in affecting export benefit. Because of the difficulty to access and use of land area large and suitable land, exporting firms desperate to get enough raw materials for processing and export were often forced to cooperate with small scale growers even if the latter had no contract with the firms. (This is unlike cases of vertically integrated agro-export such as banana.) The exception was the case of horticulture exports in Indonesia, where the large commercial firms own and operate vast areas of land.
The size and distribution of trade impacts revealed that although firms with large assets held large market shares, small and medium firms resiliently survived
• Agro-export industries in the case studies had benefitted from trade expansion (even for the pineapple export industry of Ghana, contrary to prior fears of the industry would collapse). This can be seen statistically from the increase in export volume in real terms between 4-10% growth per year in the last 5 to 6 years and the increasing number of firms participating in trade (case of Indonesia’s horticulture export
• An agro-trading industry’s export revenue was correlated with its domestic concentration, as exemplified by the horticulture industry in Indonesia and pineapple in Ghana. This finding suggests that large sunk and fixed costs constitute a barrier to entry but the collusion or cooperation among large exporting firms have increased their ability to organize responses to market shocks.
• The benefits were split unevenly among firms. As expected, large firms (with large fixed assets, significant financial and physical capital, and high number of workers) enjoyed the largest share of the revenues and profits.
• However, the size of the firms and the organization of the industry did not always reflect their level of input productivity: smaller firms were sometimes found to be as input productive as the large ones. The reason seemed to be related to cost efficiency, because for instance the smaller firms had more flexible hiring and firing policies. Conversely, large firms seemed to resist more strongly market and trade risks, or they had to stay in business to cover large fixed and sunk costs even during hard times.
• Firms’ benefit from exports were also found to be positively correlated with the skill level of employees, the education level of workers/managers, the total number of years in business, the ability to link with other firms, and proximity to the export market.
136 Analysis of the size and distribution of the impacts of agricultural trade at the firm and industry levels in developing countries
Export demand remained high despite export barriers
• The case studies firmly rejected the hypothesis that agro-processing firms from developing countries struggled to access large portions of the regional and global markets, or that they were not linked to the market. Almost all of the interviewed managers confirmed that they had no problem in finding export markets. (This could amount to a bias because many of the interviewed worked for those currently exporting.) The managers stated that they often had to turn down orders from importers, as their production could not keep up with the demand. Their main problem was to find stable (not seasonal) sources of raw materials to process and export all year long.
• Still, the non-tariff barriers, especially sanitary and phytosanitary measures in the EU and Japan, to developed countries’ markets had reduced potential benefits for both small and large agro-exporting firms.
• Firms also experienced more difficulties in finding efficient means of transportation, especially during the peak of export seasons; their landing costs increased and their competitiveness declined sharply.
• The lack of contract enforcement in both input and output markets limited export expansion, especially in the pineapple and mango export industries.
A low supply of raw materials was a common problem
• All four case studies revealed that the lack of a stable supply in high quality raw materials constitutes the main constraint for the agro-trading firms and industries.
• The export industries in these four countries had similar features: their productions were all constrained by seasonality and
low productivity in the production of raw materials, so bad that often the limited amount of the bulk raw materials available made it impossible to meet quality requirements for processing and export.
• The larger firms suffered the most, as they were often working below operational capacity but had to cover their fixed costs.
There were some signs of trade impacts on upstream links, especially workers and farmers
• All four agro-export industries selected in the case studies were significant providers of direct and indirect employment in the respective countries. Measuring how these industries contributed to poverty reduction was beyond the scope of this study. However, interviewed small landowners and farm workers acknowledged benefits from expansion of agro-trading industries.
• There was no particular indication that farmers or workers linked to large firms received more or less returns than those linked to smaller firms. However, those linked to large firms seemed to have more stable returns.
• Workers complained about low wages but often put the blame on the high unemployment rate of unskilled labour and lack of skills training.
• Trade shocks such as the actual change in variety of pineapple or a simulated decrease in the mango export price created long lags of uncertainty and decreased income for growers, especially small farmers.
• In the cases of small producers and farm workers of cashew in Tanzania, the exporters had oligopsony power to depress farm prices, despite the introduction of the so-called ‘Warehouse Receipt System’ that guaranteed minimum price levels for different cashew nut grades.
Inconsistent and costly policies adversely affected exporters and importers.
• Aware of the importance of agro-export industries, governments in the selected

137Chapter 6: Conclusions and implications
countries (especially in Tanzania and the Philippines) devoted efforts to build production policies around direct or indirect subsidies for farmers involved in the agricultural export chain.
• However, many forms of export restrictions like direct taxation or licensing remained in place and cancelled out the production subsidies. Interviewed managers claimed that these restrictions, despite on-going reforms, constituted major barriers to agro-trade expansion.
• Similarly, though the imports of essential input and equipment had been liberalized and tariffs on these inputs were minimal, the impact on input price remained mixed because the input import business was concentrated in the hands of a few importers.
• The cashew nut export in Tanzania exemplified how the production and trade policies for agro-industries remained complex and in need of thorough review. Small producers were subsidized but had no bargaining power on prices. Moreover, exporters belonged mostly to foreign-based companies that compensated for the losses due to export tax via high markups based on the low price of raw cashew.
6.2 Implications for the promotion of agro-industry growth
Results of the preliminary research and case studies indicated that many developing countries had made significant efforts to diversify agricultural exports and especially to promote high-value or processed products in order to retain value added within the country, to reduce poverty and spur growth and employment. Government efforts ranged from providing assistance to growers, manufacturers, and exporters to relaxing the tight control on export licensing.
Although in general, developing countries’ agro-export industries still face tariff escalation
and non-tariff barriers, the key finding from this study was that there were lucrative market niches for specific industries, especially tropical fruits and horticulture, but that the agro-export industries in the selected countries could not keep up with the rising demand in these niches even during the fruit season. Another problem linked to unstable and inadequate supply is lack of competitiveness due to low productivity and high transaction (transportations, taxes) costs. The main implication is therefore to give more attention to raw material production and to promote efforts enabling farmers and growers to provide a stable and adequate supply to the exporting firms. These efforts would require partnership between public and private officials to include appropriate trade and industrial policies aimed at creating production and trading environments that help local firms deliver quality products to these markets. The recommendations that deserve priority are as follows.
Provide technical assistance to producers, processors, and exporters in order to increase the availability of high quality inputs and outputs
This may be done by increasing productivity through better extension and research programs and by encouraging cooperation among exporting firms and farmers. The example of the Ghana pineapple sector industry shows that despite the low labour cost and proximity to the European market, return per acre of land or per unit of raw pineapple remained much lower than those of other competitors (e.g. Costa Rica), not just because of high transaction costs, but because of low yields at both the farm and firm levels.
While reducing the seasonality of production remains a tall order, tackling productivity by improving the quality of post-harvest operation is feasible. This will increase the amount and quality of the products to be exported. Efficiency will increase with increases in physical and financial capital, and especially human capital (production and managerial skills), from farms to the factories. Training of farmers and workers that have been clearly lacking skills as reported in the case studies would increase efficiency.

138 Analysis of the size and distribution of the impacts of agricultural trade at the firm and industry levels in developing countries
Improve infrastructure and quality of public services through increased investments
Market infrastructure and information are important to agro-export industries. Upgrading the poor infrastructure will allow firms to cut transaction costs and increase their competitiveness. For instance, fixing the frequent energy supply cuts and bad roads will surely reduce post-harvest losses and improve the quality of the final products. Storage facilities for the highly perishable tropical and horticultural products are also required along the supply chain. Similarly, providing market information especially information related to operating costs and requirements in importing countries will allow timely adjustment in production and export decisions of the firms.
The majority of key stakeholders interviewed agreed that increases in public, and especially private, investments are important to ensure enough resources are available to help both small and large firms benefit from trade opportunities. These investments would contribute to the upgrade of market infrastructure (roads and storage facilities) to ease the flow of goods and services as well as information. They may include farm extension and research programs that contribute to agro-trading firms’ meeting the market requirements for high quality raw materials and processed products. Key stakeholders interviewed during the surveys pointed to examples of successful non-agricultural sectors in their countries to conclude that having foreign investment would help them to bridge gaps in market links such as appropriate insurance services and efficient means of transportations.
Institute more consistent and effective trade policies by taking into account the organization of the agro-trading industries
All the interviewed firm managers still ranked government policy (or lack of clear policy) high among barriers to trade expansion indicating that more policy work remains to be done. Lowering trade barriers (both tariffs and non-tariffs) remains
a key. Agro-exports like mango or cashew always have been sources of government revenue, and it is true that reducing export taxes would directly reduce government revenue. However, such revenue loss can be compensated for by tax revenue from the widened tax base of increased employment and firms’ revenue if the agro-export industries expand.
Under oligopsony by foreign-based importers, as in the cashew nut industry of Tanzania, government subsidies on production benefited only the foreign importers and inflicted a net loss to the country’s already scarce resource. Governments should instead promote partnership among the traders (exporters or foreign importers) and farmers so that the latter enjoy larger benefits as input owners. Conversely, if the industry appears to be less concentrated with no oligopsony power on raw material purchase, supporting producers to increase the level and quality of production would prove more beneficial.
Strengthen market institutions
One of the biggest needs for the countries in the case studies was to overcome the lack of comprehensive institutional supports to spur competitiveness of their agro-trading industries. Although these case studies were limited to four types of agro-industries, they showed that promoting diversification of agro-export depended on policy dialogue with agro-industries and the firms.
Therefore, organizations of farmers, workers, manufacturers and exporters need to be encouraged rather than shunned, since they constitute platforms for dialogue among these stakeholders and with policy makers. Managers of pineapple exports in Ghana confirmed that their industry overcame some of the negative impacts of the change in pineapple variety through consultations with the exporting firms and growers. Similarly, strengthening the existing local quality control entities will increase industries’ credibility and will reduce the cost of the importers’ certification processes. Moreover, because the production of tropical products in the

139Chapter 6: Conclusions and implications
studies depended greatly on weather conditions, access to risk management tools would help reduce production and marketing risks.
One of the problems revealed in the case studies was parties breaching contracts because of the weakness of national contract enforcing institutions. Although having professional organizations of actors (e.g. farmers, exporters, or transporters) helps reduce the number of incidences of contract breaches that may discourage transactions, there is no substitute for strong contract enforcing measures backed by public authority.
There is also the need to consider inter-regional cooperation among the agro-exporters. For instance, the mango season in East Africa is the counter-season for firms in the Philippines, and there is a need to study whether exploiting such complementarity to reap benefits from the stable and high export demand is feasible. Similarly, any policy allowing capital and technology to flow between the two sides may prove beneficial for both. For pineapple, the use of by-products such as fibers for clothing industries has been widely developed in the Philippines, but less so in Ghana, and some forms of cooperation can be envisaged there.
6.3 Looking ahead
This investigation of agricultural trade impacts at the firm and industry levels in developing countries provides guidance for future studies. Three areas of study deserve immediate attention. One is refining the trade-impact indicators, including the estimates of total factor productivity measures at the firm level. This requires enormous data collection efforts but will increase understanding of how much technical assistance firms of various sizes may need to improve technical and allocative efficiencies. Such information will confirm whether productivity increases due to agricultural trade depend on the firm size.
The second area worth further exploration is the causes of the exporting firms’ entries and exits. More important, focusing on why
small firms have remained in business, though intermittently, invites more thought on the roles of product differentiation, exposure to the product market, marketing sale strategies, and especially on firms’ costs (sunk costs and flexibility in hiring and firing inputs). Such a focus would identify what actions might help these small firms endure risk.
The third and most important task for future studies is to dig more into the link between the firms’ benefits or losses and the welfare distribution among their input suppliers, including growers and workers. It is for instance important to investigate how large firms with large benefits decide on the returns to factor owners asking question such as ‘Do larger firms pay higher input prices, or wage than smaller firms do and why?’ . All of these proposals for future studies point towards ways to enhance developing countries’ trade benefits from agro-industries for firms and their upstream links through increased competitiveness of the firms and industries.


Food and Agriculture Organization of the United NationsViale delle Terme di Caracalla00153 Rome, ItalyTel: (+39) 06 57051e-mail: [email protected] I5130E
The size and distribution of trade impacts revealed that although firms with large assets held large market shares, small and medium firms resiliently survived…
….the size of the firms and the organization of the industry did not always reflect their level of input productivity: smaller firms were sometimes found to be as input productive as the large ones. The reason seemed to be related to cost efficiency, because for instance the smaller firms had more flexible hiring and firing policies. Conversely, large firms seemed to resist more strongly market and trade risks, or they had to stay in business to cover large fixed and sunk costs even during hard times.
…Firms’ benefits from exports was also found to be positively correlated with the skill level of employees, the education level of workers/managers, the total number of years in business, the ability to link with other firms, and proximity to the export market Although in general, developing countries’ agro-export industries still face tariff escalation and non-tariff barriers, the key finding from this study was that there were lucrative market niches for specific industries, especially tropical fruits and horticulture, but that the agro-export industries in the selected countries could not keep up with the rising demand in these niches even during the fruit season.
…. Almost all of the interviewed managers confirmed that they had no problem in finding export markets. (This could amount to a bias because many of the interviewed worked for those currently exporting.) The managers stated that they often had to turn down orders from importers, as their production could not keep up with the demand. Their main problem was to find stable (not seasonal) sources of raw materials to process and export all year long…..
… Another problem linked to unstable and inadequate supply is lack of competitiveness due to low pro-ductivity and high transaction (transportations, taxes) costs. The main implication is therefore to give more attention to raw material production and to promote efforts enabling farmers and growers to provide a stable and adequate supply to the exporting firms. These efforts would require partnership between public and private officials to include appropriate trade and industrial policies aimed at creating production and trading environments that help local firms deliver quality products to these markets.