analysis of the use and perception of shared mobility: a
TRANSCRIPT
sustainability
Article
Analysis of the Use and Perception of Shared Mobility: A CaseStudy in Western Australia
Craig Standing 1, Ferry Jie 1 , Thi Le 2,* , Susan Standing 1 and Sharon Biermann 3
�����������������
Citation: Standing, C.; Jie, F.; Le, T.;
Standing, S.; Biermann, S. Analysis of
the Use and Perception of Shared
Mobility: A Case Study in Western
Australia. Sustainability 2021, 13, 8766.
https://doi.org/10.3390/su13168766
Academic Editor: Jungho Baek
Received: 8 June 2021
Accepted: 3 August 2021
Published: 5 August 2021
Publisher’s Note: MDPI stays neutral
with regard to jurisdictional claims in
published maps and institutional affil-
iations.
Copyright: © 2021 by the authors.
Licensee MDPI, Basel, Switzerland.
This article is an open access article
distributed under the terms and
conditions of the Creative Commons
Attribution (CC BY) license (https://
creativecommons.org/licenses/by/
4.0/).
1 School of Business and Law, Edith Cowan University, Joondalup, WA 6027, Australia;[email protected] (C.S.); [email protected] (F.J.); [email protected] (S.S.)
2 Murdoch Business School, Murdoch University, 90 South Street, Murdoch, WA 6150, Australia3 PATREC, University of Western Australia, Crawley, WA 6009, Australia; [email protected]* Correspondence: [email protected]
Abstract: The sharing economy has acquired a lot of media attention in recent years, and it has had asignificant impact on the transport sector. This paper investigates the existing impact and potentialof various forms of shared mobility, concentrating on the case study of Wanneroo, Western Australia.We adopted bibliometric analysis and visualization tools based on nearly 700 papers collected fromthe Scopus database to identify research clusters on shared mobility. Based on the clusters identified,we undertook a further content analysis to clarify the factors affecting the potential of differentshared mobility modes. A specially designed questionnaire was applied for Wanneroo’s residentsto explore their use of shared mobility, their future behaviour intentions, and their perspectives onthe advantages and challenges of adoption. The empirical findings indicate that the majority ofrespondents who had used shared mobility options in the last 12 months belong to the low-mean-agegroup. The younger age group of participants also showed positive views on shared mobility andwould consider using it in the future. Household size in terms of number of children did not makeany impact on shared mobility options. Preference for shared mobility services is not related toincome level. Bike sharing was less commonly used than the other forms of shared mobility.
Keywords: shared mobility; shared mobility; facilitator; barriers; ride sharing; car sharing; carpooling;bike sharing
1. Introduction
The development of technology has accelerated a growing transition from conven-tional travel modes to shared mobility [1]. Shaheen et al. [2] defined shared mobility asdifferent modes of transportation that are shared on an as-needed basis. Shared mobilitycomprises various new forms such as car sharing, carpooling, ride sharing or bike sharing,which are growing rapidly in recent years [3,4]. This transition requires a comprehensiveunderstanding by policy makers, transportation planners and managers about the effects ofshared mobility on public transport demand and road use, as well as regulation to controland adjust these increasing collaborative consumptions [5]. The majority of existing studiesindicated that shared mobility would reshape urban transportation [6]. The most commonadvantages of shared mobility include reducing congestion, pollution, and transportationcosts, creating sustainable travel behaviour and sustainable urban infrastructure [7,8].However, shared mobility is not a simple shortcut to create sustainable transportationbased on modern technology solutions [9]. For instance, although shared mobility servicessuch as bike sharing or carpooling have opened the prospect of urban mobility emissionreduction [10], motorbike ride sharing in Indonesia was found to be ineffective in miti-gating air pollution or carbon dioxide emissions [11]. Several critics even predicted thatshared mobility options were likely to collapse soon as these services would make thetraffic worse and create minor impacts on environment protection [12]. As there is a lackof consensus on how shared mobility will affect people’s travel behaviour and the urban
Sustainability 2021, 13, 8766. https://doi.org/10.3390/su13168766 https://www.mdpi.com/journal/sustainability
Sustainability 2021, 13, 8766 2 of 14
landscape, the broad deployment of shared mobility needs an intensive investigation ofsolutions to conquer challenges, such as designing a proper ride mechanism and buildingtrust among unknown users on the online systems. Technology-enabled forms of collab-orative consumption are in their infancy, but it is apparent that they have already had adisrupting effect on government policies and transportation regulations. The arrival ofUber, for example, has resulted in disruption in the taxi industry [13] and policy changes inAustralia. Governments are investing extensively in transportation infrastructure, whichfeatures the long-term urban form. The possible influence of future demand developmentmust be investigated and monitored cautiously. Collaborative consumption and sharingeconomies have increased travel options and can significantly affect private vehicle use,although the extent of the effect is still unclear [14].
Therefore, this paper aims to explore the use and perception of shared mobilitythrough bibliometric analysis of 700 papers collected from the Scopus database to identifyresearch clusters on the recent research topic. From the identified research cluster, we useda case study in Wanneroo, Western Australia, to identify in-depth trends in shared mobilityadoption and the possible implications of these services on future transportation demandfrom the user’s perspective, which is often neglected in existing research [15].
This paper is structured as follows. The following section begins with the definitionsof critical terms in shared mobility, then the research methodology and findings from thebibliometric and in-depth analysis are outlined. The case study of Wanneroo is carriedout in Section 4. Finally, Section 5 outlines the conclusion and recommendations forpolicy makers.
2. Definition of Shared Mobility
The sharing economy in transportation for this report is categorised into car sharing,carpooling, ride sharing, and bike sharing.
Car sharing programs allow members to rent and operate a car for a specified periodbefore returning it to a set location. Car sharing includes corporate schemes or car clubssuch as Zipcar, owned by Avis, one of the most extensive car sharing services globally;and Hertz 24/7, which operates a car sharing scheme in Australia. Members of theseschemes are often well educated, professional, and live in urban areas; they rely on carsharing programs for long and small trips. Car-sharing schemes can be further dividedinto manufacturers’ car-sharing schemes, such as BMW’s DriveNow and ReachNow aswell as Daimler’s Car2Go, and peer-to-peer schemes such as Car Next Door.
Carpooling enables one individual to share the journey and split the associated costwith the other passengers. Dense urban regions are reported to have many car sharing andcarpooling use. However, there still exists a difference in demographics among carpoolingand car sharing users. Carpool members are mostly blue-collar employees, tend to drivebecause there is no other transport available and have more financial restrictions thancar-share members [16]. In contrast, existing literature on carpooling suggest that a greaternumber of women use carpooling services. Studies suggest the key driver of carpooling isemployer size, followed by a desire to reduce congestion, while other motivations showednegligible impacts [17]. Despite the success of carpooling for short trips, BlaBlaCar hasgained popularity for long-distance journeys.
Ride sharing is a peer-to-peer service in which the car owner accepts ride requestsfrom other service members in exchange for a charge. Through apps such as UberX,on-demand ride sharing allows the driver to respond instantly to requests for rides andallows members to track their request. Payment is also made through the proprietaryapp. Dynamic ride sharing also involves booking a ride on short notice, but the journey islikely to be shared with other people, often strangers, taking the same or a similar route.Passengers can be picked up and dropped off anywhere along the route. This requires someflexibility in timing and route planning but can reduce the cost of a journey and the numberof vehicles needed to cover the route. UberPool is an example of a dynamic ride sharingservice. The most popular findings from prior research indicated that ride sharing services

Sustainability 2021, 13, 8766 3 of 14
users were mainly in the younger adult, highly educated and high-income groups [18,19].However, an opposite trend was confirmed in the contemporary study, where users of ridesharing primarily came from low- and middle-income households [20–22].
The bike sharing program was first introduced in 1996 in the United Kingdom, thenmainly adopted in Barcelona and Paris in 2007, and has recently spread to more than onethousand cities worldwide [23]. The significant growth in bike sharing is motivated byincreasing healthy vision, sustainable development and carbon dioxide reduction [24].UberBike is currently available at several train stations and metro areas in Perth, WesternAustralia. The introduction of electric bikes for longer rides and to make riding morecomfortable could result in increased use of this type of service. Thus, understanding thecontribution of bike sharing to the context of urban mobility may influence strategic workfor shared mobility networks. See Figure 1.
Figure 1. Types of shared mobility schemes.
3. Research Methodology
Bibliometric analysis was combined with further content analysis. The VOS viewerwas used to extract information from papers forming data clusters based on a similarresearch theme [25]. Content analysis enables identifying insights, themes, research diver-sification, and research trends from papers classified in the clusters as well as in-depthanalysis according to research focus.
This study applied three steps to achieve the research aims, which are describedas follows:
Step 1: Analysis scope delimitation and article selection. We searched online publishedarticles, including articles in the press and pre-publication of articles to enrich the finallist of articles, until the cut-off date, 15 February 2021, from the Scopus database. Booleanoperator “OR” was employed due to the various definitions used in this research area,and the articles were chosen if the following terms appeared in the title, abstract, orkeyword fields: shared mobility, transport sharing, ride sourcing, ride sharing, carpooling,bike sharing, and car sharing. This search led to 692 results that form the corpus of thepresent study.
Sustainability 2021, 13, 8766 4 of 14
Step 2: Descriptive analysis of papers: using the VOS viewer to identify the researchclusters. Network nodes can be divided into clusters or modules where the relation (edgedensity) between the same nodes is greater than that of different clusters [26,27]. In thepast, data clustering has been used to classify a series of papers, also called modularity [27].Data clustering has been increasingly focused on by researchers and organizations, makingit a key area of research in data visualization [28].
Step 3: In-depth analysis of papers, interpretation and discussion of findings: the in-depth analysis of papers in each data cluster is conducted, mainly focusing on the currentresearch topic to identify the key drivers, facilitators and barriers of shared mobility.
3.1. Data Clustering
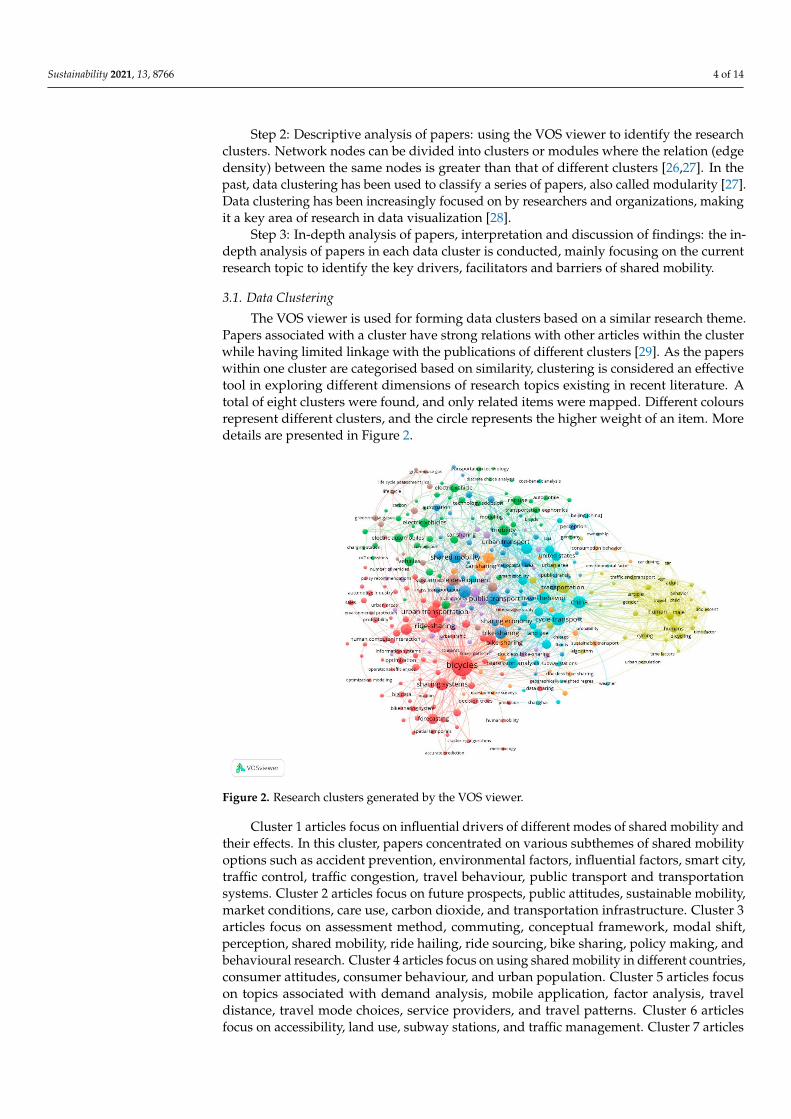
The VOS viewer is used for forming data clusters based on a similar research theme.Papers associated with a cluster have strong relations with other articles within the clusterwhile having limited linkage with the publications of different clusters [29]. As the paperswithin one cluster are categorised based on similarity, clustering is considered an effectivetool in exploring different dimensions of research topics existing in recent literature. Atotal of eight clusters were found, and only related items were mapped. Different coloursrepresent different clusters, and the circle represents the higher weight of an item. Moredetails are presented in Figure 2.
Figure 2. Research clusters generated by the VOS viewer.
Cluster 1 articles focus on influential drivers of different modes of shared mobility andtheir effects. In this cluster, papers concentrated on various subthemes of shared mobilityoptions such as accident prevention, environmental factors, influential factors, smart city,traffic control, traffic congestion, travel behaviour, public transport and transportationsystems. Cluster 2 articles focus on future prospects, public attitudes, sustainable mobility,market conditions, care use, carbon dioxide, and transportation infrastructure. Cluster 3articles focus on assessment method, commuting, conceptual framework, modal shift,perception, shared mobility, ride hailing, ride sourcing, bike sharing, policy making, andbehavioural research. Cluster 4 articles focus on using shared mobility in different countries,consumer attitudes, consumer behaviour, and urban population. Cluster 5 articles focuson topics associated with demand analysis, mobile application, factor analysis, traveldistance, travel mode choices, service providers, and travel patterns. Cluster 6 articlesfocus on accessibility, land use, subway stations, and traffic management. Cluster 7 articles
Sustainability 2021, 13, 8766 5 of 14
focus on collaboration consumption, perceived ease of use, sharing economy, economicand social effects. Cluster 8 articles focus on air quality, climate change, emission control,environmental impacts, greenhouse gas, and life cycle. To conclude, papers in Cluster 1dominate the research topics on shared mobility. They evolve the research of variousfactors affecting shared mobility such as environmental factors, accident prevention andhow shared mobility services reshape urban transportation, use of shared mobility andtravel behaviour. The in-depth analysis of these papers is necessary to provide guidelinesto survey residents in Wanneroo to find out the implication of shared mobility services onfuture transportation demand from the user’s perspective.
3.2. In-Depth Analysis—Drivers of Shared Mobility
In existing literature, economics is found to be one of the main drivers of sharedmobility. For instance, ride sharing is proven to save travelling cost, competing effectivelywith the conventional taxi industry and having led to a lower service price by approximately20% [30]. The convenience and availability of more choice in ride sharing and the feelingof fun are vital factors to beat the conventional taxi model [31]. A report by Deloitte [32]revealed that the waiting time for a taxi was three minutes, as the majority of Uber userspicked up in approximately four and a half minutes while this number for the taxi industrywas eight minutes. The study also indicated the lower risk related to ride sharing servicesdue to the transparency of both passenger and driver profile before pick-up. Such servicescan be considered a solution to traffic congestion and road infrastructure expenses by thegovernment [33].
Carpooling is motivated by cost savings and various drivers consisting of environmen-tal impact because fewer cars operate on the road. Further, carpooling is found to developsocietal structures as travellers work together to select the optimal journey instead of beingindividualistic [34]. Gender is the most important predictor of carpooling use [35,36].
Technological innovation has dramatically changed conventional carpooling by con-necting riders with drivers in real time. Although ride sharing services have proliferated,it is not apparent how these services affect the behaviour of commuters [37]. If enoughpeople use carpooling services in a locality, this can make an essential difference to vehiclemiles travelled. A study on the capability of dynamic carpooling [38] has shown thattwenty per cent of travellers to the UC Berkeley campus are more likely to replace theirprivate car with carpooling services.
Psychological barriers, such as attitudes and perceptions, affect carpooling more thansocio-demographic barriers [39]. Social-economic characteristics, such as education, age,income, family structure, and non-motorized mode use, are the strongest indicators whenforecasting car sharing and ride sharing users [40–42]. A study in Greece profiling carsharing users found that low- to medium-income passengers, who were environmentallyconscious and utilize taxis for social purposes, had a high probability of becoming carsharing members [41].
Bike sharing is significantly affected by measures of effort and comfort [43], anddistance to docking station is the key predictor of bike sharing use [44]. The number of bikesharing trips increases when more bike lanes or bike paths are close to the bike sharingstation [45,46]. Land use and built environments such as train and bus stations, restaurantsand universities are also considered motivations for bike sharing use [47,48]. The bikesharing service is more often used on weekdays than weekends, as well as during peakhours, and people tend to use this service if the travel time is less than 30 min [49].
3.3. In-Depth Analysis—Facilitators of the Sharing Economy in Transportation
Facilitators refers to elements that contribute to but are not responsible for a change.Numerous facilitators are interconnected involved in situations that lead to behaviouralchanges brought about by technological advancements and the internet (Table 1). Col-laboration, online sharing, and social commerce, in particular, have created favourableconditions for the sharing economy as people become more knowledgeable [50].
Sustainability 2021, 13, 8766 6 of 14
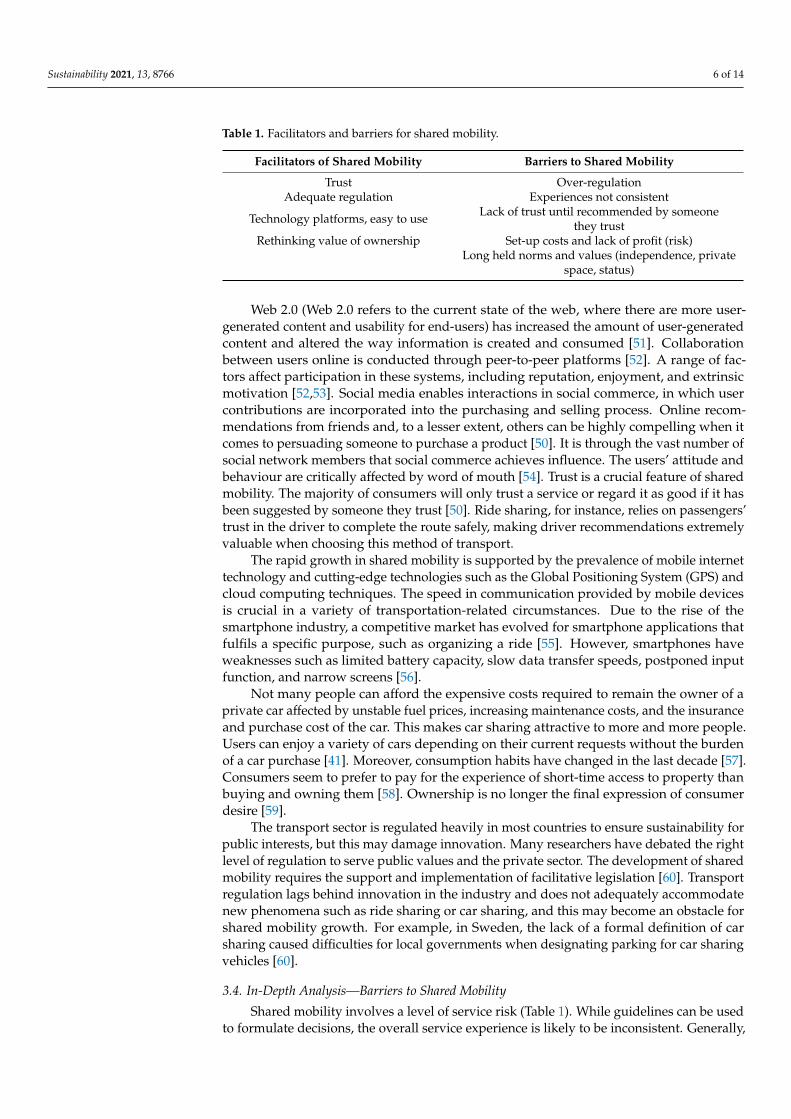
Table 1. Facilitators and barriers for shared mobility.
Facilitators of Shared Mobility Barriers to Shared Mobility
Trust Over-regulationAdequate regulation Experiences not consistent
Technology platforms, easy to use Lack of trust until recommended by someonethey trust
Rethinking value of ownership Set-up costs and lack of profit (risk)Long held norms and values (independence, private
space, status)
Web 2.0 (Web 2.0 refers to the current state of the web, where there are more user-generated content and usability for end-users) has increased the amount of user-generatedcontent and altered the way information is created and consumed [51]. Collaborationbetween users online is conducted through peer-to-peer platforms [52]. A range of fac-tors affect participation in these systems, including reputation, enjoyment, and extrinsicmotivation [52,53]. Social media enables interactions in social commerce, in which usercontributions are incorporated into the purchasing and selling process. Online recom-mendations from friends and, to a lesser extent, others can be highly compelling when itcomes to persuading someone to purchase a product [50]. It is through the vast number ofsocial network members that social commerce achieves influence. The users’ attitude andbehaviour are critically affected by word of mouth [54]. Trust is a crucial feature of sharedmobility. The majority of consumers will only trust a service or regard it as good if it hasbeen suggested by someone they trust [50]. Ride sharing, for instance, relies on passengers’trust in the driver to complete the route safely, making driver recommendations extremelyvaluable when choosing this method of transport.
The rapid growth in shared mobility is supported by the prevalence of mobile internettechnology and cutting-edge technologies such as the Global Positioning System (GPS) andcloud computing techniques. The speed in communication provided by mobile devicesis crucial in a variety of transportation-related circumstances. Due to the rise of thesmartphone industry, a competitive market has evolved for smartphone applications thatfulfils a specific purpose, such as organizing a ride [55]. However, smartphones haveweaknesses such as limited battery capacity, slow data transfer speeds, postponed inputfunction, and narrow screens [56].
Not many people can afford the expensive costs required to remain the owner of aprivate car affected by unstable fuel prices, increasing maintenance costs, and the insuranceand purchase cost of the car. This makes car sharing attractive to more and more people.Users can enjoy a variety of cars depending on their current requests without the burdenof a car purchase [41]. Moreover, consumption habits have changed in the last decade [57].Consumers seem to prefer to pay for the experience of short-time access to property thanbuying and owning them [58]. Ownership is no longer the final expression of consumerdesire [59].
The transport sector is regulated heavily in most countries to ensure sustainability forpublic interests, but this may damage innovation. Many researchers have debated the rightlevel of regulation to serve public values and the private sector. The development of sharedmobility requires the support and implementation of facilitative legislation [60]. Transportregulation lags behind innovation in the industry and does not adequately accommodatenew phenomena such as ride sharing or car sharing, and this may become an obstacle forshared mobility growth. For example, in Sweden, the lack of a formal definition of carsharing caused difficulties for local governments when designating parking for car sharingvehicles [60].
3.4. In-Depth Analysis—Barriers to Shared Mobility
Shared mobility involves a level of service risk (Table 1). While guidelines can be usedto formulate decisions, the overall service experience is likely to be inconsistent. Generally,
Sustainability 2021, 13, 8766 7 of 14
trust is absent until someone makes a suggestion. Several countries initially opposedride sharing, for instance, Australia, although this has recently shifted in most states [61].Nonetheless, an overabundance of ride sharing restrictions could make it complicatedand costly for drivers to start this type of business [62]. Some argue for the developmentof more comprehensive laws that do not inhibit innovation. Before, regulators treatedthe sharing economy exclusively through the lens of established procedures. Since manysharing economy practices blur the line between personal and business activity, a new legalframework is required. A minimal set of legal standards is required to take the distinctivecharacteristics of innovative sharing economy practices into account and allow for futuredevelopment [63]. However, it is stated that the aims of local governments and sharingeconomy enterprises are frequently aligned and that ride sharing enterprises must take theinitiative in advocating for themselves [62]. Additionally, there has been significant debateover whether Uber drivers can earn a decent profit given the associated cost [50].
Despite the sharp growth in ride sharing, some argue that its influence on the transportlandscape is primarily small. It is typically limited to metropolitan areas and more well-educated, young adults [64]. Additionally, it is frequently used to replace single-occupantdriving excursions. One survey on millennials across California discovered that they wouldhave walked or cycled if they had not used ride sharing, even though previous generationssaid they would have driven [65]. How ride sharing affects car miles travelled can varyaccording to the local context, passenger characteristics, land-use features, and alternativemodes of transportation [14]. Multiple people can share a ride in a vehicle with newerservices. If this type of service becomes popular, car miles will be reduced [65].
Barriers to the growth in shared mobility also stem from long-held customs and beliefs,such as the desire to maintain independence, the importance put on maintaining privatespace, and the status conferred by private automobile ownership.
4. Wanneroo Case study4.1. Methods and Measures
Based on factors identified from the existing literature and the input of various stake-holders, a questionnaire was developed. An invitation to complete the anonymous onlinequestionnaire was provided to Wanneroo residents and those travelling around Wanneroo,18 years of age or over. We received and analysed 220 completed questionnaires. Thisnumber of respondents was deemed satisfactory, given that 8500 people aged 18 and orlive in Wanneroo. The demographic breakdown of participants roughly represents themale/female ratio, ages, number of children and household income of those living inWanneroo [4].
The questionnaire was divided into three sections. The first part covered informationon social demographic characteristics such as age, gender, number of children in the home,and annual income.
The second part categorised respondents as shared mobility users and non-sharedmobility users based on their self-reported behaviour for various types of trips. Thequestions are designed to answer two questions: (1) the use of shared mobility in the pastyear, taking into account age and number of children at the address, and (2) the use ofshared mobility in the next 12 months. The intention to use shared mobility options inthe future was measured using a six-point Likert scale (1: Yes; 2: Very likely; 3: Unsure;4: Unlikely; 5: No; 6: Unavailable to me)
The third section assessed participant attitudes towards four shared mobility options—ride sharing, car sharing, carpooling, and bike sharing—in relation to participant age andannual income before tax. All items were evaluated on a five-point Likert scale, rangingfrom 1 (clearly describes my feelings) to 5 (does not describe my feelings). The followingTables 2–5 summarise the demographic data obtained from participants: Table 2. Age ofrespondents; Table 3. Gender of respondents; Table 4. Number of children living at theaddress; Table 5. Annual household income of respondents.
Sustainability 2021, 13, 8766 8 of 14
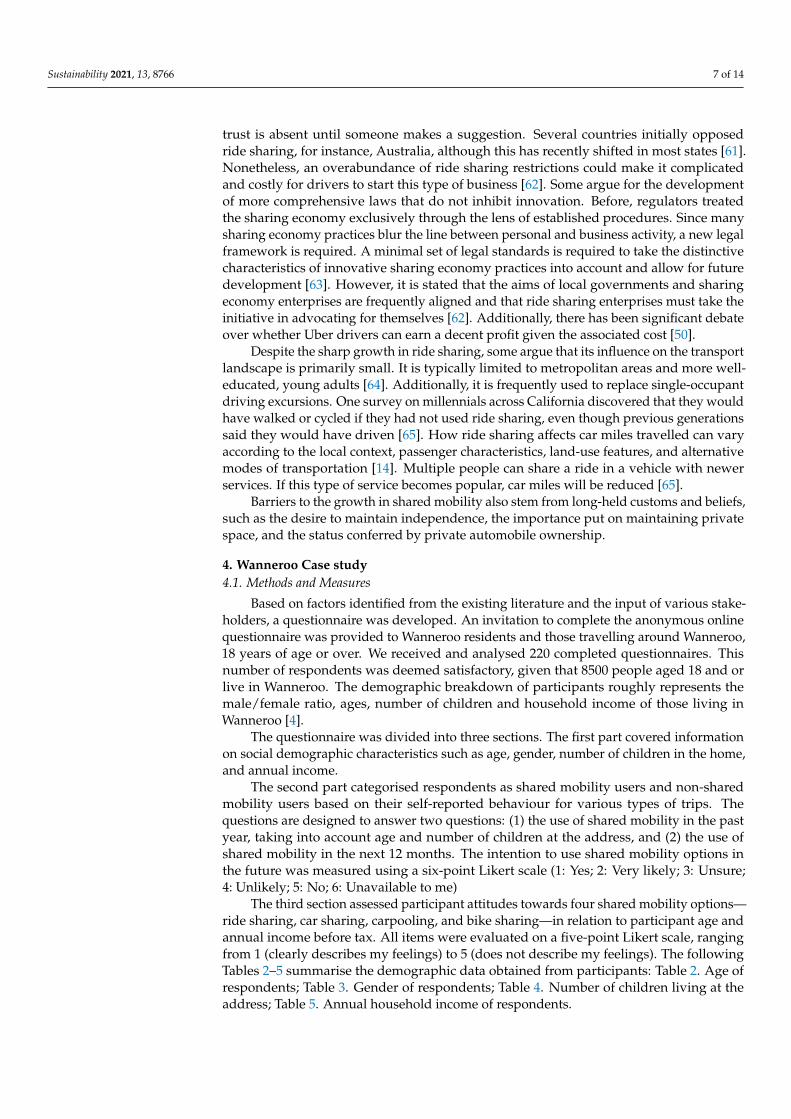
Table 2. Age of respondents.
Age Frequency Percentage
18–24 16 825–34 44 2035–44 61 2845–54 44 2055–64 36 1665–74 16 7
75 or over 3 1
Table 3. Gender of respondents.
Gender Frequency Percentage
Male 86 39Female 134 61
Transgender 0 0Not identify as female, male
or transgender 0 0
Table 4. Number of children living at the address.
Number of Children Living at this Address Frequency Percentage
0 112 511 39 182 46 213 17 84 4 2
More than 4 2 1
Table 5. Annual household income of respondents.
Annual Household Income Frequency Percentage
Under $10,400 11 5$10,400–$20,799 11 5$20,800–$36,399 24 11$36,400–$51,999 33 15$52,000–$77,999 31 14$78,000–$103,999 33 15
$104,000–$129,999 20 9$130,000 and over 24 11
Prefer not to answer 33 15
Our sample consisted of 220 Wanneroo residents and those travelling around Wan-neroo, 18 years of age or over. We divided the respondents into seven age groups: (1) eightper cent were between the ages of 18 and 24, (2) twenty per cent were between the agesof 25 and 34, (3) twenty-eight per cent were between the ages of 35 and 44, (4) twenty percent were between the ages of 45 and 54, (5) sixteen per cent were between the ages of 55and 64, (6) seven per cent were between the ages of 65 and 74, and (7) one per cent were75 or older. Number of children, participant gender, and income level were also consid-ered. More women than men answered the questionnaire (sixty-one per cent comparedto thirty-nine per cent), and approximately fifty-one per cent of respondents have zerochildren. Thirty-nine per cent of the participants have one or two children. Income levelfor thirty-six per cent of respondents was less than AUD 52,000, while only thirteen percent had an income level of AUD 130,000 and over.

Sustainability 2021, 13, 8766 9 of 14
4.2. Results and Discussion
The following section presents a selection of results from the survey on respondentattitude and use of shared mobility. See Table 6.
Table 6. Use of shared mobility in the past year (excludes taxi services).
Age
Use in the Past Year
Ride Sharing Service Car Sharing Services Carpooling Bike Sharing Scheme
Yes No Yes No Yes No Yes No
18–24 66.67% 33.33% 22.22% 77.78% 33.33% 66.67% 0.00% 100.00%25–34 58.33% 41.67% 4.17% 95.83% 29.17% 70.83% 12.50% 87.50%35–44 42.86% 57.14% 17.14% 82.86% 26.47% 73.53% 0.00% 100.00%45–54 45.83% 54.17% 8.33% 91.67% 8.33% 91.67% 4.17% 95.83%55–64 19.05% 80.95% 9.52% 90.48% 31.82% 68.18% 0.00% 100.00%65–74 11.11% 88.89% 0.00% 100.00% 11.11% 88.89% 0.00% 100.00%>75 0.00% 100.00% 0.00% 100.00% 0.00% 100.00% 0.00% 100.00%
Total 41.80% 58.20% 10.66% 89.34% 23.77% 76.23% 3.31% 96.69%
Nearly forty-two per cent of respondents used ride sharing in the past year. Althoughmost users were in the 18–24 age group, all age groups below 55 were not far behind. Usewas lower for those aged 55 or over but it still remained a significant option. Car sharingwas used less than ride sharing, but it still accounted for over ten per cent of respondents.Carpooling is a widely used mode of travel with almost one-quarter of respondents havingcarpooled in the past year. Bike sharing was less commonly used than the other forms ofshared mobility. See Table 7.
Table 7. Number of children and the use of shared mobility in the past year.
Number of Children at This Address
0 1 2 3 4 >4 Total
In the last 12 months, I have used the followingsharing transport option—ride sharing service
Yes 44% 44% 28% 36% 0% 0% 40%No 56% 56% 72% 64% 100% 100% 60%
In the last 12 months, I have used the followingsharing transport option—car sharing services
Yes 8% 12% 12% 25% 50% 50% 12%No 92% 88% 88% 75% 50% 50% 88%
In the last 12 months, I have used the followingsharing transport option—carpooling arrangement
Yes 25% 17% 16% 18% 100% 100% 22%No 75% 83% 84% 82% 0% 0% 78%
In the last 12 months, I have used the followingsharing transport option—bike sharing scheme
Yes 4% 4% 4% 0% 0% 50% 4%No 96% 96% 96% 100% 100% 50% 96%
Household size in terms of number of children did not make an impact on the useof shared mobility and families of all sizes used shared mobility options for travel. Textcomments from respondents indicated that they would use shared mobility more if safetydevices such as child restraints and baby seats were fitted in vehicles. See Table 8.
The pattern of use of shared mobility in the next 12 months was quite similar to thatof shared mobility options used in the past year. The majority of the respondents in theage groups 18–24 and 55 or over reported that shared mobility options were not availableto them. The highest group of intention users was the 25–54 age group, followed by the18–24 age group. Use decreased sharply for the 55 or over group. Ride sharing was selectedthe most, followed by carpooling. Car sharing was considered more by the 55–64 agegroup. Bike sharing continued to be less commonly considered than the other forms ofshared mobility. See Table 9.

Sustainability 2021, 13, 8766 10 of 14
Table 8. Age and the use of shared mobility in the next 12 months.
AgeTotal
18–24 25–34 35–44 45–54 55–64 65–74 >75
I will use ride sharing moreoften in the next 12 months
Yes 0% 9% 6% 18% 0% 0% 0% 7%Very likely 14% 18% 22% 27% 11% 0% 0% 19%
Unsure 14% 18% 17% 18% 67% 33% 0% 25%Unlikely 0% 36% 39% 9% 0% 0% 0% 20%
No 14% 9% 11% 18% 0% 33% 0% 12%Unavailable to me 58% 10% 5% 10% 22% 34% 100% 17%
I will use car sharing moreoften in the next 12 months
Yes 14% 0% 6% 0% 11% 0% 0% 5%Very likely 0% 9% 17% 9% 11% 0% 0% 10%
Unsure 14% 18% 17% 27% 56% 33% 0% 25%Unlikely 0% 45% 33% 27% 0% 0% 0% 24%
No 29% 18% 11% 27% 0% 33% 0% 17%Unavailable to me 43% 10% 16% 10% 22% 34% 100% 19%
I will use carpooling moreoften in the next 12 months
Yes 14% 0% 6% 0% 0% 33% 0% 5%Very likely 14% 18% 22% 27% 11% 0% 0% 19%
Unsure 14% 9% 22% 9% 44% 33% 0% 20%Unlikely 0% 36% 33% 36% 11% 0% 0% 25%
No 14% 27% 11% 18% 12% 0% 0% 15%Unavailable to me 44% 10% 6% 10% 22% 34% 100% 16%
I will use bike sharing moreoften in the next 12 months
Yes 0% 9% 0% 8% 0% 0% 0% 3%Very likely 0% 0% 6% 8% 11% 0% 0% 5%
Unsure 0% 0% 22% 8% 12% 0% 0% 10%Unlikely 14% 55% 39% 9% 0% 0% 0% 25%
No 15% 9% 17% 67% 33% 67% 0% 30%Unavailable to me 71% 27% 16% 0% 44% 33% 100% 27%
Table 9. Age and attitude towards shared mobility.
AgeTotal
18–24 25–34 35–44 45–54 55–64 65–74 >75
I am positive aboutride sharing
Describes my feelings 62% 81% 61% 63% 56% 38% 0% 63%Does not describe
my feelings 38% 19% 39% 37% 44% 63% 100% 37%
I am positive aboutcar sharing
Describes my feelings 43% 57% 48% 50% 61% 14% 0% 50%Does not describe
my feelings 57% 43% 52% 50% 39% 86% 100% 50%
I am positive aboutcarpooling
Describes my feelings 62% 62% 45% 50% 72% 50% 0% 56%Does not describe
my feelings 38% 38% 55% 50% 28% 50% 100% 44%
I am positive aboutbike sharing
Describes my feelings 13% 43% 40% 35% 47% 29% 0% 38%Does not describe
my feelings 87% 57% 60% 65% 53% 71% 100% 62%
Respondents generally have positive feelings towards ride sharing, with sixty-threeper cent positive and thirty-seven per cent not positive. The results were evenly divided forcar sharing (50%–50%), and more were positive towards carpooling (56%) than not positive(44%). Thirty-eight per cent of respondents felt positively about bike sharing as opposed tosixty-two per cent who did not. This is in contrast to the low percentage of people whohave actually used bike sharing in the past year. Positive attitude towards shared mobilityreduced as the age of respondents increased. See Table 10.

Sustainability 2021, 13, 8766 11 of 14
Table 10. Income and attitude towards shared mobility.
Annual Income before Tax Total
$1–$10,399
$10,400–$20,799
$20,800–$36,399
$36,400–$51,999
$52,000–$77,999
$78,000–$103,999
$104,000–$129,999
$130,000or Over
Prefer not toAnswer
“I am positiveabout
ride sharing”
Describes myfeelings 57% 75% 62.5% 50% 75% 75% 77% 69% 47% 65%
Does not describemy feelings 43% 25% 37.5% 50% 25% 25% 23% 31% 53% 35%
“I am positiveabout
car sharing”
Describes myfeelings 43% 33% 56% 64% 55% 60% 62% 50% 25% 52%
Does not describemy feelings 57% 67% 44% 36% 45% 40% 38% 50% 75% 48%
“I am positiveabout
carpooling”
Describes myfeelings 57% 33% 60% 64% 67% 62.5% 69% 33% 37.5% 56%
Does not describemy feelings 43% 67% 40% 36% 33% 37.5% 31% 67% 62.5% 44%
“I am positiveabout
bike sharing”
Describes myfeelings 29% 33% 40% 43% 48% 60.% 23% 36% 33% 43%
Does not describemy feelings 71% 67% 60% 57% 52% 40.% 77% 64% 67% 57%
The literature assumes that cost savings are a key driver in the use of shared mobility.However, no discernible pattern can be detected in relation to income and attitude towardsshared mobility from these data. Therefore, as the results indicate that preference for sharedmobility is not related to income level, cost savings may not be a key driver, or all incomelevels may be equally concerned about cost savings.
Most of the users of shared mobility in the past year and the next 12 months were inthe younger age groups (under 54). This result is in line with the literature [41,66], reportingthat the highest car sharing members had a low mean age. Older respondents were lesspositive about shared mobility options than the younger age groups, consistent with theresults reported for use of shared mobility, indicating that attitudes were the key driverin shaping choices [67]. Bike sharing challenges include strict cycling regulations, such asthe fact that wearing a helmet is compulsory in Australia, which may make the schemesimpractical for some respondents. Further, there is concern about safety when cyclingon heavily car-dominated roads that lack adequate bicycle infrastructure [68]. Althoughincome was found to have a strong relationship with use of shared mobility in manyexisting literature reviews [4,68,69], our study did not find a link between cost savings andshared mobility services. An in-depth regression analysis needs to be conducted to clarifythe impact of income factors on the use of shared mobility.
5. Conclusions and Recommendation
Our study investigated approximately 700 papers obtained from the Scopus databaseto determine contemporary research clusters on shared mobility. The findings from biblio-metric analysis were then applied for the case study of Wanneroo, Australia. A speciallydesigned questionnaire was sent to Wanneroo residents and those travelling around Wan-neroo, 18 years of age or over, in order to investigate use of shared mobility and residents’future behaviour intentions.
Our findings suggest several vital insights. First, most respondents who had usedshared mobility options in the past year were in the younger age groups (55 or lower).Second, participants in the younger age groups seemed to be more optimistic about sharedmobility and were likely to use the service in the next 12 months. Third, household sizemeasured by number of children was not associated with use of shared mobility. Fourth,no discernible relationship between annual income and positive attitude towards sharedmobility was found. Fifth, bike sharing was less commonly used than the other forms ofshared mobility.
The survey findings draw several suggestions for Wanneroo City Council and trans-portation authorities in Western Australia to consider when developing transport planningdocuments. The sharing economy has impacted travel behaviour and will continue to
Sustainability 2021, 13, 8766 12 of 14
evolve along with technological advancements. These innovations must be integratedinto transportation planning, striking a balance between the demand for mode choiceand service equality. Further, more policies need to be introduced to build up trust inshared mobility services among the older age group and encourage this population touse shared mobility programs. Last but not least, policy makers should concentrate onincreasing public awareness of shared mobility options, especially bike sharing servicesand provide incentives for participation, such as implementing the restriction of road lanesfor vehicles carrying fewer than two passengers during rush hours. Although few peopleused bike sharing, there seems to be interest in this form of shared mobility among asignificant portion of residents, so more promotional support and further development ofbike lanes/zones for rider safety need to be investigated.
Author Contributions: C.S., F.J., S.B., and S.S., conceptualization; F.J. and T.L., data curation; C.S.,F.J., and T.L., formal analysis; C.S., F.J., S.B., and S.S., investigation; C.S., F.J., and T.L., methodology;F.J., C.S., S.B., and S.S., project administration; F.J., C.S., S.B., and S.S., resources; T.L., software; F.J.,supervision; F.J., validation; C.S., F.J., and T.L., visualization; C.S., F.J., and T.L., roles/writing—original draft; F.J., C.S., and T.L., writing—review and editing. All authors have read and agreed tothe published version of the manuscript.
Funding: This research received no external funding.
Institutional Review Board Statement: Not applicable.
Informed Consent Statement: Not applicable.
Data Availability Statement: Data are not available.
Conflicts of Interest: The authors declare no conflict of interest.
References1. Meng, L.; Somenahalli, S.; Berry, S. Policy implementation of multi-modal (shared) mobility: Review of a supply-demand value
proposition canvas. Transp. Rev. 2020, 40, 670–684. [CrossRef]2. Shaheen, S.; Chan, N.; Bansal, A.; Cohen, A. Shared Mobility: A Sustainability and Technologies Workshop—Definitions, Industry
Developments, and Early Understanding; Transportation Sustainability Research Center, University of California, Berkeley andCalifornia Department of Transportation: Richmond, CA, USA, 2015.
3. Jiao, J.; Bischak, C.; Hyden, S. The impact of shared mobility on trip generation behavior in the US: Findings from the 2017National Household Travel Survey. Travel Behav. Soc. 2020, 19, 1–7. [CrossRef]
4. Jie, F.; Standing, C.; Biermann, S.; Standing, S.; Le, T. Factors affecting the adoption of shared mobility systems: Evidence fromAustralia. Res. Transp. Bus. Manag. 2021, 100651. [CrossRef]
5. Rauch, D.E.; Schleicher, D. Like Uber, but for Local Government Policy: The Future of Local Regulation of the “Shared Economy”; MarronInstitute of Urban Management: New York, NY, USA, 2015.
6. McKenzie, G. Urban mobility in the sharing economy: A spatiotemporal comparison of shared mobility services. Comput. Environ.Urban Syst. 2020, 79, 101418. [CrossRef]
7. Mourad, A.; Puchinger, J.; Chu, C. A survey of models and algorithms for optimizing shared mobility. Transp. Res. Part B Methodol.2019, 123, 323–346. [CrossRef]
8. Shokouhyar, S.; Shokoohyar, S.; Sobhani, A.; Gorizi, A.J. Shared mobility in post-COVID era: New challenges and opportunities.Sustain. Cities Soc. 2021, 67, 102714. [CrossRef]
9. Hu, J.W.; Creutzig, F. A systematic review on shared mobility in China. Int. J. Sustain. Transp. 2021, 1–16. [CrossRef]10. Anair, D.; Martin, J.; Moura, M.C.P.D.; Goldman, J. Ride-Hailing’s Climate Risks: Steering a Growing Industry toward a Clean
Transportation Future. Union of Concerned Scientists. 2020. Available online: https://www.ucsusa.org/resources/ride-hailing-climate-risks (accessed on 10 July 2021).
11. Suatmadi, A.Y.; Creutzig, F.; Otto, I.M. On-demand motorcycle taxis improve mobility, not sustainability. Case Stud. Transp. Policy2019, 7, 218–229. [CrossRef]
12. Berger, C.; Chen, C.; Frey, B. Drivers of disruption? Estimating the Uber effect. Eur. Econ. Rev. 2018, 110, 197–210. [CrossRef]13. Wallsten, S. The competitive effects of the sharing economy: How is Uber changing taxis? Technol. Policy Inst. 2015, 22, 1–21.14. Goebel, B. Are Uber and Lyft Really ‘Disrupting’ Transportation? KQED News. 2015. Available online: https://www.kqed.org/
news/10766036/are-uber-and-lyft-really-disrupting-transportation (accessed on 20 January 2019).15. Burghard, U.; Dütschke, E. Who wants shared mobility? Lessons from early adopters and mainstream drivers on electric
carsharing in Germany. Transp. Res. Part D Transp. Environ. 2019, 71, 96–109. [CrossRef]

Sustainability 2021, 13, 8766 13 of 14
16. Brimont, L.; Demailly, D.; Saujot, M.; Sartor, O. The New Collaborative Mobility Actors: From Promises to Challenges for PublicAuthorities. IDDRI. 2016. Available online: https://www.iddri.org/en/publications-and-events/study/new-collaborative-mobility-actors-promises-challenges-public (accessed on 20 January 2019).
17. Neoh, J.G.; Chipulu, M.; Marshall, A. What encourages people to carpool? An evaluation of factors with meta-analysis.Transportation 2017, 44, 423–447. [CrossRef]
18. Loa, P.; Habib, K.N. Examining the influence of attitudinal factors on the use of ride-hailing services in Toronto. Transp. Res. PartA Policy Pract. 2021, 146, 13–28. [CrossRef]
19. McGrath, F. The Demographics of Uber’s US Users. 16 August 2015. Available online: https://blog.globalwebindex.com/chart-of-the-day/uber-demographics/ (accessed on 15 January 2019).
20. Atkinson-Palombo, C.; Varone, L.; Garrick, N.W. Understanding the Surprising and Oversized Use of Ridesourcing Services inPoor Neighborhoods in New York City. Transp. Res. Rec. 2019, 2673, 185–194. [CrossRef]
21. Brown, A.E. Who and where rideshares? Rideshare travel and use in Los Angeles. Transp. Res. Part A 2020, 136, 120–134.[CrossRef]
22. Gehrke, S.R.; Felix, A.; Reardon, T.G. Fare Choices: A Survey of Ride-hailing Passengers in Metro Boston. 2018. Available online:http://www.mapc.org/wp-content/uploads/2018/02/Fare-Choices-MAPC.pdf (accessed on 20 July 2020).
23. Anaya-Boig, E.; Douch, J.; Castro, A. The death and life of bike-sharing schemes in Spain: 2003–2018. Transp. Res. Part A PolicyPract. 2021, 149, 227–236. [CrossRef]
24. Radzimski, A.; Dziecielski, M. Exploring the relationship between bike-sharing and public transport in Poznan, Poland. Transp.Res. Part A Policy Pract. 2021, 145, 189–202. [CrossRef]
25. Nagariya, R.; Kumar, D.; Kumar, I. Service supply chain: From bibliometric analysis to content analysis, current research trendsand future research directions. Benchmarking Int. J. 2020, 28, 333–369. [CrossRef]
26. Clauset, A.; Newman, M.E.J.; Moore, C. Finding community structure in very large networks. Phys. Rev. 2004, 70, 1–6. [CrossRef]27. Radicchi, F.; Castellano, C.; Cecconi, F.; Loreto, V.; Parisi, D. Defining and identifying communities in networks. Proc. Natl. Acad.
Sci. USA 2004, 101, 2658–2663. [CrossRef] [PubMed]28. Blondel, V.D.; Guillaume, J.L.; Lambiotte, R.; Lefebvre, E. Fast unfolding of communities in large networks. J. Stat. Mech. Theor.
Exp. 2008, 2008, P10008. [CrossRef]29. Xu, X.; Chen, X.; Jia, F.; Brown, S.; Gong, Y.; Xu, Y. Supply chain finance: A systematic literature review and bibliometric analysis.
Int. J. Prod. Econ. 2018, 204, 160–173. [CrossRef]30. Business Travel. A New Report Explores the Benefits of Uber. 2016. Available online: http://www.news.com.au/finance/
business/travel/a-new-report-explores-the-benefits-of-uber/newsstory/5e41687c9bc2614f07015f85eb784f7f (accessed on 20January 2019).
31. Deloitte. Review of the Collaborative Economy in NSW. 2015. Available online: https://www.finance.nsw.gov.au/sites/default/files/Deloitte_Report_Review_Collaborative_Economy.pdf (accessed on 20 January 2019).
32. Deloitte. Economic Effects of Ridesharing in Australia. Uber. 2016. Available online: https://www2.deloitte.com/au/en/pages/economics/articles/economic-effects-ridesharing-australia-uber.html (accessed on 20 January 2019).
33. Eggers, W.D.; Macmillan, P. Why governments should get behind ride-sharing. Harv. Bus. Rev. 2013, 13. Available online:https://hbr.org/2013/11/why-governments-should-get-behind-ride-sharing (accessed on 20 January 2019).
34. Belk, R. You are what you can access: Sharing and collaborative consumption online. J. Bus. Res. 2014, 67, 1595–1600. [CrossRef]35. Caulfield, B. Estimating the environmental benefits of ride-sharing: A case study of Dublin. Transp. Res. Part D Transp. Environ.
2009, 14, 527–531. [CrossRef]36. Delhomme, P.; Gheorghiu, A. Comparing French carpoolers and non-carpoolers: Which factors contribute the most to carpooling?
Transp. Res. Part D Transp. Environ. 2016, 42, 1–15. [CrossRef]37. Viti, F.; Croman, F. Equilibrium and sensitivity analysis of dynamic rider sharing. In Proceedings of the 16th International IEEE
Annual Conference on Intelligent Transportation System, The Hague, The Netherlands, 6–9 October 2013.38. Deakin, E.; Karen, T.F.; Kevin, M.S. Markets for dynamic ride-sharing? Case study of Berkeley, California. Transp. Res. Rec. J.
Transp. Res. Board 2011, 2178, 131–137.39. Vanoutrive, T.; Van De Vijver, E.; Van Malderen, L.; Jourquin, B.; Thomas, I.; Verhetsel, A.; Witlox, F. What determines carpooling
to workplaces in Belgium: Location, organisation, or promotion? J. Transp. Geogr. 2012, 22, 77–86. [CrossRef]40. Coll, M.H.; Vandersmissen, M.H.; Theriault, M. Modelling spatio-temporal diffusion of car-sharing membership in Quebec City.
J. Transp. Geogr. 2014, 38, 22–37. [CrossRef]41. Efthymiou, D.; Antoniou, C.; Waddell, P. Factors affecting the adoption of vehicle sharing systems by young drivers. Transp.
Policy 2013, 29, 64–73. [CrossRef]42. Prieto, M.; Baltas, G.; Stan, V. Car sharing adoption intention in urban areas: What are the key sociodemographic drivers? Transp.
Res. Part A Policy Pract. 2017, 101, 218–227. [CrossRef]43. Campbell, A.A.; Cherry, C.R.; Ryerson, M.S.; Yang, X. Factors influencing the choice of shared bicycles and shared electric bikes in
Beijing. Transp. Res. Part C Emerg. Technol. 2016, 67, 399–414. [CrossRef]44. Fishman, E.; Washington, S.; Haworth, N. Barriers and facilitators to public bicycle scheme use: A qualitative approach. Transp.
Res. Part F Traffic Psychol. Behav. 2012, 15, 686–698. [CrossRef]
Sustainability 2021, 13, 8766 14 of 14
45. Zhao, J.; Deng, W.; Song, Y. Ridership and effectiveness of bike sharing: The effects of urban features and system characteristicson daily use and turnover rate of public bikes in China. Transp. Policy 2014, 35, 253–264. [CrossRef]
46. Rixey, R. Station-Level Forecasting of bikesharing ridership: Station network effects in Three US systems. Transp. Res. Rec. J.Transp. Res. Board 2013, 2387, 46–55. [CrossRef]
47. Wang, X.; Lindsey, G.; Schoner, J.E.; Harrison, A. Modeling bike share station activity: Effects of nearby businesses and jobs ontrips to and from Stations. J. Urban Plan. Dev. 2015, 142, 04015001. [CrossRef]
48. Faghih-Imani, A.; Eluru, N.; El-Geneidy, A.M.; Rabbat, M.; Haq, U. How land-use and urban form impact bicycle flows: Evidencefrom the bicycle-sharing system (BIXI) in Montreal. J. Transp. Geogr. 2014, 41, 306–314. [CrossRef]
49. Guo, Y.; Zhou, J.; Wu, Y.; Li, Z. Identifying the factors affecting bike-sharing usage and degree of satisfaction in Ningbo, China.PLoS ONE 2017, 12, e0185100. [CrossRef]
50. Standing, C.; Standing, S.; Biermann, S. The implications of the sharing economy for transport. Transp. Rev. 2019, 39, 226–242.[CrossRef]
51. Kaplan, A.M.; Haenlein, M. Users of the world, unite! The challenges and opportunities of Social Media. Bus. Horiz. 2010, 53,59–68. [CrossRef]
52. Hamari, J.; Sjöklint, M.; Ukkonen, A. The sharing economy: Why people participate in collaborative consumption. J. Assoc. Inf.Science Technol. 2015, 67, 2047–2059. [CrossRef]
53. Wasko, M.M.; Faraj, S. Why should I share? Examining social capital and knowledge contribution in electronic networks ofpractice. MIS Q. 2005, 29, 35–57. [CrossRef]
54. Liang, T.P.; Turban, E. Introduction to the special issue social commerce: A research framework for social commerce. Int. J.Electron. Commer. 2011, 16, 5–14. [CrossRef]
55. Harding, S.; Kandlikar, M.; Gulati, S. Taxi apps, regulation, and the market for taxi journeys. Transp. Res. Part A Policy Pract. 2016,88, 15–25. [CrossRef]
56. Parise, S.; Guinan, P.J.; Kafka, R. Solving the crisis of immediacy: How digital technology can transform the customer experience.Bus. Horiz. 2016, 59, 411–420. [CrossRef]
57. Bardhi, F.; Eckhardt, G.M. Access-Based Consumption: The Case of Car Sharing. J. Consum. Res. 2012, 39, 881–898. [CrossRef]58. Rifkin, J. The Age of Access: The New Culture of Hypercapitalism Where All of Life Is a Paid for Experience; Penguin Putnam, Inc.:
New York, NY, USA, 2000.59. Chen, Y. Possession and Access: Consumer Desires and Value Perceptions Regarding Contemporary Art Collection and Exhibit
Visits. J. Consum. Res. 2009, 35, 925–940. [CrossRef]60. Karlsson, I.C.M.; Mukhtar-Landgren, D.; Smith, G.; Koglin, T.; Kronsell, A.; Lund, E.; Sarasini, S.; Sochor, J. Development and
implementation of Mobility-as-a-Service—A qualitative study of barriers and enabling factors. Transp. Res. Part A Policy Pract.2020, 131, 283–295. [CrossRef]
61. Washington, D. State Govt and Uber End Standoff. 2017. Available online: http://indaily.com.au/news/local/2017/03/31/state-govt-and-uber-end-stand-off/ (accessed on 20 January 2019).
62. Cannon, S.; Summers, L.H. How Uber and the sharing economy can win over regulators. Harv. Bus. Rev. 2014, 13, 24–28. Availableonline: https://hbr.org/2014/10/how-uber-and-the-sharing-economy-can-win-over-regulators (accessed on 20 January 2019).
63. Ranchordás, S. Does sharing mean caring: Regulating innovation in the sharing economy. Minn. JL Sci. Tech. 2015, 16, 413.64. Rayle, L.; Shaheen, S.; Chan, N.; Dai, D.; Cervero, R. App-Based, On-Demand Ride Services: Comparing Taxi and Ride sourcing Trips
and User Characteristics in San Francisco University of California Transportation Center (UCTC); University of California: Berkeley, CA,USA, 2014.
65. Circella, G.; Tiedeman, S.H.; Alemi, F.; Mokhtarian, P. What Affects U.S. Passenger Travel? Current Trends and Future Perspectives.National Center for Sustainable Transportation. 2016. Available online: http://www.dot.ca.gov/research/researchreports/reports/2016/CA16-2825_FinalReport.pdf (accessed on 20 January 2019).
66. Becker, H.; Ciari, F.; Axhausen, K.W. Comparing car-sharing schemes in Switzerland: User groups and usage patterns. Transp.Res. Part A Policy Pract. 2017, 97, 17–29. [CrossRef]
67. Rahimi, A.; Azimi, G.; Jin, X. Examining human attitudes toward shared mobility options and autonomous vehicles. Transp. Res.Part F Traffic Psychol. Behav. 2020, 72, 133–154. [CrossRef]
68. Nikitas, A. Understanding bike-sharing acceptability and expected usage patterns in the context of a small city novel to theconcept: A story of ‘Greek Drama’. Transp. Res. Part F Traffic Psychol. Behav. 2018, 56, 306–321. [CrossRef]
69. Dias, F.F.; Lavieri, P.S.; Garikapati, V.M.; Astroza, S.; Pendyala, R.M.; Bhat, C.R. A behavioral choice model of the use of car-sharingand ride-sourcing services. Transportation 2017, 44, 1307–1323. [CrossRef]