analysis of thermoelectric generator performance by use … · analysis of thermoelectric generator...
TRANSCRIPT
Analysis of Thermoelectric Generator Performanceby Use of Simulations and Experiments
OLLE HOGBLOM1 and RONNIE ANDERSSON1,2
1.—Department of Chemical and Biological Engineering, Chalmers University of Technology,41296 Goteborg, Sweden. 2.—e-mail: [email protected]
A method that enables accurate determination of contact resistances in ther-moelectric generators and which gives detailed insight into how these reducemodule performance is presented in this paper. To understand the importancetaking thermal and electrical contact resistances into account in analysis ofthermoelectric generators, full-scale modules were studied. Contact resistanceswere determined by means of non-linear regression analysis on the basis ofresults from 3D finite element simulations and experiments in a setup in whichheat flow, voltage, and current were measured. Statistical evaluation showedthat the model and the identified contact resistances enabled excellent predic-tion of performance over the entire range of operating conditions. It was shownthat if contact resistances were not included in the analysis the simulationssignificantly over-predicted both heat flow and electric power output, and it wasconcluded that contact resistance should always be included in module simu-lations. The method presented in this paper gives detailed insight into howthermoelectric modules perform in general, and also enables prediction of po-tential improvement in module performance by reduction of contact resistances.
Key words: Thermoelectric modeling, thermal contact resistance, electricalcontact resistance
Nomenclaturecp Specific heat capacity, J kg�1 K�1
I Current, AJ Current density, A m�2
P Electric power, WQ Heat flow, WSS Normalized sum of squares errorT Temperature, KU Voltage, V
Greek symbolsa Seebeck coefficient, V K�1
b Thermal contact resistance, m2 K W�1
c Electric contact resistance, X m2
k Thermal conductivity, W m�1 K�1
q Density, kg m�3
r Electric conductivity, X�1 m�1
Subscriptsc Cold sideh Hot side
INTRODUCTION
The development of thermoelectric (TE) devices,for example thermoelectric generators (TEG) andthermoelectric coolers (TEC), relies to a large extenton simulation tools that predict performance. Forthis purpose several studies have been conducted toevaluate the accuracy of different modelingapproaches proposed in the literature.1,2 The modelsproposed in the literature range from simplifiedmacroscopic models based on the global balance ofheat transfer and thermoelectric effects, to three-dimensional simulations based on the finite elementmethod (FEM) that take into account all relevantthermoelectric phenomena, i.e. Seebeck, Peltier,Thomson, and Joule effects.3 Thermoelectric simu-lations based on FEM are becoming widespread,because they provide detailed information aboutpotential, current flow, and temperature distribu-tion within TE modules and readily enable details ofgeometry and non-linear material properties to betaken into account. When performing FEM simula-tions of complete TE modules several unknownproperties related to the characteristics of the
(Received June 30, 2013; accepted January 9, 2014;published online February 4, 2014)
Journal of ELECTRONIC MATERIALS, Vol. 43, No. 6, 2014
DOI: 10.1007/s11664-014-3020-x� 2014 The Author(s). This article is published with open access at Springerlink.com
2247

modules must be determined to complete the model.These include thermal and electrical conductance atdifferent material junctions inside the modules.Whereas the properties of the bulk material, e.g. theSeebeck coefficient, thermal conductivity, and elec-tric resistivity, and their temperature dependence,depend on the choice of n-type and p-type material,thermal conductance, i.e. the inverse of thermalresistance, at interfaces depends on material prop-erties, surface roughness, and applied contact pres-sure.4 Consequently the thermal conductances of thedifferent material junctions inside the modules varysubstantially. Values between 2 9 103 W m�2 K�1
and 1 9 106 W m�2 K�1 are reported in the litera-ture; these correspond to contact resistance in therange 1 9 10�6–5 9 10�4 m2 KW�1, depending onthe specific material junctions. These interfacialresistances can be compared with the thermalresistance of the bulk materials, to assess whether ornot they can be neglected. An estimate of the ther-mal resistance of the bulk is bbulk = L/k. The pelletsinside TE modules are of the order of 1 mm, and thethermal conductivity of the bulk material is typically2 Wm�1 K�1. Consequently, the thermal resistanceof the bulk material is approximately 5 910�4 m2 KW�1. This means the interfaces mayresult in substantial resistance to heat transfercompared with the resistance of the bulk material;they can, therefore, have a substantial effect ontemperature profile, heat flow, and, thus, moduleperformance. Ziolkowski et al.5 have used simula-tions to study contact resistances within TEG andobserved negligible thermal resistance between thepellets and the contact bridges. However, in theirresearch they did not investigate the other thermalcontact resistances present inside a TE module.
Similarly, material junctions also result in elec-trical contact resistances. Ziolkowski reportscontact resistances in the range 1 9 10�9–1 910�7 Xm2, depending on production conditions.Assuming a 1-mm pellet with electrical resistivity of1 9 10�5 Xm, the electrical resistance of the pelletis approximately 1 9 10�8 Xm2. Therefore, electri-cal contact resistances must be determined toenable system-level simulations of TEG modules.
Consequently, neither thermal nor electricalcontact resistances should be neglected when per-forming TEG module simulations. Because contactresistances can, potentially, have a large effect onTEG module simulations, contact resistances insidethe module should be characterized. To this end, inthis paper a system-level analysis of thermal andelectrical contact resistances, how these can bedetermined accurately, and the effect they have onsimulation of TEG performance is reported.
METHODOLOGY
The experimental measurement setup used in thisresearch enabled highly accurate determination ofvoltage, current, and heat flow through TEG modules
exposed to different thermal gradients. An FEMmodel of the thermoelectric generator, includingthermal and electrical contact resistances, was sub-sequently built and simulated by use of Ansys. Sim-ulations were performed for the same operatingconditions as in the experiments, and the contactresistances inside the module were identified by useof non-linear regression analysis. Finally the identi-fied contact resistances were used to predict theperformance of a geometrically different module,manufactured by use of the same process and made ofthe same materials, to assess the consistency of themodel and the measured contact resistances.
EXPERIMENTAL SETUP
To characterize module performance in terms ofheat flow, electric voltage, and current a setupenabling the dependent variables to be measured withhigh accuracy is required. For this purpose the sym-metric experimental setup shown in Fig. 1a was used.It consisted of one electrically heated aluminium blockin the center, with one thermoelectric module on eachside of the block. By measuring the performance of twomodules operating under the same conditions, poten-tial variability between the modules could be identi-fied. Experimental data showed that both modulesgave identical performance for the same temperaturedifference. The high thermal conductivity of alumin-ium ensures even temperature distribution through-out the hot block and, thus, over the module surface.The temperaturesweremeasured withthermocouplesinside the hot block. Measurements at different loca-tions inside the hot block showed that the temperaturevariation was below 1�C, which is insignificant andenables use of constant temperature boundary condi-tions in the simulations.
Water-cooled aluminium blocks were used as heatsinks on the cold side of the modules. Because thewater was heated on its way through the system, thewater channels in the blocks were connected in series,from one block to the other and back again, so thetemperature distribution was as uniform as possible.The mass flow rate of water affected the temperaturedifference between the two cold blocks, i.e. the higherthe mass flow rate of water, the lower the temperaturedifference between the blocks. Temperature mea-surements with thermocouples inside the cold blocksconfirmed that variation between the two blocks wasbelow 2�C, which is low compared with the tempera-ture difference between the cold and hot blocks (in therange 60–150�C) in the experiments, Table I.
The heat flow through the modules was calculatedfrom the energy balance, on the basis of measuredmass flow rates of cooling water and the inlet andoutlet water temperatures in the setup. Conse-quently, the maximum mass flow rate of cooling wa-ter that could be used to minimize the temperaturedifference between the two cold blocks was limited bythe accuracy of measurement of the inlet and outletwater temperatures. The energy balance was possi-
Hogblom and Andersson2248

bly affected by convection and radiation from the coldblocks. Experiments were performed to determinethe heat losses by wrapping the cold block withinsulating material (Superwool 607 HT; MorganAdvanced Materials, UK; thermal conductivity of0.08 Wm�1 K�1) 2 cm. The results showed that los-ses were below 1% in the operating range of interest.
The cold blocks were held together with a clampand two springs to achieve the specified contactpressure for these modules. A photograph of thehardware is shown in Fig. 1b. The two modulesstudied here were commercial bismuth telluridemodules from Thermonamic. The first module,TEHP1-12680-0.15, was 80 mm 9 80 mm and con-sisted of 126 TE pairs; hereinafter this will bereferred to as the ‘‘large module’’. The second mod-ule, TEP1-1264-1.5, was 40 mm 9 40 mm and con-tained 127 TE pairs; this will be referred to as the‘‘small module’’. The dimensions of the pellets andthe connecting bridges and their arrangementinside the modules were determined by opening themodules, thus enabling measurement of interiorparts.
The thermoelectric module was connected in ser-ies with an electronic load, TTI LD300 (ThurlbyThandar Instruments, UK), so the external resis-tance was approximately 0.3 ohm for the largemodule and approximately 3 ohm for the small
module. The resistance was slightly varied at eachload point to achieve a voltage over the module thatwas 50% of the voltage when it was measured atopen circuit at the same temperature. This wasdone to maximize the power delivered by the mod-ules. The hot-side temperature was incremented innine steps and all the measurements were takenwhen steady state conditions were achieved. Datawere sampled by use of a DataTaker DT85 (ThermoFisher Scientific, Australia).
MODEL DESCRIPTION
The thermoelectric modules consisted of severalsmall thermocouples connected electrically in seriesand thermally in parallel, as shown schematically inFig. 2. The external surfaces of the modules werecovered with a thin layer of graphite that had to becompressed to reduce the thermal resistance. Agraphite layer also covered the interior of the mod-ules, between the connecting bridges on the hot sideand the ceramic plate (red in Fig. 2). The connectingbridges were soldered to the pellets on the cold sideand the bridges on the hot side were formed directlyon the pellets by thermal spraying.
The unknown contact resistances included theelectrical contact resistances, on both sides of thethermoelectric pellets, and the thermal contact
Fig. 1. (a) Schematic diagram of the measurement setup. (b) Photograph of the setup.
Table I. Measurement data for the large module, TEHP1-12680-0.15
Load point Th (�C) Tc (�C) U (V) I (A) Q (W) P (W)
1 111 50 0.89 3.13 202 2.82 127 56 1.07 3.53 239 3.83 140 60 1.22 3.90 271 4.84 158 65 1.33 4.26 311 5.75 171 69 1.55 4.71 354 7.36 179 62 1.74 5.22 419 9.17 192 66 1.92 5.49 457 10.58 207 71 2.07 5.88 507 12.29 225 76 2.27 6.06 547 13.8
Analysis of Thermoelectric Generator Performance by Use of Simulations and Experiments 2249

resistances between the pellets and the connectors,and between the connectors and the ceramic plates(Fig. 2). In other words, there were 504 electricalresistances in series and four thermal resistances inseries inside the large module. In this work the Inthis work three contact resistances were used—twothermal contact resistances, one on each side of themodule, and one electrical contact resistance. Thethermal contact resistances in the model wereapplied to the surface between the ceramic plate andthe connecting bridges, as shown in Fig. 2. Therewere also thermal contact resistances between thethermoelectric pellets and the connecting bridges,but, because it is the temperature on the surface ofthe thermoelectric material that is of interest ingeneration of thermoelectricity, these resistanceswere grouped together. The electrical resistanceswere assumed to be the same on the hot and the coldsides, and for the n-type and p-type materials. This isa valid assumption, because the sum of all the elec-trical resistances is what is important here. Theresistances were also assumed not to have any tem-perature dependence.
In thermoelectric calculations the temperature fieldinside the thermoelectric module, the electric chargecontinuity equation, and the thermoelectric constitu-tive equations enable calculation of the current andvoltage.6 The energy equation solved for the thermo-electric material consists of, in addition to the con-duction and accumulation terms, two terms describingohmic heating and thermoelectric conversion (Eq. 1):
�r krTð Þ ¼ qcp@T
@tþ J2
rþraTJ: (1)
The potential field is built up by diffusion of thecharge carrier in the direction of the temperaturegradient and is reduced by ohmic losses, in accor-dance with Eq. 2:
rU ¼ �arT � J=r: (2)
In addition to the contact resistances and theconstitutive equation above, boundary conditions
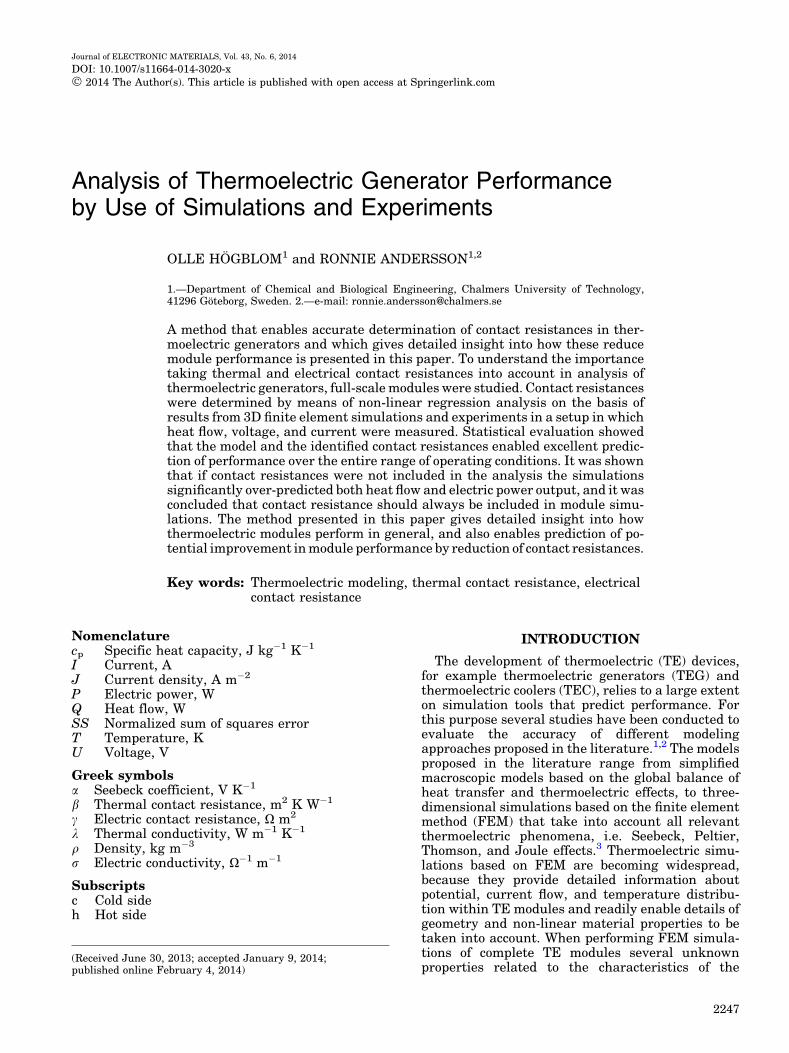
are needed to solve the model. The boundarycondition for the potential field calculations is across section of the electric connector that is elec-trically grounded. The two boundary conditionsused when solving the energy equation are identicalto the two temperatures measured in the alumin-ium blocks. For this reason, the thermal resistancein the outer graphite layer on the modules is in-cluded in the analysis, which is necessary for sys-tem-level simulations. The simulation model isshown in Fig. 3 where the external load is encircled.During the simulations the load was kept at a con-stant temperature, to prevent it being heated, whichwould have affected the heat flow in the module.The resistance was varied by assigning differentresistivity to the load in accordance with the exter-nal load used in the measurements. The geometry ofthe thermoelectric module was discretized withhexahedral elements, and a grid sensitivity analysiswas performed to ensure grid independence in thesimulations.
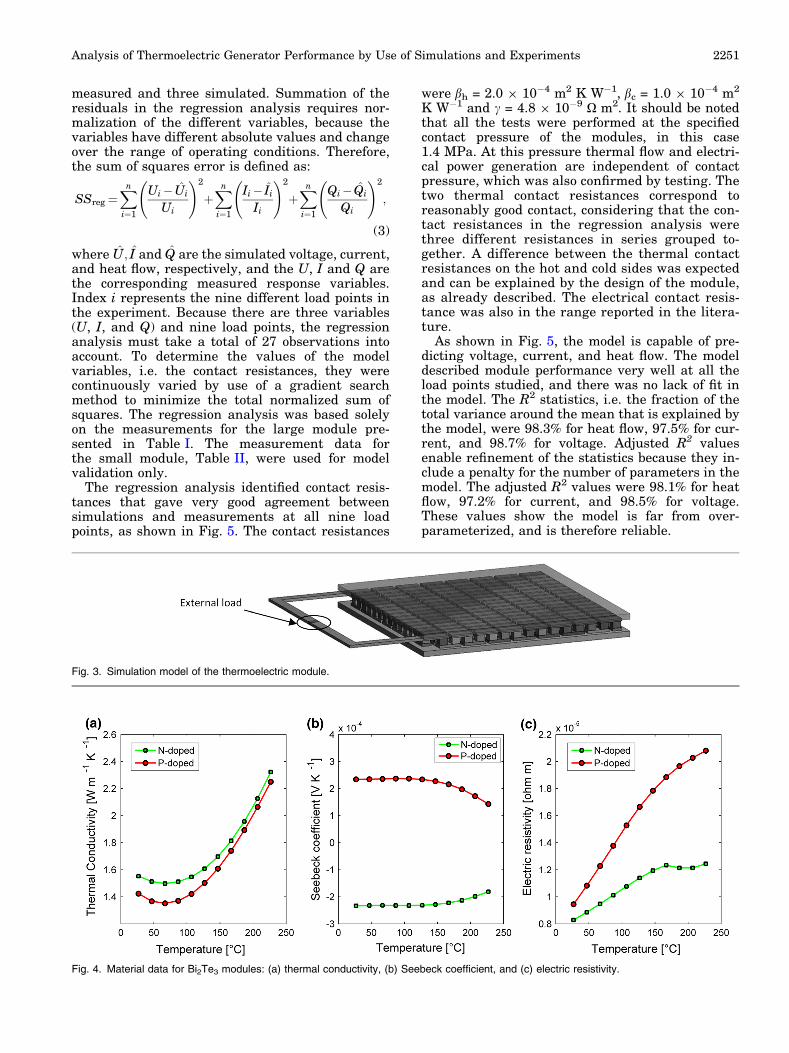
Thermoelectric simulations require relevantmaterial data, for example the Seebeck coefficient,electrical resistivity, and thermal conductivity.Temperature-dependent material data for the bis-muth telluride used in the modules was obtainedfrom the manufacturer,7 and is shown in Fig. 4. Theconnecting bridges inside the modules were made ofcopper on the cold side and aluminium on the hotside. The ceramic plates enclosing the module weremade of aluminium oxide. The temperature depen-dence of all these materials was also included in themodel.
RESULTS
Experiments were conducted under nine differentoperating conditions; the measured data at thesedifferent load points is summarized in Table I.Simulations were performed at identical tempera-tures and external load, as in the experiments. Eachload point had three dependent variables; current,voltage, and heat flow. This means that theregression analysis includes six variables; three
Fig. 2. Contact resistances within the TE modules.
Hogblom and Andersson2250
measured and three simulated. Summation of theresiduals in the regression analysis requires nor-malization of the different variables, because thevariables have different absolute values and changeover the range of operating conditions. Therefore,the sum of squares error is defined as:
SSreg¼Xn
i¼1
Ui� Ui
Ui
!2
þXn
i¼1
Ii� Ii
Ii
!2
þXn
i¼1
Qi� Qi
Qi
!2
;
(3)
where U; I and Q are the simulated voltage, current,and heat flow, respectively, and the U, I and Q arethe corresponding measured response variables.Index i represents the nine different load points inthe experiment. Because there are three variables(U, I, and Q) and nine load points, the regressionanalysis must take a total of 27 observations intoaccount. To determine the values of the modelvariables, i.e. the contact resistances, they werecontinuously varied by use of a gradient searchmethod to minimize the total normalized sum ofsquares. The regression analysis was based solelyon the measurements for the large module pre-sented in Table I. The measurement data forthe small module, Table II, were used for modelvalidation only.
The regression analysis identified contact resis-tances that gave very good agreement betweensimulations and measurements at all nine loadpoints, as shown in Fig. 5. The contact resistances
were bh = 2.0 9 10�4 m2 K W�1, bc = 1.0 9 10�4 m2
K W�1 and c = 4.8 9 10�9 X m2. It should be notedthat all the tests were performed at the specifiedcontact pressure of the modules, in this case1.4 MPa. At this pressure thermal flow and electri-cal power generation are independent of contactpressure, which was also confirmed by testing. Thetwo thermal contact resistances correspond toreasonably good contact, considering that the con-tact resistances in the regression analysis werethree different resistances in series grouped to-gether. A difference between the thermal contactresistances on the hot and cold sides was expectedand can be explained by the design of the module,as already described. The electrical contact resis-tance was also in the range reported in the litera-ture.
As shown in Fig. 5, the model is capable of pre-dicting voltage, current, and heat flow. The modeldescribed module performance very well at all theload points studied, and there was no lack of fit inthe model. The R2 statistics, i.e. the fraction of thetotal variance around the mean that is explained bythe model, were 98.3% for heat flow, 97.5% for cur-rent, and 98.7% for voltage. Adjusted R2 valuesenable refinement of the statistics because they in-clude a penalty for the number of parameters in themodel. The adjusted R2 values were 98.1% for heatflow, 97.2% for current, and 98.5% for voltage.These values show the model is far from over-parameterized, and is therefore reliable.
Fig. 3. Simulation model of the thermoelectric module.
Fig. 4. Material data for Bi2Te3 modules: (a) thermal conductivity, (b) Seebeck coefficient, and (c) electric resistivity.
Analysis of Thermoelectric Generator Performance by Use of Simulations and Experiments 2251

The importance of including the contact resis-tances in the simulations is indicated in Fig. 6, inwhich simulations with and without contact resis-tances are compared. It is readily apparent that thecontact resistances have a major effect on the sim-ulation performance and should always be includedin simulations of modules. If no contact resistances
were present, the heat flow and electric power out-put would be significantly over-predicted, as isapparent from Fig. 6.
To further validate the model and investigatewhether the identified contact resistances alsoenable prediction for geometrically different mod-ules, measurements and simulations were con-
Table II. Measurement data for the small module, TEP1-1264-1.5
Load point Th (�C) Tc (�C) U (V) I (A) Q (W) P (W)
1 89 21 1.56 0.52 46 0.812 118 29 2.22 0.64 56 1.43 130 27 2.4 0.72 64 1.74 142 26 2.62 0.79 77 2.15 159 29 2.9 0.87 81 2.56 179 30 3.26 0.96 99 3.1
Fig. 5. Measurement and simulation of TEHP1-12680-0.15 with contact resistances: (a) heat flow, (b) current, and (c) voltage.
Fig. 6. Comparison of simulations with and without contact resistances: (a) heat flow and (b) electric power output.
Hogblom and Andersson2252

ducted using the small module. The experimentswere performed in the same way as described above,under the conditions specified in Table II.
It was concluded that simulations of heat flow,current, and voltage agreed very well with mea-sured data for the small module also. The simulatedand experimental results are compared in Fig. 7.The R2 values for the small module were 97.4% forheat flow, 97.8% for current, and 98.7% for voltage.The corresponding adjusted R2 values were 96.8%for heat flow, 97.3% for current, and 98.4% forvoltage. These values were only slightly lower thanthose for the large module, and confirm that themodel is capable of predicting module performancevery well. There was no lack of fit in the model, i.e.there were no systematic deviations between simu-lated and measured values of voltage, current, andheat flow over the entire operating range. If nocontact resistances were present, voltage, current,and heat flow would be significantly over-predictedfor this module also. The relative errors of thesimulations were approximately the same whencontact resistances were excluded from the model.
CONCLUSIONS
In this study 3D finite element modeling wascombined with experimental results from commer-cial TEG Bi2Te3-based modules to measure thermaland electrical contact resistances and their effect onmodule performance. The experimental setup usedenabled heat flow, voltage, and current to be mea-sured with high accuracy. Simulations were con-ducted under the same conditions as in theexperiments, i.e., identical heat source and heatsink temperatures and external loads. Non-linearregression analysis was subsequently used todetermine contact resistances. The thermal resis-tances inside the module and on its surfaces wereincluded in two different parameters in the model.
Electrical contact resistance was assumed to beidentical at all material junctions. This was shownto be sufficient, and enabled highly accurate pre-diction of module performance, including for mod-ules with different geometrical designs.
Statistical evaluation validated the model and thecontact resistances enabled excellent prediction ofmodule performance over the entire range of oper-ating conditions. The question of accuracy of mea-surement of the contact resistances was addressedby confirming they were also valid for a geometri-cally different module manufactured by use of thesame process and made of the same materials. Itwas also shown that if no contact resistances wereincluded in the analysis, the simulations systemat-ically over-predicted module performance, by up to200% for electric power output and approximately50% for heat flow, even though the contact resis-tances were moderate and within the rangereported in the literature. This also means that theefficiency of the investigated modules, i.e. the ratioof electric power to heat flow, can be increased byminimizing contact resistances.
It was concluded that the methodology presentedin this paper enables contact resistances in TEG tobe determined accurately, and that the effect ofcontact resistances should always be taken intoaccount in module simulations. It was, moreover,concluded that this analysis gives detailed insightinto how thermoelectric modules perform in gen-eral, and enables prediction of potential improve-ment of module performance by reduction of contactresistances.
ACKNOWLEDGEMENTS
This work was financially supported by theSwedish Foundation for Strategic EnvironmentalResearch. The authors would like to thank Termo-Gen AB for providing equipment for measurements
Fig. 7. Measurement and simulation of TEP1-1264-1.5 with contact resistances: (a) heat flow, (b) current, and (c) voltage.
Analysis of Thermoelectric Generator Performance by Use of Simulations and Experiments 2253

of the modules. The simulations were conducted onthe computer cluster at Chalmers University ofTechnology, supported by the Swedish NationalInfrastructure for Computing, SNIC.
OPEN ACCESS
This article is distributed under the terms of theCreative Commons Attribution License which per-mits any use, distribution, and reproduction in anymedium, provided the original author(s) and thesource are credited.
REFERENCES
1. G. Fraisse, J. Ramousse, D. Sgorlon, and C. Goupil, EnergyConvers., Manag. 65, 351 (2013).
2. R. McCarty, J. Electron. Mater. 39, 1842 (2010).3. E.E. Antonova and D.C. Looman, Finite Elements for Ther-
moelectric Device Analysis in ANSYS (New York: IEEE, 2005).4. Y.A. Cengel and A.J. Ghajar, Heat and Mass Transfer: Funda-
mentals & Applications, 4th ed. (New York: McGraw-Hill, 2011).5. P. Ziolkowski, P. Poinas, J. Leszczynski, G. Karpinski, and
E. Muller, J. Electron. Mater. 39, 1934 (2010).6. M. Chen, L.A. Rosendahl, and T.J. Condra, Int. J Heat Mass
Transf. 54, 345 (2011).7. Thermonamic. Ingot specification sheet (Online). www.
thermonamic.com. Accessed 18 June 2013.
Hogblom and Andersson2254