analysis of trade data quality in eastern and southern...
TRANSCRIPT
Analysis of trade data quality in Eastern and Southern
Africa region
Julliet Wanjiku , Paul Guthiga , Eric Macharia and Joseph Karugia
Invited paper presented at the 5th International Conference of the African Association of
Agricultural Economists, September 23-26, 2016, Addis Ababa, Ethiopia
Copyright 2016 by [authors]. All rights reserved. Readers may make verbatim copies of this
document for non-commercial purposes by any means, provided that this copyright notice
appears on all such copies.
1
Analysis of trade data quality in Eastern and Southern Africa region
Julliet Wanjiku1, Paul Guthiga
2, Eric Macharia
3 and Joseph Karugia
4
1 Corresponding author, Research Associate, ReSAKSS-ECA, Box 30709-00100, Nairobi, Kenya, email:
[email protected] 2 Senior Scientist, ReSAKSS-ECA, , Box 30709-00100, Nairobi, email: [email protected]
3 Data Analyst, ReSAKSS-ECA, Box 30709-00100, Nairobi, email: [email protected]
4 Coordinator, ReSAKSS-ECA, Box 30709-00100, Nairobi, email: [email protected]
2
Abstract
Trade stakeholders such as national governments and regional economic communities have been
investing to enhance intra-regional trade in Eastern and Southern Africa region. To measure the
results of these investments, good and reliable trade data are essential. Any trade related policy
decision making and planning are made based on analysis of available data. If the quality of
trade data has a problem, the resultant macro-economic analysis and policy recommendation are
misleading. Country A’s recorded exports to Country B should match Country B’s recorded
imports from Country A, i.e. identical mirror records. Due to weak data infrastructure (entailing
difficulties in data harmonization, different data collection methodologies and missing data),
mirror statistics are often very different. The focus of this paper is to analyze the status of the
quality of trade data in ESA region by use of total and absolute average discrepancy for the
period 2010-2014. The methodology analyses consistency of trade data involving a specific
product and on bilateral trade involving a sample of products. Focus products are grains and
pulses, livestock/products, processed flour and vegetables, chosen based on data availability and
prominence in food trade. The results show mixed scenarios: for some countries and products
trade statistics are consistent while for others discrepancies were noted. We recommend
continuous capacity building and strengthening of systems for collecting, analyzing and
reporting trade data. There is need for joint data reconciliation and synchronizing data collection
systems and procedures. We also recommend studies to establish the causes and characteristics
of data discrepancies.
Key words: Data Quality, Exports, Import, Maize, Trade
3
Introduction
One of the key pillars of integration in the Common Market for Eastern and Southern Africa
(COMESA) and East Africa Community (EAC) regions is intra-regional trade. The COMESA
treaty calls for regional integration agenda through elimination of tariff and non-tariff barriers.
The article 3 of the treaty sets out the aims and objectives of establishing the common market.
These include:-
Establishing a customs union, abolish all non-tariff barriers to trade among
member countries;
Establishing a common external tariff; co-operate in customs procedures and
activities;
Simplify and harmonize their trade documents and procedure among others.
Free intra-regional trade has potential to improve the welfare of citizens by improving food
security, addressing poverty and increasing incomes. Free intra-regional trade increases
availability of food, provides stability against domestic price surges, fosters growth of markets
and ultimately drives economic growth (Durkin, 2015). Notably, trade especially in staple foods
is expected to grow rapidly in the ESA region due to expanding markets as a result of rapid
population growth, favourable economic prospects and rapid rate of urbanization. Further, the
ESA region experiences diversified and different rainfall patterns across the countries resulting
to staggered harvesting especially of main staples all year around. The staggered harvesting leads
to diversified harvesting season which serves different markets in each country. Through cross-
border trade food then moves from surplus areas in one country to food deficit areas in
neighbouring countries throughout the year due to the staggered harvesting seasons.
Over the years, many stakeholders such as the national governments, regional economic
communities, donor community, among others have been investing to enhance intra-regional
trade in ESA region. In order to measure the results of these investments, good and reliable data
on the volume and value of trade are essential. Reliable data reporting systems are essential for
assessing the impacts of regional trade policies and trade enhancing investments. Any trade
4
related policy decision making and planning are made and implemented based on analysis of
available trade data. Thus the need for good quality data to ensure accurate and evidence based
decision making.
Ideally, data on the goods traded between two countries should be captured by each country
respective customs office. Country A’s recorded exports to Country B should be identical to
Country B’s recorded imports from Country A (mirror records). This sometimes is not the case
due to some discrepancies caused by errors and different methods used in data collection,
analysis and dissemination. However, the ideal expectation is that the two sides of the mirror
statistics should be more or less similar. In developing countries due to weak data infrastructure,
mirror statistics from two countries are often very different compromising the quality of trade
data. Weak data infrastructure includes difficulties in data harmonization due to use of different
recording systems, different data collection methodologies in addition to missing/incomplete
regional trade data due to unrecorded trade. Poor quality data affects planning, monitoring and
effective decision making. Thus the focus of this paper is to establish the status of the quality of
trade data in ESA region by use of the discrepancy analysis and also find out if the trade data has
improved since 2010-2014.
Literature review
A. Sources of discrepancies in trade data
Sources of data discrepancy between mirror records of export and imports include the following:
a. Timing. Trade may be recorded at different times causing data discrepancy. Trade
recorded and exported in one year and arrives destination in the next year is likely
to be different due to some aspects like difference in exchange rates. If trade is
growing very fast and trade recording is done on monthly bases, time lag in
recording export and the imported goods may cause discrepancies.
b. Shipping and insurance costs. Most countries report export data on a Free on
Board (F.O.B) bases while for imports they are reported on Cost, insurance and
Freight (C.I.F.) bases see Tsigas et al. (1992). The shipping and insurance costs
are thus added up to the value of exports in order to move the goods from one
5
place to another causing the import data to be higher than export data. This
creates a systematic reason for import data to be a little larger than export data.
c. Difference in classification of goods. Goods may be classified differently by the
exporter and the importer.
d. Re-exports: Traded goods can move from country A to country B then to country
C. In this case, goods may be recorded to originate from country A with a final
destination to country B which can be different from country A as origin to
destination C.
e. Mis-invoicing and mis-attribution. Mis-invoicing involves under invoicing and/or
over invoicing which is declaring the value of goods to be either higher or lower
than their true value while mis-attribution takes place when traders deliberately
make false declarations about the origin or destination of a good. This can be
done by traders in order to evade tax/tariff.
f. Smuggling. This may lead to discrepancy in trade statistics if a commodity is
considered legal in one country while illegal in the other country causing
commodity smuggling which is not recorded in official statistics so its value is
zero. Some illegal goods may include certain drugs, explosives, weapons or
pornographic materials among others.
g. Non-recording of trade. This may occur when an exporter records the traded
goods while the receiving country, the importer, does not record the imported
goods.
B. Literature on trade data discrepancies
Good quality statistics are important as a resource for planning, policy and decision making.
Macro and micro decisions are made based on available statistics thus if data is of poor quality,
the analysis leads to unreliable and inaccurate planning and decision making. There is thus the
need to improve trade data quality and hence facilitate trade policy analysis.
Sika et al, (2010) carried out a study on developing trade indicators which can be used to assess
the intraregional trade dynamics for the main staple foods in the ESA region. Several available
trade data sources were explored. Both formal and informal trade data were considered in order
6
to identify countries and products likely to be associated with reliable reported trade data. In the
process, the project identified inconsistency in trade data from different sources. A comparison
of mirror data showed high level of discrepancies in export and import data in the region across
countries. Data on the exports of maize grain from Kenya and Tanzania to the region and exports
of tomato and bovine meat from Uganda to the ESA region were reported to be consistent. The
study by Sika et al (2010) clearly indicates the importance of good quality data in trade indicator
development. Trade indicators can be used to show the impact of trade policy change and
investment initiatives. The current study adds value to the study by Sika et al (2010).
International Trade Centre, (2005) has developed a write up on reliability of trade statistics. The notes
have given methodological information on the indicators of consistency between trade figures reported by
countries and their corresponding mirror estimates. The ITC work has also discussed the sources of
discrepancies in reported trade data among them being different time of trade data recording,
different trade system, re-exports, different classification, valuation of trade at CIF or FOB or
even discrepancies can be caused by errors and estimation. ITC has also proposed various
indicators that could be used to assess the discrepancies in reported trade data. ITC (2005) has
proposed two methodologies that can be used to analyze trade data discrepancies mainly total
discrepancy measure which assesses the consistency of the trade data reported at aggregated
levels and an absolute average discrepancy measure which assesses the consistency of the trade
data reported per product or on bilateral trade. The current study has used both total and absolute
average discrepancy to evaluate trade data quality in ESA.
Munalula and Walakira (2007) reported on the methods used for measuring and monitoring data
quality for international merchandise trade statistics (IMTS) in COMESA region. The study
looked at methodological basis for compilation of IMTS, accuracy and reliability including data
sources and assessment of the data sources. The study further looked at timeliness, consistency
and accessibility of the trade data. The study findings suggest that most of COMESA member
countries did not use similar methodological tools in collecting trade data. By 2006, the countries
used different versions of the harmonized system to disseminate data. The data also lacked
country of origin/destination. This brings in the challenge of data harmonization. Discrepancies
were also observed in mirror statistics. A few countries transmitted data after the expected period
7
of data transfer which is three months after the reference month. The data was also reported to be
accessible online to the public. The study recommends monitoring and evaluation of the quality
of trade data of COMESA member states through online set up.
Yeats (1990) attempted to answer the question; do Sub-Saharan trade statistics mean anything?
Using trade reconciliation and evaluation procedures by Organisation for Economic Co-
operation and Development (OECD) the study by Yeats (1990) analyzed the accuracy of trade
statistics by comparing the reported value of African exports with trade partner countries'
reported import values. The results of the study showed major discrepancies between the trading
partner exports and imports. The study attributed the discrepancies to majorly false invoicing and
smuggling. Yeats (1990) concluded that there are major differences in intra-African trade
statistics. Further statistical tests showed that the African trade data cannot be relied on to
indicate the level, direction and trends in African trade. The Yeats’ study gives basis for the
current study, what is the level of intra-regional trade data discrepancies in ESA? Is the trade
data still unreliable since 1990? Has the quality of trade data improved especially in the
COMESA region? This study will attempt to answer this question using data on selected
commodities traded among several countries in the East and Southern Africa region.
In a different continent from Africa, Ferrantino and Wang (2007) looked at discrepancies in
bilateral Trade using the case of China, Hong Kong, and the United States. Mirror statistics was
used to calculate the magnitude of statistical discrepancy. The study analyzed the data for China
and multiple trading partners, Hong Kong being a re-exporter/re-importer. The study concluded
that reporting of different values to importing and exporting authorities is a source of
discrepancies in trade data. The misreporting of origins and destinations due to goods passing
through many countries was also found to cause discrepancies in trade data.
Hamanaka (2011) assessed the quality of Cambodia’s export and import statistics by use of
mirror statistics of its trade partners. The paper identified discrepancies in trade data and the
inconsistent in data was mainly caused by both commodity and direction misclassifications.
Hamanaka argues that a single bilateral mirror comparison does not give the manner in which
misclassifications are committed. Which side, exporter/importer can be argued to have generated
8
the inaccurate statistic? Hamanaka recommended the use of multiple mirror comparison
technique. This technique compares the results of various bilateral mirror analyses of trade
statistics thus can be able to tell which direction and commodity misclassifications have
originated from. Focus of current study is to determine the quality of trade data in ESA.
Hamanaka study has enlightened on areas that require further research, if trade data is found to
be of low quality in ESA, further research need to identify the manner including direction of the
data inconsistency.
Hangzhou (2009) examined the bilateral merchandise trade statistics between China and the
United Sates. A reconciliation study was carried out to explain and quantify the statistical
discrepancies in the bilateral merchandise trade data. The study found out that the level of
bilateral trade between United States and China has continued to grow. As bilateral trade is
growing, the level of discrepancies has been growing. However discrepancy in the bilateral trade
statistics was observed to decline. The main causes of discrepancy were reported to be
conceptual and methodological differences in the collection and processing of the trade data.
Specifically the discrepancies were attributed to statistical territory definitions, re-exports and
time of recording trade. Intermediary trade and value addition also caused discrepancies. The
study went further to adjust for discrepancies that can be quantified. This study relates to the
current study as it shows areas of further research. If the current study reports noted trade data
discrepancies, there is need for further research to establish the causes and characteristics of
trade data discrepancies in ESA region.
Methodology
Choice of countries and food commodities
The countries of focus in this study are Burundi, Ethiopia, Kenya, Malawi, Rwanda, Uganda,
Tanzania and Zambia. Apart from Tanzania, all the other countries are member of COMESA; the
Regional Economic Community (REC) in ESA. The focus of this paper is analysis based on
intra-regional trade, countries trading with partners in ESA region. The chosen countries were
based on availability of data and also those countries with highest maize trade volumes in the
region. Tanzania is not a COMESA member state but it is centrally located within the COMESA
region and it is a key player in regional food staples trade in ESA. It is also a member of the East
9
African Community, to which Kenya, Uganda, Rwanda and Burundi belong with reported intra-
regional trade especially of maize among the neighbouring countries.
The food commodities were chosen based on availability of data and the volume of trade in those
commodities. The commodities of focus in this study are maize grain, rice grain, maize flour,
wheat flour, beans and pulses, onions, tomatoes, live bovine animals, milk and cream, bovine
meat, fish and crustaceans.
Data source
The data used were obtained from:-
i. COMSTAT
This is the COMESA data portal. The portal contains formal trade data as reported by individual
COMESA member states to COMESA Secretariat. The quality of the data in terms of its
accuracy, completeness and consistency is largely dependent on the capacity of national data
systems in collecting, collating and reporting on trade data and statistics. It is also dependent on
the ability of COMSTAT staff to cross-check the data and request countries to act when obvious
anomalies are noted.
ii. Tanzania Revenue Authority (TRA)
Tanzania is not a COMESA member state but due to its geographic proximity and close trade
relations with many countries in the ESA region, it has been included in the current study. Since
it is not a COMESA member state; the country is not obligated to report formal trade data to
COMSTAT. Formal trade data for Tanzania is therefore obtained directly from the Tanzania
Revenue Authority.
Methodology for trade data discrepancy analysis
There are several measures of trade data discrepancy analysis that are used to measure
consistency of reported data (ITC, 2005). The discrepancy analysis in the current study is based
on a methodology developed and applied by the International Trade Centre (ITC, 2005). The
ITC methodology assesses the consistency of reported data on the trade involving a specific
product and also on the bilateral trade involving a sample of products, which is focus of our
10
discrepancy analysis. Discrepancy represents the difference expressed in percentage, between
values of country initiating the mirror analysis and value of partner country with which the
comparison is performed. The discrepancy is possible between 0% and 200%. If there is no
discrepancy, it means that there is no difference in the data between two countries which is very
rare occurrence, if the discrepancy is 200% it implies that one of countries has not registered the
external trade. Generally trade between two countries, A and B, should be a mirror image of each
other. In practice however, disparities exist between bilateral merchandise trade flows published
by two countries.
For this study, we report total regional trade discrepancy and absolute average discrepancy of
volumes and values since 2010 to 2014. Total regional trade discrepancy (To) expresses the sum
of differences between exports of the product to each destination and mirror import records by
each partner country as a ratio of total trade of that country for that product while average
absolute discrepancy (Ao) shows the total discrepancy but avoiding the possibility of positive
and negative discrepancies cancelling each other out. More details below:
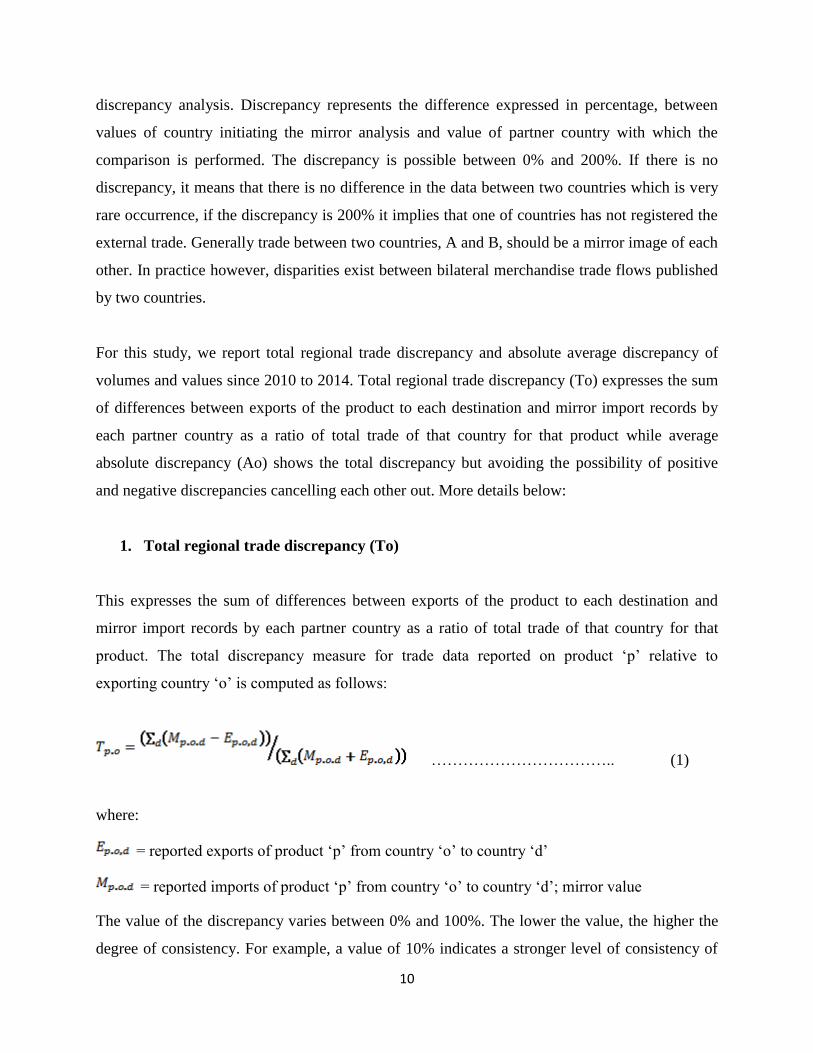
1. Total regional trade discrepancy (To)
This expresses the sum of differences between exports of the product to each destination and
mirror import records by each partner country as a ratio of total trade of that country for that
product. The total discrepancy measure for trade data reported on product ‘p’ relative to
exporting country ‘o’ is computed as follows:
…………………………….. (1)
where:
= reported exports of product ‘p’ from country ‘o’ to country ‘d’
= reported imports of product ‘p’ from country ‘o’ to country ‘d’; mirror value
The value of the discrepancy varies between 0% and 100%. The lower the value, the higher the
degree of consistency. For example, a value of 10% indicates a stronger level of consistency of
11
trade statistics than a value of 20%. ITC suggests that total discrepancy measure should be
around 5%, reflecting mainly the fact that import values computed at c.i.f (cost, insurance and
freight) price should be slightly higher than the export values computed at f.o.b (free on board)
price. For ESA, trade data would be considered consistent if the total discrepancy measure is
around 5% but below 15% (Sika et al, 2010).
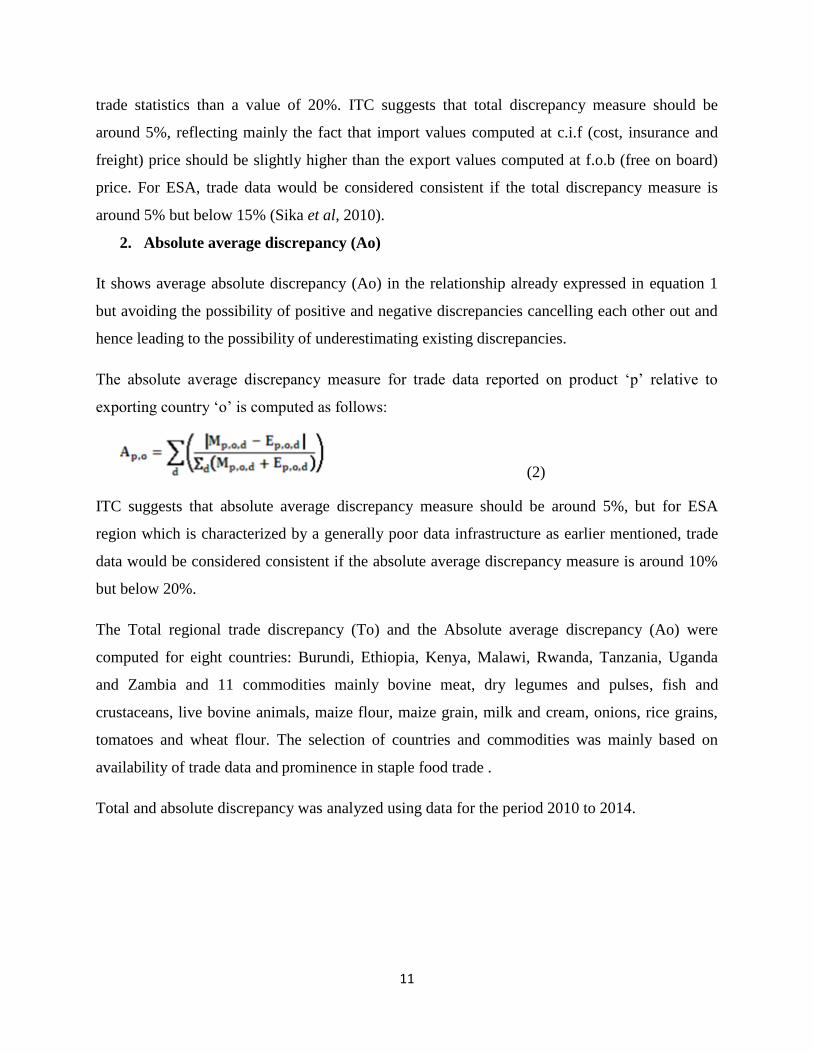
2. Absolute average discrepancy (Ao)
It shows average absolute discrepancy (Ao) in the relationship already expressed in equation 1
but avoiding the possibility of positive and negative discrepancies cancelling each other out and
hence leading to the possibility of underestimating existing discrepancies.
The absolute average discrepancy measure for trade data reported on product ‘p’ relative to
exporting country ‘o’ is computed as follows:
(2)
ITC suggests that absolute average discrepancy measure should be around 5%, but for ESA
region which is characterized by a generally poor data infrastructure as earlier mentioned, trade
data would be considered consistent if the absolute average discrepancy measure is around 10%
but below 20%.
The Total regional trade discrepancy (To) and the Absolute average discrepancy (Ao) were
computed for eight countries: Burundi, Ethiopia, Kenya, Malawi, Rwanda, Tanzania, Uganda
and Zambia and 11 commodities mainly bovine meat, dry legumes and pulses, fish and
crustaceans, live bovine animals, maize flour, maize grain, milk and cream, onions, rice grains,
tomatoes and wheat flour. The selection of countries and commodities was mainly based on
availability of trade data and prominence in staple food trade .
Total and absolute discrepancy was analyzed using data for the period 2010 to 2014.
12
Results
A. Discrepancy analysis using maize mirror records
This section gives the discrepancies analysis between mirror records of maize trade in selected
countries in ESA. Maize is the most important staple food in many countries in ESA (De Groot
et al., 2002; Pingali, 2001). Maize is also the most consumed, most traded food staple in ESA
(Food trade in East and Southern Africa, 2015), thus main commodity of focus in this section.
Mirror records are defined as a “bilateral comparison of two basic measures of a trade flow”
(EuroStat, 2005). Mirror statistics are thus used to compare importer’s imports with its partner’s
exports, and vice versa. We use both values in US$ and volumes in kilograms for maize trade.
Maize mirror records between Kenya and Uganda
Figure 1 shows the exports from Uganda to Kenya and the reported imports by Kenya from
Uganda. Minimal discrepancy was noted in year 2014 in comparison to the other years mainly by
use of volume of maize in kilograms (Figure 1).
Figure 1: Maize weights in kg, mirror records as reported by Uganda and Kenya
The quality of reported exports by Uganda and reported imports by Kenya by use of maize
values in US$ shows different results unlike in figure 1. Figure 2 shows high discrepancies in
trade flows between Kenya and Uganda by use of values in 2014.
-
20,000,000.00
40,000,000.00
60,000,000.00
80,000,000.00
100,000,000.00
2010 2011 2012 2013 2014
Vo
lum
e, k
gs
Uganda to kenya kenya from Uganda
13
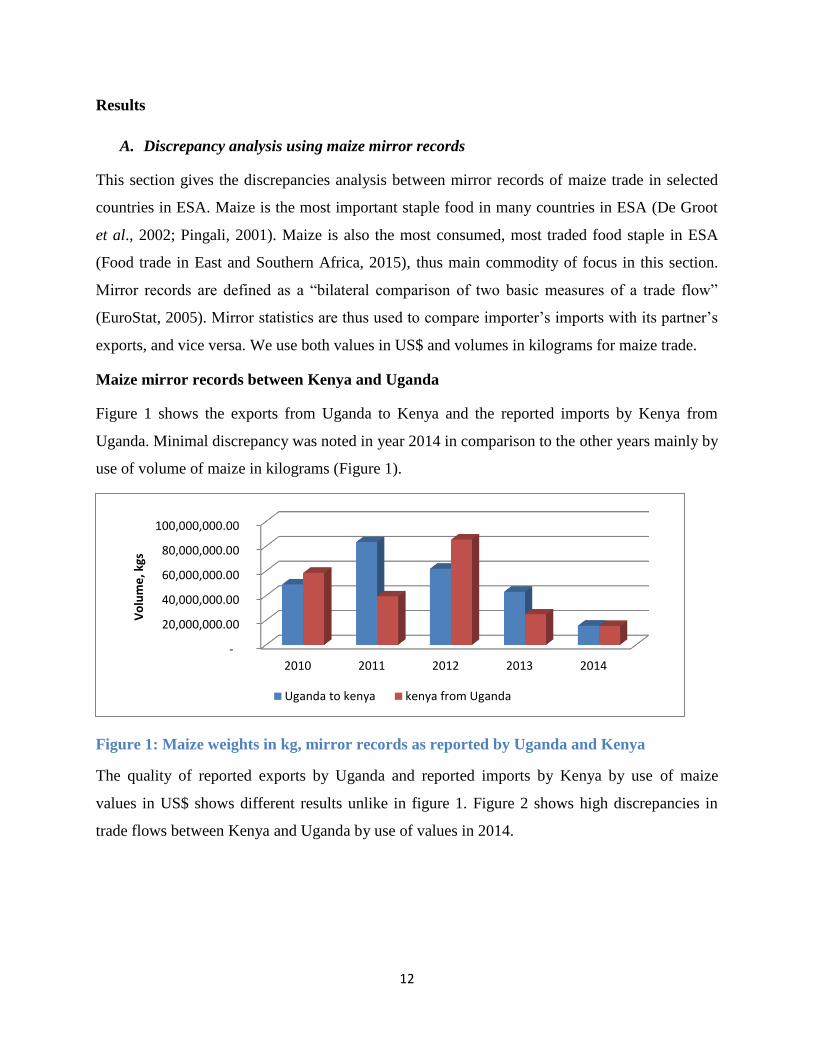
Figure 2: Maize Value (US$), mirror records as reported by Uganda and Kenya
Maize mirror records between Kenya and Tanzania
Both values and volume imports and exports between Kenya and Tanzania have reported an
almost similar trend, minimal discrepancies of reported mirror trade data since 2010 to 2014
(Figure 3 and Figure 4). There is also reported increased trade in 2014 between Kenya and
Tanzania.
Figure 3: Maize Value (US$), mirror records as reported by Tanzania and Kenya
-
10,000,000.00
20,000,000.00
30,000,000.00
40,000,000.00
50,000,000.00
60,000,000.00
2010 2011 2012 2013 2014
Val
ue
, US$
Uganda to Kenya Kenya from Uganda
-
20,000,000.00
40,000,000.00
60,000,000.00
80,000,000.00
100,000,000.00
2010 2011 2012 2013 2014
US$
Kenya from Tanzania Tanzania to Kenya
14
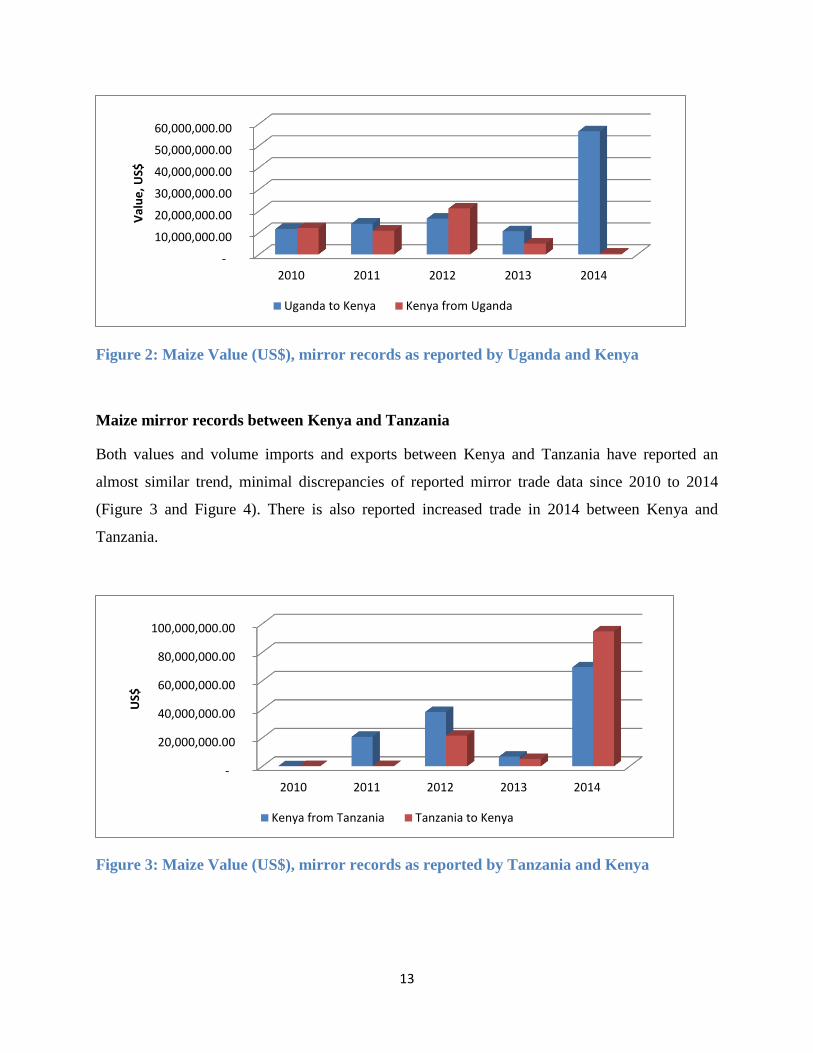
Figure 4: Maize weights in kg, mirror records as reported by Tanzania and Kenya
Maize mirror records between Malawi and Zambia
2012, 2013 and 2014 show some level of reported trade data consistency (Figure 5 and Figure 6)
by use of values and volumes of maize trade between Malawi and Zambia. The same scenario
has not been reported in 2010 and 2011. This shows improvement in trade data quality over the
years (2012-2014) as reported discrepancies are minimal after 2012 to 2014.
Figure 5: Maize weights in kg, mirror records as reported by Malawi and Zambia
0
50,000,000
100,000,000
150,000,000
200,000,000
250,000,000
300,000,000
350,000,000
2010 2011 2012 2013 2014
Kgs
Tanzania to kenya Kenya from Tanzania
0
500000
1000000
1500000
2010 2011 2012 2013 2014
Kgs
Malawi to Zambia Zambia from Malawi
15
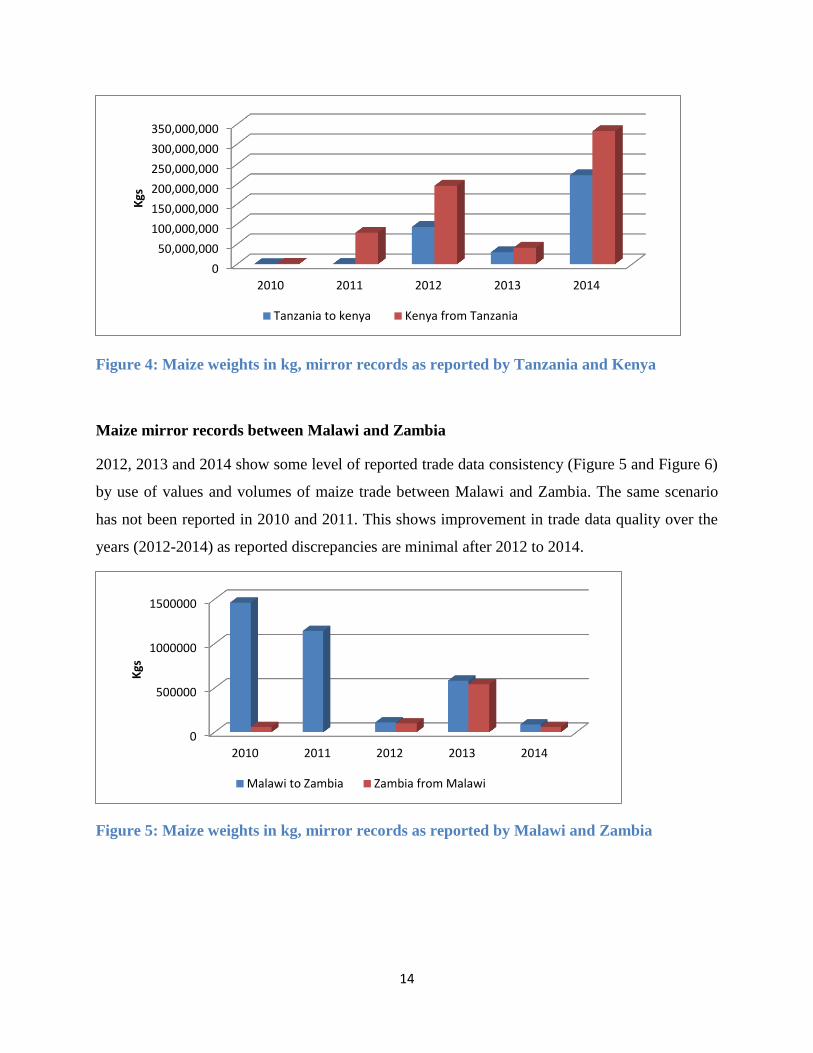
Figure 6: Maize values in US$, mirror records as reported by Malawi and Zambia
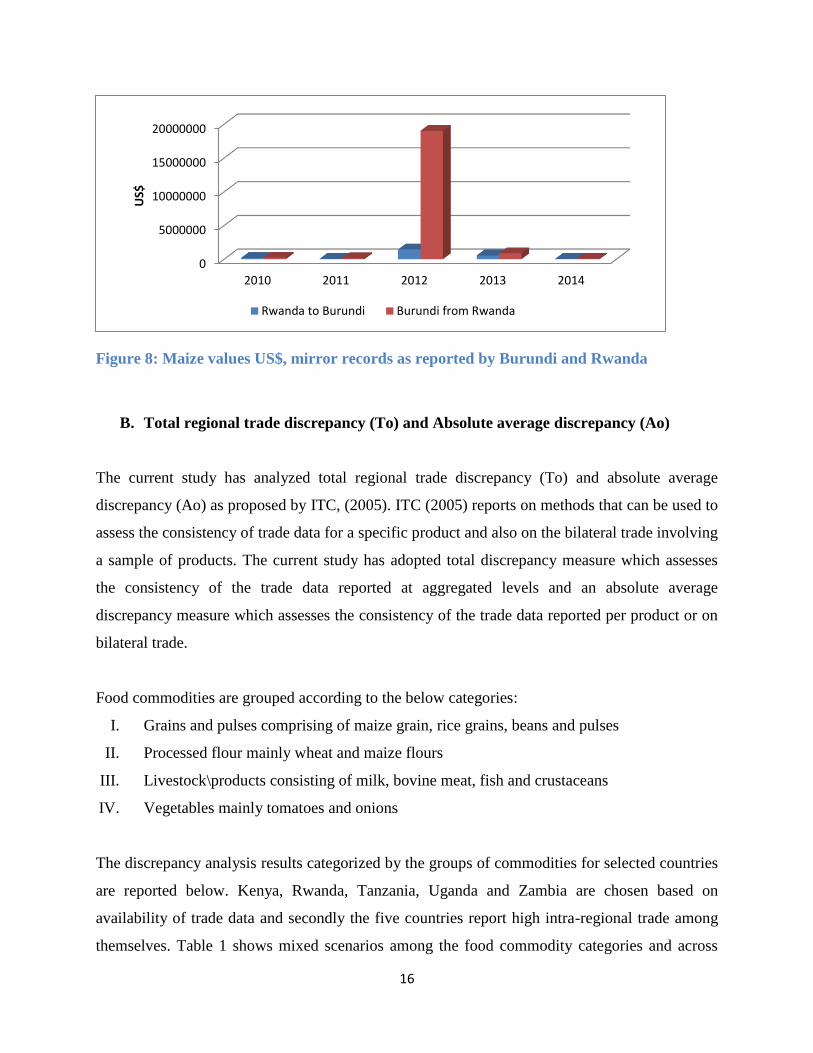
Maize mirror records between Burundi and Rwanda
Mirror records of trade volumes in kilograms between Rwanda and Burundi can be said to be
consistent between year 2010 to 2014 (Figure 9)
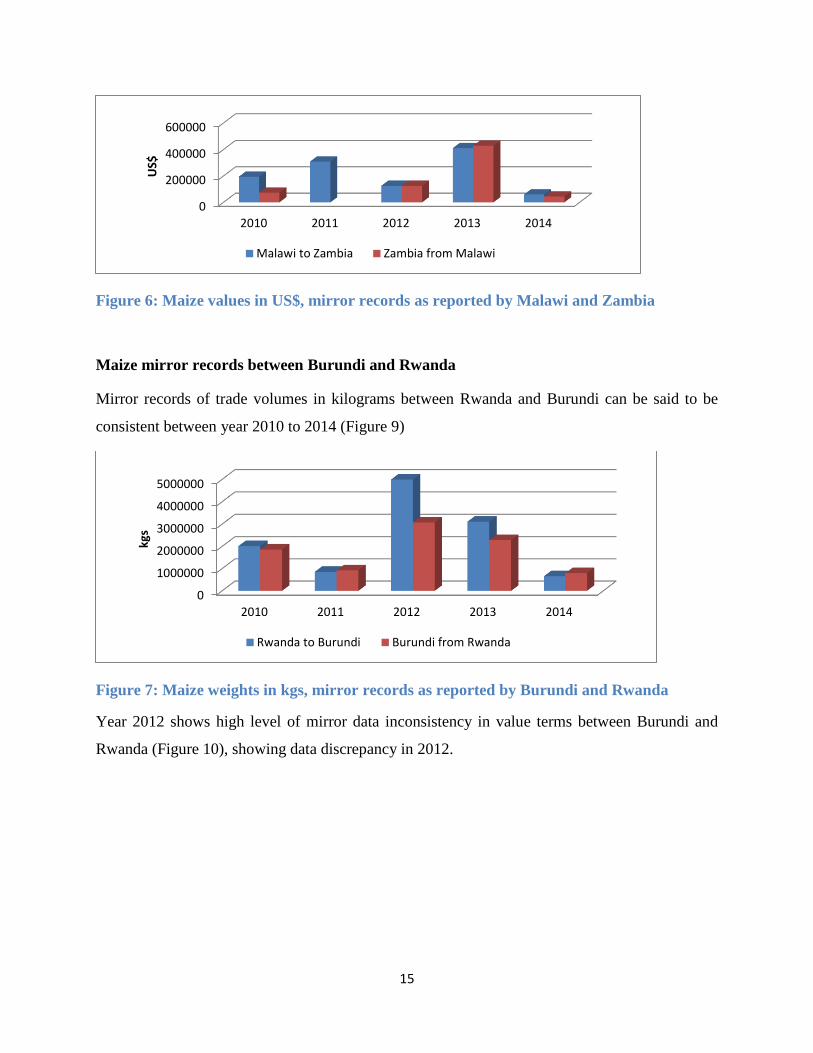
Figure 7: Maize weights in kgs, mirror records as reported by Burundi and Rwanda
Year 2012 shows high level of mirror data inconsistency in value terms between Burundi and
Rwanda (Figure 10), showing data discrepancy in 2012.
0
200000
400000
600000
2010 2011 2012 2013 2014
US$
Malawi to Zambia Zambia from Malawi
0
1000000
2000000
3000000
4000000
5000000
2010 2011 2012 2013 2014
kgs
Rwanda to Burundi Burundi from Rwanda
16
Figure 8: Maize values US$, mirror records as reported by Burundi and Rwanda
B. Total regional trade discrepancy (To) and Absolute average discrepancy (Ao)
The current study has analyzed total regional trade discrepancy (To) and absolute average
discrepancy (Ao) as proposed by ITC, (2005). ITC (2005) reports on methods that can be used to
assess the consistency of trade data for a specific product and also on the bilateral trade involving
a sample of products. The current study has adopted total discrepancy measure which assesses
the consistency of the trade data reported at aggregated levels and an absolute average
discrepancy measure which assesses the consistency of the trade data reported per product or on
bilateral trade.
Food commodities are grouped according to the below categories:
I. Grains and pulses comprising of maize grain, rice grains, beans and pulses
II. Processed flour mainly wheat and maize flours
III. Livestock\products consisting of milk, bovine meat, fish and crustaceans
IV. Vegetables mainly tomatoes and onions
The discrepancy analysis results categorized by the groups of commodities for selected countries
are reported below. Kenya, Rwanda, Tanzania, Uganda and Zambia are chosen based on
availability of trade data and secondly the five countries report high intra-regional trade among
themselves. Table 1 shows mixed scenarios among the food commodity categories and across
0
5000000
10000000
15000000
20000000
2010 2011 2012 2013 2014
US$
Rwanda to Burundi Burundi from Rwanda
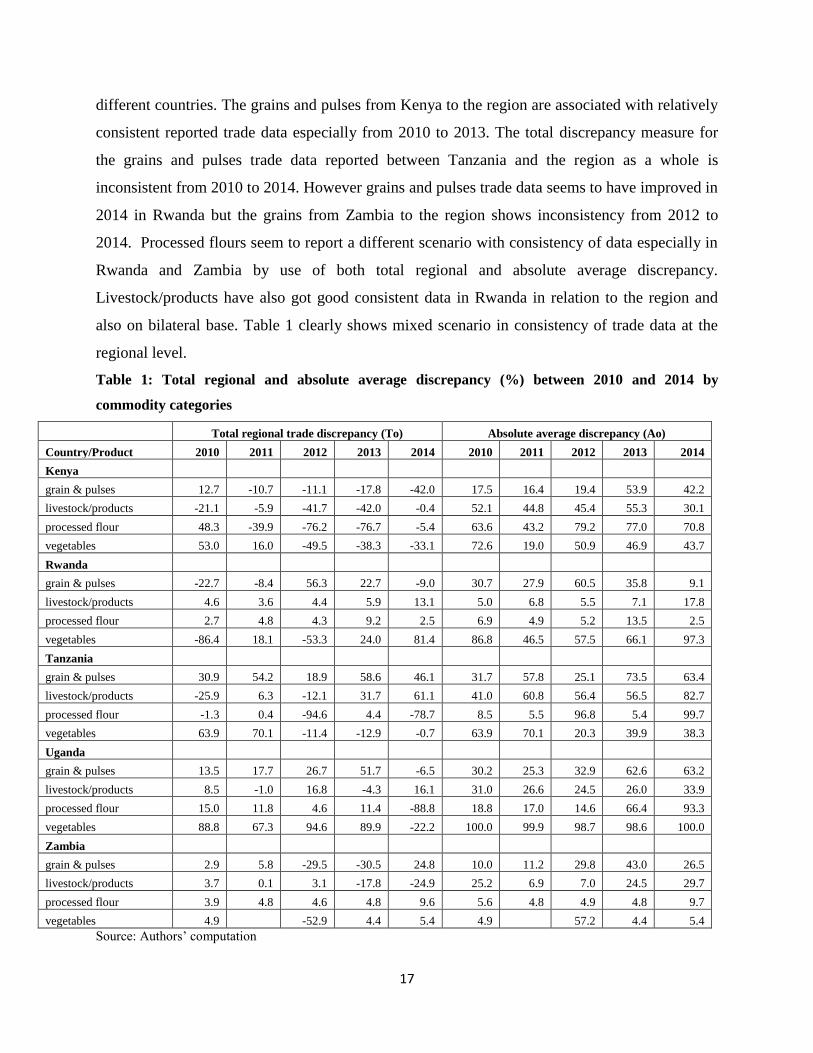
17
different countries. The grains and pulses from Kenya to the region are associated with relatively
consistent reported trade data especially from 2010 to 2013. The total discrepancy measure for
the grains and pulses trade data reported between Tanzania and the region as a whole is
inconsistent from 2010 to 2014. However grains and pulses trade data seems to have improved in
2014 in Rwanda but the grains from Zambia to the region shows inconsistency from 2012 to
2014. Processed flours seem to report a different scenario with consistency of data especially in
Rwanda and Zambia by use of both total regional and absolute average discrepancy.
Livestock/products have also got good consistent data in Rwanda in relation to the region and
also on bilateral base. Table 1 clearly shows mixed scenario in consistency of trade data at the
regional level.
Table 1: Total regional and absolute average discrepancy (%) between 2010 and 2014 by
commodity categories
Total regional trade discrepancy (To) Absolute average discrepancy (Ao)
Country/Product 2010 2011 2012 2013 2014 2010 2011 2012 2013 2014
Kenya
grain & pulses 12.7 -10.7 -11.1 -17.8 -42.0 17.5 16.4 19.4 53.9 42.2
livestock/products -21.1 -5.9 -41.7 -42.0 -0.4 52.1 44.8 45.4 55.3 30.1
processed flour 48.3 -39.9 -76.2 -76.7 -5.4 63.6 43.2 79.2 77.0 70.8
vegetables 53.0 16.0 -49.5 -38.3 -33.1 72.6 19.0 50.9 46.9 43.7
Rwanda
grain & pulses -22.7 -8.4 56.3 22.7 -9.0 30.7 27.9 60.5 35.8 9.1
livestock/products 4.6 3.6 4.4 5.9 13.1 5.0 6.8 5.5 7.1 17.8
processed flour 2.7 4.8 4.3 9.2 2.5 6.9 4.9 5.2 13.5 2.5
vegetables -86.4 18.1 -53.3 24.0 81.4 86.8 46.5 57.5 66.1 97.3
Tanzania
grain & pulses 30.9 54.2 18.9 58.6 46.1 31.7 57.8 25.1 73.5 63.4
livestock/products -25.9 6.3 -12.1 31.7 61.1 41.0 60.8 56.4 56.5 82.7
processed flour -1.3 0.4 -94.6 4.4 -78.7 8.5 5.5 96.8 5.4 99.7
vegetables 63.9 70.1 -11.4 -12.9 -0.7 63.9 70.1 20.3 39.9 38.3
Uganda
grain & pulses 13.5 17.7 26.7 51.7 -6.5 30.2 25.3 32.9 62.6 63.2
livestock/products 8.5 -1.0 16.8 -4.3 16.1 31.0 26.6 24.5 26.0 33.9
processed flour 15.0 11.8 4.6 11.4 -88.8 18.8 17.0 14.6 66.4 93.3
vegetables 88.8 67.3 94.6 89.9 -22.2 100.0 99.9 98.7 98.6 100.0
Zambia
grain & pulses 2.9 5.8 -29.5 -30.5 24.8 10.0 11.2 29.8 43.0 26.5
livestock/products 3.7 0.1 3.1 -17.8 -24.9 25.2 6.9 7.0 24.5 29.7
processed flour 3.9 4.8 4.6 4.8 9.6 5.6 4.8 4.9 4.8 9.7
vegetables 4.9 -52.9 4.4 5.4 4.9 57.2 4.4 5.4
Source: Authors’ computation
18
Some commodities across the different countries have reported consistent data while some
countries have reported high discrepancies in some commodities. The question is what causes
these different scenarios? This is an area for further research.
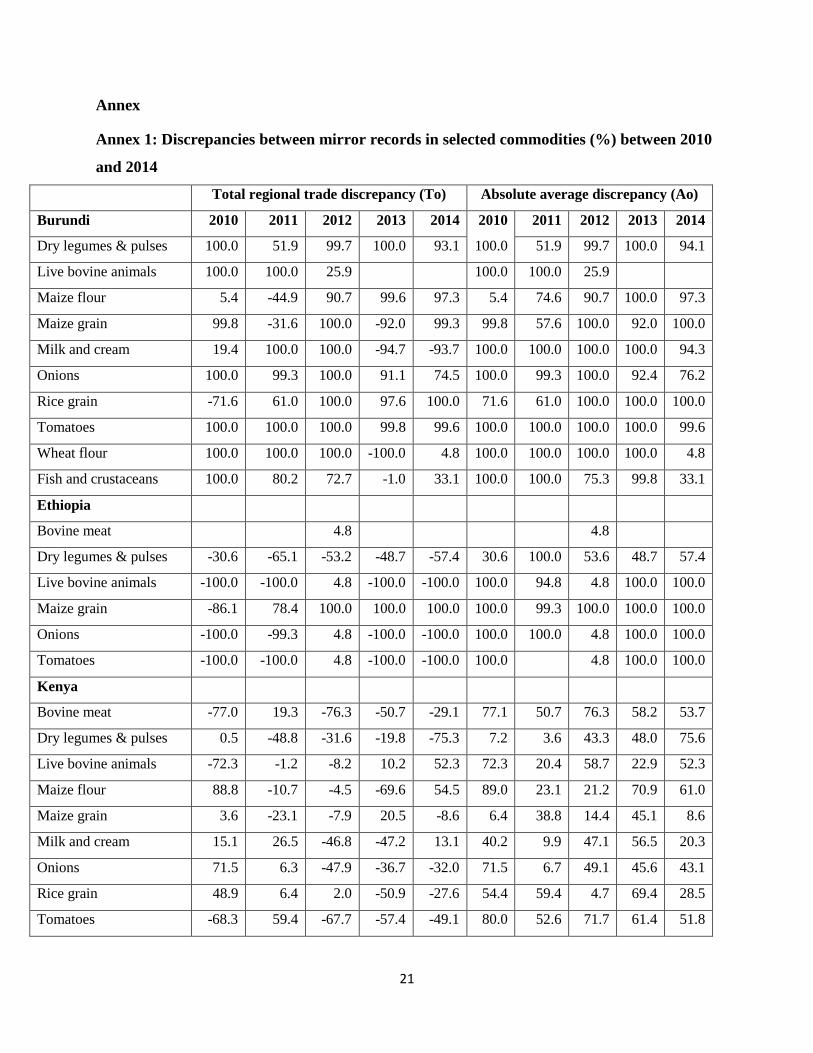
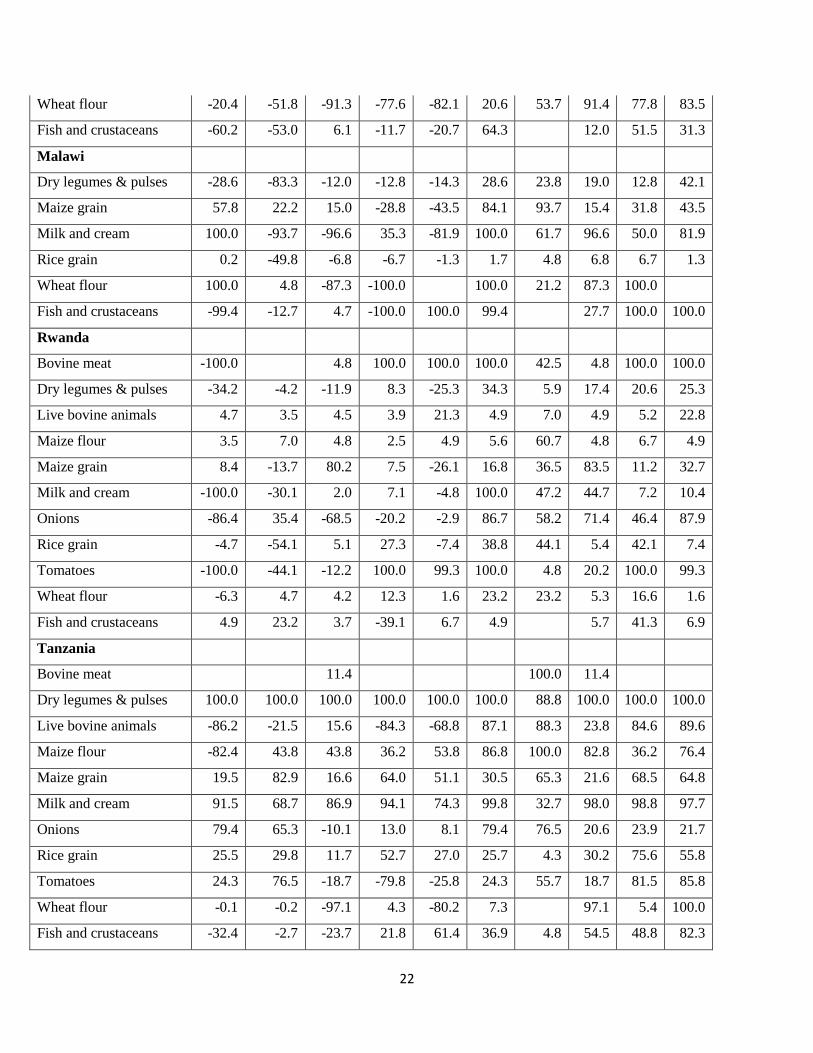
Further, detailed results by individual commodities are reported in Annex 1. Annex 1 shows
mixed scenarios of discrepancies in trade data among different countries and commodities for the
period 2010 to 2014 just as the analysis by use of categorized food commodities. For example in
Burundi, consistent data is only reported in year 2014 for wheat flour only by use of both total
and average discrepancies. In Ethiopia consistent data is only reported in year 2012 for bovine
meat, live bovine animals, onions and tomatoes by use of both total and average discrepancies
analyses. Consistent data in Kenya is only observed for maize grain for year 2010 and 2014 by
use of total and average discrepancy method. Malawi has reported consistent data for 2012 to
2014 for rice grain. Further Rwanda data is also consistent over time for maize flour. Live bovine
animals trade data is also consistent from 2010-2013 by use of both total and average
discrepancies in Rwanda. There is a notable improvement in the quality of trade data on wheat
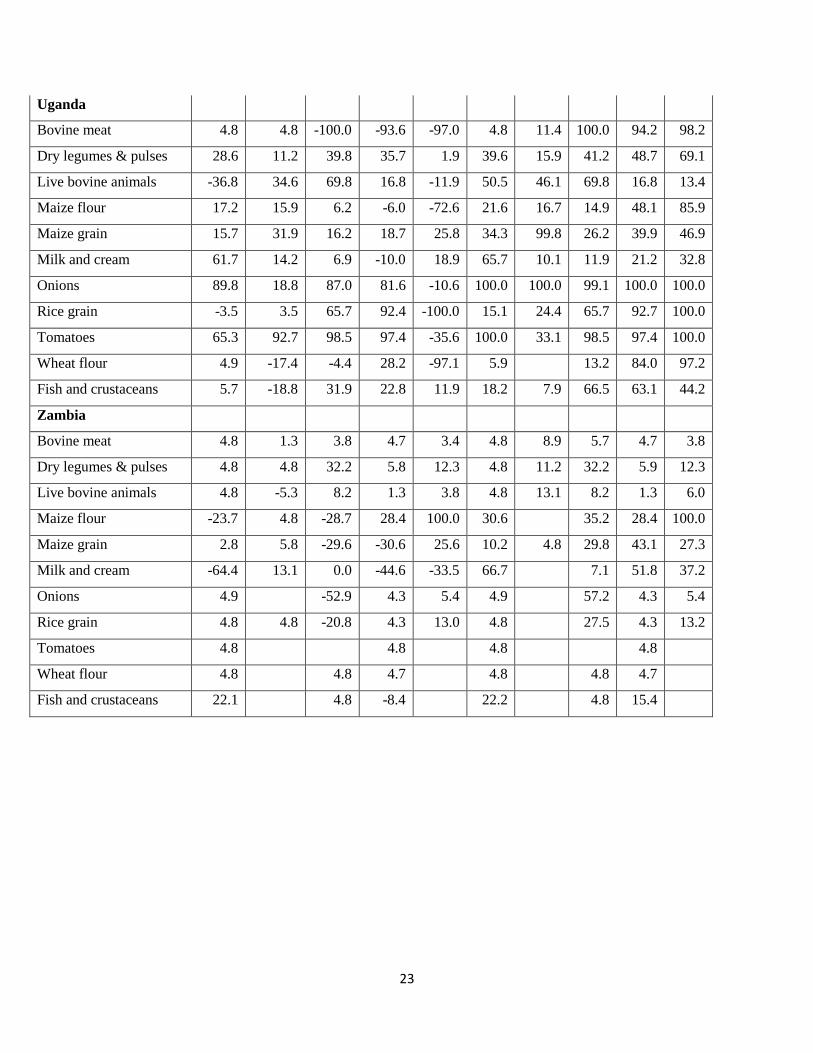
flour trade data from Rwanda. On the other hand bovine meat, dry legumes and live bovine
animals trade data from Zambia reports a consistency over time. The discrepancy measures for
total trade for most of the traded commodities in Burundi, Uganda and Tanzania, at the regional
level, are substantially higher than 10%, and the absolute average discrepancy values for total
trade are substantially higher than 20% for most of the commodities under study in the same
countries. This reflects data inconsistency due to the high discrepancies. See more details in
Annex 1.
Conclusion and recommendation
The computed discrepancy indices have revealed mixed scenarios in trade data consistency. For
some countries and some commodities, the trade data quality has improved as the reported
discrepancies are within the acceptable percentage limits while some data is highly discrepant.
Some countries have recorded very clear improvement in the quality of trade data. For instance
Zambia, the discrepancy indices are consistent for bovine meat, dry legumes & pulses from
2010-2014. Rwanda data is also consistent over time for maize flour. Ethiopia trade data in
bovine meat, live bovine animals, onions and tomatoes was only consistent in 2012 and
19
becoming inconsistent in 2013 and 2014. Further, the discrepancy measure for most commodities
in Burundi, Tanzania and Uganda fell outside the acceptable discrepancy level showing high
inconsistency in trade data. The discrepancy analysis shows there is need to continue
improvement in the quality of trade data due to the noted discrepancies across countries and
across commodities.
Good quality trade data is essential for effective policy decision making in the ESA region. We
therefore recommend investments aimed at improving the systems for collecting, analyzing and
reporting trade data in the region. Specifically this can be achieved through:
1. Continuous capacity building and strengthening of systems of collecting, analyzing and
reporting trade data. The capacity building should involve both institutional and human
capacity in custom authorities and national statistical organizations.
2. Joint data reconciliation between national statistical office and customs authorities with
and between countries.
3. Synchronizing the data collection systems and procedures
4. Awareness creation on importance of good quality statistics in ESA region
There is also need for further research to identify the characteristics and causes of the trade data
discrepancy among the trading partners in ESA region.
References
De Groot, H., Doss, C., Lyimo S.D., Mwangi, W., 2002. Adoption of maize technologies in East
Africa: What happened to Africa’s emerging maize revolution? Paper prepared for the
FASID Forum V, Green Revolution in Asia and its Transferability to Africa, Tokyo, Japan,
8–10 December 2002.
Durkin, A., 2015. Grow Markets, Fight Hunger: A Food Security Framework for US-Africa
Trade Relations. The Chicago Council on Global Affairs, Chicago, Illinois
Eurostat., 2005. Statistics on the trading of goods - User guide. Methods and nomenclatures.
Office for Official Publications of the European Communities, Luxembourg. Available:
http://ec.europa.eu/eurostat/documents/3859598/5889553/KS-BM-05-001-EN.PDF/72491f68-
2867-43da-9d8b-905541ffa71a?version=1.0. Accessed, 11.01.2016.
20
Food Trade East and Southern Africa., 2015. Facilitating regional trade in food staples. Available:
http://foodtradeesa.com/ . Accessed 3.3.2016.
Ferrantino M. and Wang Z., 2007. Accounting for Discrepancies in Bilateral Trade: The Case of
China, Hong Kong and the United States. Office of Economics Working Paper.
https://www.gtap.agecon.purdue.edu/.../3106.pdf. Accessed in 25.2.2016
Hamanaka, S., 2011. Utilizing the Multiple Mirror Technique to Assess the Quality of
Cambodian Trade Statistics. ADB Working Paper Series on Regional Economic
Integration. No. 88
Hangzhou P.R.C., 2009. Report on statistical discrepancy of merchandise trade between the
United States and China. Available: http://www.esa.doc.gov/reports/report-statistical-
discrepancy-merchandise-trade-between-united-states-and-china. Accessed 2.3.2016.
International Trade Centre., 2005. Reliability of trade statistics: Indicators of consistency
between trade figures reported by countries and their corresponding mirror estimates.
Munalula T. and Walakira A., 2007. Developing Data Quality Metrics for International
Merchandise Trade Statistics in the COMESA Region. COMESA Statistical Brief Issue
no. 4. Available: http://comstat.comesa.int/ResourceCenter/Default.aspx?client=true.
Accessed in 25.2.2016
Pingali P.L. (ed.)., 2001. World Maize Facts and Trends. Meeting World Maize Needs:
Technological Opportunities and Priorities for the Public Sector. Mexico, D.F.: CIMMYT.
CIMMYT 1999-2000
Sika G., Ayele G., Wanjiku J., Karugia J., Massawe S., and Wambua J., 2010. Towards
developing intra-regional trade indicators for staple food products in COMESA. Paper for
the Fifth International Conference on Agriculture Statistics – ICAS-V, Integrating
Agriculture into National Statistical Systems, Speke Resort, Kampala, Uganda, 13-15
October 2010
Tsigas, Marinos E., Hertel, Thomas W., and Binkley, James K., 1992. Estimates of systematic
reporting bias in trade statistics. Economic Systems Research, 4(4), 297−310.
Yeats, Alexander J., 1990. On the Accuracy of Economic Observations: Do Sub-Saharan Trade
Statistics Mean Anything? The World Bank Economic Review, 4 (2): 135-156
21
Annex
Annex 1: Discrepancies between mirror records in selected commodities (%) between 2010
and 2014
Total regional trade discrepancy (To) Absolute average discrepancy (Ao)
Burundi 2010 2011 2012 2013 2014 2010 2011 2012 2013 2014
Dry legumes & pulses 100.0 51.9 99.7 100.0 93.1 100.0 51.9 99.7 100.0 94.1
Live bovine animals 100.0 100.0 25.9 100.0 100.0 25.9
Maize flour 5.4 -44.9 90.7 99.6 97.3 5.4 74.6 90.7 100.0 97.3
Maize grain 99.8 -31.6 100.0 -92.0 99.3 99.8 57.6 100.0 92.0 100.0
Milk and cream 19.4 100.0 100.0 -94.7 -93.7 100.0 100.0 100.0 100.0 94.3
Onions 100.0 99.3 100.0 91.1 74.5 100.0 99.3 100.0 92.4 76.2
Rice grain -71.6 61.0 100.0 97.6 100.0 71.6 61.0 100.0 100.0 100.0
Tomatoes 100.0 100.0 100.0 99.8 99.6 100.0 100.0 100.0 100.0 99.6
Wheat flour 100.0 100.0 100.0 -100.0 4.8 100.0 100.0 100.0 100.0 4.8
Fish and crustaceans 100.0 80.2 72.7 -1.0 33.1 100.0 100.0 75.3 99.8 33.1
Ethiopia
Bovine meat 4.8 4.8
Dry legumes & pulses -30.6 -65.1 -53.2 -48.7 -57.4 30.6 100.0 53.6 48.7 57.4
Live bovine animals -100.0 -100.0 4.8 -100.0 -100.0 100.0 94.8 4.8 100.0 100.0
Maize grain -86.1 78.4 100.0 100.0 100.0 100.0 99.3 100.0 100.0 100.0
Onions -100.0 -99.3 4.8 -100.0 -100.0 100.0 100.0 4.8 100.0 100.0
Tomatoes -100.0 -100.0 4.8 -100.0 -100.0 100.0 4.8 100.0 100.0
Kenya
Bovine meat -77.0 19.3 -76.3 -50.7 -29.1 77.1 50.7 76.3 58.2 53.7
Dry legumes & pulses 0.5 -48.8 -31.6 -19.8 -75.3 7.2 3.6 43.3 48.0 75.6
Live bovine animals -72.3 -1.2 -8.2 10.2 52.3 72.3 20.4 58.7 22.9 52.3
Maize flour 88.8 -10.7 -4.5 -69.6 54.5 89.0 23.1 21.2 70.9 61.0
Maize grain 3.6 -23.1 -7.9 20.5 -8.6 6.4 38.8 14.4 45.1 8.6
Milk and cream 15.1 26.5 -46.8 -47.2 13.1 40.2 9.9 47.1 56.5 20.3
Onions 71.5 6.3 -47.9 -36.7 -32.0 71.5 6.7 49.1 45.6 43.1
Rice grain 48.9 6.4 2.0 -50.9 -27.6 54.4 59.4 4.7 69.4 28.5
Tomatoes -68.3 59.4 -67.7 -57.4 -49.1 80.0 52.6 71.7 61.4 51.8
22
Wheat flour -20.4 -51.8 -91.3 -77.6 -82.1 20.6 53.7 91.4 77.8 83.5
Fish and crustaceans -60.2 -53.0 6.1 -11.7 -20.7 64.3 12.0 51.5 31.3
Malawi
Dry legumes & pulses -28.6 -83.3 -12.0 -12.8 -14.3 28.6 23.8 19.0 12.8 42.1
Maize grain 57.8 22.2 15.0 -28.8 -43.5 84.1 93.7 15.4 31.8 43.5
Milk and cream 100.0 -93.7 -96.6 35.3 -81.9 100.0 61.7 96.6 50.0 81.9
Rice grain 0.2 -49.8 -6.8 -6.7 -1.3 1.7 4.8 6.8 6.7 1.3
Wheat flour 100.0 4.8 -87.3 -100.0 100.0 21.2 87.3 100.0
Fish and crustaceans -99.4 -12.7 4.7 -100.0 100.0 99.4 27.7 100.0 100.0
Rwanda
Bovine meat -100.0 4.8 100.0 100.0 100.0 42.5 4.8 100.0 100.0
Dry legumes & pulses -34.2 -4.2 -11.9 8.3 -25.3 34.3 5.9 17.4 20.6 25.3
Live bovine animals 4.7 3.5 4.5 3.9 21.3 4.9 7.0 4.9 5.2 22.8
Maize flour 3.5 7.0 4.8 2.5 4.9 5.6 60.7 4.8 6.7 4.9
Maize grain 8.4 -13.7 80.2 7.5 -26.1 16.8 36.5 83.5 11.2 32.7
Milk and cream -100.0 -30.1 2.0 7.1 -4.8 100.0 47.2 44.7 7.2 10.4
Onions -86.4 35.4 -68.5 -20.2 -2.9 86.7 58.2 71.4 46.4 87.9
Rice grain -4.7 -54.1 5.1 27.3 -7.4 38.8 44.1 5.4 42.1 7.4
Tomatoes -100.0 -44.1 -12.2 100.0 99.3 100.0 4.8 20.2 100.0 99.3
Wheat flour -6.3 4.7 4.2 12.3 1.6 23.2 23.2 5.3 16.6 1.6
Fish and crustaceans 4.9 23.2 3.7 -39.1 6.7 4.9 5.7 41.3 6.9
Tanzania
Bovine meat 11.4 100.0 11.4
Dry legumes & pulses 100.0 100.0 100.0 100.0 100.0 100.0 88.8 100.0 100.0 100.0
Live bovine animals -86.2 -21.5 15.6 -84.3 -68.8 87.1 88.3 23.8 84.6 89.6
Maize flour -82.4 43.8 43.8 36.2 53.8 86.8 100.0 82.8 36.2 76.4
Maize grain 19.5 82.9 16.6 64.0 51.1 30.5 65.3 21.6 68.5 64.8
Milk and cream 91.5 68.7 86.9 94.1 74.3 99.8 32.7 98.0 98.8 97.7
Onions 79.4 65.3 -10.1 13.0 8.1 79.4 76.5 20.6 23.9 21.7
Rice grain 25.5 29.8 11.7 52.7 27.0 25.7 4.3 30.2 75.6 55.8
Tomatoes 24.3 76.5 -18.7 -79.8 -25.8 24.3 55.7 18.7 81.5 85.8
Wheat flour -0.1 -0.2 -97.1 4.3 -80.2 7.3 97.1 5.4 100.0
Fish and crustaceans -32.4 -2.7 -23.7 21.8 61.4 36.9 4.8 54.5 48.8 82.3
23
Uganda
Bovine meat 4.8 4.8 -100.0 -93.6 -97.0 4.8 11.4 100.0 94.2 98.2
Dry legumes & pulses 28.6 11.2 39.8 35.7 1.9 39.6 15.9 41.2 48.7 69.1
Live bovine animals -36.8 34.6 69.8 16.8 -11.9 50.5 46.1 69.8 16.8 13.4
Maize flour 17.2 15.9 6.2 -6.0 -72.6 21.6 16.7 14.9 48.1 85.9
Maize grain 15.7 31.9 16.2 18.7 25.8 34.3 99.8 26.2 39.9 46.9
Milk and cream 61.7 14.2 6.9 -10.0 18.9 65.7 10.1 11.9 21.2 32.8
Onions 89.8 18.8 87.0 81.6 -10.6 100.0 100.0 99.1 100.0 100.0
Rice grain -3.5 3.5 65.7 92.4 -100.0 15.1 24.4 65.7 92.7 100.0
Tomatoes 65.3 92.7 98.5 97.4 -35.6 100.0 33.1 98.5 97.4 100.0
Wheat flour 4.9 -17.4 -4.4 28.2 -97.1 5.9 13.2 84.0 97.2
Fish and crustaceans 5.7 -18.8 31.9 22.8 11.9 18.2 7.9 66.5 63.1 44.2
Zambia
Bovine meat 4.8 1.3 3.8 4.7 3.4 4.8 8.9 5.7 4.7 3.8
Dry legumes & pulses 4.8 4.8 32.2 5.8 12.3 4.8 11.2 32.2 5.9 12.3
Live bovine animals 4.8 -5.3 8.2 1.3 3.8 4.8 13.1 8.2 1.3 6.0
Maize flour -23.7 4.8 -28.7 28.4 100.0 30.6 35.2 28.4 100.0
Maize grain 2.8 5.8 -29.6 -30.6 25.6 10.2 4.8 29.8 43.1 27.3
Milk and cream -64.4 13.1 0.0 -44.6 -33.5 66.7 7.1 51.8 37.2
Onions 4.9 -52.9 4.3 5.4 4.9 57.2 4.3 5.4
Rice grain 4.8 4.8 -20.8 4.3 13.0 4.8 27.5 4.3 13.2
Tomatoes 4.8 4.8 4.8 4.8
Wheat flour 4.8 4.8 4.7 4.8 4.8 4.7
Fish and crustaceans 22.1 4.8 -8.4 22.2 4.8 15.4