analysis...
TRANSCRIPT
Ecological Economics 137 (2017) 195–206
Contents lists available at ScienceDirect
Ecological Economics
j ourna l homepage: www.e lsev ie r .com/ locate /eco lecon
Analysis
Understanding the Amenity Impacts of Wind Development on anInternational Border�
Martin D. Heintzelmana,*,1, Richard J. Vynb,1, Sarah Guthc
aEnvironmental Economics, School of Business, Clarkson University, P.O. Box 5790, Potsdam, NY13699, United StatesbDepartment of Food, Agricultural & Resource Economics, University of Guelph, Ridgetown Campus, CanadacHarvard University, United States
A R T I C L E I N F O
Article history:Received 14 January 2016Accepted 5 March 2017Available online 23 March 2017
Keywords:Hedonic AnalysisWind EnergyProperty ValuesBorder StudiesCanada and the United States
A B S T R A C T
Wind energy developments are often controversial. Concerns are often raised about negative impacts onlocal communities, including impacts on property values. Some of these negative impacts may be off-set by compensatory payments made by wind developers. Community involvement in the planning anddevelopment process may also reduce negative perceptions associated with wind facilities. However, if thedevelopment is near a border between municipalities, states, or even countries, it is often the case that oneor more jurisdictions will not be involved in the process or receive compensation, but will, nonetheless,face some costs or impacts from the development. We explore exactly this situation at the border betweenCanada and the United States in the Thousand Islands region where a wind farm is currently operating on theCanadian border island of Wolfe Island. Using a parcel-level hedonic analysis of property sales transactions,we find that properties in New York with a view of and/or in close proximity to the turbines significantlydepreciated in value after construction of the turbines while no negative impacts were observed on prop-erties in Ontario. We highlight a number of factors that could contribute to these differences in impacts onproperty values, which may also explain the variation in results that currently exists in the literature.
© 2017 Elsevier B.V. All rights reserved.
1. Introduction
Renewable energy sources are a steadily increasing portion ofour global energy mix. Such energy sources are a global publicgood — by substituting for more pollution-intensive fossil-fuelsources they reduce global pollution of criteria pollutants, such asNOx, SOx, Mercury, and others, as well as greenhouse pollutants like
� This paper is based, in part, on data provided by the Municipal Property Assess-ment Corporation. Any opinions, findings, conclusions or recommendations expressedin this material are those solely of the authors and are not necessarily the views ofthe Municipal Property Assessment Corporation. This research was supported by theFredric C. Menz endowment fund for Environmental Economics at Clarkson Univer-sity. Background research was conducted while Guth was participating in ClarksonUniversity’s Research Experience for Undergraduates (REU) program, supported byNSF Grant No. EEC-1359256. Additional research assistance was provided by BrittanyBerry at the University of Guelph and Chuan Tang at Clarkson University. Some GISanalysis was provided by Adam Bonnycastle, also of the University of Guelph. Weare indebted to seminar respondents at the University of New Hampshire and the2015 Biennial Meeting of the Association for Canadian Studies in the United States forhelpful comments and suggestions.
* Corresponding author.E-mail address: [email protected] (M.D. Heintzelman).
1 Primary authorship of this paper was shared equally between Heintzelmanand Vyn.
CO2.2 The benefits of these reductions are generally spread over alarge area and, in the case of greenhouse gases, over the entire planet.The costs of these reductions, however, are more likely to fall ona much smaller geographic area. In some cases, in fact, renewableenergy facilities can be thought of simultaneously as global publicgoods and local public bads. As evidence of this, siting new renew-able energy facilities, particularly wind farms, is often controversial,with local governments and/or residents putting up stiff resistance.Common local concerns about wind developments include visual andaural disamenities, potential human health impacts, and impacts onwildlife. These perceived amenity and health impacts are likely to bereflected in property values as bids for properties in close proximityto wind turbines may be reduced. Research on the impacts of windturbines on property values is a growing area of the literature, butremains without consensus in the results regarding these impacts.
A number of recent studies using the hedonic pricing method(Rosen, 1974) have found evidence of significant negative impacts(Gibbons, 2015; Heintzelman and Tuttle, 2012; Jensen et al., 2014;Sunak and Madlener, 2012), while other studies have not found
2 The exact emissions reductions from a wind facility depends very much on whatother energy sources are displaced, the focus of Kaffine et al. (2013).
http://dx.doi.org/10.1016/j.ecolecon.2017.03.0080921-8009/© 2017 Elsevier B.V. All rights reserved.
Mark Thayer Direct Testimony, Ex.___, Exhibit 10
Page 1 of 12

196 M. Heintzelman et al. / Ecological Economics 137 (2017) 195–206
significant impacts (Hoen et al., 2011, 2015; Lang et al., 2014; Simsand Dent, 2007; Sims et al., 2008; Vyn and McCullough, 2014).These mixed results may occur due in part to issues inherent in theestimation of these impacts. Typically there are relatively few obser-vations from which impacts are estimated for individual wind farms,which may affect the validity of the results or reduce the likelihood offinding statistically significant impacts. Hoen et al. (2015) addressedthis issue by combining multiple sites around the U.S., which pro-duced a large data set with many observations in close proximityto turbines. However, combining observations across multiple sitesmay obscure variation that may occur in the impacts across sites,which was demonstrated by Heintzelman and Tuttle (2012) wheresignificant negative impacts were found at two sites but not at a thirdsite. The mixed results in the literature may also suggest that theremay not be a single, global answer to the question regarding impactsof wind turbines on property values; rather, the specific context forindividual sites may influence whether significant impacts occur.
There are a number of factors related to context that may affectthe nature of the impacts that wind turbines have on property val-ues. The degree of local controversy related to wind development canpotentially influence perceptions regarding the disamenity effects ofwind turbines, which in turn could affect the willingness to pay forproperties in close proximity to turbines. The impacts may be exac-erbated by the presence of seasonal or vacation homes. Owners ofthese homes are likely to have more elastic preferences regardingchanges in the amenities surrounding their property, and may bemore likely to sell their property or less likely to buy a property dueto an adverse change in amenities, which could contribute to a rel-atively greater impact on prices for these properties. Acting counterto these potential negative impacts are benefits that accrue throughpayments from developers to local landowners, through lease pay-ments for use of the land, and to communities, through payments-in-lieu-of-taxes (PILOTs). Another potential influencing factor is publicinvolvement in the approval and development process. If a commu-nity feels that they have not had sufficient input into this process,this can create considerable opposition to and negative perceptionsof the turbines, which can be manifested in property value impacts,whereas if the community is involved throughout the process, resi-dents may be less likely to hold negative perceptions of the turbines(Devine-Wright, 2005). As an extreme form of this, if the develop-ment happens near a border between communities, but is whollycontained within one community, the community without the devel-opment is unlikely to be consulted during the approval process andwould not receive compensation from the developer. These neigh-boring communities, in other words, will bear some of the cost of theproject with little prospect of receiving any benefits.
The factors discussed above are explored in this paper, using aunique setting in which a large wind farm was constructed on theCanadian island of Wolfe Island in the St. Lawrence River along theborder between Canada and the United States. This setting is idealfor examining the impacts of these contextual factors, particularlythe cross-border impacts and the influence of seasonal or vacationhomes. While the wind turbines on Wolfe Island affect the viewshedfor properties on both sides of the border, the development of thiswind farm involved public consultation and compensation only onthe Canadian side. In addition, many of the properties on the Amer-ican side, particularly those with views of the turbines, are seasonalor vacation homes rather than primary residences.
We use a hedonic analysis and property sales data to examineand compare how property values on both sides of the border havebeen impacted by the Wolfe Island wind turbines. In this analysis,a difference-in-differences approach is used to compare transactionprices before and after approval or construction of the wind farm aswell as between homes which can and cannot view the turbines, orare at varying distances from the turbines. We employ fixed effectsto mitigate potential omitted variables bias as well as to control
for property market trends and seasonality of prices. We find evi-dence of negative property value impacts on the American side afterconstruction of the turbines for properties in close proximity tothe turbines and/or with a view of the turbines. In contrast, we donot find evidence of significant negative impacts on the Canadianside.
2. Study Region
Wolfe Island, which is the largest island in the Thousand Islandsregion, is situated at the entrance of the St. Lawrence River in LakeOntario, directly across the river from the community of Cape Vin-cent in the state of New York. The Wolfe Island wind farm wasdeveloped by Canadian Hydro Developers3 , which initially submit-ted a proposal for construction of this wind farm on the westernhalf of the island in July 2005 (Keating, 2006). The official plan andzoning bylaw amendments necessary to allow this project to moveforward were passed by council in November 2006, and the projectwas officially announced on the Wolfe Island website in April 2007.Construction of the 86-turbine, 197.8 MW facility began in May2008 and was completed in June 2009, at which time the wind farmbecame operational (Ontario Power Authority).
On the American side, we focus on Jefferson County, which sitsat the northern edge of New York and borders both the St. LawrenceRiver and Lake Ontario. Throughout the past decade, wind energyhas divided public opinion in the county. The region has been thetargeted site for several recent American wind facility proposals,including in the Town of Cape Vincent and in the Town of Hounsfield,on Galloo Island in Lake Ontario, all of which have been highlycontroversial.
Newspaper coverage and letters to the editor in the New Yorkmedia regarding the Wolfe Island facility clearly expressed JeffersonCounty residents’ opposition to turbines due to negative aestheticimpacts. A Cape Vincent journalist feared that the turbines “willtake away [the] image and. . . beauty of [his] township”, deterringprospective seasonal residents who “contribute so much in taxes andexpertise” (Radley, 2009). A Chaumont resident characterized thewind farm as “blight on landscape” (Lynne, 2009). Finally, a seasonalresident of Chippewa Bay described the waterfront view of facilitynighttime lighting as “a jolt to the entire landscape and to [his] mind,. . . like a jab in the ribs” (Quarrier, 2009).
Similar sentiments have been expressed by residents of WolfeIsland, where the construction of this wind farm generated consid-erable controversy and public opposition. Opponents of the windturbines have expressed concerns regarding “the industrializationof this rural community” and how the turbines “forever change thelandscape into something that doesn’t fit here” (Fast et al., 2015). Aswith Cape Vincent, there are a considerable number of seasonal res-idences on Wolfe Island, many of which are waterfront properties.According to Fast et al. (2015) , summer cottages comprise aboutone-third of all residences on the island. As such, visual amenitiesplay a significant role in the value of these properties, and owners ofthese properties have expressed concerns regarding potential nega-tive impacts on property values arising due to the visual disamenitiesassociated with wind turbines. As one seasonal resident stated, “whywould I want to live there [with the turbines]?” (Fast et al., 2015)In one case, property owners brought an appeal to Ontario’s Assess-ment Review Board to have the assessed value of their waterfrontproperty reduced due to the devaluation caused by the wind tur-bines. This appeal was ultimately rejected due to a lack of evidenceof negative impacts. But this case highlights the underlying concernsthat exist among residents of Wolfe Island regarding impacts of wind
3 Canadian Hydro Developers was acquired by TransAlta in 2009.
Mark Thayer Direct Testimony, Ex.___, Exhibit 10
Page 2 of 12

M. Heintzelman et al. / Ecological Economics 137 (2017) 195–206 197
turbines. However, not all residents of Wolfe Island were opposedto this project. As evident from interviews conducted by Fast et al.(2015) , there are a considerable number of area residents that weresupportive of the project and of wind energy in general.
It is interesting to note that similar concerns and issues wereraised by residents on both sides of the border despite the fact thatpublic meetings and open houses were held for residents on theCanadian side throughout the application and development process.Public open houses for this project were first held in March of 2006,only a few months after the project was initially proposed. In Octo-ber 2006, a public meeting was held to consider a proposed zoningby-law amendment applicable to all Wolfe Island lands optioned fora wind plant zone (this amendment was passed by council the fol-lowing month). In March 2007, public open houses were held thatincluded maps indicating the 86 turbine locations. Overall, publicconsultation focused only on residents of Wolfe Island, while res-idents of Cape Vincent had no involvement in this process. Thisdifference in the level of involvement could potentially contributeto a difference in the nature of the resulting impacts on either sideof the border. In addition, the Township of Frontenac Islands, whichincludes Wolfe Island, receives C$645,000 per year in paymentsfrom the developer, while no compensation is provided to Jeffer-son County. This could also contribute to a difference in impacts onproperty values.
3. Data and Methodology
3.1. Property Value Data
We estimate the impacts of the Wolfe Island wind farmon property values using data on 8279 single-family residentialproperty transactions on both sides of the border: 6017 in Jeffer-son County, NY4 , and 2262 across the border in Frontenac County,Ontario. Fig. 1 provides a map of the study area and transaction loca-tions. Data on NY transactions between January 2004 and July 2013,inclusive, comes from the New York State Office of Real PropertyTaxation Services (NYSORPTS). This data includes sale price, saledate, and parcel identifying information. This transaction data is thenmerged with parcel and home characteristics data from the assess-ment process, also from NYSORPTS. We then bring in parcel shapefile(GIS) data which we acquired from the Jefferson County Assessor’sOffice. With this spatial data we calculate a number of distance andspatial variables in ArcGIS. Data on Canadian transactions comesfrom Ontario’s Municipal Property Assessment Corporation (MPAC).This detailed data includes all open-market sales of residential prop-erties in Frontenac County between September 2004 and July 2013,inclusive. An extensive set of property and structural variables isincluded in the MPAC data, while additional distance and spatial vari-ables are calculated using ArcGIS. There are no sales in this data setof properties on which a turbine is located.
To ensure consistency in the estimation approach between thetwo sides of the border and to reduce the possibility of bias betweenthe two sets of results, the same set of explanatory variables repre-senting the parcel and structural characteristics are used. Variablesaccounting for parcel attributes include lot size and categorical vari-ables for waterfront and seasonal properties as well as for theexistence of a mobile home as the primary residence. The value asso-ciated with the residence on each parcel is accounted for by a set ofvariables that includes living area, finished basement area, age of thehouse, a house quality index (from 1 to 5), the numbers of bathrooms,bedrooms, and stories, and categorical variables for the existence of afireplace, central air conditioning, and forced air heating. In addition
4 There were an additional 11 transactions that had to be omitted from the data setdue to incomplete information.
to distance to the nearest turbine, other distance variables includethe distances from each parcel to the nearest city, to the nearesttown, and to the St. Lawrence River. As mentioned above, sets of yearand month fixed effects variables are also included. All of these vari-ables were included in both data sets, though in some cases slightadjustments were made in the merging process. For example, thehouse quality index variable is based on a 5-point scale in the NYdata and on a 10-point scale in the ON data, which is accounted forby dividing the quality index by two for parcels in Ontario.
3.2. Wind Turbine Data
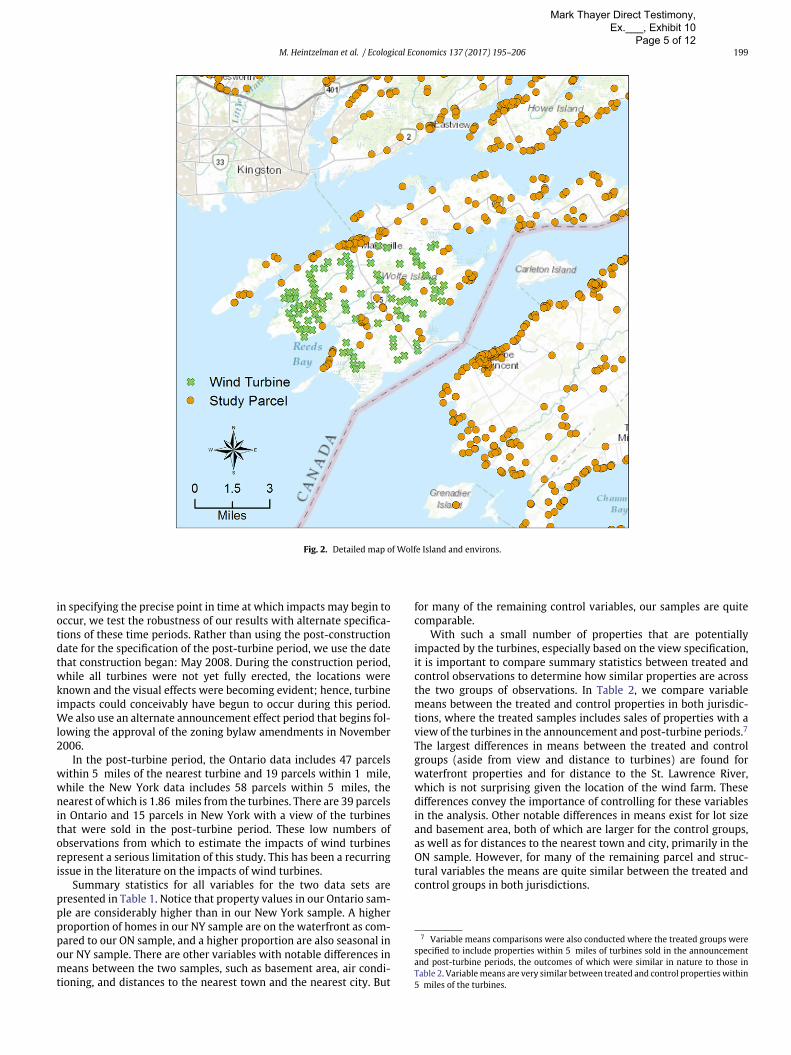
The Wolfe Island wind farm consists of 86 turbines built primarilyon farmland properties but with residential properties interspersedwithin and around this area that may be impacted by the turbines.The locations of the turbines and of properties within the sampleson both sides of the border that are in close proximity to the tur-bines are indicated in Fig. 2. The key variables specified to capturethe visual and aural impacts of the wind turbines include a tur-bine visibility variable and a turbine proximity variable. We estimateseparate models using each of these variables. The turbine prox-imity variable was specified based on the Euclidean distance fromeach parcel to the nearest turbine on Wolfe Island, calculated usingArcGIS. Previous studies that have accounted for turbine impactson property values based on distance measures have used inversedistance (e.g., Heintzelman and Tuttle, 2012; Vyn and McCullough,2014) and distance bands (e.g., Hoen et al., 2011, 2015). Both of thesemeasures have potential shortcomings: the use of inverse distanceinvolves estimating impacts at the mean distance from the turbinesand, as such, may underestimate the potentially greater impacts invery close proximity to turbines, while the use of distance bands,which involves dividing up observations into bins of specified dis-tances from turbines, can result in estimated impacts for each bandthat may be based on relatively few observations. Due to the rela-tively low number of observations in our data sets in close proximityto the turbines, the shortcoming associated with the use of distancebands is of greater concern. As a result, we use the inverse distancemeasure in our analysis (InvDistance). Given the distance-decayingnature of the visual and aural impacts of turbines, any impacts onproperty values are expected to be greater in closer proximity to theturbines, which would be reflected by a negative coefficient for theinverse distance variable.
Since proximity does not necessarily correspond with visibility,as view may be obstructed by landscape features, we also conductedfield visits to all parcels that are potentially within visibility of thewind turbines (this potential was determined based on a combina-tion of viewshed modelling in ArcGIS and distance to the nearestturbine — less than 5 miles). On these visits, it was determinedwhether the parcel (as viewed from the road) had a partial or fullview of one or more of the turbines. These assessments were usedto create a categorical variable indicating whether properties had aview (either partial or full) of the turbines (View).5
The field observations of the visual impacts of every transactedparcel with a potential view is a strength of this paper, similar to thatof Hoen et al. (2011) and Hoen et al. (2015). It is superior to solelyusing viewshed analysis in ArcGIS, which generally relies on a num-ber of assumptions about the height of different forms of land cover(trees) to estimate views, and cannot possibly include every potential
5 Since there are relatively few parcels with a view of the turbines, we use onlya single variable to represent view rather than accounting separately for impacts onparcels with a full view and impacts on parcels with a partial view. As a result, anyeffects that we estimate using this measure will be an average of effects across thesesub-categories of view, presumably over-estimating the effect for those with only apartial view of one turbine and under-estimating the effect for those with full viewsof multiple turbines.
Mark Thayer Direct Testimony, Ex.___, Exhibit 10
Page 3 of 12

198 M. Heintzelman et al. / Ecological Economics 137 (2017) 195–206
Fig. 1. Study area.
obstruction. Because of this, viewshed analysis will tend to overesti-mate turbine views, and we avoid this potential error with the fieldobservations. It is important to note, however, that there could stillbe some error in this view variable. It is possible that some parcelswith a view fell outside of our distance filter in determining whichparcels to visit. That is, we may be underestimating the number ofparcels with views of the turbines. Nonetheless, these parcels wouldbe more than 5 miles from the turbines, and thus less likely to beimpacted by the turbines.6
While turbine view is highly correlated with turbine proximity(0.6089), we believe it is important to conduct analysis using both
6 If we did mischaracterize some parcels with a view as not having a view, andthose parcels were actually negatively impacted, we are likely to be underestimatingthe negative impacts in our analysis. If, on the other hand, these parcels were notnegatively impacted, despite the view, than our results would be biased in the otherdirection.
factors, as they account for different aspects of the potential impactsof turbines, although not simultaneously. For example, turbine viewaccounts only for the visual impacts of turbines, while turbine prox-imity also accounts for aural impacts. Both of these factors have beenutilized in previous studies, and are included here.
Since the data includes sales that occurred both before and afterthe wind farm was developed, it is necessary to account for thetime period during which turbine impacts on property values areexpected to occur. We specify a post-turbine period to account forsales that occurred after turbine construction on Wolfe Island wascompleted in June 2009 (Post-Turbine). In addition, we accountfor potential announcement effects by specifying an announcementperiod between April 2007, when the wind farm was first announced,and June 2009 (Announcement). Each of these time period variablesis interacted with the visibility (View) and turbine distance (InvDis-tance) variables in order to specify the variables that account for theimpacts of turbines on property values. However, given the difficulty
Mark Thayer Direct Testimony, Ex.___, Exhibit 10
Page 4 of 12
M. Heintzelman et al. / Ecological Economics 137 (2017) 195–206 199
Fig. 2. Detailed map of Wolfe Island and environs.
in specifying the precise point in time at which impacts may begin tooccur, we test the robustness of our results with alternate specifica-tions of these time periods. Rather than using the post-constructiondate for the specification of the post-turbine period, we use the datethat construction began: May 2008. During the construction period,while all turbines were not yet fully erected, the locations wereknown and the visual effects were becoming evident; hence, turbineimpacts could conceivably have begun to occur during this period.We also use an alternate announcement effect period that begins fol-lowing the approval of the zoning bylaw amendments in November2006.
In the post-turbine period, the Ontario data includes 47 parcelswithin 5 miles of the nearest turbine and 19 parcels within 1 mile,while the New York data includes 58 parcels within 5 miles, thenearest of which is 1.86 miles from the turbines. There are 39 parcelsin Ontario and 15 parcels in New York with a view of the turbinesthat were sold in the post-turbine period. These low numbers ofobservations from which to estimate the impacts of wind turbinesrepresent a serious limitation of this study. This has been a recurringissue in the literature on the impacts of wind turbines.
Summary statistics for all variables for the two data sets arepresented in Table 1. Notice that property values in our Ontario sam-ple are considerably higher than in our New York sample. A higherproportion of homes in our NY sample are on the waterfront as com-pared to our ON sample, and a higher proportion are also seasonal inour NY sample. There are other variables with notable differences inmeans between the two samples, such as basement area, air condi-tioning, and distances to the nearest town and the nearest city. But
for many of the remaining control variables, our samples are quitecomparable.
With such a small number of properties that are potentiallyimpacted by the turbines, especially based on the view specification,it is important to compare summary statistics between treated andcontrol observations to determine how similar properties are acrossthe two groups of observations. In Table 2, we compare variablemeans between the treated and control properties in both jurisdic-tions, where the treated samples includes sales of properties with aview of the turbines in the announcement and post-turbine periods.7
The largest differences in means between the treated and controlgroups (aside from view and distance to turbines) are found forwaterfront properties and for distance to the St. Lawrence River,which is not surprising given the location of the wind farm. Thesedifferences convey the importance of controlling for these variablesin the analysis. Other notable differences in means exist for lot sizeand basement area, both of which are larger for the control groups,as well as for distances to the nearest town and city, primarily in theON sample. However, for many of the remaining parcel and struc-tural variables the means are quite similar between the treated andcontrol groups in both jurisdictions.
7 Variable means comparisons were also conducted where the treated groups werespecified to include properties within 5 miles of turbines sold in the announcementand post-turbine periods, the outcomes of which were similar in nature to those inTable 2. Variable means are very similar between treated and control properties within5 miles of the turbines.
Mark Thayer Direct Testimony, Ex.___, Exhibit 10
Page 5 of 12

200 M. Heintzelman et al. / Ecological Economics 137 (2017) 195–206
Table 1Summary statistics.
Ontario New York
Variable name Variable description Mean Std. Dev. Min Max Mean Std. Dev. Min Max
Sale price Sale price of the parcel, inCanadian $ for Ontario sales andin US $ for New York sales
241,150.40 122,104.90 25,000.00 1,600,000.00 142,004.90 101,407.80 3,500.00 2,000,300.00
View = 1 if parcel has a view (full orpartial) of the turbines
0.03 0.18 0 1 0 0.07 0 1
Distance Distance to nearest Wolfe Islandturbine, in miles
19.28 13.21 0.28 71.45 25.75 9.02 1.86 44.38
Announcement = 1 if parcel sold between projectannouncement and completion ofturbine construction
0.35 0.48 0 1 0.21 0.41 0 1
Post-turbine = 1 if parcel sold followingcompletion of turbineconstruction
0.59 0.49 0 1 0.41 0.49 0 1
Waterfront = 1 if parcel is on the waterfront 0.05 0.22 0 1 0.12 0.32 0 1Seasonal = 1 if parcel is seasonal 0.06 0.24 0 1 0.1 0.3 0 1Mobile = 1 if residence is mobile home 0.01 0.11 0 1 0.04 0.19 0 1Lot size Size of the parcel, in acres 4.18 14.48 0.06 300.56 6.54 25.41 0.01 391.43Living area Living area of the house, in
square feet1493.10 587.71 101 4839.00 1557.52 598.32 136 6074.00
Basement area Finished basement area, in squarefeet
221.04 385.94 0 4091.00 71.47 276.6 0 2600.00
Stories Number of stories in the house 1.26 0.4 1 3 1.46 0.44 1 3Quality House quality index (1–5) 2.89 0.39 0.5 4 2.94 0.54 1 5Age Age of the house, in years 42.45 37.29 0 190 67.5 52.45 0 225Bathrooms Number of bathrooms 1.51 0.7 0 4.5 1.43 0.58 0 5.5Bedrooms Number of bedrooms 2.92 0.82 0 9 2.99 0.94 0 9Fireplace = 1 if at least one fireplace exists
in the house0.29 0.45 0 1 0.17 0.38 0 1
Air = 1 if house has central airconditioning
0.23 0.42 0 1 0.02 0.14 0 1
Forced air = 1 if the house has forced airheat
0.72 0.45 0 1 0.7 0.46 0 1
Town Distance to the nearest town, inmiles
13.8 10.29 0 57.02 1.61 1.51 0 8.25
City Distance to the nearest city(population > 50,000), in miles
17.02 16.49 0 81.32 2.9 3.03 0 17.88
St. Lawrence Distance to the St. LawrenceRiver, in miles
14 12.52 0.01 62.36 7.17 6.77 0 26.45
Observations 2262 6017
3.3. Methodology
Hedonic analysis is a well-accepted form of revealed preference(as opposed to stated preference) non-market valuation in the fieldof environmental economics. This approach is derived from Rosen(1974) and others.8 Essentially, Rosen (1974) lays out a model of buy-ers and sellers with preferences over the attributes of a compoundgood, like housing. In this case, he derives a hedonic price functionshowing that, under certain assumptions, the market price of a housewill be a function of its attributes. One can then estimate this hedo-nic function using data on a set of homes with varying prices andattributes, where the estimated coefficients represent the marginalwillingness-to-pay for changes in these individual attributes. Thestrength of this approach is that it allows for the estimation of thevalue of marginal changes in attributes that are otherwise not boughtand sold on markets, such as environmental amenities.
The hedonic method is quite powerful because any amenitywhich is valued by consumers and associated in some way withhousing markets can, in theory, be valued through this method underthe right conditions. A limitation of this approach, however, is thatthe hedonic method can only estimate what are called “use” val-ues of homeowners or renters, and not broader societal values. Forinstance, the hedonic method could estimate the value of having a
8 See Taylor (2003) and Freeman III et al. (2014) for comprehensive treatments ofthe hedonic method in environmental economics.
healthy ecosystem to residents in a local area, but cannot estimatethe value to society-at-large of a particular ecosystem.
As in any econometric exercise, there are a number of empiricalissues that are common in hedonic analyses. First, one must take carein choosing the functional form. Traditionally, based on Cropper etal. (1988), the log-linear or log-log forms are preferred. We use a log-log form for our analysis. However, to ensure that this selection offunctional form does not bias the results, we also tested the sensitiv-ity of the results to a log-linear functional form, which has also beenused in recent studies on the impacts of wind turbines on propertyvalues. We found that the nature of the results of our primary vari-ables of interest was consistent between the log–log and log–linearforms, which suggests that our results are not particularly sensitiveto the selection of functional form.
Kuminoff et al. (2010) also advocate for the inclusion of spatialfixed effects, temporal controls, and quasi-experimental identifica-tion to control as best as possible for omitted variables bias, whichis endemic to applications of the hedonic method. Omitted variablesbias arises when one or more factors that are correlated with boththe dependent variable and one or more included explanatory vari-ables are omitted from the specification. In this case, the analysis willassign explanatory power which properly belongs with the omittedvariable to included variables, resulting in biased estimates of theeffects of those variables. Given the large number of factors which areboth unobservable to the analyst and correlated with property values(local neighborhood attributes, for instance), this has serious impli-cations for hedonic analysis. Similarly, given that we are trying to
Mark Thayer Direct Testimony, Ex.___, Exhibit 10
Page 6 of 12

M. Heintzelman et al. / Ecological Economics 137 (2017) 195–206 201
Table 2Variable means and standard deviations for treated and control properties, based on turbine view.
Ontario New York
Treated Control Treated Control
Variable name Mean Std. Dev. Mean Std. Dev. Mean Std. Dev. Mean Std. Dev.
Sale price 330,567.80 250,096.00 238,880.50 116,275.10 209,351.40 194,272.30 141,757.70 100,858.10View 1 0 0.01 0.09 1 0 0 0.03Distance 2.25 2.17 19.72 13.09 2.88 0.63 25.84 8.92Announcement 0.3 0.46 0.36 0.48 0.32 0.48 0.21 0.41Post-Con 0.7 0.46 0.58 0.49 0.68 0.48 0.41 0.49Waterfront 0.52 0.5 0.04 0.19 0.45 0.51 0.12 0.32Seasonal 0.21 0.41 0.06 0.24 0.14 0.35 0.1 0.3Mobile 0.02 0.13 0.01 0.11 0.05 0.21 0.04 0.19Lot size 2.52 5.6 4.23 14.63 0.99 1.88 6.56 25.45Living area 1473.43 509.86 1493.60 589.65 1583.86 654.26 1557.42 598.16Basement area 102.71 243.97 224.05 388.43 0 0 71.73 277.07Stories 1.34 0.36 1.26 0.4 1.41 0.39 1.46 0.44Quality 2.79 0.41 2.89 0.39 3.18 0.73 2.94 0.54Age 50.04 44.69 42.25 37.07 81.68 55.8 67.44 52.43Bathrooms 1.43 0.64 1.52 0.7 1.45 0.6 1.43 0.58Bedrooms 2.82 0.94 2.93 0.82 2.91 1.11 2.99 0.94Fireplace 0.23 0.43 0.29 0.45 0.45 0.51 0.17 0.37Air 0.13 0.33 0.24 0.43 0 0 0.02 0.14Forced air 0.61 0.49 0.72 0.45 0.73 0.46 0.7 0.46Town 7.46 3.17 13.96 10.35 1.47 1.36 1.61 1.51City 9.14 5.65 17.22 16.62 1.39 1.37 2.9 3.04St. Lawrence 0.24 0.41 14.35 12.48 0.05 0.03 7.19 6.76
identify the impact of a feature which changes over time (the WolfeIsland turbines are built mid-sample period), if we fail to adequatelycontrol for trends over time, we may similarly bias our estimates ofthe turbine impacts.
Fixed effects approaches help overcome these issues. By implic-itly including a large number of spatial dummy variables, fixedeffects allows each area (township or census block, for instance) tohave its own intercept term, accounting for time invariant factorswhich affect property values in these areas. The smaller the level ofthe fixed effects, the less likely one is to have an omitted variables
problem (as more and more spatial factors will be subsumed in thefixed effect). However, fixed effects also rely on within unit variationto identify the effects of remaining variables. This often means that asthe level of the fixed effects gets smaller, the analyst loses power toidentify effects. Thus, it is important to carefully balance these effectswhen interpreting results and choosing a level of fixed effects. In ourcase, we found that the use of fixed effects at the township level pro-vided an appropriate balance, as our preliminary analysis indicatedthat the ability to identify effects was diminished with the use offixed effects at the census block level. In addition, differences exist
Table 3Regression results for full sample and 20mile sample — turbine view.
Full sample 20 mile sample
Ontario New York Ontario New York
Variable Coefficient Std. Error Coefficient Std. Error Coefficient Std. Error Coefficient Std. Error
View 0.017 0.017 0.031 0.044 0.006 0.006 0.181 * 0.094Announcement −0.02 0.029 −0.081 0.06 −0.045 0.04 −0.163 ** 0.071Post-Turbine 0.034 0.044 −0.15 ** 0.069 −0.005 0.063 −0.136 0.137View*Announcement 0.008 0.056 0.181 *** 0.056 0.047 0.034 0.068 0.077View*Post-Turbine −0.037 0.048 −0.185 *** 0.052 −0.001 0.027 −0.289 ** 0.101Waterfront 0.615 *** 0.025 0.557 *** 0.065 0.624 *** 0.023 0.555 *** 0.073Seasonal −0.038 0.028 0.137 *** 0.038 −0.03 0.041 0.076 0.064Mobile −0.375 *** 0.049 −0.154 *** 0.042 −0.52 *** 0.028 −0.14 ** 0.048Ln(Lot Size) 0.074 *** 0.01 0.017 0.012 0.067 *** 0.006 0.024 0.02Ln(Living Area) 0.392 *** 0.017 0.563 *** 0.049 0.406 *** 0.029 0.484 *** 0.129Ln(Basement Area) 0.005 0.002 0.005 0.007 0.002 0.003 0.017 0.018Stories −0.056 ** 0.015 0.003 0.037 −0.069 ** 0.012 −0.038 0.073Quality 0.298 *** 0.019 0.294 *** 0.017 0.315 *** 0.027 0.237 *** 0.015Ln(Age) −0.089 *** 0.008 −0.097 *** 0.017 −0.084 *** 0.007 −0.05 0.033Bathrooms 0.057 *** 0.011 0.098 *** 0.019 0.048 ** 0.01 0.135 *** 0.033Bedrooms −0.003 0.008 −0.002 0.016 0.004 0.011 0.027 0.032Fireplace 0.041 ** 0.013 0.148 *** 0.021 0.04 0.014 0.126 ** 0.051Air 0.012 0.009 0.114 ** 0.047 0.013 0.014 0.239 *** 0.038Forced Air 0.043 *** 0.005 −0.113 *** 0.019 0.034 * 0.009 −0.103 * 0.053Ln(Town) −0.163 0.079 −0.057 0.041 −0.18 0.108 −0.012 0.047Ln(City) 0.046 0.075 0.01 0.044 0.1 0.103 0.016 0.04Ln(St. Lawrence) −0.047 *** 0.01 −0.195 *** 0.028 −0.028 0.014 −0.15 ** 0.064Number of observations 2262 6017 1620 1569Adjusted R2 0.7823 0.3969 0.7673 0.4284
Mark Thayer Direct Testimony, Ex.___, Exhibit 10
Page 7 of 12
202 M. Heintzelman et al. / Ecological Economics 137 (2017) 195–206
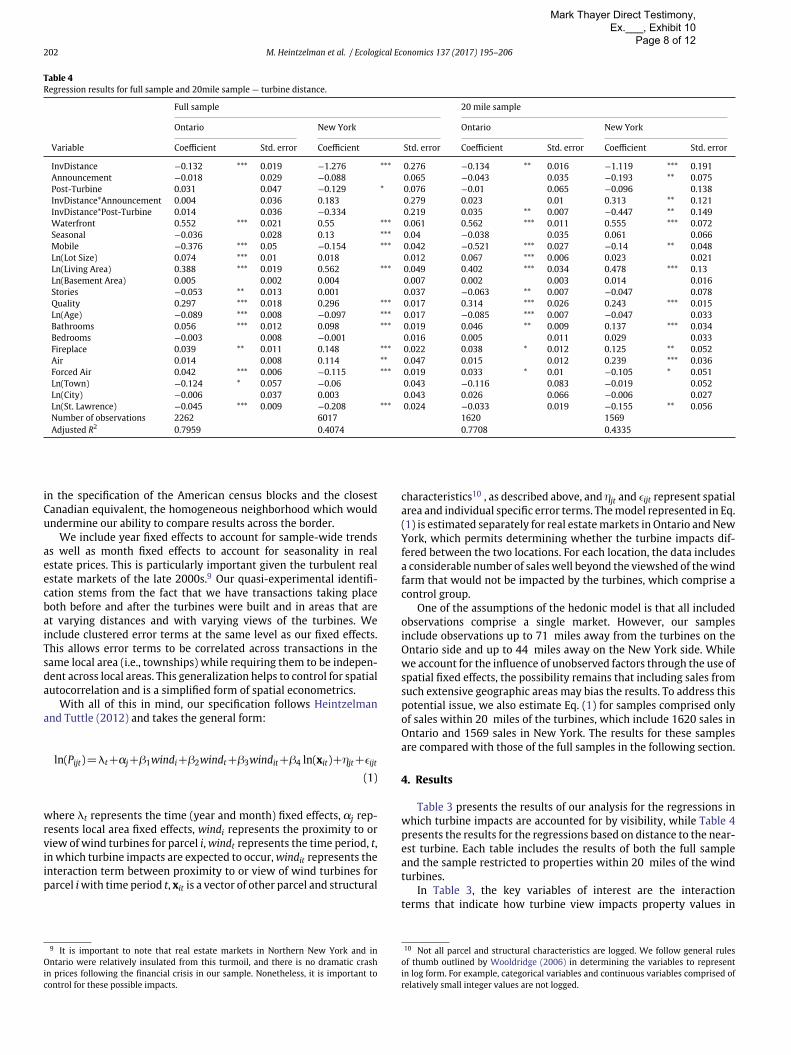
Table 4Regression results for full sample and 20mile sample — turbine distance.
Full sample 20 mile sample
Ontario New York Ontario New York
Variable Coefficient Std. error Coefficient Std. error Coefficient Std. error Coefficient Std. error
InvDistance −0.132 *** 0.019 −1.276 *** 0.276 −0.134 ** 0.016 −1.119 *** 0.191Announcement −0.018 0.029 −0.088 0.065 −0.043 0.035 −0.193 ** 0.075Post-Turbine 0.031 0.047 −0.129 * 0.076 −0.01 0.065 −0.096 0.138InvDistance*Announcement 0.004 0.036 0.183 0.279 0.023 0.01 0.313 ** 0.121InvDistance*Post-Turbine 0.014 0.036 −0.334 0.219 0.035 ** 0.007 −0.447 ** 0.149Waterfront 0.552 *** 0.021 0.55 *** 0.061 0.562 *** 0.011 0.555 *** 0.072Seasonal −0.036 0.028 0.13 *** 0.04 −0.038 0.035 0.061 0.066Mobile −0.376 *** 0.05 −0.154 *** 0.042 −0.521 *** 0.027 −0.14 ** 0.048Ln(Lot Size) 0.074 *** 0.01 0.018 0.012 0.067 *** 0.006 0.023 0.021Ln(Living Area) 0.388 *** 0.019 0.562 *** 0.049 0.402 *** 0.034 0.478 *** 0.13Ln(Basement Area) 0.005 0.002 0.004 0.007 0.002 0.003 0.014 0.016Stories −0.053 ** 0.013 0.001 0.037 −0.063 ** 0.007 −0.047 0.078Quality 0.297 *** 0.018 0.296 *** 0.017 0.314 *** 0.026 0.243 *** 0.015Ln(Age) −0.089 *** 0.008 −0.097 *** 0.017 −0.085 *** 0.007 −0.047 0.033Bathrooms 0.056 *** 0.012 0.098 *** 0.019 0.046 ** 0.009 0.137 *** 0.034Bedrooms −0.003 0.008 −0.001 0.016 0.005 0.011 0.029 0.033Fireplace 0.039 ** 0.011 0.148 *** 0.022 0.038 * 0.012 0.125 ** 0.052Air 0.014 0.008 0.114 ** 0.047 0.015 0.012 0.239 *** 0.036Forced Air 0.042 *** 0.006 −0.115 *** 0.019 0.033 * 0.01 −0.105 * 0.051Ln(Town) −0.124 * 0.057 −0.06 0.043 −0.116 0.083 −0.019 0.052Ln(City) −0.006 0.037 0.003 0.043 0.026 0.066 −0.006 0.027Ln(St. Lawrence) −0.045 *** 0.009 −0.208 *** 0.024 −0.033 0.019 −0.155 ** 0.056Number of observations 2262 6017 1620 1569Adjusted R2 0.7959 0.4074 0.7708 0.4335
in the specification of the American census blocks and the closestCanadian equivalent, the homogeneous neighborhood which wouldundermine our ability to compare results across the border.
We include year fixed effects to account for sample-wide trendsas well as month fixed effects to account for seasonality in realestate prices. This is particularly important given the turbulent realestate markets of the late 2000s.9 Our quasi-experimental identifi-cation stems from the fact that we have transactions taking placeboth before and after the turbines were built and in areas that areat varying distances and with varying views of the turbines. Weinclude clustered error terms at the same level as our fixed effects.This allows error terms to be correlated across transactions in thesame local area (i.e., townships) while requiring them to be indepen-dent across local areas. This generalization helps to control for spatialautocorrelation and is a simplified form of spatial econometrics.
With all of this in mind, our specification follows Heintzelmanand Tuttle (2012) and takes the general form:
ln(Pijt)=kt+aj+b1windi+b2windt+b3windit+b4 ln(xit)+gjt+4ijt
(1)
where kt represents the time (year and month) fixed effects, aj rep-resents local area fixed effects, windi represents the proximity to orview of wind turbines for parcel i, windt represents the time period, t,in which turbine impacts are expected to occur, windit represents theinteraction term between proximity to or view of wind turbines forparcel i with time period t, xit is a vector of other parcel and structural
9 It is important to note that real estate markets in Northern New York and inOntario were relatively insulated from this turmoil, and there is no dramatic crashin prices following the financial crisis in our sample. Nonetheless, it is important tocontrol for these possible impacts.
characteristics10 , as described above, and gjt and 4ijt represent spatialarea and individual specific error terms. The model represented in Eq.(1) is estimated separately for real estate markets in Ontario and NewYork, which permits determining whether the turbine impacts dif-fered between the two locations. For each location, the data includesa considerable number of sales well beyond the viewshed of the windfarm that would not be impacted by the turbines, which comprise acontrol group.
One of the assumptions of the hedonic model is that all includedobservations comprise a single market. However, our samplesinclude observations up to 71 miles away from the turbines on theOntario side and up to 44 miles away on the New York side. Whilewe account for the influence of unobserved factors through the use ofspatial fixed effects, the possibility remains that including sales fromsuch extensive geographic areas may bias the results. To address thispotential issue, we also estimate Eq. (1) for samples comprised onlyof sales within 20 miles of the turbines, which include 1620 sales inOntario and 1569 sales in New York. The results for these samplesare compared with those of the full samples in the following section.
4. Results
Table 3 presents the results of our analysis for the regressions inwhich turbine impacts are accounted for by visibility, while Table 4presents the results for the regressions based on distance to the near-est turbine. Each table includes the results of both the full sampleand the sample restricted to properties within 20 miles of the windturbines.
In Table 3, the key variables of interest are the interactionterms that indicate how turbine view impacts property values in
10 Not all parcel and structural characteristics are logged. We follow general rulesof thumb outlined by Wooldridge (2006) in determining the variables to representin log form. For example, categorical variables and continuous variables comprised ofrelatively small integer values are not logged.
Mark Thayer Direct Testimony, Ex.___, Exhibit 10
Page 8 of 12
M. Heintzelman et al. / Ecological Economics 137 (2017) 195–206 203
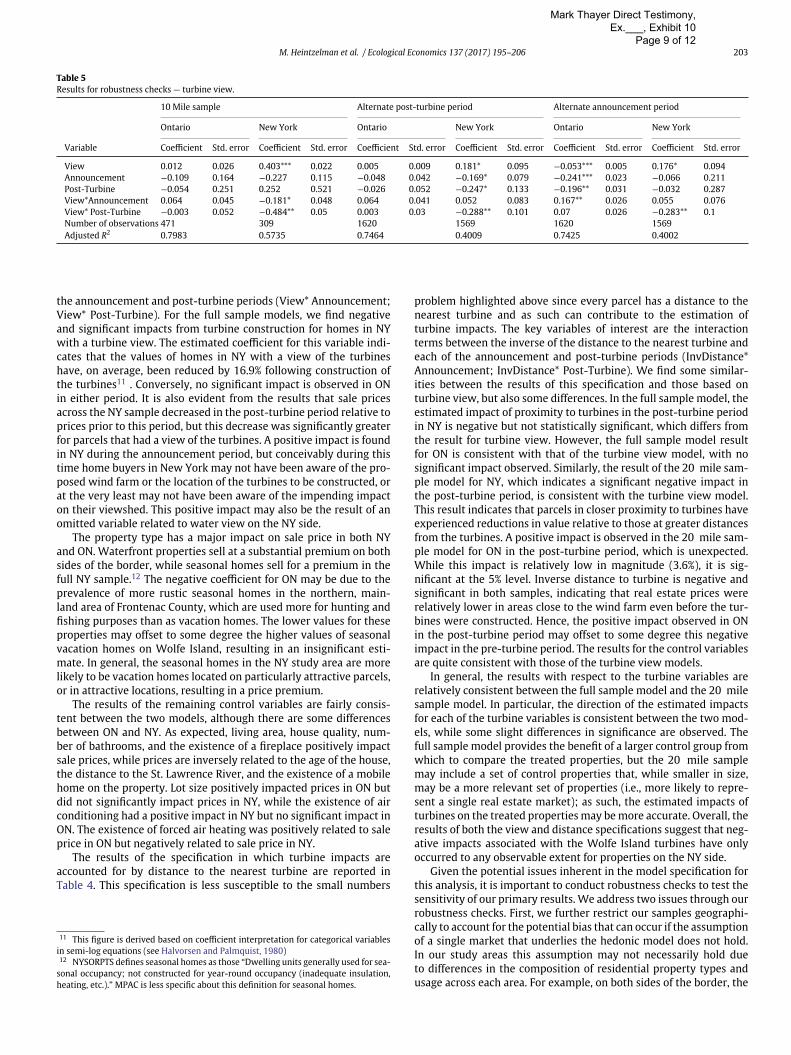
Table 5Results for robustness checks — turbine view.
10 Mile sample Alternate post-turbine period Alternate announcement period
Ontario New York Ontario New York Ontario New York
Variable Coefficient Std. error Coefficient Std. error Coefficient Std. error Coefficient Std. error Coefficient Std. error Coefficient Std. error
View 0.012 0.026 0.403*** 0.022 0.005 0.009 0.181* 0.095 −0.053*** 0.005 0.176* 0.094Announcement −0.109 0.164 −0.227 0.115 −0.048 0.042 −0.169* 0.079 −0.241*** 0.023 −0.066 0.211Post-Turbine −0.054 0.251 0.252 0.521 −0.026 0.052 −0.247* 0.133 −0.196** 0.031 −0.032 0.287View*Announcement 0.064 0.045 −0.181* 0.048 0.064 0.041 0.052 0.083 0.167** 0.026 0.055 0.076View* Post-Turbine −0.003 0.052 −0.484** 0.05 0.003 0.03 −0.288** 0.101 0.07 0.026 −0.283** 0.1Number of observations 471 309 1620 1569 1620 1569Adjusted R2 0.7983 0.5735 0.7464 0.4009 0.7425 0.4002
the announcement and post-turbine periods (View* Announcement;View* Post-Turbine). For the full sample models, we find negativeand significant impacts from turbine construction for homes in NYwith a turbine view. The estimated coefficient for this variable indi-cates that the values of homes in NY with a view of the turbineshave, on average, been reduced by 16.9% following construction ofthe turbines11 . Conversely, no significant impact is observed in ONin either period. It is also evident from the results that sale pricesacross the NY sample decreased in the post-turbine period relative toprices prior to this period, but this decrease was significantly greaterfor parcels that had a view of the turbines. A positive impact is foundin NY during the announcement period, but conceivably during thistime home buyers in New York may not have been aware of the pro-posed wind farm or the location of the turbines to be constructed, orat the very least may not have been aware of the impending impacton their viewshed. This positive impact may also be the result of anomitted variable related to water view on the NY side.
The property type has a major impact on sale price in both NYand ON. Waterfront properties sell at a substantial premium on bothsides of the border, while seasonal homes sell for a premium in thefull NY sample.12 The negative coefficient for ON may be due to theprevalence of more rustic seasonal homes in the northern, main-land area of Frontenac County, which are used more for hunting andfishing purposes than as vacation homes. The lower values for theseproperties may offset to some degree the higher values of seasonalvacation homes on Wolfe Island, resulting in an insignificant esti-mate. In general, the seasonal homes in the NY study area are morelikely to be vacation homes located on particularly attractive parcels,or in attractive locations, resulting in a price premium.
The results of the remaining control variables are fairly consis-tent between the two models, although there are some differencesbetween ON and NY. As expected, living area, house quality, num-ber of bathrooms, and the existence of a fireplace positively impactsale prices, while prices are inversely related to the age of the house,the distance to the St. Lawrence River, and the existence of a mobilehome on the property. Lot size positively impacted prices in ON butdid not significantly impact prices in NY, while the existence of airconditioning had a positive impact in NY but no significant impact inON. The existence of forced air heating was positively related to saleprice in ON but negatively related to sale price in NY.
The results of the specification in which turbine impacts areaccounted for by distance to the nearest turbine are reported inTable 4. This specification is less susceptible to the small numbers
11 This figure is derived based on coefficient interpretation for categorical variablesin semi-log equations (see Halvorsen and Palmquist, 1980)12 NYSORPTS defines seasonal homes as those “Dwelling units generally used for sea-
sonal occupancy; not constructed for year-round occupancy (inadequate insulation,heating, etc.).” MPAC is less specific about this definition for seasonal homes.
problem highlighted above since every parcel has a distance to thenearest turbine and as such can contribute to the estimation ofturbine impacts. The key variables of interest are the interactionterms between the inverse of the distance to the nearest turbine andeach of the announcement and post-turbine periods (InvDistance*Announcement; InvDistance* Post-Turbine). We find some similar-ities between the results of this specification and those based onturbine view, but also some differences. In the full sample model, theestimated impact of proximity to turbines in the post-turbine periodin NY is negative but not statistically significant, which differs fromthe result for turbine view. However, the full sample model resultfor ON is consistent with that of the turbine view model, with nosignificant impact observed. Similarly, the result of the 20 mile sam-ple model for NY, which indicates a significant negative impact inthe post-turbine period, is consistent with the turbine view model.This result indicates that parcels in closer proximity to turbines haveexperienced reductions in value relative to those at greater distancesfrom the turbines. A positive impact is observed in the 20 mile sam-ple model for ON in the post-turbine period, which is unexpected.While this impact is relatively low in magnitude (3.6%), it is sig-nificant at the 5% level. Inverse distance to turbine is negative andsignificant in both samples, indicating that real estate prices wererelatively lower in areas close to the wind farm even before the tur-bines were constructed. Hence, the positive impact observed in ONin the post-turbine period may offset to some degree this negativeimpact in the pre-turbine period. The results for the control variablesare quite consistent with those of the turbine view models.
In general, the results with respect to the turbine variables arerelatively consistent between the full sample model and the 20 milesample model. In particular, the direction of the estimated impactsfor each of the turbine variables is consistent between the two mod-els, while some slight differences in significance are observed. Thefull sample model provides the benefit of a larger control group fromwhich to compare the treated properties, but the 20 mile samplemay include a set of control properties that, while smaller in size,may be a more relevant set of properties (i.e., more likely to repre-sent a single real estate market); as such, the estimated impacts ofturbines on the treated properties may be more accurate. Overall, theresults of both the view and distance specifications suggest that neg-ative impacts associated with the Wolfe Island turbines have onlyoccurred to any observable extent for properties on the NY side.
Given the potential issues inherent in the model specification forthis analysis, it is important to conduct robustness checks to test thesensitivity of our primary results. We address two issues through ourrobustness checks. First, we further restrict our samples geographi-cally to account for the potential bias that can occur if the assumptionof a single market that underlies the hedonic model does not hold.In our study areas this assumption may not necessarily hold dueto differences in the composition of residential property types andusage across each area. For example, on both sides of the border, the
Mark Thayer Direct Testimony, Ex.___, Exhibit 10
Page 9 of 12

204 M. Heintzelman et al. / Ecological Economics 137 (2017) 195–206
Table 6Results for robustness checks — turbine distance.
10 Mile sample Alternate post-turbine period Alternate announcement period
Ontario New York Ontario New York Ontario New York
Variable Coefficient Std. error Coefficient Std. error Coefficient Std. error Coefficient Std. error Coefficient Std. error Coefficient Std. error
InvDistance −0.102* 0.015 −1.321 0.968 −0.133** 0.017 −1.125*** 0.206 −0.133** 0.015 −1.225*** 0.204Announcement −0.096 0.146 −0.379* 0.122 −0.043 0.034 −0.212** 0.081 −0.111* 0.031 −0.131 0.185Post-Turbine −0.055 0.257 0.309 0.475 −0.023 0.044 −0.214 0.143 −0.076 0.031 −0.023 0.267InvDistance*Announcement0.012 0.01 0.85 0.872 0.021 0.016 0.433** 0.189 0.021** 0.004 0.488** 0.155InvDistance* Post-Turbine 0.025 0.03 0.013 0.431 0.031* 0.009 −0.419** 0.165 0.034** 0.004 −0.343* 0.18Number of Observations 471 309 1620 1569 1620 1569Adjusted R2 0.802 0.5736 0.7464 0.4009 0.7425 0.4002
areas that would be most affected by the wind turbines (i.e., WolfeIsland and Cape Vincent), have proportionally more waterfront prop-erties relative to the other areas of their respective counties, and arealso used to a greater extent for vacation purposes. Such differencescould potentially introduce bias into our estimates of the turbineimpacts. To address this potential bias, we consider a specificationthat restricts our samples to parcels within 10 miles of the turbines,which include 471 parcels in the ON sample and 309 parcels in theNY sample.
Second, as described above in our data section, due to the uncer-tainty around the time at which turbine impacts could conceivablybegin to occur, we test alternate specifications of the post-turbineand announcement periods, using the 20 mile sample models. Forthe alternate post-turbine period specification we use the date thatturbine construction began (May 2008), rather than the date con-struction was completed (June 2009) as the date following whichimpacts would be expected to occur. We specify the alternateannouncement period to begin following approval of zoning bylawamendments (November 2006) rather than using the date that theproject was officially announced (April 2007).
The results of the robustness checks are provided in Tables 5 (tur-bine view) and 6 (turbine distance). The results of the 10 mile samplemodel for turbine view are similar to those of our primary models,with a negative impact on property values in the post-turbine periodin NY and no significant impacts in ON. In addition, there is evidenceof a negative impact in the announcement period in NY. The resultsof this model for turbine distance indicate no evidence of significantimpacts of turbines in either ON, which is consistent with the fullsample model, or NY, which is consistent with the 20 mile samplemodel. The results of the alternate post-turbine and announcementperiod specifications are also similar to those of our primary specifi-cations for both view and distance, particularly for the post-turbineinteraction variables. One difference from the primary specificationsis that positive impacts are observed in the announcement period inON for both view and distance. Overall, the results of the robustnesschecks support the results of our primary models, where evidence ofnegative impacts on property values in the post-turbine period arefound only in NY.
5. Discussion and Conclusions
There are two main contributions of this paper. First, it providesevidence that impacts of wind turbines on property values varydepending on the context. Second, it identifies some factors that maycontribute to the occurrence of significant impacts and explain thevariation in the results of the literature related to this issue. Thispaper also adds to the growing amount of evidence that wind facili-ties can have significant economic impacts on property values. In ourparticular context, with a unique setting in which two communities
separated by an international border are affected by the same windfarm, we find evidence that property values are negatively impactedby wind turbines, but only on one side of the border.
This finding implies that there are some contextual factors thatinfluence whether property values in a local area are negativelyimpacted by wind turbines. The finding of negative impacts onproperty values in New York but not in Ontario, despite the fact thatmany properties on Wolfe Island are located in among the turbines,is somewhat surprising given that concerns were raised on both sidesof the border. However, this may reflect the cross-border differencein the level of involvement in the project development process. Inaddition, as indicated in Fast et al. (2015) , there are a fair num-ber of residents, both long-time residents and newcomers, on WolfeIsland that are quite supportive of the wind farm. Those who sup-port the wind farm are less likely to be concerned about impactson property values and may not reduce their willingness-to-pay forproperties with a view of or in close proximity to the turbines. If alarge enough proportion of residents and potential homebuyers sup-port the wind farm and believe it benefits the community, this mayreduce the likelihood or magnitude of impacts on property values.In addition, the township of Frontenac Islands receives an annualpayment of C$645,000 from the developer that may also be work-ing counter to negative impacts on property values. These factorscould also contribute to the observed positive impact in ON in thepost-turbine period.
It is evident from the results of the primary models and robust-ness checks that negative impacts of wind turbines on properties inNY are more likely to be attributable to turbine view rather than toproximity to turbines. There is more robust evidence in the resultsfor NY of significant negative impacts in the post-turbine period forturbine view. This is not surprising, given the types of propertiesin NY that are potentially impacted by the Wolfe Island wind tur-bines. Many of these properties are vacation homes and waterfronthomes, for which a considerable amount of value tends to be derivedfrom an aesthetic view. As such, it is more likely that turbine viewwill contribute to a negative property value impact than proximityto turbines, since properties in close proximity to turbines do notnecessarily have a direct view of them.
While there are also many vacation homes and waterfront homeson Wolfe Island, these properties do not appear to be impacted bythe view of the turbines in the same way that similar propertiesare impacted on the NY side. This could be due to a key differencein how the turbines affect the viewshed, particularly for waterfrontproperties, between the two sides of the border. On Wolfe Island, theview of the water for most waterfront properties is not obstructedby the turbines, as the turbines are located in-land from these prop-erties (i.e., “behind” the waterfront properties). As such, there maynot be much of an impact on the amenity value associated with theview from these properties. Conversely, on the NY side the turbinesfactor quite prominently into the view of the water for many of the
Mark Thayer Direct Testimony, Ex.___, Exhibit 10
Page 10 of 12
M. Heintzelman et al. / Ecological Economics 137 (2017) 195–206 205
waterfront properties, which may contribute to a greater impact onthe values of these properties.
There are limitations in this study that should be acknowledged.First, as noted by Hoen et al. (2015), the use of inverse distanceto account for turbine impacts involves estimating this impact atthe mean distance from the turbines, which can hamper the abil-ity to generate accurate impacts in close proximity to the turbines.This issue could potentially be avoided through the use of discretedistance bands. However, this approach may be unable to detect sig-nificant impacts within specified bands if the number of affectedsales is relatively low, which is the case in our study. In fact, the lownumber of treated observations on both sides of the border repre-sents a major limitation of this study, as it may impede the abilityto detect significant impacts or to generate accurate estimates ofthese impacts. In addition, across the models estimated in the pri-mary analysis and the robustness checks there are some changesin significance for some of the primary variables of interest, whichmay be cause for concern. Due to these issues, the results of thisstudy regarding the impacts of the Wolfe Island wind turbines onsurrounding property values should be viewed with considerablecaution.
Interestingly, however, the finding of significant negative impactson property values on the NY side occurred despite the fact that therewere fewer sales with a view of the turbines than on the Ontario side.This suggests that the lack of evidence of negative impacts on theOntario side is not necessarily due to a lack of observations. However,the possibility remains that parcels that are impacted the most bythe turbines were not sold or were unable to be sold. Unfortunately,data is not available to examine this issue; as such, this represents animportant caveat to our study results.
Despite these limitations, this paper provides an interesting casestudy that can add to the growing body of literature on this issue,particularly with respect to understanding the variation in results inthe literature. Given that variation has even occurred among recentstudies (Gibbons, 2015; Hoen et al., 2015) that have overcome theissue of low numbers of observations that plagued prior studies, itis worthwhile to identify factors that could influence the likelihoodthat wind facilities will impact property values. The unique settingof our study has enabled us to highlight some contextual factors thatcould contribute to differences in estimated impacts.
First, the quality of the view prior to construction of wind tur-bines may influence the nature of any observed impacts. Related tothis factor, impacts could vary across different types of properties.For example, vacation homes and waterfront properties, for whichthe view is likely to be an important amenity, could be impacted toa greater degree than other types of properties. Subsequently, thelikelihood of observing negative impacts would be greater in areaswith a relatively high proportion of such properties. This may havebeen the case in our study, where many of the affected properties onthe NY side were waterfront properties, for which the turbines hada greater impact on the view amenity relative to that of waterfrontproperties on the ON side.
Another factor influencing the nature of potential impacts couldbe the level of involvement or public participation that local res-idents have in the planning and development process for windfacilities. The amount of involvement may influence perceptions ofwind energy, where a lack of involvement may contribute to nega-tive perceptions (Devine-Wright, 2005) . In this study, we comparedtwo jurisdictions affected by the same wind farm, one of which wasinvolved in the process and one that was unable to participate in theprocess and did not receive any compensation from the developer.This difference may have contributed to the difference in observedimpacts between the two jurisdictions.
However, while we have identified a number of factors that mayhave contributed to the observed differences in impacts between thetwo jurisdictions, we should stress that these explanations, though
plausible, remain speculative, as we are unable to isolate these fac-tors in order to test the extent to which each factor contributedto the differences in estimated impacts. Future research on set-tings with similar contextual factors is needed to support theseconjectures.
This study reinforces the notion that the nature of the impacts ofwind turbines on property values depends on the specific context ofeach wind facility, which helps to rationalize the varied results in theliterature. In our case, we have impacts that differ across two com-munities impacted by the same facility. This implies that, in general,researchers should not expect there to be one single answer to thequestion of how wind farms affect property values, and that the lackof consensus in the literature is not necessarily problematic. Instead,making any forecast of anticipated impacts will require a more care-ful comparison to communities with similar contextual factors thathave already been studied. As in any benefits transfer process, find-ing a proper comparison site is the critical task when using resultsfrom one community to predict outcomes for another. Given thatthe rationale we provide for the differences observed in our studyis primarily conjecture, future research could focus on better iden-tifying and understanding the contextual factors that contribute toan increased likelihood of observing negative property value impactsfrom wind facilities.
References
Cropper, M.L., Deck, L.B., McConnell, K.E., 1988. On the choice of functional form forhedonic price functions. Rev. Econ. Stat. 70 (4), 668–675. ISSN 0034-6535. http://www.jstor.org/stable/1935831. http://dx.doi.org/10.2307/1935831.
Devine-Wright, P., 2005. Beyond NIMBYism: towards an integrated framework forunderstanding public perceptions of wind energy. Wind Energy 8 (2), 125–139.ISSN 1099-1824. http://dx.doi.org/10.1002/we.124. April.
Fast, S., Mabee, W., Blair, J., 2015. The changing cultural and economic values of windenergy landscapes. Can. Geogr. / Can. Gogr. 59 (2), 181–193. ISSN 1541-0064.http://dx.doi.org/10.1111/cag.12145. June.
Freeman, A.M., III, Herriges, J.A., Kling, C.L., 2014. The Measurement of Environ-mental and Resource Values: Theory and Methods. Routledge. June. 978-1-317-70392-1.
Gibbons, S., 2015. Gone with the wind: valuing the visual impacts of wind turbinesthrough house prices. J. Environ. Econ. Manag. 72, 177–196. ISSN 0095-0696.http://dx.doi.org/10.1016/j.jeem.2015.04.006. July.
Halvorsen, R., Palmquist, R., 1980. The interpretation of dummy variables in semilog-arithmic equations. Am. Econ. Rev. 70 (3), 474–475.
Heintzelman, M.D., Tuttle, C.M., 2012. Values in the wind: a hedonic analysis of windpower facilities. Land Econ. 88 (3), 571–588. http://dx.doi.org/10.3368/le.88.3.571. August, ISSN 0023-7639, 1543-8325.
Hoen, B., Wiser, R., Cappers, P., Thayer, M., Sethi, G., 2011. Wind energy facilities andresidential properties: the effect of proximity and view on sales prices. J. RealEstate Res. 33 (3), 279–316. ISSN 0896-5803. http://dx.doi.org/10.5555/rees.33.3.16133472w8338613. January.
Hoen, B., Brown, J.P., Jackson, T., Thayer, M.A., Wiser, R., Cappers, P., 2015. Spatial hedo-nic analysis of the effects of US wind energy facilities on surrounding propertyvalues. J. Real Estate Financ. Econ. 51 (1), 22–51. ISSN 0895-5638. http://dx.doi.org/10.1007/s11146-014-9477-9. WOS:000355662300002. July.
Jensen, C.U., Panduro, T.E., Lundhede, T.H., 2014. The vindication of Don Quixote:the impact of noise and visual pollution from wind turbines. Land Econ. 90(4), 668–682. http://dx.doi.org/10.3368/le.90.4.668. November, ISSN 0023-7639,1543-8325.
Kaffine, D.T., McBee, B.J., Lieskovsky, J., 2013. Emissions savings from wind powergeneration in Texas. Energy J. 34 (1), 155.
Keating, R., 2006. Wolfe Island is Proposed as Future Home to 86 Windmills. Water-town Daily Times. January.
Kuminoff, N.V., Parmeter, C.F., Pope, J.C., 2010. Which hedonic models can we trust torecover the marginal willingness to pay for environmental amenities? J. Environ.Econ. Manag. 60 (3), 145–160. ISSN 0095-0696. http://dx.doi.org/10.1016/j.jeem.2010.06.001.
Lang, C., Opaluch, J.J., Sfinarolakis, G., 2014. The windy city: Property value impacts ofwind turbines in an urban setting. Energy Econ. 44, 413–421. ISSN 0140-9883.http://dx.doi.org/10.1016/j.eneco.2014.05.010. July.
Lynne, M., 2009. A Blight On Landscape. Watertown Daily Times. June.Quarrier, S., 2009. Turbine Strobe Lights Dominate Landscape. Watertown Daily Times.
September.Radley, J., 2009. Beauty of Cape Vincent Area Is Threatened. Watertown Daily Times.
May.Rosen, S., 1974. Hedonic prices and implicit markets: product differentiation in pure
competition. J. Polit. Econ. 34–55.
Mark Thayer Direct Testimony, Ex.___, Exhibit 10
Page 11 of 12

206 M. Heintzelman et al. / Ecological Economics 137 (2017) 195–206
Sims, S., Dent, P., 2007. Property stigma: wind farms are just the latest fashion. J.Prop. Invest. Financ. 25 (6), 626–651. ISSN 1463-578X. http://dx.doi.org/10.1108/14635780710829315.
Sims, S., Dent, P., Oskrochi, G., 2008. Modelling the impact of wind farms on houseprices in the UK. Int. J. Strateg. Prop. Manag. 12 (4), 251–269. ISSN 1648-715X.http://dx.doi.org/10.3846/1648-715X.2008.12.251-269.
Sunak, Y., Madlener, R., 2012. The Impact of Wind Farms on Property Values: A Geo-graphically Weighted Hedonic Pricing Model. SSRN Scholarly Paper ID 2114216.Social Science Research Network, Rochester, NY. May.
Taylor, L.O., 2003. The Hedonic Method. In: Champ, P.A., Boyle, K.J., Brown, T.C. (Eds.),A Primer on Nonmarket Valuation. number 3 in The Economics of Non-MarketGoods and Resources. Springer Netherlands., pp. 331–393. ISBN 978-1-4020-1445-1 978-94-007-0826-6. http://dx.doi.org/10.1007/978-94-007-0826-6_10.
Vyn, R.J., McCullough, R.M., 2014. The effects of wind turbines on property values inOntario: does public perception match empirical evidence? Can. J. Agric. Econ. 62(3), 365–392. ISSN 0008-3976. http://dx.doi.org/10.1111/cjag.12030.
Wooldridge, J.M., 2006. Introductory Econometrics: A Modern Approach. 3rd edition,Thomson South-Western, Mason, OH.
Mark Thayer Direct Testimony, Ex.___, Exhibit 10
Page 12 of 12