analysis report examination with cube
DESCRIPTION
Analysis report examination with CUBE. Alexandru Calotoiu German Research School for Simulation Sciences (with content used with permission from tutorials by Monika Luecke/GRS). CUBE. Parallel program analysis report exploration tools Libraries for XML report reading & writing - PowerPoint PPT PresentationTRANSCRIPT
Analysis report examination with CUBE
Alexandru Calotoiu
German Research School for Simulation Sciences
(with content used with permission from tutorials by Monika Luecke/GRS)
EU COST IC0805 ComplexHPC school, 3-7 June 2013, Uppsala
CUBE
• Parallel program analysis report exploration tools– Libraries for XML report reading & writing– Algebra utilities for report processing– GUI for interactive analysis exploration
• requires Qt4
• Originally developed as part of Scalasca toolset• Now available as a separate component
– Can be installed independently of Score-P, e.g., onlaptop or desktop
– Latest release: CUBE 4.1.6 (March 2013)
2
EU COST IC0805 ComplexHPC school, 3-7 June 2013, Uppsala
Analysis presentation and exploration
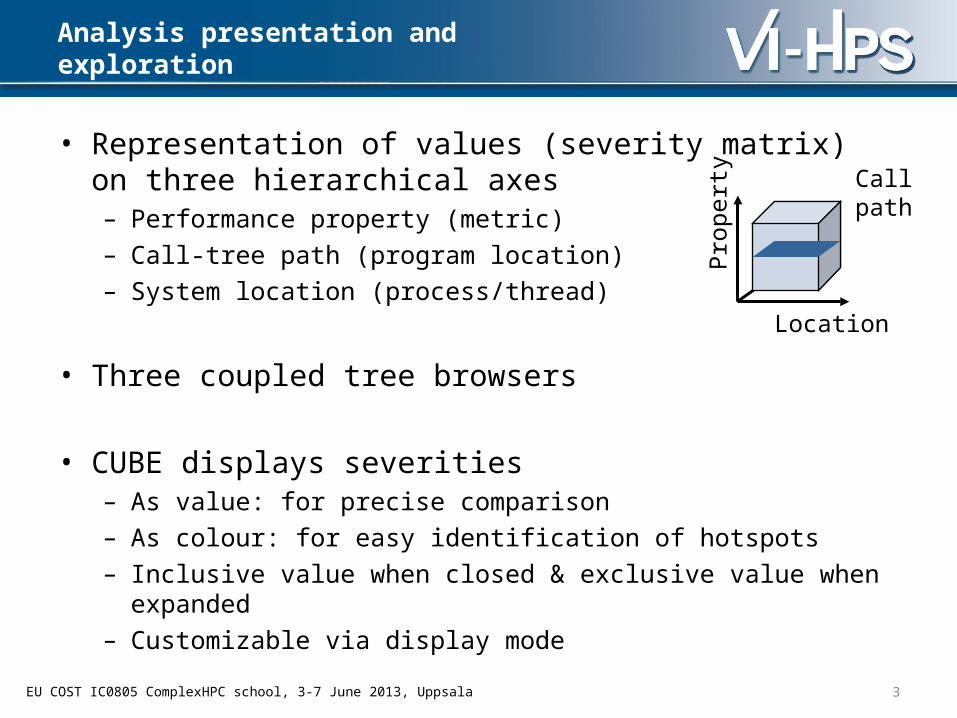
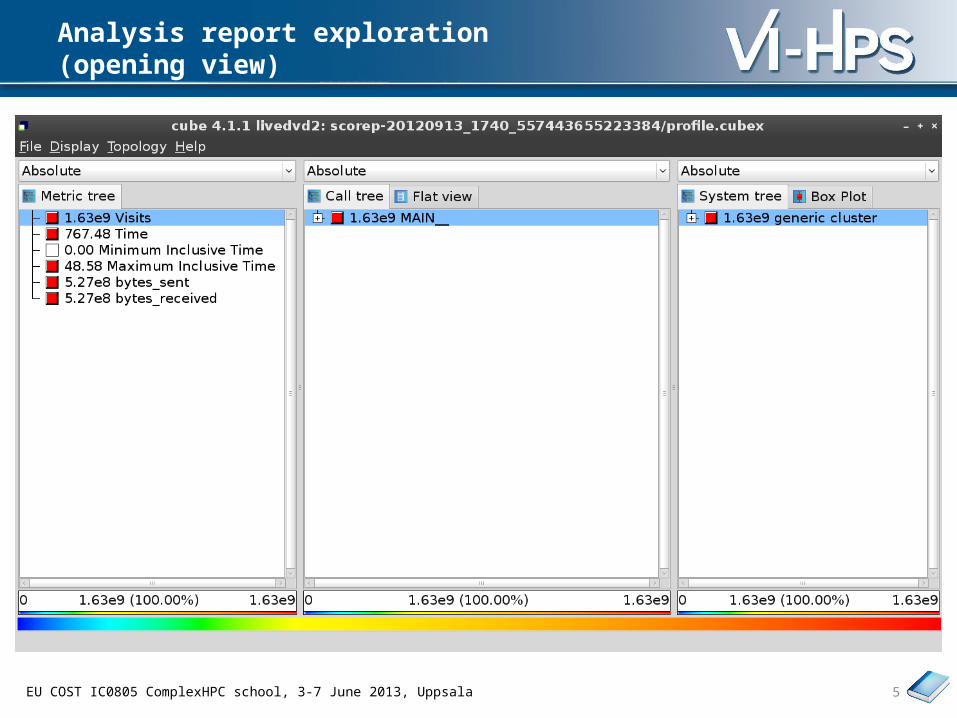
• Representation of values (severity matrix)on three hierarchical axes– Performance property (metric)– Call-tree path (program location)– System location (process/thread)
• Three coupled tree browsers
• CUBE displays severities– As value: for precise comparison– As colour: for easy identification of hotspots– Inclusive value when closed & exclusive value when expanded– Customizable via display mode
3
Callpath
Pro
pert
y
Location
EU COST IC0805 ComplexHPC school, 3-7 June 2013, Uppsala
Analysis presentation
4
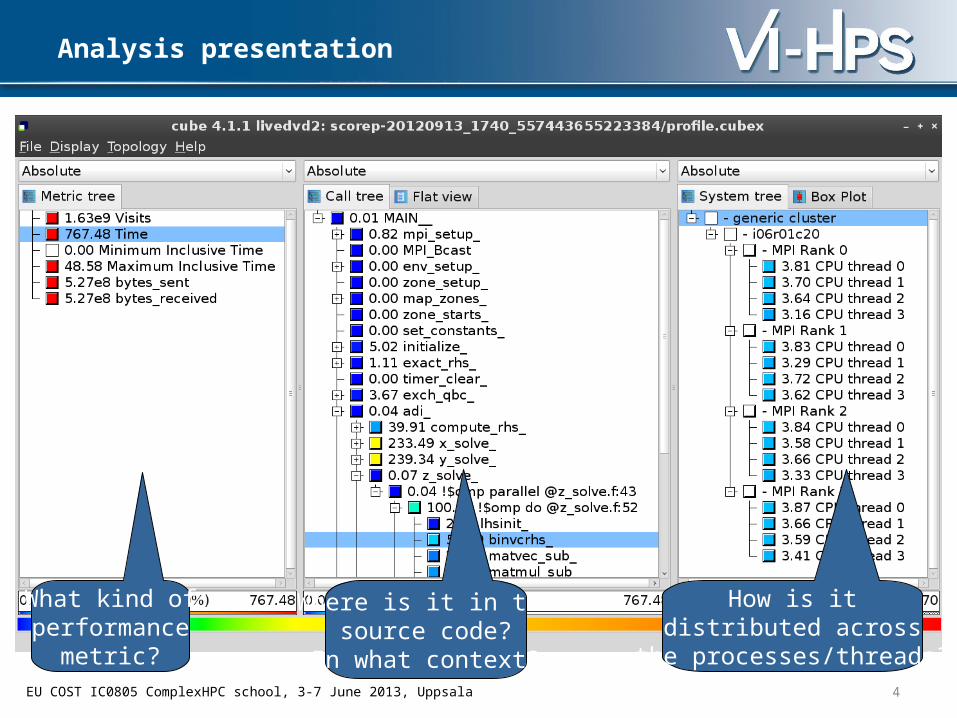
How is itdistributed across
the processes/threads?
What kind ofperformance
metric?
Where is it in thesource code?
In what context?
EU COST IC0805 ComplexHPC school, 3-7 June 2013, Uppsala
Analysis report exploration (opening view)
5
EU COST IC0805 ComplexHPC school, 3-7 June 2013, Uppsala
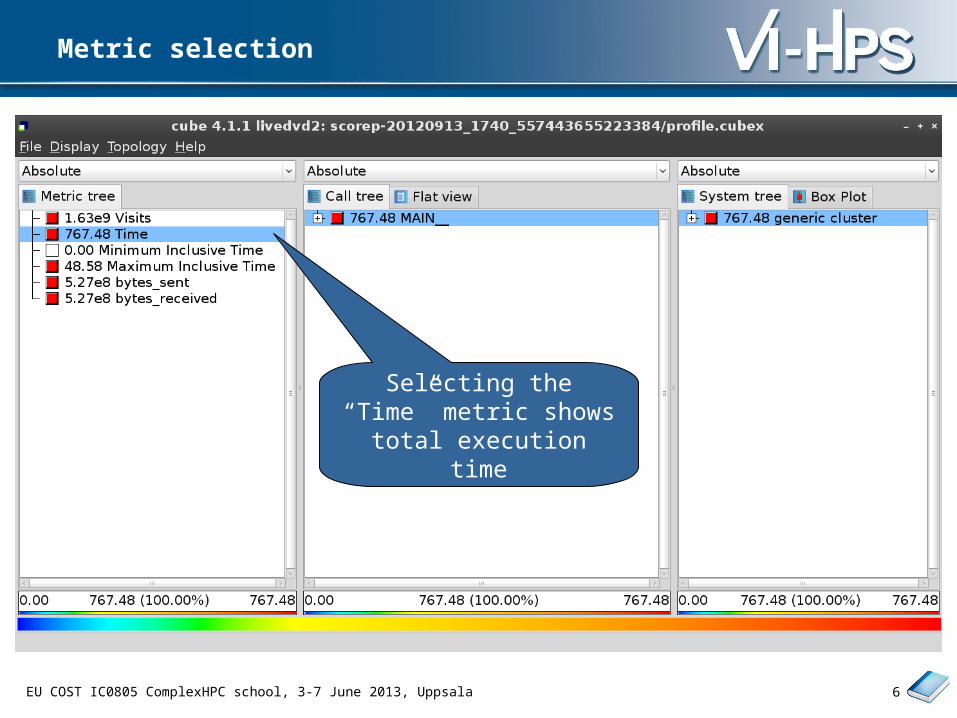
Metric selection
6
Selecting the “Time” metric shows total
execution time
EU COST IC0805 ComplexHPC school, 3-7 June 2013, Uppsala
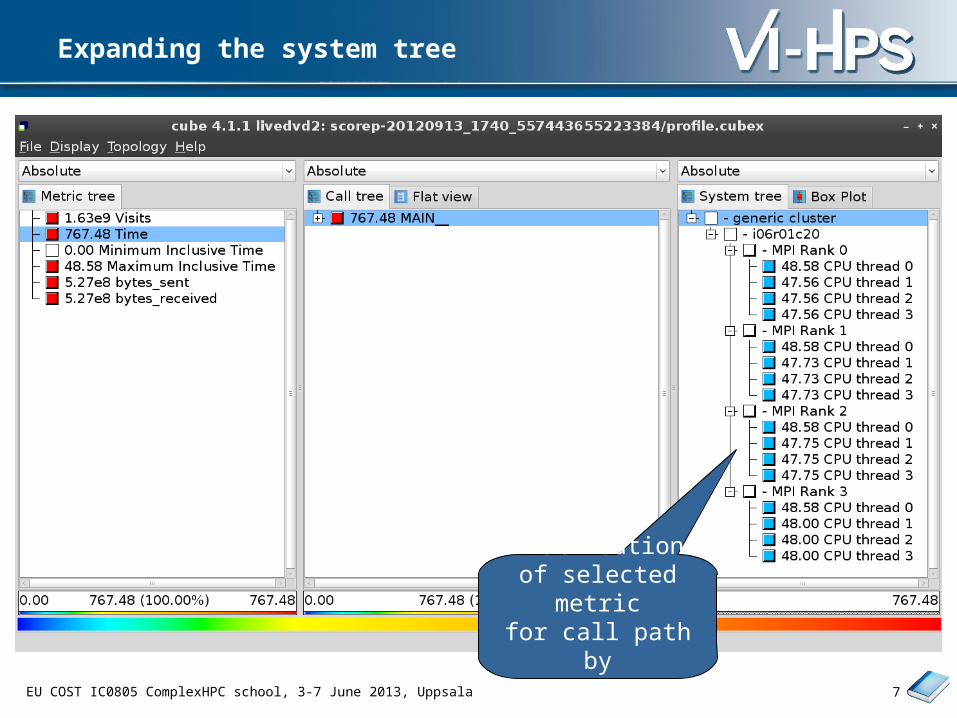
Expanding the system tree
7
Distribution of selected metricfor call path by process/thread
EU COST IC0805 ComplexHPC school, 3-7 June 2013, Uppsala
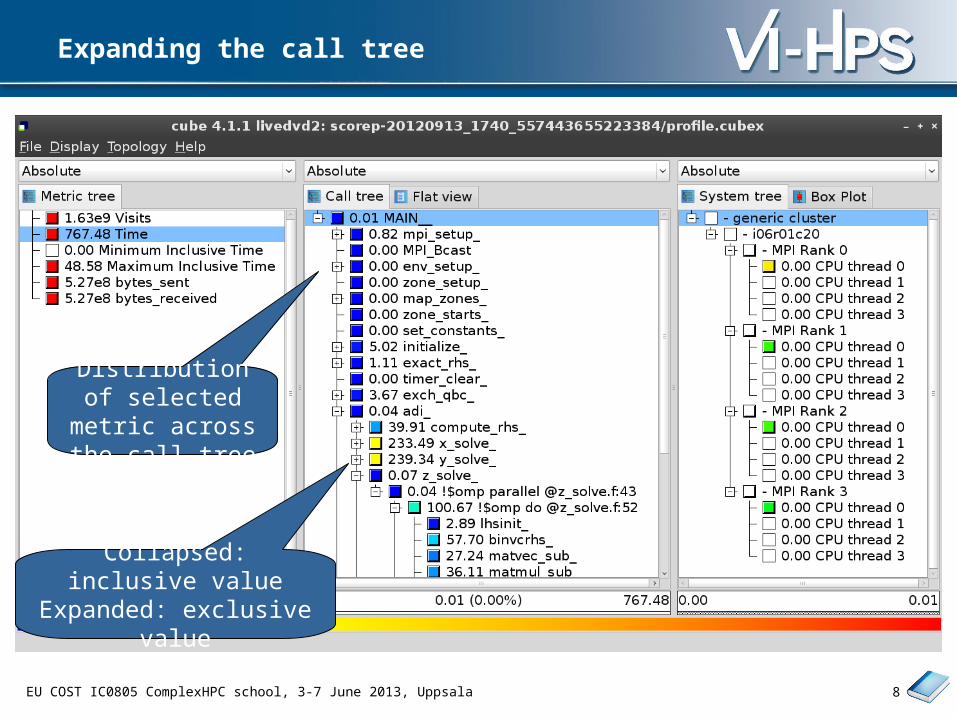
Expanding the call tree
8
Distribution of selected metric across the call
tree
Collapsed: inclusive valueExpanded: exclusive
value
EU COST IC0805 ComplexHPC school, 3-7 June 2013, Uppsala
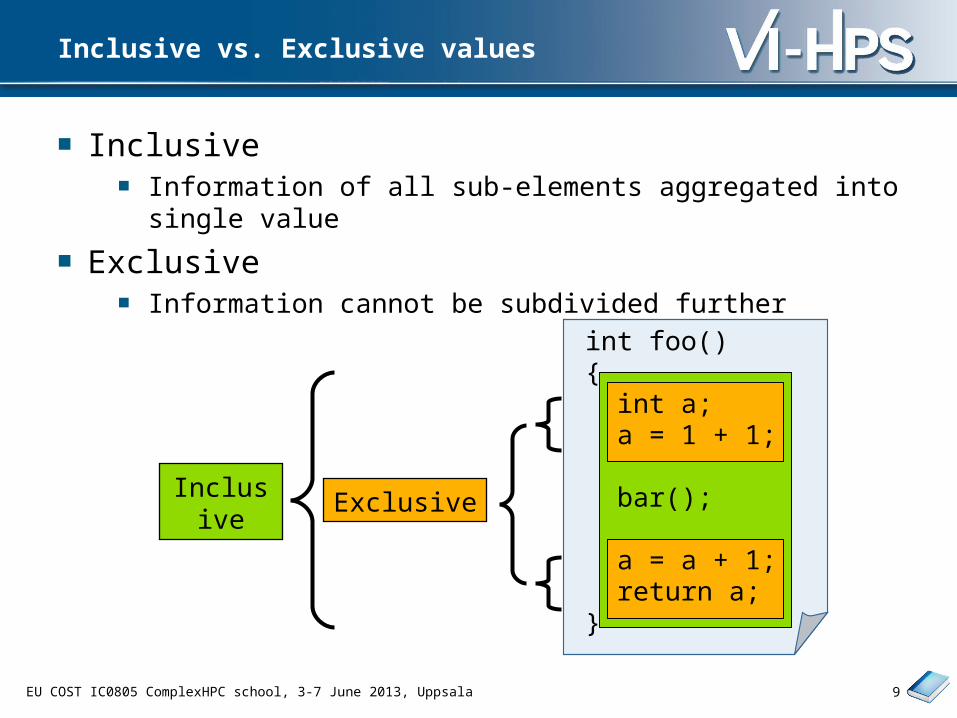
■ Inclusive■ Information of all sub-elements aggregated into single value
■ Exclusive■ Information cannot be subdivided further
Inclusive
Inclusive vs. Exclusive values
Exclusive
9
int foo() { int a; a = 1 + 1;
bar();
a = a + 1; return a;}
EU COST IC0805 ComplexHPC school, 3-7 June 2013, Uppsala
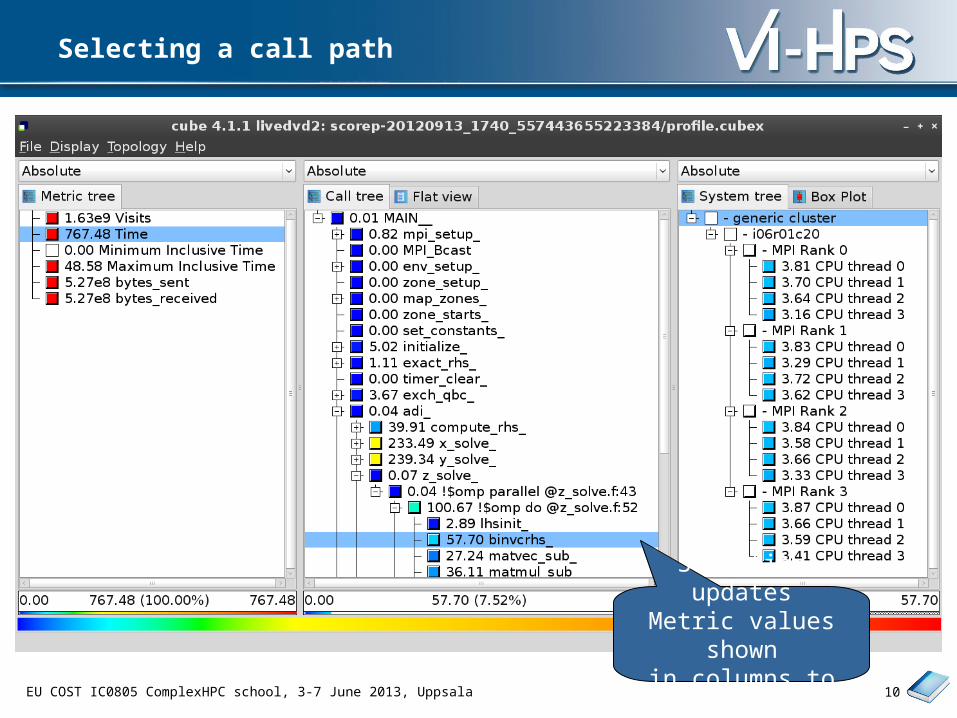
Selecting a call path
10
Selection updatesMetric values shownin columns to right
EU COST IC0805 ComplexHPC school, 3-7 June 2013, Uppsala
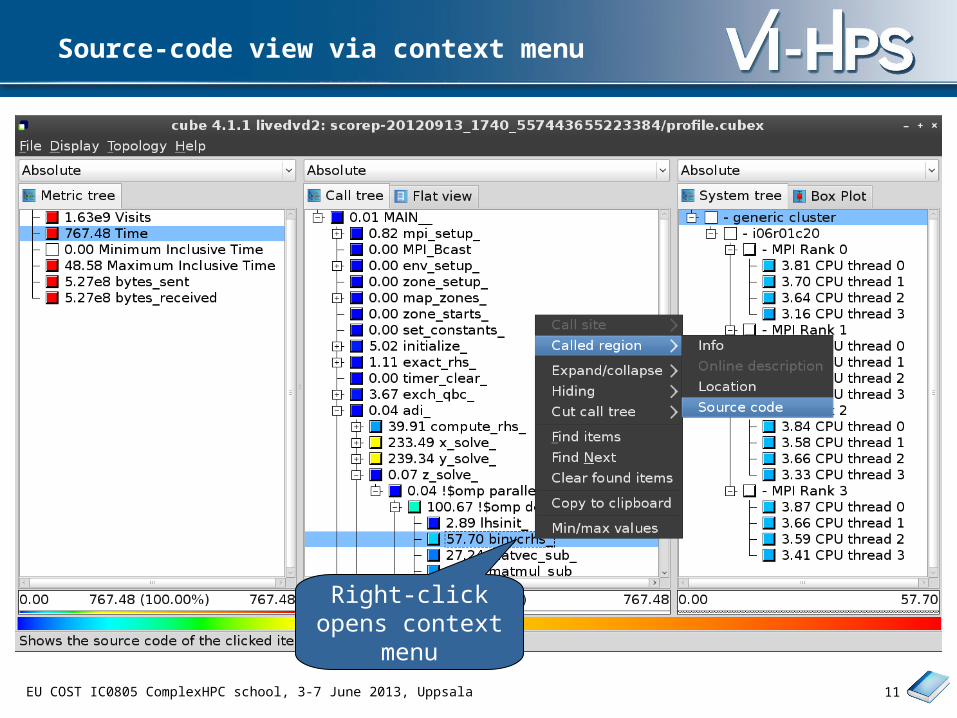
Source-code view via context menu
11
Right-click opens context menu
EU COST IC0805 ComplexHPC school, 3-7 June 2013, Uppsala
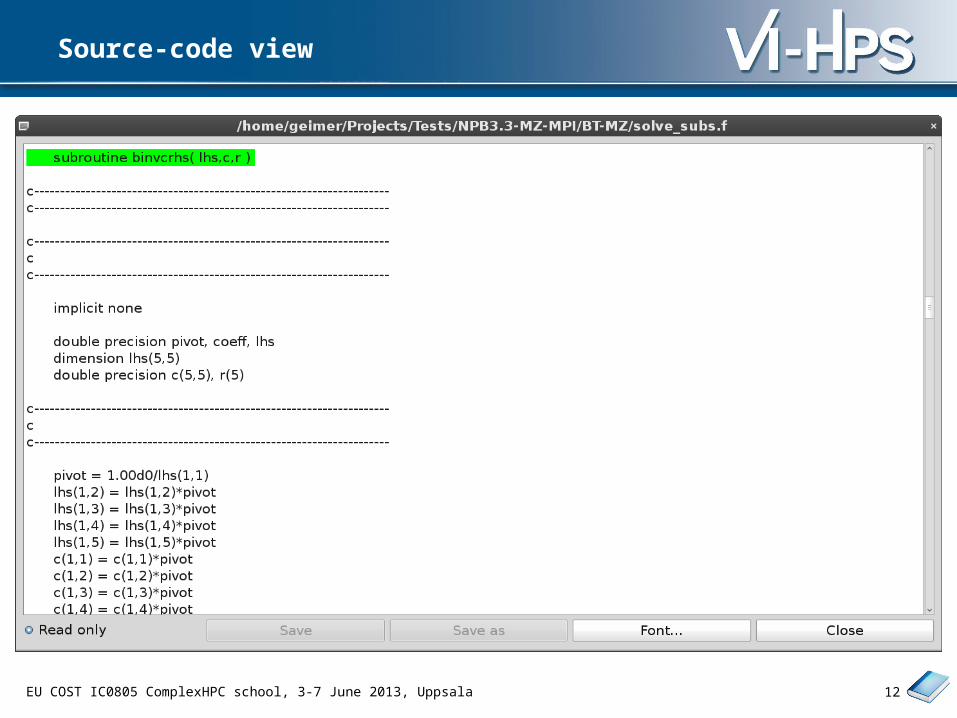
Source-code view
12
EU COST IC0805 ComplexHPC school, 3-7 June 2013, Uppsala
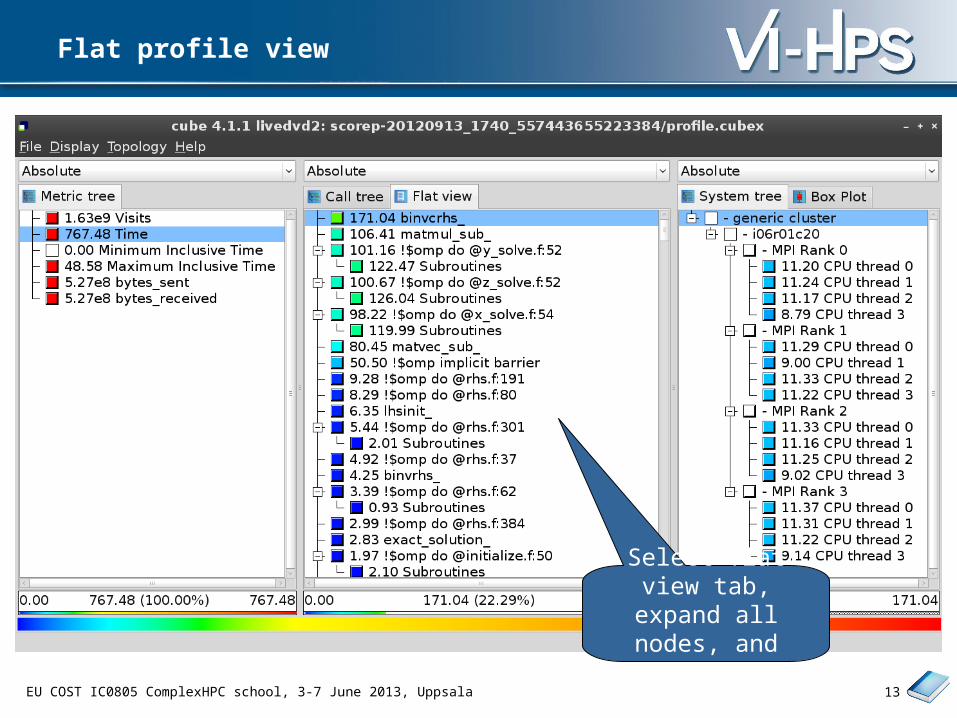
Flat profile view
13
Select flat view tab, expand all nodes, and sort by value
EU COST IC0805 ComplexHPC school, 3-7 June 2013, Uppsala
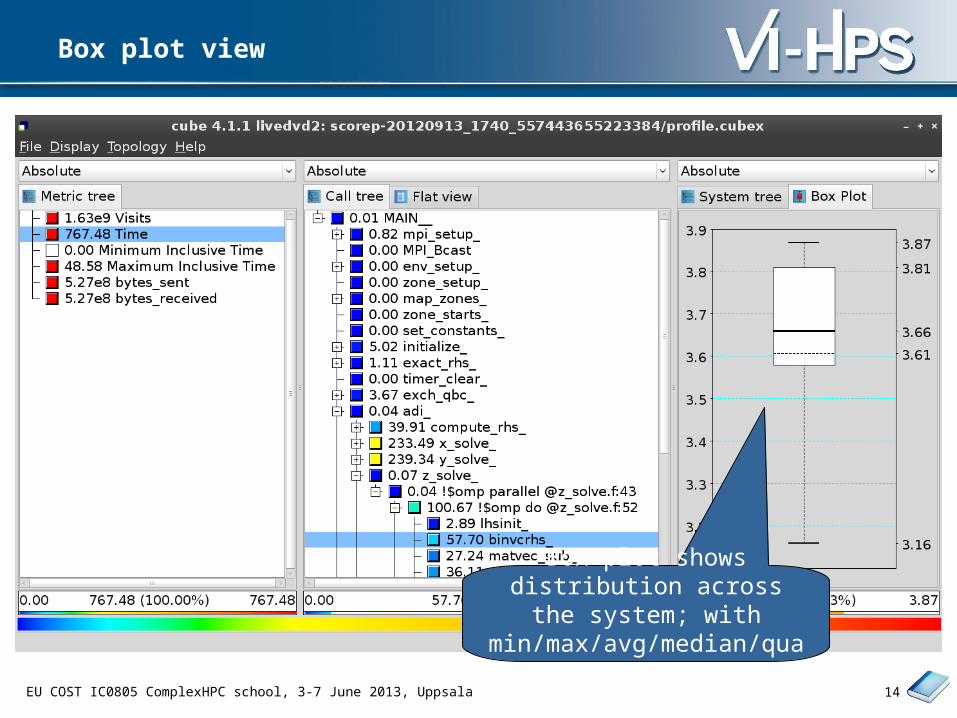
Box plot view
14
Box plot shows distribution across the system; with
min/max/avg/median/quartiles
EU COST IC0805 ComplexHPC school, 3-7 June 2013, Uppsala
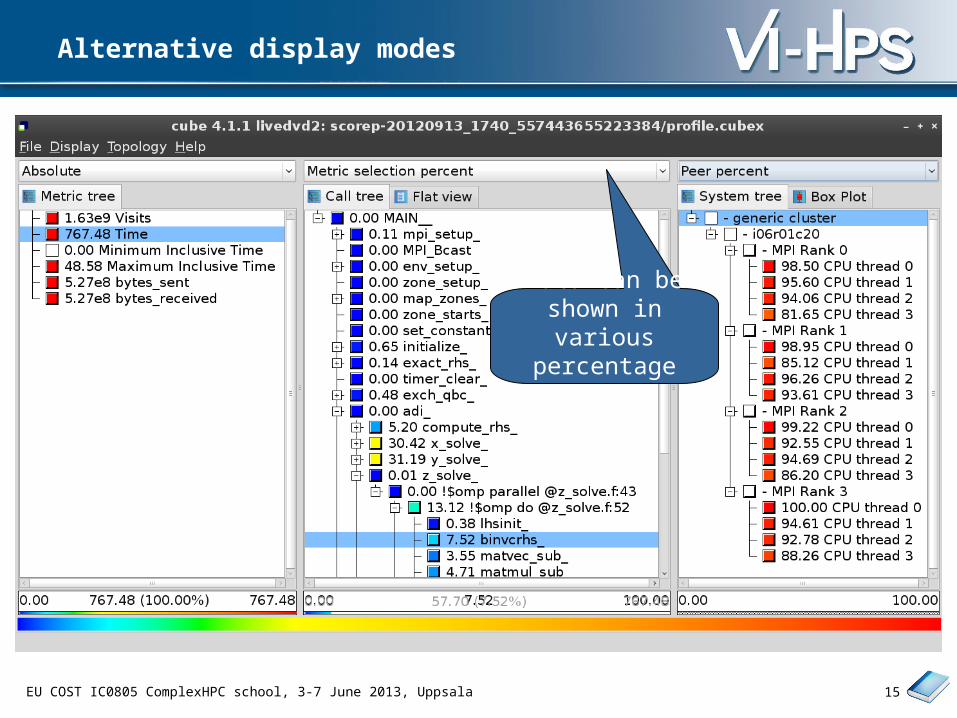
Alternative display modes
15
Data can be shown in various
percentage modes
EU COST IC0805 ComplexHPC school, 3-7 June 2013, Uppsala
Important display modes
16
• Absolute– Absolute value shown in seconds/bytes/occurances
• Selection percent– Value shown as percentage of the value of the selected node
“on the left“ (metric/call path)
• Peer percent (system tree only)– Value shown as percentage relative to the maximum peer value
EU COST IC0805 ComplexHPC school, 3-7 June 2013, Uppsala
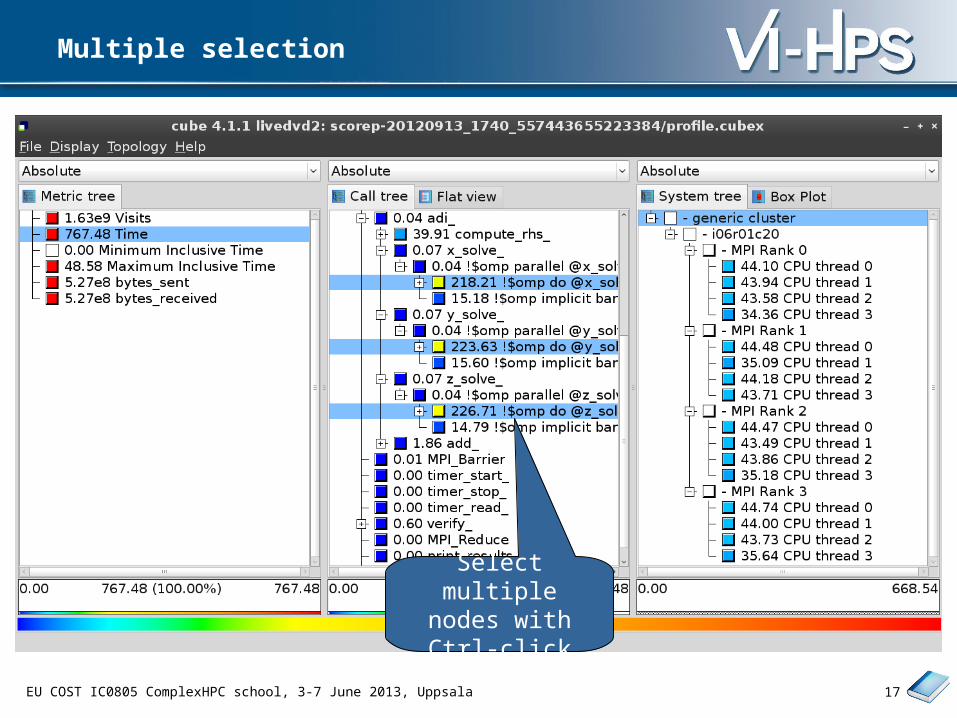
Multiple selection
17
Select multiple nodes withCtrl-click
EU COST IC0805 ComplexHPC school, 3-7 June 2013, Uppsala
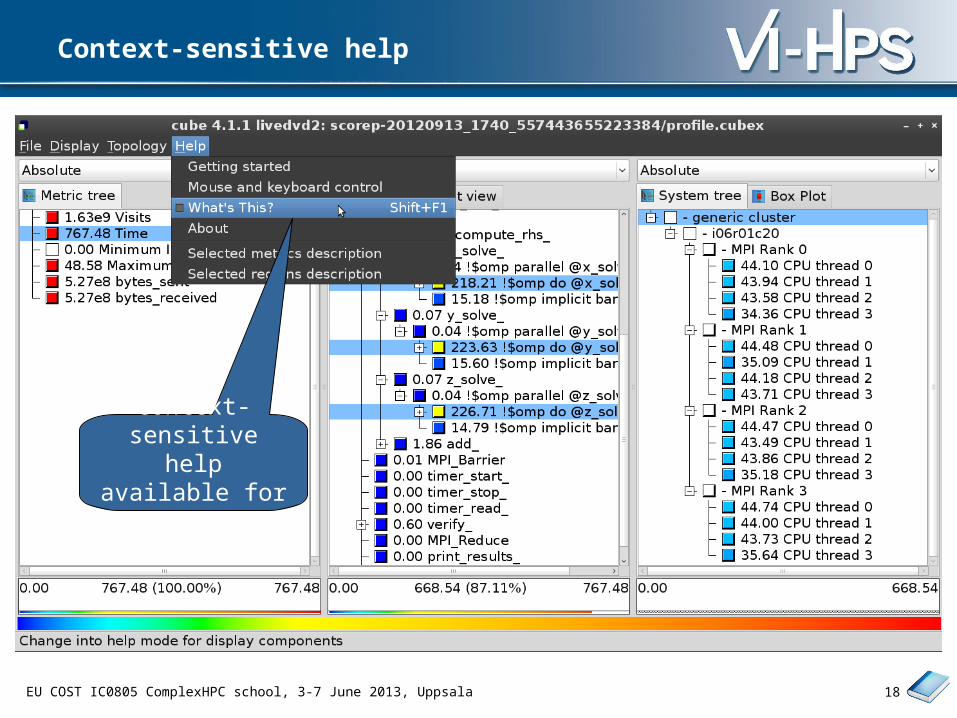
Context-sensitive help
18
Context-sensitive help available for
all GUI items
EU COST IC0805 ComplexHPC school, 3-7 June 2013, Uppsala
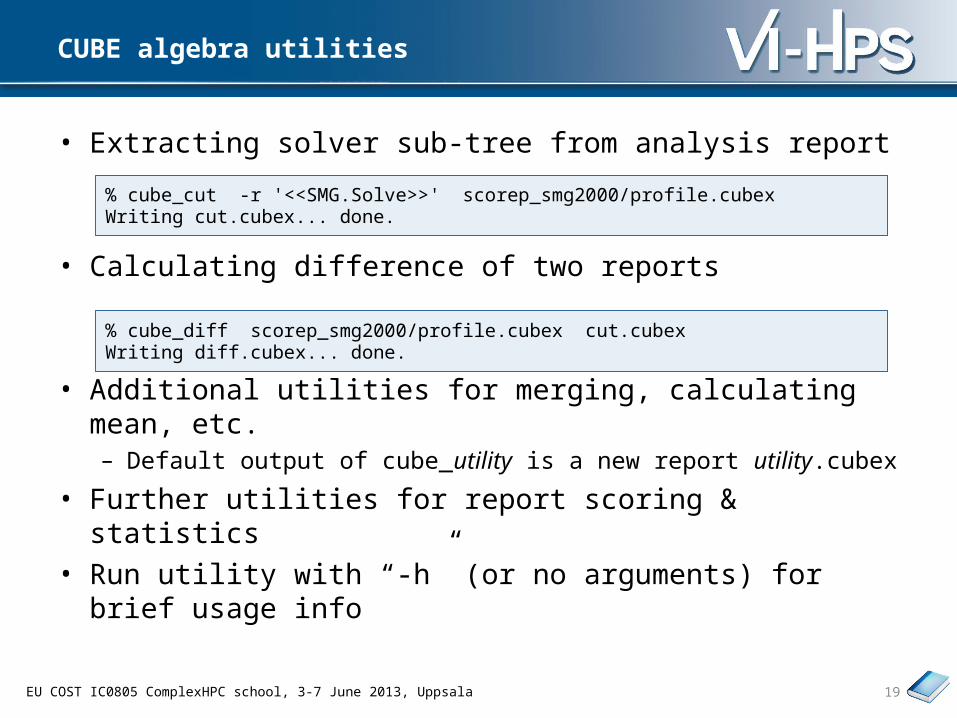
CUBE algebra utilities
• Extracting solver sub-tree from analysis report
• Calculating difference of two reports
• Additional utilities for merging, calculating mean, etc.– Default output of cube_utility is a new report utility.cubex
• Further utilities for report scoring & statistics• Run utility with “-h” (or no arguments) for brief usage info
19
% cube_cut -r '<<SMG.Solve>>' scorep_smg2000/profile.cubexWriting cut.cubex... done.
% cube_diff scorep_smg2000/profile.cubex cut.cubexWriting diff.cubex... done.
EU COST IC0805 ComplexHPC school, 3-7 June 2013, Uppsala
Further information
CUBE– Parallel program analysis report exploration tools
• Libraries for XML report reading & writing
• Algebra utilities for report processing
• GUI for interactive analysis exploration
– Available under New BSD open-source license– Documentation & Sources:
• http://www.score-p.org– User guide also part of installation:
• `cube-config --cube-dir`/share/doc/CubeGuide.pdf– Contact:
• mailto: [email protected]
20