analyst and investor presentation q3 … 1 analyst and investor presentation q3-2013 conference call...
TRANSCRIPT
27/08/2013
1
ANALYST AND INVESTOR PRESENTATION Q3-2013 CONFERENCE CALL
Wednesday, August 28, 2013 - 1:30 pm
CAUTION REGARDING FORWARD-LOOKING STATEMENTS
From time to time, National Bank of Canada (the Bank) makes written and oral forward-looking statements, such as those contained in the Major Economic Trends and theOutlook for National Bank sections of the 2012 Annual Report, in other filings with Canadian securities regulators, and in other communications, for the purpose ofdescribing the economic environment in which the Bank will operate during fiscal 2013 and the objectives it has set for itself for that period. These forward-lookingstatements are made in accordance with current securities legislation. They include, among others, statements with respect to the economy—particularly the Canadian andU.S. economies—market changes, observations regarding the Bank's objectives and its strategies for achieving them, Bank projected financial returns and certain risks facedby the Bank. These forward-looking statements are typically identified by future or conditional verbs or words such as "outlook," "believe," "anticipate," "estimate,""project," "expect," "intend," "plan," and similar terms and expressions.
By their very nature, such forward-looking statements require assumptions to be made and involve inherent risks and uncertainties, both general and specific. Assumptionsabout the performance of the Canadian and U.S. economies in 2013 and how that will affect the Bank’s business are among the main factors considered in setting the Bank’sstrategic priorities and objectives and in determining its financial targets, including provisions for credit losses. In determining its expectations for economic growth, bothbroadly and in the financial services sector in particular, the Bank primarily considers historical economic data provided by the Canadian and U.S. governments and theiragencies.
There is a strong possibility that express or implied projections contained in these forward-looking statements will not materialize or will not be accurate. The Bankrecommends that readers not place undue reliance on these statements, as a number of factors, many of which are beyond the Bank's control, could cause actual futureresults, conditions, actions or events to differ significantly from the targets, expectations, estimates or intentions expressed in the forward-looking statements. These factorsinclude credit risk, market risk, liquidity risk, operational risk, regulatory risk, reputation risk, and environmental risk (all of which are described in greater detail in the RiskManagement section that begins on page 57 of the 2012 Annual Report); the general economic environment and financial market conditions in Canada, the United Statesand certain other countries in which the Bank conducts business, including the effects of the debt crisis in certain European countries; the lowering of the U.S. long-termsovereign debt rating by Standard & Poor’s; the lowering of the sovereign debt rating of certain European countries and the impact of changes that affect the Bank’s creditratings; the situation with respect to the restructured notes of the master asset vehicle (MAV) conduits, in particular the realizable value of underlying assets; changes in theaccounting policies the Bank uses to report its financial condition, including uncertainties associated with assumptions and critical accounting estimates; tax laws in thecountries in which the Bank operates, primarily Canada and the United States; and changes to capital and liquidity guidelines and to the manner in which they are to bepresented and interpreted.
The foregoing list of risk factors is not exhaustive. Additional information about these factors can be found in the Risk Management and Other Risk Factors sections of the2012 Annual Report. Investors and others who base themselves on the Bank's forward-looking statements should carefully consider the above factors as well as theuncertainties they represent and the risk they entail. The Bank also cautions readers not to place undue reliance on these forward-looking statements.
The forward-looking information contained in this document is presented for the purpose of interpreting the information contained herein and may not be appropriate forother purposes.
27/08/2013
2
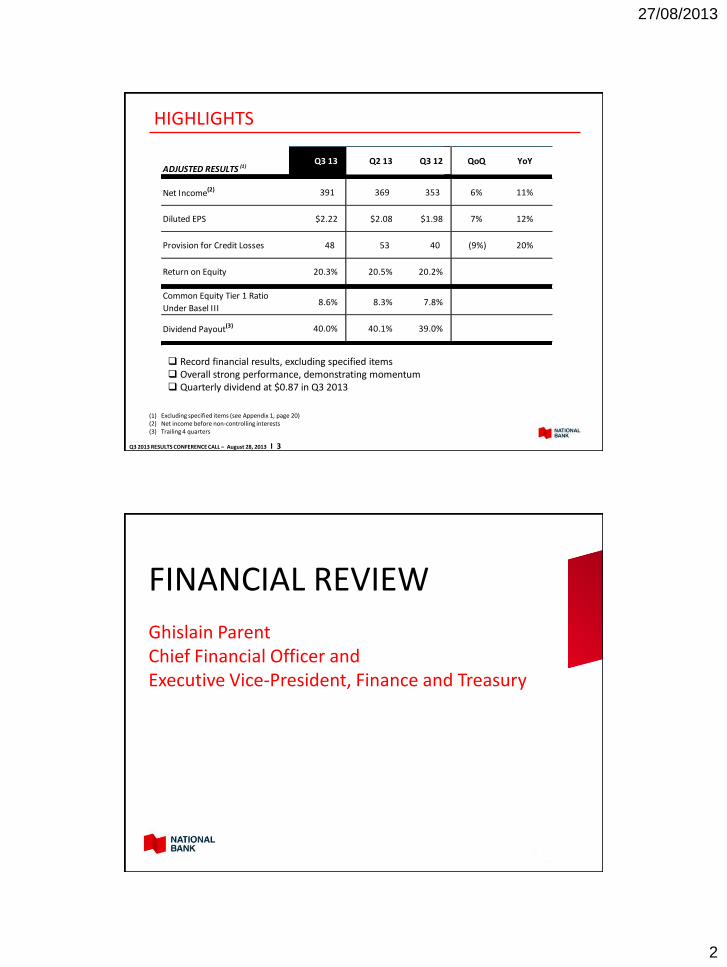
HIGHLIGHTS
Q3 2013 RESULTS CONFERENCE CALL – August 28, 2013 I 3
(1) Excluding specified items (see Appendix 1, page 20)(2) Net income before non-controlling interests(3) Trailing 4 quarters
Record financial results, excluding specified items Overall strong performance, demonstrating momentum Quarterly dividend at $0.87 in Q3 2013
ADJUSTED RESULTS (1)Q3 13 Q2 13 Q3 12 QoQ YoY
Net Income(2) 391 369 353 6% 11%
Diluted EPS $2.22 $2.08 $1.98 7% 12%
Provision for Credit Losses 48 53 40 (9%) 20%
Return on Equity 20.3% 20.5% 20.2%
Common Equity Tier 1 Ratio
Under Basel III8.6% 8.3% 7.8%
Dividend Payout(3) 40.0% 40.1% 39.0%
Ghislain ParentChief Financial Officer and Executive Vice-President, Finance and Treasury
FINANCIAL REVIEW
27/08/2013
3
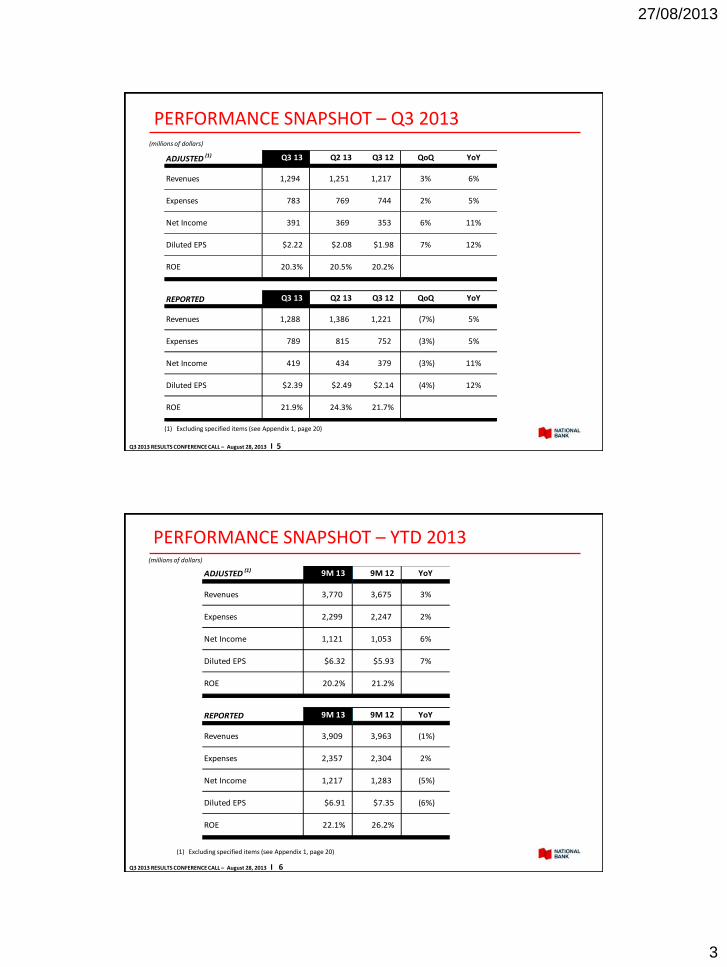
PERFORMANCE SNAPSHOT – Q3 2013
Q3 2013 RESULTS CONFERENCE CALL – August 28, 2013 I 5
(1) Excluding specified items (see Appendix 1, page 20)
(millions of dollars)
ADJUSTED (1) Q3 13 Q2 13 Q3 12 QoQ YoY
Revenues 1,294 1,251 1,217 3% 6%
Expenses 783 769 744 2% 5%
Net Income 391 369 353 6% 11%
Diluted EPS $2.22 $2.08 $1.98 7% 12%
ROE 20.3% 20.5% 20.2%
REPORTED Q3 13 Q2 13 Q3 12 QoQ YoY
Revenues 1,288 1,386 1,221 (7%) 5%
Expenses 789 815 752 (3%) 5%
Net Income 419 434 379 (3%) 11%
Diluted EPS $2.39 $2.49 $2.14 (4%) 12%
ROE 21.9% 24.3% 21.7%
PERFORMANCE SNAPSHOT – YTD 2013
Q3 2013 RESULTS CONFERENCE CALL – August 28, 2013 I 6
(1) Excluding specified items (see Appendix 1, page 20)
(millions of dollars)
ADJUSTED (1) 9M 13 9M 12 YoY
Revenues 3,770 3,675 3%
Expenses 2,299 2,247 2%
Net Income 1,121 1,053 6%
Diluted EPS $6.32 $5.93 7%
ROE 20.2% 21.2%
REPORTED 9M 13 9M 12 YoY
Revenues 3,909 3,963 (1%)
Expenses 2,357 2,304 2%
Net Income 1,217 1,283 (5%)
Diluted EPS $6.91 $7.35 (6%)
ROE 22.1% 26.2%
27/08/2013
4
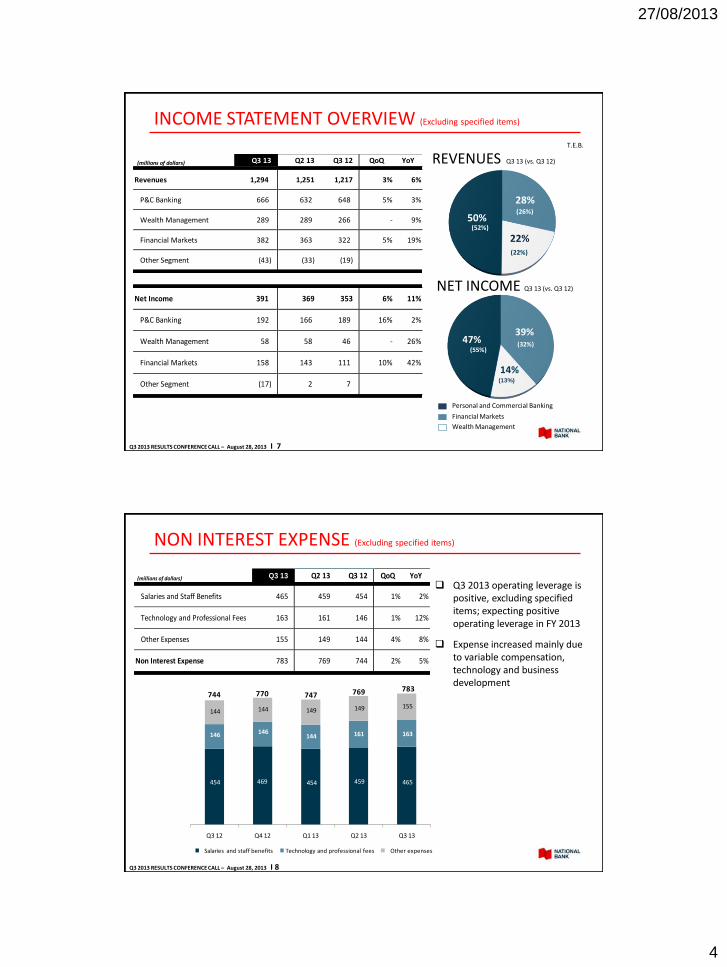
INCOME STATEMENT OVERVIEW (Excluding specified items)
REVENUES Q3 13 (vs. Q3 12)
NET INCOME Q3 13 (vs. Q3 12)
T.E.B.
Personal and Commercial Banking
Financial Markets
Wealth Management
Q3 2013 RESULTS CONFERENCE CALL – August 28, 2013 I 7
(millions of dollars) Q3 13 Q2 13 Q3 12 QoQ YoY
Revenues 1,294 1,251 1,217 3% 6%
P&C Banking 666 632 648 5% 3%
Wealth Management 289 289 266 - 9%
Financial Markets 382 363 322 5% 19%
Other Segment (43) (33) (19)
Net Income 391 369 353 6% 11%
P&C Banking 192 166 189 16% 2%
Wealth Management 58 58 46 - 26%
Financial Markets 158 143 111 10% 42%
Other Segment (17) 2 7
28%
22%
50%(52%)
(26%)
(22%)
39%
14%
47%(32%)
(13%)
(55%)
454 469 454 459 465
146 146 144 161 163
144 144 149 149 155
Q3 12 Q4 12 Q1 13 Q2 13 Q3 13
Salaries and staff benefits Technology and professional fees Other expenses
744 770 747 769 783
NON INTEREST EXPENSE (Excluding specified items)
Q3 2013 operating leverage is positive, excluding specified items; expecting positive operating leverage in FY 2013
Expense increased mainly due to variable compensation, technology and business development
Q3 2013 RESULTS CONFERENCE CALL – August 28, 2013 I 8
(millions of dollars) Q3 13 Q2 13 Q3 12 QoQ YoY
Salaries and Staff Benefits 465 459 454 1% 2%
Technology and Professional Fees 163 161 146 1% 12%
Other Expenses 155 149 144 4% 8%
Non Interest Expense 783 769 744 2% 5%
27/08/2013
5
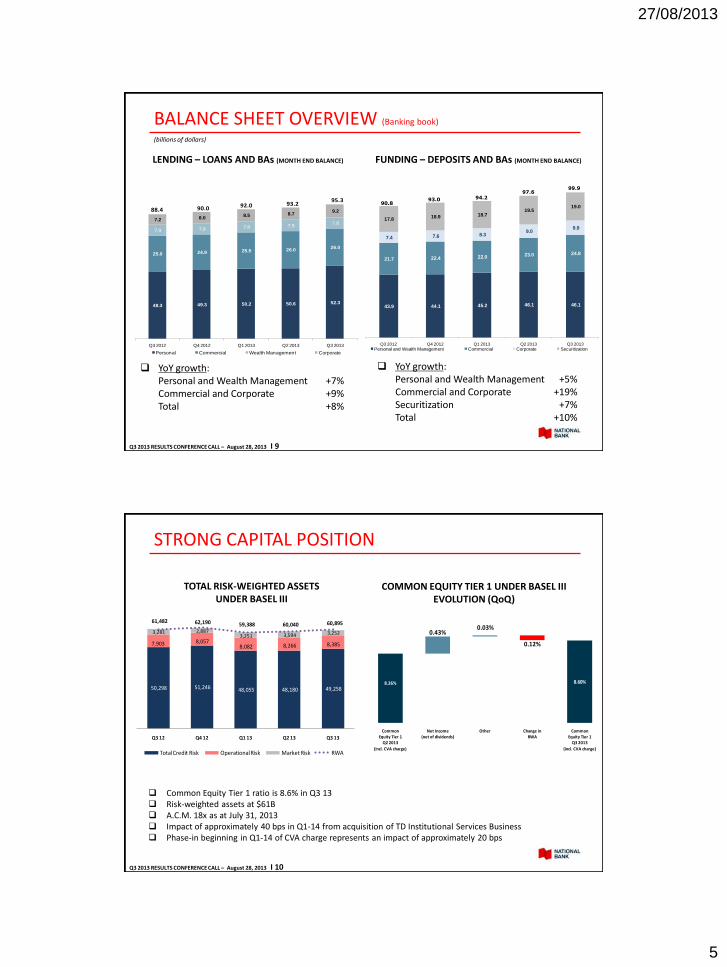
BALANCE SHEET OVERVIEW (Banking book)
Q3 2013 RESULTS CONFERENCE CALL – August 28, 2013 I 9
LENDING – LOANS AND BAs (MONTH END BALANCE) FUNDING – DEPOSITS AND BAs (MONTH END BALANCE)
(billions of dollars)
YoY growth:Personal and Wealth Management +7%Commercial and Corporate +9%Total +8%
YoY growth:Personal and Wealth Management +5%Commercial and Corporate +19%Securitization +7%Total +10%
48.3 49.3 50.2 50.6 52.3
25.0 24.9 25.5 26.0 26.0
7.9 7.8 7.8 7.9 7.8
7.2 8.0 8.5 8.7
9.2
Q3 2012 Q4 2012 Q1 2013 Q2 2013 Q3 2013
Personal Commercial Wealth Management Corporate
95.3 93.2 92.0 90.0 88.4
43.9 44.1 45.2 46.1 46.1
21.7 22.4 22.0 23.0 24.8
7.4 7.6 8.3 9.0
9.9
17.8 18.9 18.7
19.5 19.0
Q3 2012 Q4 2012 Q1 2013 Q2 2013 Q3 2013Personal and Wealth Management Commercial Corporate Securitization
90.893.0 94.2
97.699.9
8.26%8.26%
8.69% 8.60% 8.60%
0.43%0.03%
0.12%
Common Equity Tier 1
Q2 2013
(incl. CVA charge)
Net Income (net of dividends)
Other Change inRWA
Common Equity Tier 1
Q3 2013
(incl. CVA charge)
50,298 51,246 48,055 48,180 49,258
7,903 8,057 8,082 8,266 8,385
3,281 2,887 3,251 3,594 3,252
61,482 62,190 59,388 60,040 60,895
Q3 12 Q4 12 Q1 13 Q2 13 Q3 13
Total Credit Risk Operational Risk Market Risk RWA
STRONG CAPITAL POSITION
COMMON EQUITY TIER 1 UNDER BASEL III EVOLUTION (QoQ)
Common Equity Tier 1 ratio is 8.6% in Q3 13 Risk-weighted assets at $61B A.C.M. 18x as at July 31, 2013 Impact of approximately 40 bps in Q1-14 from acquisition of TD Institutional Services Business Phase-in beginning in Q1-14 of CVA charge represents an impact of approximately 20 bps
TOTAL RISK-WEIGHTED ASSETS UNDER BASEL III
Q3 2013 RESULTS CONFERENCE CALL – August 28, 2013 I 10
27/08/2013
6
RISK MANAGEMENT
William BonnellExecutive Vice-President, Risk Management
(67%)(7%)
(26%)
Personal Banking and Wealth Management
Corporate Banking
Commercial Banking
67%8%
25%
9%
12%
4%
14%
9%13%
3%
5%
4%
11%
10%
6%
Agriculture and Forestry Mining, Oil and Gas
Construction Real Estate
Manufacturing Wholesale and Retail
Transportation Finance and Insurance
Communications Other Services
Government and Public Services Other
(11%)
(4%)
(3%)
(14%)
(9%)
(14%)
(4%)
(11%)
(9%)
(4%)
(11%)
(6%)
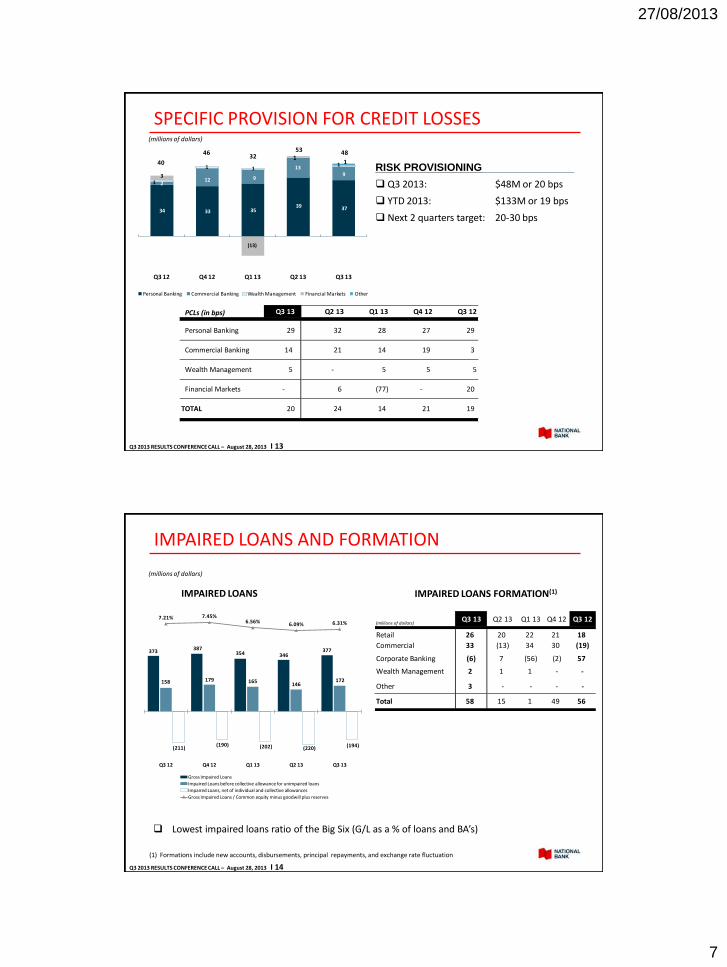
GLOBAL CREDIT PORTFOLIO As at July 31, 2013 vs. (July 31, 2012)
PER BUSINESS SEGMENT
PER INDUSTRY RETAIL PORTFOLIO COMPOSITION
Global Credit Portfolio mix remained stable Well-diversified across industrial sectors
Q3 2013 RESULTS CONFERENCE CALL – August 28, 2013 I 12
19%
20%
24%
37%
Uninsured Mortgages
Other (secured & unsecured)
HELOC
Insured Mortgages
(21%)
(38%)
(24%)
(17%)
27/08/2013
7
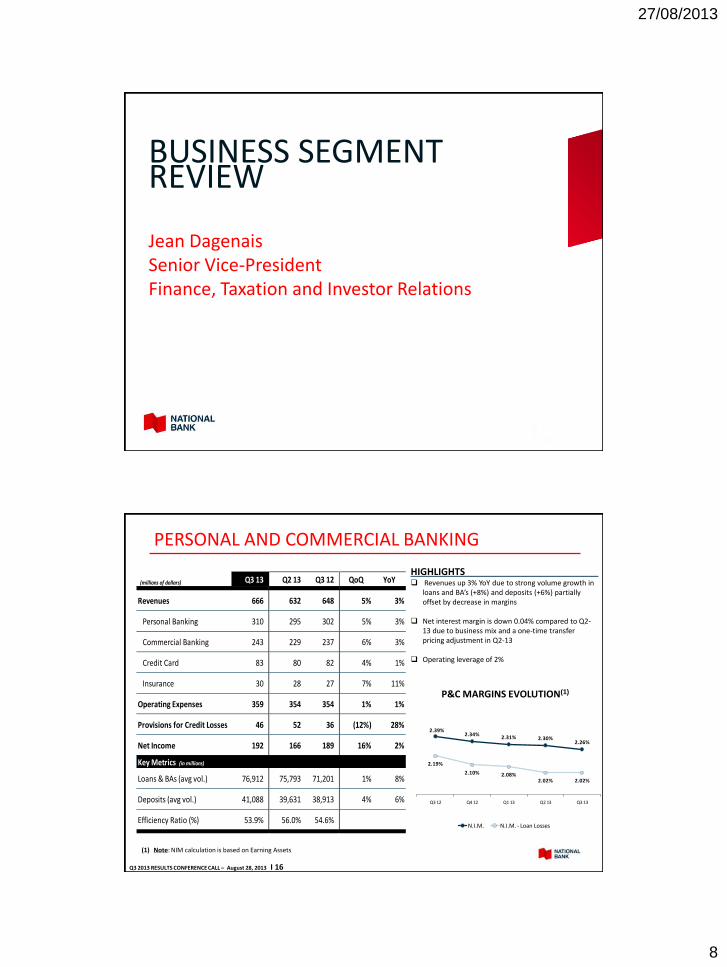
SPECIFIC PROVISION FOR CREDIT LOSSES(millions of dollars)
RISK PROVISIONING
Q3 2013: $48M or 20 bps
YTD 2013: $133M or 19 bps
Next 2 quarters target: 20-30 bps
Q3 2013 RESULTS CONFERENCE CALL – August 28, 2013 I 13
34 33 35 39 37
212 9
139
1
1
(13)
1
3
1
Q3 12 Q4 12 Q1 13 Q2 13 Q3 13
Personal Banking Commercial Banking Wealth Management Financial Markets Other
1 1
40
46 5332
48
PCLs (in bps) Q3 13 Q2 13 Q1 13 Q4 12 Q3 12
Personal Banking 29 32 28 27 29
Commercial Banking 14 21 14 19 3
Wealth Management 5 - 5 5 5
Financial Markets - 6 (77) - 20
TOTAL 20 24 14 21 19
IMPAIRED LOANS AND FORMATION
(millions of dollars)
IMPAIRED LOANS IMPAIRED LOANS FORMATION(1)
(1) Formations include new accounts, disbursements, principal repayments, and exchange rate fluctuation
Q3 2013 RESULTS CONFERENCE CALL – August 28, 2013 I 14
373 387
354 346 377
158 179 165 146
172
(211)(190) (202) (220) (194)
7.21% 7.45%6.56% 6.09% 6.31%
Q3 12 Q4 12 Q1 13 Q2 13 Q3 13
Gross Impaired Loans
Impaired Loans before collective allowance for unimpaired loans
Impaired Loans, net of individual and collective allowances
Gross Impaired Loans / Common equity minus goodwill plus reserves
(millions of dollars)Q3 13 Q2 13 Q1 13 Q4 12 Q3 12
Retail 26 20 22 21 18
Commercial 33 (13) 34 30 (19)
Corporate Banking (6) 7 (56) (2) 57
Wealth Management 2 1 1 - -
Other 3 - - - -
Total 58 15 1 49 56
Lowest impaired loans ratio of the Big Six (G/L as a % of loans and BA’s)
27/08/2013
8
Jean DagenaisSenior Vice-PresidentFinance, Taxation and Investor Relations
BUSINESS SEGMENT REVIEW
PERSONAL AND COMMERCIAL BANKING
P&C MARGINS EVOLUTION(1)
HIGHLIGHTS Revenues up 3% YoY due to strong volume growth in
loans and BA’s (+8%) and deposits (+6%) partially offset by decrease in margins
Net interest margin is down 0.04% compared to Q2-13 due to business mix and a one-time transfer pricing adjustment in Q2-13
Operating leverage of 2%
Q3 2013 RESULTS CONFERENCE CALL – August 28, 2013 I 16
(1) Note: NIM calculation is based on Earning Assets
(millions of dollars) Q3 13 Q2 13 Q3 12 QoQ YoY
Revenues 666 632 648 5% 3%
Personal Banking 310 295 302 5% 3%
Commercial Banking 243 229 237 6% 3%
Credit Card 83 80 82 4% 1%
Insurance 30 28 27 7% 11%
Operating Expenses 359 354 354 1% 1%
Provisions for Credit Losses 46 52 36 (12%) 28%
Net Income 192 166 189 16% 2%
Key Metrics (in millions)
Loans & BAs (avg vol.) 76,912 75,793 71,201 1% 8%
Deposits (avg vol.) 41,088 39,631 38,913 4% 6%
Efficiency Ratio (%) 53.9% 56.0% 54.6%
2.39%2.34%
2.31% 2.30%2.26%
2.19%
2.10% 2.08%2.02% 2.02%
Q3 12 Q4 12 Q1 13 Q2 13 Q3 13
N.I.M. N.I.M. - Loan Losses
27/08/2013
9
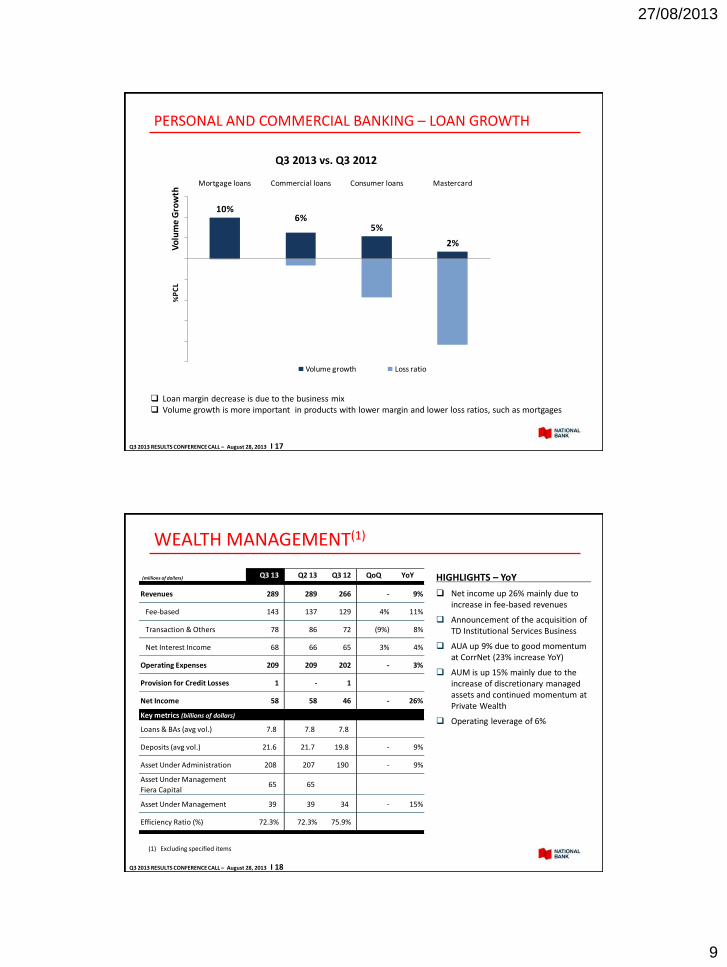
10%6%
5%
2%
Mortgage loans Commercial loans Consumer loans MastercardV
olu
me
Gro
wth
Volume growth Loss ratio
%P
CL
PERSONAL AND COMMERCIAL BANKING – LOAN GROWTH
Loan margin decrease is due to the business mix Volume growth is more important in products with lower margin and lower loss ratios, such as mortgages
Q3 2013 RESULTS CONFERENCE CALL – August 28, 2013 I 17
Q3 2013 vs. Q3 2012
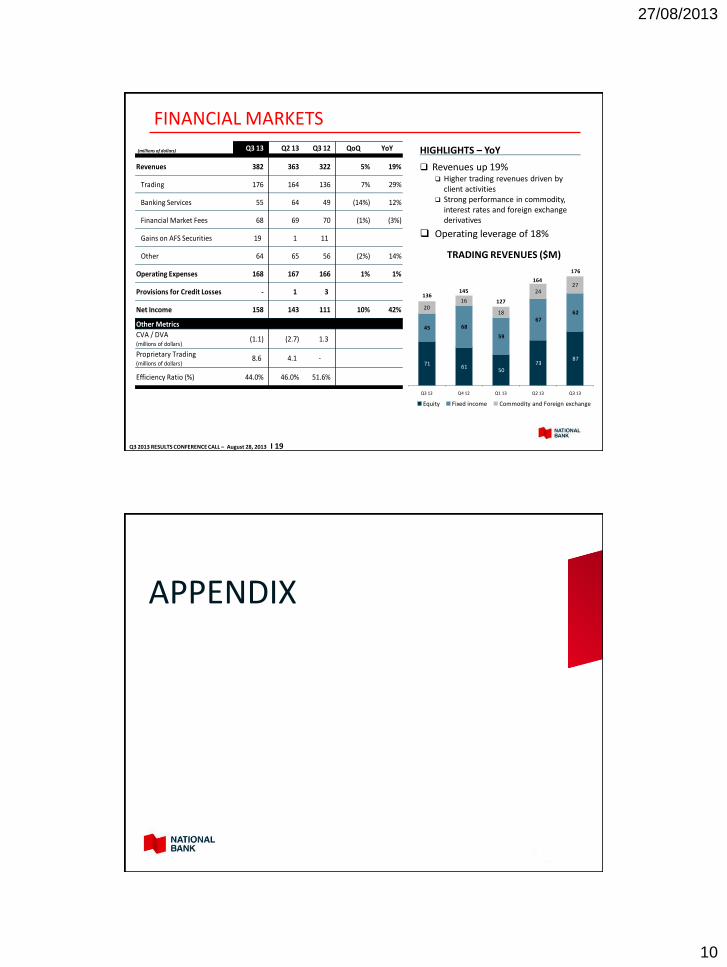
WEALTH MANAGEMENT(1)
(1) Excluding specified items
HIGHLIGHTS – YoY
Net income up 26% mainly due to increase in fee-based revenues
Announcement of the acquisition of TD Institutional Services Business
AUA up 9% due to good momentum at CorrNet (23% increase YoY)
AUM is up 15% mainly due to the increase of discretionary managed assets and continued momentum at Private Wealth
Operating leverage of 6%
Q3 2013 RESULTS CONFERENCE CALL – August 28, 2013 I 18
(millions of dollars) Q3 13 Q2 13 Q3 12 QoQ YoY
Revenues 289 289 266 - 9%
Fee-based 143 137 129 4% 11%
Transaction & Others 78 86 72 (9%) 8%
Net Interest Income 68 66 65 3% 4%
Operating Expenses 209 209 202 - 3%
Provision for Credit Losses 1 - 1
Net Income 58 58 46 - 26%
Key metrics (billions of dollars)
Loans & BAs (avg vol.) 7.8 7.8 7.8
Deposits (avg vol.) 21.6 21.7 19.8 - 9%
Asset Under Administration 208 207 190 - 9%
Asset Under Management
Fiera Capital 65 65 0%
Asset Under Management 39 39 34 - 15%
Efficiency Ratio (%) 72.3% 72.3% 75.9%
27/08/2013
10
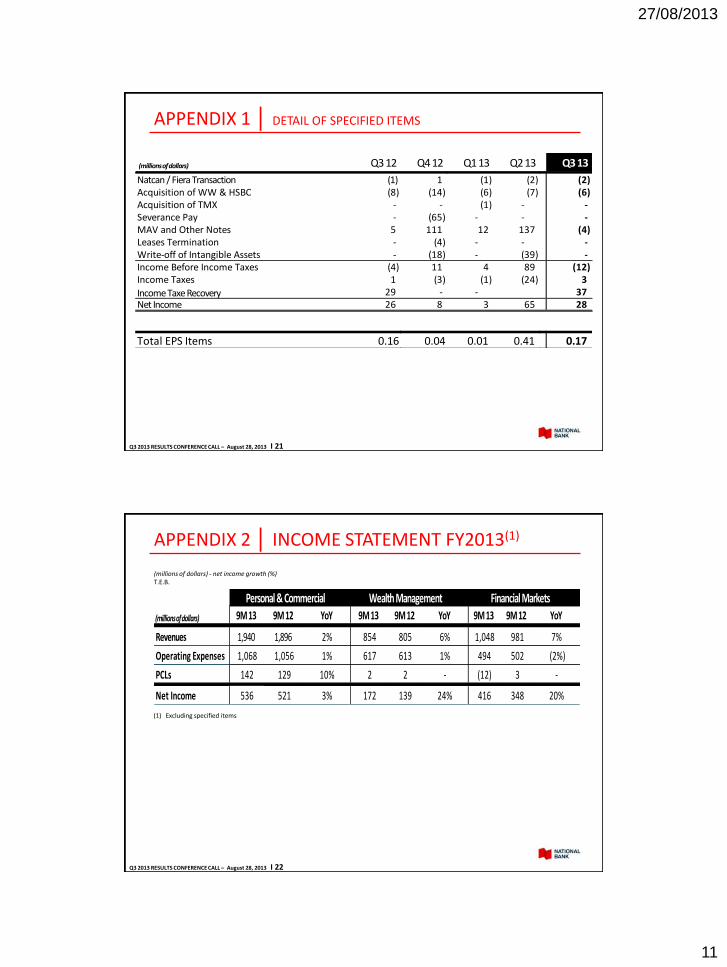
FINANCIAL MARKETS
HIGHLIGHTS – YoY
Revenues up 19% Higher trading revenues driven by
client activities Strong performance in commodity,
interest rates and foreign exchange derivatives
Operating leverage of 18%
TRADING REVENUES ($M)
Q3 2013 RESULTS CONFERENCE CALL – August 28, 2013 I 19
71 61
50 73
87
45 68
59
67 62
2016
18
2427
Q3 12 Q4 12 Q1 13 Q2 13 Q3 13
Equity Fixed income Commodity and Foreign exchange
145136
127
176
164
(millions of dollars) Q3 13 Q2 13 Q3 12 QoQ YoY
Revenues 382 363 322 5% 19%
Trading 176 164 136 7% 29%
Banking Services 55 64 49 (14%) 12%
Financial Market Fees 68 69 70 (1%) (3%)
Gains on AFS Securities 19 1 11
Other 64 65 56 (2%) 14%
Operating Expenses 168 167 166 1% 1%
Provisions for Credit Losses - 1 3
Net Income 158 143 111 10% 42%
Other Metrics
CVA / DVA(millions of dollars)
(1.1) (2.7) 1.3
Proprietary Trading(millions of dollars)
8.6 4.1 -
Efficiency Ratio (%) 44.0% 46.0% 51.6%
APPENDIX
27/08/2013
11
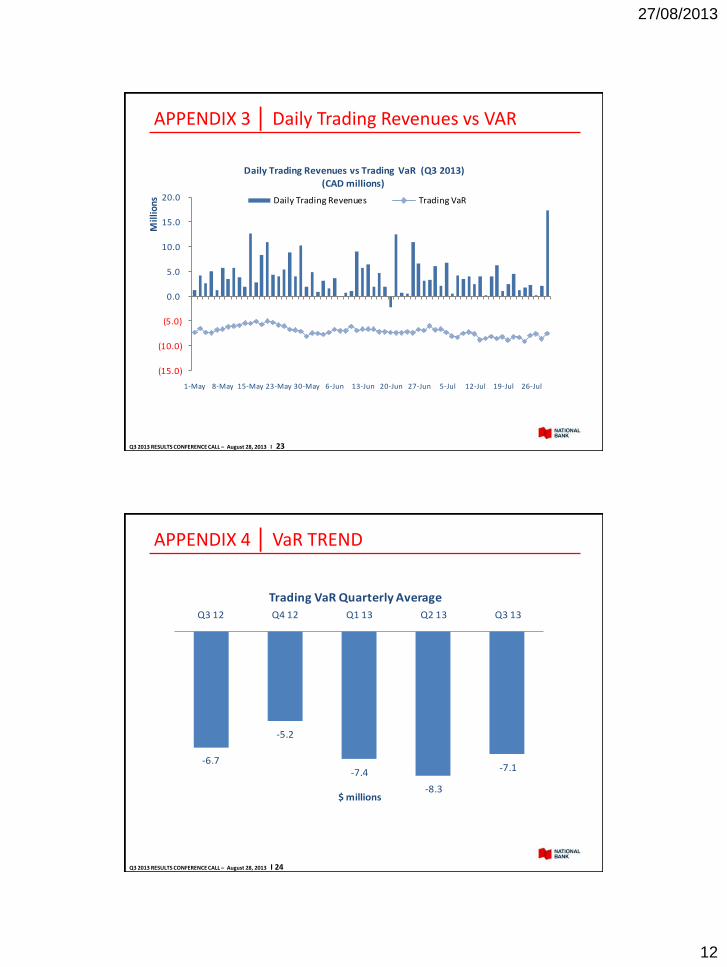
APPENDIX 1 │ DETAIL OF SPECIFIED ITEMS
Triggers could also be breached if realized losses in the CDX credit indices above exceeded 12% (currently at 1.11%)
Q3 2013 RESULTS CONFERENCE CALL – August 28, 2013 I 21
(millions of dollars) Q3 12 Q4 12 Q1 13 Q2 13 Q3 13
Natcan / Fiera Transaction (1) 1 (1) (2) (2) Acquisition of WW & HSBC (8) (14) (6) (7) (6) Acquisition of TMX - - (1) - - Severance Pay - (65) - - - MAV and Other Notes 5 111 12 137 (4) Leases Termination - (4) - - - Write-off of Intangible Assets - (18) - (39) - Income Before Income Taxes (4) 11 4 89 (12) Income Taxes 1 (3) (1) (24) 3
Income Taxe Recovery 29 - - 37 Net Income 26 8 3 65 28
Total EPS Items 0.16 0.04 0.01 0.41 0.17
APPENDIX 2 │ INCOME STATEMENT FY2013(1)
(1) Excluding specified items
(millions of dollars) - net income growth (%)T.E.B.
Q3 2013 RESULTS CONFERENCE CALL – August 28, 2013 I 22
9M 13 9M 12 YoY 9M 13 9M 12 YoY 9M 13 9M 12 YoY
Revenues 1,940 1,896 2% 854 805 6% 1,048 981 7%
Operating Expenses 1,068 1,056 1% 617 613 1% 494 502 (2%)
PCLs 142 129 10% 2 2 - (12) 3 -
Net Income 536 521 3% 172 139 24% 416 348 20%
Wealth Management Financial MarketsPersonal & Commercial
(millions of dollars)
27/08/2013
12
APPENDIX 3 │ Daily Trading Revenues vs VAR
Q3 2013 RESULTS CONFERENCE CALL – August 28, 2013 I 23
(15.0)
(10.0)
(5.0)
0.0
5.0
10.0
15.0
20.0
1-May 8-May 15-May 23-May 30-May 6-Jun 13-Jun 20-Jun 27-Jun 5-Jul 12-Jul 19-Jul 26-Jul
Mill
ions
Daily Trading Revenues vs Trading VaR (Q3 2013)
(CAD millions)
Daily Trading Revenues Trading VaR
APPENDIX 4 │ VaR TREND
Q3 2013 RESULTS CONFERENCE CALL – August 28, 2013 I 24
-6.7
-5.2
-7.4
-8.3
-7.1
Q3 12 Q4 12 Q1 13 Q2 13 Q3 13
$ millions
Trading VaR Quarterly Average
27/08/2013
13
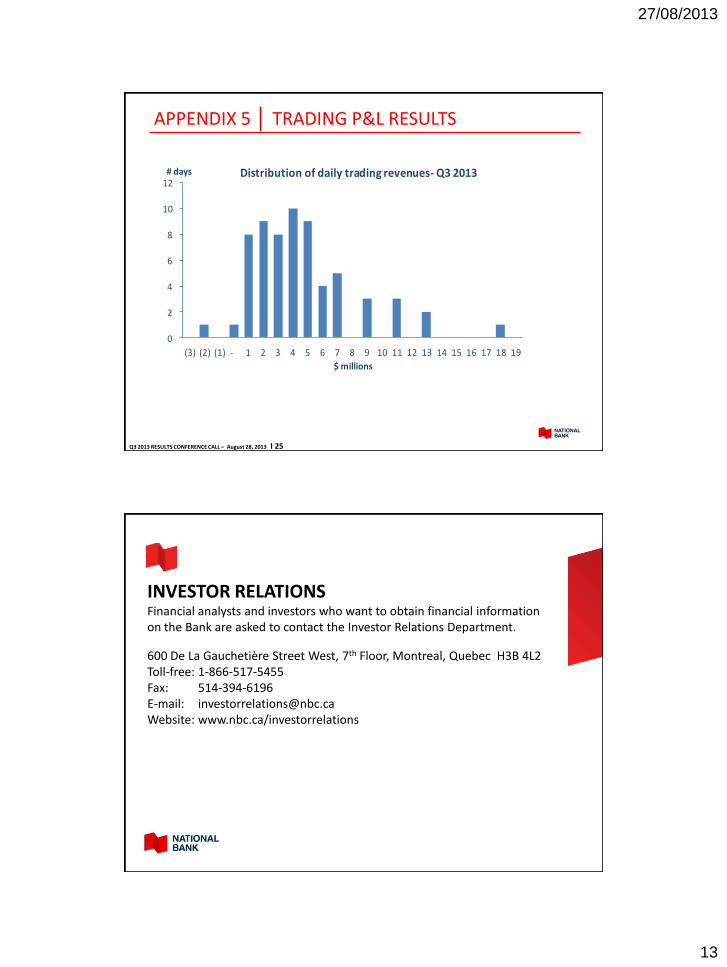
APPENDIX 5 │ TRADING P&L RESULTS
Q3 2013 RESULTS CONFERENCE CALL – August 28, 2013 I 25
0
2
4
6
8
10
12
(3) (2) (1) - 1 2 3 4 5 6 7 8 9 10 11 12 13 14 15 16 17 18 19
# days
$ millions
Distribution of daily trading revenues - Q3 2013
INVESTOR RELATIONSFinancial analysts and investors who want to obtain financial information on the Bank are asked to contact the Investor Relations Department.
600 De La Gauchetière Street West, 7th Floor, Montreal, Quebec H3B 4L2Toll-free: 1-866-517-5455Fax: 514-394-6196E-mail: [email protected]: www.nbc.ca/investorrelations