analyst coverage and market reaction around stock split announcements
TRANSCRIPT

This article was downloaded by: [University Of Maryland]On: 10 October 2014, At: 09:23Publisher: RoutledgeInforma Ltd Registered in England and Wales Registered Number: 1072954 Registered office: Mortimer House,37-41 Mortimer Street, London W1T 3JH, UK
Applied Financial EconomicsPublication details, including instructions for authors and subscription information:http://www.tandfonline.com/loi/rafe20
Analyst coverage and market reaction around stocksplit announcementsDeborah A. Ford a , Hoang H. Nguyen a & Van T. Nguyen ba Department of Finance and Economics , Merrick School of Business, University ofBaltimore , 1420 N. Charles Street, Baltimore, MD 21201, USAb Department of Accounting and Finance , Earl G. Graves School of Business andManagement, Morgan State University , 1700 E. Cold Spring Lane, Baltimore, MD 21251, USAPublished online: 03 Oct 2011.
To cite this article: Deborah A. Ford , Hoang H. Nguyen & Van T. Nguyen (2012) Analyst coverage and market reaction aroundstock split announcements, Applied Financial Economics, 22:2, 135-145
To link to this article: http://dx.doi.org/10.1080/09603107.2011.605755
PLEASE SCROLL DOWN FOR ARTICLE
Taylor & Francis makes every effort to ensure the accuracy of all the information (the “Content”) containedin the publications on our platform. However, Taylor & Francis, our agents, and our licensors make norepresentations or warranties whatsoever as to the accuracy, completeness, or suitability for any purpose of theContent. Any opinions and views expressed in this publication are the opinions and views of the authors, andare not the views of or endorsed by Taylor & Francis. The accuracy of the Content should not be relied upon andshould be independently verified with primary sources of information. Taylor and Francis shall not be liable forany losses, actions, claims, proceedings, demands, costs, expenses, damages, and other liabilities whatsoeveror howsoever caused arising directly or indirectly in connection with, in relation to or arising out of the use ofthe Content.
This article may be used for research, teaching, and private study purposes. Any substantial or systematicreproduction, redistribution, reselling, loan, sub-licensing, systematic supply, or distribution in anyform to anyone is expressly forbidden. Terms & Conditions of access and use can be found at http://www.tandfonline.com/page/terms-and-conditions
Applied Financial Economics, 2012, 22, 135–145
Analyst coverage and market
reaction around stock split
announcements
Deborah A. Forda, Hoang H. Nguyena,* and Van T. Nguyenb
aDepartment of Finance and Economics, Merrick School of Business,
University of Baltimore, 1420 N. Charles Street, Baltimore,
MD 21201, USAbDepartment of Accounting and Finance, Earl G. Graves School of Business
and Management, Morgan State University, 1700 E. Cold Spring Lane,
Baltimore, MD 21251, USA
This study examines the influence of the number of financial analysts
following a firm on market reaction around the announcement of stock
splits. Results show that the raw as well as abnormal returns at the
announcement of stock splits are negatively related to the level of analyst
coverage. The negative relation prevails even after controlling for size,
book-to-market, momentum, split factors and post-split target price.
Moreover, the impact of analyst coverage on market reaction is stronger
for a sample of small size stocks than a sample of large stocks. The findings
of this article suggest that information asymmetry is an important factor
influencing market reaction to stock split announcements.
Keywords: stock splits; analysts; information asymmetry; announcement
return
JEL Classification: G12; G14; G20
I. Introduction
Splits ought to be cosmetic events, since they change
only the numbers of shares outstanding and do not
have any impact on cash flow or ownership.
However, the market reacts positively around their
announcements. Grinblatt et al. (1984) documented
that even in ‘clean’ splits, where there is no contem-
poraneous announcement; splits still generate an
average positive abnormal return of nearly 3%
upon their announcements. Grinblatt et al. (1984)
hypothesize that managers use splits to signal
favourable information to the public and the
market reacts positively to the good news. Further
evidence supporting that signalling hypothesis can
also be found in Lamoureux and Poon (1987),
Ikenberry et al. (1996), and Conroy and Harris
(1999), who document that split stocks experience
short-term excess returns. Examining long-run
returns, Ikenberry et al. (1996), Desai and Jain
(1997), Ikenberry and Ramnath (2002), and Hwang
et al. (2008) document that split stocks outperform
the benchmark average over a 12-month period
following split announcements. Lakonishok and Lev
(1987) and Asquith et al. (1989) find that firms
demonstrate strong operating performance during
the 2 years prior to the announcement of splits,
and the trend does not revert following the split.
*Corresponding author. E-mail: [email protected]
Applied Financial Economics ISSN 0960–3107 print/ISSN 1466–4305 online � 2012 Taylor & Francis 135http://www.tandfonline.com
http://dx.doi.org/10.1080/09603107.2011.605755
Dow
nloa
ded
by [
Uni
vers
ity O
f M
aryl
and]
at 0
9:23
10
Oct
ober
201
4
All the evidence appears to support the signallinghypothesis.
Another hypothesis receiving considerable atten-tion from the literature is marketability. Contraryto the signalling hypothesis, marketability tends torelate the motivation for a split to past rather thanfuture performance. This hypothesis posits thatfollowing a period of significant price run-up,firms conduct splits to return stock prices to anormal range to improve liquidity. The lower pricelevel helps the firm to attract individual investorswho find it costly to trade round lots on highprice stocks. Schultz (2000) shows that the numberof small orders increases significantly, followingthe splits. Lamoureux and Poon (1987) andMaloney and Mulherin (1992) find increases inthe numbers of shareholders after splits. Dennis(2003) find that the frequency and volume of smalltrades increases after splits. Moreover, lower pricesfollowing splits effectively increase bid–ask spreads,and therefore motivate brokers to promote splitstocks. Consistent with this argument, Copeland(1979), Conroy et al. (1990), Gray et al. (2003),Desai et al. (1998) and Schultz (2000) all documentthat the relative bid–ask spreads increase followingstock splits. Further support for the marketabilityhypothesis can be found in Angel (1997), whosemodel suggests that post-split lower prices canincrease relative tick sizes, and therefore improveliquidity through the behaviour of market makersand limit order traders.
In this article, we examine whether the numberof financial analysts following a firm before theannouncement of a stock split has any impact onmarket reaction to such an event.1 This article ismotivated not only by the debate over the under-lying reason for splits, but also by the establishedliterature on the role of financial analysts inimproving the information environment. Jensenand Meckling (1976) contend that security analystshave a comparative advantage in the production offirm-specific information. Brennan and Hughes(1991), Chung and Jo (1996) and Womack (1996)argue that one of the analysts’ primary roles is toincrease the informativeness of the market regard-ing a firm’s securities, and therefore the perfor-mance of analysts will reduce the informationasymmetry between the firm’s managers andinvestors. Ayers and Freeman (2003) find thatprices are more informative with respect to futureearnings for stocks covered by more analysts.Brennan et al. (1993), Hong et al. (2000) and
Griffin and Lemmon (2002) find that analysts helpto improve the information diffusion process.
Therefore, for a given event that contains newinformation, the marginal value of this event will belower if there are more analysts following, since thereis lower information asymmetry between managersand investors. As a result, we expect that marketreaction to new information is negatively related tothe level of analyst coverage. In the context of stocksplits, we document that the market reaction to splitannouncements is stronger for firms followed byfewer analysts. This negative relationship betweenmarket reaction and analyst coverage prevails evenafter controlling for factors associated with theannouncement effect, including split factor, targetprice, firm size, book-to-market and momentum.
We further investigate the relationship betweenthe number of analysts and market reaction to splitannouncements for firms with different levels ofinformation asymmetry. If there is no informationasymmetry between managers and investors, infor-mation provided by managers should not causesignificant reaction on the market, and the role ofanalyst coverage around the information announce-ment should be limited. However, if there is severeasymmetry, not only does information released bymanagers carry higher value, but analysts’ coverageshould also have more influence over marketresponse to information. Consistent with this argu-ment, when we partition the sample into two groupsbased on market capitalization of firms – which isused to proxy information asymmetry – we documentthat the negative relation between the number ofanalysts following and abnormal returns around splitannouncements is stronger for stocks of small sizesample than for those of larger capitalization. Tofurther investigate the information hypothesis, weexamine long-run post-split announcement perfor-mance to see if there is a reverse pattern in long-termreturn, meaning that stocks with fewer analystsexperience significantly lower long-term return com-pared to those covered by more analysts. The resultsshow that there is no significant relation betweenlong-run performance of split and number of analystsfollowing.
This study contributes to the current literaturein two ways. First, the results show that marketreaction to split announcements is related to theinformation asymmetry. This finding offers newevidence supporting the signalling hypothesis con-cerning the motivation of splits. Second, this studyadds to a growing body of studies on the role of
1 To be consistent with the literature in this field, we focus our analysis on market reaction around the announcement of a splitrather than around the date when the split actually takes place.
136 D. A. Ford et al.
Dow
nloa
ded
by [
Uni
vers
ity O
f M
aryl
and]
at 0
9:23
10
Oct
ober
201
4
financial analysts in reducing information asymmetryand how analyst coverage can affect market reactionto the corporate finance decision.
The rest of the article is organized asfollows: Section II details the sample and methodol-ogy, Section III presents the empirical results, andSection IV concludes the article.
II. Sample and Methodology
The data for this study comes from two sources.First, we use the Center for Research in SecuritiesPrice (CRSP) to identify all split announcementsrecorded from 1976 to 2007. We exclude AmericanDepositary Receipts (ADRs), Real Estate InvestmentTrusts (REITs), closed-end funds and primes andscores and focus on common stocks, whose sharecode is either 10 or 11. The market reaction to splitannouncements is represented by the 3-day returnfrom the day before (day �1) to the day after (dayþ1) the announcement. In addition to raw returns,we analyse 3-day market-adjusted return, which isobtained by subtracting the 3-day buy-and-holdCRSP value-weighted (or equal-weighted) returnfrom the 3-day holding return for split stocks.We report both mean and median return values of
the entire sample. Significance levels are computedbased on the cross-sectional SD.
Second, information on analyst coverage isextracted from the IBES Historical Summary File,which is available on a monthly basis. For each stockin CRSP, the coverage in any given month is equal tothe number of IBES analysts who provide fiscal yearearnings estimates in the month prior to the splitannouncement. When the number of analysts isunavailable, we set the coverage to zero.
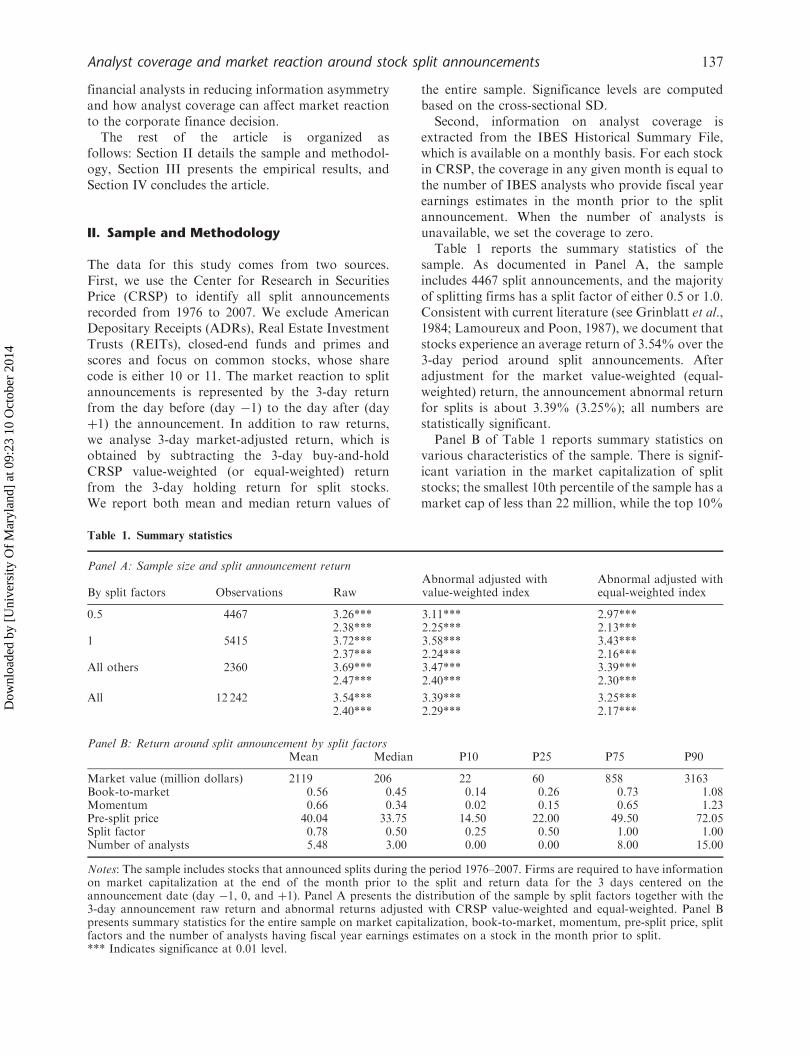
Table 1 reports the summary statistics of thesample. As documented in Panel A, the sampleincludes 4467 split announcements, and the majorityof splitting firms has a split factor of either 0.5 or 1.0.Consistent with current literature (see Grinblatt et al.,1984; Lamoureux and Poon, 1987), we document thatstocks experience an average return of 3.54% over the3-day period around split announcements. Afteradjustment for the market value-weighted (equal-weighted) return, the announcement abnormal returnfor splits is about 3.39% (3.25%); all numbers arestatistically significant.
Panel B of Table 1 reports summary statistics onvarious characteristics of the sample. There is signif-icant variation in the market capitalization of splitstocks; the smallest 10th percentile of the sample has amarket cap of less than 22 million, while the top 10%
Table 1. Summary statistics
Panel A: Sample size and split announcement return
By split factors Observations RawAbnormal adjusted withvalue-weighted index
Abnormal adjusted withequal-weighted index
0.5 4467 3.26*** 3.11*** 2.97***2.38*** 2.25*** 2.13***
1 5415 3.72*** 3.58*** 3.43***2.37*** 2.24*** 2.16***
All others 2360 3.69*** 3.47*** 3.39***2.47*** 2.40*** 2.30***
All 12 242 3.54*** 3.39*** 3.25***2.40*** 2.29*** 2.17***
Panel B: Return around split announcement by split factorsMean Median P10 P25 P75 P90
Market value (million dollars) 2119 206 22 60 858 3163Book-to-market 0.56 0.45 0.14 0.26 0.73 1.08Momentum 0.66 0.34 0.02 0.15 0.65 1.23Pre-split price 40.04 33.75 14.50 22.00 49.50 72.05Split factor 0.78 0.50 0.25 0.50 1.00 1.00Number of analysts 5.48 3.00 0.00 0.00 8.00 15.00
Notes: The sample includes stocks that announced splits during the period 1976–2007. Firms are required to have informationon market capitalization at the end of the month prior to the split and return data for the 3 days centered on theannouncement date (day �1, 0, and þ1). Panel A presents the distribution of the sample by split factors together with the3-day announcement raw return and abnormal returns adjusted with CRSP value-weighted and equal-weighted. Panel Bpresents summary statistics for the entire sample on market capitalization, book-to-market, momentum, pre-split price, splitfactors and the number of analysts having fiscal year earnings estimates on a stock in the month prior to split.*** Indicates significance at 0.01 level.
Analyst coverage and market reaction around stock split announcements 137
Dow
nloa
ded
by [
Uni
vers
ity O
f M
aryl
and]
at 0
9:23
10
Oct
ober
201
4
has capitalization of at least $3.1 billion. Split stocksappear to have good performance momentum, as theaverage 6-month return prior to split is 66%. Themean and median value of the book-to-market ratiofor the sample is about 0.5. The pre-split price of thesample is fairly high, with mean and median valuesof about $40 and $37, respectively. On average, thesample is not widely covered by financial analysts;the mean and median values of the number ofanalysts following are 5 and 3, respectively. Onereason for this phenomenon is that stocks listed onNational Association of Securities Dealers AutomatedQuotation (NASDAQ) account for about 55% ofthe sample, and they tend to be small in marketcapitalization and therefore do not have many ana-lysts following.
III. Empirical Results
Number of analysts following and abnormal returnaround split announcements
To examine the impact of analyst coverage on marketreaction to split announcements, we employ bothunivariate and multivariate analysis. For the univar-iate method, we assign the split sample into quartilesbased on the number of analysts following. We reportthe mean and median value of the raw and abnormalannouncement return for each of the four portfolios.We also test the difference in return between theportfolio with the lowest coverage (Low quartile) andthe portfolio with the highest coverage (High quar-tile). For multivariate analysis, we regress abnormalannouncement returns on analyst coverage andcontrol variables and conduct standard t-tests onwhether coefficients on analyst coverage are signifi-cantly less than zero, since we expect that the higherthe number of analysts following, the lower themarket reaction to split announcements.
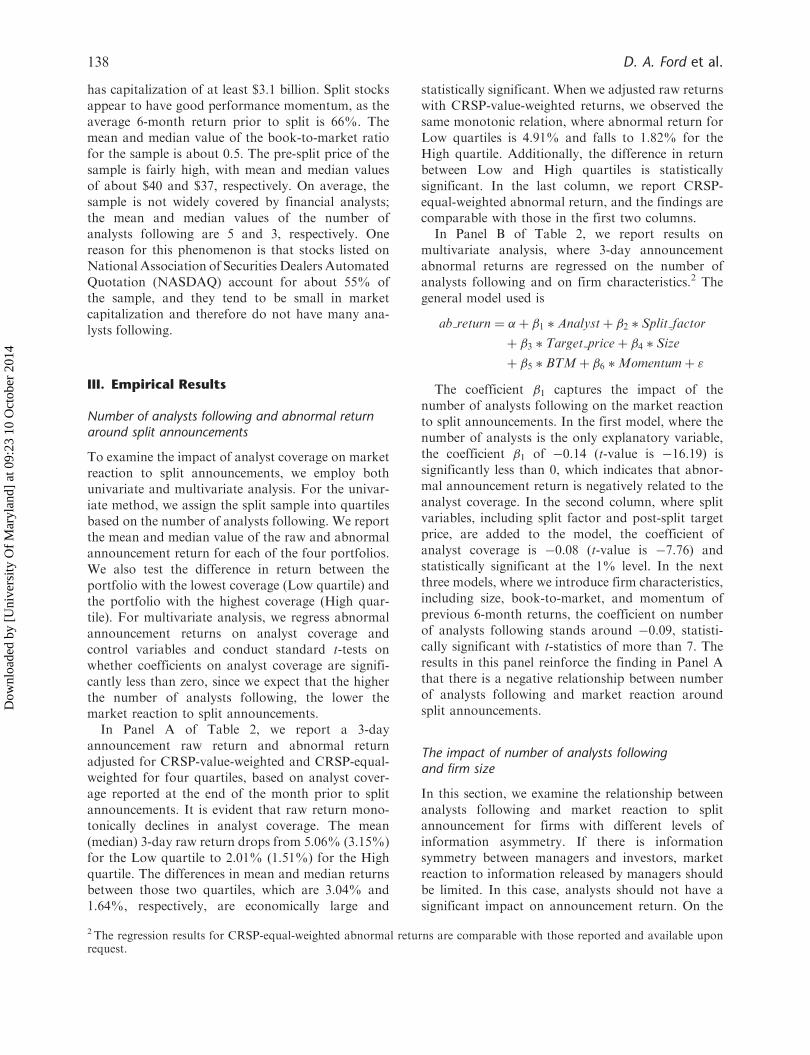
In Panel A of Table 2, we report a 3-dayannouncement raw return and abnormal returnadjusted for CRSP-value-weighted and CRSP-equal-weighted for four quartiles, based on analyst cover-age reported at the end of the month prior to splitannouncements. It is evident that raw return mono-tonically declines in analyst coverage. The mean(median) 3-day raw return drops from 5.06% (3.15%)for the Low quartile to 2.01% (1.51%) for the Highquartile. The differences in mean and median returnsbetween those two quartiles, which are 3.04% and1.64%, respectively, are economically large and
statistically significant. When we adjusted raw returnswith CRSP-value-weighted returns, we observed thesame monotonic relation, where abnormal return forLow quartiles is 4.91% and falls to 1.82% for theHigh quartile. Additionally, the difference in returnbetween Low and High quartiles is statisticallysignificant. In the last column, we report CRSP-equal-weighted abnormal return, and the findings arecomparable with those in the first two columns.
In Panel B of Table 2, we report results onmultivariate analysis, where 3-day announcementabnormal returns are regressed on the number ofanalysts following and on firm characteristics.2 Thegeneral model used is
ab return ¼ �þ �1 � Analystþ �2 � Split factor
þ �3 � Target priceþ �4 � Size
þ �5 � BTMþ �6 �Momentumþ "
The coefficient �1 captures the impact of thenumber of analysts following on the market reactionto split announcements. In the first model, where thenumber of analysts is the only explanatory variable,the coefficient �1 of �0.14 (t-value is �16.19) issignificantly less than 0, which indicates that abnor-mal announcement return is negatively related to theanalyst coverage. In the second column, where splitvariables, including split factor and post-split targetprice, are added to the model, the coefficient ofanalyst coverage is �0.08 (t-value is �7.76) andstatistically significant at the 1% level. In the nextthree models, where we introduce firm characteristics,including size, book-to-market, and momentum ofprevious 6-month returns, the coefficient on numberof analysts following stands around �0.09, statisti-cally significant with t-statistics of more than 7. Theresults in this panel reinforce the finding in Panel Athat there is a negative relationship between numberof analysts following and market reaction aroundsplit announcements.
The impact of number of analysts followingand firm size
In this section, we examine the relationship betweenanalysts following and market reaction to splitannouncement for firms with different levels ofinformation asymmetry. If there is informationsymmetry between managers and investors, marketreaction to information released by managers shouldbe limited. In this case, analysts should not have asignificant impact on announcement return. On the
2 The regression results for CRSP-equal-weighted abnormal returns are comparable with those reported and available uponrequest.
138 D. A. Ford et al.
Dow
nloa
ded
by [
Uni
vers
ity O
f M
aryl
and]
at 0
9:23
10
Oct
ober
201
4

other hand, if there is severe information asymmetry,information released by managers should carryhigher value and cause the market to react signifi-cantly around the announcement. Moreover, analystsshould play a more important role in alleviatingthe asymmetry. Hence, they should have a strongerimpact on market reaction to split announcements.We use market capitalization as a proxy for theinformation asymmetry.
For the univariate analysis, we partition the sampleinto two groups (Small and Large), based on theirmarket capitalization at the end of the month priorto split announcements. In Panel A of Table 3,we report a 3-day announcement return by analyst
quartiles for the samples of small and large stocks.Several interesting points emerged from this panel.First, the negative relation between number ofanalysts following and split announcement return isprevalent in both size samples, which suggests thatour findings in previous sections are not sensitive tofirm size. Second, consistent with our argument,we find that the difference between splits with thelowest analyst coverage (Low quartile) and thosewith the highest coverage (High quartile) is larger fora small size sample than for a large size sample.For small size firms, the average (median) raw returnis 5.21% (3.32%) for Low quartile and 2.76%(2.87%) for High quartile, creating a difference of
Table 2. Split announcement return and analyst coverage
Panel A: Univariate analysis
Analyst coverage Observations RawAbnormal adjusted withvalue-weighted index
Abnormal adjusted withequally-weighted index
1 (Low) 3724 5.06*** 4.91*** 4.78***3.15*** 3.18*** 2.95***
2 2081 3.84*** 3.70*** 3.59***3.02*** 2.89*** 2.77***
3 3209 3.13*** 2.99*** 2.84***2.32*** 2.27*** 2.16***
4 (High) 3228 2.01*** 1.82*** 1.69***1.51*** 1.35*** 1.22***
Low–High 3.04*** 3.10*** 3.09***1.64*** 1.83*** 1.73***
Panel B: Regression analysisModel 1 Model 2 Model 3 Model 4 Model 5
Intercept 4.20*** 4.50*** 4.60*** 4.76*** 4.72***50.25 29.04 29.31 25.28 25.16
Analyst �0.14*** �0.08*** �0.09*** �0.10*** �0.08***�16.19 �7.76 �8.54 �8.66 �7.27
Split_factor 1.37*** 1.36*** 1.36*** 1.30***10.53 10.50 10.49 10.01
Target_price �0.08*** �0.08*** �0.08*** �0.09***�12.58 �13.02 �13.11 �14.84
Size 0.02*** 0.02*** 0.02***3.93 3.92 4.00
BTM �0.21 �0.16�1.50 �1.15
Momentum 0.30***8.91
R-square (%) 0.024 0.046 0.047 0.047 0.054
Notes: Splits are assigned to quartiles based on the number of analysts covering a stock at the end of the month prior to thesplit announcements. Panel A presents the 3-day announcement raw return and abnormal returns adjusted with CRSP value-weighted and equal-weighted for each analyst coverage quartile. The first number in each cell is mean value and the secondnumber is median value. The last row (Low – High) reports the difference between quartiles of Low analyst coverage andHigh analyst coverage. The significance levels for the mean and the median are determined by a standard t-test and Wilcoxonsigned-rank test, respectively. Panel B presents the regression result of abnormal return adjusted with value-weighted CRSPreturn on analyst coverage, split specification and firm characteristics. The first number in each cell is the coefficient and thesecond number is the t-statistic.*** Indicates significance at 0.01 level.
Analyst coverage and market reaction around stock split announcements 139
Dow
nloa
ded
by [
Uni
vers
ity O
f M
aryl
and]
at 0
9:23
10
Oct
ober
201
4
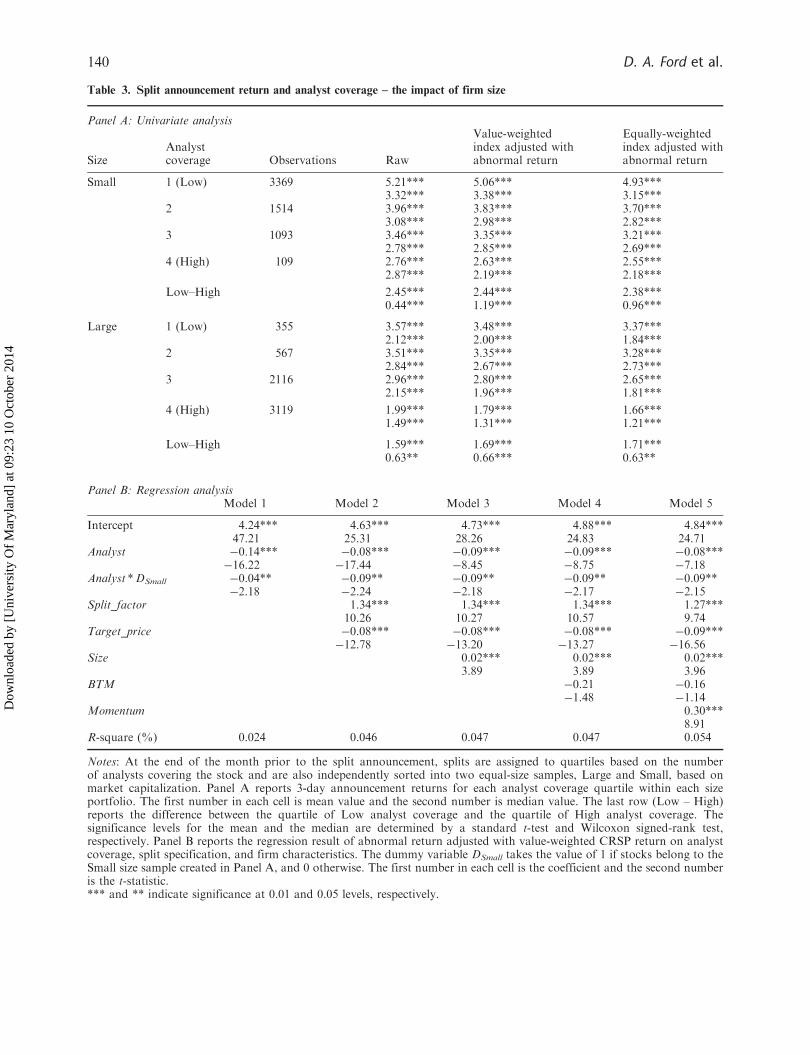
Table 3. Split announcement return and analyst coverage – the impact of firm size
Panel A: Univariate analysis
SizeAnalystcoverage Observations Raw
Value-weightedindex adjusted withabnormal return
Equally-weightedindex adjusted withabnormal return
Small 1 (Low) 3369 5.21*** 5.06*** 4.93***3.32*** 3.38*** 3.15***
2 1514 3.96*** 3.83*** 3.70***3.08*** 2.98*** 2.82***
3 1093 3.46*** 3.35*** 3.21***2.78*** 2.85*** 2.69***
4 (High) 109 2.76*** 2.63*** 2.55***2.87*** 2.19*** 2.18***
Low–High 2.45*** 2.44*** 2.38***0.44*** 1.19*** 0.96***
Large 1 (Low) 355 3.57*** 3.48*** 3.37***2.12*** 2.00*** 1.84***
2 567 3.51*** 3.35*** 3.28***2.84*** 2.67*** 2.73***
3 2116 2.96*** 2.80*** 2.65***2.15*** 1.96*** 1.81***
4 (High) 3119 1.99*** 1.79*** 1.66***1.49*** 1.31*** 1.21***
Low–High 1.59*** 1.69*** 1.71***0.63** 0.66*** 0.63**
Panel B: Regression analysisModel 1 Model 2 Model 3 Model 4 Model 5
Intercept 4.24*** 4.63*** 4.73*** 4.88*** 4.84***47.21 25.31 28.26 24.83 24.71
Analyst �0.14*** �0.08*** �0.09*** �0.09*** �0.08***�16.22 �17.44 �8.45 �8.75 �7.18
Analyst *DSmall �0.04** �0.09** �0.09** �0.09** �0.09**�2.18 �2.24 �2.18 �2.17 �2.15
Split_factor 1.34*** 1.34*** 1.34*** 1.27***10.26 10.27 10.57 9.74
Target_price �0.08*** �0.08*** �0.08*** �0.09***�12.78 �13.20 �13.27 �16.56
Size 0.02*** 0.02*** 0.02***3.89 3.89 3.96
BTM �0.21 �0.16�1.48 �1.14
Momentum 0.30***8.91
R-square (%) 0.024 0.046 0.047 0.047 0.054
Notes: At the end of the month prior to the split announcement, splits are assigned to quartiles based on the numberof analysts covering the stock and are also independently sorted into two equal-size samples, Large and Small, based onmarket capitalization. Panel A reports 3-day announcement returns for each analyst coverage quartile within each sizeportfolio. The first number in each cell is mean value and the second number is median value. The last row (Low – High)reports the difference between the quartile of Low analyst coverage and the quartile of High analyst coverage. Thesignificance levels for the mean and the median are determined by a standard t-test and Wilcoxon signed-rank test,respectively. Panel B reports the regression result of abnormal return adjusted with value-weighted CRSP return on analystcoverage, split specification, and firm characteristics. The dummy variable DSmall takes the value of 1 if stocks belong to theSmall size sample created in Panel A, and 0 otherwise. The first number in each cell is the coefficient and the second numberis the t-statistic.*** and ** indicate significance at 0.01 and 0.05 levels, respectively.
140 D. A. Ford et al.
Dow
nloa
ded
by [
Uni
vers
ity O
f M
aryl
and]
at 0
9:23
10
Oct
ober
201
4
2.45% (0.44%); all numbers are statistically signifi-cant. In terms of abnormal return, the average(median) difference between those two quartiles isabout 2.4% (1.0%), statistically significant. Whenwe look at the large size sample, while the differ-ences between Low quartile and High quartileare statistically significant, the magnitude of thedifferences is less than half the difference in the smallsize sample; the average (median) difference inraw return, as well as in abnormal return, is around1.5% (0.6%).
In Panel B of Table 3, we report regression resultsregarding the impact of analyst coverage conditionalon market capitalization. We introduce a dummyvariable, DSmall, which equals 1 if stocks belong to thesmall size sample and 0 otherwise. The general modelused is
ab return ¼ �þ �1 � Analystþ �2 � Analyst �Dsmall
þ �3 � Split factorþ �4 � Target price
þ �5 � Sizeþ �6 � BTM
þ �7 �Momentumþ "
The coefficient �1 on the variable Analyst indicatesthe impact of analysts’ coverage on stocks in the largesize sample, while the coefficient �2 on the productbetween Analyst and the dummy variable DSmall
(Analyst *DSmall) captures the difference in analysts’impact between small and large size samples.Consistent with the univariate results, the coefficient�1 on Analyst for all models is negative and signif-icantly less than 0, which suggests that for large sizesamples, market reaction around the announcementof stock splits is negatively related to the number ofanalysts following. More importantly, the fact thatthe coefficient �2 on Analyst *DSmall is also negativeand significant indicates that for small size samples,analysts following helps to reduce market reactionto split announcement more than in the case of largesize samples.
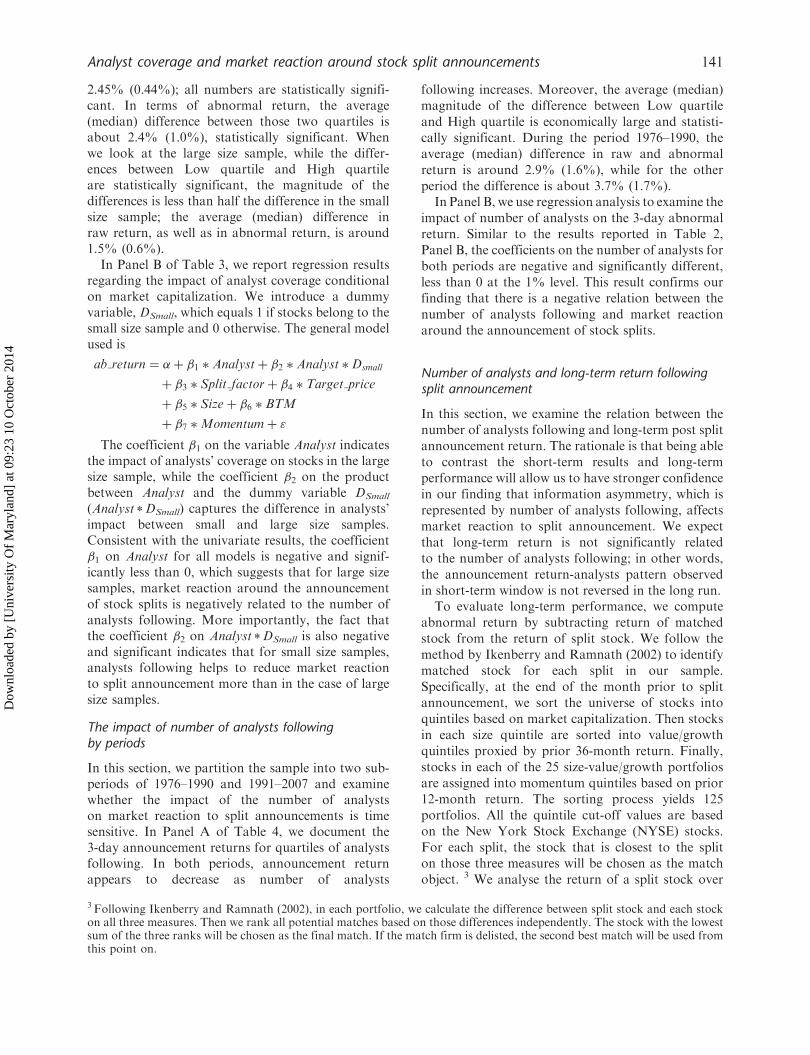
The impact of number of analysts followingby periods
In this section, we partition the sample into two sub-periods of 1976–1990 and 1991–2007 and examinewhether the impact of the number of analystson market reaction to split announcements is timesensitive. In Panel A of Table 4, we document the3-day announcement returns for quartiles of analystsfollowing. In both periods, announcement returnappears to decrease as number of analysts
following increases. Moreover, the average (median)magnitude of the difference between Low quartileand High quartile is economically large and statisti-cally significant. During the period 1976–1990, theaverage (median) difference in raw and abnormalreturn is around 2.9% (1.6%), while for the otherperiod the difference is about 3.7% (1.7%).
In Panel B, we use regression analysis to examine theimpact of number of analysts on the 3-day abnormalreturn. Similar to the results reported in Table 2,Panel B, the coefficients on the number of analysts forboth periods are negative and significantly different,less than 0 at the 1% level. This result confirms ourfinding that there is a negative relation between thenumber of analysts following and market reactionaround the announcement of stock splits.
Number of analysts and long-term return followingsplit announcement
In this section, we examine the relation between thenumber of analysts following and long-term post splitannouncement return. The rationale is that being ableto contrast the short-term results and long-termperformance will allow us to have stronger confidencein our finding that information asymmetry, which isrepresented by number of analysts following, affectsmarket reaction to split announcement. We expectthat long-term return is not significantly relatedto the number of analysts following; in other words,the announcement return-analysts pattern observedin short-term window is not reversed in the long run.
To evaluate long-term performance, we computeabnormal return by subtracting return of matchedstock from the return of split stock. We follow themethod by Ikenberry and Ramnath (2002) to identifymatched stock for each split in our sample.Specifically, at the end of the month prior to splitannouncement, we sort the universe of stocks intoquintiles based on market capitalization. Then stocksin each size quintile are sorted into value/growthquintiles proxied by prior 36-month return. Finally,stocks in each of the 25 size-value/growth portfoliosare assigned into momentum quintiles based on prior12-month return. The sorting process yields 125portfolios. All the quintile cut-off values are basedon the New York Stock Exchange (NYSE) stocks.For each split, the stock that is closest to the spliton those three measures will be chosen as the matchobject. 3 We analyse the return of a split stock over
3 Following Ikenberry and Ramnath (2002), in each portfolio, we calculate the difference between split stock and each stockon all three measures. Then we rank all potential matches based on those differences independently. The stock with the lowestsum of the three ranks will be chosen as the final match. If the match firm is delisted, the second best match will be used fromthis point on.
Analyst coverage and market reaction around stock split announcements 141
Dow
nloa
ded
by [
Uni
vers
ity O
f M
aryl
and]
at 0
9:23
10
Oct
ober
201
4
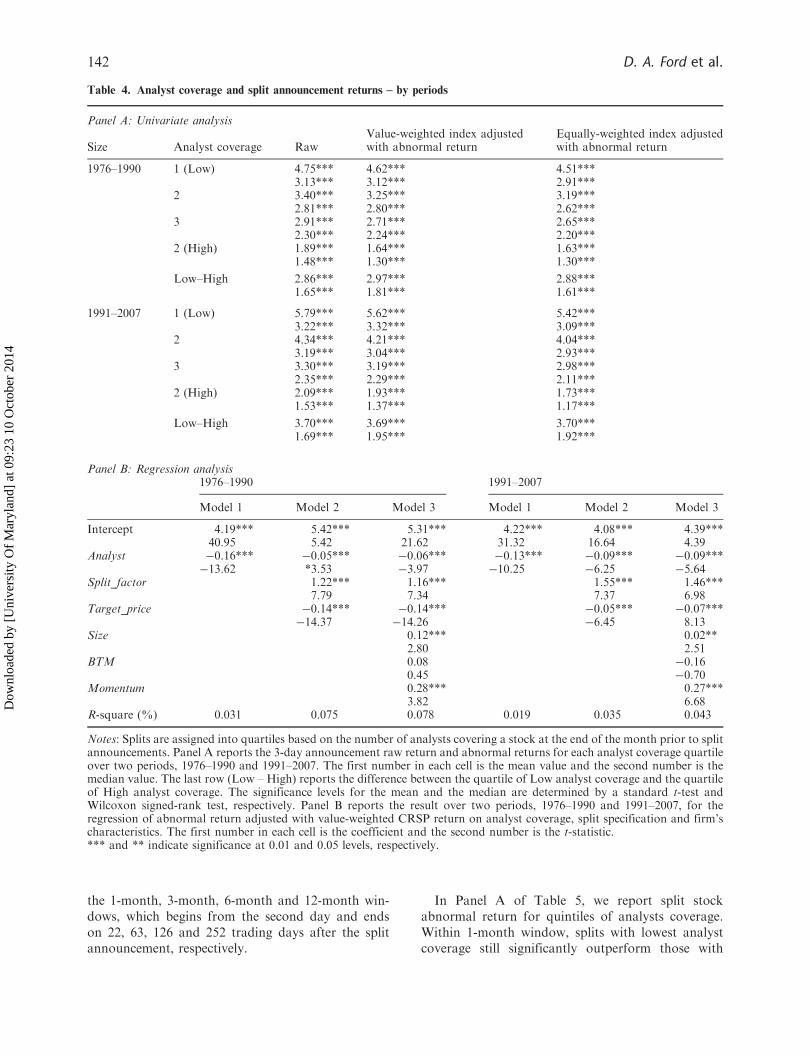
the 1-month, 3-month, 6-month and 12-month win-dows, which begins from the second day and endson 22, 63, 126 and 252 trading days after the splitannouncement, respectively.
In Panel A of Table 5, we report split stockabnormal return for quintiles of analysts coverage.Within 1-month window, splits with lowest analystcoverage still significantly outperform those with
Table 4. Analyst coverage and split announcement returns – by periods
Panel A: Univariate analysis
Size Analyst coverage RawValue-weighted index adjustedwith abnormal return
Equally-weighted index adjustedwith abnormal return
1976–1990 1 (Low) 4.75*** 4.62*** 4.51***3.13*** 3.12*** 2.91***
2 3.40*** 3.25*** 3.19***2.81*** 2.80*** 2.62***
3 2.91*** 2.71*** 2.65***2.30*** 2.24*** 2.20***
2 (High) 1.89*** 1.64*** 1.63***1.48*** 1.30*** 1.30***
Low–High 2.86*** 2.97*** 2.88***1.65*** 1.81*** 1.61***
1991–2007 1 (Low) 5.79*** 5.62*** 5.42***3.22*** 3.32*** 3.09***
2 4.34*** 4.21*** 4.04***3.19*** 3.04*** 2.93***
3 3.30*** 3.19*** 2.98***2.35*** 2.29*** 2.11***
2 (High) 2.09*** 1.93*** 1.73***1.53*** 1.37*** 1.17***
Low–High 3.70*** 3.69*** 3.70***1.69*** 1.95*** 1.92***
Panel B: Regression analysis1976–1990 1991–2007
Model 1 Model 2 Model 3 Model 1 Model 2 Model 3
Intercept 4.19*** 5.42*** 5.31*** 4.22*** 4.08*** 4.39***40.95 5.42 21.62 31.32 16.64 4.39
Analyst �0.16*** �0.05*** �0.06*** �0.13*** �0.09*** �0.09***�13.62 *3.53 �3.97 �10.25 �6.25 �5.64
Split_factor 1.22*** 1.16*** 1.55*** 1.46***7.79 7.34 7.37 6.98
Target_price �0.14*** �0.14*** �0.05*** �0.07***�14.37 �14.26 �6.45 8.13
Size 0.12*** 0.02**2.80 2.51
BTM 0.08 �0.160.45 �0.70
Momentum 0.28*** 0.27***3.82 6.68
R-square (%) 0.031 0.075 0.078 0.019 0.035 0.043
Notes: Splits are assigned into quartiles based on the number of analysts covering a stock at the end of the month prior to splitannouncements. Panel A reports the 3-day announcement raw return and abnormal returns for each analyst coverage quartileover two periods, 1976–1990 and 1991–2007. The first number in each cell is the mean value and the second number is themedian value. The last row (Low – High) reports the difference between the quartile of Low analyst coverage and the quartileof High analyst coverage. The significance levels for the mean and the median are determined by a standard t-test andWilcoxon signed-rank test, respectively. Panel B reports the result over two periods, 1976–1990 and 1991–2007, for theregression of abnormal return adjusted with value-weighted CRSP return on analyst coverage, split specification and firm’scharacteristics. The first number in each cell is the coefficient and the second number is the t-statistic.*** and ** indicate significance at 0.01 and 0.05 levels, respectively.
142 D. A. Ford et al.
Dow
nloa
ded
by [
Uni
vers
ity O
f M
aryl
and]
at 0
9:23
10
Oct
ober
201
4
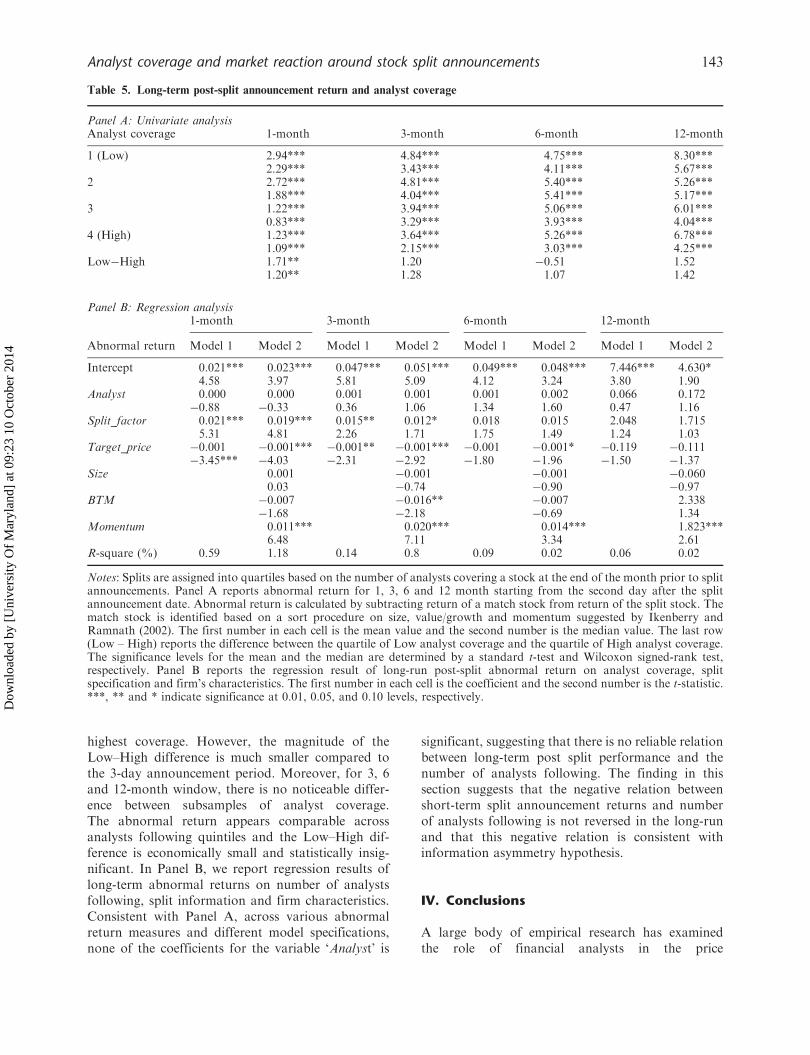
highest coverage. However, the magnitude of theLow–High difference is much smaller compared tothe 3-day announcement period. Moreover, for 3, 6and 12-month window, there is no noticeable differ-ence between subsamples of analyst coverage.The abnormal return appears comparable acrossanalysts following quintiles and the Low–High dif-ference is economically small and statistically insig-nificant. In Panel B, we report regression results oflong-term abnormal returns on number of analystsfollowing, split information and firm characteristics.Consistent with Panel A, across various abnormalreturn measures and different model specifications,none of the coefficients for the variable ‘Analyst’ is
significant, suggesting that there is no reliable relationbetween long-term post split performance and thenumber of analysts following. The finding in thissection suggests that the negative relation betweenshort-term split announcement returns and numberof analysts following is not reversed in the long-runand that this negative relation is consistent withinformation asymmetry hypothesis.
IV. Conclusions
A large body of empirical research has examinedthe role of financial analysts in the price
Table 5. Long-term post-split announcement return and analyst coverage
Panel A: Univariate analysisAnalyst coverage 1-month 3-month 6-month 12-month
1 (Low) 2.94*** 4.84*** 4.75*** 8.30***2.29*** 3.43*** 4.11*** 5.67***
2 2.72*** 4.81*** 5.40*** 5.26***1.88*** 4.04*** 5.41*** 5.17***
3 1.22*** 3.94*** 5.06*** 6.01***0.83*** 3.29*** 3.93*** 4.04***
4 (High) 1.23*** 3.64*** 5.26*** 6.78***1.09*** 2.15*** 3.03*** 4.25***
Low�High 1.71** 1.20 �0.51 1.521.20** 1.28 1.07 1.42
Panel B: Regression analysis1-month 3-month 6-month 12-month
Abnormal return Model 1 Model 2 Model 1 Model 2 Model 1 Model 2 Model 1 Model 2
Intercept 0.021*** 0.023*** 0.047*** 0.051*** 0.049*** 0.048*** 7.446*** 4.630*4.58 3.97 5.81 5.09 4.12 3.24 3.80 1.90
Analyst 0.000 0.000 0.001 0.001 0.001 0.002 0.066 0.172�0.88 �0.33 0.36 1.06 1.34 1.60 0.47 1.16
Split_factor 0.021*** 0.019*** 0.015** 0.012* 0.018 0.015 2.048 1.7155.31 4.81 2.26 1.71 1.75 1.49 1.24 1.03
Target_price �0.001 �0.001*** �0.001** �0.001*** �0.001 �0.001* �0.119 �0.111�3.45*** �4.03 �2.31 �2.92 �1.80 �1.96 �1.50 �1.37
Size 0.001 �0.001 �0.001 �0.0600.03 �0.74 �0.90 �0.97
BTM �0.007 �0.016** �0.007 2.338�1.68 �2.18 �0.69 1.34
Momentum 0.011*** 0.020*** 0.014*** 1.823***6.48 7.11 3.34 2.61
R-square (%) 0.59 1.18 0.14 0.8 0.09 0.02 0.06 0.02
Notes: Splits are assigned into quartiles based on the number of analysts covering a stock at the end of the month prior to splitannouncements. Panel A reports abnormal return for 1, 3, 6 and 12 month starting from the second day after the splitannouncement date. Abnormal return is calculated by subtracting return of a match stock from return of the split stock. Thematch stock is identified based on a sort procedure on size, value/growth and momentum suggested by Ikenberry andRamnath (2002). The first number in each cell is the mean value and the second number is the median value. The last row(Low – High) reports the difference between the quartile of Low analyst coverage and the quartile of High analyst coverage.The significance levels for the mean and the median are determined by a standard t-test and Wilcoxon signed-rank test,respectively. Panel B reports the regression result of long-run post-split abnormal return on analyst coverage, splitspecification and firm’s characteristics. The first number in each cell is the coefficient and the second number is the t-statistic.***, ** and * indicate significance at 0.01, 0.05, and 0.10 levels, respectively.
Analyst coverage and market reaction around stock split announcements 143
Dow
nloa
ded
by [
Uni
vers
ity O
f M
aryl
and]
at 0
9:23
10
Oct
ober
201
4

formation process. In this article, we investigate theinfluence of analyst coverage on market reactionaround the announcement of stock splits. Eventhough splits should be a cosmetic event in corporatefinance, the announcements of splits are accompaniedby significant market reaction. We find that stocksfollowed by more analysts experience lower returnsover the 3-day period centered on the days of splitannouncements. Additionally, the negative relationbetween analysts following and split announcementreturn appears to be stronger for the small capital-ization sample than for the large capitalizationsample.
This finding supports the general view that theservices provided by financial analysts help to reducethe information asymmetry between mangers andinvestors. The better information environment inturn reduces market reaction to announcements ofcorporate events. This impact of analysts followingis more powerful for small capitalization stocks,since those firms are subject to more severe informa-tion asymmetry. The finding of a negative relationbetween number of analysts following and marketreaction to split announcements also sheds new lighton the debate over the motivation of stock splits.This finding appears to be more consistent with thesignalling hypothesis, which argues that managers usestock splits to communicate private information tothe public. We argue that because analysts improvethe information environment, they help reducethe value of information possessed by managers,and therefore market reaction should be weakerfor firms followed by more analysts. As a robustnesscheck, we document that there is no significantrelation between long-run performance of split andnumber of analysts following, which suggests thereis no reversal in the return-analyst pattern over thelong run.
Acknowledgements
The authors would like to thank Mark Taylor (theeditor) and an anonymous referee for their commentswhich significantly improved the focus of this article.The views expressed are those of the authors and theyassume full responsibility of all errors and omissions.
References
Angel, J. (1997) Tick size, share prices, and stock splits,Journal of Finance, 52, 655–81.
Asquith, P., Healy, P. and Palepu, K. (1989) Earnings andstock splits, Accounting Review, 64, 387–403.
Ayers, B. and Freeman, R. (2003) Evidence that analystfollowing and institutions accelerate the pricing offuture earnings, Review of Accounting Studies, 8,47–67.
Brennan, M. and Hughes, P. (1991) Stock prices and thesupply of information, Journal of Finance, 46,1665–91.
Brennan, M., Jegadeesh, N. and Swaminathan, B. (1993)Investment analysis and the adjustment of stock pricesto common information, Review of Financial Studies,6, 799–824.
Chung, H. and Jo, H. (1996) The impact of securityanalysts’ monitoring and marketing functions on themarket value of firms, Journal of Financial andQuantitative Analysis, 31, 493–512.
Conroy, R. and Harris, R. (1999) Stock splits andinformation: the role of share price, FinancialManagement, 28, 28–40.
Conroy, R., Harris, R. and Benet, B. (1990) The effects ofstock splits on bid–ask spreads, Journal of Finance, 45,1285–94.
Copeland, T. (1979) Liquidity changes following stocksplits, Journal of Finance, 34, 115–41.
Dennis, P. (2003) Stock splits and liquidity: the case of theNasdaq-100 index tracking stock, Financial Review, 38,415–33.
Desai, H. and Jain, P. (1997) Long-run common stockreturns following stock splits and reverse splits,Journal of Business, 70, 409–33.
Desai, A., Nimalendran, M. and Venkataraman, S. (1998)Changes in trading activity following stock splits andtheir effect on volatility and the adverse-informationcomponent of the bid–ask spread, Journal of FinancialResearch, 21, 159–83.
Gray, F., Smith, T. and Whaley, E. (2003) Stock splits:implications for investor trading costs, Journal ofEmpirical Finance, 10, 271–303.
Griffin, J. and Lemmon, M. (2002) Book-to-market equity,distress risk, and stock returns, The Journal of Finance,57, 2317–36.
Grinblatt, M., Masulis, R. and Titman, S. (1984) Thevaluation effects of stock splits and stock dividends,Journal of Financial Economics, 4, 461–90.
Hong, H., Lim, T. and Stein, J. (2000) Bad news travelsslowly: size, analyst coverage, and the profitability ofmomentum strategies, The Journal of Finance, 55,265–95.
Hwang, S., Keswani, A. and Shackleton, M. (2008)Surprise versus anticipated information announce-ments: are prices affected differently? An investigationin the context of stock splits, Journal of Banking andFinance, 32, 643–53.
Ikenberry, D. and Ramnath, S. (2002) Underreaction toself-selected news events: the case of stock splits, TheReview of Financial Studies, 15, 489–526.
Ikenberry, D., Rankine, G. and Stice, E. (1996) What dostock splits really signal?, Journal of Financial andQuantitative Analysis, 31, 357–75.
Jensen, M. and Meckling, W. (1976) Theory of the firm:managerial behavior, agency costs and ownershipstructure, Journal of Financial Economics, 3, 305–60.
Lakonishok, J. and Lev, B. (1987) Stock splits and stockdividends: why, who, and when, Journal of Finance, 42,913–32.
144 D. A. Ford et al.
Dow
nloa
ded
by [
Uni
vers
ity O
f M
aryl
and]
at 0
9:23
10
Oct
ober
201
4

Lamoureux, C. and Poon, P. (1987) The market reactionto stock splits, Journal of Finance, 42, 1347–70.
Maloney, M. and Mulherin, H. (1992) The effects ofsplitting on the Ex: a microstructure reconciliation,Financial Management, 21, 10–11.
Schultz, P. (2000) Stock splits, tick size, and sponsorship,Journal of Finance, 55, 429–50.
Womack, K. (1996) Do brokerage analysts’ recommenda-tions have investment value?, Journal of Finance, 51,137–67.
Analyst coverage and market reaction around stock split announcements 145
Dow
nloa
ded
by [
Uni
vers
ity O
f M
aryl
and]
at 0
9:23
10
Oct
ober
201
4