analyti cal tools - food and agriculture organization · equivalence scales objective methods 1 1...
TRANSCRIPT

ANALYTICAL TOOLS
Equivalence Scales Objective Methods
Module 034

Equivalence Scales Objective Methods by
Lorenzo Giovanni Bellù, Agricultural Policy Support Service, Policy Assistance Division, FAO, Rome, Italy
Paolo Liberati, University of Urbino, "Carlo Bo", Institute of Economics, Urbino, Italy for the Food and Agriculture Organization of the United Nations, FAO
About EASYPol EASYPol is a an on-line, interactive multilingual repository of downloadable resource materials for capacity development in policy making for food, agriculture and rural development. The EASYPol home page is available at: www.fao.org/tc/easypol. EASYPol has been developed and is maintained by the Agricultural Policy Support Service, FAO.
The designations employed and the presentation of the material in this information product do not imply the expression of any opinion whatsoever on the part of the Food and Agriculture Organization of the United Nations concerning the legal status of any country, territory, city or area or of its authorities, or concerning the delimitation of its frontiers or boundaries.
© FAO November 2005: All rights reserved. Reproduction and dissemination of material contained on FAO's Web site for educational or other non-commercial purposes are authorized without any prior written permission from the copyright holders provided the source is fully acknowledged. Reproduction of material for resale or other commercial purposes is prohibited without the written permission of the copyright holders. Applications for such permission should be addressed to: [email protected].

Equivalence Scales Objective Methods
Table of Contents
1 Summary.................................................................................. 1
2 Introduction .............................................................................. 1
3 Conceptual background............................................................... 2
3.1 Objective methods – The Engel method ...................................... 2 3.2 Objective methods - Rothbarth and the Isolevel method................ 7 3.3 Objective methods - The utility-based approach ........................... 9
4 A numerical example to calculate equivalence scales after econometric estimate ..................................................................................10
4.1 A numerical example for the Engel method ............................... 10 4.2 A numerical example for the Rothbarth method ......................... 10
5 Readers’ notes..........................................................................11
5.1 Time requirements ................................................................. 11 5.2 Frequently asked questions ..................................................... 11
6 Appendix – Steps for the utility-based approach ............................12
7 References and further readings..................................................12
Module metadata .............................................................................12


Equivalence Scales Objective Methods
1
1 SUMMARY
This module illustrates how to use objective methods to derive Equivalence scales. The focus will be on the Engel method, on the Rothbarth method and on the Utility-based methods. The main difference between these methods is that the first two are based on proxy variables for the household well-being, while the last set of methods is based on the consideration of the overall preferences revealed by consumers.
2 INTRODUCTION
Objectives
The aim of this module is to give the analyst the necessary tool to properly derive equivalence scales on the basis of objective methods1.
Target audience
This module targets all policy analysts who works in public administrations (central and local), NGOs, political parties, professional organizations or in consulting firms that are willing to enhance their expertise in analyzing inequality and poverty issues at household level. Lecturers in selected undergraduate courses in economics and related fields may also be interested in using this material for academic purposes.
Required background
The trainer is strongly recommended to verify how adequate the trainees’ background is, notably their understanding of the concepts of “income distribution”, “social welfare” and the general concepts of equivalence scales. If their background is weak or missing, the trainer may consider delivering other EASYPol Modules beforehand, as highlighted above. Other technicalities present in this module should be understood by all people with an elementary knowledge of basic mathematics and statistics. A complete set links of other related EASYPol modules are included at the end of this module. However, users will also find links to related material throughout the text where relevant2.
1 This module is a further step in studying equivalence scales and should not be delivered before EASYPol Module 032: Equivalence Scales: General Aspects. It may also be useful to go through EASYPol Module 033: Equivalence Scales: Subjective Methods before delivering this module. 2 EASYPol hyperlinks are shown in blue, as follows:
a) training paths are shown in underlined bold font; b) other EASYPol modules or complementary EASYPol materials are in bold underlined italics; c) links to the glossary are in bold; and d) external links are in italics.

EASYPol Module 034 Analytical Tools
2
3 CONCEPTUAL BACKGROUND
Objective methods are based on observed behaviour. These methods can be broadly divided into two sub-sets. The first set contains those objective methods that are based on the identification of a proxy variable for household well-being. The first attempts of deriving equivalence scales in such a way may be dated back to Engel, 1895, Rowntree, 1901, in his popular study on the poverty in York, and Rothbarth, 1941. The second set contains those objective methods that are based on considerations of the overall revealed consumers’ preferences. In both cases, an econometric approach is required, which is either based on a single-equation analysis or on a multiple-equation analysis.
3.1 Objective methods – The Engel method
The Engel method is based on the observation that, for any given household composition, the share of food expenditures on total expenditures is inversely related to income. From this empirical regularity, Engel derived that the share of food expenditures could be assumed as an appropriate welfare indicator to compare households of different compositions. In this way, two households of different sizes or composition but with the same share of food with total expenditures could be thought of as having the same level of welfare.
Figure 1 - The Engel method
Figure 1 shows the Engel hypothesis for two different households, one with no children and the other with one child. The y-axis reports the Engel indicator of welfare, the share of food on total expenditures, while the x-axis reports the level of income. The figure postulates that at any given level of income, the household with one child has a lower level of welfare (i.e. a greater food share). Alternatively, at any given level of welfare, say w0, the household with one child needs more income. The ratio between the nominal incomes of the two households at w0 (y1/y0) would give the additional cost of achieving the same level of welfare with a different household composition.

Equivalence Scales Objective Methods
3
From Engel’s work, a more general approach has been developed, taking into account that either different commodities or groups of commodities (e.g. food and clothing) may be assumed as a welfare indicator. This approach is technically known as the «iso-prop» method, because the welfare indicator is always the proportion of some good on total expenditures.3 The Engel method may therefore be considered as a special case of the iso-prop method, the one considering food share as a welfare indicator. The Engel method has two major drawbacks. The first is that it generally overstates the «true» cost of children. Intuitively, suppose that a child is added to a household and the household is exactly compensated to maintain the previous level of welfare. Since the child is likely to be mainly food-consuming, a very large part of the compensation will be spent on food. It means that the marginal consumption of food will be higher than the average and the household food share will rise. It implies that after an exact compensation, the share of food will be higher than before that same compensation. Using the Engel method would reveal that, even though the household has been perfectly compensated by assumption, its level of welfare has declined. Therefore, the Engel method would pay more than the exact compensation.
Figure 2 - The Engel method overestimates exact compensation
The example demonstrates this point. In the table included in Figure 2, above, the hypothesis is made about total food and non-food expenditures of a household which is firstly with no children and then with one child. With no children, the food share would be 30 per cent. Suppose a child arrives and also suppose that the «true» compensation 3 Watts, 1967, and Seneca and Taussig, 1971, are examples of the use of other goods.

EASYPol Module 034 Analytical Tools
4
is 100. If the child is mainly food-consuming it is likely that the greater part of this compensation will be devoted to food expenditures, say 70 out of 100. Food expenditure would become 370 out of a total of 1100 (the original 1000 plus the compensation). The new food share would be 33.6 per cent. By assumption, we know that the two households are at the same level of welfare. However, if we look at the graph reporting the Engel method, for a household to be at the same level of welfare than before the child arrived, it should have the same level of food share (30 per cent). Therefore, according to the Engel method, the compensation would be, by hypothesis, 200 (1200-1000). In all these cases, the Engel method overestimates the true cost of additional members. The second drawback is that equivalence scales estimated by the Engel method have a common value across the income distribution only if Engel curves are parallel straight lines. In this latter case, the distance between nominal incomes in Figure 2, above, would be the same whatever the level of welfare chosen. This property of the equivalence scales is known as «BASE-INDEPENDENCE», by which the equivalence scale λ is independent of the expenditure level at which it is calculated. However, data generally reveal that Engel curves are not linear. This means that equivalence scales may assume different values at different levels of expenditures. In this latter case, equivalence scales may depend on the household expenditure level. Figure 3 illustrates this case.
Figure 3 - Non-linear engel curves and equivalence scales
Now the equivalence scale y1/y0 calculated at the welfare level w0 differs from the equivalence scale y3/y2 calculated at the welfare level w1. Incidentally, this effect is present also when Engel curves are linear but not parallel. It should be clear that calculating equivalence scales using the Engel method implies that we know the relation between food share and income. This relation is usually estimated by econometric methods. A simple way to estimate this relation and the corresponding equivalence scale is to use a functional form for the Engel curve LINEAR in the logarithm of total expenditure.
Equivalence Scales Objective Methods
5
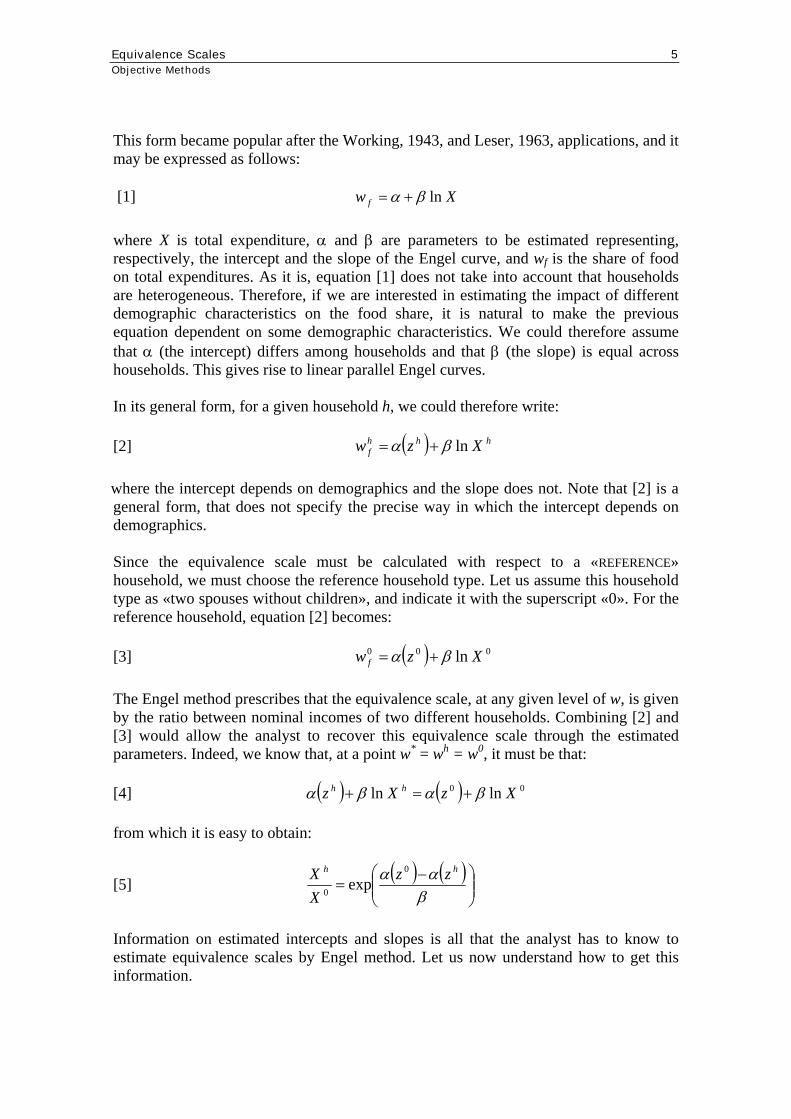
This form became popular after the Working, 1943, and Leser, 1963, applications, and it may be expressed as follows: [1] Xw f lnβα += where X is total expenditure, α and β are parameters to be estimated representing, respectively, the intercept and the slope of the Engel curve, and wf is the share of food on total expenditures. As it is, equation [1] does not take into account that households are heterogeneous. Therefore, if we are interested in estimating the impact of different demographic characteristics on the food share, it is natural to make the previous equation dependent on some demographic characteristics. We could therefore assume that α (the intercept) differs among households and that β (the slope) is equal across households. This gives rise to linear parallel Engel curves. In its general form, for a given household h, we could therefore write: [2] ( ) hhh
f Xzw lnβα += where the intercept depends on demographics and the slope does not. Note that [2] is a general form, that does not specify the precise way in which the intercept depends on demographics. Since the equivalence scale must be calculated with respect to a «REFERENCE» household, we must choose the reference household type. Let us assume this household type as «two spouses without children», and indicate it with the superscript «0». For the reference household, equation [2] becomes: [3] ( ) 000 ln Xzw f βα += The Engel method prescribes that the equivalence scale, at any given level of w, is given by the ratio between nominal incomes of two different households. Combining [2] and [3] would allow the analyst to recover this equivalence scale through the estimated parameters. Indeed, we know that, at a point w* = wh = w0, it must be that: [4] ( ) ( ) 00 lnln XzXz hh βαβα +=+ from which it is easy to obtain:
[5] ( ) ( )
⎟⎟⎠
⎞⎜⎜⎝
⎛ −=
βαα hh zz
XX 0
0 exp
Information on estimated intercepts and slopes is all that the analyst has to know to estimate equivalence scales by Engel method. Let us now understand how to get this information.

EASYPol Module 034 Analytical Tools
6
An easy way to implement this approach is to include in [2] intercept dummy variables for each household type. Let us assume, for example, that the analyst is interested in the additional cost of having, respectively, one child (OC), two children (TC) and more than two children (MTC) compared with the reference household type (no children, NC). With dummy variables, the general model would have the following form: [6] MTCTCOCXw hh
f 4321 ln αααβα ++++= where OC, TC and MTC assume value 1 if the household is of the corresponding type and zero otherwise. In other words, the general model [6] would embody four different sub-models, one for each household type:
[7] ( )( )( ) MTCMTC
f
TCTCf
OCOCf
NCNCf
Xw
Xw
Xw
Xw
ln
ln
ln
ln
41
31
21
1
βαα
βαα
βαα
βα
++=
++=
++=
+=
From [6], equivalence scales are easily recovered by noting that, at the same level of welfare w:
[8]
βαβαβα
4
3
2
lnln
lnln
lnln
−=−
−=−
−=−
NCMTC
NCTC
NCOC
XX
XX
XX
Transforming logarithms, we can obtain the final form for Engel equivalence scales
[9]
⎟⎟⎠
⎞⎜⎜⎝
⎛−==
⎟⎟⎠
⎞⎜⎜⎝
⎛−==
⎟⎟⎠
⎞⎜⎜⎝
⎛−==
βα
λ
βα
λ
βα
λ
4
3
2
exp
exp
exp
NC
MTCMTC
NC
TCTC
NC
OCOC
XX
XX
XX
which is the form discussed above in the theoretical section. Obviously, for the reference household it will be , which simply says that for the reference household λ=1.
0lnln =− NCNC XX
Basically, the number of dummy variables to be inserted into the general model [6] may vary according to the aim of the analysis. If the analyst wants to have precise

Equivalence Scales Objective Methods
7
information on a specific household types, a dummy variable on that household type may be a relatively easy way to gain information. Therefore, in principle, we could use as many dummy variables as household types.4
3.2 Objective methods: Rothbarth and the Isolevel method
A rather similar method has been advanced by Rothbarth, 1941. This method assumes «adult goods» as the appropriate welfare indicator. Adult goods are those goods that are consumed only by adults and not by children (e.g. alcoholic drinks, tobacco, etc.). In this context, two households are at the same level of welfare if they have the same absolute level of expenditures on those goods, from which the term «isolevel». The intuitive reason is that when a child arrives it is likely that consumption of adult goods falls for a given level of income. Lower levels of adult goods would mean lower levels of welfare for adults. As in the Engel case, the ratio between nominal incomes of the two households would give the additional cost of having the same welfare at a different composition.
Figure 5 - The Rothbarth method
Figure 5 illustrates this method. Adult goods may be, say, tobacco. For any given level of income, the household with one child consumes less adult goods than the household with no children. Therefore, at a given level of welfare (the same absolute level of tobacco), the household with one child needs more income. The equivalence scale at the level w0 is the ratio y1/y0. Using this appealing methodology implies that we consider some important warnings. As in the Engel method, equivalence scales have a unique value only if the curves are parallel, otherwise the equivalence scale will depend on the income level.
4 Just to recall that extending the number of parameters to be estimated is less likely to create problems if the number of observations used is large. For small samples, the gain of adding regressors must be balanced with the loss in efficiency of the estimate (less degrees of freedom).

EASYPol Module 034 Analytical Tools
8
It requires that the preference structure of adults remain invariable after the child arrives and that consumption be only affected by the income effect, i.e. the lower amount of available resources. This latter condition is technically denoted as «DEMOGRAPHIC SEPARABILITY» and implies that the relative price of adult goods, with respect to other goods, does not change. Some adult goods (tobacco, alcohol) may be inelastic with respect to income. When this is the case, the Rothbarth method would give no equivalence scale. If the same absolute level is consumed at all income levels, there is no way to calculate the compensation for different household sizes. Using the Rothbarth method analysts can only estimate the cost of children and not that of additional adults. To achieve this aim, we could find some goods that are consumed by one adult and not by another, which is rather difficult. The Rothbarth method is likely to underestimate the true cost of children. Figure 6, below, embodies and example showing this conclusion, again assuming that a child is added to a household initially with no children. After the true compensation, it is likely that the marginal propensity of spending on adult goods is less than the marginal propensity of spending on other goods (including those jointly consumed by adults and children). In the example, tobacco expenditures grow from 300 to 320, with only 20 per cent of the increase devoted to them. By assumption, our household would be at the same level of welfare with tobacco expenditures of 300 before the child and tobacco expenditures of 320 after the arrival of the child.

Equivalence Scales Objective Methods
9
Figure 6 - The Rothbarth method underestimates the cost of children
However, as already noted, the Rothbarth method implies that the same level of welfare is achieved when the same level of absolute consumption is maintained. According to the Rothbarth method, therefore, welfare would be increased after the child. This would imply, as Figure 6 shows, that the Rothbarth method would underestimate the true compensation. In the example, it would pay the household only 50, less than the true compensation. In analytical terms, the procedure to estimate equivalence scales using the Rothbarth method does not differ from that illustrated for the Engel method. The starting point, however, is not the share of some goods, rather the absolute level of adult goods. The equation corresponding to [1] for Engel method is in this case: [10] Xq A ln1 βα += where qA is the quantity of the adult good (e.g. tobacco). With this modification, the procedure illustrated above for the Engel method may be replicated for the Rothbarth method.
3.3 Objective methods: The utility-based approach
Utility-based approaches are directly founded on consumer preferences. This way of estimating equivalence scales is therefore the most theoretically consistent, among the methods here discussed, but it is also both the most time consuming and the most technically complex. Given the particular advanced nature of this approach, it will not be discussed further at this stage. However, the Appendix provides information on the main steps that are needed to implement this approach.

EASYPol Module 034 Analytical Tools
10
4 A NUMERICAL EXAMPLE TO CALCULATE EQUIVALENCE SCALES AFTER ECONOMETRIC ESTIMATE
4.1 A numerical example for the Engel method
At this stage it may be of some importance to understand the basic functioning of the objective methods, by assuming that the econometric technique has been developed. Let us start with the Engel method. Suppose that equation [6] was estimated with the following statistical significant results: [11] { { )(085.0)(057.0)(043.0)(ln17.053.1
4321
MTCTCOCXw f 321321321αααβα
+++−=
Applying equation [9] and the observation that for the reference household λ=1, we get
the following equivalence scale by simply using the estimated coefficients:
TWO ADULTS NO CHILDREN 1
TWO ADULTS ONE CHILD 1.288
TWO ADULTS TWO CHILDREN 1.398
TWO ADULTS MORE THAN THREE CHILDREN 1.649
4.2 A numerical example for the Rothbarth method
Let’s consider now the case of the Rothbarth method, using only the one-child case. Let us assume that the estimation has given the following results: [12] { { )(043.0)(ln27.03.1
21
OCXq A 321αβα
−+=
The resulting equivalence scale is obtained as before. TWO ADULTS NO CHILDREN 1
TWO ADULTS ONE CHILD 1.173

Equivalence Scales Objective Methods
11
It is worth noting that the sign of the coefficient in the Rothbarth equation is the opposite of those in the Engel equation. Engel suggested an inverse relation between food share and income (food share declines with income). Therefore a negative sign is expected in the estimated equation. Rothbarth suggests (Figure 5) a direct relation between consumption of adult goods and income. Therefore a positive sign should emerge from the estimation. Engel also suggested that, for any given level of income, food share increases with children. The sign of the coefficient of OC must therefore be positive. Rothbarth, instead, argued that, for any given level of income, consumption of adult goods decreases with children. Therefore, a negative sign on the coefficient of OC is expected.
5 READERS’ NOTES
5.1 Time requirements
The delivery of this module to an audience already familiar with the concept of equivalence scales may take about three hours.
5.2 Frequently asked questions
Frequently asked questions:
What is the proper representation of household welfare to calculate equivalence scales? Various possibilities arise. Some methods rely on defining a single type of expenditure that represents household welfare (e.g., food or tobacco). Other methods rely on the whole consumption spectrum of households.
Are the Engel method and the Rothbarth method theoretically founded? These methods are based either on empirical regularities (the Engel method) or on a definition of adult goods (the Rothbarth method). In both cases, the theoretical foundation lies in the fact that the observed consumption of specific items may represent household well-being.
How do I identify an adult good? Adults goods should be identified as those goods consumed only by adults and not by children. Lower levels of adults goods may mean lower levels of welfare.

EASYPol Module 034 Analytical Tools
12
6 APPENDIX – STEPS FOR THE UTILITY-BASED APPROACH
The steps we need to implement a utility based approach are as follows: First, define the general structure of the cost function5 from the specific class of
preferences6. Assign a functional form to the cost function. When the number of observation is
large it is not convenient to impose a specific form (e.g. linear); rather, it may be useful to choose a FLEXIBLE FUNCTIONAL FORM, i.e. a function with a large number of parameters of both first and second order (e.g. a second-order Taylor approximation).
Analytically, the derivative of the cost function with respect to prices gives rise to HICKSIAN DEMAND FUNCTIONS (Shepard’s lemma). Hicksian demands depend on prices and utility, h(u, p), therefore they are not observable. Therefore:
Multiply the Hicksian demands by the ratio between the price and the cost function to obtain an equation expressed in budget shares.
Calculate the indirect utility function from the cost function, where we have discussed that cost functions and indirect utility functions are linked by a relation of inversion).
Substitute the indirect utility function into the budget share equations to obtain the budget shares in terms of price and quantities.
7 REFERENCES AND FURTHER READINGS
Deaton A., J. Muellbauer, 1980. Economics and Consumer Behaviour, Cambridge
University Press, Cambridge, UK. Engel E., 1895. Die Lebenskosten Belgischer Arbeiter-Familien Früher and Jetzt,
International Statistical Institute Bulletin, 9, pp. 1-74. Rothbarth E., 1943. Note on a Method of Determining Equivalent Incomes for Families
of Different Composition, Appendix 4 in Madge C. (ed.), War Time Pattern of Saving and Spending, Occasional Paper No. 4, National Income of Economic and Social Research, London, UK.
Rowntree J., 1901. Poverty: A Study of Town Life, MacMillan, London, UK. Seneca J. J., Taussig M. K., 1971. Family Equivalence Scales and the Personal Income
Tax Exemptions for Children, Review of Economics and Statistics, 53, pp. 253-262.
Watts H., 1967. The Isoprop Index: An Approach to the Determination of Differential Poverty Thresholds, Journal of Human Resources, 2, pp. 3-18.
Working H., 1943. Statistical Laws of Family Expenditure, Journal of the American Statistical Association, 38, pp. 43-56.
5 See EASYPol Module 032: Equivalence Scales: General Aspects5 A cornerstone, on this point, is Deaton and Muellbauer, 1980. 6 See again EASYPol Module 032.

Equivalence Scales Objective Methods
13
Module metadata
1. EASYPol module 034
2. Title in original language English Equivalence Scales French Spanish Other language
3. Subtitle in original language English Objective Methods French Spanish Other language
4. Summary This module illustrates how to use objective methods to derive equivalence scales. The focus will be on the Engel method, on the Rothbarth method and on the utility-based methods. The main difference between these methods is that the first two are based on proxy variables for the household well-being, while the last set of methods is based on the consideration of the overall preferences revealed by consumers.
5. Date November 2005
6. Author(s) Lorenzo Giovanni Bellù, Agricultural Policy Support Service, Policy Assistance Division, FAO, Rome, Italy Paolo Liberati, University of Urbino, "Carlo Bo", Institute of Economics, Urbino, Italy 7. Module type
Thematic overview Conceptual and technical materials Analytical tools Applied materials Complementary resources
8. Topic covered by the module
Agriculture in the macroeconomic context Agricultural and sub-sectoral policies Agro-industry and food chain policies Environment and sustainability Institutional and organizational development Investment planning and policies Poverty and food security Regional integration and international trade Rural Development
9. Subtopics covered by the module
10. Training path Analysis and monitoring of socio-economic impacts of policies
11. Keywords