analytical chemistry and measurement science
TRANSCRIPT

3 , . - -
ANALYTICAL CHEMISTRY AND MEASUREMENT SCIENCE
(What Has DOE Done For Analytical Chemistry?) CONF-8904181--1
DE89 009559
W. D. Shults Analytical Chemistry Division
Oak Ridge National Laboratory* Oak Ridge, Tennessee 37831-6129
ABSTRACT
Over the past forty years, analytical scientists within the DOE complex have had a tremendous impact on the field of analytical chemistry. This paper suggests six "high impact" research/development areas that either originated within or wcce brought to maturity within the DOE laboratories. "High impact" means they lead to new subdisciplines or to new ways of doing business.
DISCLAIMER
This report was prepared as an account of work sponsored by an agency of the United States Government. Neither the United States Government nor any agency thereof, nor any of their employees, makes any warranty, express or implied, or assumes any legal liability or responsi- bility for the accuracy, completeness, or usefulness of any information, apparatus, product, or process disclosed, or represents that its use would not infringe privately owned rights. Refer- ence herein to any specific commercial product, process, or service by trade name, trademark, manufacturer, or otherwise does not necessarily constitute or imply its endorsement, recom- mendation, or favoring by the United States Government or any agency thereof. The views and opinions of authors expressed herein do not necessarily state or reflect those of the United States Government or any agency thereof.
*Operated by Martin Marietta Energy Systems, Inc. under Contract DE-AC05-840R21400 with the Department of Energy
This document is
rovW-free bcsMs to publmh or reproduce the pabghed form of mtl u n t r U . or slbw othai to do so, for U S Oovr-t pwpaaes.'
J

DISCLAIMER
This report was prepared as an account of work sponsored by an agency of the United States Government. Neither the United States Government nor any agency Thereof, nor any of their employees, makes any warranty, express or implied, or assumes any legal liability or responsibility for the accuracy, completeness, or usefulness of any information, apparatus, product, or process disclosed, or represents that its use would not infringe privately owned rights. Reference herein to any specific commercial product, process, or service by trade name, trademark, manufacturer, or otherwise does not necessarily constitute or imply its endorsement, recommendation, or favoring by the United States Government or any agency thereof. The views and opinions of authors expressed herein do not necessarily state or reflect those of the United States Government or any agency thereof.

DISCLAIMER Portions of this document may be illegible in electronic image products. Images are produced from the best available original document.

ANALYTICAL CHEMISTRY AND MEASUREMENT SCIENCE
W. D. Shults Analytical Chemistry Division
Oak Ridge National Laboratory
INTRODUCTION
The purpose of this paper is to bridge the gap between earlier papers in this symposium--which dealt
with the early accomplishments of analytical chemistry within the atomic energy program--and later papers
that will deal with recent accomplishments and the challenges of tomorrow. The usual approach in a talk
like this is to discuss what analytical chemistry has done for DOE (-ERDA, -AEC). This paper will take
the opposite approach: it will considcr what DOE has done for the ficld of analytical chemistry. The
message is that we have had great impact on our own field. "Great impact" means we have done things that
lead to whole new subdisciplines or caused our discipline to take a major detour in the way it does business.
The plan of this paper then is to present several DOE-derived contributions that have had a major
impact on our discipline. Some old photographs will be used to illustrate the tremendous progress that
we have made over the past forty years. Some related research opportunities will be suggested. Then, the
almost incredible capabilitics that we have today will be illustrated, using dollars as an analogy.
SOME MAJOR CONTRIBUTIONS TO ANALYTICAL CHEMISTRY BY DOE SCIENTISTS
Six contributions are at the top of my list. (You may have other ideas about this.) Please note
this disclaimer: we did not necessarily discover or invent these things, but we did bring them to analytical
chemistry and made them viable within the field.
1. Nuclear and Radioanalvtical Chemistry. We had to learn to deal with radioactivity, of
course --it was forced upon us. But, we did much more than deal with it. We developed a whole branch
of analytical chemistry based upon radiochemistry, we extended it to traccr chemistry, and we developed one

of the first ultratrace, multi-element techniques: neutron activation analysis. The necessity to work with
radioactive materials prompted much work on specialty instrumentation, not just for radioanalysis but also
for analysis of radioactive materials. I think the need for specialty instrumentation within DOE (and
elsewhere) and the advances in instrumental electronics were synergistic. They built on each other. We owe
much to men like Sam Reynolds, George Leddicotte, Vince Quinn, Bill Lyon.
One easy way to show what happened in radiochemistry is to look at the evolution of
spectrometers. Figure 1 shows a 20-channel spectrometer, vintage 1953. Figure 2 shows a 400-channel
spectrometer dating to 1964. A PDP-15 system of the 19703, having 40% channels, is shown in Figure 3.
Figure 4 shows an ND-9900 system, the big spectrometer of today; it has 16K channels. Finally, Figure 5
shows a personal computer based spectrometer, in use today and likely to be the technology of the future.
Capacity has increased while the size has decreased.
One challenge that we have today is to develop software for spectrometry that matches the desktop
computer hardware in sophistication and overall capability.
2. Analvtical SeDarations. It was natural for new analytical separations to develop in parallel
with developments in nuclear and radiochemistry. Radiochemistry was both a driver for the work and a
tool for carrying it out. Thus, all sorts of solid ion exchange, solvent extraction, and liquid ion exchange
studies were carried out. It became the foundation for much of what we do today. Of particular importance
was work on the ion exchange of metals as their anionic complexes, a totally new concept at the time. The
information was presented in terms of log D 9 M Acid as shown in Figure 6. A whole repertory of
separations -- today we would call it a database -- was developed in the fifties, sixties, and seventies by
men like Kurt Kraus, Fletcher Moore, Jim White, Bill Maeck, Jim Rein, Frcd Marsh, Jim Fritts, and many
others. We still depend upon their science.
There is a real opportunity here today to apply expert systems to the vase amount of knowledge that

we have established in the area of inorganic separations. Expert systems offer a way to store our knowledge,
use it efficiently, expedite methods development, trouble-shoot, and tutor non-experts.
3. ODerational Amplifiers in Analvtical Instrumentation (Figure 7). When Glenn Booman
at Idaho Falls put operational amplifiers into an electrochemical instrument, he forever changed the nature
of analytical instrumentation in general, and electroanalytical instrumentation in particular. Booman's device
was a controlled-potential coulometic titrator, an instrument that had been impractical prior to the advent
of operational amplifiers because manual potential control was tedious and the measurement of coulombs
was difficult. Glenn's first application was the determination of uranium by reduction of U(V1) to U(1V)
at a mercury pool electrode, and it was precise to a few tenths of a perccnt for samples of a few milligrams.
Fred Scott almost immediately applied the new hardware to plutonium, using the Pu(III), Pu(1V) couple
and a platinum electrode. Lots of work and lots of applications ensued, by Bob Stromatt, Jack Harrar, Bob
Propst, myself, and others. CPC became a workhorse for us for a while and it is still used in many
laboratories to determine milligram quantities of uranium and/or plutonium precisely. In fact, Wanda
Mitchell, Dennis Troutman and Ken Lewis recently published a description of an automated CPC titrator
that is in use today at the New Brunswick Laboratory.
Booman's concept of potential control by operational amplifier circuitry was extended by Myron
Kelley and Dale Fisher to DME polarography and thence to voltammetry with solid electrodes. Thus, the
whole idea of "three-electrode" electrochemistry was born. It is the conventional way to do electroanalytical
chemistry today. Both Fisher and Kelley won the ACS Chemical Instrumentation award for their work in
instrumentation. The Princeton Applied Research Corporation-now a part of EG&G--was built upon this
technology.
Figure 8 shows a servo-controlled potentiometric titrator that w3s developed during the op-amp era
to determine milligram amounts of uranium and/or plutonium. It could be used in or out of a glove box
or hot cell, but it wasn't easy. Figure 9 is a view of a box--not gloved--with a potentiometric titrator on the

left and a coulometric titrator on the right. We could not work with milligram quantities of plutonium
under these conditions today.
Figure 10 is included to illustrate the state of affairs in the operational amplifier era. It was a time
It was a time of hands-on of solder and wire and resistors and other electronic components.
instrumentation.
Future research and development in the general area of instrumentation is likely to emphasize
sensors and methodology for in-line and at-line analysis.
4. Minicomputers in Analvtical Instrumentation. Operational amplifiers were a great advance,
a nice prelude to the minicomputer era. Jack Frazier at Livermore was first to see the enormous potential
for minicomputers in analytical chemistry. We are all familiar with the PDP-8 series of computers that were
so widely used in the seventies. Jack had an earlier version--a PDP-7-and interfaced it to first mass
spectrometers, then to other things, "Interfacing" to him meant developing the hardware that could be
operated by the computer, as well as the software to control the hardware. His was a "systems" approach,
which is trite today but was visionary then. Jack Frazier also won the ACS Chemical Instrumentation for
his leadership in analytical instrumentation.
Jack Frazer, Myron Kelley (shown in Figure 11 with Jim White and a PDP-81 minicomputer), Jack
Harrar, Dale Fisher, Sam Perone, and many others made us think about our instrumentation in enlarged
terms. We began to see that the computers expanded our horizons as well as our efficiency. They let us
make measurements that we cbuld not otherwise make. These men set the stage for the microcomputers
that are so ubiquitous today.
Future research in this area is likely to be aimed at the development data management systems that
are relational in nature, so that we or our clients can extract information from the database in virtually any

~ - _ .
format they choose, and manipulate it to suit the occasion.
5. ODtical SDectroscoDy. This is another area of analytical chemistry in which great advances
have been made since the fifties, and again it is one in which DOE-sponsored work has had tremendous
impact. There are two techniques that warrant special mention here. One is fluorimetry and the other is
inductively coupled plasma atomic emission spectrometry.
The fluorimetric determination of uranium illustrates just how far we have come. In the old days
we put traces of uranium on NaF-LiF pellets, fused them by flaming (Figure 12), and then measured the
uranium by fluorescence (Figure 13). We could measure 0.1 ppm a t a time when parts per thousand
measurements were considered good. ppically, we improved hardware to improve the method: better
fusion systems (Figure 14) and better fluorimeter systems (Figure 15). As has often happened, it took a
change of concept to provide a the quantum advance in methodology. Laser-based fluorescence plus
carefully designed timing and measuring electronics have proved to be the “next step”, as indicated in Figure
16. A pulse from a nitrogen laser excites the uranium, which in this case is in solution. Measurements of
fluorescence intensity are made as a function of time and extrapolated back to t = o to get the
concentration dependent readout. This circumvents interference from inipurities in the solvent. These
measurements are quick, reliable, and sensitive to the 0.05 ppb level without pre-concentration.
Inductively coupled plasma spectrometry (Figure 17), is by far the DOE-sponsored development of
greatest impact on optical spectrometry. Velmer Fasiel and his colleagues at the Ames Laboratory
developed the inductively coupled plasma source, which now is in use in laboratories all over the world.
The ICP was adopted promptly by the instrument companies and has become the standard method for trace
element analysis in water. This technology caused the field of analytical chemistry to take a detour. The
latest rage is to couple Fassel’s ICP source with a mass spectrometer, thereby obtaining improved sensitivity
and selectivity, plus isotopic information. There are at ]cast six ICPMS systems within the DOE
laboratories now and several others are on the way. At about the same time, Sam Hurst, Jack Young, and

Marvin Payne developed a laser-based spectrometric technique that was claimed to detect a single atom.
In fact, there has been one claim in the literature of detecting half an atom. Half an atom! They must have
done it with mirrors (or statistics).
Laser spectroscopy is certain to be a prominent R and D area in analytical optical spectroscopy
in the future. Laser offers tremendous resolution, control, and speed.
6. Inorganic Mass Snectrometry. Inorganic mass spectrometry--isotopic analysis, gas analysis,
major and minor component analysis-must be included in any list of very significant contributions to
measurement science via DOE. DOE labs have been slow to get into organic mass spectrometry, but they
have been prime movers in isotopic and inorganic mass spectrometry. We owe a great deal to people like
AI Nier, Gus Cameron, Harry Svec, Leo Collins, and others who not only developed the instruments and
techniques, but also set the foundations and expectations upon which the field is built.
Figure 18 shows a two-stage machine that ORNL built for the IAEA Safeguards Analytical
Laboratory in Vienna in the mid-l970s, for high precision isotopic analysis of uranium. This machine has
now been supplanted by commercial instrumentation that can do fantastic things. Isotopic ratios can be
measured with precision and accuracy of 0.01%. With gas machines, the precision and accuracy approaches
0.003%. Mass spectrometry has become the premier analytical technique today, in sensitivity, accuracy, and
applicability.
Research in analytical mass spectrometry in the future is likely to include trapped ion and laser-
based techniques. Ion traps and ion cyclotron mass spectrometers are already attracting much attention in
organic mass spectrometry, and resonance ionization mass spectrometry has already been shown to have great
selectivity.
The above six areas of contribution were selected as having major impact on the field of analytical

chemistry. You may disagree with some of the choices, or perhaps with some of the future research
opportunities that are mentioned. I hope you can agree with the premise that DOE scientists have changed
the course of analytical chemistry.
WHAT HAS HAPPENED TO US IN FOUR DECADES
I want to conclude by illustrating what has transpired in measurement science since NBL was
established. To do that I want to use the height of a stack of dollar bills as my reference. A stack of one
hundred dollar bills measures 0.75 inch. We can relate accuracy and precision to stacks of bills. Thus, in
1950 we could determine major constituents with an accuracy of 99.8-99.9%, or about one part per thousand.
This is analogous to measuring all but one or two bills in a stack of bills 7 1/2 inches tall. Today we can
do almost 100 times better. The analogy now is measuring all except one or two bills in a stack 750 inches
(62.5 feet) tall. I believe we have made good, but not spectacular, improvement insofar as accuracy is
concerned.
The real gains have been made in sensitivity. When NBL was born, detection limits for ionic
analyses were generally in the tens to hundreds of parts per million. Using the above analogy, detecting ten
ppm corresponds to detecting one blank paper in 100,OOO bills. That is about 750 inches or 62.5 feet of
dollar bills. Today, we operate routincly at the part per billion level. The analogy is detection of one blank
piece of paper in a stack of bills about 6.25 x ld feet tall. To put it in context: we detect constituents
in our samples at levels that correspond to one blank paper in ti stack of bills as tall as 424 Empire State
Buildings. We have made unbelievable gains in practical sensitiirity over the past forty years.
CONCLUSION
Forty years ago, analytical chemistry was perceived primarily as "wet chemistry" (Figure 19). Today
it is perceived as fancy instrumentation and computers (Figure 20). To get here from there, we have had

to be technologically agile. We have had to learn new skills, develop and adopt new technology, and meet
new challenges-and do so continually-over the years. It has been exciting and it has been fun. On the
average, it has been fine (Figure 21).
Part of the fun, of course, has been knowing and working with the people a t laboratories like NBL.
The New Brunswick Laboratory has been involved in every one of the six areas of analytical chemistry that
I discussed. It has been a force within the field. I congratulate NBL and wish it continued success between
now and 2028.
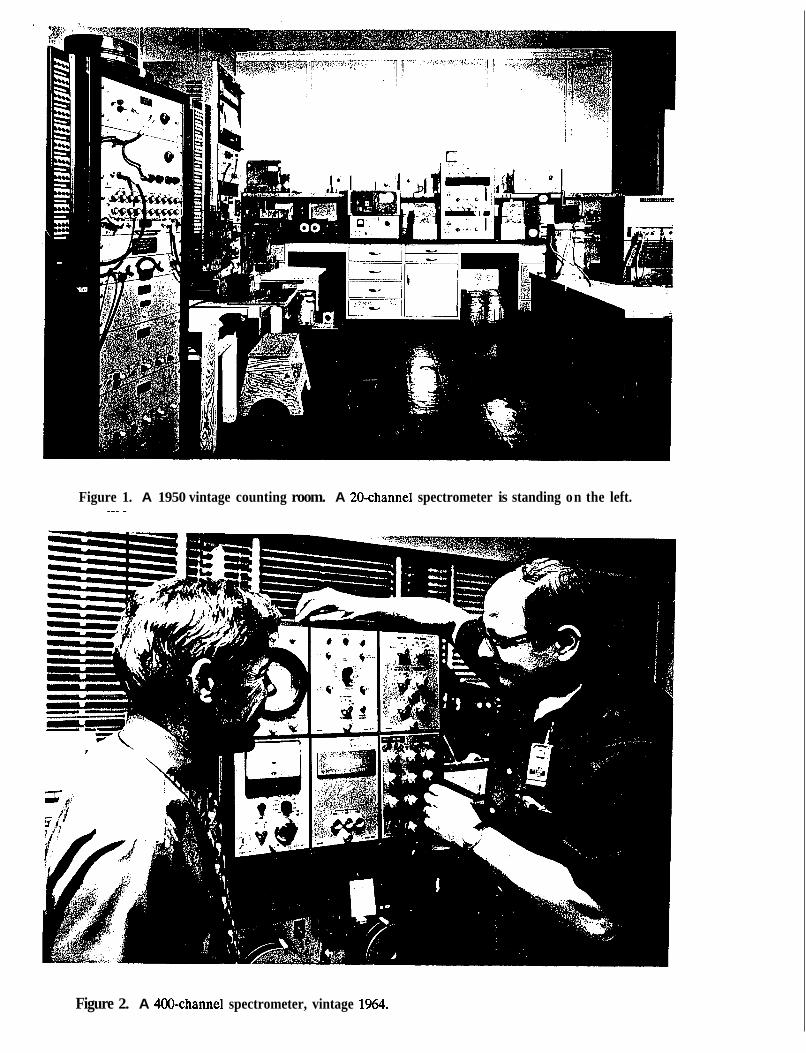
Figure 1. A 1950 vintage counting room. A 20-channel spectrometer is standing on the left. __. -
Figure 2. A 400-channel spectrometer, vintage 1964.

Figure 3. A minicomputer-based spectrometer system, vintage 1975.
Figure 4. A microcomputer-based spectrometcr system, vintage 19SO.

.- . - . . . . -. . . . .- ..... .. .
i
Figure 5. A desktop computer based spectrometer, vintage 1990. - - - _ _ -
ORNL- DWG. 75- 11285
4
3
2
1
0.1 I 5 10 14 QI 1 5 10 14 CUI 5 10 14 ar 1 5 10 14 ,Q1! 5 to 14
"03, M
IONIC METAL ADSORPTION BY STRONGLY BASIC ANION EXCHANGE RESIN (Dowex 1-X2)
Figure 6. -ical separation data; ion exchange in nitrate medium.

Figure 7. Operational amplifiers, vintage 1960. I__._ - __________.-____ -
Figure 8. A servo-controlled potentiometric titrator, vintage 1960.

Figure 9. A titration box la-alutonium. vintage 1960. -- ._ __- - __ -
Figure 10. The operational amplifier era.

Figure 11. A laboratory minicomputer system of the 1970s. .~ . __- .
A. Mulltiple-Fusion Device and MisceUsrneaus Equlment Rewired for the Determination of Uranium by the Fluorometric Method
Figure 12. A pellet fusing device, vintage 1950.

Figure 13. An early uranium fluorimeter. _I -I_ - I - _ _ - _ - - - -- -
Figure 14. An advanced pellet fusing device, vintage 1970.

Figure 15. An advanced fluorimeter, vintage 1970.
LASER-BASED FLUORIMETRY NANOMETERS
300 400 500 600 I I I I
LASER EXCITATION 4
I I I I 1
MICROSECONDS
Figure 16. Laser-excited fluoresccnce of uranium.
i
I

..
Figure 17. An inductively coupled plasma source for atomic emission spectrometly, vintage 1980.
Figure 18. A two-stage mass spectrometer, vintage 1975.

Figure 19. Analytical chemistry, vintage 1950.
Figurc 20. Analytical chemistry, vintage 1989.

I c VI * j , 3
5
AVERAGES CAN BE MISLEADING
"ON THE AVERAGE, HE FEELS FINE!"
Figure 21. The law of averages.