analytical method development and … k, aleti p, venisetty rk* department of pharmaceutical...
TRANSCRIPT

Available Online through
www.ijpbs.com (or) www.ijpbsonline.com IJPBS |Volume 3| Issue 4 |OCT-DEC|2013|343-353
Research Article
Pharmaceutical Sciences
International Journal of Pharmacy and Biological Sciences (e-ISSN: 2230-7605)
Venisetty Rk* et al Int J Pharm Bio Sci www.ijpbs.com or www.ijpbsonline.com
Pag
e34
3
ANALYTICAL METHOD DEVELOPMENT AND VALIDATION OF SIMULTANIOUS
ESTIMATION OF EZETAMIBE AND ROSUVASTATIN IN TABLET DOSAGE FORM
BY RP-HPLC
Ramu K, Aleti P, Venisetty Rk* Department of Pharmaceutical Analysis, Sri Shivani College Of Pharmacy,
Mulugu Road, Warangal, Andhra Pradesh, India, 506001.
*Corresponding Author Email: [email protected]
ABSTRACT The HPLC method was developed by using, Zorbax SB C18 (150mmX 4.6mm id particle size 3.5μ) reverse phase
packed with Octadecylsilane chemically bonded to porous silica or ceramic micro-particle with mobile phase
40:45:15 (v/v) potassium dihydrogen phosphate buffer (adjust the pH to 2.5 0.05 using dilute Ortho phosphoric
acid), methanol and acetonitrile. Flow rate was 1.5ml / min with UV detection at 242 nm and the injection volume
was set at 10 μl, with 10 min runtime. The developed method was validated by using various parameters
according to ICH guidelines. It was validated for specificity, stability in analytical solution, linearity, precision,
accuracy studies, LOD, LOQ, robustness and ruggedness. All the validation parameters were found to be well
within the acceptance criteria. The system suitability parameters also reveals that the values within the specified
limit for the proposed method. The theoretical plates for Ezetamibe and Rosuvastatin were found to be more than
2000 and the tailing factor is NMT 2.0.The precision of the System and Method were checked and found to be
within limits. This indicates that the method is precise. From the linearity studies, the specified range for
Ezetamibe was found to be 25mcg to 75mcg and for Rosuvastatin was found to be 25mcg to 75mcg. It was
evaluated by the visual inspection of the plot of Peak area vs. Concentration and the correlation was found to be
linear. The accuracy was found that the recovery value of pure drug and sample is in between 99.94 % to 101.1%
which indicates that the method is accurate. The system suitability should passes as per the test method at
variable conditions, hence it was concluded that the test method was Robust.There is a wide scope for the
development of new analytical methods for the assay of the above drugs. RP-HPLC technique has been used as a
tool in the present work
KEY WORDS Ezetamibe and Rosuvastatin, RP-HPLC
INTRODUCTION
Ezetamibe1 is Anticholesteremic Agents, Cholesterol
Absorption Inhibitors. Chemically Ezetamibe1,
3R,4S)-1-(4-fluorophenyl) -3- [(3S )-3-(4-
fluorophenyl) -3- hydroxypropyl] -4-(4-
hydroxyphenyl)azetidin-2-one. Ezetimibe is
primarily metabolized in the small intestine and
liver via glucuronide conjugation (a phase II
reaction) with subsequent biliary and renal
excretion. In humans, ezetimibe is rapidly
metabolized to ezetimibe-glucuronide.

Available Online through
www.ijpbs.com (or) www.ijpbsonline.com IJPBS |Volume 3| Issue 4 |OCT-DEC|2013|343-353
International Journal of Pharmacy and Biological Sciences (e-ISSN: 2230-7605)
Venisetty Rk* et al Int J Pharm Bio Sci www.ijpbs.com or www.ijpbsonline.com
Pag
e34
4
Figure 1: Chemical Structure of Ezetamibe
Rosuvastatin2 is a Anticholesteremic Agents, HMG-CoA
Reductase Inhibitors. Rosuvastatin2, chemically it is
found 3R, 5S, 6E) -7- [4- (4-fluorophenyl)-2-(N-
methylmethanesulfonamido)- 6-(propan-2-
yl)pyrimidin-5-yl]-3,5-dihydroxyhept-6-enoic acid.
Rosuvastatin is Rosuvastatin is a competitive inhibitor
of HMG-CoA reductase. HMG-CoA reductase catalyzes
the conversion of HMG-CoA to mevalonate, an early
rate-limiting step in cholesterol biosynthesis.
Rosuvastatin acts primarily in the liver. Decreased
hepatic cholesterol concentrations stimulate the
upregulation of hepatic low density lipoprotein (LDL)
receptors which increases hepatic uptake of LDL.
Rosuvastatin also inhibits hepatic synthesis of very low
density lipoprotein (VLDL). The overall effect is a
decrease in plasma LDL and VLDL. In vitro and in vivo
animal studies also demonstrate that rosuvastatin
exerts vasculoprotective effects independent of its
lipid-lowering properties. Rosuvastatin exerts an anti-
inflammatory effect on rat mesenteric microvascular
endothelium by attenuating leukocyte rolling,
adherence and transmigration. The drug also
modulates nitric oxide synthase (NOS) expression and
reduces ischemic-reperfusion injuries in rat hearts.
Rosuvastatin increases the bioavailability of nitric
oxide by upregulating NOS and by increasing the
stability of NOS through post-transcriptional
polyadenylation. It is unclear as to how rosuvastatin
brings about these effects though they may be due to
decreased concentrations of mevalonic acid.
Figure 2: Chemical Structure of Rosuvastatin
The literature survey was carried out and it revealed
that various methods have been reported in literature
to detect and quantify the individual drugs. So there is
a need to develop a simple, accurate and precise HPLC
method for the simultaneous determination of the
Ezetamibe and Rosuvastatin in combined tablet
formulation.
The work of interest is Ezetamibe and Rosuvastatin in
the combined dosage form. Validation of the method
was done in accordance with ICH guidelines for the
assay of active ingredients. Thus validated method
can be recommended for the routine laboratory
analysis.
MATERIALS & METHODS
Materials:
Analytically pure samples of Ezetamibe and
Rosuvastatin were procured as gift samples from Dr.
Reddy’s Laboratories, (Hyderabad, India). Ezetamibe
10mg + Rosuvastatin 10mg -200mg tablets
manufactured by NOVARTIS., USA were procured
from a local pharmacy. The solvents for the
experiment were selected based on the solubility test
results of both the drugs. The solubility tests were
performed using the common solvents like water,
methanol (Merk), Acetonitrile (Merck). The analytical
reagent grade Potassium dihydrogen ortho phosphate

Available Online through
www.ijpbs.com (or) www.ijpbsonline.com IJPBS |Volume 3| Issue 4 |OCT-DEC|2013|343-353
International Journal of Pharmacy and Biological Sciences (e-ISSN: 2230-7605)
Venisetty Rk* et al Int J Pharm Bio Sci www.ijpbs.com or www.ijpbsonline.com
Pag
e34
5
(Merk) and orthophosphoric acid was used to prepare
the mobile phase which is filtered through a nylon
0.45μm membrane filter paper3-5
.
CHROMATOGRAPHIC CONDITIONS:
The HPLC method was developed by using, Zorbax SB
C18 (150mmX 4.6mm id particle size 3.5μ) reverse
phase packed with Octadecylsilane chemically
bonded to porous silica or ceramic micro-particle with
mobile phase 40:45:15 (v/v) potassium dihydrogen
phosphate buffer (adjust the pH to 2.5 0.05 using
dilute Ortho phosphoric acid), methanol and
acetonitrile. Flow rate was 1.5ml / min with UV
detection at 242 nm and the injection volume was set
at 10 μl, with 10 min runtime.
ASSAY OF FORMULATION:
PREPARATON OF STANDARD STOCK SOLUTION:
Accurately weighed quantity of 25 Ezetamibe mg of
and 25 Rosuvastatin mg was transferred to a 100 ml
volumetric flask, dissolved in 50 mL of methanol,
sonicated for dissolve and the volume was made up
to 100 mL with methanol.
PREPARATION OF SAMPLE SOLUTION:
Step 1
Weighed 20 tablets and determined the average
weight and crushed to fine powder. Weighed
accurately tablet powder equivalent to 50mg of
Ezetamibe and Rosuvastatin transferred into 100 ml
volumetric flask. Add methanol sonicated for 30
minutes in cold water, made up the volume with
mobile phase. Mixed well and filtered through
filtration unit.
Step 2
5 ml of above solution was diluted to 50 ml with
methanol, so that the concentration of 50µg/ml
respectively.
Step 3
Inject 10 µl of filtered portion of the sample
preparation and Standard preparation into the
chromatograph. Record the responses for the major
peaks.
METHOD VALIDATION: The developed HPLC method
for simultaneous determination of Ezetamibe and
Rosuvastatin formulation was validated as per ICH
guidelines.
Fig.No 3: Chromatogram of Blank for Assay
Available Online through
www.ijpbs.com (or) www.ijpbsonline.com IJPBS |Volume 3| Issue 4 |OCT-DEC|2013|343-353
International Journal of Pharmacy and Biological Sciences (e-ISSN: 2230-7605)
Venisetty Rk* et al Int J Pharm Bio Sci www.ijpbs.com or www.ijpbsonline.com
Pag
e34
6
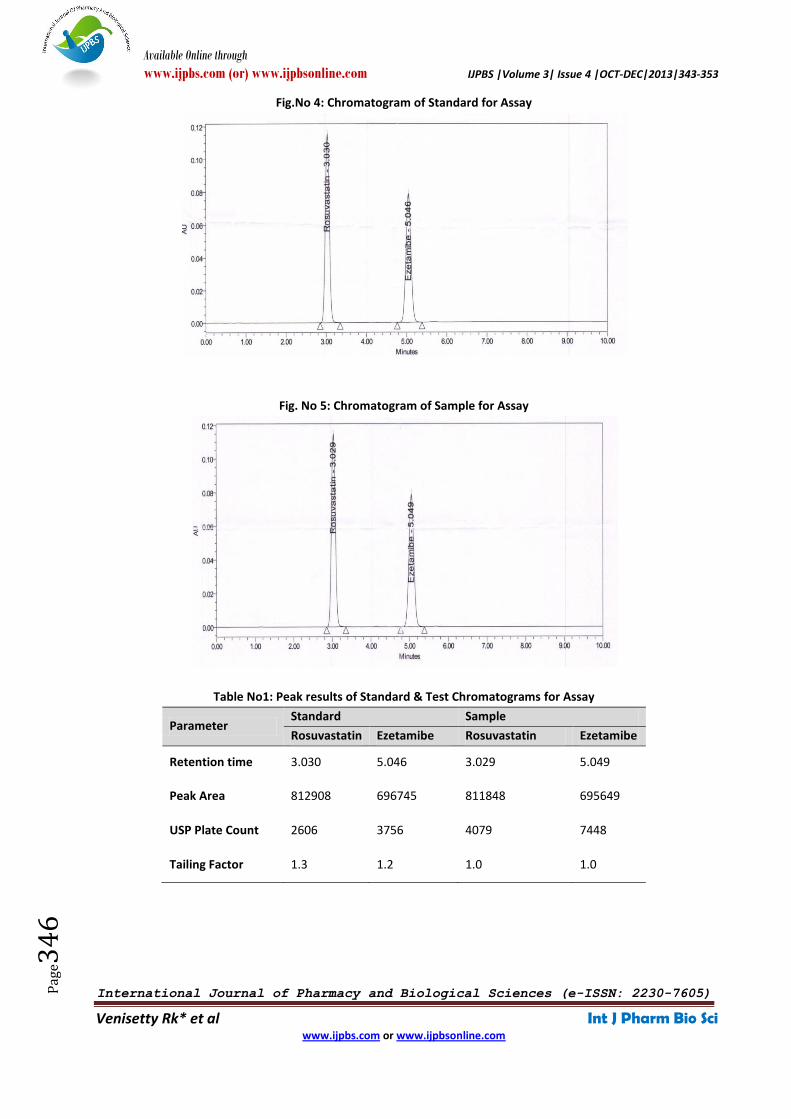
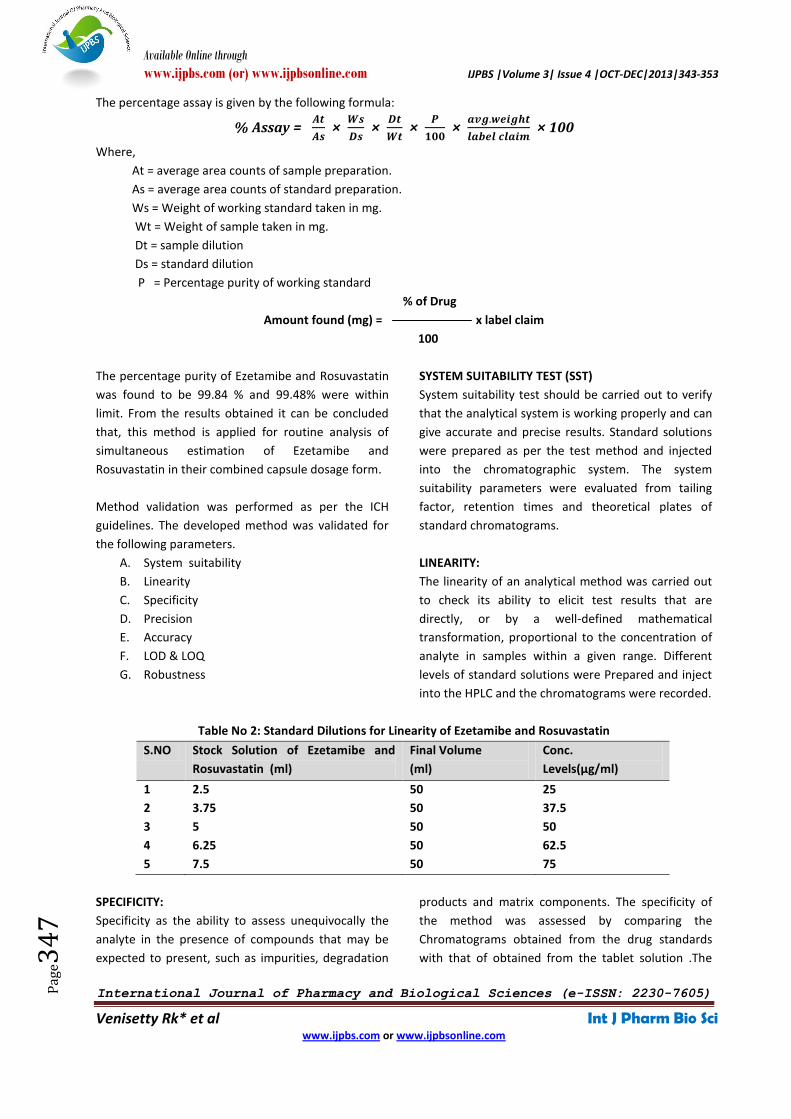
Fig.No 4: Chromatogram of Standard for Assay
Fig. No 5: Chromatogram of Sample for Assay
Table No1: Peak results of Standard & Test Chromatograms for Assay
Parameter Standard Sample
Rosuvastatin Ezetamibe Rosuvastatin Ezetamibe
Retention time 3.030 5.046 3.029 5.049
Peak Area 812908 696745 811848 695649
USP Plate Count 2606 3756 4079 7448
Tailing Factor 1.3 1.2 1.0 1.0
Available Online through
www.ijpbs.com (or) www.ijpbsonline.com IJPBS |Volume 3| Issue 4 |OCT-DEC|2013|343-353
International Journal of Pharmacy and Biological Sciences (e-ISSN: 2230-7605)
Venisetty Rk* et al Int J Pharm Bio Sci www.ijpbs.com or www.ijpbsonline.com
Pag
e34
7
The percentage assay is given by the following formula:
% Assay = 𝑨𝒕
𝑨𝒔 ×
𝑾𝒔
𝑫𝒔 ×
𝑫𝒕
𝑾𝒕 ×
𝑷
𝟏𝟎𝟎 ×
𝒂𝒗𝒈.𝒘𝒆𝒊𝒈𝒉𝒕
𝒍𝒂𝒃𝒆𝒍 𝒄𝒍𝒂𝒊𝒎 × 100
Where,
At = average area counts of sample preparation.
As = average area counts of standard preparation.
Ws = Weight of working standard taken in mg.
Wt = Weight of sample taken in mg.
Dt = sample dilution
Ds = standard dilution
P = Percentage purity of working standard
% of Drug
Amount found (mg) = x label claim
100
The percentage purity of Ezetamibe and Rosuvastatin
was found to be 99.84 % and 99.48% were within
limit. From the results obtained it can be concluded
that, this method is applied for routine analysis of
simultaneous estimation of Ezetamibe and
Rosuvastatin in their combined capsule dosage form.
Method validation was performed as per the ICH
guidelines. The developed method was validated for
the following parameters.
A. System suitability
B. Linearity
C. Specificity
D. Precision
E. Accuracy
F. LOD & LOQ
G. Robustness
SYSTEM SUITABILITY TEST (SST)
System suitability test should be carried out to verify
that the analytical system is working properly and can
give accurate and precise results. Standard solutions
were prepared as per the test method and injected
into the chromatographic system. The system
suitability parameters were evaluated from tailing
factor, retention times and theoretical plates of
standard chromatograms.
LINEARITY:
The linearity of an analytical method was carried out
to check its ability to elicit test results that are
directly, or by a well-defined mathematical
transformation, proportional to the concentration of
analyte in samples within a given range. Different
levels of standard solutions were Prepared and inject
into the HPLC and the chromatograms were recorded.
Table No 2: Standard Dilutions for Linearity of Ezetamibe and Rosuvastatin
S.NO Stock Solution of Ezetamibe and
Rosuvastatin (ml)
Final Volume
(ml)
Conc.
Levels(µg/ml)
1 2.5 50 25
2 3.75 50 37.5
3 5 50 50
4 6.25 50 62.5
5 7.5 50 75
SPECIFICITY:
Specificity as the ability to assess unequivocally the
analyte in the presence of compounds that may be
expected to present, such as impurities, degradation
products and matrix components. The specificity of
the method was assessed by comparing the
Chromatograms obtained from the drug standards
with that of obtained from the tablet solution .The

Available Online through
www.ijpbs.com (or) www.ijpbsonline.com IJPBS |Volume 3| Issue 4 |OCT-DEC|2013|343-353
International Journal of Pharmacy and Biological Sciences (e-ISSN: 2230-7605)
Venisetty Rk* et al Int J Pharm Bio Sci www.ijpbs.com or www.ijpbsonline.com
Pag
e34
8
retention times of the drug standards and the drug
from sample solutions were same, so the method was
specific. The method was also specific and selective
because there was no interference from excipients in
the capsules.
PRECISION:
The precision of an analytical method is the degree of
agreement among individual test results when the
method is applied repeatedly to multiple sampling of
homogeneous sample. The precision of analytical
method is usually expressed as the standard deviation
or relative standard deviation (coefficient of
variation) of series of measurements.
a) System Precision:
The system precision was carried out to ensure that
the analytical system is working properly. Injected
Standard preparation five times into the HPLC.
Calculated the RSD for Ezetamibe and Rosuvastatin
peaks in Standard preparation. The results obtained
are tabulated. The retention time and area of five
determinations is measured and % RSD should be
calculated.
b) Method Precision:
In method precision, a homogenous sample of a
single batch should be analyzed five times and was
checked whether the method is giving consistent
results for a single batch. The samples of Ezetamibe
and Rosuvastatin were analysed five times. The % RSD
was calculated for the sample.
ACCURACY:
The accuracy of an analytical method is the closeness
of agreement between the value which is accepted
either as a conventional true value or an accepted
reference value and the value found.
The study was performed by making three different
standard concentrations at50%, 100%, and 150%
levels of known amounts of studied drugs. The
accuracy of an analytical method should be
established across its range. Finally, the final volume
made up with solvent (methanol) and mixed well. The
resulting mixtures were analysed by the proposed
HPLC method at 242 nm. The excellent mean
recoveries and standard deviation suggested good
accuracy results of the propose method.
LIMIT OF DETECTION & QUANTIFICATION:6,7
The detection limit of an individual analytical
procedure is the lowest amount of analyte in a
sample which can be detected but not necessarily
quantitated as an exact value and the quantitation
limit of an individual analytical procedure is the
lowest amount of analyte in a sample which can be
quantitatively determined with suitable precision and
accuracy .The detection limit and the quantitation
limit can be calculated based on the Standard
Deviation of the Response and the Slope. .
The Detection Limit (DL) may be
expressed as:
DL = 3.3F/S
The Quantitation Limit (QL) may be expressed as:
QL = 10F/S
Where,
F = Residual Standard deviation of the response,
S = Slope of the calibration curve.
Limit of Detection (LOD):
The parameter LOD was determined on the
basis of response and slope of the regression
equation.
The Detection Limit (DL) may be expressed as:
DL = 3.3F/S
Where,
F = Residual Standard deviation of the response,
S = Slope of the calibration curve.
The LOD for this method was found to be 0.718
µg/ml and 0.613 µg/ml for Ezetamibe and
Rosuvastatin.
Limit of Quantification (LOQ):
The parameter LOQ was determined on the basis of
response and slope of the regression equation.
The Quantitation Limit (QL) may be expressed as:
QL = 10F/S
Where,
F = Residual Standard deviation of the response,
S = Slope of the calibration curve.
ROBUSTNESS:
The robustness of an analytical method is a measure
of its capacity to remain unaffected by small but
deliberate variations in method parameters and

Available Online through
www.ijpbs.com (or) www.ijpbsonline.com IJPBS |Volume 3| Issue 4 |OCT-DEC|2013|343-353
International Journal of Pharmacy and Biological Sciences (e-ISSN: 2230-7605)
Venisetty Rk* et al Int J Pharm Bio Sci www.ijpbs.com or www.ijpbsonline.com
Pag
e34
9
provides an indication of its reliability during normal
usage.
The robustness of the proposed method was
determined by analysis of aliquots from homogenous
lots by differing physical parameters like mobile
phase composition, flow rate and temperature which
may differ but the responses were still within the
specified limits of the assay. The standard solution,
sample solution and sample solution spiked with
impurities were injected into the chromatograph at
varied conditions of flow ± 10%ml/min, mobile phase
buffer pH ± 0.2 units and wavelength by + or -2nm.
a) Effect of variation of mobile phase buffer pH
A study was conducted to determine the effect of
variation in mobile phase buffer pH by Changing the
pH of mobile phase i.e. changes in buffer pH.
Standard solution was prepared and injected into the
HPLC system.
b) Effect of variation of flow rate
A study was conducted to determine the effect of
variation in flow rate. Standard solution was prepared
and injected into the HPLC system by keeping
variation in flow rate + or – 10%. The effect of
variation of flow rate was evaluated.
c) Effect of variation in wave length
A study was conducted to determine the effect of
variation in wave length. Standard solution was
prepared and injected into the HPLC system by
keeping variation in wave length + or – 2 nm. The
effect of variation of wave length was evaluated.
d) Effect of variation of Temperature
A study was conducted to determine the effect of
variation in temperature. Standard solution was
prepared and injected into the HPLC system by
keeping variation in flow rate + or – 50C. The effect of
variation of flow rate was evaluated.
RESULTS AND DISCUSSION
A new reversed phase high performance liquid
chromatographic method has been developed and
validated for the simultaneous estimation Ezetamibe
and Rosuvastatin in tablet formulation. It is shown
above that the method was accurate, reproducible,
repeatable, linear, precise and selective, proving
reliability of method. The run time is relatively short,
i.e.10 min which enables rapid quantitation of many
samples in routine quality control analysis of tablet
formulation. The same solvent used throughout the
experimental work and no interference from any
excipients was observed.
These results show the method could find practical
application as a quality control tool for the
simultaneous estimation of the two drugs (Ezetamibe
and Rosuvastatin) in their combined capsule dosage
form (10/10 mg) in quality control laboratories.
The developed method was validated by using various
parameters according to ICH guidelines. It was
validated for specificity, stability in analytical solution,
linearity, precision, accuracy studies, LOD, LOQ,
robustness and ruggedness. All the validation
parameters were found to be well within the
acceptance criteria.
The system suitability parameters also reveals that
the values within the specified limit for the proposed
method. The theoretical plates for Ezetamibe and
Rosuvastatin were found to be more than 2000 and
the tailing factor is NMT 2.0.
The precision of the System and Method were
checked and found to be within limits. This indicates
that the method is precise.
From the linearity studies, the specified range for
Ezetamibe was found to be 25mcg to 75mcg and for
Rosuvastatin was found to be 25mcg to 75mcg. It was
evaluated by the visual inspection of the plot of Peak
area vs. Concentration and the correlation was found
to be linear.
The accuracy was found that the recovery value of
pure drug and sample is in between 99.94 % to
101.1% which indicates that the method is accurate.
The LOQ for this method was found to be 2.176µg/ml
and 1.858 µg/ml for Ezetamibe and Rosuvastatin.
Available Online through
www.ijpbs.com (or) www.ijpbsonline.com IJPBS |Volume 3| Issue 4 |OCT-DEC|2013|343-353
International Journal of Pharmacy and Biological Sciences (e-ISSN: 2230-7605)
Venisetty Rk* et al Int J Pharm Bio Sci www.ijpbs.com or www.ijpbsonline.com
Pag
e35
0
The system suitability should passes as per the test
method at variable conditions, hence it was
concluded that the test method was Robust.
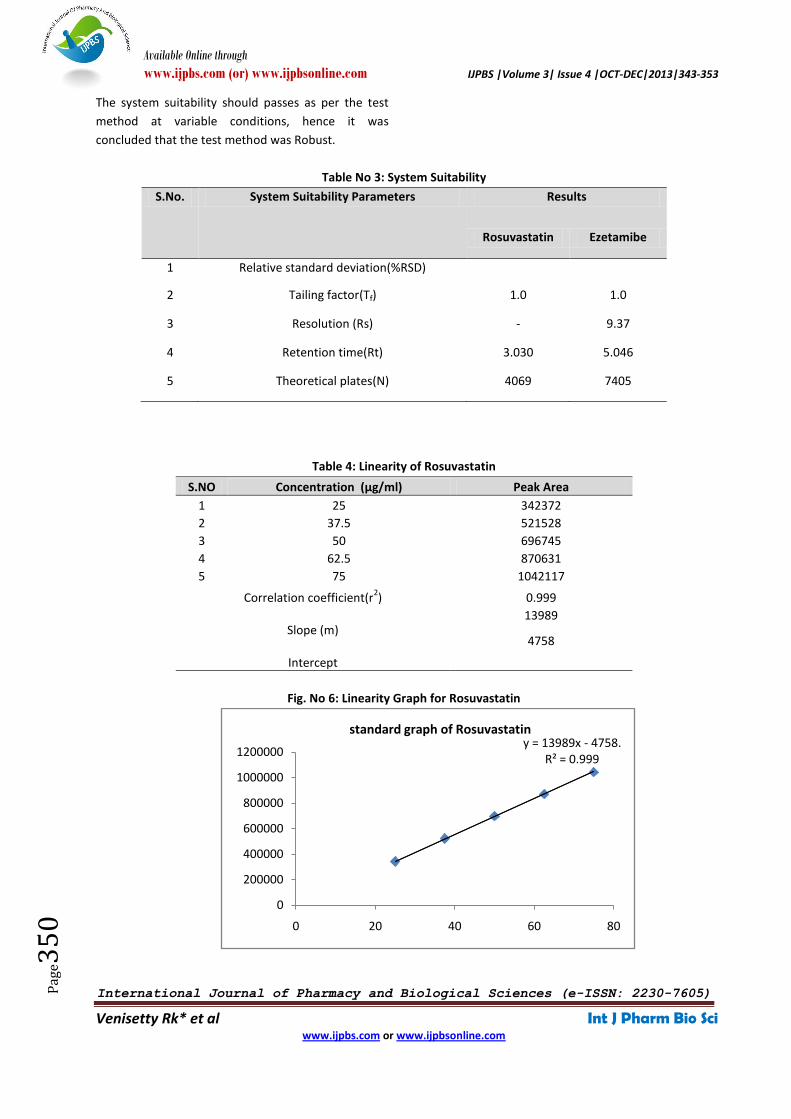
Table No 3: System Suitability
S.No. System Suitability Parameters Results
Rosuvastatin Ezetamibe
1 Relative standard deviation(%RSD)
2 Tailing factor(Tf) 1.0 1.0
3 Resolution (Rs) - 9.37
4 Retention time(Rt) 3.030 5.046
5 Theoretical plates(N) 4069 7405
Table 4: Linearity of Rosuvastatin
S.NO Concentration (µg/ml) Peak Area
1 25 342372
2 37.5 521528
3 50 696745
4 62.5 870631
5 75 1042117
Correlation coefficient(r2)
Slope (m)
Intercept
0.999
13989
4758
Fig. No 6: Linearity Graph for Rosuvastatin
y = 13989x - 4758.R² = 0.999
0
200000
400000
600000
800000
1000000
1200000
0 20 40 60 80
standard graph of Rosuvastatin

Available Online through
www.ijpbs.com (or) www.ijpbsonline.com IJPBS |Volume 3| Issue 4 |OCT-DEC|2013|343-353
International Journal of Pharmacy and Biological Sciences (e-ISSN: 2230-7605)
Venisetty Rk* et al Int J Pharm Bio Sci www.ijpbs.com or www.ijpbsonline.com
Pag
e35
1
Table No 5: Linearity of Ezetamibe
S.NO Concentration (µg/ml) Peak Area
1 25 405484
2 37.5 601891
3 50 812908
4 62.5 1012135
5 75 1214632
Correlation coefficient(r
2)
Slope (m) Intercept
0.999
16228
2006
Fig. No 7:Linearity Graph for Ezetamibe
Fig. No 8:Chromatogram for Accuracy Level 50%
y = 16228x - 2006R² = 0.999
0
200000
400000
600000
800000
1000000
1200000
1400000
0 20 40 60 80
standard graph of Ezetamibe

Available Online through
www.ijpbs.com (or) www.ijpbsonline.com IJPBS |Volume 3| Issue 4 |OCT-DEC|2013|343-353
International Journal of Pharmacy and Biological Sciences (e-ISSN: 2230-7605)
Venisetty Rk* et al Int J Pharm Bio Sci www.ijpbs.com or www.ijpbsonline.com
Pag
e35
2
Fig. No 9:Chromatogram for Accuracy Level 100%
Fig. No 10: Chromatogram for Accuracy Level 150%
CONCLUSION
A simple, specific, precise, accurate, rapid and
isocratic reverse phase high performance liquid
chromatography (RP-HPLC) method was developed
and validated for simultaneous estimation of Aliskiren
and Amlodipine in tablet dosage form.
A simple, economic, accurate and precise HPLC
method was successfully developed. The method was
successfully validated in terms of linearity, precision,
accuracy& robustness, LOD, LOQ as per ICH
guidelines.
Using the optimized chromatographic conditions,
chromatograms of Aliskiren and amlodipine were
recorded. Calibration curves were obtained by using
peak area vs. concentration. The accuracy studies
were shown as % recovery for Aliskiren and
Amlodipine at 50%, 100% and 150%. The limit of %
recovered shown is in the range of 98-102% and the
results obtained were found to be within the limits.
Hence the method was found to be accurate. For
Intra-Day & Inter-day precision studies of Aliskiren
and Amlodipine was performed. %RSD was
determined from the peak areas and was found to be
not more than 2%. The proposed method is simple,
accurate and rapid.
Limit of detection (LOD) and Limit of quantification
(LOQ) were estimated from the signal-to-noise ratio.
Limit of detection of 1.37741µg/ml & 4.17396µg/ml &
limit of quantification of 0.73967µg/ml and
2.24142µg/ml for Aliskiren & Amlodipine respectively.
For robustness studies the chromatograms were
recorded for standard solutions of Aliskiren and
Available Online through
www.ijpbs.com (or) www.ijpbsonline.com IJPBS |Volume 3| Issue 4 |OCT-DEC|2013|343-353
International Journal of Pharmacy and Biological Sciences (e-ISSN: 2230-7605)
Venisetty Rk* et al Int J Pharm Bio Sci www.ijpbs.com or www.ijpbsonline.com
Pag
e35
3
Amlodipine by changing flow rate. Robustness studies
reveal that the method was reliable.
Hence the proposed method was found to be rapid,
accurate, precise, robust and economical. The mobile
phase is simple to prepare and economical. This
method is also having an advantage of short retention
time. The proposed method was a good approach for
obtaining reliable results & found to be suitable for
the routine analysis and quality control of
pharmaceutical preparations containing these drugs
either individually or in combination.
ACKNOWLEDGEMENT
The authors are thankful to Dr. Reddy’s Laboratories
were procured as gift samples from local market,
(Hyderabad, India), for providing gift sample of
Rosuvastatin and Ezetimibe for research. The authors
are grateful to Department of Pharmaceutical
Analysis, Sri Shivani College of Pharmacy, and
Affiliated to Kakatiya University, Warangal, Andra
Pradesh, India.
REFERENCES 1. http://www.drugbank.ca/drugs/DB00973.
2. http://www.drugbank.ca/drugs/DB01098.
3. S. S. Dhaneshwar, S. R. Dhaneshwar, P.
Deshpande, and M. Patil - Described a simple,
accurate and precise RP-HPLC method for the
Simultaneous densitometric estimation of
Atorvastatin calcium And Ezetamibe as the bulk
drug.. Journal of ACTA CHROMATOGRAPHIC, NO.
19, 2007
4. Anuradha K. Gajjar and Vishal D. Shah- Described
a simple, accurate and precise RP-HPLC method
for the Development and Validation of a Stability-
Indicating Reversed-Phase HPLC Method for
Simultaneous Estimation of Rosuvastatin and
Ezetimibe from Their Combination Dosage Forms.
Eurasian Journal of Analytical Chemistry 5(3): 265-
283, 2010
5. G.Krishnaveni , P.V.V. Sathyannarayana –
Described a simple, accurate and precise RP-HPLC
method for the Development and Validation of a
Reversed-Phase HPLC Method for Simultaneous
Estimation of Simvavastatin and Ezetimibe from
Their Combination Dosage Forms. International
Journal of Pharmaceutical and Life Sciences ISSN
2305-0330 Volume 2, Issue 2: March 2013
6. M. C. Sharma , Smita Sharmaa, D. V. Kohlib, A. D.
Sharmac, Describes a First order Derivative A
validated HPTLC method for determination of
simultaneous estimation Rosuvastatin Calcium
and Ezetimibe in pharmaceutical solid dosage
form Archives of Applied Science Research, 2010,
2 (1) 1-7ISSN 0975-508X CODEN (USA) AASRC9
7. Baokar Shrikrishna B., Erande R.S. and Shaikh S.G.,
revealed a simple, selective, accurate high
Performance Liquid Chromatographic (HPLC)
method was developed and validated for the
analysis of Ezetamibe. International Journal of
Research in Pharmaceutical and Biomedical
Sciences ISSN: 2229
*Corresponding Author: Venisetty Rk * Department of Pharmaceutical Analysis, Sri Shivani College Of Pharmacy, Mulugu Road, Warangal, Andhra Pradesh, India, 506001.