analytical perspectives - the white house
TRANSCRIPT
Analytical PerspectivesBudget of the U.S. GovernmentFISCAL YEAR 2022
OFFICE OF MANAGEMENT AND BUDGET
Analytical PerspectivesBudget of the U.S. GovernmentFISCAL YEAR 2022
OFFICE OF MANAGEMENT AND BUDGET
THE BUDGET DOCUMENTS
Budget of the United States Government, Fiscal Year 2022 contains the Budget Message of the President, information on the President’s priori-ties, and summary tables.
Analytical Perspectives, Budget of the United States Government, Fiscal Year 2022 contains analyses that are designed to highlight specified subject areas or provide other significant presenta-tions of budget data that place the budget in perspec-tive. This volume includes economic and accounting analyses, information on Federal receipts and collec-tions, analyses of Federal spending, information on Federal borrowing and debt, baseline or current ser-vices estimates, and other technical presentations.
Supplemental tables and other materials that are part of the Analytical Perspectives vol-ume are available at https://whitehouse.gov/omb/analytical-perspectives/.
Appendix, Budget of the United States Government, Fiscal Year 2022 contains detailed information on the various appropriations and funds that constitute the budget and is designed primarily for the use of the Appropriations Committees. The Appendix contains more detailed financial infor-mation on individual programs and appropriation accounts than any of the other budget documents. It includes for each agency: the proposed text of
appropriations language; budget schedules for each account; legislative proposals; narrative explana-tions of each budget account; and proposed general provisions applicable to the appropriations of entire agencies or group of agencies. Information is also provided on certain activities whose transactions are not part of the budget totals.
BUDGET INFORMATION AVAILABLE ONLINE
The President’s Budget and supporting materials are available online at https://whitehouse.gov/omb/budget/. This link includes electronic versions of all the budget volumes, supplemental materials that are part of the Analytical Perspectives volume, spread-sheets of many of the budget tables, and a public use budget database. This link also includes Historical Tables that provide data on budget receipts, outlays, surpluses or deficits, Federal debt, and Federal em-ployment over an extended time period, generally from 1940 or earlier to 2022 or 2026. Also available are links to documents and materials from budgets of prior years.
For more information on access to electronic ver-sions of the budget documents, call (202) 512-1530 in the D.C. area or toll-free (888) 293-6498. To pur-chase the printed documents call (202) 512-1800.
GENERAL NOTES1. All years referenced for budget data are
fiscal years unless otherwise noted. All years referenced for economic data are calendar years unless otherwise noted.
2. Detail in this document may not add to the totals due to rounding.
U.S. GOVERNMENT PUBLISHING OFFICE, WASHINGTON 2021

iii
Page
TABLE OF CONTENTS
List of Charts and Tables .......................................................................................................................v
Introduction
1. Introduction .................................................................................................................................3
Economic and Budget Analyses
2. Economic Assumptions and Overview ........................................................................................7
3. Long-Term Budget Outlook .......................................................................................................17
4. Federal Borrowing and Debt .....................................................................................................23
Management
5. Strengthening the Federal Workforce .......................................................................................41
Budget Concepts and Budget Process
6. Budget Concepts.........................................................................................................................55
7. Coverage of the Budget ..............................................................................................................79
Federal Receipts
8. Governmental Receipts ..............................................................................................................87
9. Offsetting Collections and Offsetting Receipts .........................................................................97
10. Tax Expenditures .....................................................................................................................105
Special Topics
11. Aid to State and Local Governments ......................................................................................149
12. Information Technology and Cybersecurity Funding .............................................................165
13. Federal Investment ..................................................................................................................171
14. Research and Development .....................................................................................................177
15. Credit and Insurance ...............................................................................................................181
16. Federal Drug Control Funding ................................................................................................201
Technical Budget Analyses
17. Current Services Estimates .....................................................................................................205
18. Trust Funds and Federal Funds ..............................................................................................215
19. Comparison of Actual to Estimated Totals .............................................................................229


v
LIST OF CHARTS AND TABLES


vii
LIST OF CHARTS AND TABLES
LIST OF CHARTS
2–1. Labor Underutilization: Alternative Measures ..........................................................................7
2–2. Contributions to Percent Change in 2020 Real GDP .................................................................8
2–3. Components of Real Personal Consumption Expenditures .......................................................8
2–4. Range of Uncertainty for the Budget Deficit ............................................................................15
3–1. Comparison of Annual Surplus/Deficit .....................................................................................18
3–2. Comparison of Publicly Held Debt ............................................................................................19
5–1. Masters Degree or Above by Year for Federal and Private Sectors .........................................48
5–2. High School Graduate or Less by Year for Federal and Private Sectors .................................48
5–3. Average Age by Year for Federal and Private Sectors ..............................................................48
5–4. Government-wide On-board U.S. Distribution 10-1-1978 ........................................................49
5–5. Government-wide On-board U.S. Distribution 1-1-2021 ..........................................................50
5–6. The Changing General Schedule Workforce .............................................................................50
5–7. Potential Retirees to Younger than 30 Employee: Federal Workforce .....................................51
5–8. Potential Retires to Younger than 30 Employees: Federal IT Workforce Vs. Federal Workforce ..........................................................................51
6–1. Relationship of Budget Authority to Outlays for 2022 .............................................................69
12–1. Trends in Federal Civilian IT Spending .................................................................................166
12–2. 2022 Federal Civilian IT Investment Portfolio .......................................................................166
15–1. Face Value of Federal Credit Outstanding ..............................................................................196
Page


ix
LIST OF TABLES
Economic and Budget Analyses
Economic Assumptions and Overview 2–1. Economic Assumptions ....................................................................................................... 9 2–2. Comparison of Economic Assumptions in the 2021 and 2022 Budgets .......................... 10 2–3. Comparison of Economic Assumptions ............................................................................. 11 2–4. Sensitivity of the Budget to Economic Assumptions ...................................................... 13 2–5. Forecast Errors, 2002-Present .......................................................................................... 14 2–6. Differences Between Estimated and Actual Surpluses or Deficits
for Five-Year Budget Estimates Since 1985 ................................................................ 15
Long-Term Budget Outlook 3–1. Intermediate Actuarial Projections for OASDI and HI, 2020 Trustees’ Reports ........... 19
Federal Borrowing and Debt 4–1. Trends in Federal Debt Held By the Public and Interest on the
Debt Held by the Public ................................................................................................. 24 4–2. Federal Government Financing and Debt ........................................................................ 26 4–3. Debt Held by the Public Net of Financial Assets and Liabilities .................................... 29 4–4. Agency Debt ....................................................................................................................... 31 4–5. Debt Held by Government Accounts ................................................................................. 33 4–6. Federal Funds Financing and Change in Debt Subject to Statutory Limit ................... 37 4–7. Foreign Holdings of Federal Debt ..................................................................................... 38
Management
Strengthening the Federal Workforce 5–1. Federal Civilian Employment in the Executive Branch .................................................... 43 5–2. Total Federal Employment ................................................................................................ 44 5–3. Occupations of Federal and Private Sector Workforces ................................................... 45 5–4. Personnel Pay and Benefits ............................................................................................... 46 5–5. Hiring Trends Since 2016 .................................................................................................. 47
Budget Concepts and Budget Process
Budget ConceptsBudget Calendar ............................................................................................................................... 57 6–1. Totals for the Budget and the Federal Government ........................................................ 62
Coverage of the Budget 7–1. Comparison of Total, On-Budget, and Off-Budget Transactions ..................................... 80
Federal Receipts
Governmental Receipts 8–1. Receipts by Source—Summary ......................................................................................... 87 8–2. Effect of Budget Proposals ................................................................................................ 89 8–3. Receipts by Source ............................................................................................................. 94
Offsetting Collections and Offsetting Receipts 9–1. Offsetting Collections and Offsetting Receipts from the Public ...................................... 99 9–2. Summary of Offsetting Receipts by Type ....................................................................... 100
Page
x
9–3. Gross Outlays, User Charges, Other Offsetting Collections and Offsetting Receipts from the Public, and Net Outlays ......................................................................................... 101
9–4. User Charge Proposals in the FY 2022 Budget ............................................................ 102 9–5. Offsetting Receipts by Type ................................................................................................. * 9–6. Offsetting Collections and Offsetting Receipts by Detail─2022 Budget ............................ *
Tax Expenditures 10–1. Estimates of Total Income Tax Expenditures for Fiscal Years 2020–2030 ................... 108 10–2a. Estimates of Total Corporate Income Tax Expenditures for
Fiscal Years 2020–2030 ................................................................................................ 114 10–2b. Estimates of Total Individual Income Tax Expenditures for
Fiscal Years 2020–2030 ................................................................................................ 119 10–3. Income Tax Expenditures Ranked by Total Fiscal Year 2021–2030
Projected Revenue Effect ............................................................................................. 124 10–4. Present Value of Selected Tax Expenditures for Activity in Calendar Year 2020 ........ 127
Special Topics
Aid to State and Local Governments 11–1. Trends in Federal Grants to State and Local Governments ......................................... 152 11–2. Federal Grants to State and Local Governments—Budget Authority and Outlays .... 153 11–3. Summary of Programs by Agency, Bureau, and Program .................................................. * 11–4. Summary of Programs by State ........................................................................................... * 11–5.–11–49. 2022 Budget Program State-by-State Tables ......................................................... *
Information Technology and Cybersecurity Funding 12–1. Estimated FY 2022 Civilian Federal IT Spending and Percentage by Agency ............ 167 12–2. Estimated Civilian Federal Cybersecurity Spending by Agency .................................. 168 12–3. NIST Framework Function Civilian CFO Act Agency Funding Totals ........................ 169
Federal Investment 13–1. Composition of Federal Investment Outlays .................................................................. 172 13–2. Federal Investment Budget Authority and Outlays: Grant
and Direct Federal Programs ...................................................................................... 173
Research and Development 14–1. Federal Research and Development Spending .............................................................. 178
Credit and Insurance 15–1. Estimated Future Cost of Outstanding Federal Credit Programs ................................ 196 15–2. Direct Loan Subsidy Rates, Budget Authority, and Loan Levels, 2020–2022 .............. 197 15–3. Loan Guarantee Subsidy Rates, Budget Authority, and Loan Levels, 2020–2022 ....... 199 15–4. Summary of Federal Direct Loans and Loan Guarantees ............................................. 200 15–5. Reestimates of Credit Subsidies on Loans Disbursed Between 1992-2020 ....................... * 15–6. Face Value of Government-Sponsored Lending .................................................................. * 15–7. Lending and Borrowing by Government-Sponsored Enterprises (GSEs) ......................... * 15–8. Direct Loan Transactions of the Federal Government ....................................................... * 15–9. Guaranteed Loan Transactions of the Federal Government .............................................. * 15–10. Change in Programmatic Costs of Troubled Asset Relief Program ................................... * 15–11. Troubled Asset Relief Program Current Value ................................................................... *
Page
*Available on the internet at http://www.whitehouse.gov/omb/analytical-perspectives/

xi
15–12. Troubled Asset Relief Program Effects on the Deficit and Debt ........................................ * 15–13. Troubled Asset Relief Program Effects on the Deficit and
Debt Calculated on a Cash Basis ..................................................................................... * 15–14. Troubled Asset Relief Program Reestimates ....................................................................... * 15–15. Detailed TARP Program Levels and Costs .......................................................................... * 15–16. Comparison of CBO and OMB TARP Costs ........................................................................ *
Federal Drug Control Funding 16–1. Drug Control Funding FY 2020—FY 2022 .................................................................... 201
Technical Budget Analyses
Current Services Estimates 17–1. Category Totals for the Baseline ..................................................................................... 205 17–2. Summary Of Economic Assumptions ............................................................................. 207 17–3. Baseline Beneficiary Projections for Major Benefit Programs ...................................... 208 17–4. Impact of Regulations, Expiring Authorizations, and
Other Assumptions in the Baseline ................................................................................. * 17–5. Receipts by Source in the Projection of Baseline ........................................................... 209 17–6. Effect on Receipts of Changes in the Social Security Taxable Earnings Base ............. 210 17–7. Change in Outlay Estimates by Category in the Baseline ............................................ 210 17–8. Outlays by Function in the Baseline .............................................................................. 211 17–9. Outlays by Agency in the Baseline ................................................................................. 212 17–10. Budget Authority by Function in the Baseline .............................................................. 213 17–11. Budget Authority by Agency in the Baseline ................................................................. 21417–12. Current Services Budget Authority and Outlays by Function, Category, and Program ... *
Trust Funds and Federal Funds 18–1. Receipts, Outlays and Surplus or Deficit by Fund Group ............................................. 217 18–2. Comparison of Total Federal Fund and Trust Fund Receipts to
Unified Budget Receipts, Fiscal Year 2020 ................................................................. 218 18–3. Income, Outgo, and Balances of Trust Funds Group ..................................................... 219 18–4. Income, Outgo, and Balances of Major Trust Funds ...................................................... 221 18–5. Income, Outgo, and Balances of Selected Special Funds ............................................... 228
Comparison of Actual to Estimated Totals 19–1. Comparison of Actual 2020 Receipts with the Initial Current Services Estimates ..... 229 19–2. Comparison of Actual 2020 Outlays with the Initial Current Services Estimates ...... 230 19–3. Comparison of the Actual 2020 Deficit with the Initial Current Services Estimate ... 231 19–4. Comparison of Actual and Estimated Outlays for Mandatory
and Related Programs Under Current Law ............................................................... 232 19–5. Reconciliation of Final Amounts For 2020 ..................................................................... 233
Detailed Functional Tables
20–1. Budget Authority and Outlays by Function, Category and Program ................................ *
Federal Budget by Agency and Account
21–1. Federal Budget by Agency and Account .............................................................................. * Calfed Bay-Delta Federal Budget Crosscut Report ........................................................................... * Columbia River Basin Federal Budget Crosscut Report ................................................................... *
Page
*Available on the internet at http://www.whitehouse.gov/omb/analytical-perspectives/


1
INTRODUCTION


3
1. INTRODUCTION
The Analytical Perspectives volume presents analyses that highlight specific subject areas or provide other sig-nificant data that place the President’s 2022 Budget in context and assist the public, policymakers, the media, and researchers in better understanding the Budget. This volume complements the main Budget volume, which presents the President’s Budget policies and priorities, and the Budget Appendix volume, which provides ap-propriations language, schedules for budget expenditure accounts, and schedules for selected receipt accounts.
Presidential Budgets have included separate analyti-cal presentations of this kind for many years. The 1947 Budget and subsequent budgets included a separate sec-tion entitled Special Analyses and Tables that covered four, and later more, topics. For the 1952 Budget, the section was expanded to 10 analyses, including many subjects still covered today, such as receipts, investment, credit programs, and aid to State and local governments. With the 1967 Budget this material became a separate volume entitled Special Analyses, and included 13 chap-ters. The material has remained a separate volume since then, with the exception of the Budgets for 1991–1994, when all of the budget material was included in one volume. Beginning with the 1995 Budget, the volume has been named Analytical Perspectives. Since the 2022 Budget is being released following a presidential tran-sition, OMB is publishing an abbreviated Analytical Perspectives volume this year. The 2023 Budget will include a more comprehensive Analytical Perspectives vol-ume with additional key updates on areas including the Government’s mission performance goals and objectives and the President’s Management Agenda (PMA), effective utilization of Federal real property, statistics that offer a numerical picture of the United States and an overview of statistical agency budgets and priorities, and the impor-tance of using evidence, evaluation, and data to improve Government effectiveness.
In addition to the information included in this vol-ume, supplemental tables and other materials that are part of the Analytical Perspectives volume are available at http://www.whitehouse.gov/omb/analytical-perspec-tives. Tables included at this link are shown in the List of Tables in the front of this volume with an asterisk instead of a page number.
Overview of the Chapters
Economic and Budget Analyses
Economic Assumptions and Overview. This chap-ter reviews recent economic developments; presents the Administration’s assessment of the economic situation and outlook; compares the economic assumptions on
which the 2022 Budget is based with the assumptions for last year’s Budget and those of other forecasters; pro-vides sensitivity estimates for the effects on the Budget of changes in specified economic assumptions; and reviews past errors in economic projections.
Long-Term Budget Outlook. This chapter assesses the long-term budget outlook under current policies and under the Budget’s proposals. It focuses on 25-year projections of Federal deficits and debt to illustrate the long-term impact of the Administration’s proposed poli-cies. It also discusses the uncertainties of the long-term budget projections and discusses the actuarial status of the Social Security and Medicare programs.
Federal Borrowing and Debt. This chapter analyzes Federal borrowing and debt and explains the budget es-timates. It includes sections on special topics such as trends in debt, debt held by the public net of financial as-sets and liabilities, investment by Government accounts, and the statutory debt limit.
Management
Strengthening the Federal Workforce. This chapter presents summary data on Federal employment and com-pensation, and discusses the approach the Administration is taking with Federal human capital management.
Budget Concepts and Budget Process
Budget Concepts. This chapter includes a basic descrip-tion of the budget process, concepts, laws, and terminology, and includes a glossary of budget terms. It also discusses proposals specific to the 2022 Budget to improve budget-ing under certain budget concepts.
Coverage of the Budget. This chapter describes activi-ties that are included in budget receipts and outlays (and are therefore classified as “budgetary”) as well as those activities that are not included in the Budget (and are therefore classified as “non-budgetary”). The chapter also defines the terms “on-budget” and “off-budget” and in-cludes illustrative examples.
Federal Receipts
Governmental Receipts. This chapter presents informa-tion on estimates of governmental receipts, which consist of taxes and other compulsory collections. It includes descrip-tions of tax-related legislation enacted in the last year and describes proposals affecting receipts in the 2022 Budget.
Offsetting Collections and Offsetting Receipts. This chapter presents information on collections that offset outlays, including collections from transactions with the public and intragovernmental transactions. In addition, this chapter presents information on “user fees,” charges associated with market-oriented activities and regulatory fees. Detailed tables of offsetting receipts and offsetting
4ANALYTICAL PERSPECTIVES
collections in the Budget are available at the internet ad-dress cited above.
Tax Expenditures. This chapter describes and pres-ents estimates of tax expenditures, which are defined as revenue losses from special exemptions, credits, or other preferences in the tax code.
Special Topics
Aid to State and Local Governments. This chapter pres-ents crosscutting information on Federal grants to State and local governments. The chapter also includes a table showing historical grant spending, and a table with bud-get authority and outlays for grants in the Budget. Tables showing State-by-State spending for major grant pro-grams are available at the internet address cited above.
Information Technology and Cybersecurity. This chap-ter addresses Federal information technology (IT) and cybersecurity, highlighting initiatives and proposed fund-ing levels to deliver critical citizen services, keep sensitive data and systems secure, and further the vision of modern Government. The Administration will invest in modern, secure technologies and services to drive enhanced effi-ciency and effectiveness. This will include undertaking complex Government-wide modernization efforts, driving improved delivery of citizen-facing services, and improv-ing the overall management of the Federal IT portfolio. The Administration will also continue its efforts to fur-ther build the Federal IT workforce and seek to reduce the Federal Government’s cybersecurity risk in order to better serve and protect the American public.
Federal Investment. This chapter discusses federally financed spending that yields long-term benefits. It pres-ents information on annual spending on physical capital, research and development, and education and training.
Research and Development. This chapter presents a crosscutting review of research and development funding in the Budget.
Credit and Insurance. This chapter provides cross-cutting analyses of the roles, risks, and performance of Federal credit and insurance programs and Government-sponsored enterprises (GSEs). The chapter covers the major categories of Federal credit (housing, education, small business and farming, energy and infrastructure, and international) and insurance programs (deposit in-surance, pension guarantees, disaster insurance, and insurance against terrorism-related risks). Five addi-tional tables address transactions including direct loans, guaranteed loans, and GSEs. These tables are available at the internet address cited above.
Federal Drug Control Funding. This chapter displays enacted and proposed drug control funding for Federal Departments and Agencies.
Technical Budget Analyses
Current Services Estimates. This chapter discusses the conceptual basis of the Budget’s current services, or “baseline,” estimates, which are generally consistent with the baseline rules in the Balanced Budget and Emergency
Deficit Control Act of 1985 (BBEDCA). The chapter pres-ents estimates of receipts, outlays, and the deficit under this baseline. Two detailed tables addressing factors that affect the baseline and providing details of baseline bud-get authority and outlays are available at the internet address cited above.
Trust Funds and Federal Funds. This chapter provides summary information about the two fund groups in the Budget—Federal funds and trust funds. In addition, for the major trust funds and certain Federal fund programs, the chapter provides detailed information about income, outgo, and balances.
Comparison of Actual to Estimated Totals. This chap-ter compares the actual receipts, outlays, and deficit for 2020 with the estimates for that year published in the 2020 Budget, published in March 2019.
The following materials are available at the internet address cited above.
Detailed Functional Table
Detailed Functional Table. Table 20–1, “Budget Authority and Outlays by Function, Category, and Program,” displays budget authority and outlays for major Federal program categories, organized by budget function (such as healthcare, transportation, or national defense), category, and program.
Federal Budget by Agency and Account
Federal Budget by Agency and Account. Table 21–1, “Federal Budget by Agency and Account,” displays bud-get authority and outlays for each account, organized by agency, bureau, fund type, and account.
Budgets of the Federal Statistical Agencies
Budgets of the Federal Statistical Agencies. Table 22-1, “Budgets of the Federal Statistical Agencies,” displays the budgets of the Principle Statistical Agencies recognized by OMB, organized by agency.
Calfed Bay-Delta Program Federal Budget Crosscut
Calfed Bay-Delta Program Crosscut. The Calfed Bay-Delta Program interagency budget crosscut report provides an estimate of Federal funding by each of the participating Federal Agencies with authority and pro-grammatic responsibility for implementing this program, fulfilling the reporting requirements of section 106(c) of Public Law 108–361.
Columbia River Basin Federal Budget Crosscut
Columbia River Basin Federal Budget Crosscut. The Columbia River interagency budget crosscut report in-cludes an estimate of Federal funding by each of the participating Federal agencies to carry out restoration activities within the Columbia River Basin, fulfilling the reporting requirements of section 123 of the Clean Water Act (33 U.S.C. 1275).

5
ECONOMIC AND BUDGET ANALYSES

7
2. ECONOMIC ASSUMPTIONS AND OVERVIEW
This chapter presents the economic assumptions that underlie the Administration’s 2022 Budget.1 It provides an overview of the recent performance of the American economy, presents the Administration’s projections for key macroeconomic variables, compares them to forecasts prepared by other prominent institutions, and discusses the unavoidable uncertainty inherent in providing long-term forecasts.
This chapter proceeds as follows:The first section provides an overview of the recent
functioning of the U.S. economy, examining the perfor-mance of a broad array of key economic indicators.
The second section presents a detailed exposition of the Administration’s economic assumptions underlying the 2022 Budget, discussing how key macroeconomic vari-ables are expected to evolve over the years 2021 to 2031.
The third section compares the forecast of the Administration with those of the Congressional Budget Office (CBO), the Federal Open Market Committee of the Federal Reserve, and the Blue Chip panel of private-sec-tor forecasters.
The fourth section discusses the sensitivity of the Administration’s projections of Federal receipts and out-lays to alternative paths of macroeconomic variables.
The fifth section considers the errors in past Administrations’ forecasts, comparing them with the er-rors in forecasts produced by the CBO and the Blue Chip panel of private professional forecasters.
The sixth section uses information on past accuracy of Administration forecasts to provide understanding
1 Economic performance, unless otherwise specified, is discussed in terms of calendar years (January-December). Budget figures are dis-cussed in terms of fiscal years (October-September).
and insight into the uncertainty associated with the Administration’s current forecast of the budget balance.
Recent Economic Performance2
The onset of the COVID-19 pandemic was marked by a sharp recession with steep declines across all prominent U.S. economic indicators. Unlike a typical recession, the effects of the recession were most acutely felt by those in the service and retail sectors, where social distancing be-havior limited overall spending and activity. The economy plunged in the second quarter of 2020 and has partially rebounded in the quarters since, yet GDP remains below its pre-pandemic peak. Gains continue to be made in la-bor force participation while employers have added over 1.5 million jobs since the beginning of 2021.
Looking forward, consumers and businesses alike are showing increasing optimism following the passage of the American Rescue Plan Act of 2021 and significant prog-ress in controlling the pandemic. Both the University of Michigan and Conference Board indicators for con-sumer sentiment and consumer confidence, respectively, have increased substantially over the past few months. Improvements in consumer sentiment signal increased consumer spending heading into the summer months. Businesses are also exhibiting optimism, as seen in the re-cent high levels of the ISM Purchasing Managers Index, a survey of business activity at manufacturing companies.
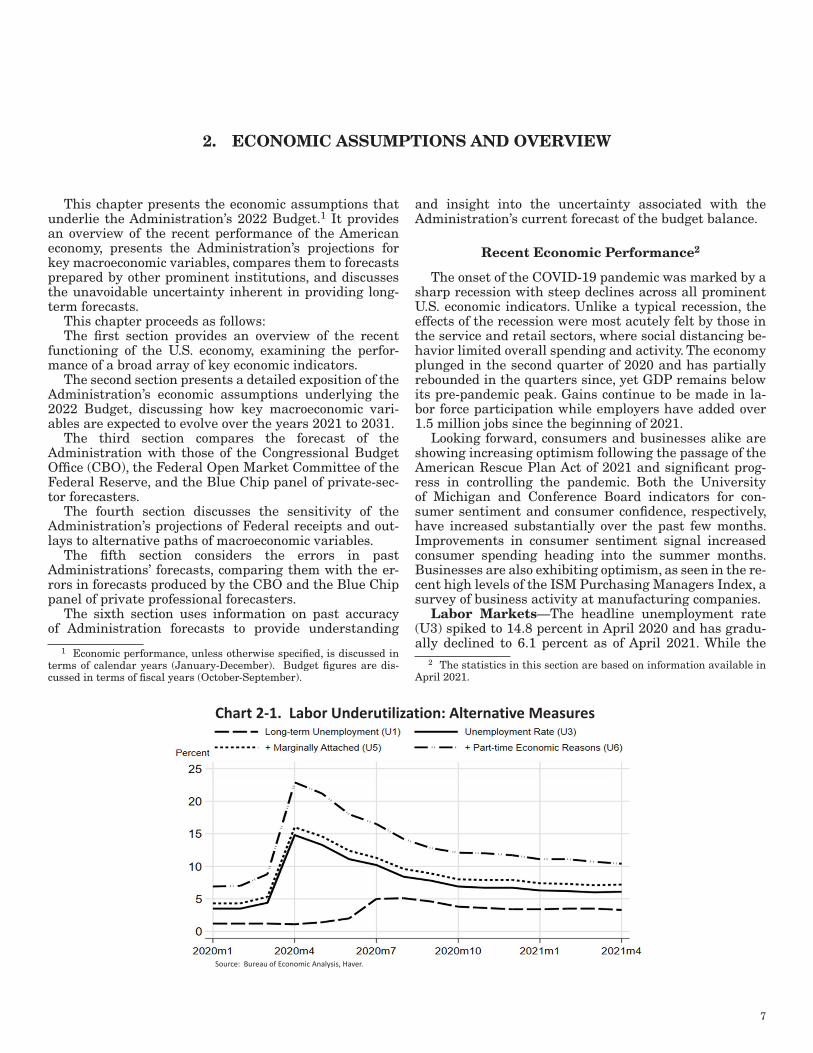
Labor Markets—The headline unemployment rate (U3) spiked to 14.8 percent in April 2020 and has gradu-ally declined to 6.1 percent as of April 2021. While the
2 The statistics in this section are based on information available in April 2021.
Chart 2-1. Labor Underutilization: Alternative Measures
Source: Bureau of Economic Analysis, Haver.
8ANALYTICAL PERSPECTIVES
decline in the unemployment rate is a positive sign for the economy, and the Blue Chip panel of professional fore-casters projects that the unemployment rate will fall to an average of 4.7 percent during 2022, several important labor market indicators still show signs of weakness.
By looking at alternative measures of labor unde-rutilization (Chart 2-1), we can get a clearer picture of the state of employment. The U5 unemployment rate, which includes those workers who identify as margin-ally attached to the workforce, is 7.2 percent as of April.3 Including workers who are working part-time for econom-ic reasons (U6), the rate is 10.4 percent. Additionally, not only do millions of Americans remain unemployed—9.8 million as of April, a 72.0 percent increase from February 2020—but the duration of unemployment remains elevat-
3 The BLS defines marginally attached workers as persons who are not in the labor force, want and are available for work, and had looked for a job sometime in the prior 12 months. They are not counted as un-employed because they had not searched for work in the prior 4 weeks.
ed as well. The long-term unemployment rate (U1), which measures the percent of the labor force unemployed for 15 weeks or longer, is 3.3 percent as of April; this is almost three times as high as the pre-pandemic rate of 1.2 per-cent from February 2020. Moreover, the median duration of unemployment in April was 19.8 weeks, which is the highest this indicator has been since October 2012.
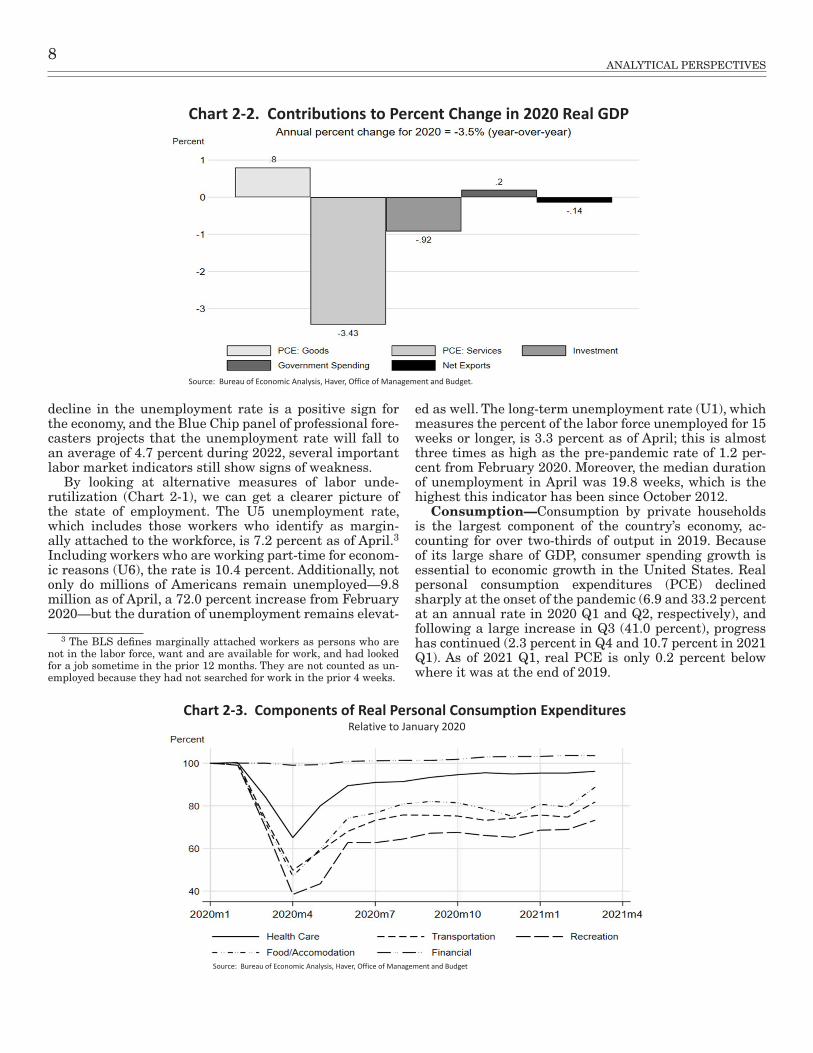
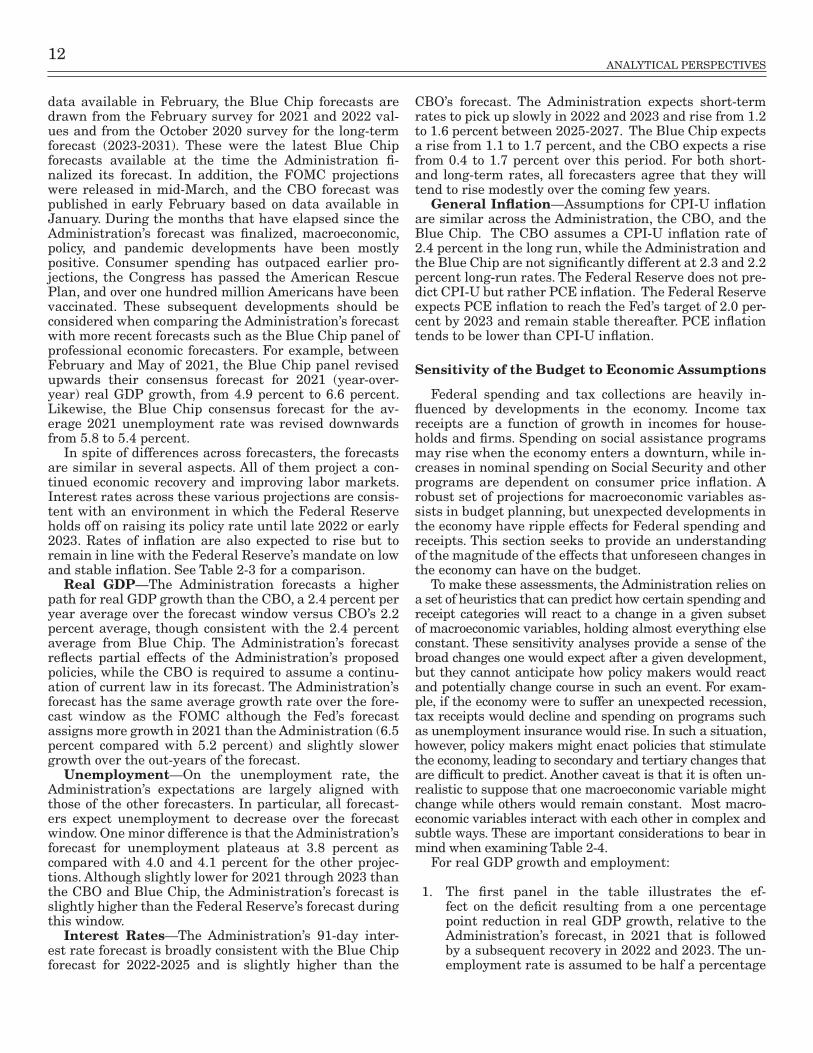
Consumption—Consumption by private households is the largest component of the country’s economy, ac-counting for over two-thirds of output in 2019. Because of its large share of GDP, consumer spending growth is essential to economic growth in the United States. Real personal consumption expenditures (PCE) declined sharply at the onset of the pandemic (6.9 and 33.2 percent at an annual rate in 2020 Q1 and Q2, respectively), and following a large increase in Q3 (41.0 percent), progress has continued (2.3 percent in Q4 and 10.7 percent in 2021 Q1). As of 2021 Q1, real PCE is only 0.2 percent below where it was at the end of 2019.
Chart 2-2. Contributions to Percent Change in 2020 Real GDP
Source: Bureau of Economic Analysis, Haver, Office of Management and Budget.
Chart 2-3. Components of Real Personal Consumption ExpendituresRelative to January 2020
Source: Bureau of Economic Analysis, Haver, Office of Management and Budget

2. ECONOMIC ASSUMPTIONS AND OVERVIEW 9
A prominent story of the pandemic has been the extent of the economic damage in specific sectors, particularly services. Chart 2-2 illustrates that a decline in the com-bined consumption of goods and services accounted for 75 percent of the total decline in real GDP for the year as a whole in 2020. Looking at the composition of services con-sumption, Chart 2-3 shows that several prominent service sectors are still considerably below pre-pandemic levels.
Nonresidential Fixed Investment—Real nonresi-dential fixed investment declined at an annual rate of 4.0 percent in 2020 (year-over-year). Equipment and intel-lectual property investment have recovered strongly in recent quarters, although business structures investment remains slow.
The Government Sector—Topline real government expenditures on consumption and investment increased 1.1 percent in 2020 (year-over-year), which includes a 4.3 percent increase in Federal spending partially offset by a 0.8 percent decline in State and Local spending. Within the Federal spending category, nondefense spending rose 5.6 percent while defense spending increased 3.5 percent.
Federal Reserve Policy—The Federal Reserve’s re-sponse to the COVID-19 pandemic can be grouped into three main categories: lowering the policy rate, stabiliz-ing financial markets, and supporting the flow of credit in the economy.4 First, the Fed’s monetary policymaking
4 See the following Fed blog post for a more detailed description of the
body—the Federal Open Market Committee (FOMC)—quickly lowered the target range for the federal funds rate. The federal funds rate, which serves as the FOMC’s policy interest rate, is the rate that banks charge each other for overnight loans. In an effort to forestall negative economic impacts from the pandemic, the FOMC rapidly lowered the federal funds rate from an average of 1.59 in January 2020 to 0.08 by the end of March 2020, and this rate currently sits within the target range of 0 to 0.25 per-cent as of April 2021. This step helped reduce borrowing costs for households and businesses.
During its March 2021 meeting the FOMC announced it would maintain the target range for the federal funds rate at 0 to 0.25 percent. In its accompanying statement, the Committee repeated that it will not raise the federal funds rate target range “until labor market conditions have reached levels consistent with the Committee’s as-sessments of maximum employment and inflation has risen to 2 percent and is on track to moderately exceed 2 percent for some time.”
Second, the Fed took a number of steps to unfreeze key financial markets and to help them run smoothly. In many cases this involved the purchases of securities and assets that were otherwise difficult to sell. These purchases con-
Fed’s policy response to the pandemic: https://www.stlouisfed.org/open-vault/2020/august/fed-response-covid19-pandemic
Table 2–1. ECONOMIC ASSUMPTIONS 1
(Calendar Years, Dollar Amounts In Billions)
Actual2019
Projections
2020 2021 2022 2023 2024 2025 2026 2027 2028 2029 2030 2031
Gross Domestic Product (GDP)Levels, Dollar Amounts in Billions:
Current Dollars �������������������������������������������������������� 21,433 20,933 22,411 23,799 24,808 25,778 26,767 27,794 28,860 29,986 31,166 32,414 33,723Real, Chained (2012) Dollars ���������������������������������� 19,092 18,423 19,375 20,200 20,652 21,039 21,418 21,803 22,196 22,609 23,039 23,491 23,961Chained Price Index (2012=100), Annual Average � 112 114 116 118 120 123 125 128 130 133 135 138 141
Percent Change, Fourth Quarter over Fourth Quarter:Current Dollars �������������������������������������������������������� 4�0 -1�2 7�1 5�2 4�0 3�8 3�8 3�8 3�8 3�9 3�9 4�0 4�0Real, Chained (2012) Dollars ���������������������������������� 2�3 -2�5 5�2 3�2 2�0 1�8 1�8 1�8 1�8 1�9 1�9 2�0 2�0Chained Price Index (2012=100) ����������������������������� 1�6 1�3 1�8 1�9 2�0 2�0 2�0 2�0 2�0 2�0 2�0 2�0 2�0
Incomes, Billions of Current DollarsDomestic Corporate Profits ������������������������������������� 1,745 1,616 1,529 1,725 1,795 1,861 1,880 1,854 1,828 1,825 1,849 1,900 1,955Employee Compensation ����������������������������������������� 11,432 11,489 12,247 12,907 13,416 13,909 14,435 15,018 15,642 16,305 17,002 17,730 18,491Wages and Salaries ������������������������������������������������ 9,309 9,369 10,047 10,491 10,918 11,383 11,818 12,296 12,812 13,352 13,930 14,526 15,159Nonwage Personal Income �������������������������������������� 5,413 5,409 5,324 5,522 5,806 6,096 6,436 6,747 7,094 7,371 7,650 7,984 8,265
Consumer Price Index (All Urban) 3:Level (1982-1984 = 100), Annual Average �������������� 249 252 258 263 269 275 281 287 294 301 307 314 321Percent Change, Fourth Quarter over Fourth
Quarter ��������������������������������������������������������������� 1�9 1�3 2�0 2�1 2�2 2�3 2�3 2�3 2�3 2�3 2�3 2�3 2�3
Unemployment Rate, Civilian, PercentAnnual Average ������������������������������������������������������� 3�7 8�1 5�5 4�1 3�8 3�8 3�8 3�8 3�8 3�8 3�8 3�8 3�8
Interest Rates, Percent91-Day Treasury Bills 2 ��������������������������������������������� 2�1 0�4 0�1 0�2 0�4 0�8 1�2 1�5 1�6 1�7 1�8 2�1 2�310-Year Treasury Notes ������������������������������������������� 2�1 0�9 1�2 1�4 1�7 2�1 2�4 2�6 2�7 2�8 2�8 2�8 2�8
1 Based on information available as of mid-February 20212 Average rate, secondary market (bank discount basis)3 Seasonally Adjusted

10ANALYTICAL PERSPECTIVES
veyed to the public that the Fed stands ready to assist important parts of the financial system.
Third, the Fed introduced several temporary lending and funding facilities to support the flow of credit to busi-nesses and households. Overall, the Fed has introduced multiple temporary facilities to support various types of funding and credit markets. Two of the commonly dis-cussed facilities are the Paycheck Protection Program Liquidity Facility, established to help small businesses keep workers on the payroll, and the Main Street Lending Program (a set of five facilities), established to support lending to both small and midsized businesses and non-profit organizations.
Economic Projections
The Administration’s forecast was finalized on February 19, with the parameters of that forecast close to the consensus prevailing at that date. The forecast in-forms the 2022 Budget and assumes implementation of the Administration’s policy proposals. Importantly, how-ever, the projections described below were formulated before the details of the American Jobs Plan (AJP) and American Families Plan (AFP) were finalized and there-fore do not incorporate the full impact of these policies. The Administration’s projections are reported in Table 2-1 and summarized below.
Real GDP—In 2021, as the economy recovers from the COVID-19 pandemic, the Administration forecast assumes a strong recovery in civilian employment, as-sociated with a rebound at a fourth quarter-over-fourth quarter rate of 5.2 percent. As noted below, growth to date in 2021 has been strong, and private forecasters
now project somewhat more rapid 2021 growth than in the Administration forecast. As the economy continues to recover and the employment picture improves, growth is projected to be 3.2 percent in 2022. Real GDP is projected to return to its long-run “potential” level by 2023 and is forecasted to grow at an average of 1.9 percent between 2024 and 2031.
Unemployment—As of December 2020, the unem-ployment rate stood at 6.7 percent, a substantial recovery from the peak rate of 14.8 percent in April 2020 but still high relative to historical levels. The Administration expects a rapid and strong recovery in unemployment coinciding with progress in controlling the pandemic, with the unemployment rate dropping to 4.7 percent by the end of 2021. The Administration then forecasts un-employment rates will drop to 4.1 percent by 2022 before leveling out at 3.8 percent from 2023-2031.
Interest Rates—Interest rates are expected to rise as the economy recovers from the recession and as infla-tion rises and then stabilizes around the Federal Reserve target rate of 2 percent. The 91-day Treasury bill rate is expected to steadily rise from an average of 0.1 percent in 2021 to 1.2 percent in 2025, then gradually increase to a terminal rate of 2.3 percent. The 10-year rate follows a similar path as it increases from 1.4 percent in 2021 to 2.4 percent by 2025, reaching 2.8 percent at the end of the budget window, which reflects both the increase in short-term rates and an increase in the term premium for investors committing to holding long-term securities.
General Inflation—The Administration’s forecast assumes that inflation will return to a long run trend. Specifically, the Administration’s forecast assumes that the Consumer Price Index for all Urban Consumers
Table 2–2. COMPARISON OF ECONOMIC ASSUMPTIONS IN THE 2021 AND 2022 BUDGETS
2019 2020 2021 2022 2023 2024 2025 2026 2027 2028 2029 2030
Real GDP (Percent Change)1:2021 Budget Assumptions ����������������������������������������������������������� 2�5 2�5 3�1 3�0 3�0 3�0 3�0 2�9 2�8 2�8 2�8 2�82022 Budget Assumptions ����������������������������������������������������������� 2�3 –2�5 5�2 3�2 2�0 1�8 1�8 1�8 1�8 1�9 1�9 2�0
GDP Price Index (Percent Change)1:2021 Budget Assumptions ����������������������������������������������������������� 2�3 1�8 2�0 2�0 2�0 2�0 2�0 2�0 2�0 2�0 2�0 2�02022 Budget Assumptions ����������������������������������������������������������� 1�6 1�3 1�8 1�9 2�0 2�0 2�0 2�0 2�0 2�0 2�0 2�0
Consumer Price Index (All-Urban; Percent Change)1:2021 Budget Assumptions ����������������������������������������������������������� 2�2 1�9 2�3 2�3 2�3 2�3 2�3 2�3 2�3 2�3 2�3 2�32022 Budget Assumptions ����������������������������������������������������������� 1�9 1�3 2�0 2�1 2�2 2�3 2�3 2�3 2�3 2�3 2�3 2�3
Civilian Unemployment Rate (Percent)1:2021 Budget Assumptions ����������������������������������������������������������� 3�9 3�7 3�5 3�6 3�8 4�0 4�0 4�0 4�0 4�0 4�0 4�02022 Budget Assumptions ����������������������������������������������������������� 3�7 8�1 5�5 4�1 3�8 3�8 3�8 3�8 3�8 3�8 3�8 3�8
91-Day Treasury Bill Rate (Percent)2:2021 Budget Assumptions ����������������������������������������������������������� 1�9 2�1 1�4 1�5 1�5 1�6 1�7 2�0 2�2 2�4 2�5 2�52022 Budget Assumptions ����������������������������������������������������������� 2�1 0�4 0�1 0�2 0�4 0�8 1�2 1�5 1�6 1�7 1�8 2�1
10-Year Treasury Note Rate (Percent)2:2021 Budget Assumptions ����������������������������������������������������������� 2�9 2�2 2�0 2�2 2�5 2�7 3�0 3�1 3�1 3�1 3�2 3�22022 Budget Assumptions ����������������������������������������������������������� 2�1 0�9 1�2 1�4 1�7 2�1 2�4 2�6 2�7 2�8 2�8 2�8
1 % Change 4Q2 Calendar Year Average

2. ECONOMIC ASSUMPTIONS AND OVERVIEW 11
(CPI-U) will rise from 1.2 percent in 2020 on a fourth quarter-over-fourth quarter basis to 2.0 percent in 2021 and stabilize at 2.3 percent from 2024 to 2031, a rate consistent with the Federal Open Market Committee’s inflation target for a slightly different inflation measure.
Comparison with Other Forecasts
For perspective on the Administration’s forecast, this section compares it with forecasts prepared around the same time by the CBO, the Federal Open Market Committee of the Federal Reserve (FOMC), and the Blue Chip panel of private-sector forecasters. There are impor-tant differences that should inform such comparisons.
The most important difference between these forecasts is that they make different assumptions about the imple-mentation of the Administration’s proposed policies. As
already noted, the Administration’s forecast assumes im-pacts of Administration policies, including the American Rescue Plan and components of the American Jobs and American Families Plans. In contrast, the CBO forecast assumes no changes to current law and was formulated prior to passage of the American Rescue Plan. It is not clear to what extent FOMC participants and Blue Chip panelists incorporate policy implementation expecta-tions in their respective outlooks. The Blue Chip panel, in particular, comprises a large number of private-sector forecasters, who have different expectations about the enactment of the Administration’s proposed policies and different views about the contribution of those policies to economic growth.
A second difference is that the various forecasts were published on different dates. For example, while the forecast published by the Administration is based on
Table 2–3. COMPARISON OF ECONOMIC ASSUMPTIONS 1
2020 2021 2022 2023 2024 2025 2026 2027 2028 2029 2030 2031
Real GDP (Year-over-Year):2022 Budget ���������������������������������������������������������������������������� –3�5 5�2 4�3 2�2 1�9 1�8 1�8 1�8 1�9 1�9 2�0 2�0CBO ����������������������������������������������������������������������������������������� –3�4 4�6 2�9 2�2 2�3 2�3 1�9 1�6 1�6 1�6 1�5 1�6Blue Chip 2 ������������������������������������������������������������������������������� 4�9 3�8 2�3 2�4 2�0 2�0 1�9 1�9 1�9 1�9 1�9
Real GDP (Fourth-Quarter-over-Fourth-Quarter):2022 Budget ���������������������������������������������������������������������������� –2�5 5�2 3�2 2�0 1�8 1�8 1�8 1�8 1�9 1�9 2�0 2�0Federal Reserve 3 �������������������������������������������������������������������� –2�4 4�2 3�2 2�4 1�8 1�8 1�8 1�8 1�8 1�8 1�8 1�8
Consumer Price Index (CPI-U) (Fourth-Quarter-over-Fourth-Quarter):2022 Budget ���������������������������������������������������������������������������� 1�3 2�0 2�1 2�2 2�3 2�3 2�3 2�3 2�3 2�3 2�3 2�3CBO ����������������������������������������������������������������������������������������� 1�1 1�9 2�2 2�3 2�3 2�4 2�4 2�5 2�5 2�4 2�4 2�3Blue Chip 2, 4 ���������������������������������������������������������������������������� 2�3 2�1 2�2 2�2 2�2 2�2 2�2 2�2 2�2 2�2 2�2Federal Reserve, PCE 3, 5 ������������������������������������������������������� 1�2 1�8 1�9 2�0 2�0 2�0 2�0 2�0 2�0 2�0 2�0 2�0
Unemployment Rate: (annual averages)2022 Budget ���������������������������������������������������������������������������� 8�1 5�5 4�1 3�8 3�8 3�8 3�8 3�8 3�8 3�8 3�8 3�8CBO ����������������������������������������������������������������������������������������� 8�1 5�7 5�0 4�7 4�4 4�1 3�9 3�9 4�0 4�1 4�3 4�3Blue Chip 2 ������������������������������������������������������������������������������� 5�8 4�7 4�8 4�5 4�3 4�4 4�3 4�3 4�3 4�3 4�3Federal Reserve 3, 6 ����������������������������������������������������������������� 6�7 5�0 4�2 3�7 4�1 4�1 4�1 4�1 4�1 4�1 4�1 4�1
Interest Rates:
91-Day Treasury Bills (discount basis):2022 Budget ���������������������������������������������������������������������������� 0�4 0�1 0�2 0�4 0�8 1�2 1�5 1�6 1�7 1�8 2�1 2�3CBO ����������������������������������������������������������������������������������������� 0�4 0�1 0�1 0�2 0�3 0�6 1�0 1�4 1�6 1�9 2�2 2�3
Blue Chip 2 ������������������������������������������������������������������������������� 0�1 0�2 0�6 0�9 1�1 1�3 1�7 1�7 1�7 1�7 1�7
10-Year Treasury Notes2022 Budget ���������������������������������������������������������������������������� 0�9 1�2 1�4 1�7 2�1 2�4 2�6 2�7 2�8 2�8 2�8 2�8CBO ����������������������������������������������������������������������������������������� 0�9 1�1 1�3 1�5 1�8 2�1 2�5 2�7 3�0 3�2 3�3 3�4Blue Chip 2 ������������������������������������������������������������������������������� 1�2 1�6 1�7 2�0 2�2 2�3 2�5 2�5 2�5 2�5 2�5
Sources: Administration; CBO, The Budget and Economic Outlook: 2021 to 2031, February 2021; October 2020 and February 2021 Blue Chip Economic Indicators, Aspen Publishers, Inc�; Federal Reserve Open Market Committee, December 16, 2020
1 Calendar Year2 2028-2031 are 5 year averages; 2023-2031 values derived from October 2020 report3 Median Projection4 Year-over-Year5 Personal Consumption Expenditures 6 Average rate during 4th quarter
12ANALYTICAL PERSPECTIVES
data available in February, the Blue Chip forecasts are drawn from the February survey for 2021 and 2022 val-ues and from the October 2020 survey for the long-term forecast (2023-2031). These were the latest Blue Chip forecasts available at the time the Administration fi-nalized its forecast. In addition, the FOMC projections were released in mid-March, and the CBO forecast was published in early February based on data available in January. During the months that have elapsed since the Administration’s forecast was finalized, macroeconomic, policy, and pandemic developments have been mostly positive. Consumer spending has outpaced earlier pro-jections, the Congress has passed the American Rescue Plan, and over one hundred million Americans have been vaccinated. These subsequent developments should be considered when comparing the Administration’s forecast with more recent forecasts such as the Blue Chip panel of professional economic forecasters. For example, between February and May of 2021, the Blue Chip panel revised upwards their consensus forecast for 2021 (year-over-year) real GDP growth, from 4.9 percent to 6.6 percent. Likewise, the Blue Chip consensus forecast for the av-erage 2021 unemployment rate was revised downwards from 5.8 to 5.4 percent.
In spite of differences across forecasters, the forecasts are similar in several aspects. All of them project a con-tinued economic recovery and improving labor markets. Interest rates across these various projections are consis-tent with an environment in which the Federal Reserve holds off on raising its policy rate until late 2022 or early 2023. Rates of inflation are also expected to rise but to remain in line with the Federal Reserve’s mandate on low and stable inflation. See Table 2-3 for a comparison.
Real GDP—The Administration forecasts a higher path for real GDP growth than the CBO, a 2.4 percent per year average over the forecast window versus CBO’s 2.2 percent average, though consistent with the 2.4 percent average from Blue Chip. The Administration’s forecast reflects partial effects of the Administration’s proposed policies, while the CBO is required to assume a continu-ation of current law in its forecast. The Administration’s forecast has the same average growth rate over the fore-cast window as the FOMC although the Fed’s forecast assigns more growth in 2021 than the Administration (6.5 percent compared with 5.2 percent) and slightly slower growth over the out-years of the forecast.
Unemployment—On the unemployment rate, the Administration’s expectations are largely aligned with those of the other forecasters. In particular, all forecast-ers expect unemployment to decrease over the forecast window. One minor difference is that the Administration’s forecast for unemployment plateaus at 3.8 percent as compared with 4.0 and 4.1 percent for the other projec-tions. Although slightly lower for 2021 through 2023 than the CBO and Blue Chip, the Administration’s forecast is slightly higher than the Federal Reserve’s forecast during this window.
Interest Rates—The Administration’s 91-day inter-est rate forecast is broadly consistent with the Blue Chip forecast for 2022-2025 and is slightly higher than the
CBO’s forecast. The Administration expects short-term rates to pick up slowly in 2022 and 2023 and rise from 1.2 to 1.6 percent between 2025-2027. The Blue Chip expects a rise from 1.1 to 1.7 percent, and the CBO expects a rise from 0.4 to 1.7 percent over this period. For both short- and long-term rates, all forecasters agree that they will tend to rise modestly over the coming few years.
General Inflation—Assumptions for CPI-U inflation are similar across the Administration, the CBO, and the Blue Chip. The CBO assumes a CPI-U inflation rate of 2.4 percent in the long run, while the Administration and the Blue Chip are not significantly different at 2.3 and 2.2 percent long-run rates. The Federal Reserve does not pre-dict CPI-U but rather PCE inflation. The Federal Reserve expects PCE inflation to reach the Fed’s target of 2.0 per-cent by 2023 and remain stable thereafter. PCE inflation tends to be lower than CPI-U inflation.
Sensitivity of the Budget to Economic Assumptions
Federal spending and tax collections are heavily in-fluenced by developments in the economy. Income tax receipts are a function of growth in incomes for house-holds and firms. Spending on social assistance programs may rise when the economy enters a downturn, while in-creases in nominal spending on Social Security and other programs are dependent on consumer price inflation. A robust set of projections for macroeconomic variables as-sists in budget planning, but unexpected developments in the economy have ripple effects for Federal spending and receipts. This section seeks to provide an understanding of the magnitude of the effects that unforeseen changes in the economy can have on the budget.
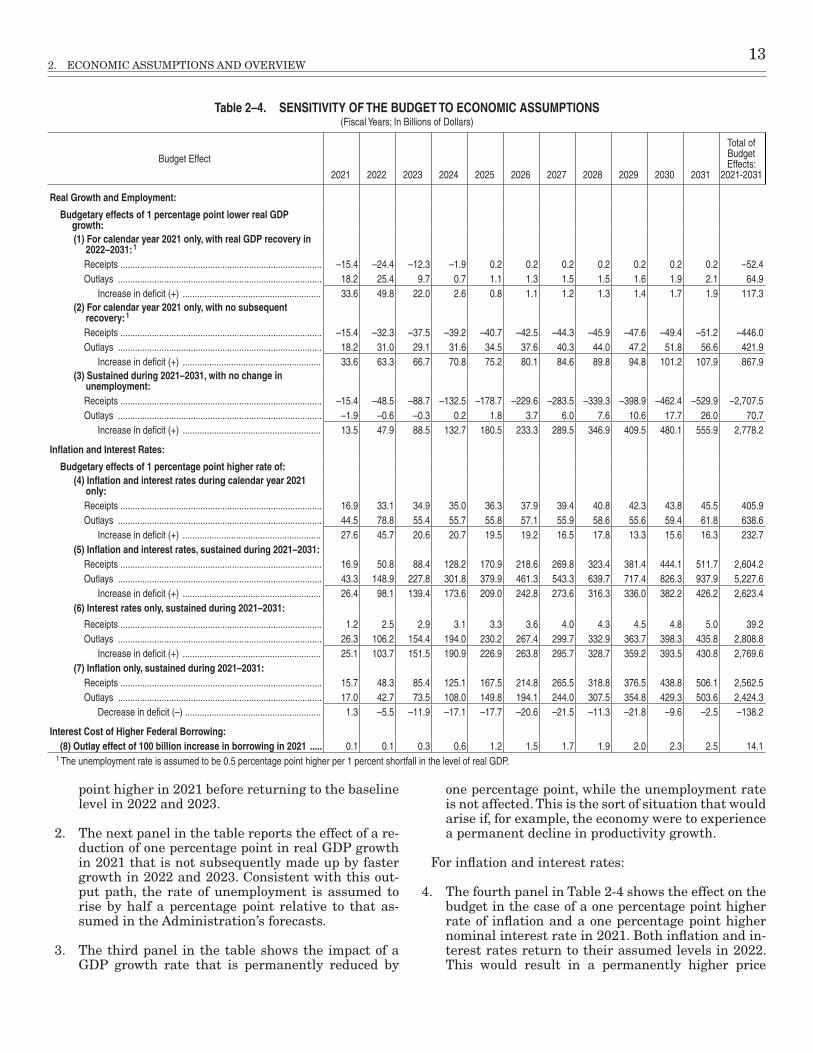
To make these assessments, the Administration relies on a set of heuristics that can predict how certain spending and receipt categories will react to a change in a given subset of macroeconomic variables, holding almost everything else constant. These sensitivity analyses provide a sense of the broad changes one would expect after a given development, but they cannot anticipate how policy makers would react and potentially change course in such an event. For exam-ple, if the economy were to suffer an unexpected recession, tax receipts would decline and spending on programs such as unemployment insurance would rise. In such a situation, however, policy makers might enact policies that stimulate the economy, leading to secondary and tertiary changes that are difficult to predict. Another caveat is that it is often un-realistic to suppose that one macroeconomic variable might change while others would remain constant. Most macro-economic variables interact with each other in complex and subtle ways. These are important considerations to bear in mind when examining Table 2-4.
For real GDP growth and employment:
1. The first panel in the table illustrates the ef-fect on the deficit resulting from a one percentage point reduction in real GDP growth, relative to the Administration’s forecast, in 2021 that is followed by a subsequent recovery in 2022 and 2023. The un-employment rate is assumed to be half a percentage
2. ECONOMIC ASSUMPTIONS AND OVERVIEW 13
point higher in 2021 before returning to the baseline level in 2022 and 2023.
2. The next panel in the table reports the effect of a re-duction of one percentage point in real GDP growth in 2021 that is not subsequently made up by faster growth in 2022 and 2023. Consistent with this out-put path, the rate of unemployment is assumed to rise by half a percentage point relative to that as-sumed in the Administration’s forecasts.
3. The third panel in the table shows the impact of a GDP growth rate that is permanently reduced by
one percentage point, while the unemployment rate is not affected. This is the sort of situation that would arise if, for example, the economy were to experience a permanent decline in productivity growth.
For inflation and interest rates:
4. The fourth panel in Table 2-4 shows the effect on the budget in the case of a one percentage point higher rate of inflation and a one percentage point higher nominal interest rate in 2021. Both inflation and in-terest rates return to their assumed levels in 2022. This would result in a permanently higher price
Table 2–4. SENSITIVITY OF THE BUDGET TO ECONOMIC ASSUMPTIONS (Fiscal Years; In Billions of Dollars)
Budget Effect
2021 2022 2023 2024 2025 2026 2027 2028 2029 2030 2031
Total of Budget Effects:
2021-2031
Real Growth and Employment:
Budgetary effects of 1 percentage point lower real GDP growth:(1) For calendar year 2021 only, with real GDP recovery in
2022–2031: 1
Receipts ����������������������������������������������������������������������������������� –15�4 –24�4 –12�3 –1�9 0�2 0�2 0�2 0�2 0�2 0�2 0�2 –52�4Outlays ������������������������������������������������������������������������������������ 18�2 25�4 9�7 0�7 1�1 1�3 1�5 1�5 1�6 1�9 2�1 64�9
Increase in deficit (+) ��������������������������������������������������������� 33�6 49�8 22�0 2�6 0�8 1�1 1�2 1�3 1�4 1�7 1�9 117�3(2) For calendar year 2021 only, with no subsequent
recovery: 1
Receipts ����������������������������������������������������������������������������������� –15�4 –32�3 –37�5 –39�2 –40�7 –42�5 –44�3 –45�9 –47�6 –49�4 –51�2 –446�0Outlays ������������������������������������������������������������������������������������ 18�2 31�0 29�1 31�6 34�5 37�6 40�3 44�0 47�2 51�8 56�6 421�9
Increase in deficit (+) ��������������������������������������������������������� 33�6 63�3 66�7 70�8 75�2 80�1 84�6 89�8 94�8 101�2 107�9 867�9(3) Sustained during 2021–2031, with no change in
unemployment:Receipts ����������������������������������������������������������������������������������� –15�4 –48�5 –88�7 –132�5 –178�7 –229�6 –283�5 –339�3 –398�9 –462�4 –529�9 –2,707�5Outlays ������������������������������������������������������������������������������������ –1�9 –0�6 –0�3 0�2 1�8 3�7 6�0 7�6 10�6 17�7 26�0 70�7
Increase in deficit (+) ��������������������������������������������������������� 13�5 47�9 88�5 132�7 180�5 233�3 289�5 346�9 409�5 480�1 555�9 2,778�2
Inflation and Interest Rates:
Budgetary effects of 1 percentage point higher rate of:(4) Inflation and interest rates during calendar year 2021
only:Receipts ����������������������������������������������������������������������������������� 16�9 33�1 34�9 35�0 36�3 37�9 39�4 40�8 42�3 43�8 45�5 405�9Outlays ������������������������������������������������������������������������������������ 44�5 78�8 55�4 55�7 55�8 57�1 55�9 58�6 55�6 59�4 61�8 638�6
Increase in deficit (+) ��������������������������������������������������������� 27�6 45�7 20�6 20�7 19�5 19�2 16�5 17�8 13�3 15�6 16�3 232�7(5) Inflation and interest rates, sustained during 2021–2031:
Receipts ����������������������������������������������������������������������������������� 16�9 50�8 88�4 128�2 170�9 218�6 269�8 323�4 381�4 444�1 511�7 2,604�2Outlays ������������������������������������������������������������������������������������ 43�3 148�9 227�8 301�8 379�9 461�3 543�3 639�7 717�4 826�3 937�9 5,227�6
Increase in deficit (+) ��������������������������������������������������������� 26�4 98�1 139�4 173�6 209�0 242�8 273�6 316�3 336�0 382�2 426�2 2,623�4(6) Interest rates only, sustained during 2021–2031:
Receipts ����������������������������������������������������������������������������������� 1�2 2�5 2�9 3�1 3�3 3�6 4�0 4�3 4�5 4�8 5�0 39�2Outlays ������������������������������������������������������������������������������������ 26�3 106�2 154�4 194�0 230�2 267�4 299�7 332�9 363�7 398�3 435�8 2,808�8
Increase in deficit (+) ��������������������������������������������������������� 25�1 103�7 151�5 190�9 226�9 263�8 295�7 328�7 359�2 393�5 430�8 2,769�6(7) Inflation only, sustained during 2021–2031:
Receipts ����������������������������������������������������������������������������������� 15�7 48�3 85�4 125�1 167�5 214�8 265�5 318�8 376�5 438�8 506�1 2,562�5Outlays ������������������������������������������������������������������������������������ 17�0 42�7 73�5 108�0 149�8 194�1 244�0 307�5 354�8 429�3 503�6 2,424�3
Decrease in deficit (–) �������������������������������������������������������� 1�3 –5�5 –11�9 –17�1 –17�7 –20�6 –21�5 –11�3 –21�8 –9�6 –2�5 –138�2
Interest Cost of Higher Federal Borrowing:(8) Outlay effect of 100 billion increase in borrowing in 2021 ..... 0�1 0�1 0�3 0�6 1�2 1�5 1�7 1�9 2�0 2�3 2�5 14�1
1 The unemployment rate is assumed to be 0�5 percentage point higher per 1 percent shortfall in the level of real GDP�
14ANALYTICAL PERSPECTIVES
Table 2–5. FORECAST ERRORS, 2002-PRESENT
REAL GDP ERRORS
2-Year Average Annual Real GDP Growth Administration CBO Blue Chip
Mean Error ������������������������������������������������������������������������������������������������� 1�0 0�5 0�7
Mean Absolute Error ���������������������������������������������������������������������������������� 1�1 0�7 0�8
Root Mean Square Error ��������������������������������������������������������������������������� 1�5 1�2 1�2
6-Year Average Annual Real GDP Growth
Mean Error ������������������������������������������������������������������������������������������������� 1�6 1�4 1�2
Mean Absolute Error ���������������������������������������������������������������������������������� 1�6 1�4 1�2
Root Mean Square Error ��������������������������������������������������������������������������� 1�7 1�5 1�4
INFLATION ERRORS
2-Year Average Annual Change in the Consumer Price Index Administration CBO Blue Chip
Mean Error ������������������������������������������������������������������������������������������������� -0�2 -0�2 -0�0
Mean Absolute Error ���������������������������������������������������������������������������������� 0�7 0�6 0�6
Root Mean Square Error ��������������������������������������������������������������������������� 0�8 0�8 0�7
6-Year Average Annual Change in the Consumer Price Index
Mean Error ������������������������������������������������������������������������������������������������� 0�1 0�0 0�3
Mean Absolute Error ���������������������������������������������������������������������������������� 0�4 0�3 0�4
Root Mean Square Error ��������������������������������������������������������������������������� 0�5 0�4 0�5
INTEREST RATE ERRORS
2-Year Average 91-Day Treasury Bill Rate Administration CBO Blue Chip
Mean Error ������������������������������������������������������������������������������������������������� 0�5 0�5 0�7
Mean Absolute Error ���������������������������������������������������������������������������������� 0�8 0�6 0�8
Root Mean Square Error ��������������������������������������������������������������������������� 1�1 1�0 1�2
6-Year Average 91-Day Treasury Bill Rate
Mean Error ������������������������������������������������������������������������������������������������� 2�1 2�2 2�3
Mean Absolute Error ���������������������������������������������������������������������������������� 2�1 2�2 2�3
Root Mean Square Error ��������������������������������������������������������������������������� 2�3 2�4 2�6
level and nominal GDP level over the course of the forecast horizon.
5. The fifth panel in the table illustrates the effects on the budget deficit of a one percentage point higher inflation rate and interest rate than projected in ev-ery year of the forecast.
6. The sixth panel reports the effect on the deficit re-sulting from an increase in interest rates in every year of the forecast, with no accompanying increase in inflation.
7. The seventh panel in the table reports the effect on the budget deficit of a one percentage point higher inflation rate than projected in every year of the forecast window, while the interest rate remains as forecast.
8. Finally, the table shows the effect on the budget deficit if the Federal Government were to borrow an additional $100 billion in 2021, while all of the other projections remain constant.
9. These simple approximations that inform the sensi-tivity analysis are symmetric. This means that the effect of, for example, a one percentage point higher rate of growth over the forecast horizon would be of the same magnitude as a one percentage point re-duction in growth, though with the opposite sign.
Forecast Errors for Growth, Inflation, and Interest Rates
As with any forecast, the Administration’s projections are projections and are subject to error because they are based on a set of assumptions about the underlying mi-lieu comprising social, political, and global conditions. It
2. ECONOMIC ASSUMPTIONS AND OVERVIEW 15
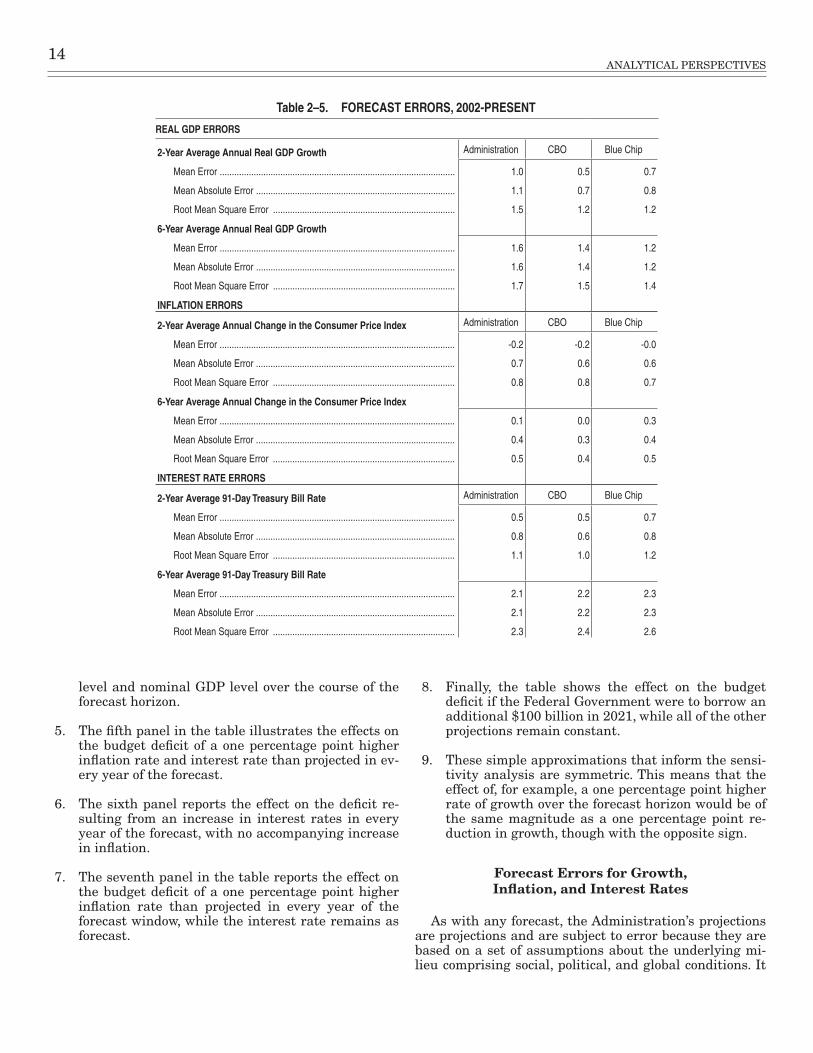
is impossible to foresee every eventuality over a one-year horizon, much less over ten or more years. This section evaluates the historical accuracy of past Administrations’ forecasts for real GDP growth, inflation, and short-term interest rates from 2002 to the present day, especially relative to the accuracy of forecasts produced by the CBO and Blue Chip panel. For this exercise, forecasts produced by all three entities are compared with realized values of these variables.
The results of this exercise are reported in Table 2-5 and contain three different measures of accuracy. The first is the average forecast error. When a forecaster has an average forecast error of zero, it may be said that the forecast has historically been unbiased, in the sense that realized values of the variables have not been systemati-cally above or below the forecasted value. The second is the average absolute value of the forecast error, which of-fers a sense of the magnitude of errors. Even if the past forecast errors average to zero, the errors may have been of a very large magnitude, with both positive and nega-tive values. Finally, the table reports the square root of the mean of squared forecast error (RMSE). This metric applies a harsher penalty to forecasts exhibiting large er-rors. The table reports these measures of accuracy at both the 2-year and the 6-year horizons, thus evaluating the
relative success of different forecasts in the short run and in the medium run.
Past Administrations have forecast 2-year real GDP growth and interest rates that were higher than actu-ally realized, on average, by 1.0 percentage points and 0.5 percentage points, respectively. This is partly due to the assumption that Administration policy proposals contained in the Budget will be enacted, which has not always come to pass. The 2-year average forecast error for inflation is smaller, -0.2 percentage points, and similar to other forecasts.
Uncertainty and the Deficit Projections
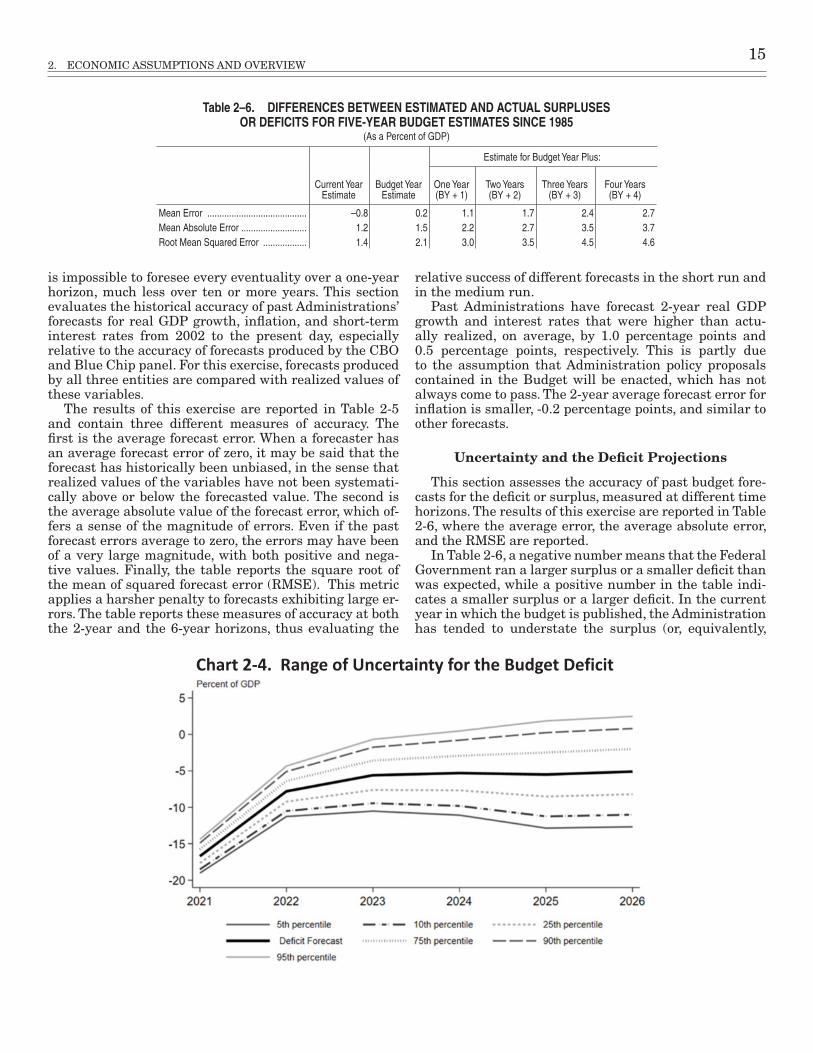
This section assesses the accuracy of past budget fore-casts for the deficit or surplus, measured at different time horizons. The results of this exercise are reported in Table 2-6, where the average error, the average absolute error, and the RMSE are reported.
In Table 2-6, a negative number means that the Federal Government ran a larger surplus or a smaller deficit than was expected, while a positive number in the table indi-cates a smaller surplus or a larger deficit. In the current year in which the budget is published, the Administration has tended to understate the surplus (or, equivalently,
Table 2–6. DIFFERENCES BETWEEN ESTIMATED AND ACTUAL SURPLUSES OR DEFICITS FOR FIVE-YEAR BUDGET ESTIMATES SINCE 1985
(As a Percent of GDP)
Current Year Estimate
Budget Year Estimate
Estimate for Budget Year Plus:
One Year (BY + 1)
Two Years (BY + 2)
Three Years (BY + 3)
Four Years (BY + 4)
Mean Error ����������������������������������������� –0�8 0�2 1�1 1�7 2�4 2�7Mean Absolute Error ��������������������������� 1�2 1�5 2�2 2�7 3�5 3�7Root Mean Squared Error ������������������ 1�4 2�1 3�0 3�5 4�5 4�6
Chart 2-4. Range of Uncertainty for the Budget Deficit
16ANALYTICAL PERSPECTIVES
overstate the deficit) by an average of 0.8 percent of GDP. For the budget year, however, the historical pattern has been for the budget to understate the deficit by an aver-age of 0.2 percent of GDP.5 One possible reason for this is that past Administrations’ policy proposals have not all been implemented. The forecast errors tend to grow with the time horizon, which is not surprising given that there is much greater uncertainty in the medium run about both the macroeconomic situation and the specific details of policy enactments.
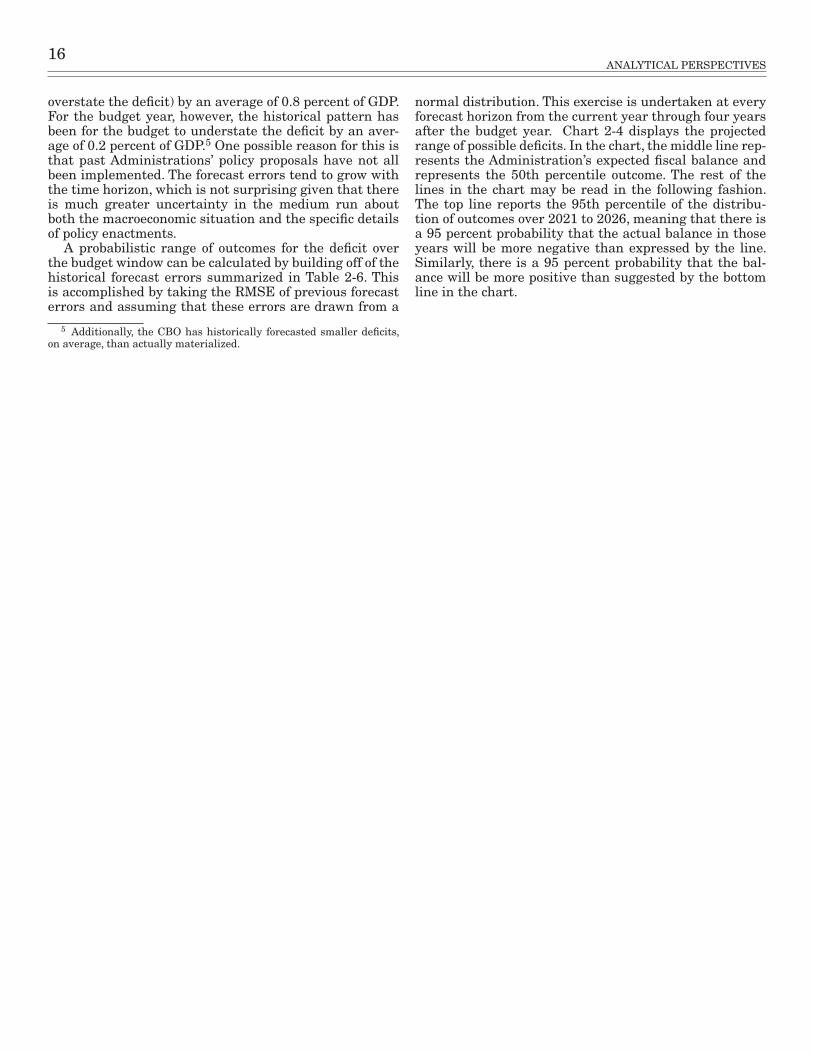
A probabilistic range of outcomes for the deficit over the budget window can be calculated by building off of the historical forecast errors summarized in Table 2-6. This is accomplished by taking the RMSE of previous forecast errors and assuming that these errors are drawn from a
5 Additionally, the CBO has historically forecasted smaller deficits, on average, than actually materialized.
normal distribution. This exercise is undertaken at every forecast horizon from the current year through four years after the budget year. Chart 2-4 displays the projected range of possible deficits. In the chart, the middle line rep-resents the Administration’s expected fiscal balance and represents the 50th percentile outcome. The rest of the lines in the chart may be read in the following fashion. The top line reports the 95th percentile of the distribu-tion of outcomes over 2021 to 2026, meaning that there is a 95 percent probability that the actual balance in those years will be more negative than expressed by the line. Similarly, there is a 95 percent probability that the bal-ance will be more positive than suggested by the bottom line in the chart.

17
3. LONG-TERM BUDGET OUTLOOK
The horizon for most numbers in this Budget is 10 years. This 10-year horizon reflects a balance between the importance of considering both the current and future im-plications of budget decisions made today, and a practical limit on the construction of detailed budget projections for years in the future.
Nonetheless, it can be informative to look further into the future, despite the uncertainty surrounding the as-sumptions needed for such estimates. This chapter begins by discussing the fiscal outlook under current law over the next 25 years. The second section discusses the fiscal impact of the Administration’s policies, finding they will cut deficits and debt over the long run, compared to the baseline. The third section discusses the actuarial projec-tions for Social Security and Medicare. The appendix to this chapter provides further detail on data sources, as-sumptions, and other methods for estimation.
Long-Run Projections under Continuation of Current Policies
The baseline long-term projections assume that current policy continues for Social Security, Medicare, Medicaid, other mandatory programs, and revenues.1 Projections for all mandatory programs and revenues maintain con-sistency with other Federal agency projections. From 2032-2046, total mandatory spending grows by 4.2 per-centage points as a share of GDP (Gross Domestic Product), while revenues increase by 3.8 percent. For discretionary spending, it is less clear how to project a continuation of current policy. After the expiration of the statutory caps in 2021, the Administration’s 10-year baseline assumes that discretionary funding levels generally grow slightly below the rate of CPI (Consumer Price Index) inflation (about 2.2 percent per year). Thereafter, the baseline long-run projections assume that real per-person discretionary funding remains constant, implying an average growth rate of 2.8 percent per year. The appendix provides addi-tional detail on the methodology behind these projections.
The COVID-19 public health and economic crisis and measures taken to address them significantly increased deficits and debt for 2020 and 2021. In the baseline pro-jections (not including proposed policy), the deficit is 14.9 percent of GDP in 2020 and 16.7 percent of GDP in 2021. The deficit is then projected to fall sharply in 2022 and 2023 and then gradually fall to 4.0 percent of GDP in 2027, though it is projected to rise through the end of the
1 The long-run baseline projections are consistent with the Budget’s baseline concept, which is explained in more detail in Chapter 17, “Cur-rent Services Estimates,” in this volume. The projections assume full payment of scheduled Social Security and Medicare benefits without re-gard to the projected depletion of the trust funds for these programs. Ad-ditional baseline assumptions beyond the 10-year window are detailed in the appendix to this chapter.
10-year window and reach 5.0 percent of GDP in 2031. Debt rose to 100.1 percent of GDP in 2020 and is projected to rise to 109.7 percent of GDP in 2022 and 111.2 percent of GDP in 2023 before leveling off to a more gradual as-cent, rising to 112.9 percent of GDP in 2031.
Over the past several decades, interest rates have fall-en even as debt has risen. This has been a widespread, persistent, and global phenomenon, and it has meant that the burden associated with debt has gone down. Under the baseline projections, real net interest payments will remain at or below 0.5 percent of GDP over the 10-year window, below the approximately one percent average over the last four decades and well below the roughly two percent average level in the 1990s.
Beyond the 10-year horizon, deficits continue to rise un-der the baseline projections, reaching 5.8 percent of GDP in 2041 before falling back to 5.7 percent of GDP by the end of the 25-year window. Debt is projected to increase gradually from 112.9 percent of GDP in 2031 to 130.8 per-cent of GDP by 2046, an increase of about 1.2 percentage points per year. Real net interest steadily rises after the 10-year window, but never exceeds 0.7 percent of GDP.
Future budget outcomes depend on a host of unknowns: changing economic conditions, unforeseen international developments, unexpected demographic shifts, and un-predictable technological advances. The longer budget projections are extended, the more the uncertainties increase. These uncertainties make even accurate short-run budget forecasting quite difficult. For example, the Budget’s projection of the deficit in five years is 5.1 per-cent of GDP, but a distribution of probable outcomes ranges from a deficit of 11.0 percent of GDP to a surplus of 0.8 percent of GDP, at the 10th and 90th percentiles, respectively.2
Among the risks, the rate of future productivity growth is both highly uncertain and a major driver of the long-term budget outlook. Lower productivity growth would directly reduce the growth of major tax bases while high-er productivity growth would have the opposite effect. If productivity were to grow 0.25 percentage points slower per year, we would expect the annual deficits to deterio-rate significantly from baseline projections. The same would be true if excess cost growth for healthcare was higher than expected or if interest rates grew faster than expected. These risks are roughly symmetric, so faster productivity growth, less healthcare excess cost growth and lower interest rates would significantly improve the fiscal outlook.
Another primary risk not addressed in the long-run economic assumptions or baseline budget projections is the impact of climate change. Climate change will likely
2 These estimates are derived in Chart 2-4 of Chapter 2, “Economic Assumptions and Overview,” in this volume.
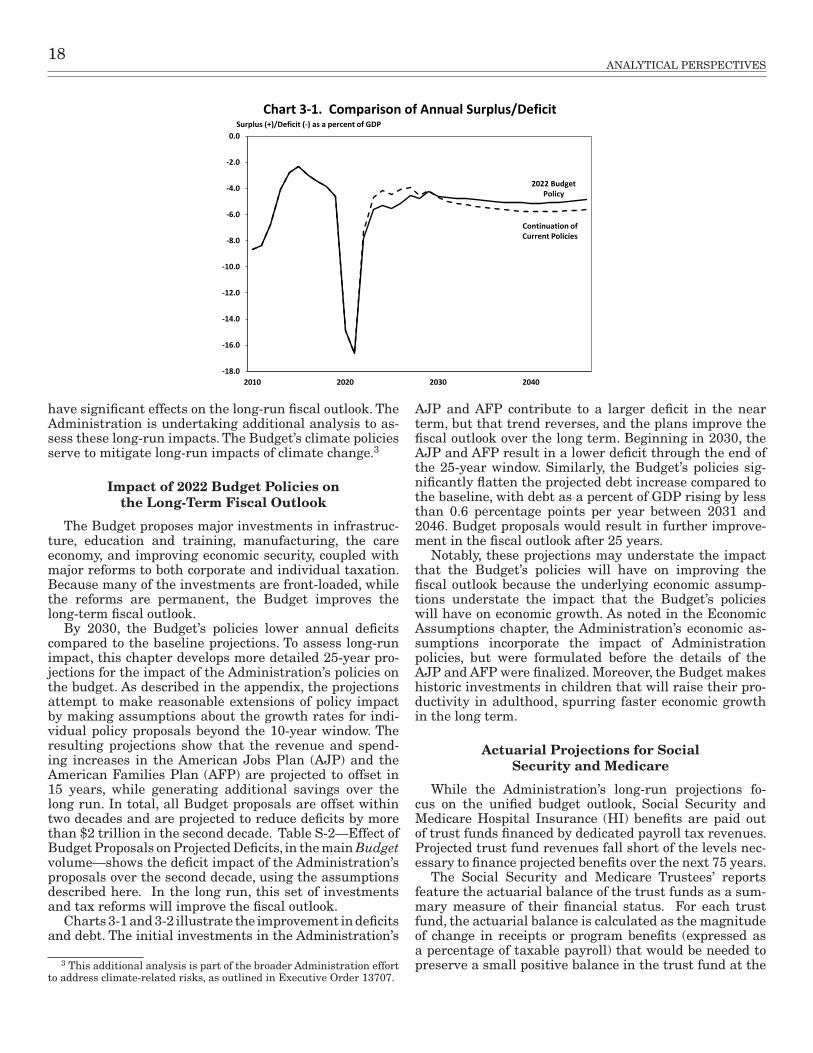
18ANALYTICAL PERSPECTIVES
have significant effects on the long-run fiscal outlook. The Administration is undertaking additional analysis to as-sess these long-run impacts. The Budget’s climate policies serve to mitigate long-run impacts of climate change.3
Impact of 2022 Budget Policies on the Long-Term Fiscal Outlook
The Budget proposes major investments in infrastruc-ture, education and training, manufacturing, the care economy, and improving economic security, coupled with major reforms to both corporate and individual taxation. Because many of the investments are front-loaded, while the reforms are permanent, the Budget improves the long-term fiscal outlook.
By 2030, the Budget’s policies lower annual deficits compared to the baseline projections. To assess long-run impact, this chapter develops more detailed 25-year pro-jections for the impact of the Administration’s policies on the budget. As described in the appendix, the projections attempt to make reasonable extensions of policy impact by making assumptions about the growth rates for indi-vidual policy proposals beyond the 10-year window. The resulting projections show that the revenue and spend-ing increases in the American Jobs Plan (AJP) and the American Families Plan (AFP) are projected to offset in 15 years, while generating additional savings over the long run. In total, all Budget proposals are offset within two decades and are projected to reduce deficits by more than $2 trillion in the second decade. Table S-2—Effect of Budget Proposals on Projected Deficits, in the main Budget volume—shows the deficit impact of the Administration’s proposals over the second decade, using the assumptions described here. In the long run, this set of investments and tax reforms will improve the fiscal outlook.
Charts 3-1 and 3-2 illustrate the improvement in deficits and debt. The initial investments in the Administration’s
3 This additional analysis is part of the broader Administration effort to address climate-related risks, as outlined in Executive Order 13707.
AJP and AFP contribute to a larger deficit in the near term, but that trend reverses, and the plans improve the fiscal outlook over the long term. Beginning in 2030, the AJP and AFP result in a lower deficit through the end of the 25-year window. Similarly, the Budget’s policies sig-nificantly flatten the projected debt increase compared to the baseline, with debt as a percent of GDP rising by less than 0.6 percentage points per year between 2031 and 2046. Budget proposals would result in further improve-ment in the fiscal outlook after 25 years.
Notably, these projections may understate the impact that the Budget’s policies will have on improving the fiscal outlook because the underlying economic assump-tions understate the impact that the Budget’s policies will have on economic growth. As noted in the Economic Assumptions chapter, the Administration’s economic as-sumptions incorporate the impact of Administration policies, but were formulated before the details of the AJP and AFP were finalized. Moreover, the Budget makes historic investments in children that will raise their pro-ductivity in adulthood, spurring faster economic growth in the long term.
Actuarial Projections for Social Security and Medicare
While the Administration’s long-run projections fo-cus on the unified budget outlook, Social Security and Medicare Hospital Insurance (HI) benefits are paid out of trust funds financed by dedicated payroll tax revenues. Projected trust fund revenues fall short of the levels nec-essary to finance projected benefits over the next 75 years.
The Social Security and Medicare Trustees’ reports feature the actuarial balance of the trust funds as a sum-mary measure of their financial status. For each trust fund, the actuarial balance is calculated as the magnitude of change in receipts or program benefits (expressed as a percentage of taxable payroll) that would be needed to preserve a small positive balance in the trust fund at the
-18.0
-16.0
-14.0
-12.0
-10.0
-8.0
-6.0
-4.0
-2.0
0.0
2010 2020 2030 2040
Chart 3-1. Comparison of Annual Surplus/Deficit
Continuation of Current Policies
2022 Budget Policy
Surplus (+)/Deficit (-) as a percent of GDP

3. LONG-TERM BUDGET OUTLOOk 19
40.0
50.0
60.0
70.0
80.0
90.0
100.0
110.0
120.0
130.0
140.0
2010 2020 2030 2040
Chart 3-2. Comparison of Publicly Held DebtDebt as a percent of GDP
2022 Budget Policy
Continuation of Current Policies
end of a specified time period. The estimates cover peri-ods ranging in length from 25 to 75 years.
Table 3-1 shows the projected income rate, cost rate, and annual balance for the Medicare HI and combined OASDI trust funds at selected dates under the Trustees’ intermediate assumptions in the 2020 reports. There is a continued imbalance in the long-run projections of the HI program due to revenues that do not match costs over time. According to the 2020 Trustees’ report, the HI trust fund reserves are projected to become depleted in 2026, at which point dedicated revenues would be expected to be able to cover 90 percent of scheduled payments.
The 2020 Social Security Trustees’ report projects that under current law, there is a long-term mismatch between program revenue and costs. Social Security is currently drawing on its trust fund balances to cover current expenditures. Over time, as the ratio of workers
to retirees falls, costs are projected to rise further while revenues excluding interest are projected to rise less rapidly. In the process, the Social Security trust fund re-serves, which were built up since 1983, would be drawn down and eventually become depleted in 2035, based on the projections in the 2020 report. At that point, the dedicated revenues could pay for 79 percent of program expenditures in the rest of 2035, declining to 73 percent in 2094. Note that the projections in the 2020 Trustees’ report do not reflect the effects of the COVID-19 pandem-ic on the Social Security program, which may advance reserve depletion to 2034.
The long-term budget projections in this chapter as-sume that benefits would continue to be paid in full despite the projected depletion of the trust fund reserves to show the long-run cost of maintaining current benefit formulas.
Table 3–1. INTERMEDIATE ACTUARIAL PROJECTIONS FOR OASDI AND HI, 2020 TRUSTEES’ REPORTS
2019 2020 2030 2040 2090
Percent of Payroll
Medicare Hospital Insurance (HI):Income Rate ������������������������������������������������������������������������������������������� 3�3 3�4 3�7 3�8 4�4Cost Rate ������������������������������������������������������������������������������������������������ 3�4 3�5 4�3 4�8 5�0Annual Balance �������������������������������������������������������������������������������������� –0�1 –0�2 –0�6 –1�0 –0�6Projection Interval: �������������������������������������������������������������������������������� 25 years 50 years 75 years
Actuarial Balance ������������������������������������������������������������������������������� –0�8 –0�8 –0�8
Percent of Payroll
Old Age Survivors and Disability Insurance (OASDI):Income Rate ������������������������������������������������������������������������������������������� 12�8 13�0 13�2 13�3 13�4Cost Rate ������������������������������������������������������������������������������������������������ 13�9 13�9 16�0 16�8 17�9Annual Balance �������������������������������������������������������������������������������������� –1�0 –0�9 –2�8 –3�5 –4�4Projection Interval: �������������������������������������������������������������������������������� 25 years 50 years 75 years
Actuarial Balance ������������������������������������������������������������������������������� –2�0 –2�8 –3�2

20ANALYTICAL PERSPECTIVES
TECHNICAL NOTE: SOURCES OF DATA AND METHODS OF ESTIMATING
The long-run budget projections are based on actuarial projections for Social Security and Medicare as well as demographic and economic assumptions. A simplified model of the Federal budget, developed at OMB, is used to compute the budgetary implications of these assumptions after the 10-year budget window.
Demographic and Economic Assumptions.—For the years 2021-2031, the assumptions are drawn from the Administration’s economic projections used for the 2022 Budget. The economic assumptions are extended beyond this interval by holding the inflation rate, interest rates, and the unemployment rate constant at the levels assumed in the final year (2031) of the budget forecast. Population growth and labor force growth are extended using the intermediate assumptions from the 2020 Social Security Trustees’ report. The projected rate of growth for real GDP is built up from the labor force assumptions and an assumed rate of productivity growth. Productivity growth, measured as real GDP per hour, is assumed to equal its average annual rate of growth in the Budget’s economic assumptions: 1.4 percent per year.
Under the Budget’s policies, the CPI inflation rate is held constant at 2.3 percent per year, the unemployment rate is held constant at 3.8 percent, the yield to matu-rity on 10-year Treasury notes is kept at 2.8 percent, and the 91-day Treasury bill rate is kept at 2.2 percent. Consistent with the demographic assumptions in the Trustees’ reports, U.S. population growth slows from an average of just over 0.5 percent per year during the bud-get window to about three-quarters of that rate by the end of the 25-year projection period. Real GDP growth is projected to be less than its historical average of around 2.5 percent per year because the slowdown in population growth and the increase in the share of the population over age 65 reduce labor supply growth. In these projec-tions, real GDP growth averages between 1.7 percent and 1.8 percent per year for the period following the end of the 10-year budget window. The economic and demographic projections described above are set exogenously and do not change in response to changes in the budget outlook.
Baseline Budget Projections.—For the period through 2031, receipts and outlays in the baseline and policy projections follow the 2022 Budget’s baseline and policy estimates, respectively. Outside the budget win-dow, discretionary spending grows at the rate of growth in inflation and population. Long-run Social Security spending is projected by the Social Security actuaries us-ing this chapter’s long-run economic and demographic assumptions. Medicare benefits are projected based on a projection of beneficiary growth and excess healthcare cost growth from the 2020 Medicare Trustees’ report cur-rent law baseline. Excess cost growth for private health insurance is assumed to grow at a rate that averages the excess cost growth assumed in the Medicare actuarial as-sumptions and provided in their Illustrative Alternative. In these projections, private health insurance excess cost growth averages 1.3 percent after 2031. Medicaid outlays
are based on the economic and demographic projections in the model, which assume average excess cost growth of approximately 0.9 percentage points above growth in GDP per capita after 2031. Other entitlement programs are projected based on rules of thumb linking program spending to elements of the economic and demographic projections such as the poverty rate. Individual income tax revenues are projected using a microsimulation model that incorporates real bracket creep. Corporate tax and other receipts are projected to grow with GDP.
Policy Budget Projections.—The long-run impact of the President’s policy proposals is based on the same set of economic and demographic assumptions, but make the following assumptions for the growth of costs and savings from specific policy proposals.
Discretionary Spending.—Discretionary spending is assumed to grow at the rate of growth in inflation and population outside the budget window, as in the baseline model.
American Jobs Plan Investments.—In general, the pro-posed outlays for the AJP investments do not continue beyond the budget window. The projections take into ac-count that a small amount of budget authority provided in the first decade is spent outside the budget window.
Made in America Tax Plan.—Other than tax credit ex-pansions, tax provisions in the AJP are assumed to grow at the rate of growth in GDP. Four energy credit expansions (the Energy Investment Credit, the Renewable Production Tax Credit, the Carbon Oxide Sequestration Tax Credit, and the new tax credits for qualified advanced energy manufacturing) can be claimed outside the budget window. The outlays for these credits beyond the budget window are projected separately for each proposal and assume dif-ferent paths for spend-out, based on guidance from the Department of the Treasury’s Office of Tax Analysis (OTA). The remaining energy credits with 2031 outlays will likely have smaller carry-overs; the Budget assumes that their 2032 outlays are half of their 2031 outlays and that their 2033-2046 outlays are zero. For the Low-Income Housing Tax Credit and Neighborhood Homes Investment Tax Credit, the Budget assumes that initial allocations not re-sulting in credits claimed in the first decade will lead to a declining pattern of credits claimed during 2032-36 before remaining at zero in 2037 and beyond.
American Families Plan.—As a general rule, invest-ments that are expected to be largely paying for wages or providing goods or services that increase in quality are assumed to grow with GDP. Investments that provide constant-quality goods or services are assumed to grow with inflation and population.
Paid Leave and Child Care Initiatives: The 10-year Budget projections assume that providing universal paid family and medical leave, universal preschool, creating a new child care entitlement, and providing pay parity for Head Start teachers and ensuring all early childhood pro-gram staff make a $15 minimum wage are fully phased in (with take-up reaching steady state levels) by the tenth year. After that, the budget authority for these provisions is projected based on the GDP growth rate, and the outlay
3. LONG-TERM BUDGET OUTLOOk 21
rates for these programs from the budget window are car-ried through beyond the budget window.
Education Initiatives: Policies to fund free commu-nity college and advance affordability for students at Historically Black Colleges and Universities, Tribal Colleges and Universities, and Minority Serving Institutions have their budget authority grow with rel-evant populations and tuition inflation, as specified in the proposals, with respective outlays growing according to the applicable outlay rate. Increasing the Pell Grant and making recipients of DACA (Deferred Action for Childhood Arrivals) eligible for Pell Grants have their budget authority grow with inflation and population be-cause eligibility is likely to grow with population and the value of the grants is proposed to grow with inflation, and the policies follow the same outlay rate beyond the budget window as during the budget window. Education proposals with flat funding for the first 10 years are as-sumed to have budget authority grow with inflation and population so that they do not decrease in value in sub-sequent years. Investments in teacher credentials are funded only in the first five years of the budget window and not beyond.
Nutrition Initiatives: Proposals related to nutrition, including expanding the Summer Electronic Benefit Transfer to all eligible children nationwide, facilitating re-entry for formerly incarcerated individuals through eligibility for the Supplemental Nutrition Assistance Program, and expanding school meal programs, each grow at the rate of inflation and population because the cost of these proposals is affected by food prices, which
grow with inflation, while participation will generally grow with population.
Family Coordinators at Veterans Affairs Medical Centers: This proposal grows with GDP because costs would increase with wages.
Investments in Maternal Health: This funding expires before 2031, so funding beyond the budget window is zero.
Tax Investments: These proposals, which include making permanent the American Rescue Plan (ARP) expansion to the Earned Income Tax Credit for workers without children, making permanent ARP changes to the Child and Dependent Care Tax Credit (CDCTC), extend-ing ARP changes to the Child Tax Credit, and making permanent full refundability, were estimated directly by OTA through 2041; the provisions grow in 2042-2046 ac-cording to their 2032-2041 growth patterns. The Budget accounts for the CDCTC interaction with the proposed child care entitlement, and the interaction grows at the same rate as the permanent CDCTC. Making permanent the ARP expansion of premium tax credits is projected as-suming average excess cost growth of approximately 1.3 percentage points above growth in GDP after 2031.
Offsets: Most tax provisions in the American Families Plan are projected to grow with GDP, based on guidance from OTA. Receipts from Internal Revenue Service (IRS) tax compliance reforms, net of IRS discretionary and man-datory outlay reforms, are assumed to grow with GDP. Capital income proposals were estimated directly by OTA through 2041 and grow at a faster rate than GDP growth based on modeled deferral behavior; the provision grows in 2042-2046 according to its growth pattern in 2032-2041.


23
4. FEDERAL BORROWING AND DEBT
Debt is the largest legally and contractually binding obligation of the Federal Government. At the end of 2020, the Government owed $21,017 billion of principal to the individuals and institutions who had loaned it the money to fund past deficits. During that year, the Government paid the public approximately $387 billion of interest on this debt.1 At the same time, the Government also held fi-nancial assets, net of financial liabilities other than debt, of $2,993 billion. Therefore, debt held by the public net of financial assets was $18,024 billion.
The $21,017 billion debt held by the public at the end of 2020 represents an increase of $4,216 billion over the level at the end of 2019. This increase is the result of the $3,129 billion deficit in 2020 and other financing transac-tions that increased the need to borrow by $1,087 billion. Debt held by the public grew from 79.2 percent of Gross Domestic Product (GDP) at the end of 2019 to 100.1 per-cent of GDP at the end of 2020. The deficit is estimated to increase to $3,669 billion in 2021, and then to fall to $1,837 billion in 2022. The deficit is projected to fall again in 2023, and then to remain relatively stable as a percent of GDP throughout the remainder of the Budget window. Debt held by the public is projected to grow to $24,167 billion (109.7 percent of GDP) at the end of 2021 and $26,265 billion (111.8 percent of GDP) at the end of 2022. After 2022, debt held by the public as a percent of GDP is projected to increase more slowly, reaching 117.0 percent in 2031. Debt held by the public net of financial assets is expected to similarly grow to 98.4 percent of GDP at the end of 2021, 100.1 percent at the end of 2022, and 108.5 percent at the end of 2031.
Trends in Debt Since World War II
Table 4–1 depicts trends in Federal debt held by the public from World War II to the present and estimates from the present through 2031. (It is supplemented for earlier years by Tables 7.1–7.3 in the Budget’s Historical Tables, available as supplemental budget material.2) Federal debt peaked at 106.1 percent of GDP in 1946, just after the end of the war. From that point until the 1970s, Federal debt as a percentage of GDP decreased almost ev-ery year because of relatively small deficits, an expanding economy, and unanticipated inflation. With households borrowing large amounts to buy homes and consumer durables, and with businesses borrowing large amounts to buy plant and equipment, Federal debt also decreased almost every year as a percentage of total credit market debt outstanding. The cumulative effect was impressive. From 1950 to 1975, debt held by the public declined from
1 This is 2020 nominal interest on debt held by the public. For a dis-cussion of real net interest, see Chapter 3, “Long-Term Budget Outlook.”
2 The Historical Tables are available at https://www.whitehouse.gov/omb/historical-tables/.
78.6 percent of GDP to 24.6 percent, and from 53.3 per-cent of credit market debt to 17.9 percent. Despite rising interest rates during this period, interest outlays became a smaller share of the budget and were roughly stable as a percentage of GDP.
Federal debt relative to GDP is a function of the Nation’s fiscal policy as well as overall economic condi-tions. During the 1970s, large budget deficits emerged as spending grew faster than receipts and as the economy was disrupted by oil shocks and rising inflation. Federal debt relative to GDP and credit market debt stopped declining for several years in the middle of the decade. Federal debt started growing again at the beginning of the 1980s, and increased to almost 48 percent of GDP by 1993. The ratio of Federal debt to credit market debt also rose during this period, though to a lesser extent. Interest outlays on debt held by the public, calculated as a percentage of either total Federal outlays or GDP, in-creased as well.
The growth of Federal debt held by the public was slow-ing by the mid-1990s. In addition to a growing economy, two major budget agreements were enacted in the 1990s, implementing spending cuts and revenue increases and significantly reducing deficits. The debt declined marked-ly relative to both GDP and total credit market debt, with the decline accelerating as budget surpluses emerged from 1998 to 2001. Debt fell from 47.9 percent of GDP in 1993 to 31.5 percent of GDP in 2001. Over that same period, debt fell from 26.2 percent of total credit market debt to 17.4 percent. Interest as a share of outlays peaked at 16.5 percent in 1989 and then fell to 8.9 percent by 2002; interest as a percentage of GDP fell by a similar proportion.
The progress in reducing the debt burden stopped and then reversed course beginning in 2002. The attacks of September 11, 2001, a recession, two major wars, and tax cuts all contributed to increasing deficits, causing debt to rise, both in nominal terms and as a percentage of GDP. Following the recession that began in December 2007, the deficit began increasing rapidly in 2008 and 2009, as the Government intervened in the potential collapse of sev-eral major corporations and financial institutions as well as enacting a major stimulus bill. Debt as a percent of GDP continued to grow, increasing from 35.2 percent at the end of 2007 to 79.2 percent in 2019.
As a result of the COVID-19 pandemic and the Government’s actions to address the pandemic and support the economy, debt held by the public increased sharply in 2020, growing from 79.2 percent of GDP at the end of 2019 to 100.1 percent at the end of 2020.
In 2021, due largely to continued Government action, such as the American Rescue Plan, to end the pandemic and provide economic stimulus, the deficit is projected to

24ANALYTICAL PERSPECTIVES
Table 4–1. TRENDS IN FEDERAL DEBT HELD BY THE PUBLIC AND INTEREST ON THE DEBT HELD BY THE PUBLIC(Dollar amounts in billions)
Fiscal YearDebt held by the public
Debt held by the public as a percent of
Interest on the debt held by the public 3
Interest on the debt held by the public as a percent of 3
Current dollars FY 2020 dollars 1 GDPCredit market
debt 2 Current dollars FY 2020 dollars 1 Total outlays GDP
1946 ���������������������������������������������� 241�9 2,635�0 106�1 N/A 4�2 45�5 7�6 1�8
1950 ���������������������������������������������� 219�0 1,927�7 78�6 53�3 4�8 42�6 11�4 1�7
1955 ���������������������������������������������� 226�6 1,753�1 55�8 42�1 5�2 40�1 7�6 1�3
1960 ���������������������������������������������� 236�8 1,623�7 44�3 33�1 7�8 53�6 8�5 1�5
1965 ���������������������������������������������� 260�8 1,675�6 36�8 26�4 9�6 61�5 8�1 1�4
1970 ���������������������������������������������� 283�2 1,516�4 27�1 20�3 15�4 82�3 7�9 1�5
1975 ���������������������������������������������� 394�7 1,556�8 24�6 17�9 25�0 98�6 7�5 1�6
1980 ���������������������������������������������� 711�9 1,952�4 25�5 18�4 62�8 172�1 10�6 2�2
1985 ���������������������������������������������� 1,507�3 3,150�5 35�3 22�2 152�9 319�6 16�2 3�6
1990 ���������������������������������������������� 2,411�6 4,330�7 40�9 22�5 202�4 363�4 16�2 3�4
1995 ���������������������������������������������� 3,604�4 5,709�1 47�7 26�3 239�2 378�9 15�8 3�2
2000 ���������������������������������������������� 3,409�8 4,976�9 33�7 18�8 232�8 339�8 13�0 2�3
2005 ���������������������������������������������� 4,592�2 5,998�4 35�8 17�1 191�4 250�0 7�7 1�5
2010 ���������������������������������������������� 9,018�9 10,671�0 60�8 25�0 228�2 270�0 6�6 1�5
2015 ���������������������������������������������� 13,116�7 14,227�3 72�5 30�4 260�6 282�7 7�1 1�4
2016 ���������������������������������������������� 14,167�6 15,233�3 76�4 31�4 283�8 305�2 7�4 1�5
2017 ���������������������������������������������� 14,665�4 15,492�8 76�0 31�3 309�9 327�3 7�8 1�6
2018 ���������������������������������������������� 15,749�6 16,262�9 77�4 31�8 371�4 383�5 9�0 1�8
2019 ���������������������������������������������� 16,800�7 17,012�0 79�2 32�4 423�3 428�6 9�5 2�0
2020 ���������������������������������������������� 21,016�7 21,016�7 100�1 36�2 387�4 387�4 5�9 1�8
2021 estimate ������������������������������� 24,166�7 23,764�3 109�7 N/A 360�5 354�5 5�0 1�6
2022 estimate ������������������������������� 26,264�8 25,361�0 111�8 N/A 355�8 343�6 5�9 1�5
2023 estimate ������������������������������� 27,683�1 26,222�3 112�7 N/A 374�9 355�1 6�2 1�5
2024 estimate ������������������������������� 29,062�2 26,988�7 113�8 N/A 423�6 393�4 6�8 1�7
2025 estimate ������������������������������� 30,538�7 27,803�7 115�2 N/A 500�6 455�8 7�7 1�9
2026 estimate ������������������������������� 31,957�9 28,525�3 116�1 N/A 576�9 515�0 8�6 2�1
2027 estimate ������������������������������� 33,266�1 29,110�7 116�4 N/A 657�7 575�5 9�5 2�3
2028 estimate ������������������������������� 34,690�9 29,762�2 116�8 N/A 729�8 626�1 10�0 2�5
2029 estimate ������������������������������� 35,996�2 30,276�4 116�6 N/A 799�3 672�3 10�8 2�6
2030 estimate ������������������������������� 37,480�8 30,906�9 116�8 N/A 883�7 728�7 11�3 2�8
2031 estimate ������������������������������� 39,059�3 31,576�9 117�0 N/A 970�7 784�8 11�8 2�9N/A = Not available�1 Amounts in current dollars deflated by the GDP chain-type price index with fiscal year 2020 equal to 100�2 Total credit market debt owed by domestic nonfinancial sectors� Financial sectors are omitted to avoid double counting, since financial intermediaries borrow in the credit market
primarily in order to finance lending in the credit market� Source: Federal Reserve Board flow of funds accounts� Projections are not available�3 Interest on debt held by the public is estimated as the interest on Treasury debt securities less the “interest received by trust funds” (subfunction 901 less subfunctions 902 and 903)�
The estimate of interest on debt held by the public does not include the comparatively small amount of interest paid on agency debt or the offsets for interest on Treasury debt received by other Government accounts (revolving funds and special funds)�
4. FEDERAL BORROWING AND DEBT 25
increase to $3,669 billion3 and debt held by the public is projected to grow to 109.7 percent of GDP. The deficit is projected to fall to $1,837 billion in 2022, and debt held by the public is projected to grow more slowly, to 111.8 per-cent of GDP. After 2022, the deficit is projected to roughly stabilize at around 5 percent as a percent of GDP. As a result, debt held by the public will increase more gradu-ally, reaching 117.0 percent of GDP by 2031. Debt held by the public net of financial assets as a percent of GDP is estimated to grow to 98.4 percent of GDP at the end of 2021, 100.1 percent at the end of 2022, and 108.5 percent by the end of 2031.
Debt Held by the Public and Gross Federal Debt
The Federal Government issues debt securities for two main purposes. First, it borrows from the public to provide for the Federal Government’s financing needs, including both the deficit and the other transactions requiring fi-nancing, most notably disbursements for direct student loans and other Federal credit programs.4 Second, it is-sues debt to Federal Government accounts, primarily trust funds, that accumulate surpluses. By law, trust fund sur-pluses must generally be invested in Federal securities. The gross Federal debt is defined to consist of both the debt held by the public and the debt held by Government accounts. Nearly all the Federal debt has been issued by the Treasury and is sometimes called “public debt,” but a small portion has been issued by other Government agen-cies and is called “agency debt.”5
Borrowing from the public, whether by the Treasury or by some other Federal agency, is important because it rep-resents the Federal demand on credit markets. Regardless of whether the proceeds are used for tangible or intan-gible investments or to finance current consumption, the Federal demand on credit markets has to be financed out of the saving of households and businesses, the State and local sector, or the rest of the world. Borrowing from the public can thus affect the size and composition of assets held by the private sector and the amount of saving im-ported from abroad and increase the amount of future resources required to pay interest to the public on Federal debt. Borrowing from the public is therefore an impor-tant consideration in Federal fiscal policy. Borrowing from the public, however, is an incomplete measure of the Federal impact on credit markets. Different types of Federal activities can affect the credit markets in differ-ent ways. For example, under its direct loan programs, the Government uses borrowed funds to acquire financial assets that might otherwise require financing in the cred-
3 The estimated deficit for 2021 is based on partial year actual data and generally incorporates actuals through March.
4 For the purposes of the Budget, “debt held by the public” is de-fined as debt held by investors outside of the Federal Government, both domestic and foreign, including U.S. State and local governments and foreign governments. It also includes debt held by the Federal Reserve.
5 The term “agency debt” is defined more narrowly in the budget than customarily in the securities market, where it includes not only the debt of the Federal agencies listed in Table 4–4, but also certain Govern-ment-guaranteed securities and the debt of the Government-sponsored enterprises listed in Table 15–7 in the supplemental materials to the “Credit and Insurance” chapter. (Table 15–7 is available on the internet at: https://www.whitehouse.gov/omb/analytical-perspectives/.)
it markets directly. (For more information on other ways in which Federal activities impact the credit market, see the discussion at the end of this chapter.) By incorporat-ing the change in direct loan and other financial assets, debt held by the public net of financial assets adds useful insight into the Government’s financial condition.
Issuing debt securities to Government accounts per-forms an essential function in accounting for the operation of these funds. The balances of debt represent the cumula-tive surpluses of these funds due to the excess of their tax receipts, interest receipts, and other collections over their spending. The interest on the debt that is credited to these funds accounts for the fact that some earmarked taxes and user fees will be spent at a later time than when the funds receive the monies. The debt securities are assets of those funds but are a liability of the general fund to the funds that hold the securities, and are a mechanism for crediting interest to those funds on their recorded balances. These balances generally provide the fund with authority to draw upon the U.S. Treasury in later years to make future pay-ments on its behalf to the public. Public policy may result in the Government’s running surpluses and accumulating debt in trust funds and other Government accounts in an-ticipation of future spending.
However, issuing debt to Government accounts does not have any of the current credit market effects of bor-rowing from the public. It is an internal transaction of the Government, made between two accounts that are both within the Government itself. Issuing debt to a Government account is not a current transaction of the Government with the public; it is not financed by private savings and does not compete with the private sector for available funds in the credit market. While such issu-ance provides the account with assets—a binding claim against the Treasury— those assets are fully offset by the increased liability of the Treasury to pay the claims, which will ultimately be covered by the collection of revenues or by borrowing. Similarly, the current interest earned by the Government account on its Treasury securities does not need to be financed by other resources.
The debt held by Government accounts may differ from the estimated amount of the account’s obligations or re-sponsibilities to make future payments to the public. For example, if the account records the transactions of a social insurance program, the debt that it holds does not neces-sarily represent the actuarial present value of estimated future benefits (or future benefits less taxes) for the cur-rent participants in the program; nor does it necessarily represent the actuarial present value of estimated future benefits (or future benefits less taxes) for the current par-ticipants plus the estimated future participants over some stated time period. The future transactions of Federal so-cial insurance and employee retirement programs, which own 90 percent of the debt held by Government accounts, are important in their own right and need to be analyzed separately. This can be done through information pub-lished in the actuarial and financial reports for these programs.6
6 Extensive actuarial analyses of the Social Security and Medicare programs are published in the annual reports of the boards of trustees
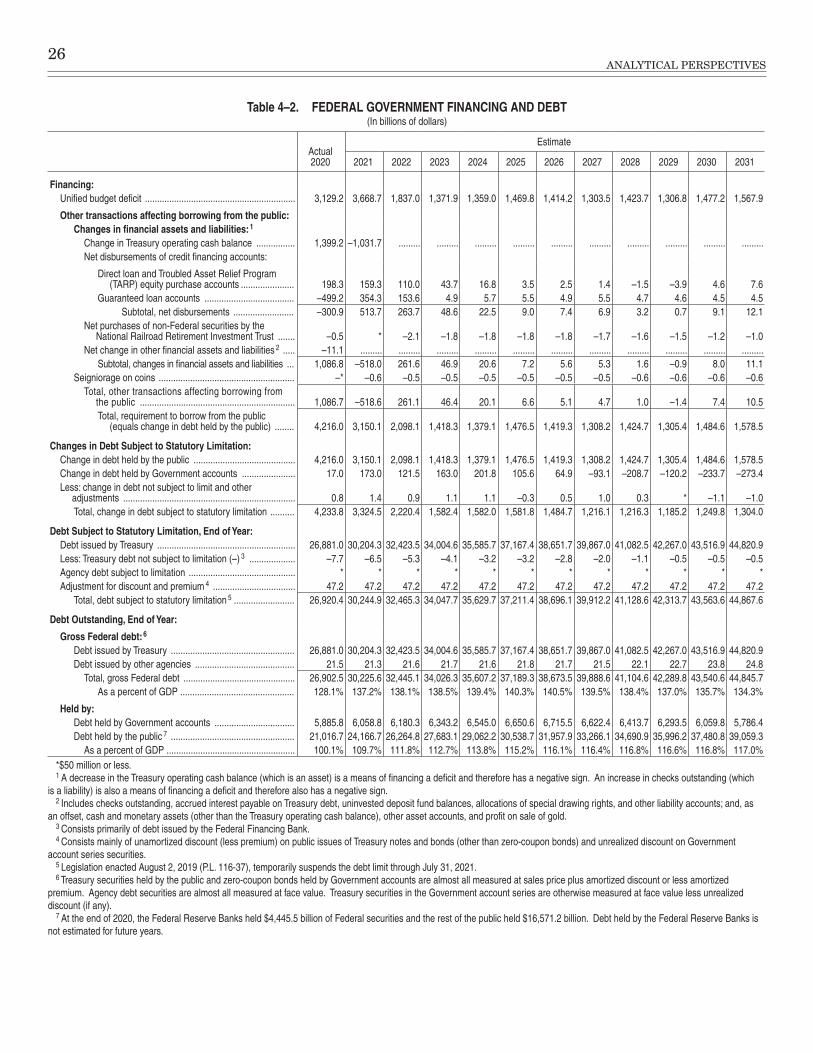
26ANALYTICAL PERSPECTIVES
Table 4–2. FEDERAL GOVERNMENT FINANCING AND DEBT(In billions of dollars)
Actual 2020
Estimate
2021 2022 2023 2024 2025 2026 2027 2028 2029 2030 2031
Financing:Unified budget deficit �������������������������������������������������������������� 3,129�2 3,668�7 1,837�0 1,371�9 1,359�0 1,469�8 1,414�2 1,303�5 1,423�7 1,306�8 1,477�2 1,567�9
Other transactions affecting borrowing from the public:Changes in financial assets and liabilities: 1
Change in Treasury operating cash balance ���������������� 1,399�2 –1,031�7 ��������� ��������� ��������� ��������� ��������� ��������� ��������� ��������� ��������� ���������Net disbursements of credit financing accounts:
Direct loan and Troubled Asset Relief Program (TARP) equity purchase accounts ���������������������� 198�3 159�3 110�0 43�7 16�8 3�5 2�5 1�4 –1�5 –3�9 4�6 7�6
Guaranteed loan accounts ������������������������������������� –499�2 354�3 153�6 4�9 5�7 5�5 4�9 5�5 4�7 4�6 4�5 4�5Subtotal, net disbursements ������������������������� –300�9 513�7 263�7 48�6 22�5 9�0 7�4 6�9 3�2 0�7 9�1 12�1
Net purchases of non-Federal securities by the National Railroad Retirement Investment Trust ������� –0�5 * –2�1 –1�8 –1�8 –1�8 –1�8 –1�7 –1�6 –1�5 –1�2 –1�0
Net change in other financial assets and liabilities 2 ����� –11�1 ��������� ��������� ��������� ��������� ��������� ��������� ��������� ��������� ��������� ��������� ���������Subtotal, changes in financial assets and liabilities ��� 1,086�8 –518�0 261�6 46�9 20�6 7�2 5�6 5�3 1�6 –0�9 8�0 11�1
Seigniorage on coins �������������������������������������������������������� –* –0�6 –0�5 –0�5 –0�5 –0�5 –0�5 –0�5 –0�6 –0�6 –0�6 –0�6Total, other transactions affecting borrowing from
the public ���������������������������������������������������������������� 1,086�7 –518�6 261�1 46�4 20�1 6�6 5�1 4�7 1�0 –1�4 7�4 10�5Total, requirement to borrow from the public
(equals change in debt held by the public) �������� 4,216�0 3,150�1 2,098�1 1,418�3 1,379�1 1,476�5 1,419�3 1,308�2 1,424�7 1,305�4 1,484�6 1,578�5
Changes in Debt Subject to Statutory Limitation:Change in debt held by the public ������������������������������������������ 4,216�0 3,150�1 2,098�1 1,418�3 1,379�1 1,476�5 1,419�3 1,308�2 1,424�7 1,305�4 1,484�6 1,578�5Change in debt held by Government accounts ���������������������� 17�0 173�0 121�5 163�0 201�8 105�6 64�9 –93�1 –208�7 –120�2 –233�7 –273�4Less: change in debt not subject to limit and other
adjustments ����������������������������������������������������������������������� 0�8 1�4 0�9 1�1 1�1 –0�3 0�5 1�0 0�3 * –1�1 –1�0Total, change in debt subject to statutory limitation ���������� 4,233�8 3,324�5 2,220�4 1,582�4 1,582�0 1,581�8 1,484�7 1,216�1 1,216�3 1,185�2 1,249�8 1,304�0
Debt Subject to Statutory Limitation, End of Year:Debt issued by Treasury ��������������������������������������������������������� 26,881�0 30,204�3 32,423�5 34,004�6 35,585�7 37,167�4 38,651�7 39,867�0 41,082�5 42,267�0 43,516�9 44,820�9Less: Treasury debt not subject to limitation (–) 3 ������������������� –7�7 –6�5 –5�3 –4�1 –3�2 –3�2 –2�8 –2�0 –1�1 –0�5 –0�5 –0�5Agency debt subject to limitation �������������������������������������������� * * * * * * * * * * * *Adjustment for discount and premium 4 ���������������������������������� 47�2 47�2 47�2 47�2 47�2 47�2 47�2 47�2 47�2 47�2 47�2 47�2
Total, debt subject to statutory limitation 5 ������������������������� 26,920�4 30,244�9 32,465�3 34,047�7 35,629�7 37,211�4 38,696�1 39,912�2 41,128�6 42,313�7 43,563�6 44,867�6
Debt Outstanding, End of Year:
Gross Federal debt: 6
Debt issued by Treasury ��������������������������������������������������� 26,881�0 30,204�3 32,423�5 34,004�6 35,585�7 37,167�4 38,651�7 39,867�0 41,082�5 42,267�0 43,516�9 44,820�9Debt issued by other agencies ����������������������������������������� 21�5 21�3 21�6 21�7 21�6 21�8 21�7 21�5 22�1 22�7 23�8 24�8
Total, gross Federal debt ���������������������������������������������� 26,902�5 30,225�6 32,445�1 34,026�3 35,607�2 37,189�3 38,673�5 39,888�6 41,104�6 42,289�8 43,540�6 44,845�7As a percent of GDP ����������������������������������������������� 128�1% 137�2% 138�1% 138�5% 139�4% 140�3% 140�5% 139�5% 138�4% 137�0% 135�7% 134�3%
Held by:Debt held by Government accounts ��������������������������������� 5,885�8 6,058�8 6,180�3 6,343�2 6,545�0 6,650�6 6,715�5 6,622�4 6,413�7 6,293�5 6,059�8 5,786�4Debt held by the public 7 ��������������������������������������������������� 21,016�7 24,166�7 26,264�8 27,683�1 29,062�2 30,538�7 31,957�9 33,266�1 34,690�9 35,996�2 37,480�8 39,059�3
As a percent of GDP ����������������������������������������������������� 100�1% 109�7% 111�8% 112�7% 113�8% 115�2% 116�1% 116�4% 116�8% 116�6% 116�8% 117�0%*$50 million or less�1 A decrease in the Treasury operating cash balance (which is an asset) is a means of financing a deficit and therefore has a negative sign� An increase in checks outstanding (which
is a liability) is also a means of financing a deficit and therefore also has a negative sign�2 Includes checks outstanding, accrued interest payable on Treasury debt, uninvested deposit fund balances, allocations of special drawing rights, and other liability accounts; and, as
an offset, cash and monetary assets (other than the Treasury operating cash balance), other asset accounts, and profit on sale of gold�3 Consists primarily of debt issued by the Federal Financing Bank�4 Consists mainly of unamortized discount (less premium) on public issues of Treasury notes and bonds (other than zero-coupon bonds) and unrealized discount on Government
account series securities�5 Legislation enacted August 2, 2019 (P�L� 116-37), temporarily suspends the debt limit through July 31, 2021�6 Treasury securities held by the public and zero-coupon bonds held by Government accounts are almost all measured at sales price plus amortized discount or less amortized
premium� Agency debt securities are almost all measured at face value� Treasury securities in the Government account series are otherwise measured at face value less unrealized discount (if any)�
7 At the end of 2020, the Federal Reserve Banks held $4,445�5 billion of Federal securities and the rest of the public held $16,571�2 billion� Debt held by the Federal Reserve Banks is not estimated for future years�
4. FEDERAL BORROWING AND DEBT 27
This Budget uses a variety of information sources to analyze the condition of Social Security and Medicare, the Government’s two largest social insurance programs. The excess of future Social Security and Medicare benefits rel-ative to their dedicated income is very different in concept and much larger in size than the amount of Treasury se-curities that these programs hold.
For all these reasons, debt held by the public and debt held by the public net of financial assets are both better gauges of the effect of the budget on the credit markets than gross Federal debt.
Government Deficits or Surpluses and the Change in Debt
Table 4–2 summarizes Federal borrowing and debt from 2020 through 2031.7 In 2020, the Government borrowed $4,216 billion, increasing the debt held by the public from $16,801 billion at the end of 2019 to $21,017 billion at the end of 2020. The debt held by Government accounts grew by $17 billion, and gross Federal debt increased by $4,233 billion to $26,902 billion.
Debt held by the public.—The Federal Government primarily finances deficits by borrowing from the public, and it primarily uses surpluses to repay debt held by the public.8 Table 4–2 shows the relationship between the Federal deficit or surplus and the change in debt held by the public. The borrowing or debt repayment depends on the Government’s expenditure programs and tax laws, on the economic conditions that influence tax receipts and outlays, and on debt management policy. The sensitiv-ity of the budget to economic conditions is analyzed in Chapter 2, “Economic Assumptions and Overview,” in this volume.
The total or unified budget consists of two parts: the on-budget portion; and the off-budget Federal entities, which have been excluded from the budget by law. Under pres-ent law, the off-budget Federal entities are the two Social Security trust funds (Old-Age and Survivors Insurance and Disability Insurance) and the Postal Service Fund.9 The on-budget and off-budget surpluses or deficits are added together to determine the Government’s financing needs.
of these funds. The actuarial estimates for Social Security, Medicare, and the major Federal employee retirement programs are summarized in the Financial Report of the United States Government, prepared annu-ally by the Department of the Treasury in coordination with the Office of Management and Budget, and presented in more detail in the financial statements of the agencies administering those programs.
7 For projections of the debt beyond 2031, see Chapter 3, “Long-Term Budget Outlook.”
8 Treasury debt held by the public is measured as the sales price plus the amortized discount (or less the amortized premium). At the time of sale, the book value equals the sales price. Subsequently, it equals the sales price plus the amount of the discount that has been amortized up to that time. In equivalent terms, the book value of the debt equals the principal amount due at maturity (par or face value) less the unamortized discount. (For a security sold at a premium, the definition is symmetrical.) For inflation-protected notes and bonds, the book value includes a periodic adjustment for inflation. Agency debt is generally recorded at par.
9 For further explanation of the off-budget Federal entities, see Chapter 7, “Coverage of the Budget.”
Over the long run, it is a good approximation to say that “the deficit is financed by borrowing from the public” or “the surplus is used to repay debt held by the pub-lic.” However, the Government’s need to borrow in any given year has always depended on several other factors besides the unified budget surplus or deficit, such as the change in the Treasury operating cash balance. These other factors—“other transactions affecting borrowing from the public”—can either increase or decrease the Government’s need to borrow and can vary considerably in size from year to year. The other transactions affect-ing borrowing from the public are presented in Table 4–2 (where an increase in the need to borrow is represented by a positive sign, like the deficit).
In 2020 the deficit was $3,129 billion while these other factors increased the need to borrow by $1,087 billion, or 26 percent of total borrowing from the public. As a result, the Government borrowed $4,216 billion from the public. The other factors are estimated to reduce borrowing by $519 billion (16 percent of total borrowing from the pub-lic) in 2021, and increase borrowing by $261 billion (12 percent) in 2022. In 2023–2031, these other factors are expected to impact borrowing by annual amounts ranging from a $1 billion decrease to a $46 billion increase.
Three specific factors presented in Table 4–2, and dis-cussed below, have historically been especially important.
Change in Treasury operating cash balance.—The cash balance increased by $1,399 billion in 2020, to $1,782 billion. This was a significantly larger change than in previous years; over the prior 10 years, annual increases and decreases in the cash balance ranged from $2 billion to $252 billion. The higher 2020 cash balance was needed to manage the changes to outlays and receipts associated with the COVID-19 impacts and the Federal response. For risk management purposes, Treasury seeks to maintain a cash balance roughly equal to one week of Government outflows, with a minimum balance of about $150 billion. The operating cash balance is projected to decrease by $1,032 billion, to $750 billion, at the end of 2021. Changes in the operating cash balance, while occasionally large, are inherently limited over time. Decreases in cash—a means of financing the Government—are limited by the amount of past accumulations, which themselves required financing when they were built up. Increases are limited because it is generally more efficient to repay debt.
Net financing disbursements of the direct loan and guaranteed loan financing accounts.—Under the Federal Credit Reform Act of 1990 (FCRA), the budgetary program account for each credit program records the esti-mated subsidy costs—the present value of estimated net losses—at the time when the direct or guaranteed loans are disbursed. The individual cash flows to and from the public associated with the loans or guarantees, such as the disbursement and repayment of loans, the default payments on loan guarantees, the collection of interest and fees, and so forth, are recorded in the credit pro-gram’s non-budgetary financing account. Although the non-budgetary financing account’s cash flows to and from the public are not included in the deficit (except for their
28ANALYTICAL PERSPECTIVES
impact on subsidy costs), they affect Treasury’s net bor-rowing requirements.10
In addition to the transactions with the public, the financing accounts include several types of intragovern-mental transactions. They receive payment from the credit program accounts for the subsidy costs of new direct loans and loan guarantees and for any upward reestimate of the costs of outstanding direct and guaran-teed loans. They also receive interest from Treasury on balances of uninvested funds. The financing accounts pay any negative subsidy collections or downward reestimate of costs to budgetary receipt accounts and pay interest on borrowings from Treasury. The total net collections and gross disbursements of the financing accounts, consisting of transactions with both the public and the budgetary accounts, are called “net financing disbursements.” They occur in the same way as the “outlays” of a budgetary ac-count, even though they do not represent budgetary costs, and therefore affect the requirement for borrowing from the public in the same way as the deficit.
The intragovernmental transactions of the credit program, financing, and downward reestimate receipt ac-counts do not affect Federal borrowing from the public. Although the deficit changes because of the budgetary ac-count’s outlay to, or receipt from, a financing account, the net financing disbursement changes in an equal amount with the opposite sign, so the effects are cancelled out. On the other hand, financing account disbursements to the public increase the requirement for borrowing from the public in the same way as an increase in budget out-lays that are disbursed to the public in cash. Likewise, receipts from the public collected by the financing account can be used to finance the payment of the Government’s obligations, and therefore they reduce the requirement for Federal borrowing from the public in the same way as an increase in budgetary receipts.
Credit net financing disbursements reduced borrow-ing by $301 billion in 2020. Credit financing accounts are projected to increase borrowing by $514 billion in 2021 and by $264 billion in 2022. From 2023 to 2031, the credit financing accounts are expected to increase borrowing by amounts ranging from $1 billion to $49 billion.
In some years, large net upward or downward reesti-mates in the cost of outstanding direct and guaranteed loans may cause large swings in the net financing dis-bursements. In 2021, upward reestimates for student loans are partly offset by downward reestimates for Small Business Administration Disaster Assistance loans and Federal Housing Administration (FHA) guarantees, re-sulting in a net upward reestimate of $3.8 billion. In 2020, there was a net upward reestimate of $51.1 billion.
Net purchases of non-Federal securities by the National Railroad Retirement Investment Trust (NRRIT).—This trust fund, which was established by the Railroad Retirement and Survivors’ Improvement Act of 2001, invests its assets primarily in private stocks and bonds. The Act required special treatment of the purchase or sale
10 The FCRA (sec. 505(b)) requires that the financing accounts be non-budgetary. They are non-budgetary in concept because they do not measure cost. For additional discussion of credit programs, see Chapter 15, “Credit and Insurance,” and Chapter 6, “Budget Concepts.”
of non-Federal assets by the NRRIT trust fund, treating such purchases as a means of financing rather than as outlays. Therefore, the increased need to borrow from the public to finance NRRIT’s purchases of non-Federal as-sets is part of the “other transactions affecting borrowing from the public” rather than included as an increase in the deficit. While net purchases and redemptions affect borrowing from the public, unrealized gains and losses on NRRIT’s portfolio are included in both the “other transac-tions” and, with the opposite sign, in NRRIT’s net outlays in the deficit, for no net impact on borrowing from the public. In 2020, net decreases, including redemptions and losses, were $0.5 billion. A $21 million net increase is projected for 2021 and net annual decreases ranging from $1.0 billion to $2.1 billion are projected for 2022 and sub-sequent years.11
Debt held by Government accounts.—The amount of Federal debt issued to Government accounts depends largely on the surpluses of the trust funds, both on-bud-get and off-budget, which owned 89 percent of the total Federal debt held by Government accounts at the end of 2020. Net investment may differ from the surplus due to changes in the amount of cash assets not currently invested. In 2020, there was a total trust fund deficit of $53 billion,12 while trust fund investment in Federal securities fell by $29 billion. The remainder of debt is-sued to Government accounts is owned by a number of special funds and revolving funds. The debt held in ma-jor accounts and the annual investments are shown in Table 4–5.
Debt Held by the Public Net of Financial Assets and Liabilities
While debt held by the public is a key measure for ex-amining the role and impact of the Federal Government in the U.S. and international credit markets and for oth-er purposes, it provides incomplete information on the Government’s financial condition. The U.S. Government holds significant financial assets, which can be offset against debt held by the public and other financial li-abilities to achieve a more complete understanding of the Government’s financial condition. The acquisition of those financial assets represents a transaction with the credit markets, broadening those markets in a way that is analogous to the demand on credit markets that bor-rowing entails. For this reason, debt held by the public is also an incomplete measure of the impact of the Federal Government in the United States and international credit markets.
One transaction that can increase both borrowing and assets is an increase to the Treasury operating cash balance. When the Government borrows to increase the Treasury operating cash balance, that cash balance also represents an asset that is available to the Federal Government. Looking at both sides of this transaction—
11 The budget treatment of this fund is further discussed in Chapter 6, “Budget Concepts.”
12 2020 was the first time in several decades that the trust funds group ran a deficit rather than a surplus, due to the impacts of the CO-VID-19 pandemic and the Federal response. For further discussion of trust funds, see Chapter 18, “Trust Funds and Federal Funds.”

4. FEDERAL BORROWING AND DEBT 29
the borrowing to obtain the cash and the asset of the cash holdings—provides much more complete information about the Government’s financial condition than looking at only the borrowing from the public. Another example of a transaction that simultaneously increases borrowing from the public and Federal assets is Government bor-rowing to issue direct loans to the public. When the direct loan is made, the Government is also acquiring an asset in the form of future payments of principal and inter-est, net of the Government’s expected losses on the loan. Similarly, when NRRIT increases its holdings of non-Fed-eral securities, the borrowing to purchase those securities is offset by the value of the asset holdings.
The acquisition or disposition of Federal financial as-sets very largely explains the difference between the deficit for a particular year and that year’s increase in debt held by the public. Debt held by the public net of financial assets is a measure that is conceptually closer to the measurement of Federal deficits or surpluses; cumu-lative deficits and surpluses over time more closely equal the debt held by the public net of financial assets than they do the debt held by the public.
Table 4–3 presents debt held by the public net of the Government’s financial assets and liabilities. Treasury debt is presented in the Budget at book value, with no adjustments for the change in economic value that results from fluctuations in interest rates. The balances of credit financing accounts are based on projections of future cash flows. For direct loan financing accounts, the balance generally represents the net present value of anticipated future inflows such as principal and interest payments from borrowers. For guaranteed loan financing accounts,
the balance generally represents the net present value of anticipated future outflows, such as default claim pay-ments net of recoveries, and other collections, such as program fees. NRRIT’s holdings of non-Federal securities are marked to market on a monthly basis. Government-sponsored enterprise stock and Air carrier worker support warrants and notes are measured at market value.
Due largely to the $1,399 billion increase in the Treasury operating cash balance, partly offset by other transactions, net financial assets grew by $1,087 billion, to $2,993 billion, in 2020. This $2,993 billion in net finan-cial assets included a cash balance of $1,782 billion, net credit financing account balances of $1,147 billion, and other assets and liabilities that aggregated to a net asset of $65 billion. At the end of 2020, debt held by the public was $21,017 billion, or 100.1 percent of GDP. Therefore, debt held by the public net of financial assets was $18,024 billion, or 85.8 percent of GDP. As shown in Table 4–3, the value of the Government’s net financial assets is pro-jected to fall, to $2,483 billion in 2021. The projected 2021 decrease is principally due to the anticipated decrease in the Treasury operating cash balance, partly offset by the expected increase in the value of the credit financing accounts. While debt held by the public is expected to increase from 100.1 percent to 109.7 percent of GDP dur-ing 2021, debt held by the public net of financial assets is expected to increase from 85.8 percent to 98.4 percent of GDP.
Debt securities and other financial assets and liabili-ties do not encompass all the assets and liabilities of the Federal Government. For example, accounts payable oc-cur in the normal course of buying goods and services;
Table 4–3. DEBT HELD BY THE PUBLIC NET OF FINANCIAL ASSETS AND LIABILITIES(Dollar amounts in billions)
Actual 2020
Estimate
2021 2022 2023 2024 2025 2026 2027 2028 2029 2030 2031
Debt Held by the Public:Debt held by the public ����������������������������������������������������������� 21,016�7 24,166�7 26,264�8 27,683�1 29,062�2 30,538�7 31,957�9 33,266�1 34,690�9 35,996�2 37,480�8 39,059�3
As a percent of GDP ��������������������������������������������������������� 100�1% 109�7% 111�8% 112�7% 113�8% 115�2% 116�1% 116�4% 116�8% 116�6% 116�8% 117�0%
Financial Assets Net of Liabilities:Treasury operating cash balance �������������������������������������������� 1,781�7 750�0 750�0 750�0 750�0 750�0 750�0 750�0 750�0 750�0 750�0 750�0
Credit financing account balances:Direct loan and TARP equity purchase accounts �������������� 1,613�3 1,772�6 1,882�6 1,926�3 1,943�1 1,946�6 1,949�1 1,950�6 1,949�0 1,945�1 1,949�7 1,957�3Guaranteed loan accounts ����������������������������������������������� –466�7 –112�4 41�3 46�2 51�9 57�3 62�2 67�7 72�4 77�0 81�6 86�1
Subtotal, credit financing account balances ����������������� 1,146�5 1,660�2 1,923�9 1,972�5 1,995�0 2,004�0 2,011�4 2,018�3 2,021�5 2,022�2 2,031�3 2,043�4Government-sponsored enterprise stock 1 ����������������������������� 108�9 108�9 108�9 108�9 108�9 108�9 108�9 108�9 108�9 108�9 108�9 108�9Air carrier worker support warrants and notes 2 ���������������������� 5�3 13�0 13�0 13�0 13�0 13�0 12�5 11�9 11�9 11�9 11�9 6�6Non-Federal securities held by NRRIT ����������������������������������� 24�0 24�0 21�9 20�1 18�3 16�5 14�7 13�1 11�4 9�9 8�7 7�7Other assets net of liabilities ��������������������������������������������������� –73�4 –73�4 –73�4 –73�4 –73�4 –73�4 –73�4 –73�4 –73�4 –73�4 –73�4 –73�4
Total, financial assets net of liabilities ������������������������������� 2,993�0 2,482�7 2,744�4 2,791�2 2,811�9 2,819�0 2,824�2 2,828�8 2,830�4 2,829�5 2,837�5 2,843�3
Debt Held by the Public Net of Financial Assets and Liabilities:Debt held by the public net of financial assets ������������������������ 18,023�6 21,684�0 23,520�5 24,891�9 26,250�4 27,719�6 29,133�8 30,437�3 31,860�5 33,166�7 34,643�3 36,216�0
As a percent of GDP ��������������������������������������������������������� 85�8% 98�4% 100�1% 101�3% 102�8% 104�5% 105�8% 106�5% 107�3% 107�5% 107�9% 108�5%*$50 million or less�1 Treasury’s warrants to purchase 79�9 percent of the common stock of the enterprises expire after September 7, 2028� The warrants were valued at $13 billion at the end of 2020�2 Of the notes and warrants issued under Air carrier worker support (Payroll support program), $0�5 billion are scheduled to expire by the end of 2026, $0�6 billion are scheduled to
expire by the end of 2027, and $5�3 billion are scheduled to expire by the end of 2031�

30ANALYTICAL PERSPECTIVES
Social Security benefits are due and payable as of the end of the month but, according to statute, are paid during the next month; and Federal employee salaries are paid after they have been earned. Like debt securities sold in the credit market, these liabilities have their own distinctive effects on the economy. The Federal Government also has significant holdings of non-financial assets, such as land, mineral deposits, buildings, and equipment. The differ-ent types of assets and liabilities are reported annually in the financial statements of Federal agencies and in the Financial Report of the United States Government, pre-pared by the Treasury in coordination with OMB.
Treasury Debt
Nearly all Federal debt is issued by the Department of the Treasury. Treasury meets most of the Federal Government’s financing needs by issuing marketable se-curities to the public. These financing needs include both the change in debt held by the public and the refinanc-ing—or rollover—of any outstanding debt that matures during the year. Treasury marketable debt is sold at pub-lic auctions on a regular schedule and, because it is very liquid, can be bought and sold on the secondary market at narrow bid-offer spreads. Treasury also sells to the pub-lic a relatively small amount of nonmarketable securities, such as savings bonds and State and Local Government Series securities (SLGS).13 Treasury nonmarketable debt cannot be bought or sold on the secondary market.
Treasury issues marketable securities in a wide range of maturities, and issues both nominal (non-inflation-protected) and inflation-protected securities. Treasury’s marketable securities include:
Treasury Bills—Treasury bills have maturities of one year or less from their issue date. In addition to the reg-ular auction calendar of bill issuance, Treasury issues cash management bills on an as-needed basis for vari-ous reasons such as to offset the seasonal patterns of the Government’s receipts and outlays. In 2020, Treasury be-gan issuing cash management bills on a weekly basis in relation to the financing needed due to the impacts of the COVID-19 pandemic and the Government’s response.
Treasury Notes—Treasury notes have maturities of more than one year and up to 10 years.
Treasury Bonds—Treasury bonds have maturities of more than 10 years. The longest-maturity securities is-sued by Treasury are 30-year bonds. In 2020, Treasury began issuing a monthly 20-year bond.
Treasury Inflation-Protected Securities (TIPS)— Treasury inflation-protected—or inflation-indexed—se-curities are coupon issues for which the par value of the security rises with inflation. The principal value is ad-justed daily to reflect inflation as measured by changes in the Consumer Price Index (CPI-U-NSA, with a two-month lag). Although the principal value may be adjusted down-ward if inflation is negative, at maturity, the securities will be redeemed at the greater of their inflation-adjusted principal or par amount at original issue.
13 Under the SLGS program, the Treasury offers special low-yield securities to State and local governments and other entities for tempo-rary investment of proceeds of tax-exempt bonds.
Floating Rate Securities—Floating rate securities have a fixed par value but bear interest rates that fluctuate based on movements in a specified benchmark market interest rate. Treasury’s floating rate notes are bench-marked to the Treasury 13-week bill. Currently, Treasury is issuing floating rate securities with a maturity of two years.
Historically, the average maturity of outstanding debt issued by Treasury has been about five years. The aver-age maturity of outstanding debt was 63 months at the end of 2020.
In addition to quarterly announcements about the overall auction calendar, Treasury publicly announces in advance the auction of each security. Individuals can participate directly in Treasury auctions or can purchase securities through brokers, dealers, and other financial institutions. Treasury accepts two types of auction bids: competitive and noncompetitive. In a competitive bid, the bidder specifies the yield. A significant portion of com-petitive bids are submitted by primary dealers, which are banks and securities brokerages that have been des-ignated to trade in Treasury securities with the Federal Reserve System. In a noncompetitive bid, the bidder agrees to accept the yield determined by the auction.14 At the close of the auction, Treasury accepts all eligible noncompetitive bids and then accepts competitive bids in ascending order beginning with the lowest yield bid until the offering amount is reached. All winning bidders re-ceive the highest accepted yield bid.
Treasury marketable securities are highly liquid and actively traded on the secondary market, which enhances the demand for Treasuries at initial auction. The demand for Treasury securities is reflected in the ratio of bids re-ceived to bids accepted in Treasury auctions; the demand for the securities is substantially greater than the level of issuance. Because they are backed by the full faith and credit of the United States Government, Treasury mar-ketable securities are considered to be credit “risk-free.” Therefore, the Treasury yield curve is commonly used as a benchmark for a wide variety of purposes in the financial markets.
Whereas Treasury issuance of marketable debt is based on the Government’s financing needs, Treasury’s issuance of nonmarketable debt is based on the public’s demand for the specific types of investments. Increases in outstand-ing balances of nonmarketable debt, such as occurred in 2020, reduce the need for marketable borrowing.15
Agency Debt
A few Federal agencies other than Treasury, shown in Table 4–4, sell or have sold debt securities to the public and, at times, to other Government accounts. Currently, new debt is issued only by the Tennessee Valley Authority (TVA) and the Federal Housing Administration; the re-maining agencies are repaying past borrowing. Agency debt was $21.5 billion at the end of 2020. Agency debt is
14 Noncompetitive bids cannot exceed $5 million per bidder.15 Detail on the marketable and nonmarketable securities issued by
Treasury is found in the Monthly Statement of the Public Debt, pub-lished on a monthly basis by the Department of the Treasury.
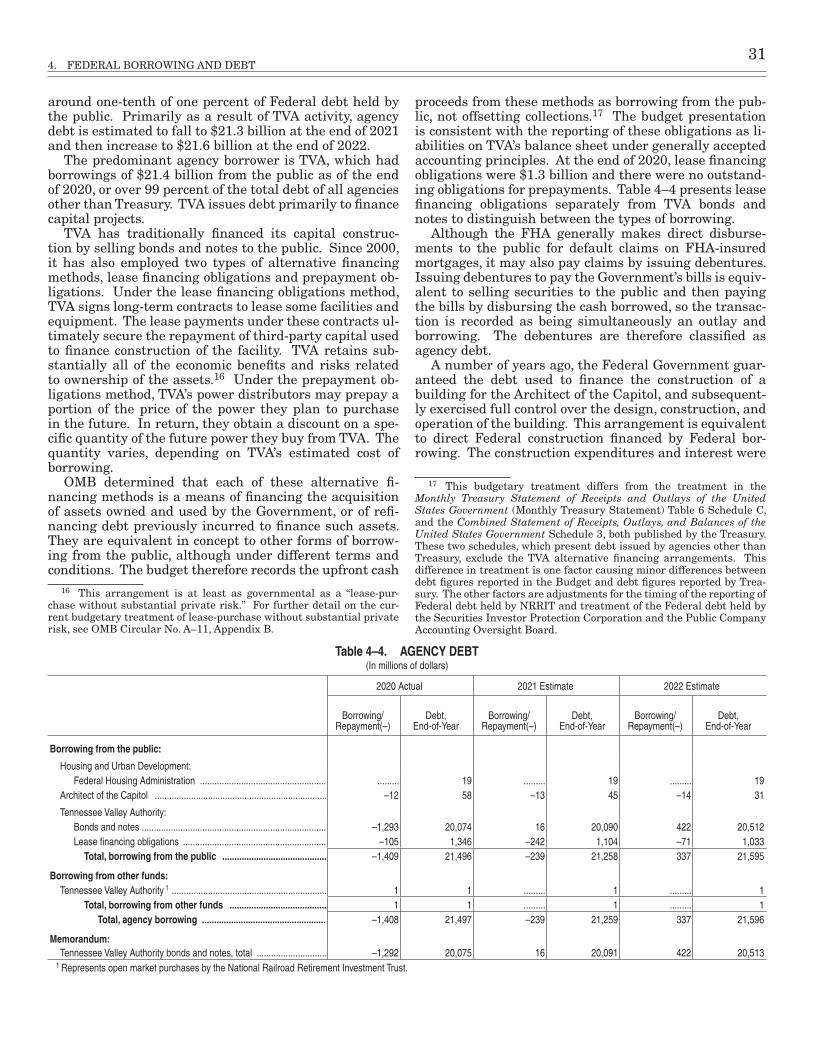
4. FEDERAL BORROWING AND DEBT 31
around one-tenth of one percent of Federal debt held by the public. Primarily as a result of TVA activity, agency debt is estimated to fall to $21.3 billion at the end of 2021 and then increase to $21.6 billion at the end of 2022.
The predominant agency borrower is TVA, which had borrowings of $21.4 billion from the public as of the end of 2020, or over 99 percent of the total debt of all agencies other than Treasury. TVA issues debt primarily to finance capital projects.
TVA has traditionally financed its capital construc-tion by selling bonds and notes to the public. Since 2000, it has also employed two types of alternative financing methods, lease financing obligations and prepayment ob-ligations. Under the lease financing obligations method, TVA signs long-term contracts to lease some facilities and equipment. The lease payments under these contracts ul-timately secure the repayment of third-party capital used to finance construction of the facility. TVA retains sub-stantially all of the economic benefits and risks related to ownership of the assets.16 Under the prepayment ob-ligations method, TVA’s power distributors may prepay a portion of the price of the power they plan to purchase in the future. In return, they obtain a discount on a spe-cific quantity of the future power they buy from TVA. The quantity varies, depending on TVA’s estimated cost of borrowing.
OMB determined that each of these alternative fi-nancing methods is a means of financing the acquisition of assets owned and used by the Government, or of refi-nancing debt previously incurred to finance such assets. They are equivalent in concept to other forms of borrow-ing from the public, although under different terms and conditions. The budget therefore records the upfront cash
16 This arrangement is at least as governmental as a “lease-pur-chase without substantial private risk.” For further detail on the cur-rent budgetary treatment of lease-purchase without substantial private risk, see OMB Circular No. A–11, Appendix B.
proceeds from these methods as borrowing from the pub-lic, not offsetting collections.17 The budget presentation is consistent with the reporting of these obligations as li-abilities on TVA’s balance sheet under generally accepted accounting principles. At the end of 2020, lease financing obligations were $1.3 billion and there were no outstand-ing obligations for prepayments. Table 4–4 presents lease financing obligations separately from TVA bonds and notes to distinguish between the types of borrowing.
Although the FHA generally makes direct disburse-ments to the public for default claims on FHA-insured mortgages, it may also pay claims by issuing debentures. Issuing debentures to pay the Government’s bills is equiv-alent to selling securities to the public and then paying the bills by disbursing the cash borrowed, so the transac-tion is recorded as being simultaneously an outlay and borrowing. The debentures are therefore classified as agency debt.
A number of years ago, the Federal Government guar-anteed the debt used to finance the construction of a building for the Architect of the Capitol, and subsequent-ly exercised full control over the design, construction, and operation of the building. This arrangement is equivalent to direct Federal construction financed by Federal bor-rowing. The construction expenditures and interest were
17 This budgetary treatment differs from the treatment in the Monthly Treasury Statement of Receipts and Outlays of the United States Government (Monthly Treasury Statement) Table 6 Schedule C, and the Combined Statement of Receipts, Outlays, and Balances of the United States Government Schedule 3, both published by the Treasury. These two schedules, which present debt issued by agencies other than Treasury, exclude the TVA alternative financing arrangements. This difference in treatment is one factor causing minor differences between debt figures reported in the Budget and debt figures reported by Trea-sury. The other factors are adjustments for the timing of the reporting of Federal debt held by NRRIT and treatment of the Federal debt held by the Securities Investor Protection Corporation and the Public Company Accounting Oversight Board.
Table 4–4. AGENCY DEBT(In millions of dollars)
2020 Actual 2021 Estimate 2022 Estimate
Borrowing/ Repayment(–)
Debt,End-of-Year
Borrowing/ Repayment(–)
Debt,End-of-Year
Borrowing/ Repayment(–)
Debt,End-of-Year
Borrowing from the public:
Housing and Urban Development:Federal Housing Administration ���������������������������������������������������� ��������� 19 ��������� 19 ��������� 19
Architect of the Capitol ����������������������������������������������������������������������� –12 58 –13 45 –14 31
Tennessee Valley Authority:Bonds and notes ���������������������������������������������������������������������������� –1,293 20,074 16 20,090 422 20,512Lease financing obligations ����������������������������������������������������������� –105 1,346 –242 1,104 –71 1,033
Total, borrowing from the public ........................................... –1,409 21,496 –239 21,258 337 21,595
Borrowing from other funds:Tennessee Valley Authority 1 ���������������������������������������������������������������� 1 1 ��������� 1 ��������� 1
Total, borrowing from other funds ........................................ 1 1 ��������� 1 ��������� 1Total, agency borrowing ................................................... –1,408 21,497 –239 21,259 337 21,596
Memorandum:Tennessee Valley Authority bonds and notes, total ����������������������������� –1,292 20,075 16 20,091 422 20,513
1 Represents open market purchases by the National Railroad Retirement Investment Trust�

32ANALYTICAL PERSPECTIVES
therefore classified as Federal outlays, and the borrow-ing was classified as Federal agency borrowing from the public.
Several Federal agencies borrow from the Bureau of the Fiscal Service (Fiscal Service) or the Federal Financing Bank (FFB), both within the Department of the Treasury. Agency borrowing from the FFB or the Fiscal Service is not included in gross Federal debt. It would be double counting to add together (a) the agency borrowing from the Fiscal Service or FFB and (b) the Treasury borrow-ing from the public that is needed to provide the Fiscal Service or FFB with the funds to lend to the agencies.
Debt Held by Government Accounts
Trust funds, and some special funds and public enter-prise revolving funds, accumulate cash in excess of current needs in order to meet future obligations. These cash sur-pluses are generally invested in Treasury securities.
The total investment holdings of trust funds and other Government accounts increased by $17 billion in 2020. Net investment by Government accounts is estimated to be $173 billion in 2021 and $121 billion in 2022, as shown in Table 4–5. The holdings of Federal securities by Government accounts are estimated to grow to $6,180 bil-lion by the end of 2022, or 19 percent of the gross Federal debt. The percentage is estimated to decrease gradually over the next 10 years.
The Government account holdings of Federal secu-rities are concentrated among a few funds: the Social Security Old-Age and Survivors Insurance and Disability Insurance trust funds; the Medicare Hospital Insurance and Supplementary Medical Insurance trust funds; and four Federal employee retirement funds. These Federal employee retirement funds include two trust funds, the Military Retirement Fund and the Civil Service Retirement and Disability Fund (CSRDF), and two special funds, the uniformed services Medicare-Eligible Retiree Health Care Fund (MERHCF) and the Postal Service Retiree Health Benefits Fund (PSRHBF). At the end of 2022, these Social Security, Medicare, and Federal em-ployee retirement funds are estimated to own 79 percent of the total debt held by Government accounts. During 2020–2022, the Military Retirement Fund has a large sur-plus and is estimated to invest a total of $253 billion, 81 percent of total net investment by Government accounts. Some Government accounts are projected to have net dis-investment in Federal securities during 2020–2022.
Technical note on measurement.—The Treasury securi-ties held by Government accounts consist almost entirely of the Government account series. Most were issued at par value (face value), and the securities issued at a dis-count or premium are traditionally recorded at par in the OMB and Treasury reports on Federal debt. However, there are two kinds of exceptions.
First, Treasury issues zero-coupon bonds to a very few Government accounts. Because the purchase price is a small fraction of par value and the amounts are large, the holdings are recorded in Table 4–5 at par value less unamortized discount. The only Government accounts that held zero-coupon bonds during 2020 are the Nuclear
Waste Disposal Fund in the Department of Energy, the Military Retirement Fund, and MERHCF. The unamor-tized discount on zero-coupon bonds held by these three funds was $24.3 billion at the end of 2020.
Second, Treasury subtracts the unrealized discount on other Government account series securities in cal-culating “net Federal securities held as investments of Government accounts.” Unlike the discount recorded for zero-coupon bonds and debt held by the public, the unre-alized discount is the discount at the time of issue and is not amortized over the term of the security. In Table 4–5 it is shown as a separate item at the end of the table and not distributed by account. The amount was $1.4 billion at the end of 2020.
Debt Held by the Federal Reserve
The Federal Reserve acquires marketable Treasury securities as part of its exercise of monetary policy. For purposes of the Budget and reporting by the Department of the Treasury, the transactions of the Federal Reserve are considered to be non-budgetary, and accordingly the Federal Reserve’s holdings of Treasury securities are included as part of debt held by the public.18 Federal Reserve holdings were $4,445 billion (21 percent of debt held by the public) at the end of 2020. Over the last 10 years, the Federal Reserve holdings have averaged 17 percent of debt held by the public. The historical holdings of the Federal Reserve are presented in Table 7.1 in the Budget’s Historical Tables. The Budget does not project Federal Reserve holdings for future years.
Limitations on Federal Debt
Definition of debt subject to limit.—Statutory limi-tations have usually been placed on Federal debt. Until World War I, the Congress ordinarily authorized a specific amount of debt for each separate issue. Beginning with the Second Liberty Bond Act of 1917, however, the nature of the limitation was modified in several steps until it de-veloped into a ceiling on the total amount of most Federal debt outstanding. This last type of limitation has been in effect since 1941. The limit currently applies to most debt issued by the Treasury since September 1917, whether held by the public or by Government accounts; and other debt issued by Federal agencies that, according to explicit statute, is guaranteed as to principal and interest by the U.S. Government.
The third part of Table 4–2 compares total Treasury debt with the amount of Federal debt that is subject to the limit. Nearly all Treasury debt is subject to the debt limit.
A large portion of the Treasury debt not subject to the general statutory limit was issued by the Federal Financing Bank. The FFB is authorized to have outstand-ing up to $15 billion of publicly issued debt. The FFB has on occasion issued this debt to CSRDF in exchange for equal amounts of regular Treasury securities. The FFB securities have the same interest rates and maturities as the Treasury securities for which they were exchanged.
18 For further detail on the monetary policy activities of the Federal Reserve and the treatment of the Federal Reserve in the Budget, see Chapter 7, “Coverage of the Budget.”

4. FEDERAL BORROWING AND DEBT 33
Table 4–5. DEBT HELD BY GOVERNMENT ACCOUNTS1
(In millions of dollars)
Description
Investment or Disinvestment (–)Holdings,
End of 2022 Estimate
2020 Actual
2021 Estimate
2022 Estimate
Investment in Treasury debt:
Judicial Branch:Judicial Officers’ Retirement Fund ��������������������������������������������������������������������������������������������������������������������������������� 111 127 123 1,104
Commerce:Public Safety Trust Fund ������������������������������������������������������������������������������������������������������������������������������������������������ 105 4,519 100 12,285
Defense--Military:Host Nation Support Fund for Relocation ���������������������������������������������������������������������������������������������������������������������� 61 –422 –199 1,167
Energy:Nuclear Waste Disposal Fund 1 ������������������������������������������������������������������������������������������������������������������������������������� 1,740 508 514 43,361Uranium Enrichment Decontamination Fund ����������������������������������������������������������������������������������������������������������������� –837 –836 6 21
Health and Human Services:Federal Hospital Insurance Trust Fund �������������������������������������������������������������������������������������������������������������������������� –64,890 –13,736 1,289 121,288Federal Supplementary Medical Insurance Trust Fund ������������������������������������������������������������������������������������������������� –17,239 99,528 5,042 192,047Vaccine Injury Compensation Fund ������������������������������������������������������������������������������������������������������������������������������� 118 75 84 4,126Child Enrollment Contingency Fund ������������������������������������������������������������������������������������������������������������������������������ ��������� 15,979 6 15,985
Homeland Security: Aquatic Resources Trust Fund ��������������������������������������������������������������������������������������������������������������������������������������� 86 67 54 2,204Oil Spill Liability Trust Fund �������������������������������������������������������������������������������������������������������������������������������������������� 460 724 725 8,764National Flood Insurance Reserve Fund ����������������������������������������������������������������������������������������������������������������������� 120 860 600 3,105
Housing and Urban Development:Federal Housing Administration Mutual Mortgage Insurance Capital Reserve ������������������������������������������������������������� 17,336 12,891 9,681 90,509Guarantees of Mortgage-Backed Securities Capital Reserve ��������������������������������������������������������������������������������������� –7,258 3,859 2,790 15,049
Interior:Bureau of Land Management Permanent Operating Funds ������������������������������������������������������������������������������������������ 82 82 82 1,207Abandoned Mine Reclamation Fund ����������������������������������������������������������������������������������������������������������������������������� –46 –41 –27 2,565Federal Aid in Wildlife Restoration Fund ������������������������������������������������������������������������������������������������������������������������ 40 80 62 2,202Environmental Improvement and Restoration Fund ������������������������������������������������������������������������������������������������������ 24 15 14 1,571Natural Resource Damage Assessment Fund ������������������������������������������������������������������������������������������������������������� 132 104 100 2,100National Parks and Public Land Legacy Restoration Fund ������������������������������������������������������������������������������������������ ��������� 1,615 938 2,553
Justice:Assets Forfeiture Fund �������������������������������������������������������������������������������������������������������������������������������������������������� 1,118 1 –36 3,189U�S� Victims of State Sponsored Terrorism Fund ����������������������������������������������������������������������������������������������������������� –872 * ��������� 168
Labor:Unemployment Trust Fund ��������������������������������������������������������������������������������������������������������������������������������������������� –33,847 –7,089 9,157 52,583Pension Benefit Guaranty Corporation �������������������������������������������������������������������������������������������������������������������������� 8,840 3,474 4,265 53,292
State: Foreign Service Retirement and Disability Trust Fund �������������������������������������������������������������������������������������������������� 663 599 370 20,950
Transportation:Airport and Airway Trust Fund ��������������������������������������������������������������������������������������������������������������������������������������� –7,118 5,735 –652 12,983Highway Trust Fund ������������������������������������������������������������������������������������������������������������������������������������������������������� –16,112 –1,113 –10,968 ���������Aviation Insurance Revolving Fund ������������������������������������������������������������������������������������������������������������������������������� 10 35 11 2,348
Treasury:Exchange Stabilization Fund ����������������������������������������������������������������������������������������������������������������������������������������� –11,453 12,256 367 23,793Treasury Forfeiture Fund ����������������������������������������������������������������������������������������������������������������������������������������������� 74 79 84 1,381Gulf Coast Restoration Trust Fund �������������������������������������������������������������������������������������������������������������������������������� 136 101 113 1,895Comptroller of the Currency Assessment Fund ������������������������������������������������������������������������������������������������������������� 13 5 5 1,993
Veterans Affairs:Servicemembers’ Group Life Insurance Fund ��������������������������������������������������������������������������������������������������������������� 961 1,262 630 3,154National Service Life Insurance Trust Fund ������������������������������������������������������������������������������������������������������������������� –510 –498 –405 1,043Veterans Special Life Insurance Fund ��������������������������������������������������������������������������������������������������������������������������� –135 –156 –146 920
Corps of Engineers:Harbor Maintenance Trust Fund ������������������������������������������������������������������������������������������������������������������������������������ –222 780 –928 8,912

34ANALYTICAL PERSPECTIVES
Table 4–5. DEBT HELD BY GOVERNMENT ACCOUNTS 1 —Continued(In millions of dollars)
Description
Investment or Disinvestment (–)Holdings,
End of 2022 Estimate
2020 Actual
2021 Estimate
2022 Estimate
Other Defense-Civil:Military Retirement Fund 1 ��������������������������������������������������������������������������������������������������������������������������������������������� 79,613 72,628 100,630 1,080,285Medicare-Eligible Retiree Health Care Fund 1 ��������������������������������������������������������������������������������������������������������������� 11,947 5,268 15,825 287,217Education Benefits Fund ����������������������������������������������������������������������������������������������������������������������������������������������� –29 –24 –23 1,003
Environmental Protection Agency:Hazardous Substance Superfund ���������������������������������������������������������������������������������������������������������������������������������� –318 70 70 5,073Leaking Underground Storage Tank Trust Fund ������������������������������������������������������������������������������������������������������������ 122 200 40 1,135
International Assistance Programs:Overseas Private Investment Corporation ��������������������������������������������������������������������������������������������������������������������� –5,864 ��������� ��������� ���������Development Finance Corporation Corporate Capital Account ������������������������������������������������������������������������������������� 6,165 94 –450 5,809
Office of Personnel Management:Civil Service Retirement and Disability Trust Fund �������������������������������������������������������������������������������������������������������� 22,381 20,369 19,202 1,001,654Postal Service Retiree Health Benefits Fund ���������������������������������������������������������������������������������������������������������������� –2,743 –2,808 –3,308 35,752Employees Life Insurance Fund ������������������������������������������������������������������������������������������������������������������������������������ 930 623 624 50,376Employees and Retired Employees Health Benefits Fund �������������������������������������������������������������������������������������������� 529 3,634 1,527 33,492
Social Security Administration:Federal Old-Age and Survivors Insurance Trust Fund 2 ������������������������������������������������������������������������������������������������� 6,817 –64,800 –42,313 2,704,100Federal Disability Insurance Trust Fund 2 ����������������������������������������������������������������������������������������������������������������������� 690 –7,412 2,741 92,538
District of Columbia:Federal Pension Fund ��������������������������������������������������������������������������������������������������������������������������������������������������� 18 71 23 3,909
Farm Credit System Insurance Corporation:Farm Credit System Insurance Fund ����������������������������������������������������������������������������������������������������������������������������� 221 307 504 5,964
Federal Deposit Insurance Corporation:Deposit Insurance Fund ������������������������������������������������������������������������������������������������������������������������������������������������ 4,934 5,269 6,883 121,101
National Credit Union Administration:Share Insurance Fund ��������������������������������������������������������������������������������������������������������������������������������������������������� 1,334 1,463 2,395 20,468Central Liquidity Facility ������������������������������������������������������������������������������������������������������������������������������������������������� 702 30 32 1,095
Postal Service:Postal Service Fund 2 ���������������������������������������������������������������������������������������������������������������������������������������������������� 5,650 –4,154 –7,129 3,708
Railroad Retirement Board:Railroad Retirement Board trust funds �������������������������������������������������������������������������������������������������������������������������� –917 599 234 2,536
Securities Investor Protection Corporation 3 ������������������������������������������������������������������������������������������������������������������������ 289 279 265 4,224United States Enrichment Corporation Fund ����������������������������������������������������������������������������������������������������������������������� 14 –248 –496 973Other Federal funds ������������������������������������������������������������������������������������������������������������������������������������������������������������� –70 46 295 5,214Other trust funds ������������������������������������������������������������������������������������������������������������������������������������������������������������������ –345 172 154 3,322Unrealized discount 1 ����������������������������������������������������������������������������������������������������������������������������������������������������������� 13,386 ��������� ��������� –1,392
Total, investment in Treasury debt 1 ........................................................................................................................... 17,032 173,017 121,454 6,180,270
Investment in agency debt:
Railroad Retirement Board:National Railroad Retirement Investment Trust ������������������������������������������������������������������������������������������������������������� 1 ��������� ��������� 1
Total, investment in agency debt 1 ......................................................................................................................... 1 ......... ......... 1Total, investment in Federal debt 1 .................................................................................................................... 17,033 173,017 121,454 6,180,271
Memorandum:Investment by Federal funds (on-budget) ���������������������������������������������������������������������������������������������������������������������������� 26,957 61,993 42,056 759,279Investment by Federal funds (off-budget) ��������������������������������������������������������������������������������������������������������������������������� 5,650 –4,154 –7,129 3,708Investment by trust funds (on-budget) ��������������������������������������������������������������������������������������������������������������������������������� –36,467 187,391 126,099 2,622,036Investment by trust funds (off-budget) ��������������������������������������������������������������������������������������������������������������������������������� 7,507 –72,213 –39,572 2,796,638Unrealized discount 1 ����������������������������������������������������������������������������������������������������������������������������������������������������������� 13,386 ��������� ��������� –1,392
* $500 thousand or less�¹Debt held by Government accounts is measured at face value except for Treasury zero-coupon bonds, which are recorded at market or redemption price; and the unrealized discount
on Government account series, which is not distributed by account� If recorded at face value, at the end of 2020 the debt figure would be $12�3 billion higher for the Nuclear Waste Disposal Fund, $9�2 billion higher for the Military Retirement Fund, and $2�8 billion higher for the Medicare-Eligible Retiree Health Care Fund than recorded in this table� Changes are not estimated in the unrealized discount�
2 Off-budget Federal entity�3 Amounts on calendar-year basis�
4. FEDERAL BORROWING AND DEBT 35
Most recently, the FFB issued: $9 billion to the CSRDF on October 1, 2013, with maturity dates from June 30, 2015, through June 30, 2024; and $3 billion of securities to the CSRDF on October 15, 2015, with maturity dates from June 30, 2026, through June 30, 2029. The outstanding balance of FFB debt held by CSRDF was $7 billion at the end of 2020 and is projected to be $6 billion at the end of 2021.
The other Treasury debt not subject to the general lim-it consists almost entirely of silver certificates and other currencies no longer being issued. It was $478 million at the end of 2020 and is projected to gradually decline over time.
The sole agency debt currently subject to the general limit, $209 thousand at the end of 2020, is certain deben-tures issued by the Federal Housing Administration.19
Some of the other agency debt, however, is subject to its own statutory limit. For example, the Tennessee Valley Authority is limited to $30 billion of bonds and notes outstanding.
The comparison between Treasury debt and debt sub-ject to limit also includes an adjustment for measurement differences in the treatment of discounts and premiums. As explained earlier in this chapter, debt securities may be sold at a discount or premium, and the measurement of debt may take this into account rather than recording the face value of the securities. However, the measurement differs between gross Federal debt (and its components) and the statutory definition of debt subject to limit. An adjustment is needed to derive debt subject to limit (as defined by law) from Treasury debt. The amount of the adjustment was $47 billion at the end of 2020 compared with the total unamortized discount (less premium) of $64 billion on all Treasury securities.
Changes in the debt limit.—The statutory debt limit has been changed many times. Since 1960, the Congress has passed 85 separate acts to raise the limit, revise the definition, extend the duration of a temporary increase, or temporarily suspend the limit.20
The seven most recent laws addressing the debt limit have each provided for a temporary suspension followed by an increase in an amount equivalent to the debt that was issued during that suspension period in order to fund commitments requiring payment through the specified end date. The Bipartisan Budget Act of 2018 suspended the $20,456 billion debt ceiling from February 9, 2018, through March 1, 2019, and then raised the debt limit on March 2, 2019, by $1,532 billion to $21,988 billion. The Bipartisan Budget Act of 2019 suspended the $21,988 bil-lion debt ceiling from August 2, 2019, through July 31, 2021.
At many times in the past several decades, including 2018 and 2019, the Government has reached the statutory debt limit before an increase has been enacted. When this has occurred, it has been necessary for the Treasury to
19 At the end of 2020, there were also $18 million of FHA debentures not subject to limit.
20 The Acts and the statutory limits since 1940 are listed in Table 7.3 of the Budget’s Historical Tables, available at https://www.whitehouse.gov/omb/historical-tables/.
take “extraordinary measures” to meet the Government’s obligation to pay its bills and invest its trust funds while remaining below the statutory limit.
One such extraordinary measure is the partial or full suspension of the daily reinvestment of the Thrift Savings Plan (TSP) Government Securities Investment Fund (G-Fund).21 The Treasury Secretary has statutory au-thority to suspend investment of the G-Fund in Treasury securities as needed to prevent the debt from exceeding the debt limit. Treasury determines each day the amount of investments that would allow the fund to be invest-ed as fully as possible without exceeding the debt limit. The TSP G-Fund had an outstanding balance of $292 bil-lion at the end of April 2021. The Treasury Secretary is also authorized to suspend investments in the CSRDF and to declare a debt issuance suspension period, which allows him or her to redeem a limited amount of securi-ties held by the CSRDF. The Postal Accountability and Enhancement Act of 2006 provides that investments in the Postal Service Retiree Health Benefits Fund shall be made in the same manner as investments in the CSRDF.22 Therefore, Treasury is able to take similar administrative actions with the PSRHBF. The law requires that when any such actions are taken with the G-Fund, the CSRDF, or the PSRHBF, the Treasury Secretary is required to make the fund whole after the debt limit has been raised by restoring the forgone interest and investing the fund fully. Another measure for staying below the debt limit is disinvestment of the Exchange Stabilization Fund. The outstanding balance in the Exchange Stabilization Fund was $13 billion at the end of April.
As the debt has neared the limit, including in 2019, Treasury has also suspended the issuance of SLGS to re-duce unanticipated fluctuations in the level of the debt. At times, Treasury has also adjusted the schedule for auc-tions of marketable securities.
In addition to these steps, Treasury has previously exchanged Treasury securities held by the CSRDF with borrowing by the FFB, which, as explained above, is not subject to the debt limit. This measure was most recently taken in October 2015.
The debt limit has always been increased prior to the exhaustion of Treasury’s limited available administra-tive actions to continue to finance Government operations when the statutory ceiling has been reached. Failure to enact a debt limit increase before these actions were ex-hausted would have significant and long-term negative consequences. The Federal Government would be forced to delay or discontinue payments on its broad range of ob-ligations, including Social Security and other payments to individuals, Medicaid and other grant payments to States, individual and corporate tax refunds, Federal employee salaries, payments to vendors and contractors, principal and interest payments on Treasury securities, and oth-er obligations. If Treasury were unable to make timely interest payments or redeem securities, investors would
21 The TSP is a defined contribution pension plan for Federal em-ployees. The G-Fund is one of several components of the TSP.
22 Both the CSRDF and the PSRHBF are administered by the Office of Personnel Management.
36ANALYTICAL PERSPECTIVES
cease to view U.S. Treasury securities as free of credit risk and Treasury’s interest costs would increase. Because in-terest rates throughout the economy are benchmarked to the Treasury rates, interest rates for State and local governments, businesses, and individuals would also rise. Foreign investors would likely shift out of dollar-denom-inated assets, driving down the value of the dollar and further increasing interest rates on non-Federal, as well as Treasury, debt.
The debt subject to limit is estimated to increase to $30,245 billion by the end of 2021 and to $32,465 billion by the end of 2022. The Budget anticipates timely congres-sional action to address the statutory limit as necessary before exhaustion of Treasury’s extraordinary measures.
Federal funds financing and the change in debt subject to limit.—The change in debt held by the public, as shown in Table 4–2, and the change in debt held by the public net of financial assets are determined primarily by the total Government deficit or surplus. The debt subject to limit, however, includes not only debt held by the public but also debt held by Government accounts. The change in debt subject to limit is therefore determined both by the factors that determine the total Government deficit or sur-plus and by the factors that determine the change in debt held by Government accounts. The effect of debt held by Government accounts on the total debt subject to limit can be seen in the second part of Table 4–2. The change in debt held by Government accounts is equal to 5 percent of the estimated total 2021 increase in debt subject to limit.
The Budget is composed of two groups of funds, Federal funds and trust funds. The Federal funds, in the main, are derived from tax receipts and borrowing and are used for the general purposes of the Government. The trust funds, on the other hand, are financed by taxes or other receipts dedicated by law for specified purposes, such as for paying Social Security benefits or making grants to State governments for highway construction.23
A Federal funds deficit must generally be financed by bor-rowing, which can be done either by selling securities to the public or by issuing securities to Government accounts that are not within the Federal funds group. Federal funds bor-rowing consists almost entirely of Treasury securities that are subject to the statutory debt limit. Very little debt sub-ject to statutory limit has been issued for reasons except to finance the Federal funds deficit. The change in debt sub-ject to limit is therefore determined primarily by the Federal funds deficit, which is equal to the difference between the total Government deficit or surplus and the trust fund sur-plus. Trust fund surpluses are almost entirely invested in securities subject to the debt limit, and trust funds hold most of the debt held by Government accounts. The trust fund surplus reduces the total budget deficit or increases the total budget surplus, decreasing the need to borrow from the public or increasing the ability to repay borrowing from the public. When the trust fund surplus is invested in Federal securities, the debt held by Government accounts increases, offsetting the decrease in debt held by the public by an equal amount. Thus, there is no net effect on gross Federal debt.
23 For further discussion of the trust funds and Federal funds groups, see Chapter 18, “Trust Funds and Federal Funds.”
Table 4–6 derives the change in debt subject to limit. In 2020 the Federal funds deficit was $3,076 billion, and other factors increased financing requirements by $1,087 billion. The change in the Treasury operating cash bal-ance increased financing requirements by $1,399 billion, partly offset by the net financing disbursements of credit financing accounts and other Federal fund factors, which together reduced financing requirements by $312 billion. In addition, special funds and revolving funds, which are part of the Federal funds group, invested a net of $33 bil-lion in Treasury securities. Adjustments are also made for the difference between the trust fund surplus or defi-cit and the trust funds’ investment or disinvestment in Federal securities (including the changes in NRRIT’s in-vestments in non-Federal securities) and for the change in unrealized discount on Federal debt held by Government accounts. As a net result of all these factors, $4,233 bil-lion in financing was required, increasing gross Federal debt by that amount. Since Federal debt not subject to limit fell by $3 billion and the adjustment for discount and premium changed by $2 billion, the debt subject to limit increased by $4,234 billion, while debt held by the public increased by $4,216 billion.
Debt subject to limit is estimated to increase by $3,325 billion in 2021 and by $2,220 billion in 2022. The pro-jected increases in the debt subject to limit are caused by the continued Federal funds deficit, supplemented by the other factors shown in Table 4–6. While debt held by the public increases by $18,043 billion from the end of 2020 through 2031, debt subject to limit increases by $17,947 billion, due to projected outyear net disinvestment by Government accounts.
Foreign Holdings of Federal Debt
Foreign holdings of Federal debt are presented in Table 4–7. During most of American history, the Federal debt was held almost entirely by individuals and institutions within the United States. In the late 1960s, foreign hold-ings were just over $10 billion, less than 5 percent of the total Federal debt held by the public. Foreign holdings began to grow significantly in the early 1970s, and then remained about 15–20 percent of total Federal debt until the mid-1990s. During 1995–97, growth in foreign hold-ings accelerated, reaching 33 percent by the end of 1997. Since 2004, foreign holdings of Federal debt have general-ly represented around 40 percent or more of outstanding debt. Foreign holdings increased to 48 percent by the end of 2008 and then remained relatively stable through 2015. After 2015, foreign holdings began to decline as a percent of total Federal debt held by the public, falling from 47 percent at the end of 2015 to 40 percent at the end of 2018. In 2019, foreign holdings increased slightly, to 41 percent.
By the end of 2020, foreign holdings of Treasury debt had grown to $7,069 billion, but fell to 34 percent of the total debt held by the public.24 The dollar increase in foreign holdings was about 3 percent of total Federal bor-
24 The debt calculated by the Bureau of Economic Analysis is dif-ferent, though similar in size, because of a different method of valuing securities.

4. FEDERAL BORROWING AND DEBT 37
rowing from the public in 2020 and 12 percent over the last five years. Increases in foreign holdings have been almost entirely due to decisions by foreign central banks, corporations, and individuals, rather than the direct marketing of these securities to foreign investors. All of the foreign holdings of Federal debt are denominated in dollars.
In 2020, foreign central banks and other foreign offi-cial institutions owned 59 percent of the foreign holdings of Federal debt; private investors owned the rest. At the end of 2020, the nations holding the largest shares of U.S. Federal debt were Japan, which held 18 percent of all for-eign holdings, and China, which held 15 percent.
Foreign holdings of Federal debt are around 20-25 per-cent of the foreign-owned assets in the United States, depending on the method of measuring total assets. The foreign purchases of Federal debt securities do not mea-sure the full impact of the capital inflow from abroad on the market for Federal debt securities. The capital inflow supplies additional funds to the credit market generally, and thus affects the market for Federal debt. For exam-ple, the capital inflow includes deposits in U.S. financial intermediaries that themselves buy Federal debt.
Federal, Federally Guaranteed, and Other Federally Assisted Borrowing
The Government’s effects on the credit markets arise not only from its own borrowing but also from the di-rect loans that it makes to the public and the provision of assistance to certain borrowing by the public. The Government guarantees various types of borrowing by individuals, businesses, and other non-Federal entities, thereby providing assistance to private credit markets. The Government is also assisting borrowing by States through the Build America Bonds program, which subsi-dizes the interest that States pay on such borrowing. In addition, the Government has established private corpo-rations—Government-sponsored enterprises—to provide financial intermediation for specified public purposes; it exempts the interest on most State and local government debt from income tax; it permits mortgage interest to be deducted in calculating taxable income; and it insures the deposits of banks and thrift institutions, which them-selves make loans.
Federal credit programs and other forms of assistance are discussed in Chapter 15, “Credit and Insurance,” in this volume. Detailed data are presented in tables accom-panying that chapter.
Table 4–6. FEDERAL FUNDS FINANCING AND CHANGE IN DEBT SUBJECT TO STATUTORY LIMIT(In billions of dollars)
Description Actual 2020
Estimate
2021 2022 2023 2024 2025 2026 2027 2028 2029 2030 2031
Change in Gross Federal Debt:Federal funds deficit ������������������������������������������������������������ 3,076�4 3,783�4 1,983�2 1,504�2 1,527�9 1,541�4 1,445�8 1,173�8 1,176�8 1,146�1 1,199�2 1,245�7Other transactions affecting borrowing from the public—
Federal funds 1 ���������������������������������������������������������������� 1,087�2 –518�6 263�2 48�1 21�9 8�4 6�9 6�4 2�6 0�1 8�5 11�5Increase (+) or decrease (–) in Federal debt held by
Federal funds ������������������������������������������������������������������ 32�6 57�8 34�9 31�8 34�1 35�2 34�4 36�7 38�3 40�6 44�4 48�8Adjustments for trust fund surplus/deficit not invested/
disinvested in Federal securities 2 ����������������������������������� 23�4 0�5 –61�8 –2�9 –3�0 –3�0 –3�0 –1�8 –1�7 –1�7 –1�2 –1�1Change in unrealized discount on Federal debt held by
Government accounts ���������������������������������������������������� 13�4 ��������� ��������� ��������� ��������� ��������� ��������� ��������� ��������� ��������� ��������� ���������Total financing requirements ������������������������������������������ 4,233�0 3,323�1 2,219�5 1,581�3 1,580�9 1,582�1 1,484�2 1,215�1 1,216�1 1,185�1 1,250�9 1,305�0
Change in Debt Subject to Limit:Change in gross Federal debt ��������������������������������������������� 4,233�0 3,323�1 2,219�5 1,581�3 1,580�9 1,582�1 1,484�2 1,215�1 1,216�1 1,185�1 1,250�9 1,305�0Less: increase (+) or decrease (–) in Federal debt not
subject to limit ����������������������������������������������������������������� –3�0 –1�4 –0�9 –1�1 –1�1 0�3 –0�5 –1�0 –0�3 –* 1�1 1�0Less: change in adjustment for discount and premium 3 ����� 2�2 ��������� ��������� ��������� ��������� ��������� ��������� ��������� ��������� ��������� ��������� ���������
Total, change in debt subject to limit ������������������������������ 4,233�8 3,324�5 2,220�4 1,582�4 1,582�0 1,581�8 1,484�7 1,216�1 1,216�3 1,185�2 1,249�8 1,304�0
Memorandum:Debt subject to statutory limit 4… ����������������������������������������� 26,920�4 30,244�9 32,465�3 34,047�7 35,629�7 37,211�4 38,696�1 39,912�2 41,128�6 42,313�7 43,563�6 44,867�6
* $50 million or less�1 Includes Federal fund transactions that correspond to those presented in Table 4–2, but that are for Federal funds alone with respect to the public and trust funds�2 Includes trust fund holdings in other cash assets and changes in the investments of the National Railroad Retirement Investment Trust in non-Federal securities�3 Consists of unamortized discount (less premium) on public issues of Treasury notes and bonds (other than zero-coupon bonds)�4 Legislation enacted August 2, 2019 (P�L� 116–37), temporarily suspends the debt limit through July 31, 2021�

38ANALYTICAL PERSPECTIVES
Table 4–7. FOREIGN HOLDINGS OF FEDERAL DEBT(Dollar amounts in billions)
Fiscal YearDebt held by the public
Change in debt held by the public 2
Total Foreign 1 Percentage
foreign Total Foreign
1965 ����������������������������������������������������� 260�8 12�2 4�7 3�9 0�3
1970 ����������������������������������������������������� 283�2 14�0 4�9 5�1 3�71975 ����������������������������������������������������� 394�7 66�0 16�7 51�0 9�1
1980 ����������������������������������������������������� 711�9 126�4 17�8 71�6 1�31985 ����������������������������������������������������� 1,507�3 222�9 14�8 200�3 47�3
1990 ����������������������������������������������������� 2,411�6 463�8 19�2 220�8 72�01995 ����������������������������������������������������� 3,604�4 820�4 22�8 171�3 138�4
2000 ����������������������������������������������������� 3,409�8 1,038�8 30�5 –222�6 –242�62005 ����������������������������������������������������� 4,592�2 1,929�6 42�0 296�7 135�1
2010 ����������������������������������������������������� 9,018�9 4,324�2 47�9 1,474�2 753�62011 ����������������������������������������������������� 10,128�2 4,912�1 48�5 1,109�3 587�92012 ����������������������������������������������������� 11,281�1 5,476�1 48�5 1,152�9 564�02013 ����������������������������������������������������� 11,982�7 5,652�8 47�2 701�6 176�72014 ����������������������������������������������������� 12,779�9 6,069�2 47�5 797�2 416�4
2015 ����������������������������������������������������� 13,116�7 6,105�9 46�6 336�8 36�72016 ����������������������������������������������������� 14,167�6 6,155�9 43�5 1,050�9 50�02017 ����������������������������������������������������� 14,665�4 6,301�9 43�0 497�8 146�02018 ����������������������������������������������������� 15,749�6 6,225�9 39�5 1,084�1 –76�02019 ����������������������������������������������������� 16,800�7 6,923�5 41�2 1,051�1 697�6
2020 ����������������������������������������������������� 21,016�7 7,069�2 33�6 4,216�0 145�71 Estimated by Treasury Department� These estimates exclude agency debt, the holdings of which are believed to be
small� The data on foreign holdings are recorded by methods that are not fully comparable with the data on debt held by the public� Projections of foreign holdings are not available�
2 Change in debt held by the public is defined as equal to the change in debt held by the public from the beginning of the year to the end of the year�

39
MANAGEMENT

41
5. STRENGTHENING THE FEDERAL WORKFORCE
“Our Constitution opens with the words, ‘We the People.’ It’s time we remembered that We the People are the govern-ment. You and I. Not some force in a distant capital. Not some powerful force we have no control over. It’s us. It’s ‘We the people.’” – President Biden
Even before the inauguration, President-elect Biden recorded a message to the Federal career workforce to establish how he would manage the civil service: “I’m thinking of you and I have the utmost trust in your capa-bilities. I’ll be President for all Americans, just as you are civil servants for all Americans. And together, together, we’ll lead with core values that have guided me through-out my career in public service, as I imagine they have guided you in your careers.”
After decades of under-investment in a modern-day workforce, a failure to partner with labor unions, and ongoing, unwarranted attacks on its independence, the civil service is in need of repair and rebuilding and the Administration has already taken swift action to de-liver on that goal. The reason for doing so is critical. As President Biden stated in his April 28, 2021, address to Congress: “We have to prove that democracy still works. That our government still works – and can deliver for the people.”
This chapter provides an overview of actions the Administration has already taken and how the Budget will support additional efforts to strengthen, empower, and reenergize the Federal workforce. As in previous years, this chapter provides an annual update on the sta-tus of the U.S. civil service, including tables and charts that describe its size, location, demographics, costs, and projections. The chapter also reviews the actions that the Administration has taken during the first 100 days and its plans to help ensure the Federal workforce can meet the opportunities and challenges before us – both now and in the future.
First Actions
The Administration is committed to empowering, re-building, and protecting the Federal workforce, which is why the Budget provides for a 2.7 percent pay increase for the Federal civilian workforce. Proposed funding also will help executive departments and agencies (Agencies) im-plement the policy established in Executive Order (E.O.) 14003, issued on January 22, 2021, aimed at protecting the Federal workforce. As the Order stated, “career civil servants are the backbone of the Federal workforce, pro-viding the expertise and experience necessary for the critical functioning of the Federal Government. It is the policy of the United States to protect, empower, and re-build the career Federal workforce.” Furthermore, the Administration is taking initial steps to revitalize the
national security workforce—whose expertise and work keep this country safe.
Before the hard work could begin on new efforts, the President immediately halted the previous adminis-tration’s actions aimed at politicizing the civil service, destroying Federal employee unions, and decreasing di-versity. In E.O. 14003, the Biden-Harris Administration eliminated Schedule F, which threatened the foundations of the civil service; restored and expanded collective bar-gaining power and worker protections for Federal workers; and directed the Office of Personnel Management (OPM) to make recommendations to the President to promote a $15 per hour minimum wage for Federal employees. E.O. 14025, “Worker Organizing and Empowerment,” (April 26, 2021) tasked the Vice-President and Agency leadership with proposing ways to facilitate union organizing and worker power in the public and private sectors. Signed on April 27, 2021, E.O. 14026 requires contractors to pay a $15 minimum wage for any employees on Federal con-tracts, an increase from the current $10.95 per hour. This E.O. also ends the practice that allowed certain govern-ment contractors to pay a subminimum wage to people with disabilities under certain circumstances. The E.O. will put in motion actions to end that practice so that per-sons with disabilities start receiving at least the new $15 per hour minimum wage.
The Budget supports the steps that the President took on his first day in office to protect the health and safety of Federal employees and contractors from COVID-19 by directing Agencies to finalize and implement workplace health and safety plans aligned with the Centers for Disease Control and Prevention’s (CDC’s) science-based guidelines. Too many federal workers – like many other critical workers across the country – fell ill and died af-ter contracting COVID-19 providing critical services for their fellow Americans, like ensuring our food is safe, car-ing for our veterans, responding to natural disasters, and keeping Government operations and services open with minimal disruption.
Federal Workforce Trends and Updates
The Federal workforce’s current staff level is 2.2 mil-lion (See Tables 5-1 and 5-2). Using data from the Bureau of Labor Statistics on full-time, full-year workers, Table 5-3 breaks out all Federal and private sector jobs into 22 occupational groups to demonstrate the differences in composition between the Federal and private work-forces. Table 5-4 summarizes total pay and benefit costs. Charts 5-1 and 5-2 present trends in educational levels for the Federal and private sector workforces over the past two decades. Chart 5-3 shows the trends in average age in both the Federal and private sectors. Chart 5-4 and

42ANALYTICAL PERSPECTIVES
Chart 5-5 show the location of Federal employees in 1978 and again in 2021. Chart 5-6 reflects the changing na-ture of work, comparing the number of employees in each General Schedule grade in 1950 versus 2021, showing an almost complete shift from lower-grade to higher-grade types of work.
Civil Service Diversity, Equity, Inclusion, and Accessibility
Since the modern merit-based civil service started in 1883, the make-up of the Federal workforce has con-tinued to evolve. The Federal workforce often has taken the lead in expanding job opportunities for highly quali-fied Americans who were denied positions elsewhere because of their race, gender, disability, sexual orienta-tion, or other characteristics. This Administration seeks to permanently end the lingering biases against all such groups while simultaneously bringing in their untapped abilities to help agencies meet their missions. The Federal Government is the Nation’s largest employer, including both the civilian and uniformed services. It also funds millions of positions through contracts, grants, and re-search awards. How the Federal Government manages its workforce often amplifies similar changes in State, local, and private sector personnel management. In ad-dition to the equal opportunity laws that all employers must follow, the U.S. Government generally maintains a higher standard than the private sector by adhering to the Federal Merit System Principles in Government employment. Unfortunately, our civil service hiring pro-cesses have not maximally supported these ideals, and the current makeup of the Federal workforce does not re-flect the overall civilian population in many career fields and management ranks.
During the first 100 days of the new Administration, the President issued an initial series of executive ac-tions to direct agencies to make quick progress to ensure that the Federal workforce represents the full talent of the Nation. E.O. 13985, “Advancing Racial Equity and Support for Underserved Communities Through the Federal Government,” (January 20, 2021) established that affirmatively advancing equity, civil rights, racial justice, and equal opportunity is the responsibility of the entire Government. Additionally, the President’s National Security Memorandum on “Revitalizing America’s Foreign Policy and National Security Workforce, Institutions, and Partnerships” (February 4, 2021) ordered a series of ac-tions by agencies to seek to ensure that our national security workforce reflects and draws on the richness and diversity of the country it represents. Management research continually demonstrates that diverse, equi-table, inclusive, and accessible workplaces yield higher performing organizations. This Budget invests in Federal employees and the opportunity to “build back better.”
The Federal Government made progress increasing rep-resentation of underrepresented groups from December 2019 to December 2020. According to data from OPM in December 2020, the Federal civilian workforce self-iden-tified as 61.5 percent White; 18.4 percent Black, which is an increase from 18.2 percent the previous year; 9.4
percent Hispanic of all races, which is an increase from 9.2 percent; 6.9 percent Asian/Pacific Islander, which is an increase from 6.6 percent; 1.6 percent Native American/Alaskan Native, which remained the same; and 1.9 per-cent more than one race. Men make up 55.7 percent of all permanent Federal employees and women represent 44.3 percent, which is up from 43.9 percent. Veterans make up 30.7 percent of the Federal workforce. By comparison, veterans represent about 6 percent of the private sector non-agricultural workforce. In addition, 18.3 percent of all Federal employees self-identify as having a disability, which includes the approximately 2.6 percent who have a “targeted disability,” such as blindness. Table 5-5 shows the staffing trends since 2016.
The Federal workforce continues to become older on average. Almost 30 percent (635,397) of employees are older than 55, while 8.1 percent (176,805) of employees are younger than 30. By comparison, in the private sec-tor, 23 percent of the workforce is younger than 30. Every single agency has fewer employees younger than 30 today than they had in 2010. The number of paid internships dropped from more than 60,000 in 2010 to about 4,000 in 2020, reducing the opportunity for many to serve. Chart 5-7 shows the widening age gap at the 24 large and mid-sized agencies since 2007. This gap carries into each career field. As an example, Chart 5-8 demonstrates the growing age disparity in the information technol-ogy sector that in particular shows the drop since 2010, when Federal internships and hiring programs for recent graduates became subject to new restrictions. The Budget recommends that agencies identify barriers and challeng-es to hiring interns, ensure internships are included in workforce planning, and directs them to identify options to increase internship opportunities.
Human Capital Management Operations and Modernization
In calendar year 2020, USAJOBS.gov hosted over 330,000 job announcements, facilitated 1.25 billion job searches, and enabled individuals to begin more than 18 million applications for Federal jobs. More than 5,000 job announcements related to the Government’s COVID-19 response led individuals to begin nearly a million applica-tions. And OPM’s Retirement Services processed almost 100,000 new retirement cases and about 30,000 survivor claims. The Federal Employees Health Benefits Program added six new health plan options and had an average premium increase of 3.6 percent for the 2021 benefit year. Additionally, the various responsible agencies completed about 2.5 million background investigations.
As the President’s Management Agenda takes shape, OPM, OMB, and the Chief Human Capital Officers (CHCO) Council continue to collaborate on major workforce reforms. For example, OPM is compiling and developing compre-hensive guidance for agencies on hiring flexibilities and competitive hiring best practices to facilitate a talent surge into Government. This work includes developing regulations to make it easier to bring back former employees by allowing agencies to rehire at a grade commensurate with the experi-ence achieved while working outside of Government, rather
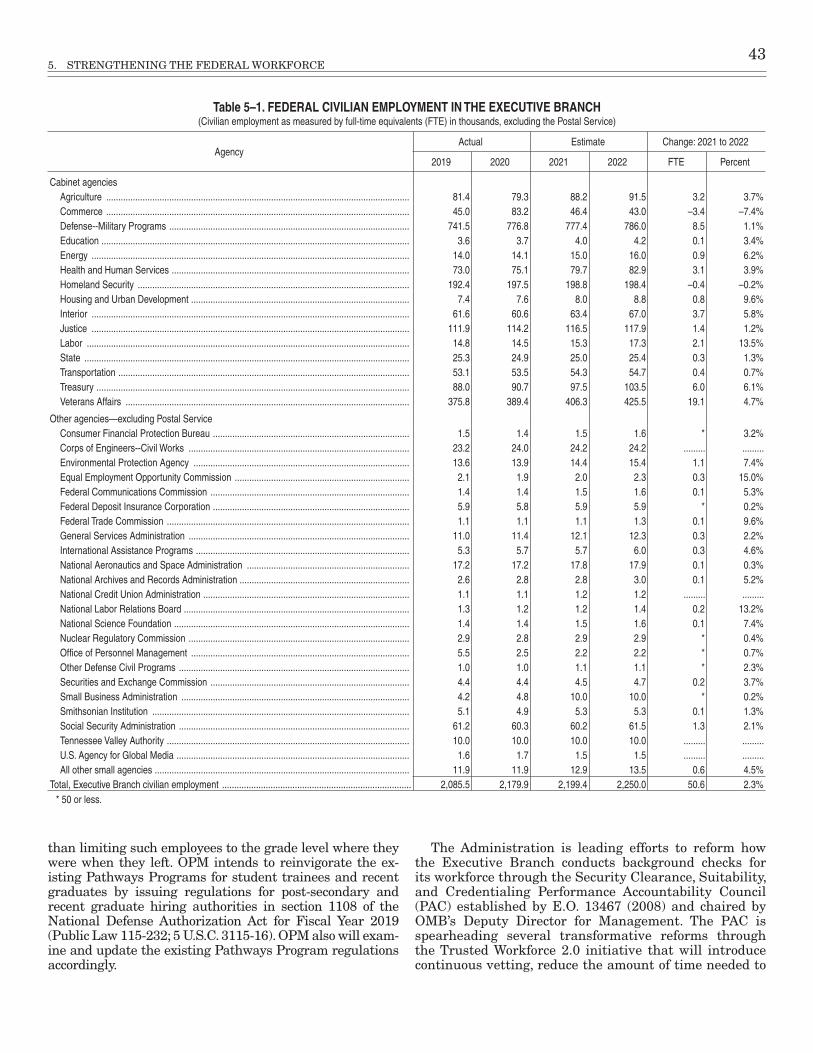
5. STRENGTHENING THE FEDERAL WORkFORCE 43
Table 5–1. FEDERAL CIVILIAN EMPLOYMENT IN THE EXECUTIVE BRANCH(Civilian employment as measured by full-time equivalents (FTE) in thousands, excluding the Postal Service)
AgencyActual Estimate Change: 2021 to 2022
2019 2020 2021 2022 FTE Percent
Cabinet agenciesAgriculture ����������������������������������������������������������������������������������������������������������������������������� 81�4 79�3 88�2 91�5 3�2 3�7%Commerce ����������������������������������������������������������������������������������������������������������������������������� 45�0 83�2 46�4 43�0 –3�4 –7�4%Defense--Military Programs ��������������������������������������������������������������������������������������������������� 741�5 776�8 777�4 786�0 8�5 1�1%Education ������������������������������������������������������������������������������������������������������������������������������� 3�6 3�7 4�0 4�2 0�1 3�4%Energy ����������������������������������������������������������������������������������������������������������������������������������� 14�0 14�1 15�0 16�0 0�9 6�2%Health and Human Services �������������������������������������������������������������������������������������������������� 73�0 75�1 79�7 82�9 3�1 3�9%Homeland Security ���������������������������������������������������������������������������������������������������������������� 192�4 197�5 198�8 198�4 –0�4 –0�2%Housing and Urban Development ������������������������������������������������������������������������������������������ 7�4 7�6 8�0 8�8 0�8 9�6%Interior ����������������������������������������������������������������������������������������������������������������������������������� 61�6 60�6 63�4 67�0 3�7 5�8%Justice ����������������������������������������������������������������������������������������������������������������������������������� 111�9 114�2 116�5 117�9 1�4 1�2%Labor ������������������������������������������������������������������������������������������������������������������������������������� 14�8 14�5 15�3 17�3 2�1 13�5%State �������������������������������������������������������������������������������������������������������������������������������������� 25�3 24�9 25�0 25�4 0�3 1�3%Transportation ������������������������������������������������������������������������������������������������������������������������ 53�1 53�5 54�3 54�7 0�4 0�7%Treasury ��������������������������������������������������������������������������������������������������������������������������������� 88�0 90�7 97�5 103�5 6�0 6�1%Veterans Affairs ��������������������������������������������������������������������������������������������������������������������� 375�8 389�4 406�3 425�5 19�1 4�7%
Other agencies—excluding Postal ServiceConsumer Financial Protection Bureau ��������������������������������������������������������������������������������� 1�5 1�4 1�5 1�6 * 3�2%Corps of Engineers--Civil Works ������������������������������������������������������������������������������������������� 23�2 24�0 24�2 24�2 ��������� ���������Environmental Protection Agency ����������������������������������������������������������������������������������������� 13�6 13�9 14�4 15�4 1�1 7�4%Equal Employment Opportunity Commission ������������������������������������������������������������������������ 2�1 1�9 2�0 2�3 0�3 15�0%Federal Communications Commission ���������������������������������������������������������������������������������� 1�4 1�4 1�5 1�6 0�1 5�3%Federal Deposit Insurance Corporation ��������������������������������������������������������������������������������� 5�9 5�8 5�9 5�9 * 0�2%Federal Trade Commission ���������������������������������������������������������������������������������������������������� 1�1 1�1 1�1 1�3 0�1 9�6%General Services Administration ������������������������������������������������������������������������������������������� 11�0 11�4 12�1 12�3 0�3 2�2%International Assistance Programs ���������������������������������������������������������������������������������������� 5�3 5�7 5�7 6�0 0�3 4�6%National Aeronautics and Space Administration ������������������������������������������������������������������� 17�2 17�2 17�8 17�9 0�1 0�3%National Archives and Records Administration ���������������������������������������������������������������������� 2�6 2�8 2�8 3�0 0�1 5�2%National Credit Union Administration ������������������������������������������������������������������������������������� 1�1 1�1 1�2 1�2 ��������� ���������National Labor Relations Board ��������������������������������������������������������������������������������������������� 1�3 1�2 1�2 1�4 0�2 13�2%National Science Foundation ������������������������������������������������������������������������������������������������� 1�4 1�4 1�5 1�6 0�1 7�4%Nuclear Regulatory Commission ������������������������������������������������������������������������������������������� 2�9 2�8 2�9 2�9 * 0�4%Office of Personnel Management ������������������������������������������������������������������������������������������ 5�5 2�5 2�2 2�2 * 0�7%Other Defense Civil Programs ����������������������������������������������������������������������������������������������� 1�0 1�0 1�1 1�1 * 2�3%Securities and Exchange Commission ���������������������������������������������������������������������������������� 4�4 4�4 4�5 4�7 0�2 3�7%Small Business Administration ���������������������������������������������������������������������������������������������� 4�2 4�8 10�0 10�0 * 0�2%Smithsonian Institution ���������������������������������������������������������������������������������������������������������� 5�1 4�9 5�3 5�3 0�1 1�3%Social Security Administration ����������������������������������������������������������������������������������������������� 61�2 60�3 60�2 61�5 1�3 2�1%Tennessee Valley Authority ���������������������������������������������������������������������������������������������������� 10�0 10�0 10�0 10�0 ��������� ���������U�S� Agency for Global Media ������������������������������������������������������������������������������������������������ 1�6 1�7 1�5 1�5 ��������� ���������All other small agencies ��������������������������������������������������������������������������������������������������������� 11�9 11�9 12�9 13�5 0�6 4�5%
Total, Executive Branch civilian employment ������������������������������������������������������������������������������ 2,085�5 2,179�9 2,199�4 2,250�0 50�6 2�3%* 50 or less�
than limiting such employees to the grade level where they were when they left. OPM intends to reinvigorate the ex-isting Pathways Programs for student trainees and recent graduates by issuing regulations for post-secondary and recent graduate hiring authorities in section 1108 of the National Defense Authorization Act for Fiscal Year 2019 (Public Law 115-232; 5 U.S.C. 3115-16). OPM also will exam-ine and update the existing Pathways Program regulations accordingly.
The Administration is leading efforts to reform how the Executive Branch conducts background checks for its workforce through the Security Clearance, Suitability, and Credentialing Performance Accountability Council (PAC) established by E.O. 13467 (2008) and chaired by OMB’s Deputy Director for Management. The PAC is spearheading several transformative reforms through the Trusted Workforce 2.0 initiative that will introduce continuous vetting, reduce the amount of time needed to

44ANALYTICAL PERSPECTIVES
Table 5–2. TOTAL FEDERAL EMPLOYMENT(As measured by Full-Time Equivalents)
Description 2020Actual
2021Estimate
2022Estimate
Change: 2021 to 2022
FTE Percent
Executive Branch Civilian:All Agencies, Except Postal Service ��������������������������������������������������������������������������������������������������������������� 2,179,917 2,199,387 2,249,971 50,584 2�2%Postal Service 1 ����������������������������������������������������������������������������������������������������������������������������������������������� 569,288 579,741 563,690 –16,051 –2�8%
Subtotal, Executive Branch Civilian ���������������������������������������������������������������������������������������������������������� 2,749,205 2,779,128 2,813,661 34,533 1�2%
Executive Branch Uniformed Military:Department of Defense 2 ������������������������������������������������������������������������������������������������������������������������������� 1,389,398 1,399,318 1,381,998 –17,320 –1�3%Department of Homeland Security (USCG) ��������������������������������������������������������������������������������������������������� 41,244 42,252 42,703 451 1�1%Commissioned Corps (DOC, EPA, HHS) ������������������������������������������������������������������������������������������������������� 6,371 6,366 6,679 313 4�7%
Subtotal, Uniformed Military ��������������������������������������������������������������������������������������������������������������������� 1,437,013 1,447,936 1,431,380 –16,556 –1�2%Subtotal, Executive Branch ����������������������������������������������������������������������������������������������������������������������� 4,186,218 4,227,064 4,245,041 17,977 0�4%
Legislative Branch 3 �������������������������������������������������������������������������������������������������������������������������������������������� 33,673 34,495 34,914 419 1�2%Judicial Branch ��������������������������������������������������������������������������������������������������������������������������������������������������� 33,242 33,665 34,198 533 1�6%
Grand Total ����������������������������������������������������������������������������������������������������������������������������������������������� 4,253,133 4,295,224 4,314,153 18,929 0�4%1 Includes Postal Rate Commission�2 Includes activated Guard and Reserve members on active duty� Does not include Full-Time Support (Active Guard & Reserve (AGRSs)) paid from Reserve Component
appropriations�3 FTE data not available for the Senate (positions filled were used for actual year and extended at same level)�
conduct background checks for new hires, and improve the mobility of the workforce, all without sacrificing the Nation’s security.
The resiliency of the Federal workforce has been on full display during the COVID-19 pandemic, as civil servants have continued to deliver on their Agencies’ missions despite unprecedented challenges. Agencies have estab-lished COVID-19 Agency safety teams and safety plans to help ensure the protection of their workforces. The CHCO community has collaborated to determine how to move formerly in-person work to the virtual environment. An overwhelming majority of respondents to the 2020 Federal Employee Viewpoint Survey reported a high level of ability to meet customers’ needs, as well as agencies’ sustained performance and quality of work. OPM, GSA, and OMB will capture best practices, convene diverse stakeholder groups inside and outside of Government, evaluate options, and develop guidance to assist agen-cies to adapt as the country continues to emerge from the COVID-19 pandemic.
As the Administration and the country move forward, it is imperative that the Federal Government have the tools and human resources personnel to evolve and compete with the overall labor market. The Budget supports building additional capacity and capability for agencies to strengthen the workforce, recruit and hire talent, and ensure agencies can recruit specific techni-cal talent where there are longstanding gaps. It requires CHCO Act Agencies to create and fund talent teams at the component level and to participate in or contribute to, as allowable, a centralized, Government-wide hiring assessment support team to improve hiring outcomes for critical positions, including more technical or hard-to-fill positions, in particular.
The Budget acknowledges the complex and long-standing challenges facing the Federal Government while reflecting a commitment to innovation, improvement, and performance. The Federal workforce is composed of dedicated public servants who work to improve the lives of the American people. The Budget demonstrates the Administration’s commitment to them.
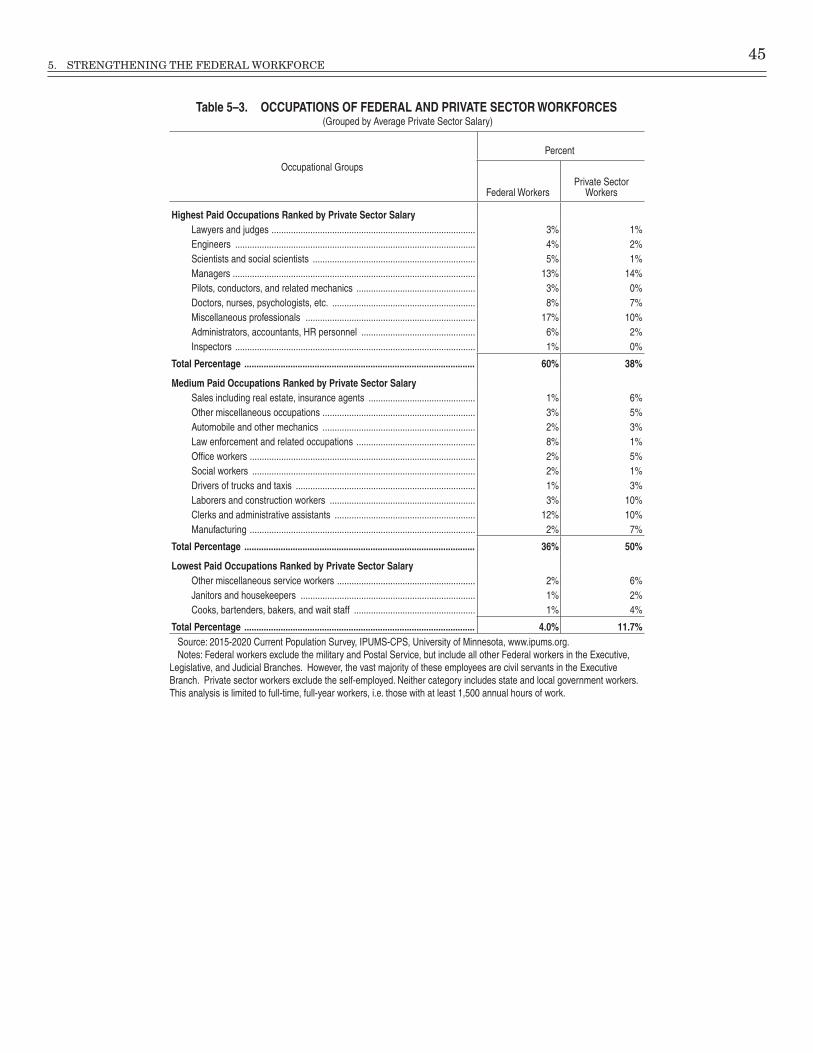
5. STRENGTHENING THE FEDERAL WORkFORCE 45
Table 5–3. OCCUPATIONS OF FEDERAL AND PRIVATE SECTOR WORKFORCES (Grouped by Average Private Sector Salary)
Occupational Groups
Percent
Federal WorkersPrivate Sector
Workers
Highest Paid Occupations Ranked by Private Sector Salary Lawyers and judges ������������������������������������������������������������������������������������ 3% 1% Engineers ��������������������������������������������������������������������������������������������������� 4% 2% Scientists and social scientists ������������������������������������������������������������������� 5% 1% Managers ���������������������������������������������������������������������������������������������������� 13% 14% Pilots, conductors, and related mechanics ������������������������������������������������� 3% 0% Doctors, nurses, psychologists, etc� ����������������������������������������������������������� 8% 7% Miscellaneous professionals ���������������������������������������������������������������������� 17% 10% Administrators, accountants, HR personnel ����������������������������������������������� 6% 2% Inspectors ��������������������������������������������������������������������������������������������������� 1% 0%
Total Percentage ............................................................................................... 60% 38%
Medium Paid Occupations Ranked by Private Sector Salary Sales including real estate, insurance agents �������������������������������������������� 1% 6% Other miscellaneous occupations ��������������������������������������������������������������� 3% 5% Automobile and other mechanics ��������������������������������������������������������������� 2% 3% Law enforcement and related occupations ������������������������������������������������� 8% 1% Office workers ��������������������������������������������������������������������������������������������� 2% 5% Social workers �������������������������������������������������������������������������������������������� 2% 1% Drivers of trucks and taxis �������������������������������������������������������������������������� 1% 3% Laborers and construction workers ������������������������������������������������������������ 3% 10% Clerks and administrative assistants ���������������������������������������������������������� 12% 10% Manufacturing ��������������������������������������������������������������������������������������������� 2% 7%
Total Percentage ............................................................................................... 36% 50%
Lowest Paid Occupations Ranked by Private Sector Salary Other miscellaneous service workers ��������������������������������������������������������� 2% 6% Janitors and housekeepers ������������������������������������������������������������������������ 1% 2% Cooks, bartenders, bakers, and wait staff �������������������������������������������������� 1% 4%
Total Percentage ............................................................................................... 4.0% 11.7%Source: 2015-2020 Current Population Survey, IPUMS-CPS, University of Minnesota, www�ipums�org�Notes: Federal workers exclude the military and Postal Service, but include all other Federal workers in the Executive,
Legislative, and Judicial Branches� However, the vast majority of these employees are civil servants in the Executive Branch� Private sector workers exclude the self-employed� Neither category includes state and local government workers� This analysis is limited to full-time, full-year workers, i�e� those with at least 1,500 annual hours of work�
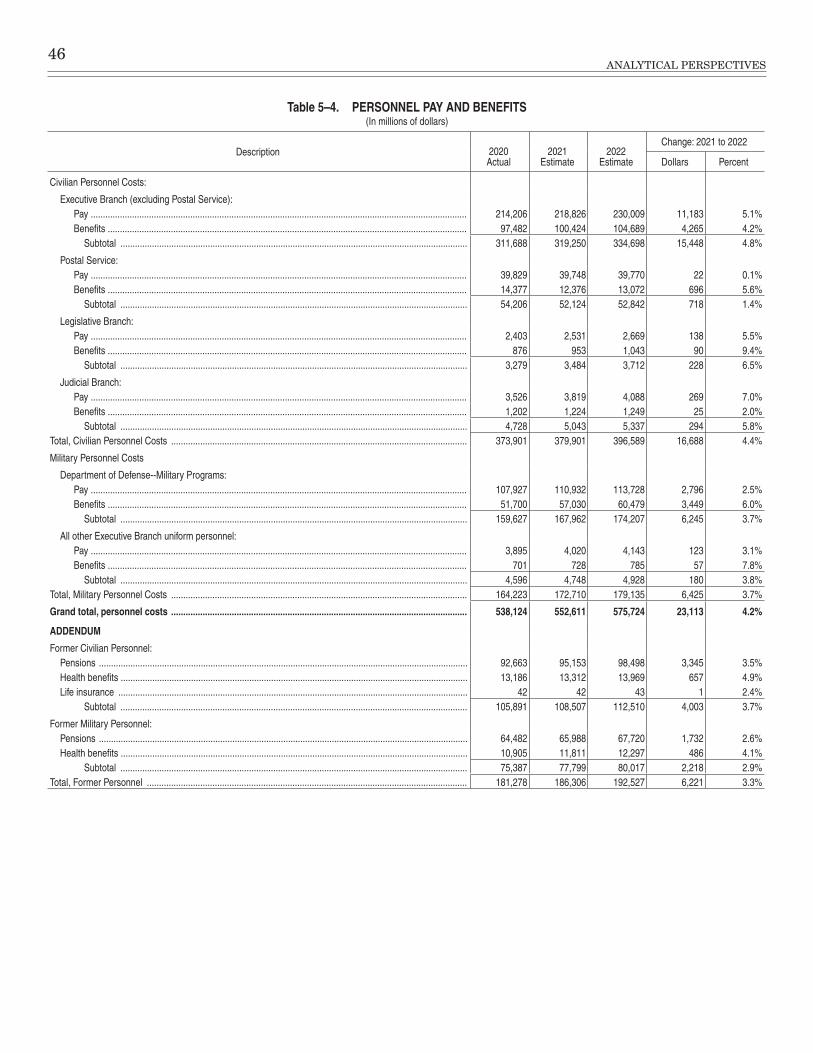
46ANALYTICAL PERSPECTIVES
Table 5–4. PERSONNEL PAY AND BENEFITS(In millions of dollars)
Description 2020Actual
2021Estimate
2022Estimate
Change: 2021 to 2022
Dollars Percent
Civilian Personnel Costs:
Executive Branch (excluding Postal Service):Pay ����������������������������������������������������������������������������������������������������������������������������������������������������������� 214,206 218,826 230,009 11,183 5�1%Benefits ���������������������������������������������������������������������������������������������������������������������������������������������������� 97,482 100,424 104,689 4,265 4�2%
Subtotal ����������������������������������������������������������������������������������������������������������������������������������������������� 311,688 319,250 334,698 15,448 4�8%
Postal Service:Pay ����������������������������������������������������������������������������������������������������������������������������������������������������������� 39,829 39,748 39,770 22 0�1%Benefits ���������������������������������������������������������������������������������������������������������������������������������������������������� 14,377 12,376 13,072 696 5�6%
Subtotal ����������������������������������������������������������������������������������������������������������������������������������������������� 54,206 52,124 52,842 718 1�4%
Legislative Branch:Pay ����������������������������������������������������������������������������������������������������������������������������������������������������������� 2,403 2,531 2,669 138 5�5%Benefits ���������������������������������������������������������������������������������������������������������������������������������������������������� 876 953 1,043 90 9�4%
Subtotal ����������������������������������������������������������������������������������������������������������������������������������������������� 3,279 3,484 3,712 228 6�5%
Judicial Branch:Pay ����������������������������������������������������������������������������������������������������������������������������������������������������������� 3,526 3,819 4,088 269 7�0%Benefits ���������������������������������������������������������������������������������������������������������������������������������������������������� 1,202 1,224 1,249 25 2�0%
Subtotal ����������������������������������������������������������������������������������������������������������������������������������������������� 4,728 5,043 5,337 294 5�8%Total, Civilian Personnel Costs �������������������������������������������������������������������������������������������������������������������������� 373,901 379,901 396,589 16,688 4�4%
Military Personnel Costs
Department of Defense--Military Programs:Pay ����������������������������������������������������������������������������������������������������������������������������������������������������������� 107,927 110,932 113,728 2,796 2�5%Benefits ���������������������������������������������������������������������������������������������������������������������������������������������������� 51,700 57,030 60,479 3,449 6�0%
Subtotal ����������������������������������������������������������������������������������������������������������������������������������������������� 159,627 167,962 174,207 6,245 3�7%
All other Executive Branch uniform personnel:Pay ����������������������������������������������������������������������������������������������������������������������������������������������������������� 3,895 4,020 4,143 123 3�1%Benefits ���������������������������������������������������������������������������������������������������������������������������������������������������� 701 728 785 57 7�8%
Subtotal ����������������������������������������������������������������������������������������������������������������������������������������������� 4,596 4,748 4,928 180 3�8%Total, Military Personnel Costs �������������������������������������������������������������������������������������������������������������������������� 164,223 172,710 179,135 6,425 3�7%
Grand total, personnel costs .......................................................................................................................... 538,124 552,611 575,724 23,113 4.2%
ADDENDUM
Former Civilian Personnel:Pensions �������������������������������������������������������������������������������������������������������������������������������������������������������� 92,663 95,153 98,498 3,345 3�5%Health benefits ����������������������������������������������������������������������������������������������������������������������������������������������� 13,186 13,312 13,969 657 4�9%Life insurance ������������������������������������������������������������������������������������������������������������������������������������������������ 42 42 43 1 2�4%
Subtotal ����������������������������������������������������������������������������������������������������������������������������������������������� 105,891 108,507 112,510 4,003 3�7%
Former Military Personnel:Pensions �������������������������������������������������������������������������������������������������������������������������������������������������������� 64,482 65,988 67,720 1,732 2�6%Health benefits ����������������������������������������������������������������������������������������������������������������������������������������������� 10,905 11,811 12,297 486 4�1%
Subtotal ����������������������������������������������������������������������������������������������������������������������������������������������� 75,387 77,799 80,017 2,218 2�9%Total, Former Personnel ������������������������������������������������������������������������������������������������������������������������������������ 181,278 186,306 192,527 6,221 3�3%
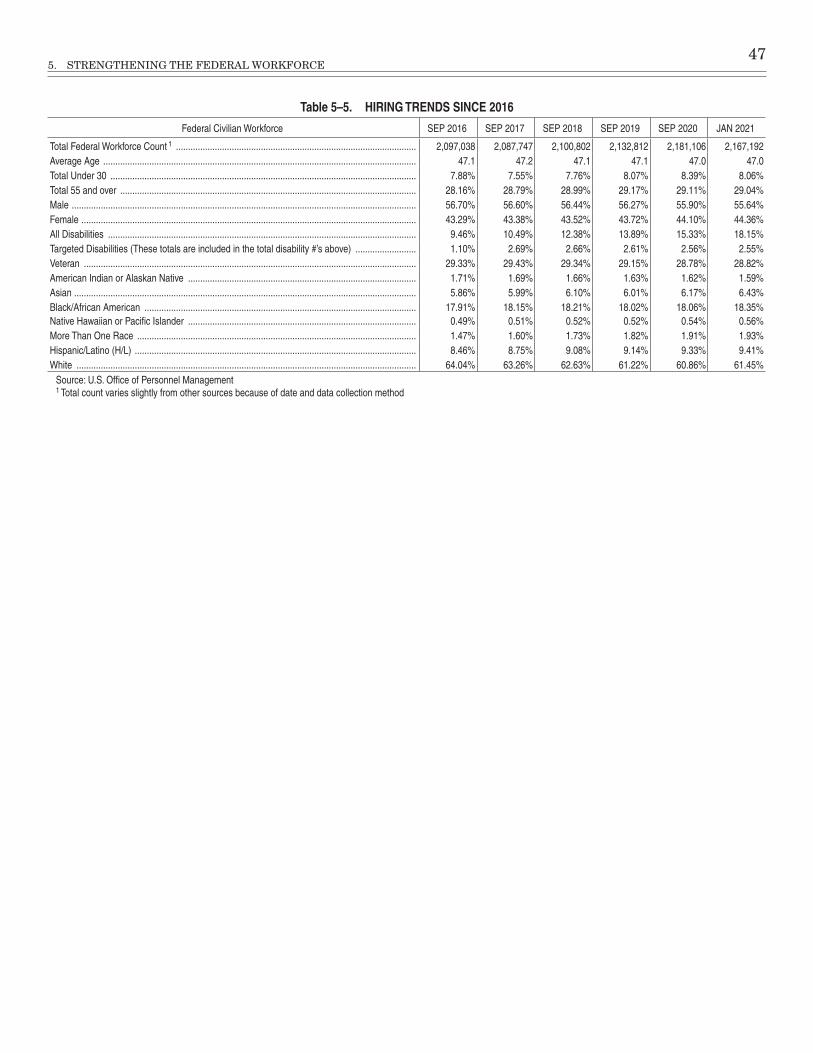
5. STRENGTHENING THE FEDERAL WORkFORCE 47
Table 5–5. HIRING TRENDS SINCE 2016
Federal Civilian Workforce SEP 2016 SEP 2017 SEP 2018 SEP 2019 SEP 2020 JAN 2021
Total Federal Workforce Count 1 ��������������������������������������������������������������������������������������������������� 2,097,038 2,087,747 2,100,802 2,132,812 2,181,106 2,167,192Average Age ��������������������������������������������������������������������������������������������������������������������������������� 47�1 47�2 47�1 47�1 47�0 47�0Total Under 30 ������������������������������������������������������������������������������������������������������������������������������ 7�88% 7�55% 7�76% 8�07% 8�39% 8�06%Total 55 and over �������������������������������������������������������������������������������������������������������������������������� 28�16% 28�79% 28�99% 29�17% 29�11% 29�04%Male ���������������������������������������������������������������������������������������������������������������������������������������������� 56�70% 56�60% 56�44% 56�27% 55�90% 55�64%Female ������������������������������������������������������������������������������������������������������������������������������������������ 43�29% 43�38% 43�52% 43�72% 44�10% 44�36%All Disabilities ������������������������������������������������������������������������������������������������������������������������������� 9�46% 10�49% 12�38% 13�89% 15�33% 18�15%Targeted Disabilities (These totals are included in the total disability #’s above) ������������������������� 1�10% 2�69% 2�66% 2�61% 2�56% 2�55%Veteran ����������������������������������������������������������������������������������������������������������������������������������������� 29�33% 29�43% 29�34% 29�15% 28�78% 28�82%American Indian or Alaskan Native ���������������������������������������������������������������������������������������������� 1�71% 1�69% 1�66% 1�63% 1�62% 1�59%Asian ��������������������������������������������������������������������������������������������������������������������������������������������� 5�86% 5�99% 6�10% 6�01% 6�17% 6�43%Black/African American ���������������������������������������������������������������������������������������������������������������� 17�91% 18�15% 18�21% 18�02% 18�06% 18�35%Native Hawaiian or Pacific Islander ���������������������������������������������������������������������������������������������� 0�49% 0�51% 0�52% 0�52% 0�54% 0�56%More Than One Race ������������������������������������������������������������������������������������������������������������������� 1�47% 1�60% 1�73% 1�82% 1�91% 1�93%Hispanic/Latino (H/L) �������������������������������������������������������������������������������������������������������������������� 8�46% 8�75% 9�08% 9�14% 9�33% 9�41%White �������������������������������������������������������������������������������������������������������������������������������������������� 64�04% 63�26% 62�63% 61�22% 60�86% 61�45%
Source: U�S� Office of Personnel Management1 Total count varies slightly from other sources because of date and data collection method

48ANALYTICAL PERSPECTIVES
0%
5%
10%
15%
20%
25%
30%
35%
1991 1993 1995 1997 1999 2001 2003 2005 2007 2009 2011 2013 2015 2017 2019
Chart 5-1. Masters Degree or Above By Year for Federal and Private Sectors
Federal Private Sector All Firms Private Sector Large Firms
Source: 1992-2020 Current Population Survey, IPUMS-CPS, University of Minnesota, www.ipums.org.
Notes: Federal excludes the military and Postal Service, but includes all other Federal workers. Private Sector excludes the self-employed. Neither category includes State and local government workers. Large firms have at least 1,000 workers. This analysis is limited to full-time, full-year workers, i.e. those with at least 1,500 annual hours of work and presents five-year averages. Industry is from the year preceding the year on the horizontal axis.
10%
20%
30%
40%
50%
60%
1991 1993 1995 1997 1999 2001 2003 2005 2007 2009 2011 2013 2015 2017 2019
Chart 5-2. High School Graduate or Less By Year for Federal and Private Sectors
Federal Private Sector All Firms Private Sector Large Firms
Source: 1992-2020 Current Population Survey, IPUMS-CPS, University of Minnesota, www.ipums.org.
Notes: Federal excludes the military and Postal Service, but includes all other Federal workers. Private Sector excludes the self-employed. Neither category includes State and local government workers. Large firms have at least 1,000 workers. This analysis is limited to full-time, full-year workers, i.e. those with at least 1,500 annual hours of work and presents five-year averages. Industry is from the year preceding the year on the horizontal axis.
36
38
40
42
44
46
48
1991 1993 1995 1997 1999 2001 2003 2005 2007 2009 2011 2013 2015 2017 2019
Chart 5-3. Average Age by Year for Federal and Private Sectors
Federal Private Sector All Firms Private Sector Large Firms
Source: 1992-2020 Current Population Survey, IPUMS-CPS, University of Minnesota, www.ipums.org.
Notes: Federal excludes the military and Postal Service, but includes all other Federal workers. Private Sector excludes the self-employed. Neither category includes State and local government workers. Large firms have at least 1,000 workers. This analysis is limited to full-time, full-year workers, i.e. those with at least 1,500 annual hours of work and presents five-year averages. Industry is from the year preceding the year on the horizontal axis.

5. STRENGTHENING THE FEDERAL WORkFORCE 49
Total 2,004,401
Chart 5-4. GOVERNMENT-WIDE ON-BOARD U.S. DISTRIBUTION 10–1–1978
Source: Office of Personnel Management.

50ANALYTICAL PERSPECTIVES
Chart 5-5. GOVERNMENT-WIDE ON-BOARD U.S. DISTRIBUTION 1–1–2021
Source: Office of Personnel Management.
0%
5%
10%
15%
20%
25%
GS-1 GS-2 GS-3 GS-4 GS-5 GS-6 GS-7 GS-8 GS-9 GS-10 GS-11 GS-12 GS-13 GS-14 GS-15
5-6. The Changing General Schedule Workforce
1950 2021Source: Office of Personnel Management
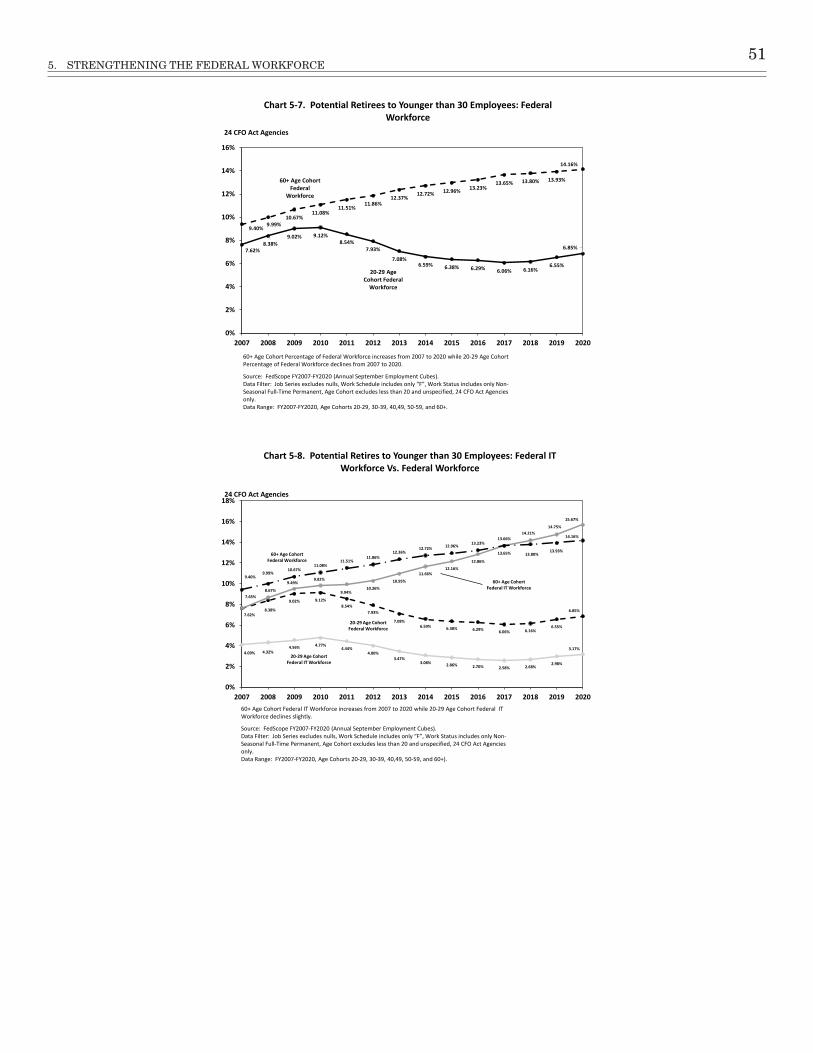
5. STRENGTHENING THE FEDERAL WORkFORCE 51
7.62%8.38%
9.02% 9.12%8.54%
7.93%
7.08%6.59% 6.38% 6.29% 6.06% 6.16%
6.55%
6.85%
9.40%9.99%
10.67%11.08%
11.51%11.86%
12.37%12.72% 12.96% 13.23%
13.65% 13.80% 13.93%
14.16%
0%
2%
4%
6%
8%
10%
12%
14%
16%
2007 2008 2009 2010 2011 2012 2013 2014 2015 2016 2017 2018 2019 2020
24 CFO Act Agencies
Chart 5-7. Potential Retirees to Younger than 30 Employees: Federal Workforce
60+ Age Cohort Federal
Workforce
20-29 Age Cohort Federal
Workforce
60+ Age Cohort Percentage of Federal Workforce increases from 2007 to 2020 while 20-29 Age Cohort Percentage of Federal Workforce declines from 2007 to 2020.
Source: FedScope FY2007-FY2020 (Annual September Employment Cubes). Data Filter: Job Series excludes nulls, Work Schedule includes only “F”, Work Status includes only Non-Seasonal Full-Time Permanent, Age Cohort excludes less than 20 and unspecified, 24 CFO Act Agencies only.Data Range: FY2007-FY2020, Age Cohorts 20-29, 30-39, 40,49, 50-59, and 60+.
4.09% 4.32%4.56% 4.77%
4.44%4.00%
3.47%3.08% 2.86% 2.70% 2.58% 2.68%
2.98%
3.17%
7.62%8.38%
9.02% 9.12%8.54%
7.93%
7.08%6.59% 6.38% 6.29% 6.06% 6.16%
6.55%
6.85%
7.65%8.67%
9.49%9.82%
9.94%10.26%
10.95%
11.66%12.16%
12.86%
13.65%
14.21%14.75%
15.67%
9.40%9.99%
10.67%11.08%
11.51%11.86%
12.36%12.72% 12.96% 13.23%
13.66%
13.80%13.93%
14.16%
0%
2%
4%
6%
8%
10%
12%
14%
16%
18%
2007 2008 2009 2010 2011 2012 2013 2014 2015 2016 2017 2018 2019 2020
24 CFO Act Agencies
Chart 5-8. Potential Retires to Younger than 30 Employees: Federal IT Workforce Vs. Federal Workforce
60+ Age Cohort Federal IT Workforce increases from 2007 to 2020 while 20-29 Age Cohort Federal IT Workforce declines slightly.
60+ Age Cohort Federal Workforce
60+ Age Cohort Federal IT Workforce
20-29 Age Cohort Federal Workforce
20-29 Age Cohort Federal IT Workforce
Source: FedScope FY2007-FY2020 (Annual September Employment Cubes). Data Filter: Job Series excludes nulls, Work Schedule includes only “F”, Work Status includes only Non-Seasonal Full-Time Permanent, Age Cohort excludes less than 20 and unspecified, 24 CFO Act Agencies only.Data Range: FY2007-FY2020, Age Cohorts 20-29, 30-39, 40,49, 50-59, and 60+).


53
BUDGET CONCEPTS AND BUDGET PROCESS

55
6. BUDGET CONCEPTS
The budget system of the United States Government provides the means for the President and the Congress to decide how much money to spend, what to spend it on, and how to raise the money they have decided to spend. Through the budget system, they determine the allocation of resources among the agencies of the Federal Government and between the Federal Government and the private sector. The budget system focuses primar-ily on dollars, but it also allocates other resources, such as Federal employment. The decisions made in the bud-get process affect the Nation as a whole, State and local governments, and individual Americans. Many budget decisions have worldwide significance. The Congress and the President enact budget decisions into law. The budget system ensures that these laws are carried out.
This chapter provides an overview of the budget system and explains some of the more important budget concepts. It includes summary dollar amounts to illustrate major concepts, and enumerates specific policies or presentation choices in the 2022 Budget associated with some of these concepts. Other chapters of the budget documents dis-
cuss these concepts and more detailed amounts in greater depth.
The following section discusses the budget process, cov-ering formulation of the President’s Budget, action by the Congress, budget enforcement, and execution of enacted budget laws. The next section provides information on budget coverage, including a discussion of on-budget and off-budget amounts, functional classification, presenta-tion of budget data, types of funds, and full-cost budgeting. Subsequent sections discuss the concepts of receipts and collections, budget authority, and outlays. These sections are followed by discussions of Federal credit; surpluses, deficits, and means of financing; Federal employment; and the basis for the budget figures. A glossary of budget terms appears at the end of the chapter.
Various laws, enacted to carry out requirements of the Constitution, govern the budget system. The chapter re-fers to the principal ones by title throughout the text and gives complete citations in the section just preceding the glossary.
THE BUDGET PROCESS
The budget process has three main phases, each of which is related to the others:
1. Formulation of the President’s Budget;
2. Action by the Congress; and
3. Execution of enacted budget laws.
Formulation of the President’s Budget
The Budget of the United States Government consists of several volumes that set forth the President’s fiscal policy goals and priorities for the allocation of resources by the Government. The primary focus of the Budget is on the budget year—the next fiscal year for which the Congress needs to make appropriations, in this case 2022. (Fiscal year 2022 will begin on October 1, 2021, and end on September 30, 2022.) The Budget also covers the nine years following the budget year in order to reflect the effect of budget decisions over the longer term. It includes the funding levels provided for the current year, in this case 2021, which allows the reader to compare the President’s Budget proposals with the most recently enacted levels. The Budget also includes data on the most recently com-pleted fiscal year, in this case 2020, so that the reader can compare budget estimates to actual accounting data.
In a normal year (excluding transitions between Administrations), the President begins the process of for-mulating the budget by establishing general budget and fiscal policy guidelines, usually by late spring of each year. Based on these guidelines, the Office of Management and Budget (OMB) works with the Federal agencies to estab-lish specific policy directions and planning levels to guide the preparation of their budget requests.
During the formulation of the budget, the President, the Director of OMB, and other officials in the Executive Office of the President continually exchange information, proposals, and evaluations bearing on policy decisions with the Secretaries of the Departments and the heads of the other Government agencies. Decisions reflected in previously enacted budgets, including the one for the fiscal year in progress, reactions to the last proposed bud-get (which the Congress is considering at the same time the process of preparing the forthcoming budget begins), and evaluations of program performance all influence decisions concerning the forthcoming budget, as do pro-jections of the economic outlook, prepared jointly by the Council of Economic Advisers, OMB, and the Department of the Treasury.
Agencies normally submit their budget requests to OMB, where analysts review them and identify issues that OMB officials need to discuss with the agencies. OMB and the agencies resolve many issues themselves. Others require the involvement of White House policy of-ficials and the President. This decision-making process

56ANALYTICAL PERSPECTIVES
is usually completed by late December. At that time, the final stage of developing detailed budget data and the preparation of the budget documents begins.
The decision-makers must consider the effects of eco-nomic and technical assumptions on the budget estimates. Interest rates, economic growth, the rate of inflation, the unemployment rate, and the number of people eligible for various benefit programs, among other factors, affect Government spending and receipts. Small changes in these assumptions can alter budget estimates by many billions of dollars. (Chapter 2, “Economic Assumptions and Overview,’’ provides more information on this subject.)
Thus, the budget formulation process involves the simultaneous consideration of the resource needs of in-dividual programs, the allocation of resources among the agencies and functions of the Federal Government, and the total outlays and receipts that are appropriate in light of current and prospective economic conditions.
The law governing the President’s Budget requires the transmittal of the following fiscal year’s Budget to the Congress on or after the first Monday in January but not later than the first Monday in February of each year. The budget is usually scheduled for transmission to the Congress on the first Monday in February, giving the Congress eight months to act on the budget before the fis-cal year begins. In years when a Presidential transition has taken place, this timeline for budget release is com-monly extended to allow the new administration sufficient time to take office and formulate its budget policy. While there is no specific timeline set for this circumstance, the detailed budget is usually completed and released in April or May. However, in order to aid the congressional bud-get process (discussed below), new administrations often release a budget blueprint that contains broad spending outlines and descriptions of major policies and priorities earlier in the year.
Congressional Action1
The Congress considers the President’s Budget pro-posals and approves, modifies, or disapproves them. It can change funding levels, eliminate programs, or add programs not requested by the President. It can add or eliminate taxes and other sources of receipts or make other changes that affect the amount of receipts collected.
The Congress does not enact a budget as such. Through the process of adopting a planning document called a bud-get resolution, the Congress agrees on targets for total spending and receipts, the size of the deficit or surplus, and the debt limit. The budget resolution provides the framework within which individual congressional com-mittees prepare appropriations bills and other spending and receipts legislation. The Congress provides funding for specified purposes in appropriations acts each year. It
1 For a fuller discussion of the congressional budget process, see Bill Heniff Jr., Introduction to the Federal Budget Process (Congressional Research Service Report 98–721), and Robert keith and Allen Schick, Manual on the Federal Budget Process (Congressional Research Service Report 98–720, archived).
also enacts changes each year in other laws that affect spending and receipts.
In making appropriations, the Congress does not vote on the level of outlays (spending) directly, but rather on budget authority, which is the authority provided by law to incur financial obligations that will result in outlays. In a separate process, prior to making appropriations, the Congress usually enacts legislation that authorizes an agency to carry out particular programs, authorizes the appropriation of funds to carry out those programs, and, in some cases, limits the amount that can be appropriat-ed for the programs. Some authorizing legislation expires after one year, some expires after a specified number of years, and some is permanent. The Congress may enact appropriations for a program even though there is no spe-cific authorization for it or its authorization has expired.
The Congress begins its work on its budget resolution shortly after it receives the President’s Budget. Under the procedures established by the Congressional Budget Act of 1974 (Congressional Budget Act), the Congress decides on budget targets before commencing action on individual appropriations. The Act requires each standing committee of the House and Senate to recommend budget levels and report legislative plans concerning matters within the committee’s jurisdiction to the Budget Committee in each body. The House and Senate Budget Committees then each design and report, and each body then considers, a concurrent resolution on the budget. The congressio-nal timetable calls for the House and Senate to resolve differences between their respective versions of the con-gressional budget resolution and adopt a single budget resolution by April 15 of each year.
In the report on the budget resolution, the Budget Committees allocate the total on-budget budget au-thority and outlays set forth in the resolution to the Appropriations Committees and the other committees that have jurisdiction over spending. These committee al-locations are commonly known as “302(a)” allocations, in reference to the section of the Congressional Budget Act that provides for them. The Appropriations Committees are then required to divide their 302(a) allocations of bud-get authority and outlays among their subcommittees. These subcommittee allocations are known as “302(b)” al-locations. There are procedural hurdles associated with considering appropriations bills that would breach an Appropriations subcommittee’s 302(b) allocation. Similar procedural hurdles exist for considering legislation that would cause the 302(a) allocation for any committee to be breached. The Budget Committees’ reports may dis-cuss assumptions about the level of funding for major programs. While these assumptions do not bind the other committees and subcommittees, they may influence their decisions.
Budget resolutions may include “reserve funds,” which permit adjustment of the resolution allocations as nec-essary to accommodate legislation addressing specific matters, such as healthcare or tax reform. Reserve funds are most often limited to legislation that is deficit neutral, including increases in some areas offset by decreases in
6. BUDGET CONCEPTS 57
BUDGET CALENDAR
The following timetable highlights the scheduled dates for significant budget events during a normal budget year:
Between the 1st Monday in January and the 1st Monday in February .............................. President transmits the budget
Six weeks later .................................................. Congressional committees report budget estimates to Budget Committees
April 15 .............................................................. Action to be completed on congressional budget resolution
May 15 ............................................................... House consideration of annual appropriations bills may begin even if the budget resolution has not been agreed to.
June 10 .............................................................. House Appropriations Committee to report the last of its annual appropriations bills.
June 15 .............................................................. Action to be completed on “reconciliation bill” by the Congress.
June 30 .............................................................. Action on appropriations to be completed by House
July 15 ............................................................... President transmits Mid-Session Review of the Budget
October 1 ............................................................ Fiscal year begins
others. The budget resolution may also contain “reconcili-ation directives” (discussed further below).
Since the concurrent resolution on the budget is not a law, it does not require the President’s approval. However, the Congress considers the President’s views in prepar-ing budget resolutions, because legislation developed to meet congressional budget allocations does require the President’s approval. In some years, the President and the joint leadership of Congress have formally agreed on plans to reduce the deficit or balance the budget. These agreements were then reflected in the budget resolution and legislation passed for those years.
If the Congress does not pass a budget resolution, the House and Senate typically adopt one or more “deeming resolutions” in the form of a simple resolution or as a pro-vision of a larger bill. A deeming resolution may serve nearly all functions of a budget resolution, except it may not trigger reconciliation procedures in the Senate.
Once the Congress approves the budget resolution, it turns its attention to enacting appropriations bills and authorizing legislation. The Appropriations Committee in each body has jurisdiction over annual appropriations. These committees are divided into subcommittees that hold hearings and review detailed budget justification materials prepared by the Executive Branch agencies within the subcommittee’s jurisdiction. After a bill has been drafted by a subcommittee, the full committee and the whole House, in turn, must approve the bill, sometimes with amendments to the original version. The House then forwards the bill to the Senate, where a similar review follows. If the Senate disagrees with the House on par-ticular matters in the bill, which is often the case, the two bodies form a conference committee (consisting of some Members of each body) to resolve the differences. The con-ference committee revises the bill and returns it to both bodies for approval. When the revised bill is agreed to, first in the House and then in the Senate, the Congress sends it to the President for approval or veto.
Since 1977, when the start of the fiscal year was estab-lished as October 1, there have been only three fiscal years
(1989, 1995, and 1997) for which the Congress agreed to and enacted every regular appropriations bill by that date. When one or more appropriations bills are not enacted by this date, the Congress usually enacts a joint resolution called a “continuing resolution’’ (CR), which is an interim or stop-gap appropriations bill that provides authority for the affected agencies to continue operations at some specified level until a specific date or until the regular ap-propriations are enacted. Occasionally, a CR has funded a portion or all of the Government for the entire year.
The Congress must present these CRs to the President for approval or veto. In some cases, Congresses have failed to pass a CR or Presidents have rejected CRs because they contained unacceptable provisions. Left without funds, Government agencies were required by law to shut down operations—with exceptions for some limited activi-ties—until the Congress passed a CR the President would approve. Shutdowns have lasted for periods of a day to several weeks.
The Congress also provides budget authority in laws other than appropriations acts. In fact, while annual ap-propriations acts fund the majority of Federal programs, they account for only about a third of the total spend-ing in a typical year. Authorizing legislation controls the rest of the spending, which is commonly called “manda-tory spending.” A distinctive feature of these authorizing laws is that they provide agencies with the authority or requirement to spend money without first requiring the Appropriations Committees to enact funding. This cat-egory of spending includes interest the Government pays on the public debt and the spending of several major programs, such as Social Security, Medicare, Medicaid, un-employment insurance, and Federal employee retirement. Almost all taxes and most other receipts also result from authorizing laws. Article I, Section 7 of the Constitution provides that all bills for raising revenue shall originate in the House of Representatives. In the House, the Ways and Means Committee initiates tax bills; in the Senate, the Finance Committee has jurisdiction over tax laws.
58ANALYTICAL PERSPECTIVES
The budget resolution often includes reconciliation directives, which require authorizing committees to recommend changes in laws that affect receipts or man-datory spending. They direct each designated committee to report amendments to the laws under the committee’s jurisdiction that would achieve changes in the levels of receipts or mandatory spending controlled by those laws. These directives specify the dollar amount of changes that each designated committee is expected to achieve, but do not specify which laws are to be changed or the changes to be made. However, the Budget Committees’ reports on the budget resolution frequently discuss assumptions about how the laws would be changed. Like other assumptions in the report, they do not bind the committees of juris-diction but may influence their decisions. A reconciliation instruction may also specify the total amount by which the statutory limit on the public debt is to be changed.
The committees subject to reconciliation directives draft the implementing legislation. Such legislation may, for example, change the tax code, revise benefit formulas or eligibility requirements for benefit programs, or autho-rize Government agencies to charge fees to cover some of their costs. Reconciliation bills are typically omnibus legislation, combining the legislation submitted by each reconciled committee in a single act.
The Senate considers such omnibus reconciliation acts under expedited procedures that limit total debate on the bill. To offset the procedural advantage gained by expedited procedures, the Senate places significant re-strictions on the substantive content of the reconciliation measure itself, as well as on amendments to the mea-sure. Any material in the bill that is extraneous or that contains changes to the Federal Old-Age and Survivors Insurance and the Federal Disability Insurance programs is not in order under the Senate’s expedited reconciliation procedures. Non-germane amendments are also prohib-ited. Reconciliation acts, together with appropriations acts for the year, are usually used to implement broad agreements between the President and the Congress on those occasions where the two branches have negotiated a comprehensive budget plan. Reconciliation acts have sometimes included other matters, such as laws provid-ing the means for enforcing these agreements.
Budget Enforcement
The Federal Government uses budget enforcement mechanisms to control revenues, spending, and deficits. The Statutory Pay-As-You-Go Act of 2010, enacted on February 12, 2010, reestablished a statutory procedure to enforce a rule of deficit neutrality on new revenue and mandatory spending legislation. The Budget Control Act of 2011 (BCA), enacted on August 2, 2011, amended the Balanced Budget and Emergency Deficit Control Act of 1985 (BBEDCA) by reinstating limits (“caps”) on the amount of discretionary budget authority that can be provided through the annual appropriations process. The BCA also created a Joint Select Committee on Deficit Reduction that was instructed to develop a bill to reduce the Federal deficit by at least $1.5 trillion over a 10-year
period, and imposed automatic spending cuts to achieve $1.2 trillion of deficit reduction over nine years after the Joint Committee process failed to achieve its deficit reduction goal. The original enforcement mechanisms es-tablished by the BCA—the caps on spending in annual appropriations and instructions to calculate reductions to achieve the $1.2 trillion deficit reduction goal—expire at the end of fiscal year 2021, although the sequestration of mandatory spending has been extended through 2030.
BBEDCA divides spending into two types—discre-tionary spending and direct (or mandatory) spending. Discretionary spending is controlled through annual appropriations acts. Funding for salaries and other op-erating expenses of Government agencies, for example, is generally discretionary. Direct spending (also referred to as mandatory spending) is controlled by permanent laws. Medicare and Medicaid payments, unemployment insurance benefits, and farm price supports are examples of mandatory spending. Receipts are included under the same statutory enforcement rules that apply to manda-tory spending because permanent laws generally control receipts.
Direct spending enforcement. The Statutory Pay-As-You-Go Act of 2010 requires that new legislation changing mandatory spending or revenue must be enact-ed on a “pay-as-you-go” (PAYGO) basis; that is, that the cumulative effects of such legislation must not increase projected on-budget deficits. PAYGO is a permanent re-quirement, and it does not impose a cap on spending or a floor on revenues. Instead, PAYGO requires that legis-lation reducing revenues must be fully offset by cuts in mandatory programs or by revenue increases, and that any bills increasing mandatory spending must be fully off-set by revenue increases or cuts in mandatory spending.
This requirement of deficit neutrality is not enforced on a bill-by-bill basis, but is based on two scorecards that tal-ly the cumulative budgetary effects of PAYGO legislation as averaged over rolling 5- and 10-year periods, starting with the budget year. Any impacts of PAYGO legislation on the current year deficit are counted as budget year im-pacts when placed on the scorecard. PAYGO is enforced by sequestration. Within 14 business days after a congressio-nal session ends, OMB issues an annual PAYGO report. If either the 5- or 10-year scorecard shows net costs in the budget year column, the President is required to issue a se-questration order implementing across-the-board cuts to nonexempt mandatory programs by an amount sufficient to offset those net costs. The PAYGO effects of legislation may be directed in legislation by reference to statements inserted into the Congressional Record by the chairmen of the House and Senate Budget Committees. Any such esti-mates are determined by the Budget Committees and are informed by, but not required to match, the cost estimates prepared by the Congressional Budget Office (CBO). If this procedure is not followed, then the PAYGO effects of the legislation are determined by OMB. Provisions of mandatory spending or receipts legislation that are des-ignated in that legislation as an emergency requirement are not scored as PAYGO budgetary effects.
6. BUDGET CONCEPTS 59
The PAYGO rules apply to the outlays resulting from outyear changes in mandatory programs made in ap-propriations acts and to all revenue changes made in appropriations acts. However, outyear changes to man-datory programs as part of provisions that have zero net outlay effects over the sum of the current year and the next five fiscal years are not considered under the PAYGO rules.
The PAYGO rules do not apply to increases in man-datory spending or decreases in receipts that result automatically under existing law. For example, mandato-ry spending for benefit programs, such as unemployment insurance, rises when the number of beneficiaries rises, and many benefit payments are automatically increased for inflation under existing laws.
The House and Senate impose points of order against consideration of tax or mandatory spending legislation that would violate the PAYGO principle, although the time periods covered by these rules and the treatment of previously enacted costs or savings may differ in some respects from the requirements of the Statutory Pay-As-You-Go Act of 2010.
BBEDCA Section 251A reductions. The failure of the Joint Select Committee on Deficit Reduction to pro-pose, and the Congress to enact, legislation to reduce the deficit by at least $1.5 trillion triggered automatic reductions to discretionary and mandatory spending in fiscal years 2013 through 2021. The reductions were implemented through a combination of sequestration of mandatory spending and reductions in the discretion-ary caps, with some modifications as provided for in the American Taxpayer Relief Act of 2012, and the Bipartisan Budget Acts (BBAs) of 2013, 2015, 2018, and 2019.
By amending section 251A of BBEDCA, the mandatory sequestration provisions were extended beyond 2021 by the BBA of 2013, which extended sequestration through 2023; Public Law 113-82, commonly referred to as the Military Retired Pay Restoration Act, which extended sequestration through 2024; the BBA of 2015, which ex-tended sequestration through 2025; the BBA of 2018, which extended sequestration through 2027; the BBA of 2019, which extended sequestration through 2029; and Public Law 116-136, commonly referred to as the CARES Act, which extended sequestration through 2030.
Starting in 2022, section 251A of BBEDCA requires that the same percentage reductions for non-exempt mandatory defense and non-defense spending will be ap-plied each year at the rate established in 2021. Those reductions are 5.7 percent for non-defense accounts, 8.3 percent for defense accounts, and 2 percent for Medicare and community and migrant health centers. 2 Since the percentage reduction is known in advance, the 2022 Budget will present these reductions at the account level.
2 The CARES Act, as amended by Public Law 117-7, suspended the Medicare sequestration from May 1, 2020 to December 31, 2021 and specified that, notwithstanding the 2 percent limit on Medicare seques-tration in the BCA, the reduction in the Medicare program should be 2 percent in the first 5.5 months of 2030, a 4 percent reduction in the second 6 months of 2030, and a 0 percent reduction in the remaining half month of 2030.
Previously, the Budget reflected the reductions starting in the budget year in a central allowance account.
Discretionary cap enforcement. BBEDCA specified spending limits (“caps”) on discretionary budget authority for 2012 through 2021. Similar enforcement mechanisms were established by the Budget Enforcement Act of 1990 and were extended in 1993 and 1997, but expired at the end of 2002. The threat of sequestration if the caps were breached proved sufficient to ensure compliance with the discretionary spending limits.
When caps were in place, BBEDCA required OMB to adjust the caps each year for: changes in concepts and def-initions; appropriations designated by the Congress and the President as emergency requirements; and appro-priations designated by the Congress and the President for Overseas Contingency Operations/Global War on Terrorism (OCO/GWOT). BBEDCA also specified cap adjustments (which are limited to fixed amounts) for: appropriations for continuing disability reviews and re-determinations by the Social Security Administration; the healthcare fraud and abuse control program at the Department of Health and Human Services; appropria-tions designated by the Congress as being for disaster relief; appropriations for reemployment services and eligi-bility assessments; appropriations for wildfire suppression at the Department of Agriculture and the Department of the Interior; and, for 2020 only, appropriations provided for the 2020 Census at the Department of Commerce.
The 2022 Budget does not propose new caps on dis-cretionary funding. The caps in place from 2012 through 2021, especially after Joint Committee enforcement was triggered, led to a serious erosion in discretionary resourc-es, particularly for non-defense funding, and contributed to a decade of under-investments in core public services and programs.
However, the 2022 Budget does support retaining sev-eral of the aforementioned cap adjustments as “allocation adjustments” to be used pursuant to the Congressional Budget Act in the Congressional Budget Resolution. The Budget does not retain all the BBEDCA adjustments (specifically, the Administration shifts funds that had been designated as OCO to the base) but it still provides funds for anomalous or above-base activities such as pro-gram integrity, disaster relief, and wildfire suppression that continue to be presented outside of the base alloca-tion for certain accounts. In anticipation of most of these useful mechanisms being retained as part of the annual budget and appropriations process, the Budget includes the following adjustments above the base level of discre-tionary funding:
• Program Integrity. This allocation adjustment continues to recognize that certain discretionary ac-tivities focused on program integrity in the largest benefit programs (Social Security, Medicare, Medic-aid, and Unemployment Insurance) have a return on investment (ROI) in the form of savings for these programs. The allocation adjustment, shown in the 2022 Budget as an additional amount for program integrity activities in the specific benefit program’s discretionary request, encourages the Congress to
60ANALYTICAL PERSPECTIVES
continue proposing those adjustments and reaping the savings associated with this activity. The Ad-ministration also supports additional program in-tegrity funding through an allocation adjustment to support ongoing enforcement of tax payments by the Internal Revenue Service. Savings derived from the program integrity allocation adjustments on the discretionary side are assumed to continue into the outyears. Because the savings are only generated if the funding is provided in annual discretionary ap-propriations, savings in the mandatory benefit pro-grams are shown as a legislative proposal not sub-ject to Pay-As-You Go procedures. This allows the scorekeeping community to recognize the benefits of this spending within established scorekeeping guidelines. Details for each program are below:
• Internal Revenue Service (IRS): The Budget propos-es to establish and fund a new IRS program integ-rity allocation adjustment for program integrity ac-tivities starting in 2022. The IRS base appropriation funds current tax administration activities, includ-ing all tax enforcement and compliance program ac-tivities, in the Enforcement and Operations Support accounts. The additional $417 million adjustment in 2022 funds new and continuing investments in expanding and improving the effectiveness and ef-ficiency of the IRS’s tax enforcement program. The activities are estimated to generate and protect $50 billion in revenue over 10 years and cost approxi-mately $7 billion, resulting in an estimated net sav-ings of $43 billion. (Separately, the Budget also pro-poses new mandatory funding for IRS enforcement activities.)
• Social Security: The Social Security Administration (SSA) takes seriously its responsibilities to ensure eligible individuals receive the benefits to which they are entitled, and to safeguard the integrity of benefit programs to better serve recipients. The pro-posed $1.7 billion in discretionary funding, includ-ing a $1.4 billion allocation adjustment, allows SSA to conduct continuing disability reviews (CDRs) and Supplemental Security Income (SSI) redetermina-tions to confirm that participants remain eligible to receive benefits, and it supports anti-fraud coopera-tive disability investigation units and special attor-neys for fraud prosecutions. Access to approximately $20 billion in discretionary funding over 10 years, including approximately $17 billion in allocation ad-justments, would produce $73 billion in gross Feder-al savings ($54 billion from allocation adjustments), with net deficit savings of approximately $37 billion in the 10-year window and additional savings in the outyears (the Budget excludes funding for the now withdrawn proposed rule regarding increasing the number and frequency of CDRs).
• Health Care Fraud and Abuse Control (HCFAC): The 2022 Budget requests $873 million in discre-tionary HCFAC funding. Of this, $556 million is additional new budget authority for the allocation
adjustment. Over 10 years, the Budget invests $6.3 billion in additional new budget authority, yielding $13.1 billion in mandatory savings to Medicare and Medicaid. The 2022 allocation adjustment includes funding to invest in Medicare medical review, ad-dress new program integrity work stemming from the COVID-19 public health emergency, and handle work associated with Medicaid expansion and the federally facilitated exchanges.
• Unemployment Insurance (UI): The 2022 Budget proposes $250 million in discretionary funding, of which $133 million is an allocation adjustment, for Reemployment Services and Eligibility Assessments (RESEA), which addresses individual reemployment needs of UI claimants and prevents and detects im-proper benefit payments. This level is consistent with the enacted level in the Congressional Budget Act, which allows for the adjustment for congressio-nal budget procedures through 2027, and the bud-getary treatment is the same as the other adjust-ments. Program integrity funding in 2028 through 2031 continues at a level that results from applying the rate of inflation in the current services baseline to the 2027 amount. The mandatory savings over ten years are $6.1 billion, which includes an estimated $1.8 billion reduction in State unemployment taxes. When netted against the discretionary costs for the cap adjustment funding, the 10-year net savings for the program is $913 million.
• Disaster Relief. The 2022 Budget maintains the same methodology for determining the funding ceil-ing for disaster relief used in previous budgets. At the time the 2022 Budget was prepared, OMB es-timated the total adjustment available for disaster funding for 2022 at $18.9 billion after accounting for 2021 enacted appropriations. This ceiling estimate is based on three components: a 10-year average of disaster relief funding provided in prior years that excludes the highest and lowest years ($10.1 bil-lion); 5 percent of Robert T. Stafford Disaster Relief and Emergency Assistance Act emergencies since 2012 ($8.7 billion); and carryover from the previous year ($0.1 billion). For 2022, the Administration is requesting $18.8 billion in funding for the Federal Emergency Management Agency’s (FEMA) Disas-ter Relief Program and more than $0.1 billion for the Small Business Administration’s Disaster Loans Program. These amounts cover the costs of Presiden-tially-declared major disasters, including identified costs for previously declared catastrophic events and the estimated annual cost of non-catastrophic events expected to obligate in 2022. The Administration’s request also addresses the significant and unprec-edented recovery needs from COVID-19 pandemic. Consistent with past practice, the 2022 request level does not seek to pre-fund anticipated needs in other programs arising out of disasters that have yet to occur. After 2022, the Administration does not have adequate information about known or future re-
6. BUDGET CONCEPTS 61
quirements necessary to estimate the total amount that will be requested in future years. Accordingly, the Budget does not explicitly request any disaster relief funding in any year after the budget year and includes a placeholder in each of the outyears that is equal to the 10-year average ($10.1 billion) of disas-ter relief currently estimated under the formula for the 2022 ceiling. This funding level does not reflect a specific request but a placeholder amount that, along with other outyear appropriations levels, will be decided on an annual basis as part of the normal budget development process.
• Wildfire Suppression. The 2022 Budget requests funding as an allocation adjustment for wildfire suppression operations at the level authorized in the Stephen Sepp Wildfire Suppression Funding and Forest Management Activities Act. The Budget funds a base level that is equal to the average costs over ten years for wildfire suppression operations that were requested in the President’s 2015 Budget for the Department of Agriculture’s Forest Service and the Department of the Interior (DOI), and seeks the full $2.5 billion adjustment authorized, with $2.1 billion for Forest Service and $0.3 billion included for DOI. Providing the full level authorized in 2022 will ensure that adequate resources are available to fight wildland fires, protect communities, and safe-guard human life during the most severe wildland fire season. After 2022, the Budget includes a place-holder for wildfire suppression that is equal to the 2022 request level. Those amounts will be refined in subsequent Budgets, as data on costs for wildfire suppression operations are updated annually.
Budget Execution
Government agencies may not spend or obligate more than the Congress has appropriated, and they may use funds only for purposes specified in law. The Antideficiency Act prohibits them from spending or obligating funds in advance or in excess of an appropriation, unless specific
authority to do so has been provided in law. Additionally, the Antideficiency Act requires the President to appor-tion the budgetary resources available for most executive branch agencies. The President has delegated this au-thority to OMB. Some apportionments are by time periods (usually by quarter of the fiscal year), some are by proj-ects or activities, and others are by a combination of both. Agencies may request OMB to reapportion funds during the year to accommodate changing circumstances. This system helps to ensure that funds do not run out before the end of the fiscal year.
During the budget execution phase, the Government sometimes finds that it needs more funding than the Congress has appropriated for the fiscal year because of unanticipated circumstances. For example, more might be needed to respond to a severe natural disaster. Under such circumstances, the Congress may enact a supple-mental appropriation.
On the other hand, the President may propose to reduce a previously enacted appropriation, through a “rescission” or “cancellation” of those funds. How the President pro-poses this reduction determines whether it is considered a rescission or a cancellation. A rescission is a reduction in previously enacted appropriations proposed pursuant to the Impoundment Control Act (ICA). The ICA allows the President, using the specific authorities in that Act, to transmit a “special message” to the Congress to in-form them of these proposed rescissions, at which time the funding can be withheld from obligation for up to 45 days on the OMB-approved apportionment. Agencies are instructed not to withhold funds without the prior ap-proval of OMB. If the Congress does not act to rescind these funds within the 45-day period, the funds are made available for obligation.
The President can also propose reductions to previ-ously enacted appropriations outside of the ICA; in these cases, these reductions are referred to as cancellations. Cancellation proposals are not subject to the require-ments and procedures of the ICA and amounts cannot be withheld from obligation. The 2022 President’s Budget includes $4.3 billion in proposed cancellations.
COVERAGE OF THE BUDGET
Federal Government and Budget Totals
The budget documents provide information on all Federal agencies and programs. However, because the laws governing Social Security (the Federal Old-Age and Survivors Insurance and the Federal Disability Insurance trust funds) and the Postal Service Fund require that the receipts and outlays for those activities be excluded from the budget totals and from the calculation of the deficit or surplus, the budget presents on-budget and off-budget totals. The off-budget totals include the Federal transactions excluded by law from the budget totals. The on-budget and off-budget amounts are added together to derive the totals for the Federal Government. These are
sometimes referred to as the unified or consolidated bud-get totals.
It is not always obvious whether a transaction or ac-tivity should be included in the budget. Where there is a question, OMB normally follows the recommendation of the 1967 President’s Commission on Budget Concepts to be comprehensive of the full range of Federal agencies, programs, and activities. In recent years, for example, the budget has included the transactions of the Affordable Housing Program funds, the Universal Service Fund, the Public Company Accounting Oversight Board, the Securities Investor Protection Corporation, Guaranty Agencies Reserves, the National Railroad Retirement Investment Trust, the United Mine Workers Combined

62ANALYTICAL PERSPECTIVES
Benefits Fund, the Federal Financial Institutions Examination Council, Electric Reliability Organizations (EROs) established pursuant to the Energy Policy Act of 2005, the Corporation for Travel Promotion, and the National Association of Registered Agents and Brokers.
In contrast, the budget excludes tribal trust funds that are owned by Indian Tribes and held and man-aged by the Government in a fiduciary capacity on the Tribes’ behalf. These funds are not owned by the Government, the Government is not the source of their capital, and the Government’s control is limited to the exercise of fiduciary duties. Similarly, the transactions of Government-sponsored enterprises, such as the Federal Home Loan Banks, are not included in the on-budget or off-budget totals. Federal laws established these enter-prises for public policy purposes, but they are privately owned and operated corporations. Nevertheless, because of their public charters, the budget discusses them and reports summary financial data in the Budget Appendix and in some detailed tables.
The budget also excludes the revenues from copyright royalties and spending for subsequent payments to copy-right holders where (1) the law allows copyright owners and users to voluntarily set the rate paid for the use of protected material, and (2) the amount paid by users of copyrighted material to copyright owners is related to the frequency or quantity of the material used. The budget excludes license royalties collected and paid out by the Copyright Office for the retransmission of network broad-casts via cable collected under 17 U.S.C. 111 because these revenues meet both of these conditions. The budget includes the royalties collected and paid out for license fees for digital audio recording technology under 17 U.S.C. 1004, since the amount of license fees paid is unrelated to usage of the material.
The Appendix includes a presentation for the Board of Governors of the Federal Reserve System for infor-mation only. The amounts are not included in either the on-budget or off-budget totals because of the independent status of the System within the Government. However, the Federal Reserve System transfers its net earnings to the Treasury, and the budget records them as receipts.
Chapter 7 of this volume, “Coverage of the Budget,” provides more information on this subject.
Functional Classification
The functional classification is used to organize bud-get authority, outlays, and other budget data according to the major purpose served—such as agriculture, trans-portation, income security, and national defense. There are 20 major functions, 17 of which are concerned with broad areas of national need and are further divided into subfunctions. For example, the Agriculture function comprises the subfunctions Farm Income Stabilization and Agricultural Research and Services. The functional classification meets the Congressional Budget Act re-quirement for a presentation in the budget by national needs and agency missions and programs. The remaining three functions—Net Interest, Undistributed Offsetting
Receipts, and Allowances—enable the functional classifi-cation system to cover the entire Federal budget.
The following criteria are used in establishing func-tional categories and assigning activities to them:
• A function encompasses activities with similar pur-poses, emphasizing what the Federal Government seeks to accomplish rather than the means of ac-complishment, the objects purchased, the clientele or geographic area served (except in the cases of functions 450 for Community and Regional Devel-opment, 570 for Medicare, 650 for Social Security, and 700 for Veterans Benefits and Services), or the Federal agency conducting the activity (except in the case of subfunction 051 in the National Defense function, which is used only for defense activities under the Department of Defense—Military).
• A function must be of continuing national impor-tance, and the amounts attributable to it must be significant.
• Each basic unit being classified (generally the ap-propriation or fund account) usually is classified ac-cording to its primary purpose and assigned to only one subfunction. However, some large accounts that serve more than one major purpose are subdivided into two or more functions or subfunctions.
In consultation with the Congress, the functional clas-sification is adjusted from time to time as warranted. Detailed functional tables, which provide information on Government activities by function and subfunction, are available online at https://www.whitehouse.gov/omb/analytical-perspectives/ and on OMB’s website.
Table 6–1. TOTALS FOR THE BUDGET AND THE FEDERAL GOVERNMENT
(In billions of dollars)
2020Actual
Estimate
2021 2022
Budget authority:Unified �������������������������������������������������� 7,735 7,090 6,212
On-budget ��������������������������������������� 6,774 6,063 5,134Off-budget ��������������������������������������� 962 1,027 1,078
Receipts:Unified �������������������������������������������������� 3,421 3,581 4,174
On-budget ��������������������������������������� 2,456 2,637 3,142Off-budget ��������������������������������������� 965 944 1,033
Outlays:Unified �������������������������������������������������� 6,550 7,249 6,011
On-budget ��������������������������������������� 5,598 6,232 4,931Off-budget ��������������������������������������� 952 1,018 1,081
Deficit (–) / Surplus (+):Unified �������������������������������������������������� –3,129 –3,669 –1,837
On-budget ��������������������������������������� –3,142 –3,595 –1,789Off-budget ��������������������������������������� 13 –73 –48
6. BUDGET CONCEPTS 63
Agencies, Accounts, Programs, Projects, and Activities
Various summary tables in the Analytical Perspectives volume of the Budget provide information on budget au-thority, outlays, and offsetting collections and receipts arrayed by Federal agency. A table that lists budget au-thority and outlays by budget account within each agency and the totals for each agency of budget authority, out-lays, and receipts that offset the agency spending totals is available online at: https://www.whitehouse.gov/omb/analytical-perspectives/ and on OMB’s website. The Appendix provides budgetary, financial, and descriptive information about programs, projects, and activities by account within each agency.
Types of Funds
Agency activities are financed through Federal funds and trust funds.
Federal funds comprise several types of funds. Receipt accounts of the general fund, which is the great-er part of the budget, record receipts not earmarked by law for a specific purpose, such as income tax receipts. The general fund also includes the proceeds of general borrowing. General fund appropriations accounts record general fund expenditures. General fund appropriations draw from general fund receipts and borrowing collec-tively and, therefore, are not specifically linked to receipt accounts.
Special funds consist of receipt accounts for Federal fund receipts that laws have designated for specific pur-poses and the associated appropriation accounts for the expenditure of those receipts.
Public enterprise funds are revolving funds used for programs authorized by law to conduct a cycle of busi-ness-type operations, primarily with the public, in which outlays generate collections.
Intragovernmental funds are revolving funds that conduct business-type operations primarily within and between Government agencies. The collections and the outlays of revolving funds are recorded in the same bud-get account.
Trust funds account for the receipt and expenditure of monies by the Government for carrying out specific purposes and programs in accordance with the terms of a statute that designates the fund as a trust fund (such as the Highway Trust Fund) or for carrying out the stip-ulations of a trust where the Government itself is the beneficiary (such as any of several trust funds for gifts and donations for specific purposes). Trust revolving funds are trust funds credited with collections earmarked by law to carry out a cycle of business-type operations.
The Federal budget meaning of the term “trust,” as ap-plied to trust fund accounts, differs significantly from its private-sector usage. In the private sector, the beneficiary of a trust usually owns the trust’s assets, which are man-aged by a trustee who must follow the stipulations of the
trust. In contrast, the Federal Government owns the as-sets of most Federal trust funds, and it can raise or lower future trust fund collections and payments, or change the purposes for which the collections are used, by changing existing laws. There is no substantive difference between a trust fund and a special fund or between a trust revolv-ing fund and a public enterprise revolving fund.
However, in some instances, the Government does act as a true trustee of assets that are owned or held for the benefit of others. For example, it maintains accounts on behalf of individual Federal employees in the Thrift Savings Fund, investing them as directed by the individ-ual employee. The Government accounts for such funds in deposit funds, which are not included in the budget. (Chapter 18 of this volume, “Trust Funds and Federal Funds,” provides more information on this subject.)
Budgeting for Full Costs
A budget is a financial plan for allocating resourc-es—deciding how much the Federal Government should spend in total, program by program, and for the parts of each program and deciding how to finance the spending. The budgetary system provides a process for proposing policies, making decisions, implementing them, and re-porting the results. The budget needs to measure costs accurately so that decision makers can compare the cost of a program with its benefits, the cost of one program with another, and the cost of one method of reaching a specified goal with another. These costs need to be fully included in the budget up front, when the spending deci-sion is made, so that executive and congressional decision makers have the information and the incentive to take the total costs into account when setting priorities.
The budget includes all types of spending, including both current operating expenditures and capital invest-ment, and to the extent possible, both are measured on the basis of full cost. Questions are often raised about the measure of capital investment. The present budget pro-vides policymakers the necessary information regarding investment spending. It records investment on a cash basis, and it requires the Congress to provide budget au-thority before an agency can obligate the Government to make a cash outlay. However, the budget measures only costs, and the benefits with which these costs are compared, based on policy makers’ judgment, must be presented in supplementary materials. By these means, the budget allows the total cost of capital investment to be compared up front in a rough way with the total expected future net benefits. Such a comparison of total costs with benefits is consistent with the formal method of cost-benefit analysis of capital projects in government, in which the full cost of a capital asset as the cash is paid out is compared with the full stream of future benefits (all in terms of present values). (Chapter 13 of this volume, “Federal Investment,’’ provides more information on capi-tal investment.)
64ANALYTICAL PERSPECTIVES
RECEIPTS, OFFSETTING COLLECTIONS, AND OFFSETTING RECEIPTS
In General
The budget records amounts collected by Government agencies two different ways. Depending on the nature of the activity generating the collection and the law that es-tablished the collection, they are recorded as either:
Governmental receipts, which are compared in total to outlays (net of offsetting collections and offsetting re-ceipts) in calculating the surplus or deficit; or
Offsetting collections or offsetting receipts, which are deducted from gross outlays to calculate net outlay figures.
Governmental Receipts
Governmental receipts are collections that result from the Government’s exercise of its sovereign power to tax or otherwise compel payment. Sometimes they are called receipts, budget receipts, Federal receipts, or Federal revenues. They consist mostly of individual and corpo-ration income taxes and social insurance taxes, but also include excise taxes, compulsory user charges, regulato-ry fees, customs duties, court fines, certain license fees, and deposits of earnings by the Federal Reserve System. Total receipts for the Federal Government include both on-budget and off-budget receipts (see Table 6–1, “Totals for the Budget and the Federal Government,” which ap-pears earlier in this chapter.) Chapter 8 of this volume, “Governmental Receipts,’’ provides more information on governmental receipts.
Offsetting Collections and Offsetting Receipts
Offsetting collections and offsetting receipts are re-corded as offsets to (deductions from) spending, not as additions on the receipt side of the budget. These amounts are recorded as offsets to outlays so that the budget totals represent governmental rather than market activity and reflect the Government’s net transactions with the public. They are recorded in one of two ways, based on inter-pretation of laws and longstanding budget concepts and practice. They are offsetting collections when the collec-tions are authorized by law to be credited to expenditure accounts and are generally available for expenditure without further legislation. Otherwise, they are deposited in receipt accounts and called offsetting receipts; many of these receipts are available for expenditure without fur-ther legislation as well.
Offsetting collections and offsetting receipts result from any of the following types of transactions:
• Business-like transactions or market-oriented activities with the public—these include vol-untary collections from the public in exchange for goods or services, such as the proceeds from the sale of postage stamps, the fees charged for admittance to recreation areas, and the proceeds from the sale of Government-owned land; and reimbursements
for damages. The budget records these amounts as offsetting collections from non-Federal sources (for offsetting collections) or as proprietary receipts (for offsetting receipts).
• Intragovernmental transactions—collections from other Federal Government accounts. The bud-get records collections by one Government account from another as offsetting collections from Federal sources (for offsetting collections) or as intragov-ernmental receipts (for offsetting receipts). For ex-ample, the General Services Administration rents office space to other Government agencies and re-cords their rental payments as offsetting collections from Federal sources in the Federal Buildings Fund. These transactions are exactly offsetting and do not affect the surplus or deficit. However, they are an important accounting mechanism for allocating costs to the programs and activities that cause the Government to incur the costs.
• Voluntary gifts and donations—gifts and dona-tions of money to the Government, which are treated as offsets to budget authority and outlays.
• Offsetting governmental transactions—collec-tions from the public that are governmental in na-ture and should conceptually be treated like Federal revenues and compared in total to outlays (e.g., tax receipts, regulatory fees, compulsory user charges, custom duties, license fees) but required by law or longstanding practice to be misclassified as offset-ting. The budget records amounts from non-Federal sources that are governmental in nature as offset-ting governmental collections (for offsetting collec-tions) or as offsetting governmental receipts (for off-setting receipts).
Offsetting Collections
Some laws authorize agencies to credit collections di-rectly to the account from which they will be spent and, usually, to spend the collections for the purpose of the account without further action by the Congress. Most re-volving funds operate with such authority. For example, a permanent law authorizes the Postal Service to use collections from the sale of stamps to finance its opera-tions without a requirement for annual appropriations. The budget records these collections in the Postal Service Fund (a revolving fund) and records budget authority in an amount equal to the collections. In addition to revolv-ing funds, some agencies are authorized to charge fees to defray a portion of costs for a program that are otherwise financed by appropriations from the general fund and usually to spend the collections without further action by the Congress. In such cases, the budget records the off-setting collections and resulting budget authority in the program’s general fund expenditure account. Similarly,
6. BUDGET CONCEPTS 65
intragovernmental collections authorized by some laws may be recorded as offsetting collections and budget au-thority in revolving funds or in general fund expenditure accounts.
Sometimes appropriations acts or provisions in other laws limit the obligations that can be financed by offset-ting collections. In those cases, the budget records budget authority in the amount available to incur obligations, not in the amount of the collections.
Offsetting collections credited to expenditure accounts automatically offset the outlays at the expenditure ac-count level. Where accounts have offsetting collections, the budget shows the budget authority and outlays of the account both gross (before deducting offsetting col-lections) and net (after deducting offsetting collections). Totals for the agency, subfunction, and overall budget are net of offsetting collections.
Offsetting Receipts
Collections that are offset against gross outlays but are not authorized to be credited to expenditure accounts are credited to receipt accounts and are called offsetting receipts. Offsetting receipts are deducted from budget authority and outlays in arriving at total net budget au-thority and outlays. However, unlike offsetting collections credited to expenditure accounts, offsetting receipts do not offset budget authority and outlays at the account level. In most cases, they offset budget authority and out-lays at the agency and subfunction levels.
Proprietary receipts from a few sources, however, are not offset against any specific agency or function and are classified as undistributed offsetting receipts. They are deducted from the Government-wide totals for net bud-get authority and outlays. For example, the collections of rents and royalties from outer continental shelf lands are undistributed because the amounts are large and for the most part are not related to the spending of the agency
that administers the transactions and the subfunction that records the administrative expenses.
Similarly, two kinds of intragovernmental transac-tions—agencies’ payments as employers into Federal employee retirement trust funds and interest received by trust funds—are classified as undistributed offsetting receipts. They appear instead as special deductions in computing total net budget authority and outlays for the Government rather than as offsets at the agency level. This special treatment is necessary because the amounts are so large they would distort measures of the agency’s activities if they were attributed to the agency.
User Charges
User charges are fees assessed on individuals or orga-nizations for the provision of Government services and for the sale or use of Government goods or resources. The payers of the user charge must be limited in the authoriz-ing legislation to those receiving special benefits from, or subject to regulation by, the program or activity beyond the benefits received by the general public or broad seg-ments of the public (such as those who pay income taxes or customs duties). Policy regarding user charges is estab-lished in OMB Circular A–25, “User Charges.” The term encompasses proceeds from the sale or use of Government goods and services, including the sale of natural resources (such as timber, oil, and minerals) and proceeds from as-set sales (such as property, plant, and equipment). User charges are not necessarily dedicated to the activity they finance and may be credited to the general fund of the Treasury.
The term “user charge” does not refer to a separate bud-get category for collections. User charges are classified in the budget as receipts, offsetting receipts, or offsetting col-lections according to the principles explained previously.
See Chapter 9, “Offsetting Collections and Offsetting Receipts,” for more information on the classification of user charges.
BUDGET AUTHORITY, OBLIGATIONS, AND OUTLAYS
Budget authority, obligations, and outlays are the pri-mary benchmarks and measures of the budget control system. The Congress enacts laws that provide agencies with spending authority in the form of budget authority. Before agencies can use these resources—obligate this budget authority—OMB must approve their spending plans. After the plans are approved, agencies can enter into binding agreements to purchase items or services or to make grants or other payments. These agreements are recorded as obligations of the United States and de-ducted from the amount of budgetary resources available to the agency. When payments are made, the obligations are liquidated and outlays recorded. These concepts are discussed more fully below.
Budget Authority and Other Budgetary Resources
Budget authority is the authority provided in law to enter into legal obligations that will result in immediate or future outlays of the Government. In other words, it is the amount of money that agencies are allowed to commit to be spent in current or future years. Government offi-cials may obligate the Government to make outlays only to the extent they have been granted budget authority.
In deciding the amount of budget authority to request for a program, project, or activity, agency officials esti-mate the total amount of obligations they will need to incur to achieve desired goals and subtract the unobli-gated balances available for these purposes. The amount of budget authority requested is influenced by the nature of the programs, projects, or activities being financed. For current operating expenditures, the amount requested usually covers the needs for the fiscal year. For major

66ANALYTICAL PERSPECTIVES
procurement programs and construction projects, agen-cies generally must request sufficient budget authority in the first year to fully fund an economically useful seg-ment of a procurement or project, even though it may be obligated over several years. This full funding policy is intended to ensure that the decision-makers take into ac-count all costs and benefits at the time decisions are made to provide resources. It also avoids sinking money into a procurement or project without being certain if or when future funding will be available to complete the procure-ment or project, as well as saddling future agency budgets with must-pay bills to complete past projects.
Budget authority takes several forms:• Appropriations, provided in annual appropria-
tions acts or authorizing laws, permit agencies to incur obligations and make payment;
• Borrowing authority, usually provided in perma-nent laws, permits agencies to incur obligations but requires them to borrow funds, usually from the gen-eral fund of the Treasury, to make payment;
• Contract authority, usually provided in permanent law, permits agencies to incur obligations in advance of a separate appropriation of the cash for payment or in anticipation of the collection of receipts that can be used for payment; and
• Spending authority from offsetting collections, usually provided in permanent law, permits agen-cies to credit offsetting collections to an expenditure account, incur obligations, and make payment using the offsetting collections.
Because offsetting collections and offsetting receipts are deducted from gross budget authority, they are re-ferred to as negative budget authority for some purposes, such as Congressional Budget Act provisions that pertain to budget authority.
Authorizing statutes usually determine the form of budget authority for a program. The authorizing statute may authorize a particular type of budget authority to be provided in annual appropriations acts, or it may provide one of the forms of budget authority directly, without the need for further appropriations.
An appropriation may make funds available from the general fund, special funds, or trust funds, or authorize the spending of offsetting collections credited to expen-diture accounts, including revolving funds. Borrowing authority is usually authorized for business-like activities where the activity being financed is expected to produce income over time with which to repay the borrowing with interest. The use of contract authority is traditionally lim-ited to transportation programs.
New budget authority for most Federal programs is nor-mally provided in annual appropriations acts. However, new budget authority is also made available through per-manent appropriations under existing laws and does not require current action by the Congress. Much of the per-manent budget authority is for trust funds, interest on the public debt, and the authority to spend offsetting collec-
tions credited to appropriation or fund accounts. For most trust funds, the budget authority is appropriated auto-matically under existing law from the available balance of the fund and equals the estimated annual obligations of the funds. For interest on the public debt, budget authority is provided automatically under a permanent appropria-tion enacted in 1847 and equals interest outlays.
Annual appropriations acts generally make budget au-thority available for obligation only during the fiscal year to which the act applies. However, they frequently allow budget authority for a particular purpose to remain avail-able for obligation for a longer period or indefinitely (that is, until expended or until the program objectives have been attained). Typically, budget authority for current op-erations is made available for only one year, and budget authority for construction and some research projects is available for a specified number of years or indefinitely. Most budget authority provided in authorizing statutes, such as for most trust funds, is available indefinitely. If budget authority is initially provided for a limited period of availability, an extension of availability would require enactment of another law (see “Reappropriation” later in this chapter).
Budget authority that is available for more than one year and not obligated in the year it becomes available is carried forward for obligation in a following year. In some cases, an account may carry forward unobligated budget authority from more than one prior year. The sum of such amounts constitutes the account’s unobligated balance. Most of these balances had been provided for specific uses such as the multiyear construction of a major project and so are not available for new programs. A small part may never be obligated or spent, primarily amounts provided for contingencies that do not occur or reserves that never have to be used.
Amounts of budget authority that have been obligated but not yet paid constitute the account’s unpaid obliga-tions. For example, in the case of salaries and wages, one to three weeks elapse between the time of obligation and the time of payment. In the case of major procurement and construction, payments may occur over a period of several years after the obligation is made. Unpaid obligations (which are made up of accounts payable and undelivered orders) net of the accounts receivable and unfilled custom-ers’ orders are defined by law as the obligated balances. Obligated balances of budget authority at the end of the year are carried forward until the obligations are paid or the balances are cancelled. (A general law provides that the obligated balance of budget authority that was made available for a definite period is automatically cancelled five years after the end of the period.) Due to such flows, a change in the amount of budget authority available in any one year may change the level of obligations and out-lays for several years to come. Conversely, a change in the amount of obligations incurred from one year to the next does not necessarily result from an equal change in the amount of budget authority available for that year and will not necessarily result in an equal change in the level of outlays in that year.
6. BUDGET CONCEPTS 67
The Congress usually makes budget authority avail-able on the first day of the fiscal year for which the appropriations act is passed. Occasionally, the appropria-tions language specifies a different timing. The language may provide an advance appropriation—budget au-thority that does not become available until one fiscal year or more beyond the fiscal year for which the ap-propriations act is passed. Forward funding is budget authority that is made available for obligation beginning in the last quarter of the fiscal year (beginning on July 1) for the financing of ongoing grant programs during the next fiscal year. This kind of funding is used mostly for ed-ucation programs, so that obligations for education grants can be made prior to the beginning of the next school year. For certain benefit programs funded by annual ap-propriations, the appropriation provides for advance funding—budget authority that is to be charged to the appropriation in the succeeding year, but which autho-rizes obligations to be incurred in the last quarter of the current fiscal year if necessary to meet benefit payments in excess of the specific amount appropriated for the year. When such authority is used, an adjustment is made to increase the budget authority for the fiscal year in which it is used and to reduce the budget authority of the suc-ceeding fiscal year.
The 2022 Budget includes $28,768 million in discre-tionary advance appropriations for 2023 and freezes them at this level in subsequent years, consistent with limits established in recent congressional budget resolu-tions. Outside of this limit, the Administration continues advance appropriations for the Department of Veterans Affairs’ medical care accounts and proposes new advance appropriations for the Department of Health and Human Services’ Indian Health Service accounts. In addition, the Administration proposes new mandatory advance appropriations for the Department of Agriculture’s Supplemental Nutrition Assistance Program. For a detailed table of accounts that have received advance ap-propriations since 2020 or for which the Budget requests advance appropriations for 2023 and beyond, please refer to the Advance Appropriations chapter in the Appendix.
Provisions of law that extend into a new fiscal year the availability of unobligated amounts that have expired or would otherwise expire are called reappropriations. Reappropriations of expired balances that are newly available for obligation in the current or budget year count as new budget authority in the fiscal year in which the balances become newly available. For example, if a 2018 appropriations act extends the availability of unob-ligated budget authority that expired at the end of 2017, new budget authority would be recorded for 2018. This scorekeeping is used because a reappropriation has ex-actly the same effect as allowing the earlier appropriation to expire at the end of 2017 and enacting a new appro-priation for 2018.
For purposes of BBEDCA and the Statutory Pay-As-You-Go Act of 2010 (discussed earlier under “Budget Enforcement’’), the budget classifies budget authority as discretionary or mandatory. This classification in-dicates whether an appropriations act or authorizing
legislation controls the amount of budget authority that is available. Generally, budget authority is discretionary if provided in an annual appropriations act and mandatory if provided in authorizing legislation. However, the bud-get authority provided in annual appropriations acts for certain specifically identified programs is also classified as mandatory by OMB and the congressional scorekeep-ers. This is because the authorizing legislation for these programs entitles beneficiaries—persons, households, or other levels of government—to receive payment, or other-wise legally obligates the Government to make payment and thereby effectively determines the amount of budget authority required, even though the payments are funded by a subsequent appropriation.
The 2022 Budget proposes two reclassifications of pro-grams that historically have been funded as discretionary. The first proposal reclassifies the appropriations for the Contract Support Costs (CSCs) and Payments for Tribal Leases accounts in the Department of Health and Human Services’ Indian Health Service and the Department of the Interior’s Bureau of Indian Affairs. Specifically, the Budget proposes that, beginning in 2023, the CSCs and Payments for Tribal Leases accounts will continue to be funded through the annual appropriations process but will be reclassified as mandatory funding. The second pro-posal reclassifies Indian water rights settlements funding at the Department of the Interior starting in 2023 by pro-viding full funding for currently enacted settlements in authorizing legislation rather than through the annual appropriations process. The Budget proposes to offset the increase in mandatory funding resulting from both re-classifications by reducing overall discretionary spending by amounts equal to baseline inflation of the programs.
Sometimes, budget authority is characterized as current or permanent. Current authority requires the Congress to act on the request for new budget authority for the year involved. Permanent authority becomes available pursu-ant to standing provisions of law without appropriations action by the Congress for the year involved. Generally, budget authority is current if an annual appropriations act provides it and permanent if authorizing legislation provides it. By and large, the current/permanent distinc-tion has been replaced by the discretionary/mandatory distinction, which is similar but not identical. Outlays are also classified as discretionary or mandatory according to the classification of the budget authority from which they flow (see “Outlays’’ later in this chapter).
The amount of budget authority recorded in the budget depends on whether the law provides a specific amount or employs a variable factor that determines the amount. It is considered definite if the law specifies a dollar amount (which may be stated as an upper limit, for ex-ample, “shall not exceed …”). It is considered indefinite if, instead of specifying an amount, the law permits the amount to be determined by subsequent circumstances. For example, indefinite budget authority is provided for interest on the public debt, payment of claims and judg-ments awarded by the courts against the United States, and many entitlement programs. Many of the laws that authorize collections to be credited to revolving, special,

68ANALYTICAL PERSPECTIVES
and trust funds make all of the collections available for expenditure for the authorized purposes of the fund, and such authority is considered to be indefinite budget au-thority because the amount of collections is not known in advance of their collection.
Obligations
Following the enactment of budget authority and the completion of required apportionment action, Government agencies incur obligations to make payments (see earlier discussion under “Budget Execution”). Agencies must record obligations when they incur a legal liability that will result in immediate or future outlays. Such obliga-tions include the current liabilities for salaries, wages, and interest; and contracts for the purchase of supplies and equipment, construction, and the acquisition of office space, buildings, and land. For Federal credit programs, obligations are recorded in an amount equal to the esti-mated subsidy cost of direct loans and loan guarantees (see “Federal Credit” later in this chapter).
Outlays
Outlays are the measure of Government spending. They are payments that liquidate obligations (other than most exchanges of financial instruments, of which the repayment of debt is the prime example). The budget re-cords outlays when obligations are paid, in the amount that is paid.
Agency, function and subfunction, and Government-wide outlay totals are stated net of offsetting collections and offsetting receipts for most budget presentations. (Offsetting receipts from a few sources do not offset any specific function, subfunction, or agency, as explained pre-viously, but only offset Government-wide totals.) Outlay totals for accounts with offsetting collections are stated both gross and net of the offsetting collections credited to the account. However, the outlay totals for special and trust funds with offsetting receipts are not stated net of the offsetting receipts. In most cases, these receipts off-set the agency, function, and subfunction totals but do not offset account-level outlays. However, when general fund payments are used to finance trust fund outlays to the public, the associated trust fund receipts are netted against the bureau totals to prevent double-counting bud-get authority and outlays at the bureau level.
The Government usually makes outlays in the form of cash (currency, checks, or electronic fund transfers). However, in some cases agencies pay obligations without disbursing cash, and the budget nevertheless records out-lays for the equivalent method. For example, the budget records outlays for the full amount of Federal employees’ salaries, even though the cash disbursed to employees is net of Federal and State income taxes withheld, retire-ment contributions, life and health insurance premiums, and other deductions. (The budget also records receipts for the amounts withheld from Federal employee pay-checks for Federal income taxes and other payments to the Government.) When debt instruments (bonds, deben-
tures, notes, or monetary credits) are used in place of cash to pay obligations, the budget records outlays financed by an increase in agency debt. For example, the budget re-cords the acquisition of physical assets through certain types of lease-purchase arrangements as though a cash disbursement were made for an outright purchase. The transaction creates a Government debt, and the cash lease payments are treated as repayments of principal and interest.
The budget records outlays for the interest on the public issues of Treasury debt securities as the interest accrues, not when the cash is paid. A small portion of Treasury debt consists of inflation-indexed securities, which feature monthly adjustments to principal for inflation and semi-annual payments of interest on the inflation-adjusted principal. As with fixed-rate securities, the budget records interest outlays as the interest accrues. The monthly ad-justment to principal is recorded, simultaneously, as an increase in debt outstanding and an outlay of interest.
Most Treasury debt securities held by trust funds and other Government accounts are in the Government ac-count series. The budget normally states the interest on these securities on a cash basis. When a Government ac-count is invested in Federal debt securities, the purchase price is usually close or identical to the par (face) value of the security. The budget generally records the investment at par value and adjusts the interest paid by Treasury and collected by the account by the difference between purchase price and par, if any.
For Federal credit programs, outlays are equal to the subsidy cost of direct loans and loan guarantees and are recorded as the underlying loans are disbursed (see “Federal Credit” later in this chapter).
The budget records refunds of receipts that result from overpayments by the public (such as income taxes with-held in excess of tax liabilities) as reductions of receipts, rather than as outlays. However, the budget records pay-ments to taxpayers for refundable tax credits (such as earned income tax credits) that exceed the taxpayer’s tax liability as outlays. Similarly, when the Government makes overpayments that are later returned to the Government, those refunds to the Government are re-corded as offsetting collections or offsetting receipts, not as governmental receipts.
Not all of the new budget authority for 2022 will be obligated or spent in 2022. Outlays during a fiscal year may liquidate obligations incurred in the same year or in prior years. Obligations, in turn, may be incurred against budget authority provided in the same year or against un-obligated balances of budget authority provided in prior years. Outlays, therefore, flow in part from budget author-ity provided for the year in which the money is spent and in part from budget authority provided for prior years. The ratio of a given year’s outlays resulting from budget authority enacted in that or a prior year to the original amount of that budget authority is referred to as the out-lay rate for that year.
As shown in the accompanying chart, $4,474 billion of outlays in 2022 (74 percent of the outlay total) will be made from that year’s $6,212 billion total of proposed new
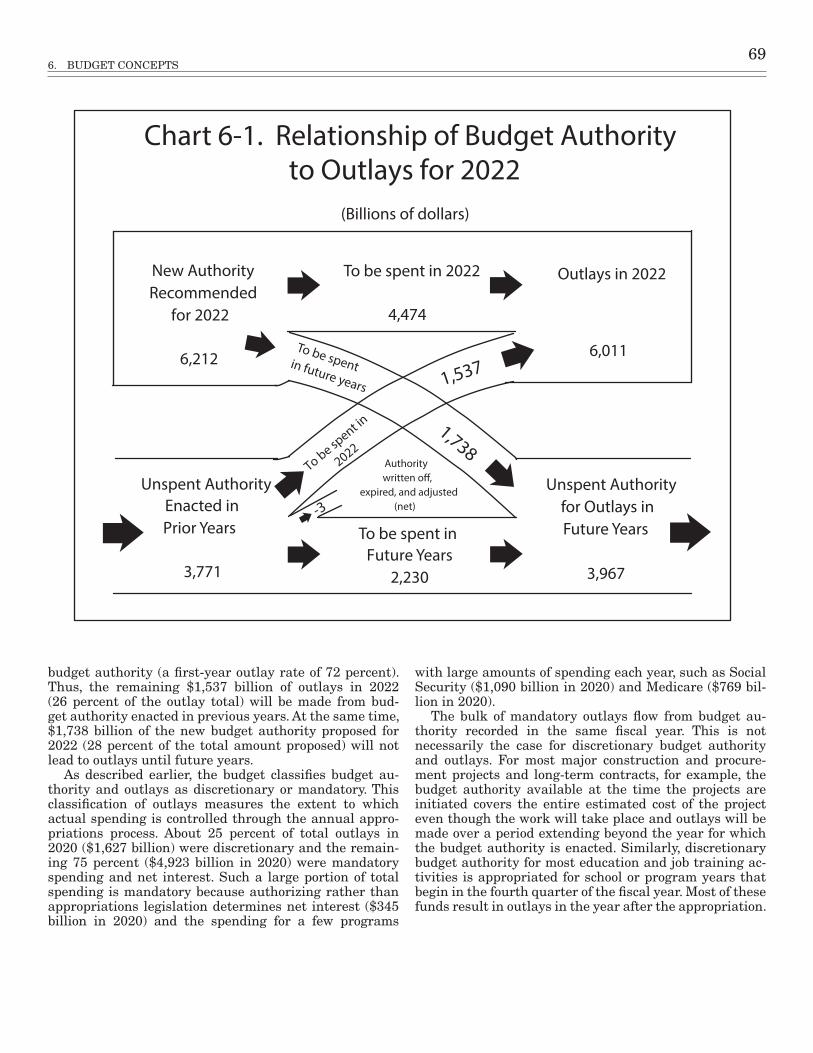
6. BUDGET CONCEPTS 69
budget authority (a first-year outlay rate of 72 percent). Thus, the remaining $1,537 billion of outlays in 2022 (26 percent of the outlay total) will be made from bud-get authority enacted in previous years. At the same time, $1,738 billion of the new budget authority proposed for 2022 (28 percent of the total amount proposed) will not lead to outlays until future years.
As described earlier, the budget classifies budget au-thority and outlays as discretionary or mandatory. This classification of outlays measures the extent to which actual spending is controlled through the annual appro-priations process. About 25 percent of total outlays in 2020 ($1,627 billion) were discretionary and the remain-ing 75 percent ($4,923 billion in 2020) were mandatory spending and net interest. Such a large portion of total spending is mandatory because authorizing rather than appropriations legislation determines net interest ($345 billion in 2020) and the spending for a few programs
with large amounts of spending each year, such as Social Security ($1,090 billion in 2020) and Medicare ($769 bil-lion in 2020).
The bulk of mandatory outlays flow from budget au-thority recorded in the same fiscal year. This is not necessarily the case for discretionary budget authority and outlays. For most major construction and procure-ment projects and long-term contracts, for example, the budget authority available at the time the projects are initiated covers the entire estimated cost of the project even though the work will take place and outlays will be made over a period extending beyond the year for which the budget authority is enacted. Similarly, discretionary budget authority for most education and job training ac-tivities is appropriated for school or program years that begin in the fourth quarter of the fiscal year. Most of these funds result in outlays in the year after the appropriation.
Unspent AuthorityEnacted in Prior Years
3,771
Unspent Authorityfor Outlays inFuture Years
3,967
To be spent in Future Years
2,230
Authority
expired, and adjusted(net)
New AuthorityRecommended
for 2022
6,212
To be spent in 2022
4,474
Chart 6-1. Relationship of Budget Authority to Outlays for 2022
(Billions of dollars)
-3
1,537To be spent in future years
1,738To be sp
ent in
2022
Outlays in 2022
6,011

70ANALYTICAL PERSPECTIVES
FEDERAL CREDIT
Some Government programs provide assistance through direct loans or loan guarantees. A direct loan is a disbursement of funds by the Government to a non-Fed-eral borrower under a contract that requires repayment of such funds with or without interest and includes eco-nomically equivalent transactions, such as the sale of Federal assets on credit terms. A loan guarantee is any guarantee, insurance, or other pledge with respect to the payment of all or a part of the principal or interest on any debt obligation of a non-Federal borrower to a non-Federal lender. The Federal Credit Reform Act of 1990, as amended (FCRA), prescribes the budgetary treatment for Federal credit programs. Under this treatment, the bud-get records obligations and outlays up front, for the net cost to the Government (subsidy cost), rather than record-ing the cash flows year by year over the term of the loan. FCRA treatment allows the comparison of direct loans and loan guarantees to each other, and to other methods of delivering assistance, such as grants.
The cost of direct loans and loan guarantees, sometimes called the “subsidy cost,’’ is estimated as the present val-ue of expected payments to and from the public over the term of the loan, discounted using appropriate Treasury interest rates.3 Similar to most other kinds of programs, agencies can make loans or guarantee loans only if the Congress has appropriated funds sufficient to cover the subsidy costs, or provided a limitation in an appropria-tions act on the amount of direct loans or loan guarantees that can be made.
The budget records the subsidy cost to the Government arising from direct loans and loan guarantees—the bud-get authority and outlays—in credit program accounts. When a Federal agency disburses a direct loan or when a non-Federal lender disburses a loan guaranteed by a Federal agency, the program account disburses or outlays an amount equal to the estimated present value cost, or subsidy, to a non-budgetary credit financing account. The financing accounts record the actual transactions with the public. For a few programs, the estimated sub-sidy cost is negative because the present value of expected Government collections exceeds the present value of ex-pected payments to the public over the term of the loan. In such cases, the financing account pays the estimated subsidy cost to the program’s negative subsidy receipt account, where it is recorded as an offsetting receipt. In a few cases, the offsetting receipts of credit accounts are dedicated to a special fund established for the program and are available for appropriation for the program.
The agencies responsible for credit programs must reestimate the subsidy cost of the outstanding portfolio of direct loans and loan guarantees each year. If the es-timated cost increases, the program account makes an additional payment to the financing account equal to the change in cost. If the estimated cost decreases, the financing account pays the difference to the program’s
3 Present value is a standard financial concept that considers the time-value of money. That is, it accounts for the fact that a given sum of money is worth more today than the same sum would be worth in the future because interest can be earned.
downward reestimate receipt account, where it is record-ed as an offsetting receipt. The FCRA provides permanent indefinite appropriations to pay for upward reestimates.
If the Government modifies the terms of an outstand-ing direct loan or loan guarantee in a way that increases the cost as the result of a law or the exercise of adminis-trative discretion under existing law, the program account records obligations for the increased cost and outlays the amount to the financing account. As with the original sub-sidy cost, agencies may incur modification costs only if the Congress has appropriated funds to cover them. A modi-fication may also reduce costs, in which case the amounts are generally returned to the general fund, as the financ-ing account makes a payment to the program’s negative subsidy receipt account.
Credit financing accounts record all cash flows arising from direct loan obligations and loan guarantee commit-ments. Such cash flows include all cash flows to and from the public, including direct loan disbursements and re-payments, loan guarantee default payments, fees, and recoveries on defaults. Financing accounts also record intragovernmental transactions, such as the receipt of subsidy cost payments from program accounts, borrowing and repayments of Treasury debt to finance program ac-tivities, and interest paid to or received from the Treasury. The cash flows of direct loans and of loan guarantees are recorded in separate financing accounts for programs that provide both types of credit. The budget totals exclude the transactions of the financing accounts because they are not a cost to the Government. However, since financing accounts record all credit cash flows to and from the pub-lic, they affect the means of financing a budget surplus or deficit (see “Credit Financing Accounts” in the next sec-tion). The budget documents display the transactions of the financing accounts, together with the related program accounts, for information and analytical purposes.
The budgetary treatment of direct loan obligations and loan guarantee commitments made prior to 1992 was grandfathered in under FCRA. The budget records these on a cash basis in credit liquidating accounts, the same as they were recorded before FCRA was enacted. However, this exception ceases to apply if the direct loans or loan guarantees are modified as described above. In that case, the budget records the subsidy cost or savings of the modification, as appropriate, and begins to account for the associated transactions under FCRA treatment for direct loan obligations and loan guarantee commitments made in 1992 or later.
Under the authority provided in various acts, certain ac-tivities that do not meet the definition in FCRA of a direct loan or loan guarantee are reflected pursuant to FCRA. For example, the Emergency Economic Stabilization Act of 2008 (EESA) created the Troubled Asset Relief Program (TARP) under the Department of the Treasury, and autho-rized Treasury to purchase or guarantee troubled assets until October 3, 2010. Under the TARP, Treasury pur-chased equity interests in financial institutions. Section 123 of the EESA provides the Administration the author-

6. BUDGET CONCEPTS 71
ity to treat these equity investments on a FCRA basis, recording outlays for the subsidy as is done for direct loans and loan guarantees. The budget reflects the cost to the Government of TARP direct loans, loan guarantees, and equity investments consistent with the FCRA and Section 123 of EESA, which requires an adjustment to the FCRA discount rate for market risks. Similarly, Treasury equity
purchases under the Small Business Lending Fund are treated pursuant to the FCRA, as provided by the Small Business Jobs Act of 2010. The Coronavirus Aid, Relief, and Economic Security (CARES) Act authorized certain investments in programs and facilities established by the Federal Reserve. Section 4003 of the CARES Act provided that these amounts be treated in accordance with FCRA.
BUDGET DEFICIT OR SURPLUS AND MEANS OF FINANCING
When outlays exceed receipts, the difference is a deficit, which the Government finances primarily by borrowing. When receipts exceed outlays, the difference is a surplus, and the Government automatically uses the surplus pri-marily to reduce debt. The Federal debt held by the public is approximately the cumulative amount of borrowing to finance deficits, less repayments from surpluses, over the Nation’s history.
Borrowing is not exactly equal to the deficit, and debt repayment is not exactly equal to the surplus, because of the other transactions affecting borrowing from the pub-lic, or other means of financing, such as those discussed in this section. The factors included in the other means of fi-nancing can either increase or decrease the Government’s borrowing needs (or decrease or increase its ability to repay debt). For example, the change in the Treasury op-erating cash balance is a factor included in other means of financing. Holding receipts and outlays constant, in-creases in the cash balance increase the Government’s need to borrow or reduce the Government’s ability to re-pay debt, and decreases in the cash balance decrease the need to borrow or increase the ability to repay debt. In some years, the net effect of the other means of financing is minor relative to the borrowing or debt repayment; in other years, the net effect may be significant.
Borrowing and Debt Repayment
The budget treats borrowing and debt repayment as a means of financing, not as receipts and outlays. If bor-rowing were defined as receipts and debt repayment as outlays, the budget would always be virtually balanced by definition. This rule applies both to borrowing in the form of Treasury securities and to specialized borrowing in the form of agency securities. The rule reflects the common-sense understanding that lending or borrowing is just an exchange of financial assets of equal value—cash for Treasury securities—and so is fundamentally different from, say, paying taxes, which involve a net transfer of financial assets from taxpayers to the Government.
In 2020, the Government borrowed $4,216 billion from the public, bringing debt held by the public to $21,017 bil-lion. This borrowing financed the $3,129 billion deficit in that year, as well as the net impacts of the other means of financing, such as changes in cash balances and other accounts discussed below.
In addition to selling debt to the public, the Department of the Treasury issues debt to Government accounts, primarily trust funds that are required by law to invest in Treasury
securities. Issuing and redeeming this debt does not affect the means of financing, because these transactions occur be-tween one Government account and another and thus do not raise or use any cash for the Government as a whole.
(See Chapter 4 of this volume, “Federal Borrowing and Debt,” for a fuller discussion of this topic.)
Exercise of Monetary Power
Seigniorage is the profit from coining money. It is the dif-ference between the value of coins as money and their cost of production. Seigniorage reduces the Government’s need to borrow. Unlike the payment of taxes or other receipts, it does not involve a transfer of financial assets from the public. Instead, it arises from the exercise of the Government’s pow-er to create money and the public’s desire to hold financial assets in the form of coins. Therefore, the budget excludes seigniorage from receipts and treats it as a means of financ-ing other than borrowing from the public. The budget also treats proceeds from the sale of gold as a means of financing, since the value of gold is determined by its value as a mon-etary asset rather than as a commodity.
Credit Financing Accounts
The budget records the net cash flows of credit programs in credit financing accounts. These accounts in-clude the transactions for direct loan and loan guarantee programs, as well as the equity purchase programs under TARP that are recorded on a credit basis consistent with Section 123 of EESA. Financing accounts also record eq-uity purchases under the Small Business Lending Fund consistent with the Small Business Jobs Act of 2010, and certain investments in programs and facilities established by the Federal Reserve consistent with Section 4003 of the CARES Act. Credit financing accounts are excluded from the budget because they are not allocations of re-sources by the Government (see “Federal Credit” earlier in this chapter). However, even though they do not affect the surplus or deficit, they can either increase or decrease the Government’s need to borrow. Therefore, they are re-corded as a means of financing.
Financing account disbursements to the public increase the requirement for Treasury borrowing in the same way as an increase in budget outlays. Financing account re-ceipts from the public can be used to finance the payment of the Government’s obligations and therefore reduce the requirement for Treasury borrowing from the public in the same way as an increase in budget receipts.

72ANALYTICAL PERSPECTIVES
Deposit Fund Account Balances
The Treasury uses non-budgetary accounts, called deposit funds, to record cash held temporarily until own-ership is determined (for example, earnest money paid by bidders for mineral leases) or cash held by the Government as agent for others (for example, State and local income taxes withheld from Federal employees’ salaries and not yet paid to the State or local government or amounts held in the Thrift Savings Fund, a defined contribution pen-sion fund held and managed in a fiduciary capacity by the Government). Deposit fund balances may be held in the form of either invested or uninvested balances. To the extent that they are not invested, changes in the balances are available to finance expenditures without a change in borrowing and are recorded as a means of financing other than borrowing from the public. To the extent that they are invested in Federal debt, changes in the balances are reflected as borrowing from the public (in lieu of borrow-ing from other parts of the public) and are not reflected as a separate means of financing.
United States Quota Subscriptions to the International Monetary Fund (IMF)
The United States participates in the IMF primarily through a quota subscription. Financial transactions with the IMF are exchanges of monetary assets. When the IMF temporarily draws dollars from the U.S. quota, the United States simultaneously receives an equal, offsetting, inter-
est-bearing, Special Drawing Right (SDR)-denominated claim in the form of an increase in the U.S. reserve po-sition in the IMF. The U.S. reserve position in the IMF increases when the United States makes deposits in its account at the IMF when the IMF temporarily uses mem-bers’ quota resources to make loans and decreases when the IMF returns funds to the United States as borrowing countries repay the IMF (and the cash flows from the re-serve position to the Treasury letter of credit).
The U.S. transactions with the IMF under the quota subscriptions do not increase the deficit in any year, and the budget excludes these transfers from budget outlays and receipts, consistent with the budgetary treatment for exchanges of monetary assets recommended by the President’s Commission on Budget Concepts in 1967. The only exception is that interest earnings on U.S. deposits in its IMF account are recorded as offsetting receipts. Other exchanges of monetary assets, such as deposits of cash in Treasury accounts at commer-cial banks, are likewise not included in the Budget. However, the Congress has historically expressed in-terest in showing some kind of budgetary effect for U.S. transactions with the IMF.4
4 For a more detailed discussion of the history of the budgetary treatment of U.S. participation in the quota and New Arrangements to Borrow (NAB), see pages 139-141 in the Analytical Perspectives volume of the 2016 Budget. As discussed in that volume, the budgetary treat-ment of the U.S. participation in the NAB is similar to the quota. See pages 85-86 of the Analytical Perspectives volume of the 2018 Budget for a more complete discussion of the changes made to the budgetary presentation of quota increases in Title IX of the Department of State, Foreign Operations, and Related Programs Appropriations Act, 2016.
FEDERAL EMPLOYMENT
The Budget includes information on civilian and mili-tary employment. It also includes information on related personnel compensation and benefits and on staffing re-quirements at overseas missions. Chapter 5 of this volume, “Strengthening the Federal Workforce,’’ provides employ-
ment levels measured in full-time equivalents (FTEs). Agency FTEs are the measure of total hours worked by an agency’s Federal employees divided by the total number of one person’s compensable work hours in a fiscal year.
BASIS FOR BUDGET FIGURES
Data for the Past Year
The past year column (2020) generally presents the actual transactions and balances as recorded in agency ac-counts and as summarized in the central financial reports prepared by the Department of the Treasury for the most recently completed fiscal year. Occasionally, the Budget re-ports corrections to data reported erroneously to Treasury but not discovered in time to be reflected in Treasury’s published data. In addition, in certain cases the Budget has a broader scope and includes financial transactions that are not reported to Treasury (see Chapter 19 of this volume, “Comparison of Actual to Estimated Totals,” for a summary of these differences).
Data for the Current Year
The current year column (2021) includes estimates of transactions and balances based on the amounts of bud-getary resources that were available when the Budget was prepared. In cases where the Budget proposes policy changes effective in the current year, the data will also reflect the budgetary effect of those proposed changes.
Data for the Budget Year
The Budget year column (2022) includes estimates of transactions and balances based on the amounts of budgetary resources that are estimated to be available, including new budget authority requested under current
6. BUDGET CONCEPTS 73
authorizing legislation, and amounts estimated to result from changes in authorizing legislation and tax laws.
The Budget Appendix generally includes the ap-propriations language for the amounts proposed to be appropriated under current authorizing legislation. In a few cases, this language is transmitted later because the exact requirements are unknown when the budget is transmitted. The Appendix generally does not include appropriations language for the amounts that will be requested under proposed legislation; that language is usually transmitted later, after the legislation is enact-ed. Some tables in the budget identify the items for later transmittal and the related outlays separately. Estimates of the total requirements for the Budget year include both the amounts requested with the transmittal of the budget and the amounts planned for later transmittal.
Data for the Outyears
The budget presents estimates for each of the nine years beyond the budget year (2023 through 2031) in or-der to reflect the effect of budget decisions on objectives and plans over a longer period.
Allowances
The budget may include lump-sum allowances to cover certain transactions that are expected to increase or de-crease budget authority, outlays, or receipts but are not, for various reasons, reflected in the program details. For example, the budget might include an allowance to show the effect on the budget totals of a proposal that would af-fect many accounts by relatively small amounts, in order to avoid unnecessary detail in the presentations for the individual accounts.
Baseline
The Budget baseline is an estimate of the receipts, outlays, and deficits or surpluses that would occur if no changes were made to current laws and policies during the period covered by the Budget. The baseline assumes that receipts and mandatory spending, which generally are authorized on a permanent basis, will continue in the future consistent with current law and policy. The baseline assumes that the future funding for most discre-tionary programs, which generally are funded annually, will equal the most recently enacted appropriation, ad-justed for inflation.
Baseline outlays represent the amount of resources that the Government would use over the period covered by the Budget on the basis of laws currently enacted.
The baseline serves several useful purposes:• It may warn of future problems, either for Govern-
ment fiscal policy as a whole or for individual tax and spending programs.
• It may provide a starting point for formulating the President’s Budget.
• It may provide a benchmark against which the Pres-ident’s Budget and alternative proposals can be com-pared to assess the magnitude of proposed changes.
The baseline rules in BBEDCA provide that funding for discretionary programs is inflated from the most re-cent enacted appropriations using specified inflation rates. Occasionally, exceptions are needed to provide more meaningful comparisons for discretionary spending. This year, the baseline removes the extension of certain emer-gency spending provided to address the public health and economic effects of the COVID-19 public health emergency (funding that was provided and designated as emergency funding for 2021 in Division M of Public Law 116-260). (Chapter 17 of this volume, “Current Services Estimates,” provides more information on the baseline.)
PRINCIPAL BUDGET LAWS
The Budget and Accounting Act of 1921 created the core of the current Federal budget process. Before enactment of this law, there was no annual centralized budgeting in the Executive Branch. Federal Government agencies usu-ally sent budget requests independently to congressional committees with no coordination of the various requests in formulating the Federal Government’s budget. The Budget and Accounting Act required the President to co-ordinate the budget requests for all Government agencies and to send a comprehensive budget to the Congress. The Congress has amended the requirements many times and portions of the Act are codified in Title 31, United States Code. The major laws that govern the budget process are as follows:
Article 1, section 8, clause 1 of the Constitution, which empowers the Congress to lay and collect taxes.
Article 1, section 9, clause 7 of the Constitution, which requires appropriations in law before money may be spent from the Treasury and the publication of a reg-ular statement of the receipts and expenditures of all public money.
Antideficiency Act (codified in Chapters 13 and 15 of Title 31, United States Code), which prescribes rules and procedures for budget execution.
Balanced Budget and Emergency Deficit Control Act of 1985, as amended, which establishes limits on discretionary spending and provides mechanisms for en-forcing mandatory spending and discretionary spending limits.
Chapter 11 of Title 31, United States Code, which prescribes procedures for submission of the President’s budget and information to be contained in it.
74ANALYTICAL PERSPECTIVES
Congressional Budget and Impoundment Control Act of 1974 (Public Law 93–344), as amended. This Act comprises the:
• Congressional Budget Act of 1974, as amended, which prescribes the congressional budget process;
• Impoundment Control Act of 1974, as amended, which controls certain aspects of budget execution; and
• Federal Credit Reform Act of 1990, as amended (2 USC 661–661f), which the Budget Enforcement Act of 1990 included as an amendment to the Con-gressional Budget Act to prescribe the budget treat-ment for Federal credit programs.
Chapter 31 of Title 31, United States Code, which provides the authority for the Secretary of the Treasury
to issue debt to finance the deficit and establishes a statu-tory limit on the level of the debt.
Chapter 33 of Title 31, United States Code, which establishes the Department of the Treasury as the author-ity for making disbursements of public funds, with the authority to delegate that authority to executive agencies in the interests of economy and efficiency.
Government Performance and Results Act of 1993 (Public Law 103–62, as amended) which emphasizes managing for results. It requires agencies to prepare strategic plans, annual performance plans, and annual performance reports.
Statutory Pay-As-You-Go Act of 2010, which es-tablishes a budget enforcement mechanism generally requiring that direct spending and revenue legislation enacted into law not increase the deficit.
GLOSSARY OF BUDGET TERMS
Account refers to a separate financial reporting unit used by the Federal Government to record budget author-ity, outlays and income for budgeting or management information purposes as well as for accounting purposes. All budget (and off-budget) accounts are classified as be-ing either expenditure or receipt accounts and by fund group. Budget (and off-budget) transactions fall within either of two fund groups: (1) Federal funds and (2) trust funds. (Cf. Federal funds group and trust funds group.)
Accrual method of measuring cost means an ac-counting method that records cost when the liability is incurred. As applied to Federal employee retirement ben-efits, accrual costs are recorded when the benefits are earned rather than when they are paid at some time in the future. The accrual method is used in part to provide data that assists in agency policymaking, but not used in presenting the overall budget of the United States Government.
Advance appropriation means appropriations of new budget authority that become available one or more fiscal years beyond the fiscal year for which the appro-priation act was passed.
Advance funding means appropriations of budget au-thority provided in an appropriations act to be used, if necessary, to cover obligations incurred late in the fiscal year for benefit payments in excess of the amount spe-cifically appropriated in the act for that year, where the budget authority is charged to the appropriation for the program for the fiscal year following the fiscal year for which the appropriations act is passed.
Agency means a department or other establishment of the Government.
Allowance means a lump-sum included in the budget to represent certain transactions that are expected to in-crease or decrease budget authority, outlays, or receipts but that are not, for various reasons, reflected in the pro-gram details.
Balanced Budget and Emergency Deficit Control Act of 1985 (BBEDCA) refers to legislation that altered the budget process, primarily by replacing the earlier fixed
targets for annual deficits with a Pay-As-You-Go require-ment for new tax or mandatory spending legislation and with caps on annual discretionary funding. The Statutory Pay-As-You-Go Act of 2010, which is a standalone piece of legislation that did not directly amend the BBEDCA, re-instated a statutory pay-as-you-go rule for revenues and mandatory spending legislation, and the Budget Control Act of 2011, which did amend BBEDCA, reinstated dis-cretionary caps on budget authority.
Balances of budget authority means the amounts of budget authority provided in previous years that have not been outlayed.
Baseline means a projection of the estimated receipts, outlays, and deficit or surplus that would result from con-tinuing current law or current policies through the period covered by the budget.
Budget means the Budget of the United States Government, which sets forth the President’s comprehen-sive financial plan for allocating resources and indicates the President’s priorities for the Federal Government.
Budget authority (BA) means the authority provided by law to incur financial obligations that will result in outlays. (For a description of the several forms of budget authority, see “Budget Authority and Other Budgetary Resources’’ earlier in this chapter.)
Budget Control Act of 2011 refers to legislation that, among other things, amended BBEDCA to reinstate dis-cretionary spending limits on budget authority through 2021 and restored the process for enforcing those spend-ing limits. The legislation also increased the statutory debt ceiling; created a Joint Select Committee on Deficit Reduction that was instructed to develop a bill to reduce the Federal deficit by at least $1.5 trillion over a 10-year period; and provided a process to implement alternative spending reductions in the event that legislation achiev-ing at least $1.2 trillion of deficit reduction was not enacted.
Budget resolution—see concurrent resolution on the budget.

6. BUDGET CONCEPTS 75
Budget totals mean the totals included in the bud-get for budget authority, outlays, receipts, and the surplus or deficit. Some presentations in the budget distinguish on-budget totals from off-budget totals. On-budget totals reflect the transactions of all Federal Government enti-ties except those excluded from the budget totals by law. Off-budget totals reflect the transactions of Government entities that are excluded from the on-budget totals by law. Under current law, the off-budget totals include the Social Security trust funds (Federal Old-Age and Survivors Insurance and Federal Disability Insurance Trust Funds) and the Postal Service Fund. The budget combines the on- and off-budget totals to derive unified (i.e. consolidated) totals for Federal activity.
Budget year refers to the fiscal year for which the bud-get is being considered, that is, with respect to a session of Congress, the fiscal year of the Government that starts on October 1 of the calendar year in which that session of the Congress begins.
Budgetary resources mean amounts available to in-cur obligations in a given year. The term comprises new budget authority and unobligated balances of budget au-thority provided in previous years.
Cap means the legal limits for each fiscal year under BBEDCA on the budget authority and outlays (only if ap-plicable) provided by discretionary appropriations.
Cap adjustment means either an increase or a de-crease that is permitted to the statutory cap limits for each fiscal year under BBEDCA on the budget authority and outlays (only if applicable) provided by discretion-ary appropriations only if certain conditions are met. These conditions may include providing for a base level of funding, a designation of the increase or decrease by the Congress, (and in some circumstances, the President) pursuant to a section of the BBEDCA, or a change in con-cepts and definitions of funding under the cap. Changes in concepts and definitions require consultation with the Congressional Appropriations and Budget Committees. As noted above, while there are no discretionary caps in place for 2022, the 2022 Budget retains several cap adjustments as “allocation adjustments” to be used pursu-ant to the Congressional Budget Act in the Congressional Budget Resolution.
Cash equivalent transaction means a transaction in which the Government makes outlays or receives col-lections in a form other than cash or the cash does not accurately measure the cost of the transaction. (For exam-ples, see the section on “Outlays’’ earlier in this chapter.)
Collections mean money collected by the Government that the budget records as a governmental receipt, an off-setting collection, or an offsetting receipt.
Concurrent resolution on the budget refers to the concurrent resolution adopted by the Congress to set bud-getary targets for appropriations, mandatory spending legislation, and tax legislation. These concurrent reso-lutions are required by the Congressional Budget Act of 1974, and are generally adopted annually.
Continuing resolution means an appropriations act that provides for the ongoing operation of the Government in the absence of enacted appropriations.
Cost refers to legislation or administrative actions that increase outlays or decrease receipts. (Cf. savings.)
Credit program account means a budget account that receives and obligates appropriations to cover the subsidy cost of a direct loan or loan guarantee and dis-burses the subsidy cost to a financing account.
Current services estimate—see Baseline.Debt held by the public means the cumulative
amount of money the Federal Government has borrowed from the public and not repaid.
Debt held by the public net of financial assets means the cumulative amount of money the Federal Government has borrowed from the public and not repaid, minus the current value of financial assets such as loan assets, bank deposits, or private-sector securities or equi-ties held by the Government and plus the current value of financial liabilities other than debt.
Debt held by Government accounts means the debt the Department of the Treasury owes to accounts within the Federal Government. Most of it results from the sur-pluses of the Social Security and other trust funds, which are required by law to be invested in Federal securities.
Debt limit means the maximum amount of Federal debt that may legally be outstanding at any time. It in-cludes both the debt held by the public and the debt held by Government accounts, but without accounting for off-setting financial assets. When the debt limit is reached, the Government cannot borrow more money until the Congress has enacted a law to increase the limit.
Deficit means the amount by which outlays exceed receipts in a fiscal year. It may refer to the on-budget, off-budget, or unified budget deficit.
Direct loan means a disbursement of funds by the Government to a non-Federal borrower under a con-tract that requires the repayment of such funds with or without interest. The term includes the purchase of, or participation in, a loan made by another lender. The term also includes the sale of a Government asset on credit terms of more than 90 days duration as well as financing arrangements for other transactions that defer payment for more than 90 days. It also includes loans financed by the Federal Financing Bank (FFB) pursuant to agency loan guarantee authority. The term does not include the acquisition of a federally guaranteed loan in satisfaction of default or other guarantee claims or the price support “loans” of the Commodity Credit Corporation. (Cf. loan guarantee.)
Direct spending—see mandatory spending.Disaster funding means a discretionary appropria-
tion that is enacted that the Congress designates as being for disaster relief. Such amounts are a cap adjustment to the limits on discretionary spending under BBEDCA. The total adjustment for this purpose cannot exceed a ceiling for a particular year that is defined as the total of the average funding provided for disaster relief over the pre-vious 10 years (excluding the highest and lowest years) and the unused amount of the prior year’s ceiling (exclud-ing the portion of the prior year’s ceiling that was itself due to any unused amount from the year before). Disaster relief is defined as activities carried out pursuant to a de-
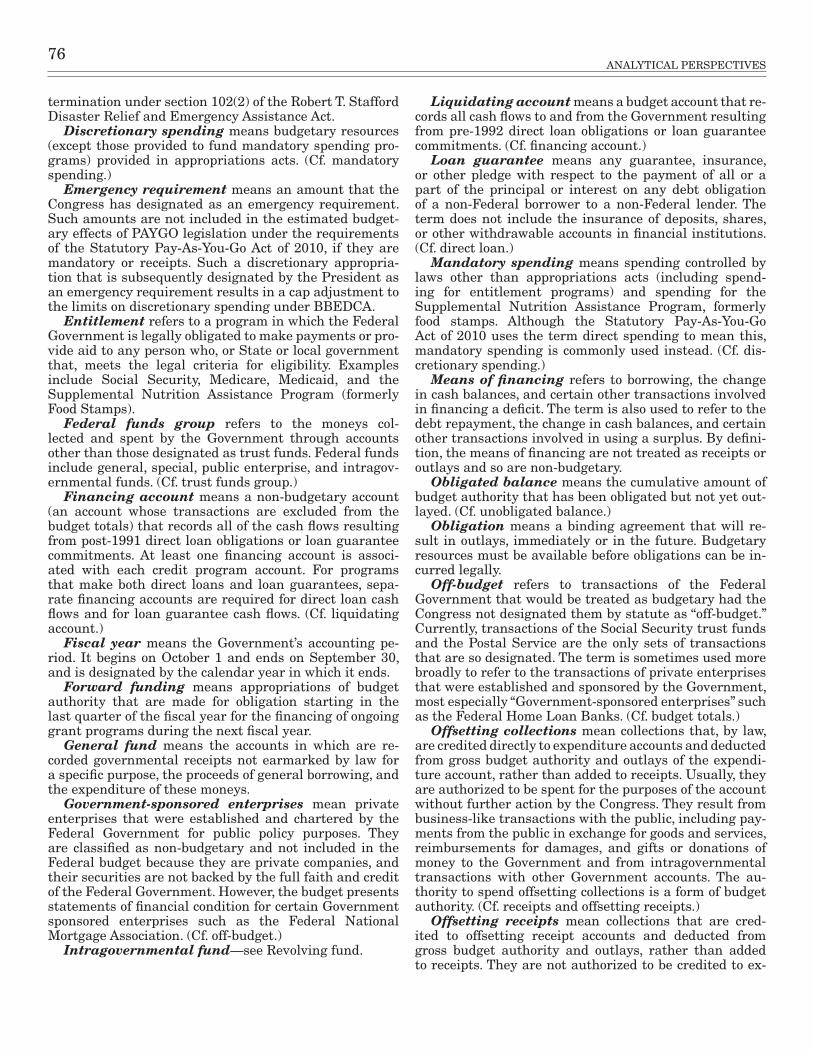
76ANALYTICAL PERSPECTIVES
termination under section 102(2) of the Robert T. Stafford Disaster Relief and Emergency Assistance Act.
Discretionary spending means budgetary resources (except those provided to fund mandatory spending pro-grams) provided in appropriations acts. (Cf. mandatory spending.)
Emergency requirement means an amount that the Congress has designated as an emergency requirement. Such amounts are not included in the estimated budget-ary effects of PAYGO legislation under the requirements of the Statutory Pay-As-You-Go Act of 2010, if they are mandatory or receipts. Such a discretionary appropria-tion that is subsequently designated by the President as an emergency requirement results in a cap adjustment to the limits on discretionary spending under BBEDCA.
Entitlement refers to a program in which the Federal Government is legally obligated to make payments or pro-vide aid to any person who, or State or local government that, meets the legal criteria for eligibility. Examples include Social Security, Medicare, Medicaid, and the Supplemental Nutrition Assistance Program (formerly Food Stamps).
Federal funds group refers to the moneys col-lected and spent by the Government through accounts other than those designated as trust funds. Federal funds include general, special, public enterprise, and intragov-ernmental funds. (Cf. trust funds group.)
Financing account means a non-budgetary account (an account whose transactions are excluded from the budget totals) that records all of the cash flows resulting from post-1991 direct loan obligations or loan guarantee commitments. At least one financing account is associ-ated with each credit program account. For programs that make both direct loans and loan guarantees, sepa-rate financing accounts are required for direct loan cash flows and for loan guarantee cash flows. (Cf. liquidating account.)
Fiscal year means the Government’s accounting pe-riod. It begins on October 1 and ends on September 30, and is designated by the calendar year in which it ends.
Forward funding means appropriations of budget authority that are made for obligation starting in the last quarter of the fiscal year for the financing of ongoing grant programs during the next fiscal year.
General fund means the accounts in which are re-corded governmental receipts not earmarked by law for a specific purpose, the proceeds of general borrowing, and the expenditure of these moneys.
Government-sponsored enterprises mean private enterprises that were established and chartered by the Federal Government for public policy purposes. They are classified as non-budgetary and not included in the Federal budget because they are private companies, and their securities are not backed by the full faith and credit of the Federal Government. However, the budget presents statements of financial condition for certain Government sponsored enterprises such as the Federal National Mortgage Association. (Cf. off-budget.)
Intragovernmental fund—see Revolving fund.
Liquidating account means a budget account that re-cords all cash flows to and from the Government resulting from pre-1992 direct loan obligations or loan guarantee commitments. (Cf. financing account.)
Loan guarantee means any guarantee, insurance, or other pledge with respect to the payment of all or a part of the principal or interest on any debt obligation of a non-Federal borrower to a non-Federal lender. The term does not include the insurance of deposits, shares, or other withdrawable accounts in financial institutions. (Cf. direct loan.)
Mandatory spending means spending controlled by laws other than appropriations acts (including spend-ing for entitlement programs) and spending for the Supplemental Nutrition Assistance Program, formerly food stamps. Although the Statutory Pay-As-You-Go Act of 2010 uses the term direct spending to mean this, mandatory spending is commonly used instead. (Cf. dis-cretionary spending.)
Means of financing refers to borrowing, the change in cash balances, and certain other transactions involved in financing a deficit. The term is also used to refer to the debt repayment, the change in cash balances, and certain other transactions involved in using a surplus. By defini-tion, the means of financing are not treated as receipts or outlays and so are non-budgetary.
Obligated balance means the cumulative amount of budget authority that has been obligated but not yet out-layed. (Cf. unobligated balance.)
Obligation means a binding agreement that will re-sult in outlays, immediately or in the future. Budgetary resources must be available before obligations can be in-curred legally.
Off-budget refers to transactions of the Federal Government that would be treated as budgetary had the Congress not designated them by statute as “off-budget.” Currently, transactions of the Social Security trust funds and the Postal Service are the only sets of transactions that are so designated. The term is sometimes used more broadly to refer to the transactions of private enterprises that were established and sponsored by the Government, most especially “Government-sponsored enterprises” such as the Federal Home Loan Banks. (Cf. budget totals.)
Offsetting collections mean collections that, by law, are credited directly to expenditure accounts and deducted from gross budget authority and outlays of the expendi-ture account, rather than added to receipts. Usually, they are authorized to be spent for the purposes of the account without further action by the Congress. They result from business-like transactions with the public, including pay-ments from the public in exchange for goods and services, reimbursements for damages, and gifts or donations of money to the Government and from intragovernmental transactions with other Government accounts. The au-thority to spend offsetting collections is a form of budget authority. (Cf. receipts and offsetting receipts.)
Offsetting receipts mean collections that are cred-ited to offsetting receipt accounts and deducted from gross budget authority and outlays, rather than added to receipts. They are not authorized to be credited to ex-
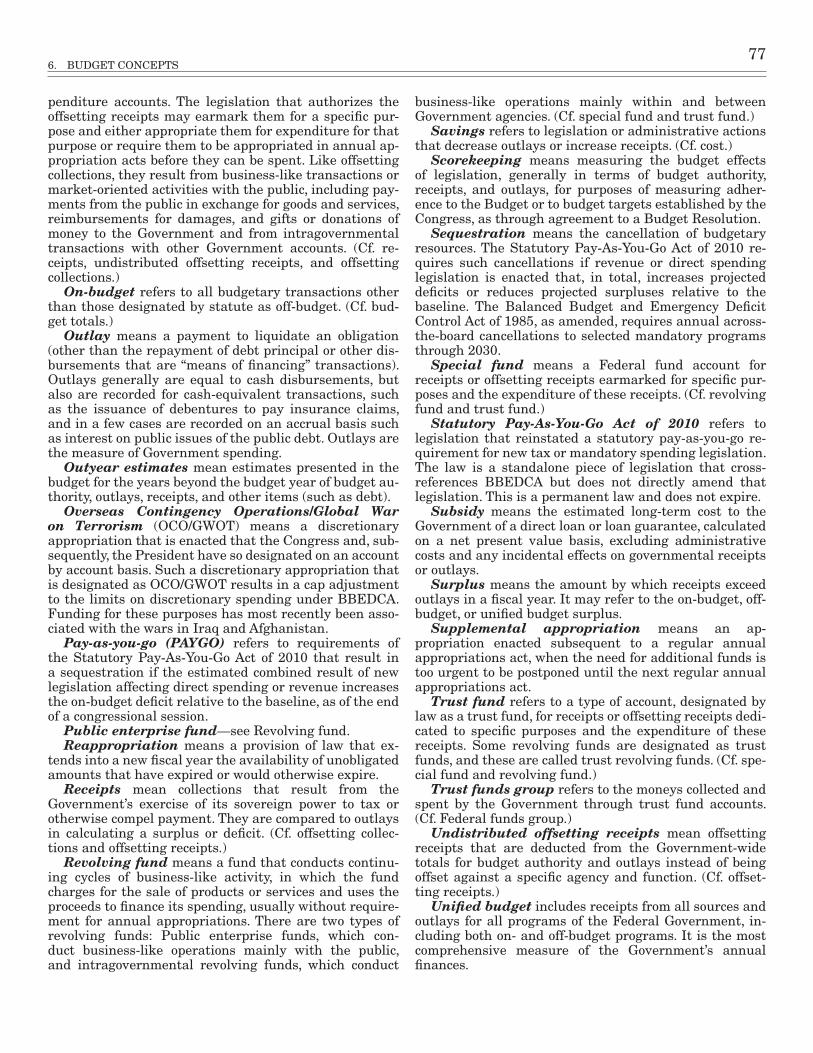
6. BUDGET CONCEPTS 77
penditure accounts. The legislation that authorizes the offsetting receipts may earmark them for a specific pur-pose and either appropriate them for expenditure for that purpose or require them to be appropriated in annual ap-propriation acts before they can be spent. Like offsetting collections, they result from business-like transactions or market-oriented activities with the public, including pay-ments from the public in exchange for goods and services, reimbursements for damages, and gifts or donations of money to the Government and from intragovernmental transactions with other Government accounts. (Cf. re-ceipts, undistributed offsetting receipts, and offsetting collections.)
On-budget refers to all budgetary transactions other than those designated by statute as off-budget. (Cf. bud-get totals.)
Outlay means a payment to liquidate an obligation (other than the repayment of debt principal or other dis-bursements that are “means of financing” transactions). Outlays generally are equal to cash disbursements, but also are recorded for cash-equivalent transactions, such as the issuance of debentures to pay insurance claims, and in a few cases are recorded on an accrual basis such as interest on public issues of the public debt. Outlays are the measure of Government spending.
Outyear estimates mean estimates presented in the budget for the years beyond the budget year of budget au-thority, outlays, receipts, and other items (such as debt).
Overseas Contingency Operations/Global War on Terrorism (OCO/GWOT) means a discretionary appropriation that is enacted that the Congress and, sub-sequently, the President have so designated on an account by account basis. Such a discretionary appropriation that is designated as OCO/GWOT results in a cap adjustment to the limits on discretionary spending under BBEDCA. Funding for these purposes has most recently been asso-ciated with the wars in Iraq and Afghanistan.
Pay-as-you-go (PAYGO) refers to requirements of the Statutory Pay-As-You-Go Act of 2010 that result in a sequestration if the estimated combined result of new legislation affecting direct spending or revenue increases the on-budget deficit relative to the baseline, as of the end of a congressional session.
Public enterprise fund—see Revolving fund.Reappropriation means a provision of law that ex-
tends into a new fiscal year the availability of unobligated amounts that have expired or would otherwise expire.
Receipts mean collections that result from the Government’s exercise of its sovereign power to tax or otherwise compel payment. They are compared to outlays in calculating a surplus or deficit. (Cf. offsetting collec-tions and offsetting receipts.)
Revolving fund means a fund that conducts continu-ing cycles of business-like activity, in which the fund charges for the sale of products or services and uses the proceeds to finance its spending, usually without require-ment for annual appropriations. There are two types of revolving funds: Public enterprise funds, which con-duct business-like operations mainly with the public, and intragovernmental revolving funds, which conduct
business-like operations mainly within and between Government agencies. (Cf. special fund and trust fund.)
Savings refers to legislation or administrative actions that decrease outlays or increase receipts. (Cf. cost.)
Scorekeeping means measuring the budget effects of legislation, generally in terms of budget authority, receipts, and outlays, for purposes of measuring adher-ence to the Budget or to budget targets established by the Congress, as through agreement to a Budget Resolution.
Sequestration means the cancellation of budgetary resources. The Statutory Pay-As-You-Go Act of 2010 re-quires such cancellations if revenue or direct spending legislation is enacted that, in total, increases projected deficits or reduces projected surpluses relative to the baseline. The Balanced Budget and Emergency Deficit Control Act of 1985, as amended, requires annual across-the-board cancellations to selected mandatory programs through 2030.
Special fund means a Federal fund account for receipts or offsetting receipts earmarked for specific pur-poses and the expenditure of these receipts. (Cf. revolving fund and trust fund.)
Statutory Pay-As-You-Go Act of 2010 refers to legislation that reinstated a statutory pay-as-you-go re-quirement for new tax or mandatory spending legislation. The law is a standalone piece of legislation that cross-references BBEDCA but does not directly amend that legislation. This is a permanent law and does not expire.
Subsidy means the estimated long-term cost to the Government of a direct loan or loan guarantee, calculated on a net present value basis, excluding administrative costs and any incidental effects on governmental receipts or outlays.
Surplus means the amount by which receipts exceed outlays in a fiscal year. It may refer to the on-budget, off-budget, or unified budget surplus.
Supplemental appropriation means an ap-propriation enacted subsequent to a regular annual appropriations act, when the need for additional funds is too urgent to be postponed until the next regular annual appropriations act.
Trust fund refers to a type of account, designated by law as a trust fund, for receipts or offsetting receipts dedi-cated to specific purposes and the expenditure of these receipts. Some revolving funds are designated as trust funds, and these are called trust revolving funds. (Cf. spe-cial fund and revolving fund.)
Trust funds group refers to the moneys collected and spent by the Government through trust fund accounts. (Cf. Federal funds group.)
Undistributed offsetting receipts mean offsetting receipts that are deducted from the Government-wide totals for budget authority and outlays instead of being offset against a specific agency and function. (Cf. offset-ting receipts.)
Unified budget includes receipts from all sources and outlays for all programs of the Federal Government, in-cluding both on- and off-budget programs. It is the most comprehensive measure of the Government’s annual finances.

78ANALYTICAL PERSPECTIVES
Unobligated balance means the cumulative amount of budget authority that remains available for obligation under law in unexpired accounts. The term “expired bal-ances available for adjustment only” refers to unobligated amounts in expired accounts.
User charges are charges assessed for the provision of Government services and for the sale or use of Government
goods or resources. The payers of the user charge must be limited in the authorizing legislation to those receiv-ing special benefits from, or subject to regulation by, the program or activity beyond the benefits received by the general public or broad segments of the public (such as those who pay income taxes or custom duties).
79
7. COVERAGE OF THE BUDGET
The Federal budget is the central instrument of nation-al policy making. It is the Government’s financial plan for proposing and deciding the allocation of resources to serve national objectives. The budget provides informa-tion on the cost and scope of Federal activities to inform decisions and to serve as a means to control the allocation of resources. When enacted, it establishes the level of pub-lic goods and services provided by the Government.
Federal Government activities can be either “budget-ary” or “non-budgetary.” Those activities that involve direct and measurable allocation of Federal resources are budgetary. The payments to and from the public resulting from budgetary activities are included in the budget’s ac-counting of outlays and receipts. Federal activities that do not involve direct and measurable allocation of Federal resources are non-budgetary and are not included in the budget’s accounting of outlays and receipts. More detailed information about outlays and receipts may be found in Chapter 6, “Budget Concepts,” of this volume.
The budget documents include information on some non-budgetary activities because they can be important instruments of Federal policy and provide insight into the scope and nature of Federal activities. For example, the budget documents show the transactions of the Thrift Savings Program (TSP), a collection of investment funds managed by the Federal Retirement Thrift Investment Board (FRTIB). Despite the fact that the FRTIB is bud-getary and one of the TSP funds is invested entirely in Federal securities, the transactions of these funds are non-budgetary because current and retired Federal em-ployees own the funds. The Government manages these funds only in a fiduciary capacity.
The budget also includes information on cash flows that are a means of financing Federal activity, such as for credit financing accounts. However, to avoid double-count-ing, means of financing amounts are not included in the estimates of outlays or receipts because the costs of the underlying Federal activities are already reflected in the deficit.1 This chapter provides details about the budgetary and non-budgetary activities of the Federal Government.
Budgetary Activities
The Federal Government has used the unified budget concept—which consolidates outlays and receipts from Federal funds and trust funds, including the Social Security trust funds—since 1968, starting with the 1969 Budget. The 1967 President’s Commission on Budget Concepts (the Commission) recommended the change to include the finan-cial transactions of all of the Federal Government’s programs
1 For more information on means of financing, see the “Budget Defi-cit or Surplus and Means of Financing” section of Chapter 6, “Budget Concepts,” in this volume.
and agencies. Thus, the budget includes information on the financial transactions of all 15 Executive Departments, all independent agencies (from all three branches of Government), and all Government corporations.2
The budget shows outlays and receipts for on-budget and off-budget activities separately to reflect the legal distinc-tion between the two. Although there is a legal distinction between on-budget and off-budget activities, conceptually there is no difference between them. Off-budget Federal activities reflect the same kinds of governmental roles as on-budget activities and result in outlays and receipts. Like on-budget activities, the Government funds and con-trols off-budget activities. The “unified budget” reflects the conceptual similarity between on-budget and off-bud-get activities by showing combined totals of outlays and receipts for both.
Many Government corporations are entities with busi-ness-type operations that charge the public for services at prices intended to allow the entity to be self-sustain-ing, although some operate at a loss in order to provide subsidies to specific recipients. Often these entities are more independent than other agencies and have limited exemptions from certain Federal personnel requirements to allow for flexibility.
All accounts in Table 21-1, “Federal Budget by Agency and Account,” in the supplemental materials to this volume are budgetary.3 The majority of budgetary ac-counts are associated with the Departments or other entities that are clearly Federal agencies. Some budget-ary accounts reflect Government payments to entities that the Government created or chartered as private or non-Federal entities. Some of these entities receive all or a majority of their funding from the Government. These include the Corporation for Public Broadcasting, Gallaudet University, Howard University, the Legal Services Corporation, the National Railroad Passenger Corporation (Amtrak), the Smithsonian Institution, the State Justice Institute, and the United States Institute of Peace. A related example is the Standard Setting Board, which is not a Federally created entity but since 2003 has received a majority of funding through a federally
2 Government corporations are Government entities that are de-fined as corporations pursuant to the Government Corporation Control Act, as amended (31 U.S.C. 9101), or elsewhere in law. Examples in-clude the Commodity Credit Corporation, the Export-Import Bank of the United States, the Federal Crop Insurance Corporation, the Federal Deposit Insurance Corporation, the Millennium Challenge Corporation, the Overseas Private Investment Corporation (now the U.S. Interna-tional Development Finance Corporation), the Pension Benefit Guar-anty Corporation, the Tennessee Valley Authority, the African Develop-ment Foundation (22 U.S.C. 290h-6), the Inter-American Foundation (22 U.S.C. 290f), the Presidio Trust (16 U.S.C. 460bb note), and the Valles Caldera Trust (16 U.S.C. 698v-4).
3 Table 21-1 can be found at: https://www.whitehouse.gov/omb/analytical-perspectives.
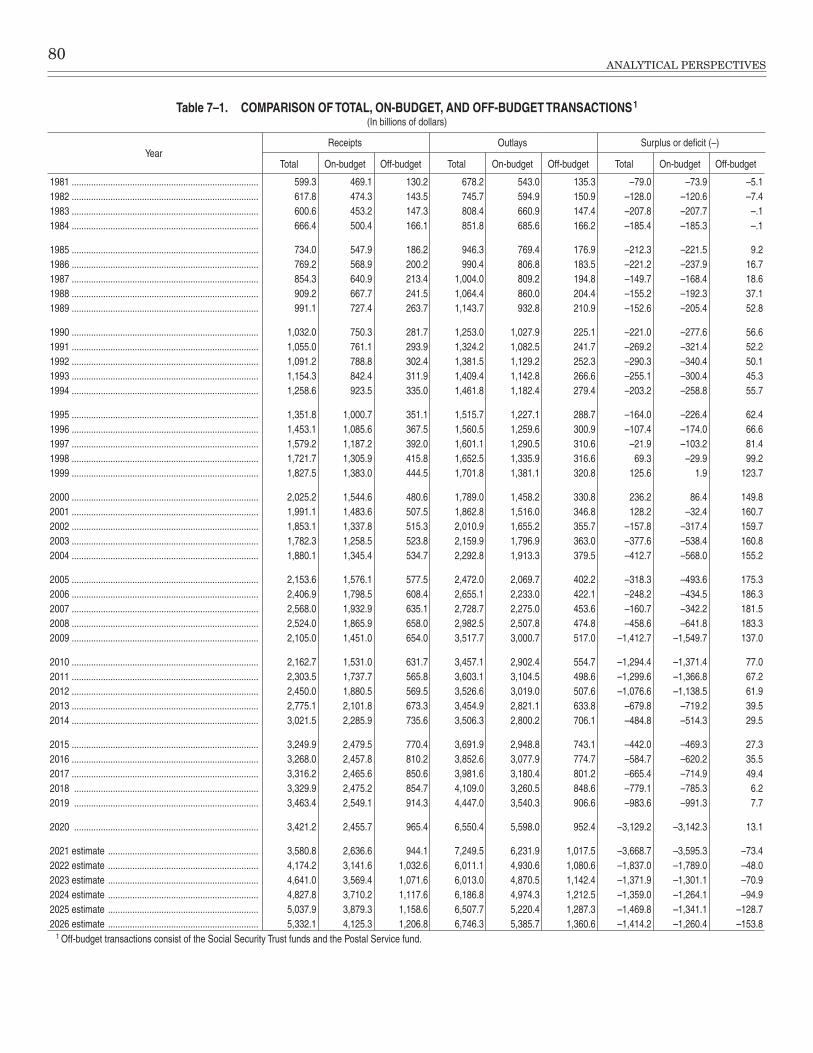
80ANALYTICAL PERSPECTIVES
Table 7–1. COMPARISON OF TOTAL, ON-BUDGET, AND OFF-BUDGET TRANSACTIONS 1
(In billions of dollars)
YearReceipts Outlays Surplus or deficit (–)
Total On-budget Off-budget Total On-budget Off-budget Total On-budget Off-budget
1981 ����������������������������������������������������������������������������� 599�3 469�1 130�2 678�2 543�0 135�3 –79�0 –73�9 –5�11982 ����������������������������������������������������������������������������� 617�8 474�3 143�5 745�7 594�9 150�9 –128�0 –120�6 –7�41983 ����������������������������������������������������������������������������� 600�6 453�2 147�3 808�4 660�9 147�4 –207�8 –207�7 –�11984 ����������������������������������������������������������������������������� 666�4 500�4 166�1 851�8 685�6 166�2 –185�4 –185�3 –�1
1985 ����������������������������������������������������������������������������� 734�0 547�9 186�2 946�3 769�4 176�9 –212�3 –221�5 9�21986 ����������������������������������������������������������������������������� 769�2 568�9 200�2 990�4 806�8 183�5 –221�2 –237�9 16�71987 ����������������������������������������������������������������������������� 854�3 640�9 213�4 1,004�0 809�2 194�8 –149�7 –168�4 18�61988 ����������������������������������������������������������������������������� 909�2 667�7 241�5 1,064�4 860�0 204�4 –155�2 –192�3 37�11989 ����������������������������������������������������������������������������� 991�1 727�4 263�7 1,143�7 932�8 210�9 –152�6 –205�4 52�8
1990 ����������������������������������������������������������������������������� 1,032�0 750�3 281�7 1,253�0 1,027�9 225�1 –221�0 –277�6 56�61991 ����������������������������������������������������������������������������� 1,055�0 761�1 293�9 1,324�2 1,082�5 241�7 –269�2 –321�4 52�21992 ����������������������������������������������������������������������������� 1,091�2 788�8 302�4 1,381�5 1,129�2 252�3 –290�3 –340�4 50�11993 ����������������������������������������������������������������������������� 1,154�3 842�4 311�9 1,409�4 1,142�8 266�6 –255�1 –300�4 45�31994 ����������������������������������������������������������������������������� 1,258�6 923�5 335�0 1,461�8 1,182�4 279�4 –203�2 –258�8 55�7
1995 ����������������������������������������������������������������������������� 1,351�8 1,000�7 351�1 1,515�7 1,227�1 288�7 –164�0 –226�4 62�41996 ����������������������������������������������������������������������������� 1,453�1 1,085�6 367�5 1,560�5 1,259�6 300�9 –107�4 –174�0 66�61997 ����������������������������������������������������������������������������� 1,579�2 1,187�2 392�0 1,601�1 1,290�5 310�6 –21�9 –103�2 81�41998 ����������������������������������������������������������������������������� 1,721�7 1,305�9 415�8 1,652�5 1,335�9 316�6 69�3 –29�9 99�21999 ����������������������������������������������������������������������������� 1,827�5 1,383�0 444�5 1,701�8 1,381�1 320�8 125�6 1�9 123�7
2000 ����������������������������������������������������������������������������� 2,025�2 1,544�6 480�6 1,789�0 1,458�2 330�8 236�2 86�4 149�82001 ����������������������������������������������������������������������������� 1,991�1 1,483�6 507�5 1,862�8 1,516�0 346�8 128�2 –32�4 160�72002 ����������������������������������������������������������������������������� 1,853�1 1,337�8 515�3 2,010�9 1,655�2 355�7 –157�8 –317�4 159�72003 ����������������������������������������������������������������������������� 1,782�3 1,258�5 523�8 2,159�9 1,796�9 363�0 –377�6 –538�4 160�82004 ����������������������������������������������������������������������������� 1,880�1 1,345�4 534�7 2,292�8 1,913�3 379�5 –412�7 –568�0 155�2
2005 ����������������������������������������������������������������������������� 2,153�6 1,576�1 577�5 2,472�0 2,069�7 402�2 –318�3 –493�6 175�32006 ����������������������������������������������������������������������������� 2,406�9 1,798�5 608�4 2,655�1 2,233�0 422�1 –248�2 –434�5 186�32007 ����������������������������������������������������������������������������� 2,568�0 1,932�9 635�1 2,728�7 2,275�0 453�6 –160�7 –342�2 181�52008 ����������������������������������������������������������������������������� 2,524�0 1,865�9 658�0 2,982�5 2,507�8 474�8 –458�6 –641�8 183�32009 ����������������������������������������������������������������������������� 2,105�0 1,451�0 654�0 3,517�7 3,000�7 517�0 –1,412�7 –1,549�7 137�0
2010 ����������������������������������������������������������������������������� 2,162�7 1,531�0 631�7 3,457�1 2,902�4 554�7 –1,294�4 –1,371�4 77�02011 ����������������������������������������������������������������������������� 2,303�5 1,737�7 565�8 3,603�1 3,104�5 498�6 –1,299�6 –1,366�8 67�22012 ����������������������������������������������������������������������������� 2,450�0 1,880�5 569�5 3,526�6 3,019�0 507�6 –1,076�6 –1,138�5 61�92013 ����������������������������������������������������������������������������� 2,775�1 2,101�8 673�3 3,454�9 2,821�1 633�8 –679�8 –719�2 39�52014 ����������������������������������������������������������������������������� 3,021�5 2,285�9 735�6 3,506�3 2,800�2 706�1 –484�8 –514�3 29�5
2015 ����������������������������������������������������������������������������� 3,249�9 2,479�5 770�4 3,691�9 2,948�8 743�1 –442�0 –469�3 27�32016 ����������������������������������������������������������������������������� 3,268�0 2,457�8 810�2 3,852�6 3,077�9 774�7 –584�7 –620�2 35�52017 ����������������������������������������������������������������������������� 3,316�2 2,465�6 850�6 3,981�6 3,180�4 801�2 –665�4 –714�9 49�42018 ���������������������������������������������������������������������������� 3,329�9 2,475�2 854�7 4,109�0 3,260�5 848�6 –779�1 –785�3 6�22019 ���������������������������������������������������������������������������� 3,463�4 2,549�1 914�3 4,447�0 3,540�3 906�6 –983�6 –991�3 7�7
2020 ���������������������������������������������������������������������������� 3,421�2 2,455�7 965�4 6,550�4 5,598�0 952�4 –3,129�2 –3,142�3 13�1
2021 estimate �������������������������������������������������������������� 3,580�8 2,636�6 944�1 7,249�5 6,231�9 1,017�5 –3,668�7 –3,595�3 –73�42022 estimate �������������������������������������������������������������� 4,174�2 3,141�6 1,032�6 6,011�1 4,930�6 1,080�6 –1,837�0 –1,789�0 –48�02023 estimate �������������������������������������������������������������� 4,641�0 3,569�4 1,071�6 6,013�0 4,870�5 1,142�4 –1,371�9 –1,301�1 –70�92024 estimate �������������������������������������������������������������� 4,827�8 3,710�2 1,117�6 6,186�8 4,974�3 1,212�5 –1,359�0 –1,264�1 –94�92025 estimate �������������������������������������������������������������� 5,037�9 3,879�3 1,158�6 6,507�7 5,220�4 1,287�3 –1,469�8 –1,341�1 –128�72026 estimate �������������������������������������������������������������� 5,332�1 4,125�3 1,206�8 6,746�3 5,385�7 1,360�6 –1,414�2 –1,260�4 –153�8
1 Off-budget transactions consist of the Social Security Trust funds and the Postal Service fund�
7. COVERAGE OF THE BUDGET 81
mandated assessment on public companies under the Sarbanes-Oxley Act. Although the Federal payments to these entities are budgetary, the entities themselves are non-budgetary.
Whether the Government created or chartered an en-tity does not alone determine its budgetary status. The Commission recommended that the budget be compre-hensive but it also recognized that proper budgetary classification required weighing all relevant factors re-garding establishment, ownership, and control of an entity while erring on the side of inclusiveness. Generally, entities that are primarily Government owned or con-trolled are classified as budgetary. OMB determines the budgetary classification of entities in consultation with the Congressional Budget Office (CBO) and the Budget Committees of the Congress.
One recent example of a budgetary classification was for the Puerto Rico Financial Oversight Board, created in June 2016 by the Puerto Rico Oversight, Management, and Economic Stability Act (P. L. 114–187). By statute, this oversight board is not a department, agency, estab-lishment, or instrumentality of the Federal Government, but is an entity within the territorial government financed entirely by the territorial government. Because the flow of funds from the territory to the oversight board is man-dated by Federal law, the budget reflects the allocation of resources by the territorial government to the territorial entity as a receipt from the territorial government and an equal outlay to the oversight board, with net zero deficit impact. Because the oversight board itself is not a Federal entity, its operations are not included in the budget.
Another example involved the National Association of Registered Agents and Brokers (NARAB). NARAB allows for the adoption and application of insurance licensing, continuing education, and other nonresident producer qualification requirements on a multi-State basis. In other words, NARAB streamlines the ability of a non-resident insurer to become a licensed agent in another State. In exchange for providing enhanced market access, NARAB collects fees from its members. The Terrorism Risk Insurance Reauthorization Act of 2015 established the association. In addition to being statutorily estab-lished—which in itself is an indication that the entity is governmental—NARAB has a board of directors ap-pointed by the President and confirmed by the Senate. It must also submit bylaws and an annual report to the Department of the Treasury and its primary function in-volves exercising a regulatory function.
Off-budget Federal activities.—Despite the Commission’s recommendation that the budget be com-prehensive, every year since 1971 at least one Federal program or agency has been presented as off-budget be-cause of a legal requirement.4 The Government funds such off-budget Federal activities and administers them according to Federal legal requirements. However, their net costs are excluded, by law, from the rest of the budget totals, also known as the “on-budget” totals.
4 While the term “off-budget” is sometimes used colloquially to mean non-budgetary, the term has a meaning distinct from non-budgetary. Off-budget activities would be considered budgetary, absent legal re-quirement to exclude these activities from the budget totals.
Off-budget Federal activities currently consist of the U.S. Postal Service and the two Social Security trust funds: Old-Age and Survivors Insurance and Disability Insurance. Social Security has been classified as off-budget since 1986 and the Postal Service has been classified as off-budget since 1990.5 Other activities that had been designated in law as off-budget at various times before 1986 have been classified as on-budget by law since at least 1985 as a re-sult of the Balanced Budget and Emergency Deficit Control Act of 1985 (P. L. 99–177). Activities that were off-budget at one time but that are now on-budget are classified as on-budget for all years in historical budget data.
Social Security is the largest single program in the uni-fied budget and it is classified by law as off-budget; as a result, the off-budget accounts constitute a significant part of total Federal spending and receipts. Table 7–1 divides total Federal Government outlays, receipts, and the surplus or deficit between on-budget and off-budget amounts. Within this table, the Social Security and Postal Service transactions are classified as off-budget for all years to provide a consistent comparison over time.
Non-Budgetary Activities
The Government characterizes some important Government activities as non-budgetary because they do not involve the direct allocation of resources.6 These ac-tivities can affect budget outlays or receipts even though they have non-budgetary components.
Federal credit programs: budgetary and non-bud-getary transactions.—Federal credit programs make direct loans or guarantee private loans to non-Federal bor-rowers. The Federal Credit Reform Act of 1990 (FCRA), as amended by the Balanced Budget Act of 1997, established the current budgetary treatment for credit programs. Under FCRA, the budgetary cost of a credit program, known as the “subsidy cost,” is the estimated lifetime cost to the Government of a loan or a loan guarantee on a net present value basis, excluding administrative costs.
Outlays equal to the subsidy cost are recorded in the budget up front, as they are incurred—for example, when a loan is made or guaranteed. Credit program cash flows to and from the public are recorded in non-budgetary
5 See 42 U.S.C. 911, and 39 U.S.C. 2009a, respectively. The off-budget Postal Service accounts consist of the Postal Service Fund, which is clas-sified as a mandatory account, and the Office of the Inspector General and the Postal Regulatory Commission, both of which are classified as discretionary accounts. The Postal Service Retiree Health Benefits Fund is an on-budget mandatory account with the Office of Personnel Man-agement. The off-budget Social Security accounts consist of the Federal Old-Age and Survivors Insurance trust fund and the Federal Disability Insurance trust fund, both of which have mandatory and discretionary funding.
6 Tax expenditures, which are discussed in Chapter 10 of this vol-ume, are an example of Government activities that could be character-ized as either budgetary or non-budgetary. Tax expenditures refer to the reduction in tax receipts resulting from the special tax treatment ac-corded certain private activities. Because tax expenditures reduce tax receipts and receipts are budgetary, tax expenditures clearly have bud-getary effects. However, the size and composition of tax expenditures are not explicitly recorded in the budget as outlays or as negative receipts and, for this reason, tax expenditures might be considered a special case of non-budgetary transactions.
82ANALYTICAL PERSPECTIVES
financing accounts and the information is included in budget documents to provide insight into the program size and costs. For more information about the mecha-nisms of credit programs, see Chapter 6 of this volume, “Budget Concepts.” More detail on credit programs is in Chapter 15 of this volume, “Credit and Insurance.”
Deposit funds.—Deposit funds are non-budgetary accounts that record amounts held by the Government temporarily until ownership is determined (such as ear-nest money paid by bidders for mineral leases) or held by the Government as an agent for others (such as State income taxes withheld from Federal employees’ salaries and not yet paid to the States). The largest deposit fund is the Government Securities Investment Fund, also known as the G-Fund, which is part of the TSP, the Government’s defined contribution retirement plan. The Federal Retirement Thrift Investment Board manages the fund’s investment for Federal employees who participate in the TSP (which is similar to private-sector 401(k) plans). The Department of the Treasury holds the G-Fund assets, which are the property of Federal employees, only in a fiduciary capacity; the transactions of the Fund are not resource allocations by the Government and are therefore non-budgetary.7 For similar reasons, Native American-owned funds that are held and managed in a fiduciary capacity are also excluded from the budget.
Government-Sponsored Enterprises (GSEs).—GSEs are privately owned and therefore distinct from Government corporations. The Federal Government has chartered GSEs such as the Federal National Mortgage Association (Fannie Mae), the Federal Home Loan Mortgage Corporation (Freddie Mac), the Federal Home Loan Banks, the Farm Credit System, and the Federal Agricultural Mortgage Corporation to provide financial intermediation for specified public purposes. Although Federally chartered to serve public-policy purposes, GSEs are classified as non-budgetary because they are in-tended to be privately owned and controlled—with any public benefits accruing indirectly from the GSEs’ busi-ness transactions. Estimates of the GSEs’ activities can be found in a separate chapter of the Budget Appendix, and their activities are discussed in Chapter 15 of this volume, “Credit and Insurance.”
In September 2008, in response to the financial market crisis, the director of the Federal Housing Finance Agency (FHFA)8 placed Fannie Mae and Freddie Mac into con-servatorship for the purpose of preserving the assets and restoring the solvency of these two GSEs. As conserva-tor, FHFA has broad authority to direct the operations of these GSEs. However, these GSEs remain private compa-nies with boards of directors and management responsible for their day-to-day operations. The Budget continues to treat these two GSEs as non-budgetary private entities in conservatorship rather than as Government Agencies. By contrast, CBO treats these GSEs as budgetary Federal
7 The administrative functions of the Federal Retirement Thrift In-vestment Board are carried out by Government employees and included in the budget totals.
8 FHFA is the regulator of Fannie Mae, Freddie Mac, and the Fed-eral Home Loan Banks.
Agencies. Both treatments include budgetary and non-budgetary amounts.
While OMB reflects all of the GSEs’ transactions with the public as non-budgetary, the payments from the Treasury to the GSEs are recorded as budgetary outlays and dividends received by the Treasury are recorded as budgetary receipts. Under CBO’s approach, the subsidy costs of Fannie Mae’s and Freddie Mac’s past credit ac-tivities are treated as having already been recorded in the budget estimates; the subsidy costs of future credit ac-tivities will be recorded when the activities occur. Lending and borrowing activities between the GSEs and the public apart from the subsidy costs are treated as non-budgetary by CBO, and Treasury payments to the GSEs are intra-governmental transfers (from Treasury to the GSEs) that net to zero in CBO’s budget estimates.
Overall, both the budget’s accounting and CBO’s ac-counting present Fannie Mae’s and Freddie Mac’s gains and losses as Government receipts and outlays, which re-duce or increase Government deficits. The two approaches, however, reflect the effect of the gains and losses in the budget at different times.
Other federally created non-budgetary entities.—In addition to the GSEs, the Federal Government has created a number of other entities that are classified as non-budgetary. These include federally funded research and development centers (FFRDCs), non-appropriated fund instrumentalities (NAFIs), and other entities; some of these are non-profit entities and some are for-profit entities.9
FFRDCs are entities that conduct agency-specif-ic research under contract or cooperative agreement. Some FFRDCs were created to conduct research for the Department of Defense but are administered by colleg-es, universities, or other non-profit entities. Despite this non-budgetary classification, many FFRDCs receive di-rect resource allocation from the Government and are included as budget lines in various agencies. Examples of FFRDCs include the Center for Naval Analysis and the
9 Although most entities created by the Federal Government are budgetary, the Congress and the President have chartered, but not necessarily created, approximately 100 non-profit entities that are non-budgetary. These include patriotic, charitable, and educational organiza-tions under Title 36 of the U.S. Code and foundations and trusts char-tered under other titles of the Code. Title 36 corporations include the American Legion, the American National Red Cross, Big Brothers—Big Sisters of America, Boy Scouts of America, Future Farmers of America, Girl Scouts of the United States of America, the National Academy of Public Administration, the National Academies of Sciences, Engineer-ing, and Medicine, and Veterans of Foreign Wars of the United States. Virtually all of the non-profit entities chartered by the Government ex-isted under State law prior to the granting of a Government charter, making the Government charter an honorary rather than governing charter. A major exception to this is the American National Red Cross. Its Government charter requires it to provide disaster relief and to en-sure compliance with treaty obligations under the Geneva Convention. Although any Government payments (whether made as direct appropri-ations or through agency appropriations) to these chartered non-profits, including the Red Cross, would be budgetary, the non-profits themselves are classified as non-budgetary. On April 29, 2015, the Subcommittee on Immigration and Border Security of the Committee on the Judiciary in the U.S. House of Representatives adopted a policy prohibiting the Congress from granting new Federal charters to private, non-profit or-ganizations. This policy has been adopted by every subcommittee with jurisdiction over charters since the 101st Congress.
7. COVERAGE OF THE BUDGET 83
Jet Propulsion Laboratory.10 Even though FFRDCs are non-budgetary, Federal payments to the FFRDC are bud-get outlays. In addition to Federal funding, FFRDCs may receive funding from non-Federal sources.
Non-appropriated fund instrumentalities (NAFIs) are entities that support an agency’s current and re-tired personnel. Nearly all NAFIs are associated with the Departments of Defense, Homeland Security (Coast Guard), and Veterans Affairs. Most NAFIs are located on military bases and include the Armed Forces exchanges (which sell goods to military personnel and their fami-lies), recreational facilities, and childcare centers. NAFIs are financed by proceeds from the sale of goods or services and do not receive direct appropriations; thus, they are characterized as non-budgetary but any agency payments to the NAFIs are recorded as budget outlays.
A number of entities created by the Government re-ceive a significant amount of non-Federal funding. Non-Federal individuals or organizations significantly control some of these entities. These entities include Gallaudet University, Howard University, Amtrak, and the Universal Services Administrative Company, among others.11 Most of these entities receive direct appropria-tions or other recurring payments from the Government. The appropriations or other payments are budgetary and included in Table 21-1. However, many of these entities are themselves non-budgetary. Generally, entities that receive a significant portion of funding from non-Feder-al sources but are not controlled by the Government are non-budgetary.
Regulation.—Federal Government regulations often require the private sector or other levels of government to make expenditures for specified purposes that are in-tended to have public benefits, such as workplace safety and pollution control. Although the budget reflects the Government’s cost of conducting regulatory activities, the costs imposed on the private sector as a result of regula-tion are treated as non-budgetary and not included in the budget. The annual Regulatory Plan and the semi-annual Unified Agenda of Federal Regulatory and Deregulatory Actions describe the Government’s regulatory priorities and plans.12 OMB has published the estimated costs and benefits of Federal regulation annually since 1997.13
10 The National Science Foundation maintains a list of FFRDCs at www.nsf.gov/statistics/ffrdc.
11 Under section 415(b) of the Amtrak Reform and Accountability Act of 1997, (49 U.S.C. 24304 and note), Amtrak was required to redeem all of its outstanding common stock. Once all outstanding common stock is redeemed, Amtrak will be wholly-owned by the Government and, at that point, its non-budgetary status may need to be reassessed.
12 The most recent Regulatory Plan and introduction to the Unified Agenda issued by the General Services Administration’s Regulatory In-formation Service Center are available at www.reginfo.gov and at www.gpo.gov.
13 In the 2018, 2019, and 2020 report, OMB indicates that for the five rules for which monetized costs and benefits were estimated in 2019, the issuing agencies estimated a total of $0.2 to $3.7 billion in annual benefits and up to $0.6 billion in annual costs, in 2018 dollars. These totals include only the benefits and costs for the minority of rules for which both those categories of impacts were estimated. The most recent report is available at https://www.whitehouse.gov/omb/information-regulatory-affairs/reports/#ORC.
Monetary policy.—As a fiscal policy tool, the bud-get is used by elected Government officials to promote economic growth and achieve other public policy objec-tives. Monetary policy is another tool that governments use to promote economic policy objectives. In the United States, the Federal Reserve System—which is com-posed of a Board of Governors and 12 regional Federal Reserve Banks—conducts monetary policy. The Federal Reserve Act provides that the goal of monetary policy is to “maintain long-run growth of the monetary and cred-it aggregates commensurate with the economy’s long run potential to increase production, so as to promote effectively the goals of maximum employment, stable prices, and moderate long-term interest rates.”14 The Full Employment and Balanced Growth Act of 1978, also known as the Humphrey-Hawkins Act, reaffirmed the dual goals of full employment and price stability.15
By law, the Federal Reserve System is a self-financing entity that is independent of the Executive Branch and subject only to broad oversight by the Congress. Consistent with the recommendations of the Commission, the ef-fects of monetary policy and the actions of the Federal Reserve System are non-budgetary, with exceptions for the transfer to the Treasury of excess income generat-ed through its operations. The Federal Reserve System earns income from a variety of sources including interest on Government securities, foreign currency investments and loans to depository institutions, and fees for services (e.g., check clearing services) provided to depository insti-tutions. The Federal Reserve System remits to Treasury any excess income over expenses annually. For the fiscal year ending September 2020, Treasury recorded $81.9 billion in receipts from the Federal Reserve System. In 2020, the Federal Reserve System also co-invested with the Treasury to establish lending facilities authorized by Section 13(3) of the Federal Reserve Act. The Coronavirus Aid, Relief, and Economic Security (CARES) Act appro-priated funds to the Treasury to support Federal Reserve 13(3) lending facilities to provide liquidity to the financial system, including financing for states, tribes, municipali-ties, eligible businesses, and nonprofit organizations.16 In addition to remitting excess income to Treasury, current law requires the Federal Reserve to transfer a portion of its excess earnings to the Consumer Financial Protection Bureau (CFPB).17
The Board of Governors of the Federal Reserve is a Federal Government Agency, but because of its indepen-dent status, its budget is not subject to Executive Branch review and is included in the Budget Appendix for in-formational purposes only. The Federal Reserve Banks are subject to Board oversight and managed by boards of directors chosen by the Board of Governors and mem-ber banks, which include all National banks and State banks that choose to become members. The budgets of the regional Banks are subject to approval by the Board of Governors and are not included in the Budget Appendix.
14 See 12 U.S.C. 225a.15 See 15 U.S.C. 3101 et seq.16 See section 4003 of Public Law 116-136.17 See section 1011 of Public Law 111-203 (12 U.S.C. 5491).

85
FEDERAL RECEIPTS


87
8. GOVERNMENTAL RECEIPTS
This chapter presents the Budget’s estimates of taxes and governmental receipts including the effects of tax legislation enacted in 2020 and early 2021, discusses
the provisions of those enacted laws, and introduces the Administration’s additional receipt proposals.
ESTIMATES OF GOVERNMENTAL RECEIPTS
Governmental receipts are taxes and other collections from the public that result from the exercise of the Feder-al Government’s sovereign or governmental powers. The difference between governmental receipts and outlays is the surplus or deficit.
The Federal Government also collects income from the public through market-oriented activities. Collections from these activities are subtracted from gross outlays, rather than added to taxes and other governmental re-ceipts, and are discussed in Chapter 9, “Offsetting Collec-tions and Offsetting Receipts,” in this volume.
Total governmental receipts (hereafter referred to as “receipts”) are estimated to be $3,580.8 billion in 2021, an increase of $159.6 billion or 4.7 percent from 2020. The estimated increase in 2021 is largely due to increases in individual and corporation income taxes. Receipts in 2021
are estimated to be 16.3 percent of Gross Domestic Prod-uct (GDP), roughly the same share as in 2020.
Receipts in the 2022 Budget are estimated to rise to $4,174.2 billion in 2022, an increase of $593.4 billion or 16.6 percent relative to 2021. Receipts are projected to grow at an average annual rate of 6.3 percent between 2022 and 2026, rising to $5,332.1 billion. Receipts are projected to rise to $6,643.5 billion in 2031, growing at an average annual rate of 5.3 percent between 2026 and 2031. This growth is largely due to assumed increases in incomes resulting from both real economic growth and in-flation, along with tax reforms in the American Jobs Plan and American Families Plan.
As a share of GDP, receipts are projected to increase from 16.3 percent in 2021 to 17.8 percent in 2022, and to steadily increase to 19.9 percent by 2031.
LEGISLATION ENACTED IN 2020 AND 2021 THAT AFFECTS GOVERNMENTAL RECEIPTS
Five laws were enacted during 2020 and early 2021 that affect receipts. The major provisions of these laws that have a significant impact on receipts are described below.1
1 In the discussions of enacted legislation, years referred to are cal-endar years, unless otherwise noted.
UNITED STATES-MEXICO-CANADA AGREEMENT IMPLEMENTATION ACT (Public Law 116–113)
The Act, which was signed into law on January 29, 2020, provides authority for the trade agreement between the United States, Mexico, and Canada (USMCA), which replaces the North American Free Trade Agreement. The
Table 8–1. RECEIPTS BY SOURCE—SUMMARY(In billions of dollars)
2020Actual
Estimate
2021 2022 2023 2024 2025 2026 2027 2028 2029 2030 2031
Individual income taxes ������������������� 1,608�7 1,704�9 2,038�6 2,242�1 2,287�6 2,435�5 2,676�0 2,895�6 3,044�5 3,194�3 3,353�5 3,526�0Corporation income taxes ���������������� 211�8 268�5 371�0 576�6 648�7 672�7 664�2 666�1 678�8 677�5 681�1 692�8Social insurance and retirement receipts ��� 1,310�0 1,296�2 1,462�0 1,527�1 1,590�1 1,646�4 1,711�4 1,775�0 1,858�8 1,929�4 2,009�2 2,088�1
(On-budget) ��������������������������������� (344�5) (352�0) (429�4) (455�5) (472�5) (487�8) (504�6) (522�5) (547�8) (568�0) (592�4) (613�8)(Off-budget) ��������������������������������� (965�4) (944�1) (1,032�6) (1,071�6) (1,117�6) (1,158�6) (1,206�8) (1,252�5) (1,311�0) (1,361�4) (1,416�8) (1,474�3)
Excise taxes ������������������������������������ 86�8 74�1 84�3 88�7 93�5 93�7 94�8 96�0 96�0 98�4 101�1 101�8Estate and gift taxes ������������������������ 17�6 17�6 20�8 18�2 19�3 20�1 20�6 32�1 33�0 34�4 36�6 38�9Customs duties �������������������������������� 68�6 84�8 57�4 45�2 45�5 46�5 47�8 49�2 50�8 52�6 54�6 56�8Miscellaneous receipts �������������������� 117�7 134�7 140�2 143�1 143�1 122�9 117�3 117�8 126�3 132�0 133�6 139�1
Total, receipts ............................. 3,421.2 3,580.8 4,174.2 4,641.0 4,827.8 5,037.9 5,332.1 5,631.7 5,888.1 6,118.7 6,369.8 6,643.5(On-budget) ���������������������������� (2,455�7) (2,636�6) (3,141�6) (3,569�4) (3,710�2) (3,879�3) (4,125�3) (4,379�3) (4,577�1) (4,757�2) (4,953�0) (5,169�2)(Off-budget) ���������������������������� (965�4) (944�1) (1,032�6) (1,071�6) (1,117�6) (1,158�6) (1,206�8) (1,252�5) (1,311�0) (1,361�4) (1,416�8) (1,474�3)
Total receipts as a percentage of GDP ��� 16�3 16�3 17�8 18�9 18�9 19�0 19�4 19�7 19�8 19�8 19�8 19�9
88ANALYTICAL PERSPECTIVES
law implements provisions of the USMCA by, among oth-er things, establishing de minimis levels for U.S. exports and providing for cooperation among treaty members to prevent evasion of customs duties.
FAMILIES FIRST CORONAVIRUS RESPONSE ACT (Public Law 116–127)
The Act (FFCRA), which was signed into law on March 18, 2020, responds to the COVID-19 public health emer-gency by providing paid sick leave tax credits and expand-ing food assistance and unemployment benefits. The law provides fully refundable credits against payroll taxes to compensate employers (including self-employed individu-als) for paid sick leave and family and medical leave that is mandated in the Act.
CORONAVIRUS AID, RELIEF, AND ECONOMIC SECURITY ACT (Public Law 116–136)
The Act, also known as the CARES Act, which was signed into law on March 27, 2020, responds to the CO-VID-19 public health emergency and its impact on the economy, public health, State and local governments, indi-viduals, and businesses. The law created an Economic Im-pact Payment which generally provided $1,200 for eligible Americans with $500 for each qualifying child. It also allows employers and self-employed individuals to defer payment of the employer’s share of Social Security tax-es incurred from March 27, 2020 through December 31, 2020; provides a refundable and advanceable Employee Retention Credit against payroll taxes for employers who kept employees on payroll during mandated shut-downs; permits businesses to offset 100 percent of taxable income for net operating losses incurred over the three-year pe-riod from 2018 to 2020 and allows corporations to carry back recently incurred losses for refunds of tax liabili-ties for the prior five years; and allows taxpayers to use their business losses to offset non-business income for tax years 2018 through 2020, or for farm losses for tax years 2018 through 2025. The Act also waives penalties for cer-tain early withdrawals from retirement accounts in 2020; creates a partial above-the-line deduction for taxpayers who do not itemize deductions in 2020 but make chari-table contributions of up to $300 in cash; and excludes from taxation certain employer payments for employees’ student loans; among other provisions.
CONSOLIDATED APPROPRIATIONS ACT, 2021 (Public Law 116–260)
The Act, which was signed into law on December 27, 2020, extends by four months the deferral of certain pay-roll taxes that was enacted in the CARES Act; clarifies the tax treatment of the forgiveness of covered loans and other provisions; excludes from a taxpayer’s income any qualified emergency financial aid grants; and extends by three months the CARES Act tax credits for paid sick and family leave; among other provisions. It also created a
second round of Economic Impact Payments of $600 for eligible Americans with $600 for each qualifying child.
AMERICAN RESCUE PLAN ACT OF 2021 (Public Law 117-2)
The Act, which was signed into law on March 11, 2021, provides additional relief to address the continued impact of the COVID-19 public health emergency on the econo-my, public health, State and local governments, individu-als, and businesses. Major provisions of the law include:
Promoting economic security.—The Act enhances major tax credits to bolster financial security for families and essential workers during the pandemic. It created a third round of Economic Impact Payments of $1,400 for eligible Americans with $1,400 for each qualifying de-pendent. It increases the amount of the Child Tax Credit from $2,000 to $3,600 for children under age 6 and $3,000 for other children under 18; expands the credit to cover children aged 17 for 2021; makes available advance pay-ments on a periodic basis through 2021; makes the credit fully refundable; and extends the credit to Puerto Rico and U.S. territories. It increases the maximum Earned Income Tax Credit (EITC) for childless adults from about $540 to just over $1,500; raises the income limit for the credit from about $16,000 to about $21,000; expands eligibility to younger and older workers; expands the EITC by allow-ing taxpayers with a Social Security number to claim the childless earned income credit when they have qualify-ing children without Social Security numbers; allows cer-tain separated spouses to claim the EITC; and increases the limitation for individuals with certain disqualified investment income. It also increases the Child and De-pendent Care Tax Credit to 50 percent of up to $8,000 for the child care expenses of one child and $16,000 for two or more children, increasing the maximum credit that can be claimed to $4,000 for taxpayers with one child and $8,000 for taxpayers with two or more children; makes the credit refundable; increases the phase-out threshold from $15,000 to $125,000; and increases the excludable amount of employer-provided dependent care assistance. The law extends and expands the tax credit for qualify-ing paid sick and family leave established under FFCRA through September 30, 2021; extends and modifies the Employee Retention Credit established under the CARES Act through December 21, 2021; provides premium as-sistance for the full cost of COBRA coverage from April 1 through September 30, 2021 through a refundable tax credit for employers; and modifies the premium tax credit for health insurance purchased through an exchange by eliminating required premium contributions for taxpay-ers making 100 to 150 percent of the Federal poverty level and lowering the maximum household contribution for all other PTC recipients, for taxable years 2021 and 2022.
Crisis support for unemployed workers.—The Act suspends tax on $10,200 per recipient of unemployment compensation received in 2020 for taxpayers with AGI be-low $150,000.
Other.—Finally, the law repeals worldwide interest allocation rules, modifies exceptions for reporting third-

8. GOVERNMENTAL RECEIPTS 89
party network transactions, extends the requirement to apply the limitation on excess business losses of non-
corporate taxpayers by one year, and extends certain cus-toms user fees, among other provisions.
BUDGET PROPOSALS
The 2022 Budget, including the American Jobs Plan and the American Families Plan, proposes meaningful tax relief for families and workers while proposing a series of revenue raisers directed at wealthy individuals and large corporations. In addition, the Made in America Tax Plan contained within the American Jobs Plan aims to replace counterproductive tax laws that reward offshor-ing and profit shifting with provisions that encourage job creation at home and put an end to the worldwide race to the bottom on corporate tax rates. Moreover, the Ameri-can Families Plan extends key tax cuts in the American
Rescue Plan Act that benefit lower- and middle-income workers and families, and includes a set of measures to make sure the wealthiest Americans pay their fair share in taxes while ensuring that no one making $400,000 per year or less will see their taxes rise. These proposals af-fecting governmental receipts are included in the table that follows. Descriptions of proposals can be found in the Department of the Treasury’s General Explanations of the Administration’s Fiscal Year 2022 Revenue Proposals 2.
2 Available at this link: https://home.treasury.gov/policy-issues/tax-policy/revenue-proposals.
Table 8–2. EFFECT OF BUDGET PROPOSALS(In millions of dollars)
2021 2022 2023 2024 2025 2026 2027 2028 2029 2030 20312022–2026
2022–2031
American Jobs Plan:
Reform corporate taxation:Increase the domestic corporate tax rate to
28 percent ������������������������������������������������� ��������� 51,127 86,182 88,059 89,385 91,784 92,065 90,730 89,357 88,798 90,330 406,537 857,817Revise the Global Minimum Tax regime,
disallow deductions attributable to exempt income, and limit inversions ���������������������� ��������� 29,816 51,386 54,192 57,030 55,283 54,699 56,056 56,988 58,223 59,830 247,707 533,503
Reform taxation of foreign fossil fuel income:Modify foreign oil and gas extraction
income (FOGEI) and foreign oil related income (FORI) rules ���������������������������� ��������� 4,178 7,173 7,468 7,834 8,393 9,055 9,633 10,051 10,358 10,638 35,046 84,781
Modify tax rule for dual capacity taxpayers ��� ��������� 48 123 128 134 143 154 165 173 178 183 576 1,429Total, reform taxation of foreign fossil
fuel income ������������������������������������� ��������� 4,226 7,296 7,596 7,968 8,536 9,209 9,798 10,224 10,536 10,821 35,622 86,210Provide tax incentives for locating jobs and
business activity in the United States and remove tax deductions for shipping jobs overseas:Provide tax credit for onshoring jobs to the
United States ��������������������������������������� ��������� –6 –10 –10 –11 –11 –12 –12 –13 –13 –14 –48 –112Remove tax deductions for shipping jobs
overseas ���������������������������������������������� ��������� 6 10 10 11 11 12 12 13 13 14 48 112Total, provide tax incentives for
locating jobs and business activity in the United States and remove tax deductions for shipping jobs overseas ����������������������������������������� ��������� ��������� ��������� ��������� ��������� ��������� ��������� ��������� ��������� ��������� ��������� ��������� ���������
Repeal deduction for Foreign Derived Intangible Income (FDII) and provide additional support for research and experimentation expenditures ������������������� ��������� ��������� ��������� ��������� ��������� ��������� ��������� ��������� ��������� ��������� ��������� ��������� ���������
Replace the Base Erosion Anti-Abuse Tax (BEAT) with the Stopping Harmful Inversions and Ending Low-Tax Developments (SHIELD) Rule ������������������ ��������� ��������� 33,244 53,796 51,111 47,655 44,463 41,914 39,425 38,990 39,453 185,806 390,051
Limit foreign tax credits for sales of hybrid entities ������������������������������������������������������ ��������� 23 39 41 43 45 47 48 49 50 51 191 436
Restrict deductions of excessive interest of members of financial reporting groups for disproportionate borrowing in the United States ������������������������������������������������������� ��������� 2,100 2,334 1,586 1,638 1,690 1,743 1,795 1,846 1,900 1,956 9,348 18,588
Impose 15 percent minimum tax on book earnings of large corporations ������������������ ��������� 10,736 15,245 14,588 13,812 14,561 15,203 16,049 16,158 15,775 16,217 68,942 148,344Total, reform corporate taxation ���������������� ��������� 98,028 195,726 219,858 220,987 219,554 217,429 216,390 214,047 214,272 218,658 954,153 2,034,949
Support housing and infrastructure:
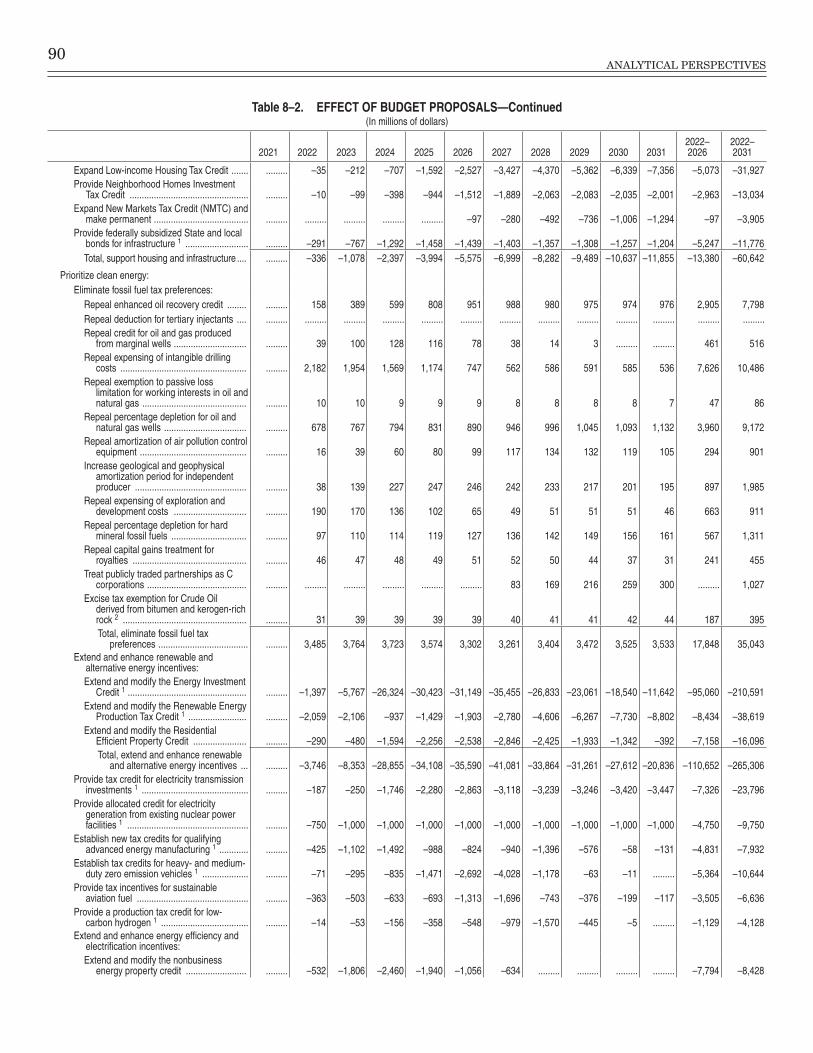
90ANALYTICAL PERSPECTIVES
Table 8–2. EFFECT OF BUDGET PROPOSALS—Continued(In millions of dollars)
2021 2022 2023 2024 2025 2026 2027 2028 2029 2030 20312022–2026
2022–2031
Expand Low-income Housing Tax Credit ������� ��������� –35 –212 –707 –1,592 –2,527 –3,427 –4,370 –5,362 –6,339 –7,356 –5,073 –31,927Provide Neighborhood Homes Investment
Tax Credit ������������������������������������������������� ��������� –10 –99 –398 –944 –1,512 –1,889 –2,063 –2,083 –2,035 –2,001 –2,963 –13,034Expand New Markets Tax Credit (NMTC) and
make permanent ��������������������������������������� ��������� ��������� ��������� ��������� ��������� –97 –280 –492 –736 –1,006 –1,294 –97 –3,905Provide federally subsidized State and local
bonds for infrastructure 1 �������������������������� ��������� –291 –767 –1,292 –1,458 –1,439 –1,403 –1,357 –1,308 –1,257 –1,204 –5,247 –11,776Total, support housing and infrastructure ���� ��������� –336 –1,078 –2,397 –3,994 –5,575 –6,999 –8,282 –9,489 –10,637 –11,855 –13,380 –60,642
Prioritize clean energy:Eliminate fossil fuel tax preferences:
Repeal enhanced oil recovery credit �������� ��������� 158 389 599 808 951 988 980 975 974 976 2,905 7,798Repeal deduction for tertiary injectants ���� ��������� ��������� ��������� ��������� ��������� ��������� ��������� ��������� ��������� ��������� ��������� ��������� ���������Repeal credit for oil and gas produced
from marginal wells ������������������������������ ��������� 39 100 128 116 78 38 14 3 ��������� ��������� 461 516Repeal expensing of intangible drilling
costs ���������������������������������������������������� ��������� 2,182 1,954 1,569 1,174 747 562 586 591 585 536 7,626 10,486Repeal exemption to passive loss
limitation for working interests in oil and natural gas ������������������������������������������� ��������� 10 10 9 9 9 8 8 8 8 7 47 86
Repeal percentage depletion for oil and natural gas wells ���������������������������������� ��������� 678 767 794 831 890 946 996 1,045 1,093 1,132 3,960 9,172
Repeal amortization of air pollution control equipment �������������������������������������������� ��������� 16 39 60 80 99 117 134 132 119 105 294 901
Increase geological and geophysical amortization period for independent producer ���������������������������������������������� ��������� 38 139 227 247 246 242 233 217 201 195 897 1,985
Repeal expensing of exploration and development costs ������������������������������ ��������� 190 170 136 102 65 49 51 51 51 46 663 911
Repeal percentage depletion for hard mineral fossil fuels ������������������������������� ��������� 97 110 114 119 127 136 142 149 156 161 567 1,311
Repeal capital gains treatment for royalties ����������������������������������������������� ��������� 46 47 48 49 51 52 50 44 37 31 241 455
Treat publicly traded partnerships as C corporations ����������������������������������������� ��������� ��������� ��������� ��������� ��������� ��������� 83 169 216 259 300 ��������� 1,027
Excise tax exemption for Crude Oil derived from bitumen and kerogen-rich rock 2 ��������������������������������������������������� ��������� 31 39 39 39 39 40 41 41 42 44 187 395Total, eliminate fossil fuel tax
preferences ������������������������������������� ��������� 3,485 3,764 3,723 3,574 3,302 3,261 3,404 3,472 3,525 3,533 17,848 35,043Extend and enhance renewable and
alternative energy incentives:Extend and modify the Energy Investment
Credit 1 ������������������������������������������������� ��������� –1,397 –5,767 –26,324 –30,423 –31,149 –35,455 –26,833 –23,061 –18,540 –11,642 –95,060 –210,591Extend and modify the Renewable Energy
Production Tax Credit 1 ������������������������ ��������� –2,059 –2,106 –937 –1,429 –1,903 –2,780 –4,606 –6,267 –7,730 –8,802 –8,434 –38,619Extend and modify the Residential
Efficient Property Credit ���������������������� ��������� –290 –480 –1,594 –2,256 –2,538 –2,846 –2,425 –1,933 –1,342 –392 –7,158 –16,096Total, extend and enhance renewable
and alternative energy incentives ��� ��������� –3,746 –8,353 –28,855 –34,108 –35,590 –41,081 –33,864 –31,261 –27,612 –20,836 –110,652 –265,306Provide tax credit for electricity transmission
investments 1 �������������������������������������������� ��������� –187 –250 –1,746 –2,280 –2,863 –3,118 –3,239 –3,246 –3,420 –3,447 –7,326 –23,796Provide allocated credit for electricity
generation from existing nuclear power facilities 1 �������������������������������������������������� ��������� –750 –1,000 –1,000 –1,000 –1,000 –1,000 –1,000 –1,000 –1,000 –1,000 –4,750 –9,750
Establish new tax credits for qualifying advanced energy manufacturing 1 ������������ ��������� –425 –1,102 –1,492 –988 –824 –940 –1,396 –576 –58 –131 –4,831 –7,932
Establish tax credits for heavy- and medium-duty zero emission vehicles 1 ������������������� ��������� –71 –295 –835 –1,471 –2,692 –4,028 –1,178 –63 –11 ��������� –5,364 –10,644
Provide tax incentives for sustainable aviation fuel ���������������������������������������������� ��������� –363 –503 –633 –693 –1,313 –1,696 –743 –376 –199 –117 –3,505 –6,636
Provide a production tax credit for low-carbon hydrogen 1 ������������������������������������ ��������� –14 –53 –156 –358 –548 –979 –1,570 –445 –5 ��������� –1,129 –4,128
Extend and enhance energy efficiency and electrification incentives:Extend and modify the nonbusiness
energy property credit ������������������������� ��������� –532 –1,806 –2,460 –1,940 –1,056 –634 ��������� ��������� ��������� ��������� –7,794 –8,428
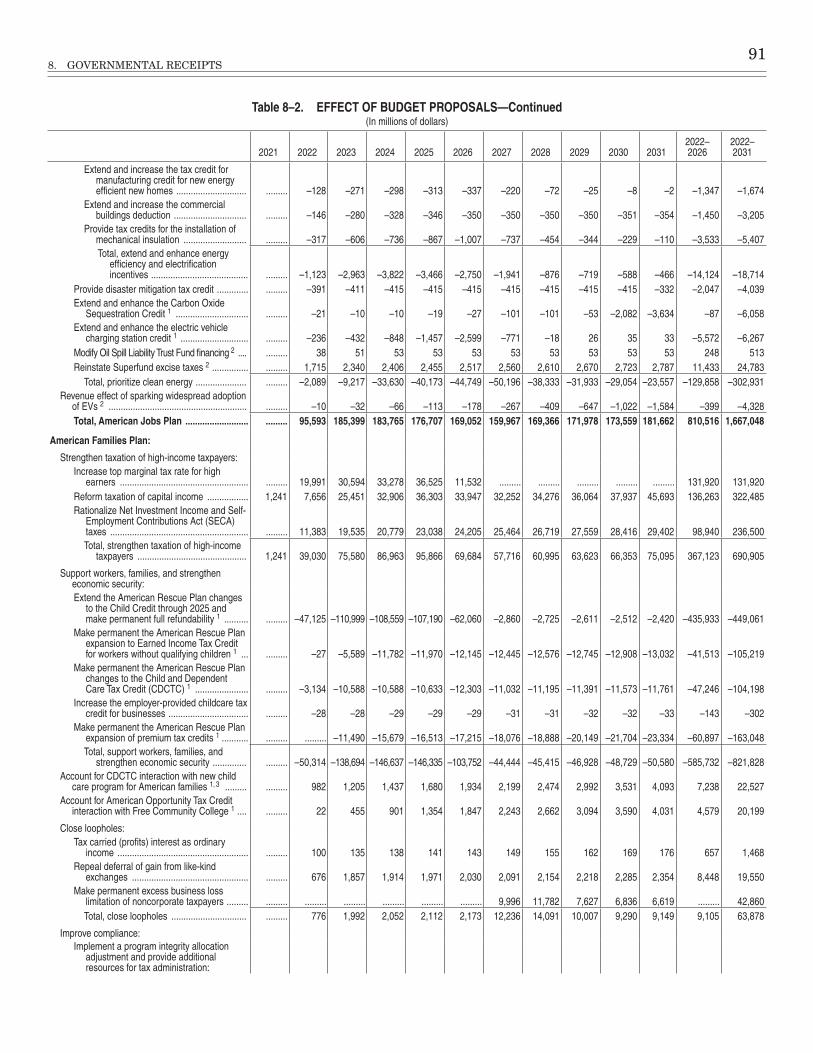
8. GOVERNMENTAL RECEIPTS 91
Table 8–2. EFFECT OF BUDGET PROPOSALS—Continued(In millions of dollars)
2021 2022 2023 2024 2025 2026 2027 2028 2029 2030 20312022–2026
2022–2031
Extend and increase the tax credit for manufacturing credit for new energy efficient new homes ����������������������������� ��������� –128 –271 –298 –313 –337 –220 –72 –25 –8 –2 –1,347 –1,674
Extend and increase the commercial buildings deduction ������������������������������ ��������� –146 –280 –328 –346 –350 –350 –350 –350 –351 –354 –1,450 –3,205
Provide tax credits for the installation of mechanical insulation �������������������������� ��������� –317 –606 –736 –867 –1,007 –737 –454 –344 –229 –110 –3,533 –5,407Total, extend and enhance energy
efficiency and electrification incentives ���������������������������������������� ��������� –1,123 –2,963 –3,822 –3,466 –2,750 –1,941 –876 –719 –588 –466 –14,124 –18,714
Provide disaster mitigation tax credit ������������� ��������� –391 –411 –415 –415 –415 –415 –415 –415 –415 –332 –2,047 –4,039Extend and enhance the Carbon Oxide
Sequestration Credit 1 ������������������������������ ��������� –21 –10 –10 –19 –27 –101 –101 –53 –2,082 –3,634 –87 –6,058Extend and enhance the electric vehicle
charging station credit 1 ���������������������������� ��������� –236 –432 –848 –1,457 –2,599 –771 –18 26 35 33 –5,572 –6,267Modify Oil Spill Liability Trust Fund financing 2 ���� ��������� 38 51 53 53 53 53 53 53 53 53 248 513Reinstate Superfund excise taxes 2 ��������������� ��������� 1,715 2,340 2,406 2,455 2,517 2,560 2,610 2,670 2,723 2,787 11,433 24,783
Total, prioritize clean energy ��������������������� ��������� –2,089 –9,217 –33,630 –40,173 –44,749 –50,196 –38,333 –31,933 –29,054 –23,557 –129,858 –302,931Revenue effect of sparking widespread adoption
of EVs 2 ��������������������������������������������������������� ��������� –10 –32 –66 –113 –178 –267 –409 –647 –1,022 –1,584 –399 –4,328Total, American Jobs Plan .......................... ......... 95,593 185,399 183,765 176,707 169,052 159,967 169,366 171,978 173,559 181,662 810,516 1,667,048
American Families Plan:
Strengthen taxation of high-income taxpayers:Increase top marginal tax rate for high
earners ����������������������������������������������������� ��������� 19,991 30,594 33,278 36,525 11,532 ��������� ��������� ��������� ��������� ��������� 131,920 131,920Reform taxation of capital income ����������������� 1,241 7,656 25,451 32,906 36,303 33,947 32,252 34,276 36,064 37,937 45,693 136,263 322,485Rationalize Net Investment Income and Self-
Employment Contributions Act (SECA) taxes ��������������������������������������������������������� ��������� 11,383 19,535 20,779 23,038 24,205 25,464 26,719 27,559 28,416 29,402 98,940 236,500Total, strengthen taxation of high-income
taxpayers ��������������������������������������������� 1,241 39,030 75,580 86,963 95,866 69,684 57,716 60,995 63,623 66,353 75,095 367,123 690,905
Support workers, families, and strengthen economic security:Extend the American Rescue Plan changes
to the Child Credit through 2025 and make permanent full refundability 1 ���������� ��������� –47,125 –110,999 –108,559 –107,190 –62,060 –2,860 –2,725 –2,611 –2,512 –2,420 –435,933 –449,061
Make permanent the American Rescue Plan expansion to Earned Income Tax Credit for workers without qualifying children 1 ��� ��������� –27 –5,589 –11,782 –11,970 –12,145 –12,445 –12,576 –12,745 –12,908 –13,032 –41,513 –105,219
Make permanent the American Rescue Plan changes to the Child and Dependent Care Tax Credit (CDCTC) 1 ���������������������� ��������� –3,134 –10,588 –10,588 –10,633 –12,303 –11,032 –11,195 –11,391 –11,573 –11,761 –47,246 –104,198
Increase the employer-provided childcare tax credit for businesses ��������������������������������� ��������� –28 –28 –29 –29 –29 –31 –31 –32 –32 –33 –143 –302
Make permanent the American Rescue Plan expansion of premium tax credits 1 ����������� ��������� ��������� –11,490 –15,679 –16,513 –17,215 –18,076 –18,888 –20,149 –21,704 –23,334 –60,897 –163,048Total, support workers, families, and
strengthen economic security �������������� ��������� –50,314 –138,694 –146,637 –146,335 –103,752 –44,444 –45,415 –46,928 –48,729 –50,580 –585,732 –821,828Account for CDCTC interaction with new child
care program for American families 1, 3 ��������� ��������� 982 1,205 1,437 1,680 1,934 2,199 2,474 2,992 3,531 4,093 7,238 22,527Account for American Opportunity Tax Credit
interaction with Free Community College 1 ���� ��������� 22 455 901 1,354 1,847 2,243 2,662 3,094 3,590 4,031 4,579 20,199
Close loopholes:Tax carried (profits) interest as ordinary
income ������������������������������������������������������ ��������� 100 135 138 141 143 149 155 162 169 176 657 1,468Repeal deferral of gain from like-kind
exchanges ������������������������������������������������ ��������� 676 1,857 1,914 1,971 2,030 2,091 2,154 2,218 2,285 2,354 8,448 19,550Make permanent excess business loss
limitation of noncorporate taxpayers ��������� ��������� ��������� ��������� ��������� ��������� ��������� 9,996 11,782 7,627 6,836 6,619 ��������� 42,860Total, close loopholes ������������������������������� ��������� 776 1,992 2,052 2,112 2,173 12,236 14,091 10,007 9,290 9,149 9,105 63,878
Improve compliance:Implement a program integrity allocation
adjustment and provide additional resources for tax administration:
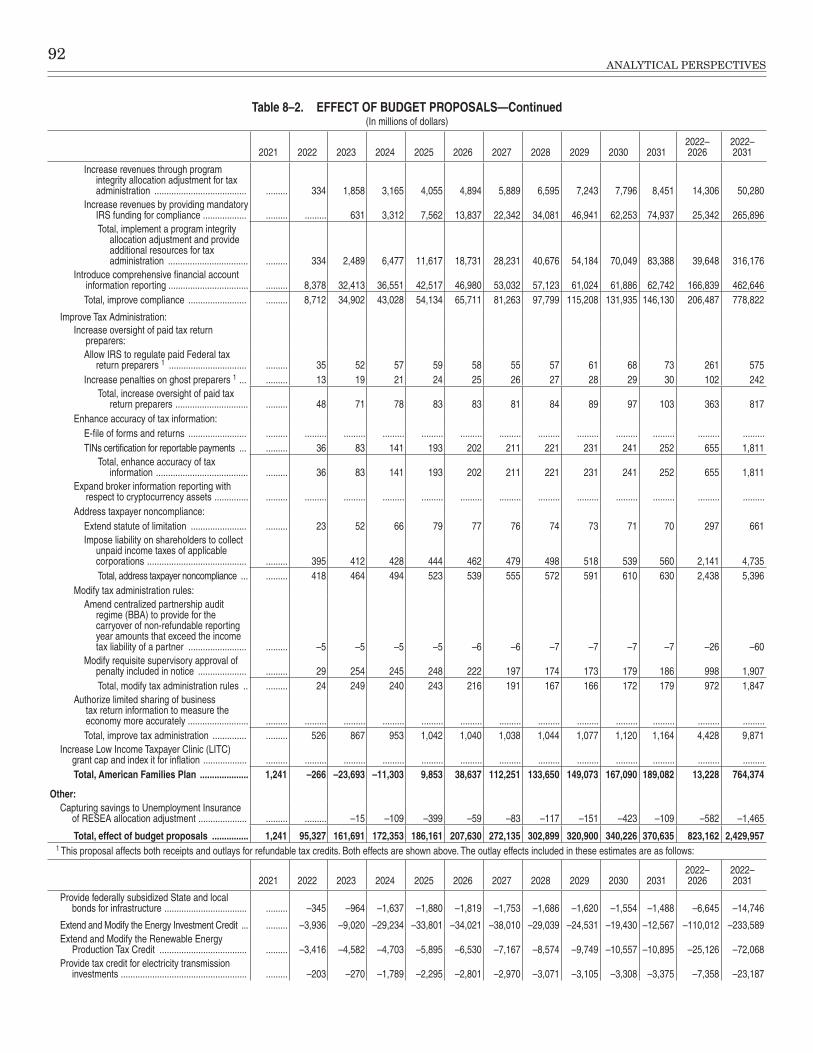
92ANALYTICAL PERSPECTIVES
Table 8–2. EFFECT OF BUDGET PROPOSALS—Continued(In millions of dollars)
2021 2022 2023 2024 2025 2026 2027 2028 2029 2030 20312022–2026
2022–2031
Increase revenues through program integrity allocation adjustment for tax administration �������������������������������������� ��������� 334 1,858 3,165 4,055 4,894 5,889 6,595 7,243 7,796 8,451 14,306 50,280
Increase revenues by providing mandatory IRS funding for compliance ������������������ ��������� ��������� 631 3,312 7,562 13,837 22,342 34,081 46,941 62,253 74,937 25,342 265,896Total, implement a program integrity
allocation adjustment and provide additional resources for tax administration ��������������������������������� ��������� 334 2,489 6,477 11,617 18,731 28,231 40,676 54,184 70,049 83,388 39,648 316,176
Introduce comprehensive financial account information reporting ��������������������������������� ��������� 8,378 32,413 36,551 42,517 46,980 53,032 57,123 61,024 61,886 62,742 166,839 462,646Total, improve compliance ������������������������ ��������� 8,712 34,902 43,028 54,134 65,711 81,263 97,799 115,208 131,935 146,130 206,487 778,822
Improve Tax Administration:Increase oversight of paid tax return
preparers:Allow IRS to regulate paid Federal tax
return preparers 1 �������������������������������� ��������� 35 52 57 59 58 55 57 61 68 73 261 575Increase penalties on ghost preparers 1 ��� ��������� 13 19 21 24 25 26 27 28 29 30 102 242
Total, increase oversight of paid tax return preparers ������������������������������ ��������� 48 71 78 83 83 81 84 89 97 103 363 817
Enhance accuracy of tax information:E-file of forms and returns ������������������������ ��������� ��������� ��������� ��������� ��������� ��������� ��������� ��������� ��������� ��������� ��������� ��������� ���������TINs certification for reportable payments ��� ��������� 36 83 141 193 202 211 221 231 241 252 655 1,811
Total, enhance accuracy of tax information �������������������������������������� ��������� 36 83 141 193 202 211 221 231 241 252 655 1,811
Expand broker information reporting with respect to cryptocurrency assets �������������� ��������� ��������� ��������� ��������� ��������� ��������� ��������� ��������� ��������� ��������� ��������� ��������� ���������
Address taxpayer noncompliance:Extend statute of limitation ����������������������� ��������� 23 52 66 79 77 76 74 73 71 70 297 661Impose liability on shareholders to collect
unpaid income taxes of applicable corporations ����������������������������������������� ��������� 395 412 428 444 462 479 498 518 539 560 2,141 4,735Total, address taxpayer noncompliance ��� ��������� 418 464 494 523 539 555 572 591 610 630 2,438 5,396
Modify tax administration rules:Amend centralized partnership audit
regime (BBA) to provide for the carryover of non-refundable reporting year amounts that exceed the income tax liability of a partner ������������������������ ��������� –5 –5 –5 –5 –6 –6 –7 –7 –7 –7 –26 –60
Modify requisite supervisory approval of penalty included in notice �������������������� ��������� 29 254 245 248 222 197 174 173 179 186 998 1,907Total, modify tax administration rules �� ��������� 24 249 240 243 216 191 167 166 172 179 972 1,847
Authorize limited sharing of business tax return information to measure the economy more accurately ������������������������� ��������� ��������� ��������� ��������� ��������� ��������� ��������� ��������� ��������� ��������� ��������� ��������� ���������Total, improve tax administration �������������� ��������� 526 867 953 1,042 1,040 1,038 1,044 1,077 1,120 1,164 4,428 9,871
Increase Low Income Taxpayer Clinic (LITC) grant cap and index it for inflation ������������������ ��������� ��������� ��������� ��������� ��������� ��������� ��������� ��������� ��������� ��������� ��������� ��������� ���������Total, American Families Plan .................... 1,241 –266 –23,693 –11,303 9,853 38,637 112,251 133,650 149,073 167,090 189,082 13,228 764,374
Other:Capturing savings to Unemployment Insurance
of RESEA allocation adjustment �������������������� ��������� ��������� –15 –109 –399 –59 –83 –117 –151 –423 –109 –582 –1,465
Total, effect of budget proposals ............... 1,241 95,327 161,691 172,353 186,161 207,630 272,135 302,899 320,900 340,226 370,635 823,162 2,429,9571 This proposal affects both receipts and outlays for refundable tax credits� Both effects are shown above� The outlay effects included in these estimates are as follows:
2021 2022 2023 2024 2025 2026 2027 2028 2029 2030 20312022–2026
2022–2031
Provide federally subsidized State and local bonds for infrastructure ���������������������������������� ��������� –345 –964 –1,637 –1,880 –1,819 –1,753 –1,686 –1,620 –1,554 –1,488 –6,645 –14,746
Extend and Modify the Energy Investment Credit ��� ��������� –3,936 –9,020 –29,234 –33,801 –34,021 –38,010 –29,039 –24,531 –19,430 –12,567 –110,012 –233,589Extend and Modify the Renewable Energy
Production Tax Credit ������������������������������������ ��������� –3,416 –4,582 –4,703 –5,895 –6,530 –7,167 –8,574 –9,749 –10,557 –10,895 –25,126 –72,068Provide tax credit for electricity transmission
investments ���������������������������������������������������� ��������� –203 –270 –1,789 –2,295 –2,801 –2,970 –3,071 –3,105 –3,308 –3,375 –7,358 –23,187
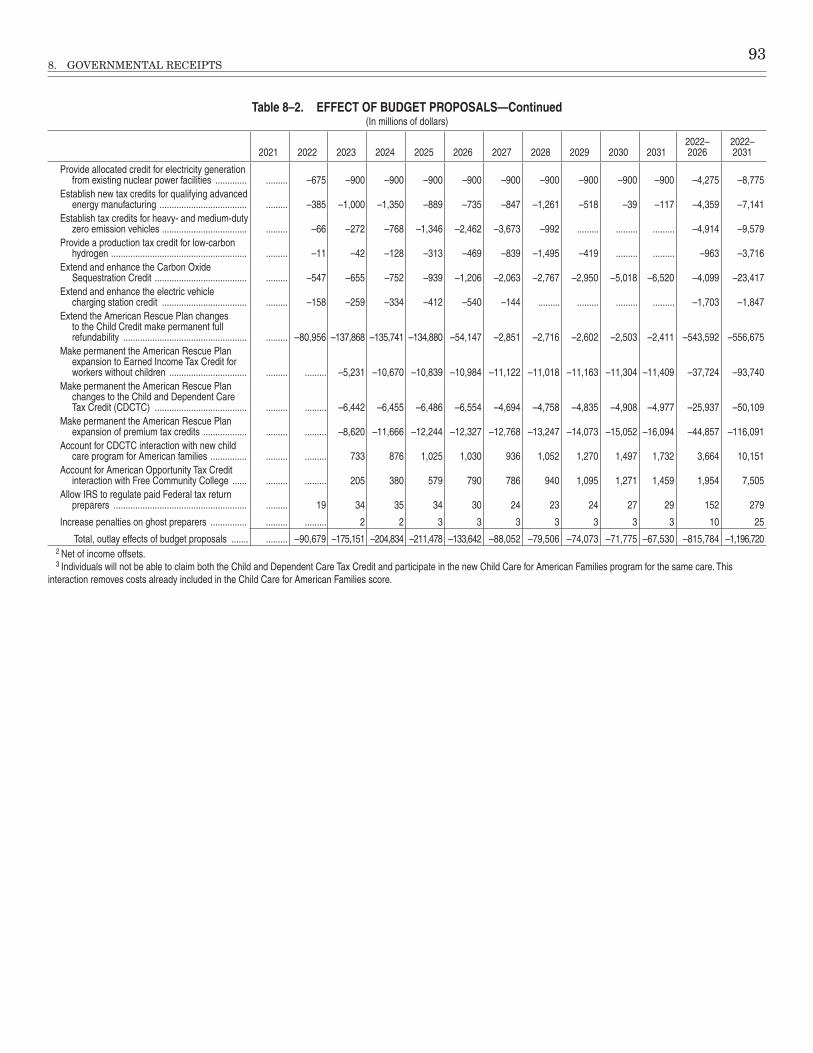
8. GOVERNMENTAL RECEIPTS 93
Table 8–2. EFFECT OF BUDGET PROPOSALS—Continued(In millions of dollars)
2021 2022 2023 2024 2025 2026 2027 2028 2029 2030 20312022–2026
2022–2031
Provide allocated credit for electricity generation from existing nuclear power facilities ������������� ��������� –675 –900 –900 –900 –900 –900 –900 –900 –900 –900 –4,275 –8,775
Establish new tax credits for qualifying advanced energy manufacturing ������������������������������������ ��������� –385 –1,000 –1,350 –889 –735 –847 –1,261 –518 –39 –117 –4,359 –7,141
Establish tax credits for heavy- and medium-duty zero emission vehicles ����������������������������������� ��������� –66 –272 –768 –1,346 –2,462 –3,673 –992 ��������� ��������� ��������� –4,914 –9,579
Provide a production tax credit for low-carbon hydrogen �������������������������������������������������������� ��������� –11 –42 –128 –313 –469 –839 –1,495 –419 ��������� ��������� –963 –3,716
Extend and enhance the Carbon Oxide Sequestration Credit �������������������������������������� ��������� –547 –655 –752 –939 –1,206 –2,063 –2,767 –2,950 –5,018 –6,520 –4,099 –23,417
Extend and enhance the electric vehicle charging station credit ����������������������������������� ��������� –158 –259 –334 –412 –540 –144 ��������� ��������� ��������� ��������� –1,703 –1,847
Extend the American Rescue Plan changes to the Child Credit make permanent full refundability ��������������������������������������������������� ��������� –80,956 –137,868 –135,741 –134,880 –54,147 –2,851 –2,716 –2,602 –2,503 –2,411 –543,592 –556,675
Make permanent the American Rescue Plan expansion to Earned Income Tax Credit for workers without children �������������������������������� ��������� ��������� –5,231 –10,670 –10,839 –10,984 –11,122 –11,018 –11,163 –11,304 –11,409 –37,724 –93,740
Make permanent the American Rescue Plan changes to the Child and Dependent Care Tax Credit (CDCTC) �������������������������������������� ��������� ��������� –6,442 –6,455 –6,486 –6,554 –4,694 –4,758 –4,835 –4,908 –4,977 –25,937 –50,109
Make permanent the American Rescue Plan expansion of premium tax credits ������������������ ��������� ��������� –8,620 –11,666 –12,244 –12,327 –12,768 –13,247 –14,073 –15,052 –16,094 –44,857 –116,091
Account for CDCTC interaction with new child care program for American families ��������������� ��������� ��������� 733 876 1,025 1,030 936 1,052 1,270 1,497 1,732 3,664 10,151
Account for American Opportunity Tax Credit interaction with Free Community College ������ ��������� ��������� 205 380 579 790 786 940 1,095 1,271 1,459 1,954 7,505
Allow IRS to regulate paid Federal tax return preparers ������������������������������������������������������� ��������� 19 34 35 34 30 24 23 24 27 29 152 279
Increase penalties on ghost preparers ��������������� ��������� ��������� 2 2 3 3 3 3 3 3 3 10 25
Total, outlay effects of budget proposals ������� ��������� –90,679 –175,151 –204,834 –211,478 –133,642 –88,052 –79,506 –74,073 –71,775 –67,530 –815,784 –1,196,7202 Net of income offsets�3 Individuals will not be able to claim both the Child and Dependent Care Tax Credit and participate in the new Child Care for American Families program for the same care� This
interaction removes costs already included in the Child Care for American Families score�
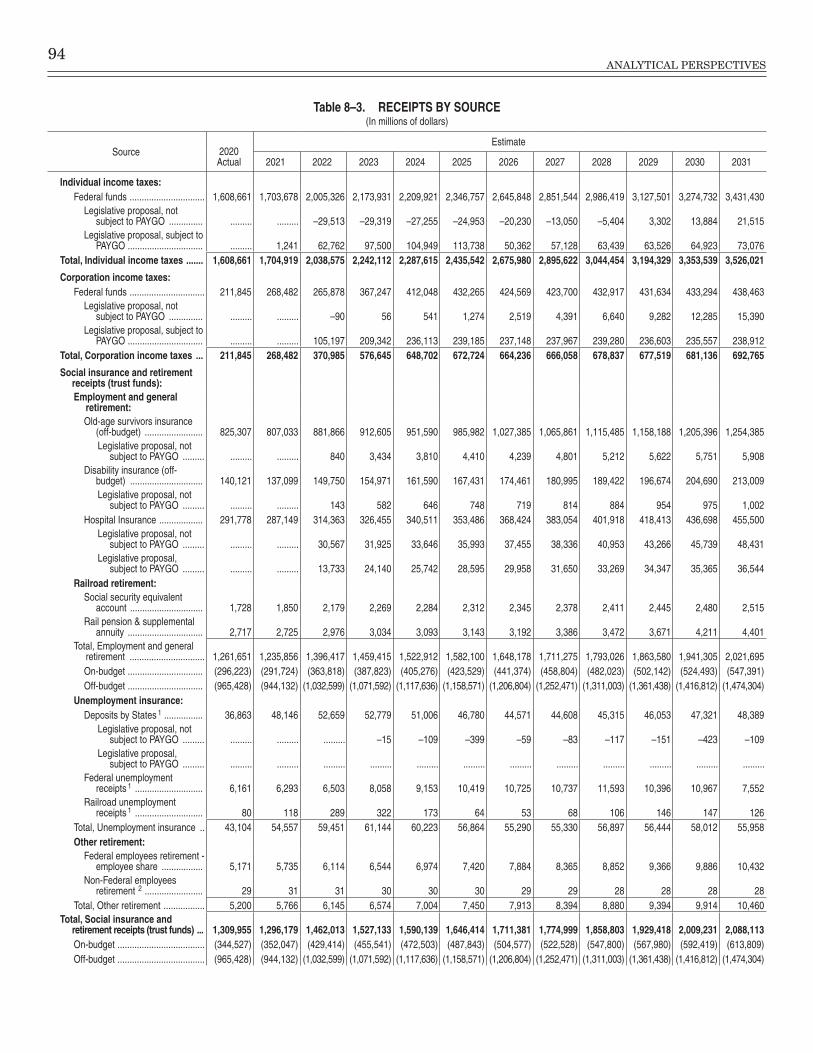
94ANALYTICAL PERSPECTIVES
Table 8–3. RECEIPTS BY SOURCE(In millions of dollars)
Source 2020 Actual
Estimate
2021 2022 2023 2024 2025 2026 2027 2028 2029 2030 2031
Individual income taxes:Federal funds ������������������������������� 1,608,661 1,703,678 2,005,326 2,173,931 2,209,921 2,346,757 2,645,848 2,851,544 2,986,419 3,127,501 3,274,732 3,431,430
Legislative proposal, not subject to PAYGO �������������� ��������� ��������� –29,513 –29,319 –27,255 –24,953 –20,230 –13,050 –5,404 3,302 13,884 21,515
Legislative proposal, subject to PAYGO ������������������������������� ��������� 1,241 62,762 97,500 104,949 113,738 50,362 57,128 63,439 63,526 64,923 73,076
Total, Individual income taxes ....... 1,608,661 1,704,919 2,038,575 2,242,112 2,287,615 2,435,542 2,675,980 2,895,622 3,044,454 3,194,329 3,353,539 3,526,021
Corporation income taxes:Federal funds ������������������������������� 211,845 268,482 265,878 367,247 412,048 432,265 424,569 423,700 432,917 431,634 433,294 438,463
Legislative proposal, not subject to PAYGO �������������� ��������� ��������� –90 56 541 1,274 2,519 4,391 6,640 9,282 12,285 15,390
Legislative proposal, subject to PAYGO ������������������������������� ��������� ��������� 105,197 209,342 236,113 239,185 237,148 237,967 239,280 236,603 235,557 238,912
Total, Corporation income taxes ... 211,845 268,482 370,985 576,645 648,702 672,724 664,236 666,058 678,837 677,519 681,136 692,765
Social insurance and retirement receipts (trust funds):Employment and general
retirement:Old-age survivors insurance
(off-budget) ������������������������ 825,307 807,033 881,866 912,605 951,590 985,982 1,027,385 1,065,861 1,115,485 1,158,188 1,205,396 1,254,385Legislative proposal, not
subject to PAYGO ��������� ��������� ��������� 840 3,434 3,810 4,410 4,239 4,801 5,212 5,622 5,751 5,908Disability insurance (off-
budget) ������������������������������ 140,121 137,099 149,750 154,971 161,590 167,431 174,461 180,995 189,422 196,674 204,690 213,009Legislative proposal, not
subject to PAYGO ��������� ��������� ��������� 143 582 646 748 719 814 884 954 975 1,002Hospital Insurance ������������������ 291,778 287,149 314,363 326,455 340,511 353,486 368,424 383,054 401,918 418,413 436,698 455,500
Legislative proposal, not subject to PAYGO ��������� ��������� ��������� 30,567 31,925 33,646 35,993 37,455 38,336 40,953 43,266 45,739 48,431
Legislative proposal, subject to PAYGO ��������� ��������� ��������� 13,733 24,140 25,742 28,595 29,958 31,650 33,269 34,347 35,365 36,544
Railroad retirement:Social security equivalent
account ������������������������������ 1,728 1,850 2,179 2,269 2,284 2,312 2,345 2,378 2,411 2,445 2,480 2,515Rail pension & supplemental
annuity ������������������������������� 2,717 2,725 2,976 3,034 3,093 3,143 3,192 3,386 3,472 3,671 4,211 4,401Total, Employment and general
retirement ������������������������������� 1,261,651 1,235,856 1,396,417 1,459,415 1,522,912 1,582,100 1,648,178 1,711,275 1,793,026 1,863,580 1,941,305 2,021,695On-budget ������������������������������� (296,223) (291,724) (363,818) (387,823) (405,276) (423,529) (441,374) (458,804) (482,023) (502,142) (524,493) (547,391)Off-budget ������������������������������� (965,428) (944,132) (1,032,599) (1,071,592) (1,117,636) (1,158,571) (1,206,804) (1,252,471) (1,311,003) (1,361,438) (1,416,812) (1,474,304)
Unemployment insurance:Deposits by States 1 ���������������� 36,863 48,146 52,659 52,779 51,006 46,780 44,571 44,608 45,315 46,053 47,321 48,389
Legislative proposal, not subject to PAYGO ��������� ��������� ��������� ��������� –15 –109 –399 –59 –83 –117 –151 –423 –109
Legislative proposal, subject to PAYGO ��������� ��������� ��������� ��������� ��������� ��������� ��������� ��������� ��������� ��������� ��������� ��������� ���������
Federal unemployment receipts 1 ���������������������������� 6,161 6,293 6,503 8,058 9,153 10,419 10,725 10,737 11,593 10,396 10,967 7,552
Railroad unemployment receipts 1 ���������������������������� 80 118 289 322 173 64 53 68 106 146 147 126
Total, Unemployment insurance �� 43,104 54,557 59,451 61,144 60,223 56,864 55,290 55,330 56,897 56,444 58,012 55,958Other retirement:
Federal employees retirement - employee share ����������������� 5,171 5,735 6,114 6,544 6,974 7,420 7,884 8,365 8,852 9,366 9,886 10,432
Non-Federal employees retirement 2 ������������������������ 29 31 31 30 30 30 29 29 28 28 28 28
Total, Other retirement ����������������� 5,200 5,766 6,145 6,574 7,004 7,450 7,913 8,394 8,880 9,394 9,914 10,460Total, Social insurance and
retirement receipts (trust funds) ... 1,309,955 1,296,179 1,462,013 1,527,133 1,590,139 1,646,414 1,711,381 1,774,999 1,858,803 1,929,418 2,009,231 2,088,113On-budget ������������������������������������ (344,527) (352,047) (429,414) (455,541) (472,503) (487,843) (504,577) (522,528) (547,800) (567,980) (592,419) (613,809)Off-budget ������������������������������������ (965,428) (944,132) (1,032,599) (1,071,592) (1,117,636) (1,158,571) (1,206,804) (1,252,471) (1,311,003) (1,361,438) (1,416,812) (1,474,304)
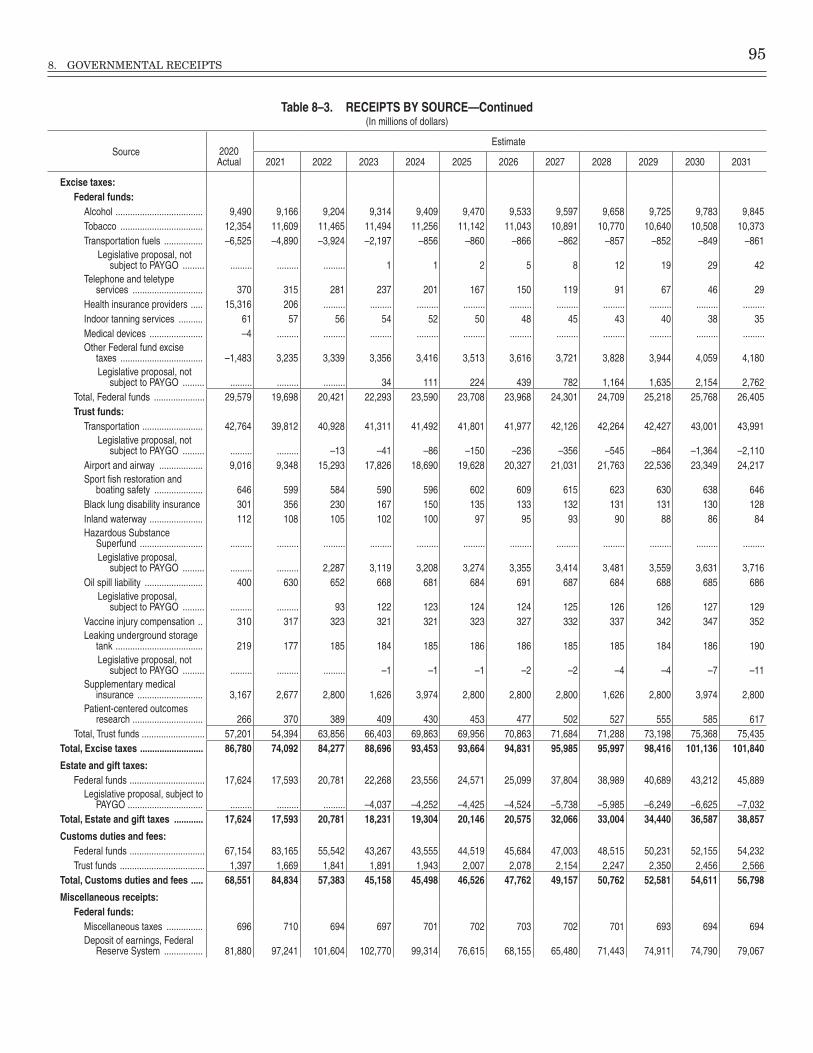
8. GOVERNMENTAL RECEIPTS 95
Table 8–3. RECEIPTS BY SOURCE—Continued(In millions of dollars)
Source 2020 Actual
Estimate
2021 2022 2023 2024 2025 2026 2027 2028 2029 2030 2031
Excise taxes:Federal funds:
Alcohol ������������������������������������ 9,490 9,166 9,204 9,314 9,409 9,470 9,533 9,597 9,658 9,725 9,783 9,845Tobacco ���������������������������������� 12,354 11,609 11,465 11,494 11,256 11,142 11,043 10,891 10,770 10,640 10,508 10,373Transportation fuels ���������������� –6,525 –4,890 –3,924 –2,197 –856 –860 –866 –862 –857 –852 –849 –861
Legislative proposal, not subject to PAYGO ��������� ��������� ��������� ��������� 1 1 2 5 8 12 19 29 42
Telephone and teletype services ����������������������������� 370 315 281 237 201 167 150 119 91 67 46 29
Health insurance providers ����� 15,316 206 ��������� ��������� ��������� ��������� ��������� ��������� ��������� ��������� ��������� ���������Indoor tanning services ���������� 61 57 56 54 52 50 48 45 43 40 38 35Medical devices ���������������������� –4 ��������� ��������� ��������� ��������� ��������� ��������� ��������� ��������� ��������� ��������� ���������Other Federal fund excise
taxes ���������������������������������� –1,483 3,235 3,339 3,356 3,416 3,513 3,616 3,721 3,828 3,944 4,059 4,180Legislative proposal, not
subject to PAYGO ��������� ��������� ��������� ��������� 34 111 224 439 782 1,164 1,635 2,154 2,762Total, Federal funds ��������������������� 29,579 19,698 20,421 22,293 23,590 23,708 23,968 24,301 24,709 25,218 25,768 26,405Trust funds:
Transportation ������������������������� 42,764 39,812 40,928 41,311 41,492 41,801 41,977 42,126 42,264 42,427 43,001 43,991Legislative proposal, not
subject to PAYGO ��������� ��������� ��������� –13 –41 –86 –150 –236 –356 –545 –864 –1,364 –2,110Airport and airway ������������������ 9,016 9,348 15,293 17,826 18,690 19,628 20,327 21,031 21,763 22,536 23,349 24,217Sport fish restoration and
boating safety �������������������� 646 599 584 590 596 602 609 615 623 630 638 646Black lung disability insurance 301 356 230 167 150 135 133 132 131 131 130 128Inland waterway ���������������������� 112 108 105 102 100 97 95 93 90 88 86 84Hazardous Substance
Superfund �������������������������� ��������� ��������� ��������� ��������� ��������� ��������� ��������� ��������� ��������� ��������� ��������� ���������Legislative proposal,
subject to PAYGO ��������� ��������� ��������� 2,287 3,119 3,208 3,274 3,355 3,414 3,481 3,559 3,631 3,716Oil spill liability ������������������������ 400 630 652 668 681 684 691 687 684 688 685 686
Legislative proposal, subject to PAYGO ��������� ��������� ��������� 93 122 123 124 124 125 126 126 127 129
Vaccine injury compensation �� 310 317 323 321 321 323 327 332 337 342 347 352Leaking underground storage
tank ������������������������������������ 219 177 185 184 185 186 186 185 185 184 186 190Legislative proposal, not
subject to PAYGO ��������� ��������� ��������� ��������� –1 –1 –1 –2 –2 –4 –4 –7 –11Supplementary medical
insurance ��������������������������� 3,167 2,677 2,800 1,626 3,974 2,800 2,800 2,800 1,626 2,800 3,974 2,800Patient-centered outcomes
research ����������������������������� 266 370 389 409 430 453 477 502 527 555 585 617Total, Trust funds �������������������������� 57,201 54,394 63,856 66,403 69,863 69,956 70,863 71,684 71,288 73,198 75,368 75,435
Total, Excise taxes .......................... 86,780 74,092 84,277 88,696 93,453 93,664 94,831 95,985 95,997 98,416 101,136 101,840
Estate and gift taxes:Federal funds ������������������������������� 17,624 17,593 20,781 22,268 23,556 24,571 25,099 37,804 38,989 40,689 43,212 45,889
Legislative proposal, subject to PAYGO ������������������������������� ��������� ��������� ��������� –4,037 –4,252 –4,425 –4,524 –5,738 –5,985 –6,249 –6,625 –7,032
Total, Estate and gift taxes ............ 17,624 17,593 20,781 18,231 19,304 20,146 20,575 32,066 33,004 34,440 36,587 38,857
Customs duties and fees:Federal funds ������������������������������� 67,154 83,165 55,542 43,267 43,555 44,519 45,684 47,003 48,515 50,231 52,155 54,232Trust funds ����������������������������������� 1,397 1,669 1,841 1,891 1,943 2,007 2,078 2,154 2,247 2,350 2,456 2,566
Total, Customs duties and fees ..... 68,551 84,834 57,383 45,158 45,498 46,526 47,762 49,157 50,762 52,581 54,611 56,798
Miscellaneous receipts:Federal funds:
Miscellaneous taxes ��������������� 696 710 694 697 701 702 703 702 701 693 694 694Deposit of earnings, Federal
Reserve System ���������������� 81,880 97,241 101,604 102,770 99,314 76,615 68,155 65,480 71,443 74,911 74,790 79,067
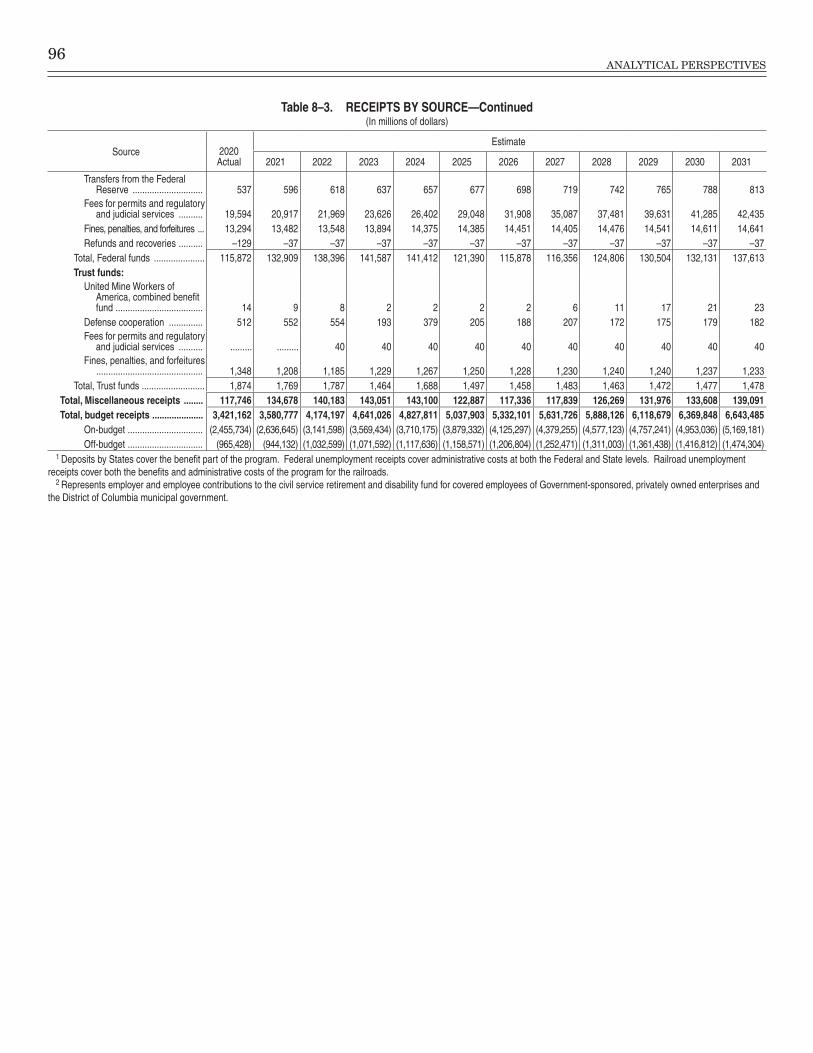
96ANALYTICAL PERSPECTIVES
Table 8–3. RECEIPTS BY SOURCE—Continued(In millions of dollars)
Source 2020 Actual
Estimate
2021 2022 2023 2024 2025 2026 2027 2028 2029 2030 2031
Transfers from the Federal Reserve ����������������������������� 537 596 618 637 657 677 698 719 742 765 788 813
Fees for permits and regulatory and judicial services ���������� 19,594 20,917 21,969 23,626 26,402 29,048 31,908 35,087 37,481 39,631 41,285 42,435
Fines, penalties, and forfeitures ��� 13,294 13,482 13,548 13,894 14,375 14,385 14,451 14,405 14,476 14,541 14,611 14,641Refunds and recoveries ���������� –129 –37 –37 –37 –37 –37 –37 –37 –37 –37 –37 –37
Total, Federal funds ��������������������� 115,872 132,909 138,396 141,587 141,412 121,390 115,878 116,356 124,806 130,504 132,131 137,613Trust funds:
United Mine Workers of America, combined benefit fund ������������������������������������ 14 9 8 2 2 2 2 6 11 17 21 23
Defense cooperation �������������� 512 552 554 193 379 205 188 207 172 175 179 182Fees for permits and regulatory
and judicial services ���������� ��������� ��������� 40 40 40 40 40 40 40 40 40 40Fines, penalties, and forfeitures
�������������������������������������������� 1,348 1,208 1,185 1,229 1,267 1,250 1,228 1,230 1,240 1,240 1,237 1,233Total, Trust funds �������������������������� 1,874 1,769 1,787 1,464 1,688 1,497 1,458 1,483 1,463 1,472 1,477 1,478
Total, Miscellaneous receipts ........ 117,746 134,678 140,183 143,051 143,100 122,887 117,336 117,839 126,269 131,976 133,608 139,091Total, budget receipts ..................... 3,421,162 3,580,777 4,174,197 4,641,026 4,827,811 5,037,903 5,332,101 5,631,726 5,888,126 6,118,679 6,369,848 6,643,485
On-budget ������������������������������� (2,455,734) (2,636,645) (3,141,598) (3,569,434) (3,710,175) (3,879,332) (4,125,297) (4,379,255) (4,577,123) (4,757,241) (4,953,036) (5,169,181)Off-budget ������������������������������� (965,428) (944,132) (1,032,599) (1,071,592) (1,117,636) (1,158,571) (1,206,804) (1,252,471) (1,311,003) (1,361,438) (1,416,812) (1,474,304)
1 Deposits by States cover the benefit part of the program� Federal unemployment receipts cover administrative costs at both the Federal and State levels� Railroad unemployment receipts cover both the benefits and administrative costs of the program for the railroads�
2 Represents employer and employee contributions to the civil service retirement and disability fund for covered employees of Government-sponsored, privately owned enterprises and the District of Columbia municipal government�
97
9. OFFSETTING COLLECTIONS AND OFFSETTING RECEIPTS
I. INTRODUCTION AND BACKGROUND
The Government records money collected in one of two ways. It is either recorded as a governmental receipt and included in the amount reported on the receipts side of the budget or it is recorded as an offsetting col-lection or offsetting receipt, which reduces (or “offsets”) the amount reported on the outlay side of the budget. Governmental receipts are discussed in the previous chapter, “Governmental Receipts.” The first section of this chapter broadly discusses offsetting collections and offsetting receipts. The second section discusses user charges, which consist of a subset of offsetting collections and offsetting receipts and a small share of governmental receipts. The third section describes the user charge pro-posals in the 2022 Budget.
Offsetting collections and offsetting receipts are re-corded as offsets to spending so that the budget totals for receipts and (net) outlays reflect the amount of resources allocated by the Government through collective politi-cal choice, rather than through the marketplace.1 This practice ensures that the budget totals measure the trans-actions of the Government with the public, and avoids the double counting that would otherwise result when one account makes a payment to another account and the receiving account then spends the proceeds. Offsetting receipts and offsetting collections are recorded in the bud-get in one of two ways, based on interpretation of laws and longstanding budget concepts and practice. They are offsetting collections when the collections are authorized to be credited to expenditure accounts. Otherwise, they are deposited in receipt accounts and called offsetting receipts.
There are two sources of offsetting receipts and offset-ting collections: from the public and from other budget accounts. Like governmental receipts, offsetting receipts and offsetting collections from the public reduce the defi-cit or increase the surplus. In contrast, offsetting receipts and offsetting collections resulting from transactions with other budget accounts, called intragovernmental transactions, exactly offset the payments made by these accounts, with no net impact on the deficit or surplus.2 In 2020, offsetting receipts and offsetting collections from the public were $625 billion, while receipts and collections from intragovernmental transactions were $1,314 billion, for a total of $1,939 billion Government-wide.
1 Showing collections from business-type transactions as offsets on the spending side of the budget follows the concept recommended by the Report of the President’s Commission on Budget Concepts in 1967 and is discussed in Chapter 6 of this volume, “Budget Concepts.’’
2 For the purposes of this discussion, “collections from the public” include collections from non-budgetary Government accounts, such as credit financing accounts and deposit funds. For more information on these non-budgetary accounts, see Chapter 7, “Coverage of the Budget.”
As described above, intragovernmental transactions are responsible for the majority of offsetting collections and offsetting receipts, when measured by the magnitude of the dollars collected. Examples of intragovernmental transactions include interest payments to funds that hold Government securities (such as the Social Security trust funds), general fund transfers to civilian and military re-tirement pension and health benefits funds, and agency payments to funds for employee health insurance and re-tirement benefits. Although receipts and collections from intragovernmental collections exactly offset the payments themselves, with no effect on the deficit or surplus, it is im-portant to record these transactions in the budget to show how much the Government is allocating to fund various programs. For example, in the case of civilian retirement pensions, Government agencies make accrual payments to the Civil Service Retirement and Disability Fund on behalf of current employees to fund their future retire-ment benefits; the receipt of these payments to the Fund is shown in a single receipt account. Recording the receipt of these payments is important because it demonstrates the total cost to the Government today of providing this future benefit.
Offsetting receipts and collections from the public com-prise approximately one-third of total offsetting collections and offsetting receipts, when measured by the magnitude of the dollars collected. Most of the funds collected through offsetting collections and offsetting receipts from the pub-lic arise from business-like transactions with the public. Unlike governmental receipts, which are derived from the Government’s exercise of its sovereign power, these offsetting collections and offsetting receipts arise primar-ily from voluntary payments from the public for goods or services provided by the Government. They are classified as offsets to outlays for the cost of producing the goods or services for sale, rather than as governmental receipts. These activities include the sale of postage stamps, land, timber, and electricity; charging fees for services provided to the public (e.g., admission to National parks); and col-lecting premiums for healthcare benefits (e.g., Medicare Parts B and D). As described above, treating offsetting collections and offsetting receipts as offsets to outlays en-sures the budgetary totals represent governmental rather than market activity.
A relatively small portion ($20.1 billion in 2020) of off-setting collections and offsetting receipts from the public is derived from the Government’s exercise of its sover-eign power. From a conceptual standpoint, these should be classified as governmental receipts. However, they are classified as offsetting rather than governmental receipts either because this classification has been specified in law or because these collections have traditionally been classi-
98ANALYTICAL PERSPECTIVES
fied as offsets to outlays. Most of the offsetting collections and offsetting receipts in this category derive from fees from Government regulatory services or Government li-censes, and include, for example, charges for regulating the nuclear energy industry, bankruptcy filing fees, and immigration fees.3
The final source of offsetting collections and offset-ting receipts from the public is gifts. Gifts are voluntary contributions to the Government to support particular purposes or reduce the amount of Government debt held by the public.
The spending associated with the activities that gener-ate offsetting collections and offsetting receipts from the public is included in total or “gross outlays.” Offsetting collections and offsetting receipts from the public are subtracted from gross outlays to the public to yield “net outlays,” which is the most common measure of outlays cited and generally referred to as simply “outlays.” 4 For 2020, gross outlays to the public were $7,176 billion, or 34.2 percent of GDP and offsetting collections and off-setting receipts from the public were $625 billion, or 3.0 percent of GDP, resulting in net outlays of $6,550 billion or 31.2 percent of GDP. Government-wide net outlays re-flect the Government’s net disbursements to the public and are subtracted from governmental receipts to derive the Government’s deficit or surplus. For 2020, governmen-tal receipts were $3,421 billion, or 16.3 percent of GDP, and the deficit was $3,129 billion, or 14.9 percent of GDP.
Although both offsetting collections and offsetting re-ceipts are subtracted from gross outlays to derive net outlays, they are treated differently when it comes to ac-counting for specific programs and agencies. Offsetting collections are usually authorized to be spent for the purposes of an expenditure account and are generally available for use when collected, without further action by the Congress. Therefore, offsetting collections are record-ed as offsets to spending within expenditure accounts, so that the account total highlights the net flow of funds.
Like governmental receipts, offsetting receipts are credited to receipt accounts, and any spending of the re-ceipts is recorded in separate expenditure accounts. As a result, the budget separately displays the flow of funds into and out of the Government. Offsetting receipts may
3 This category of receipts is known as “offsetting governmental re-ceipts.” Some argue that regulatory or licensing fees should be viewed as payments for a particular service or for the right to engage in a par-ticular type of business. However, these fees are conceptually much more similar to taxes because they are compulsory, and they fund activities that are intended to provide broadly dispersed benefits, such as protect-ing the health of the public. Reclassifying these fees as governmental receipts could require a change in law, and because of conventions for scoring appropriations bills, would make it impossible for fees that are controlled through annual appropriations acts to be scored as offsets to discretionary spending.
4 Gross outlays to the public are derived by subtracting intragovern-mental outlays from gross outlays. For 2020, gross outlays were $8,489 billion and intragovernmental outlays were $1,314 billion.
or may not be designated for a specific purpose, depending on the legislation that authorizes their collection. If des-ignated for a particular purpose, the offsetting receipts may, in some cases, be spent without further action by the Congress. When not designated for a particular purpose, offsetting receipts are credited to the general fund, which contains all funds not otherwise allocated and which is used to finance Government spending that is not financed out of dedicated funds. In some cases where the receipts are designated for a particular purpose, offsetting re-ceipts are reported in a particular agency and reduce or offset the outlays reported for that agency. In other cases, the offsetting receipts are “undistributed,” which means they reduce total Government outlays, but not the outlays of any particular agency.
Table 9–1 summarizes offsetting collections and offset-ting receipts from the public. The amounts shown in the table are not evident in the commonly cited budget mea-sure of outlays, which is already net of these collections and receipts. For 2022, the table shows that total offsetting collections and offsetting receipts from the public are esti-mated to be $590.1 billion or 2.5 percent of GDP. Of these, an estimated $243.8 billion are offsetting collections and an estimated $346.3 billion are offsetting receipts. Table 9–1 also identifies those offsetting collections and offset-ting receipts that are considered user charges, as defined and discussed below.
As shown in the table, major offsetting collections from the public include proceeds from Postal Service sales, electrical power sales, loan repayments to the Commodity Credit Corporation for loans made prior to enactment of the Federal Credit Reform Act, and Federal employee pay-ments for health insurance. As also shown in the table, major offsetting receipts from the public include premi-ums for Medicare Parts B and D, proceeds from military assistance program sales, rents and royalties from Outer Continental Shelf oil extraction, and interest income.
Tables 9–2 and 9–3 provide further detail about off-setting receipts, including both offsetting receipts from the public (as summarized in Table 9–1) and intragov-ernmental transactions. Table 9–5, “Offsetting Receipts by Type,” and Table 9–6, “Offsetting Collections and Offsetting Receipts, Detail—FY 2022 Budget,” which is a complete listing by account, are available at https://www.whitehouse.gov/omb/analytical-perspectives/. In total, offsetting receipts are estimated to be $1,291.2 bil-lion in 2022; $944.9 billion are from intragovernmental transactions and $346.3 billion are from the public. The offsetting receipts from the public consist of proprietary receipts ($333.2 billion), which are those resulting from business-like transactions such as the sale of goods or services, and offsetting governmental receipts, which, as discussed above, are derived from the exercise of the Government’s sovereign power and, absent a specification in law or a long-standing practice, would be classified on the receipts side of the budget ($13.1 billion).
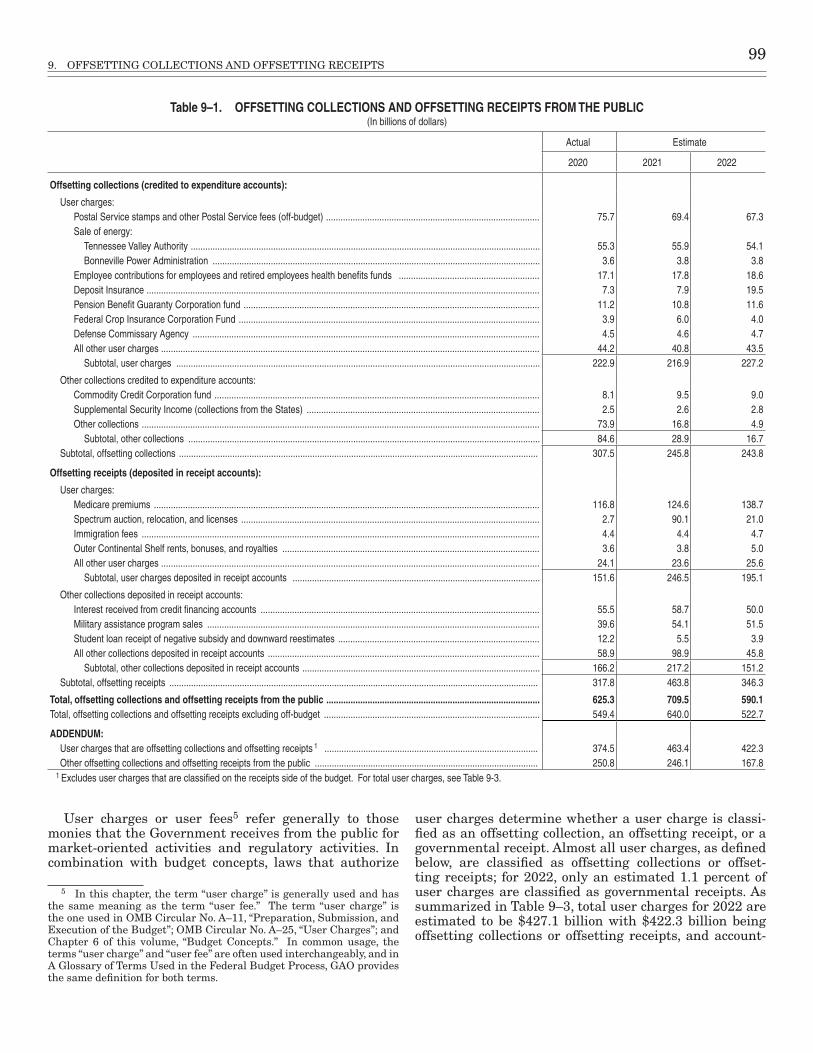
9. OFFSETTING COLLECTIONS AND OFFSETTING RECEIPTS 99
Table 9–1. OFFSETTING COLLECTIONS AND OFFSETTING RECEIPTS FROM THE PUBLIC(In billions of dollars)
Actual Estimate
2020 2021 2022
Offsetting collections (credited to expenditure accounts):
User charges:Postal Service stamps and other Postal Service fees (off-budget) ���������������������������������������������������������������������������������������� 75�7 69�4 67�3Sale of energy:
Tennessee Valley Authority ������������������������������������������������������������������������������������������������������������������������������������������������ 55�3 55�9 54�1Bonneville Power Administration ��������������������������������������������������������������������������������������������������������������������������������������� 3�6 3�8 3�8
Employee contributions for employees and retired employees health benefits funds ���������������������������������������������������������� 17�1 17�8 18�6Deposit Insurance ������������������������������������������������������������������������������������������������������������������������������������������������������������������ 7�3 7�9 19�5Pension Benefit Guaranty Corporation fund �������������������������������������������������������������������������������������������������������������������������� 11�2 10�8 11�6Federal Crop Insurance Corporation Fund ���������������������������������������������������������������������������������������������������������������������������� 3�9 6�0 4�0Defense Commissary Agency ����������������������������������������������������������������������������������������������������������������������������������������������� 4�5 4�6 4�7All other user charges ������������������������������������������������������������������������������������������������������������������������������������������������������������ 44�2 40�8 43�5
Subtotal, user charges ������������������������������������������������������������������������������������������������������������������������������������������������������ 222�9 216�9 227�2
Other collections credited to expenditure accounts:Commodity Credit Corporation fund �������������������������������������������������������������������������������������������������������������������������������������� 8�1 9�5 9�0Supplemental Security Income (collections from the States) ������������������������������������������������������������������������������������������������ 2�5 2�6 2�8Other collections �������������������������������������������������������������������������������������������������������������������������������������������������������������������� 73�9 16�8 4�9
Subtotal, other collections ������������������������������������������������������������������������������������������������������������������������������������������������� 84�6 28�9 16�7Subtotal, offsetting collections ���������������������������������������������������������������������������������������������������������������������������������������������������� 307�5 245�8 243�8
Offsetting receipts (deposited in receipt accounts):
User charges:Medicare premiums ��������������������������������������������������������������������������������������������������������������������������������������������������������������� 116�8 124�6 138�7Spectrum auction, relocation, and licenses ��������������������������������������������������������������������������������������������������������������������������� 2�7 90�1 21�0Immigration fees �������������������������������������������������������������������������������������������������������������������������������������������������������������������� 4�4 4�4 4�7Outer Continental Shelf rents, bonuses, and royalties ���������������������������������������������������������������������������������������������������������� 3�6 3�8 5�0All other user charges ������������������������������������������������������������������������������������������������������������������������������������������������������������ 24�1 23�6 25�6
Subtotal, user charges deposited in receipt accounts ������������������������������������������������������������������������������������������������������ 151�6 246�5 195�1
Other collections deposited in receipt accounts:Interest received from credit financing accounts ������������������������������������������������������������������������������������������������������������������� 55�5 58�7 50�0Military assistance program sales ����������������������������������������������������������������������������������������������������������������������������������������� 39�6 54�1 51�5Student loan receipt of negative subsidy and downward reestimates ����������������������������������������������������������������������������������� 12�2 5�5 3�9All other collections deposited in receipt accounts ���������������������������������������������������������������������������������������������������������������� 58�9 98�9 45�8
Subtotal, other collections deposited in receipt accounts �������������������������������������������������������������������������������������������������� 166�2 217�2 151�2Subtotal, offsetting receipts �������������������������������������������������������������������������������������������������������������������������������������������������������� 317�8 463�8 346�3
Total, offsetting collections and offsetting receipts from the public ........................................................................................ 625.3 709.5 590.1Total, offsetting collections and offsetting receipts excluding off-budget ����������������������������������������������������������������������������������������� 549�4 640�0 522�7
ADDENDUM:User charges that are offsetting collections and offsetting receipts 1 ���������������������������������������������������������������������������������������� 374�5 463�4 422�3Other offsetting collections and offsetting receipts from the public �������������������������������������������������������������������������������������������� 250�8 246�1 167�8
1 Excludes user charges that are classified on the receipts side of the budget� For total user charges, see Table 9-3�
User charges or user fees5 refer generally to those monies that the Government receives from the public for market-oriented activities and regulatory activities. In combination with budget concepts, laws that authorize
5 In this chapter, the term “user charge” is generally used and has the same meaning as the term “user fee.” The term “user charge” is the one used in OMB Circular No. A–11, “Preparation, Submission, and Execution of the Budget”; OMB Circular No. A–25, “User Charges”; and Chapter 6 of this volume, “Budget Concepts.” In common usage, the terms “user charge” and “user fee” are often used interchangeably, and in A Glossary of Terms Used in the Federal Budget Process, GAO provides the same definition for both terms.
user charges determine whether a user charge is classi-fied as an offsetting collection, an offsetting receipt, or a governmental receipt. Almost all user charges, as defined below, are classified as offsetting collections or offset-ting receipts; for 2022, only an estimated 1.1 percent of user charges are classified as governmental receipts. As summarized in Table 9–3, total user charges for 2022 are estimated to be $427.1 billion with $422.3 billion being offsetting collections or offsetting receipts, and account-

100ANALYTICAL PERSPECTIVES
Table 9–2. SUMMARY OF OFFSETTING RECEIPTS BY TYPE(In millions of dollars)
Receipt Type Actual 2020
Estimate
2021 2022 2023 2024 2025 2026
Intragovernmental ������������������������������������������������������������������������������ 932,528 1,187,035 944,891 983,443 1,030,794 1,079,325 1,135,822
Receipts from non-Federal sources:Proprietary ������������������������������������������������������������������������������������� 303,363 366,321 333,202 346,143 360,638 375,676 385,943Offsetting governmental ���������������������������������������������������������������� 14,455 97,438 13,065 14,866 15,173 15,416 15,533
Total, receipts from non-Federal sources �������������������������������� 317,818 463,759 346,267 361,009 375,811 391,092 401,476Total, offsetting receipts ����������������������������������������������������������������� 1,250,346 1,650,794 1,291,158 1,344,452 1,406,605 1,470,417 1,537,298
ing for more than two-thirds of all offsetting collections and offsetting receipts from the public.6
Definition. In this chapter, user charges refer to fees, charges, and assessments levied on individuals or orga-nizations directly benefiting from or subject to regulation by a Government program or activity, where the payers do not represent a broad segment of the public such as those who pay income taxes.
Examples of business-type or market-oriented user charges and regulatory and licensing user charges include those charges listed in Table 9-1 for offsetting collections and offsetting receipts. User charges exclude certain off-setting collections and offsetting receipts from the public, such as payments received from credit programs, and in-terest, and also exclude payments from one part of the Federal Government to another. In addition, user charges do not include dedicated taxes (such as taxes paid to so-cial insurance programs or excise taxes on gasoline) or customs duties, fines, penalties, or forfeitures.
Alternative definitions. The definition for user charges used in this chapter follows the definition used in OMB Circular No. A–25, “User Charges,” which provides policy guidance to Executive Branch Agencies on setting the amount for user charges. Alternative definitions may be used for other purposes. Much of the discussion of user charges below—their purpose, when they should be lev-ied, and how the amount should be set—applies to these alternative definitions as well.
A narrower definition of user charges could be limited to proceeds from the sale of goods and services, excluding the proceeds from the sale of assets, and to proceeds that are dedicated to financing the goods and services being provided. This definition is similar to one the House of Representatives uses as a guide for purposes of commit-tee jurisdiction. (See the Congressional Record, January 3, 1991, p. H31, item 8.) The definition of user charges could be even narrower by excluding regulatory fees and focus-ing solely on business-type transactions. Alternatively, the user charge definition could be broader than the one
6 User charge totals presented in this chapter include collections from accounts classified as containing user fee data. OMB accounts are classified as containing user fee data if more than half of collections are estimated to include user charges. Consequently, totals may include col-lections that are not user charges in accounts that meet the threshold and exclude user charges in accounts that do not meet the threshold.
used in this chapter by including beneficiary- or liability-based excise taxes.7
What is the purpose of user charges? User charges are intended to improve the efficiency and equity of fi-nancing certain Government activities. Charging users for activities that benefit a relatively limited number of people reduces the burden on the general taxpayer, as does charging regulated parties for regulatory activities in a particular sector.
User charges that are set to cover the costs of production of goods and services can result in more efficient resource allocation within the economy. When buyers are charged the cost of providing goods and services, they make better cost-benefit calculations regarding the size of their pur-chase, which in turn signals to the Government how much of the goods or services it should provide. Prices in pri-vate, competitive markets serve the same purposes. User charges for goods and services that do not have special social or distributional benefits may also improve equity or fairness by requiring those who benefit from an activity to pay for it and by not requiring those who do not benefit from an activity to pay for it.
When should the Government impose a charge? Discussions of whether to finance spending with a tax or a fee often focus on whether the benefits of the activity accrue to the public in general or to a limited group of peo-ple. In general, if the benefits of spending accrue broadly to the public or include special social or distributional benefits, then the program should be financed by taxes paid by the public. In contrast, if the benefits accrue to a limited number of private individuals or organizations and do not include special social or distributional benefits, then the program should be financed by charges paid by the private beneficiaries. For Federal programs where the benefits are entirely public or entirely private, apply-ing this principle can be relatively easy. For example, the benefits from national defense accrue to the public in gen-eral, and according to this principle should be (and are) financed by taxes. In contrast, the benefits of electricity
7 Beneficiary- and liability-based taxes are terms taken from the Congressional Budget Office, The Growth of Federal User Charges, Au-gust 1993, and updated in October 1995. Gasoline taxes are an example of beneficiary-based taxes. An example of a liability-based tax is the ex-cise tax that formerly helped fund the hazardous substance superfund in the Environmental Protection Agency. This tax was paid by industry groups to finance environmental cleanup activities related to the indus-try activity but not necessarily caused by the payer of the fee.

9. OFFSETTING COLLECTIONS AND OFFSETTING RECEIPTS 101
Table 9–3. GROSS OUTLAYS, USER CHARGES, OTHER OFFSETTING COLLECTIONS AND OFFSETTING RECEIPTS FROM THE PUBLIC, AND NET OUTLAYS
(In billions of dollars)
Actual 2020
Estimate
2021 2022
Gross outlays to the public ������������������������������������������������������������������������������������������������������������������������ 7,175�7 7,959�0 6,601�2
Offsetting collections and offsetting receipts from the public:User charges 1 ������������������������������������������������������������������������������������������������������������������������������������� 374�5 463�4 422�3Other ����������������������������������������������������������������������������������������������������������������������������������������������������� 250�8 246�1 167�8
Subtotal, offsetting collections and offsetting receipts from the public ������������������������������������������������������ 625�3 709�5 590�1Net outlays ������������������������������������������������������������������������������������������������������������������������������������������������� 6,550�4 7,249�5 6,011�1
1 $4�4 billion of the total user charges for 2020 were classified as governmental receipts, and the remainder were classified as offsetting collections and offsetting receipts� $4�2 billion and $4�8 billion of the total user charges for 2021 and 2022 are classified as governmental receipts, respectively�
sold by the Tennessee Valley Authority accrue primarily to those using the electricity, and should be (and predomi-nantly are) financed by user charges.
In many cases, however, an activity has benefits that accrue to both public and private groups, and it may be difficult to identify how much of the benefits accrue to each. Because of this, it can be difficult to know how much of the program should be financed by taxes and how much by fees. For example, the benefits from recreation areas are mixed. Fees for visitors to these areas are appropri-ate because the visitors benefit directly from their visit, but the public in general also benefits because these ar-eas protect the Nation’s natural and historic heritage now and for posterity. For this reason, visitor recreation fees generally cover only part of the cost to the Government of maintaining the recreation property. Where a fee may be appropriate to finance all or part of an activity, the extent to which a fee can be easily administered must be con-sidered. For example, if fees are charged for entering or using Government-owned land then there must be clear points of entry onto the land and attendants patrolling and monitoring the land’s use.
What amount should be charged? When the Government is acting in its capacity as sovereign and where user charges are appropriate, such as for some regulatory activities, current policy supports setting fees equal to the full cost to the Government, including both direct and indirect costs. When the Government is not acting in its capacity as sovereign and engages in a pure-ly business-type transaction (such as leasing or selling
goods, services, or resources), market price is generally the basis for establishing the fee.8 If the Government is engaged in a purely business-type transaction and eco-nomic resources are allocated efficiently, then this market price should be equal to or greater than the Government’s full cost of production.
Classification of user charges in the budget. As shown in the note to Table 9–3, most user charges are classified as offsets to outlays on the spending side of the budget, but a few are classified on the receipts side of the budget. An estimated $4.8 billion in 2022 of user charges are classified on the receipts side and are included in the governmental receipts totals described in the previous chapter, “Governmental Receipts.” They are classified as receipts because they are regulatory charges collected by the Federal Government by the exercise of its sovereign powers. Examples include filing fees in the United States courts and agricultural quarantine inspection fees.
The remaining user charges, an estimated $422.3 bil-lion in 2022, are classified as offsetting collections and offsetting receipts on the spending side of the Budget. As discussed above in the context of all offsetting collections and offsetting receipts, some of these user charges are col-lected by the Federal Government by the exercise of its sovereign powers and conceptually should appear on the receipts side of the budget, but they are required by law or a long-standing practice to be classified on the spend-ing side.
8 Policies for setting user charges are promulgated in OMB Circular No. A–25: “User Charges’’ (July 8, 1993).
III. USER CHARGE PROPOSALS
As shown in Table 9–1, an estimated $227.2 billion of user charges for 2022 will be credited directly to ex-penditure accounts and will generally be available for expenditure when they are collected, without further ac-tion by the Congress. An estimated $195.1 billion of user charges for 2022 will be deposited in offsetting receipt ac-counts and will be available to be spent only according to the legislation that established the charges.
As shown in Table 9–4, the Administration is proposing new or increased user charges that would, in the aggre-gate, increase collections by an estimated $616 million in
2022 and an average of $655 million per year from 2023 through 2031. These estimates reflect only the amounts to be collected; they do not include related spending. Proposals are classified as either discretionary or manda-tory, as those terms are defined in the Balanced Budget and Emergency Deficit Control Act of 1985, as amended. All user charge proposals in the 2022 Budget are clas-sified as discretionary. “Discretionary” refers to user charges controlled through annual appropriations acts and generally under the jurisdiction of the appropriations committees in the Congress. “Mandatory” refers to user

102ANALYTICAL PERSPECTIVES
Table 9–4. USER CHARGE PROPOSALS IN THE FY 2022 BUDGET 1
(Estimated collections in millions of dollars)
2022 2023 2024 2025 2026 2027 2028 2029 2030 20312022-2026
2022-2031
OFFSETTING COLLECTIONS AND OFFSETTING RECEIPTS
DISCRETIONARY:
Offsetting collections
Department of Health and Human ServicesFood and Drug Administration (FDA): Increase export certification user
fee cap �������������������������������������������������������������������������������������������������� 4 4 4 4 4 4 4 4 4 4 20 40FDA: Increase tobacco product user fee ��������������������������������������������������� 100 103 105 108 110 113 116 119 122 125 526 1,121
Department of StateEstablish The National Museum of American Diplomacy rental fee ���������� * * * * * * * * * * * *
Commodity Futures Trading Commission (CFTC)Establish CFTC user fee ���������������������������������������������������������������������������� 116 121 126 131 136 141 146 152 158 164 630 1,391
Offsetting receipts
Department of StateExtend Western Hemisphere Travel Initiative surcharge ��������������������������� 385 385 385 385 385 385 385 385 385 385 1,925 3,850Increase Border Crossing Card fee ����������������������������������������������������������� 11 11 11 11 11 11 11 11 11 11 55 110
Subtotal, discretionary user charge proposals �������������������������������� 616 624 631 639 646 654 662 671 680 689 3,156 6,512
Total, user charge proposals ...................................................................... 616 624 631 639 646 654 662 671 680 689 3,156 6,5121 A positive sign indicates an increase in collections�* $500,000 or less
charges controlled by permanent laws and under the ju-risdiction of the authorizing committees. These and other terms are discussed further in this volume in Chapter 6, “Budget Concepts.”
Discretionary User Charge Proposals
1. Offsetting collections
Department of Health and Human Services
Food and Drug Administration (FDA): Increase export certification user fee cap. Firms exporting products from the United States are often asked by foreign customers or foreign governments to supply a “certificate” for products regulated by the FDA to document the product’s regu-latory or marketing status. The proposal increases the maximum user fee cap from $175 per export certification to $600 to meet FDA’s true cost of issuing export certifi-cates and to ensure better and faster service for American companies that request the service.
FDA: Increase tobacco product user fee. Currently, FDA’s regulation of all tobacco products is financed through user fees collected from six product categories: cigarettes, roll your own tobacco, snuff, chewing tobacco, cigars, and pipe tobacco. This proposal would expand FDA’s tobacco user fees and include user fee assessments on e-cigarettes and other electronic nicotine delivery sys-tems (ENDS) manufacturers, which currently do not pay
user fees, and increase the current limitation on total tobacco user fee collections by $100 million in 2022. To ensure that resources keep up with new tobacco products, the proposal would also index future collections to infla-tion. The expansion of tobacco user fees will strengthen FDA’s ability to respond to the growth of newer products such as e-cigarettes through investments in regulatory science, enforcement, and premarket review of product applications.
Department of State
Establish The National Museum of American Diplomacy rental fee. This new user fee will enable the Department of State to provide support, on a cost-recovery basis, to out-side organizations for programs and conference activities held at The National Museum of American Diplomacy.
Commodity Futures Trading Commission (CFTC)
Establish CFTC user fee. The Budget proposes an amendment to the Commodity Exchange Act authorizing the CFTC to collect user fees to fund the Commission’s activities, like other Federal financial and banking reg-ulators. Fee funding would shift the costs of services provided by CFTC from the general taxpayer to the pri-mary beneficiaries of CFTC oversight. Contingent upon enactment of legislation authorizing the CFTC to collect fees, the Administration proposes that collections begin in 2022 to offset a portion of CFTC’s annual appropriation.

9. OFFSETTING COLLECTIONS AND OFFSETTING RECEIPTS 103
2. Offsetting receipts
Department of State
Extend Western Hemisphere Travel Initiative sur-charge. The Administration proposes to permanently extend the authority for the Department of State to col-lect the Western Hemisphere Travel Initiative surcharge. The surcharge was initially enacted by the Passport Services Enhancement Act of 2005 (P.L. 109–167) to cover the Department’s costs of meeting increased demand for
passports, which resulted from the implementation of the Western Hemisphere Travel Initiative.
Increase Border Crossing Card (BCC) fee. The Budget includes a proposal to allow the fee charged for BCC mi-nor applicants to be set administratively, rather than statutorily, at one-half the fee charged for processing an adult border crossing card. Administrative fee setting will allow the fee to better reflect the associated cost of service, consistent with other fees charged for consular services. As a result of this change, annual BCC fee collections be-ginning in 2022 are projected to increase by $11 million (from $3 million to $14 million).


105
10. TAX EXPENDITURES
The Congressional Budget Act of 1974 (Public Law 93–344) requires that a list of “tax expenditures’’ be included in the budget. Tax expenditures are defined in the law as “revenue losses attributable to provisions of the Federal tax laws which allow a special exclusion, exemption, or deduction from gross income or which provide a special credit, a preferential rate of tax, or a deferral of tax liabil-ity.’’ These exceptions may be viewed as alternatives to other policy instruments, such as spending or regulatory programs.
Identification and measurement of tax expenditures de-pends crucially on the baseline tax system against which the actual tax system is compared. The tax expenditure estimates presented in this document are patterned on a comprehensive income tax, which defines income as the sum of consumption and the change in net wealth in a given period of time.
An important assumption underlying each tax expen-diture estimate reported below is that other parts of the Tax Code remain unchanged. The estimates would be dif-ferent if tax expenditures were changed simultaneously because of potential interactions among provisions. For that reason, this document does not present a grand total for the estimated tax expenditures.
Tax expenditures relating to the individual and corporate income taxes are estimated for fiscal years 2020–2030 using two methods of accounting: current tax receipt effects and present value effects. The present val-ue approach provides estimates of the receipt effects for tax expenditures that generally involve deferrals of tax payments into the future.
TAX EXPENDITURES IN THE INCOME TAX
Tax Expenditure Estimates
All tax expenditure estimates and descriptions pre-sented here are based upon current tax law enacted as of December 31, 2020, and reflect the economic assumptions from the 2022 Budget. In some cases, expired or repealed provisions are listed if their tax receipt effects occur in fiscal year 2020 or later.
The total receipt effects for tax expenditures for fiscal years 2020–2030 are displayed according to the Budget’s functional categories in Table 10–1. Descriptions of the specific tax expenditure provisions follow the discussion of general features of the tax expenditure concept.
Two baseline concepts—the normal tax baseline and the reference tax law baseline—are used to identify and estimate tax expenditures.1 For the most part, the two concepts coincide. However, items treated as tax expendi-tures under the normal tax baseline, but not the reference tax law baseline, are indicated by the designation “nor-mal tax method’’ in the tables. The receipt effects for these items are zero using the reference tax law. The alternative baseline concepts are discussed in detail below.
Tables 10–2A and 10–2B report separately the respec-tive portions of the total receipt effects that arise under the individual and corporate income taxes. The location of the estimates under the individual and corporate head-ings does not imply that these categories of filers benefit
1 These baseline concepts are thoroughly discussed in Special Analy-sis G of the 1985 Budget, where the former is referred to as the pre-1983 method and the latter the post-1982 method.
from the special tax provisions in proportion to the re-spective tax expenditure amounts shown. Rather, these breakdowns show the form of tax liability that the various provisions affect. The ultimate beneficiaries of corpo-rate tax expenditures could be shareholders, employees, customers, or other providers of capital, depending on eco-nomic forces.
Table 10–3 ranks the major tax expenditures by the size of their 2021–2030 receipt effect. The first column provides the number of the provision in order to cross ref-erence this table to Tables 10–1, 10–2A, and 10–2B, as well as to the descriptions below.
Interpreting Tax Expenditure Estimates
The estimates shown for individual tax expenditures in Tables 10–1 through 10–3 do not necessarily equal the increase in Federal receipts (or the change in the budget balance) that would result from repealing these special provisions, for the following reasons.
First, eliminating a tax expenditure may have incen-tive effects that alter economic behavior. These incentives can affect the resulting magnitudes of the activity, or the consequences of other tax provisions or Government pro-grams. For example, if capital gains were taxed at higher ordinary income tax rates, capital gain realizations would be expected to decline, which could result in lower tax receipts depending on the elasticity of the capital gains tax rates. Such behavioral effects are not reflected in the estimates.
Second, tax expenditures are interdependent even without incentive effects. Repeal of a tax expenditure

106ANALYTICAL PERSPECTIVES
provision can increase or decrease the tax receipts associ-ated with other provisions. For example, even if behavior does not change, repeal of an itemized deduction could increase the receipt costs from other deductions because some taxpayers would be moved into higher tax brackets. Alternatively, repeal of an itemized deduction could lower the receipt cost from other deductions if taxpayers are led to claim the standard deduction instead of itemizing. Similarly, if two provisions were repealed simultaneously, the increase in tax liability could be greater or less than the sum of the two separate tax expenditures, because each is estimated assuming that the other remains in force. In addition, the estimates reported in Table 10–1 are the to-tals of individual and corporate income tax receipt effects reported in Tables 10–2A and 10–2B, and do not reflect any possible interactions between individual and corpo-rate income tax receipts. For this reason, the estimates in Table 10–1 should be regarded as approximations.
Present-Value Estimates
The annual value of tax expenditures for tax deferrals is reported on a cash basis in all tables except Table 10–4. Cash-based estimates reflect the difference between taxes deferred in the current year and incoming receipts that are received due to deferrals of taxes from prior years. Although such estimates are useful as a measure of cash flows into the Government, they do not accurately reflect the true economic cost of these provisions. For example, for a provision where activity levels have changed over time, so that incoming tax receipts from past deferrals are greater than deferred receipts from new activity, the cash-basis tax expenditure estimate can be nega-tive, despite the fact that in present-value terms current deferrals have a real cost to the Government (i.e., taxpay-ers). Alternatively, in the case of a newly enacted deferral provision, a cash-based estimate can overstate the real effect on receipts to the Government because the newly deferred taxes will ultimately be received.
Discounted present-value estimates of receipt effects are presented in Table 10–4 for certain provisions that involve tax deferrals or other long-term receipt effects. These estimates complement the cash-based tax expendi-ture estimates presented in the other tables.
The present-value estimates represent the receipt ef-fects, net of future tax payments that follow from activities undertaken during calendar year 2020 which cause the deferrals or other long-term receipt effects. For instance, a pension contribution in 2020 would cause a deferral of tax payments on wages in 2020 and on pension fund earn-ings on this contribution (e.g., interest) in later years. In some future year, however, the 2020 pension contribution and accrued earnings will be paid out and taxes will be due; these receipts are included in the present-value es-timate. In general, this conceptual approach is similar to the one used for reporting the budgetary effects of credit programs, where direct loans and guarantees in a given year affect future cash flows.
Tax Expenditure Baselines
A tax expenditure is an exception to baseline provisions of the tax structure that usually results in a reduction in the amount of tax owed. The 1974 Congressional Budget Act, which mandated the tax expenditure budget, did not specify the baseline provisions of the tax law. As noted previously, deciding whether provisions are exceptions, therefore, is a matter of judgment. As in prior years, most of this year’s tax expenditure estimates are presented using two baselines: the normal tax baseline and the reference tax law baseline. Tax expenditures may take the form of credits, deductions, special exceptions and allowances.
The normal tax baseline is patterned on a practical variant of a comprehensive income tax, which defines in-come as the sum of consumption and the change in net wealth in a given period of time. The normal tax baseline allows personal exemptions, a standard deduction, and deduction of expenses incurred in earning income. It is not limited to a particular structure of tax rates, or by a specific definition of the taxpaying unit.
The reference tax law baseline is also patterned on a comprehensive income tax, but it is closer to existing law. Reference tax law tax expenditures are limited to special exceptions from a generally provided tax rule that serves programmatic functions in a way that is analogous to spending programs. Provisions under the reference tax law baseline are generally tax expenditures under the normal tax baseline, but the reverse is not always true.
Both the normal tax and reference tax law baselines al-low several major departures from a pure comprehensive income tax. For example, under the normal tax and refer-ence tax law baselines:
• Income is taxable only when it is realized in ex-change. Thus, the deferral of tax on unrealized capi-tal gains is not regarded as a tax expenditure. Ac-crued income would be taxed under a comprehensive income tax.
• There is a separate corporate income tax.
• Tax rates on noncorporate business income vary by level of income.
• Individual tax rates, including brackets, standard deduction, and personal exemptions, are allowed to vary with marital status.
• Values of assets and debt are not generally adjust-ed for inflation. A comprehensive income tax would adjust the cost basis of capital assets and debt for changes in the general price level. Thus, under a comprehensive income tax baseline, the failure to take account of inflation in measuring depreciation, capital gains, and interest income would be regarded as a negative tax expenditure (i.e., a tax penalty), and failure to take account of inflation in measuring
10. TAX EXPENDITURES 107
interest costs would be regarded as a positive tax expenditure (i.e., a tax subsidy).
• The base erosion and anti-abuse tax (BEAT) for mul-tinational corporations is treated as a minimum tax and considered part of the rate structure.
Although the reference tax law and normal tax base-lines are generally similar, areas of difference include:
Tax rates. The separate schedules applying to the vari-ous taxpaying units and the Alternative Minimum Tax are treated as part of the baseline rate structure under both the reference tax law and normal tax methods.
Income subject to the tax. Income subject to tax is defined as gross income less the costs of earning that income. Under the reference tax law, gross income does not include gifts defined as receipts of money or prop-erty that are not consideration in an exchange nor does gross income include most transfer payments from the Government.2 The normal tax baseline also excludes gifts between individuals from gross income. Under the normal tax baseline, however, all cash transfer payments from the Government to private individuals are counted in gross income, and exemptions of such transfers from tax are identified as tax expenditures. The costs of earning income are generally deductible in determining taxable income under both the reference tax law and normal tax baselines.3
Capital recovery. Under the reference tax law baseline no tax expenditures arise from accelerated depreciation. Under the normal tax baseline, the depreciation allow-ance for property is computed using estimates of economic depreciation.
Descriptions of Income Tax Provisions
Descriptions of the individual and corporate income tax expenditures reported on in this document follow. These descriptions relate to current law as of December 31,2020. Legislation enacted in 2020 expanded the scope and size of tax expenditures. The Families First Coronavirus Response Act created a tax credit for qualified sick leave and family leave equivalent amounts for self-employed individuals. The Coronavirus Aid, Relief, and Economic Security (CARES) Act introduced a recovery rebate tax credit for eligible individuals and an exclusion for certain loans received under the “Paycheck Protection Program” and subsequently forgiven. CARES also modified a num-ber of tax expenditures. It created an exception to the
2 Gross income does, however, include transfer payments associated with past employment, such as Social Security benefits.
3 In the case of individuals who hold “passive’’ equity interests in businesses, the pro-rata shares of sales and expense deductions report-able in a year are limited. A passive business activity is defined gener-ally to be one in which the holder of the interest, usually a partnership interest, does not actively perform managerial or other participatory functions. The taxpayer may generally report no larger deductions for a year than will reduce taxable income from such activities to zero. Deduc-tions in excess of the limitation may be taken in subsequent years, or when the interest is liquidated. In addition, costs of earning income may be limited under the Alternative Minimum Tax.
10-percent early withdrawal tax for “coronavirus related distributions” from a qualified retirement plan or IRA, and another exception to the required minimum distribu-tion rules. It introduced a partial above-the-line deduction for charitable deductions, and expanded the limits on deductions for charitable contributions. It also included over-the-counter medicines and drugs and menstrual care products as qualified medical expenses for HSAs, Archer MSAs, health FSAs, and HRAs. It also modified a num-ber of other provisions in the tax Code. The Consolidated Appropriations Act (CAA) created another rebate and ad-justed several provisions in CARES.
National Defense
1. Exclusion of benefits and allowances to armed forces personnel.—Under the baseline tax system, all compensation, including dedicated payments and in-kind benefits, should be included in taxable income because they represent accretions to wealth that do not materially differ from cash wages. As an example, a rental voucher of $100 is (approximately) equal in value to $100 of cash income. In contrast to this treatment, certain housing and meals, in addition to other benefits provided military personnel, either in cash or in kind, as well as certain amounts of pay related to combat service, are excluded from income subject to tax.
International Affairs
2. Exclusion of income earned abroad by U.S. citizens.—Under the baseline tax system, all compen-sation received by U.S. citizens and residents is properly included in their taxable income. It makes no difference whether the compensation is a result of working abroad or whether it is labeled as a housing allowance. In con-trast to this treatment, U.S. tax law allows U.S. citizens and residents who live abroad, work in the private sec-tor, and satisfy a foreign residency requirement to exclude up to $80,000, plus adjustments for inflation since 2004, in foreign earned income from U.S. taxes. In addition, if these taxpayers are provided housing by their employers, then they may also exclude the cost of such housing from their income to the extent that it exceeds 16 percent of the earned income exclusion limit. This housing exclusion is capped at 30 percent of the earned income exclusion limit, with geographical adjustments. If taxpayers do not re-ceive a specific allowance for housing expenses, they may deduct housing expenses up to the amount by which for-eign earned income exceeds their foreign earned income exclusion.
3. Exclusion of certain allowances for Federal employees abroad.—In general, all compensation re-ceived by U.S. citizens and residents is properly included in their taxable income. It makes no difference whether the compensation is a result of working abroad or wheth-er it is labeled as an allowance for the high cost of living abroad. In contrast to this treatment, U.S. Federal civilian employees and Peace Corps members who work outside the continental United States are allowed to exclude
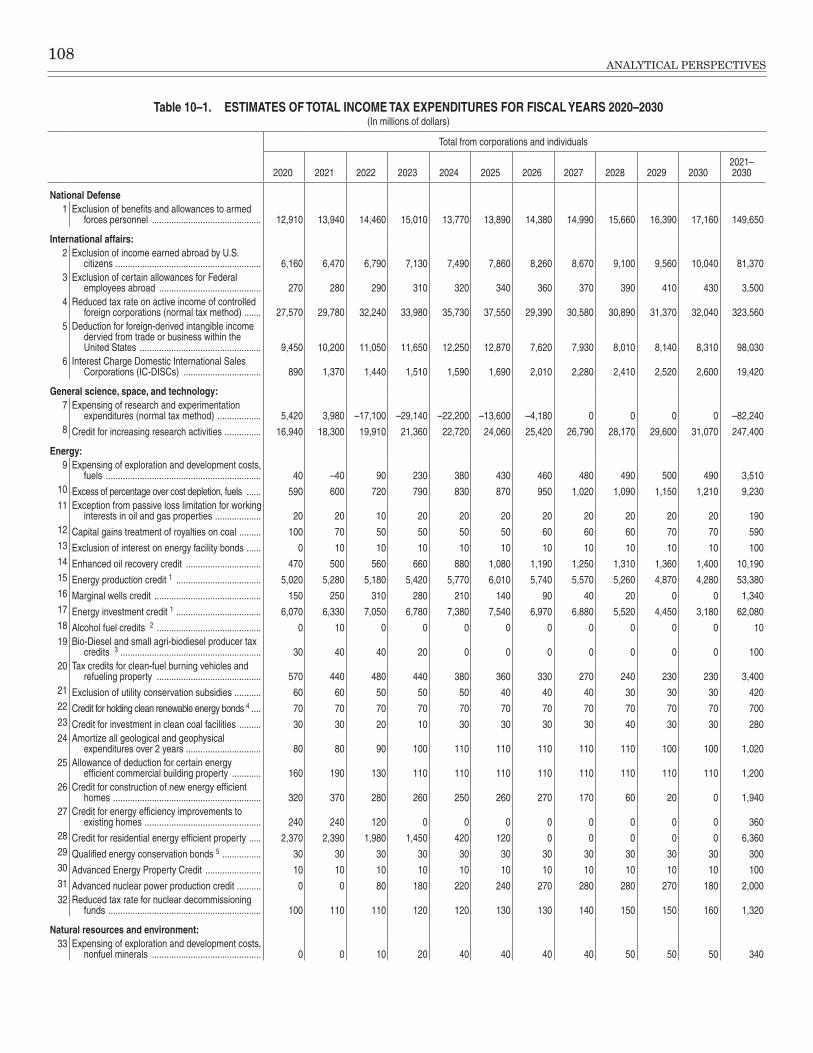
108ANALYTICAL PERSPECTIVES
Table 10–1. ESTIMATES OF TOTAL INCOME TAX EXPENDITURES FOR FISCAL YEARS 2020–2030(In millions of dollars)
Total from corporations and individuals
2020 2021 2022 2023 2024 2025 2026 2027 2028 2029 20302021–2030
National Defense1 Exclusion of benefits and allowances to armed
forces personnel ��������������������������������������������� 12,910 13,940 14,460 15,010 13,770 13,890 14,380 14,990 15,660 16,390 17,160 149,650
International affairs: 2 Exclusion of income earned abroad by U�S�
citizens ������������������������������������������������������������ 6,160 6,470 6,790 7,130 7,490 7,860 8,260 8,670 9,100 9,560 10,040 81,3703 Exclusion of certain allowances for Federal
employees abroad ������������������������������������������ 270 280 290 310 320 340 360 370 390 410 430 3,5004 Reduced tax rate on active income of controlled
foreign corporations (normal tax method) ������� 27,570 29,780 32,240 33,980 35,730 37,550 29,390 30,580 30,890 31,370 32,040 323,5605 Deduction for foreign-derived intangible income
dervied from trade or business within the United States �������������������������������������������������� 9,450 10,200 11,050 11,650 12,250 12,870 7,620 7,930 8,010 8,140 8,310 98,030
6 Interest Charge Domestic International Sales Corporations (IC-DISCs) �������������������������������� 890 1,370 1,440 1,510 1,590 1,690 2,010 2,280 2,410 2,520 2,600 19,420
General science, space, and technology: 7 Expensing of research and experimentation
expenditures (normal tax method) ������������������ 5,420 3,980 –17,100 –29,140 –22,200 –13,600 –4,180 0 0 0 0 –82,2408 Credit for increasing research activities ��������������� 16,940 18,300 19,910 21,360 22,720 24,060 25,420 26,790 28,170 29,600 31,070 247,400
Energy: 9 Expensing of exploration and development costs,
fuels ���������������������������������������������������������������� 40 –40 90 230 380 430 460 480 490 500 490 3,51010 Excess of percentage over cost depletion, fuels ������ 590 600 720 790 830 870 950 1,020 1,090 1,150 1,210 9,23011 Exception from passive loss limitation for working
interests in oil and gas properties ������������������� 20 20 10 20 20 20 20 20 20 20 20 19012 Capital gains treatment of royalties on coal ��������� 100 70 50 50 50 50 60 60 60 70 70 59013 Exclusion of interest on energy facility bonds ������ 0 10 10 10 10 10 10 10 10 10 10 10014 Enhanced oil recovery credit ������������������������������� 470 500 560 660 880 1,080 1,190 1,250 1,310 1,360 1,400 10,19015 Energy production credit 1 ����������������������������������� 5,020 5,280 5,180 5,420 5,770 6,010 5,740 5,570 5,260 4,870 4,280 53,38016 Marginal wells credit �������������������������������������������� 150 250 310 280 210 140 90 40 20 0 0 1,34017 Energy investment credit 1 ����������������������������������� 6,070 6,330 7,050 6,780 7,380 7,540 6,970 6,880 5,520 4,450 3,180 62,08018 Alcohol fuel credits 2 ������������������������������������������� 0 10 0 0 0 0 0 0 0 0 0 1019 Bio-Diesel and small agri-biodiesel producer tax
credits 3 ���������������������������������������������������������� 30 40 40 20 0 0 0 0 0 0 0 10020 Tax credits for clean-fuel burning vehicles and
refueling property ������������������������������������������� 570 440 480 440 380 360 330 270 240 230 230 3,40021 Exclusion of utility conservation subsidies ����������� 60 60 50 50 50 40 40 40 30 30 30 42022 Credit for holding clean renewable energy bonds 4 ���� 70 70 70 70 70 70 70 70 70 70 70 70023 Credit for investment in clean coal facilities ��������� 30 30 20 10 30 30 30 30 40 30 30 28024 Amortize all geological and geophysical
expenditures over 2 years ������������������������������� 80 80 90 100 110 110 110 110 110 100 100 1,02025 Allowance of deduction for certain energy
efficient commercial building property ������������ 160 190 130 110 110 110 110 110 110 110 110 1,20026 Credit for construction of new energy efficient
homes ������������������������������������������������������������� 320 370 280 260 250 260 270 170 60 20 0 1,94027 Credit for energy efficiency improvements to
existing homes ������������������������������������������������ 240 240 120 0 0 0 0 0 0 0 0 36028 Credit for residential energy efficient property ����� 2,370 2,390 1,980 1,450 420 120 0 0 0 0 0 6,36029 Qualified energy conservation bonds 5 ���������������� 30 30 30 30 30 30 30 30 30 30 30 30030 Advanced Energy Property Credit ����������������������� 10 10 10 10 10 10 10 10 10 10 10 10031 Advanced nuclear power production credit ���������� 0 0 80 180 220 240 270 280 280 270 180 2,00032 Reduced tax rate for nuclear decommissioning
funds ��������������������������������������������������������������� 100 110 110 120 120 130 130 140 150 150 160 1,320
Natural resources and environment: 33 Expensing of exploration and development costs,
nonfuel minerals ��������������������������������������������� 0 0 10 20 40 40 40 40 50 50 50 340
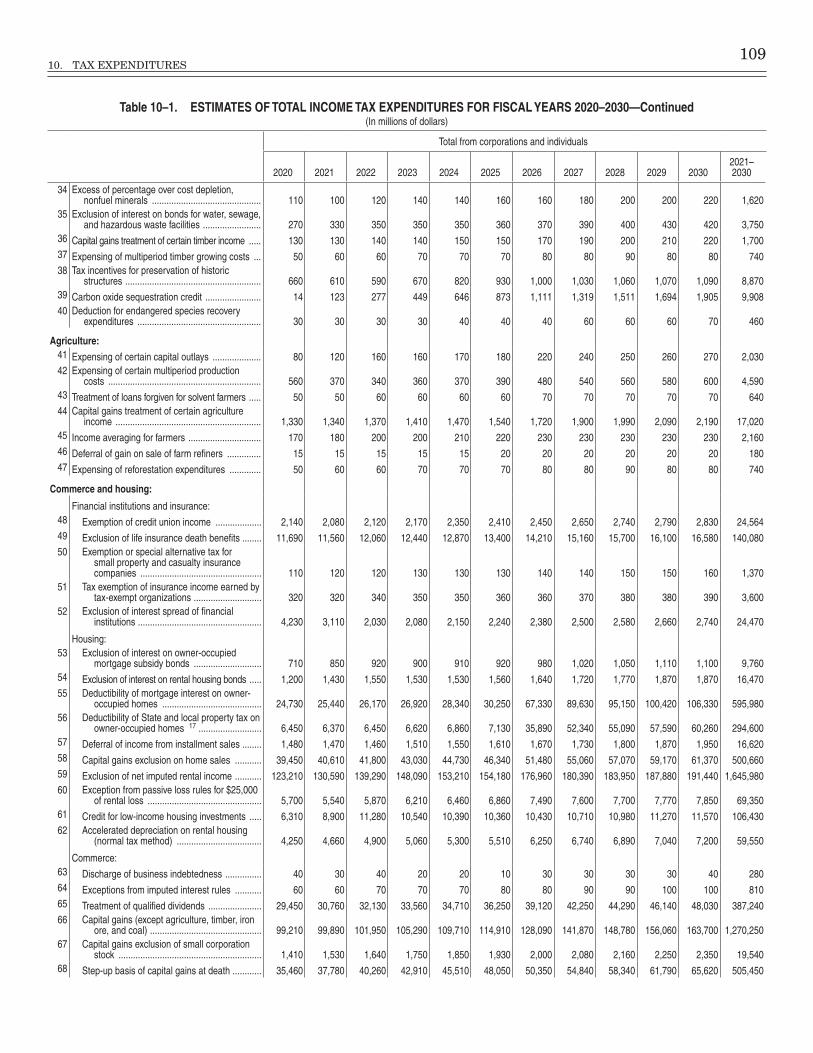
10. TAX EXPENDITURES 109
Table 10–1. ESTIMATES OF TOTAL INCOME TAX EXPENDITURES FOR FISCAL YEARS 2020–2030—Continued(In millions of dollars)
Total from corporations and individuals
2020 2021 2022 2023 2024 2025 2026 2027 2028 2029 20302021–2030
34 Excess of percentage over cost depletion, nonfuel minerals ��������������������������������������������� 110 100 120 140 140 160 160 180 200 200 220 1,620
35 Exclusion of interest on bonds for water, sewage, and hazardous waste facilities ������������������������ 270 330 350 350 350 360 370 390 400 430 420 3,750
36 Capital gains treatment of certain timber income ����� 130 130 140 140 150 150 170 190 200 210 220 1,70037 Expensing of multiperiod timber growing costs ��� 50 60 60 70 70 70 80 80 90 80 80 74038 Tax incentives for preservation of historic
structures �������������������������������������������������������� 660 610 590 670 820 930 1,000 1,030 1,060 1,070 1,090 8,87039 Carbon oxide sequestration credit ����������������������� 14 123 277 449 646 873 1,111 1,319 1,511 1,694 1,905 9,90840 Deduction for endangered species recovery
expenditures ��������������������������������������������������� 30 30 30 30 40 40 40 60 60 60 70 460
Agriculture: 41 Expensing of certain capital outlays �������������������� 80 120 160 160 170 180 220 240 250 260 270 2,03042 Expensing of certain multiperiod production
costs ��������������������������������������������������������������� 560 370 340 360 370 390 480 540 560 580 600 4,59043 Treatment of loans forgiven for solvent farmers ����� 50 50 60 60 60 60 70 70 70 70 70 64044 Capital gains treatment of certain agriculture
income ������������������������������������������������������������ 1,330 1,340 1,370 1,410 1,470 1,540 1,720 1,900 1,990 2,090 2,190 17,02045 Income averaging for farmers ������������������������������ 170 180 200 200 210 220 230 230 230 230 230 2,16046 Deferral of gain on sale of farm refiners �������������� 15 15 15 15 15 20 20 20 20 20 20 18047 Expensing of reforestation expenditures ������������� 50 60 60 70 70 70 80 80 90 80 80 740
Commerce and housing:
Financial institutions and insurance: 48 Exemption of credit union income ������������������� 2,140 2,080 2,120 2,170 2,350 2,410 2,450 2,650 2,740 2,790 2,830 24,56449 Exclusion of life insurance death benefits �������� 11,690 11,560 12,060 12,440 12,870 13,400 14,210 15,160 15,700 16,100 16,580 140,08050 Exemption or special alternative tax for
small property and casualty insurance companies �������������������������������������������������� 110 120 120 130 130 130 140 140 150 150 160 1,370
51 Tax exemption of insurance income earned by tax-exempt organizations ���������������������������� 320 320 340 350 350 360 360 370 380 380 390 3,600
52 Exclusion of interest spread of financial institutions ��������������������������������������������������� 4,230 3,110 2,030 2,080 2,150 2,240 2,380 2,500 2,580 2,660 2,740 24,470
Housing: 53 Exclusion of interest on owner-occupied
mortgage subsidy bonds ���������������������������� 710 850 920 900 910 920 980 1,020 1,050 1,110 1,100 9,76054 Exclusion of interest on rental housing bonds ����� 1,200 1,430 1,550 1,530 1,530 1,560 1,640 1,720 1,770 1,870 1,870 16,47055 Deductibility of mortgage interest on owner-
occupied homes ����������������������������������������� 24,730 25,440 26,170 26,920 28,340 30,250 67,330 89,630 95,150 100,420 106,330 595,98056 Deductibility of State and local property tax on
owner-occupied homes 17 �������������������������� 6,450 6,370 6,450 6,620 6,860 7,130 35,890 52,340 55,090 57,590 60,260 294,60057 Deferral of income from installment sales �������� 1,480 1,470 1,460 1,510 1,550 1,610 1,670 1,730 1,800 1,870 1,950 16,62058 Capital gains exclusion on home sales ����������� 39,450 40,610 41,800 43,030 44,730 46,340 51,480 55,060 57,070 59,170 61,370 500,66059 Exclusion of net imputed rental income ����������� 123,210 130,590 139,290 148,090 153,210 154,180 176,960 180,390 183,950 187,880 191,440 1,645,98060 Exception from passive loss rules for $25,000
of rental loss ����������������������������������������������� 5,700 5,540 5,870 6,210 6,460 6,860 7,490 7,600 7,700 7,770 7,850 69,35061 Credit for low-income housing investments ����� 6,310 8,900 11,280 10,540 10,390 10,360 10,430 10,710 10,980 11,270 11,570 106,43062 Accelerated depreciation on rental housing
(normal tax method) ����������������������������������� 4,250 4,660 4,900 5,060 5,300 5,510 6,250 6,740 6,890 7,040 7,200 59,550
Commerce: 63 Discharge of business indebtedness ��������������� 40 30 40 20 20 10 30 30 30 30 40 28064 Exceptions from imputed interest rules ����������� 60 60 70 70 70 80 80 90 90 100 100 81065 Treatment of qualified dividends ���������������������� 29,450 30,760 32,130 33,560 34,710 36,250 39,120 42,250 44,290 46,140 48,030 387,24066 Capital gains (except agriculture, timber, iron
ore, and coal) ���������������������������������������������� 99,210 99,890 101,950 105,290 109,710 114,910 128,090 141,870 148,780 156,060 163,700 1,270,25067 Capital gains exclusion of small corporation
stock ����������������������������������������������������������� 1,410 1,530 1,640 1,750 1,850 1,930 2,000 2,080 2,160 2,250 2,350 19,54068 Step-up basis of capital gains at death ������������ 35,460 37,780 40,260 42,910 45,510 48,050 50,350 54,840 58,340 61,790 65,620 505,450
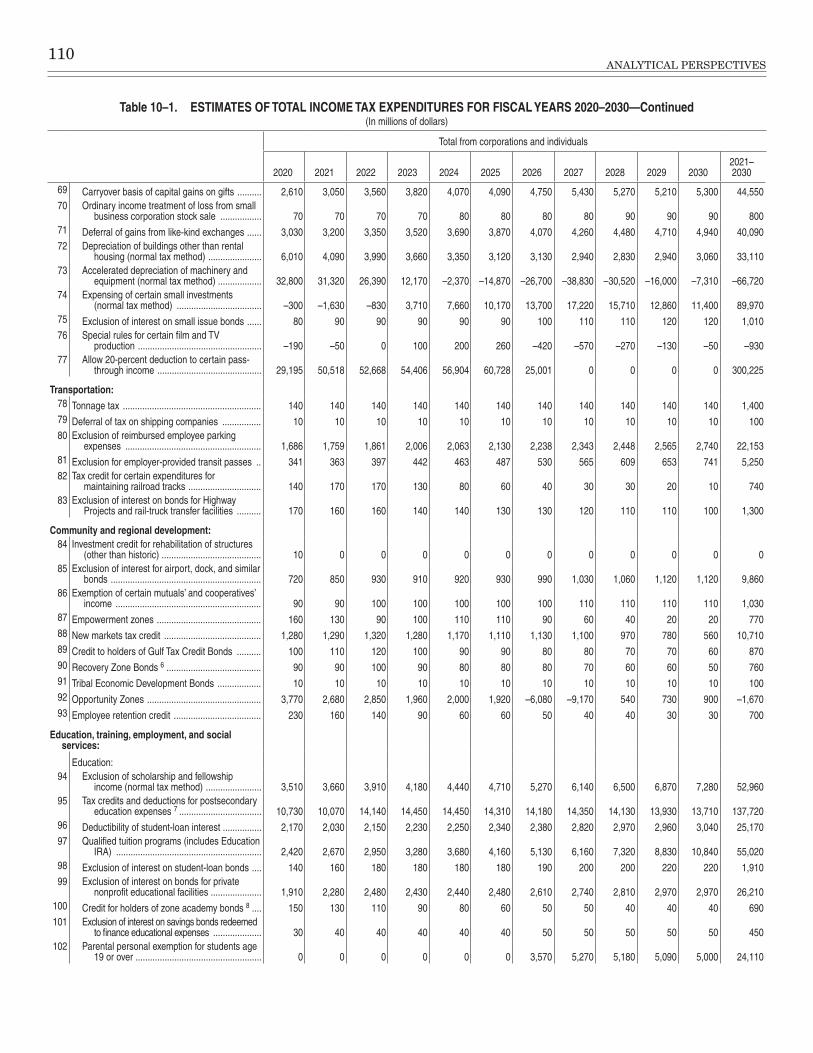
110ANALYTICAL PERSPECTIVES
Table 10–1. ESTIMATES OF TOTAL INCOME TAX EXPENDITURES FOR FISCAL YEARS 2020–2030—Continued(In millions of dollars)
Total from corporations and individuals
2020 2021 2022 2023 2024 2025 2026 2027 2028 2029 20302021–2030
69 Carryover basis of capital gains on gifts ���������� 2,610 3,050 3,560 3,820 4,070 4,090 4,750 5,430 5,270 5,210 5,300 44,55070 Ordinary income treatment of loss from small
business corporation stock sale ����������������� 70 70 70 70 80 80 80 80 90 90 90 80071 Deferral of gains from like-kind exchanges ������ 3,030 3,200 3,350 3,520 3,690 3,870 4,070 4,260 4,480 4,710 4,940 40,09072 Depreciation of buildings other than rental
housing (normal tax method) ���������������������� 6,010 4,090 3,990 3,660 3,350 3,120 3,130 2,940 2,830 2,940 3,060 33,11073 Accelerated depreciation of machinery and
equipment (normal tax method) ������������������ 32,800 31,320 26,390 12,170 –2,370 –14,870 –26,700 –38,830 –30,520 –16,000 –7,310 –66,72074 Expensing of certain small investments
(normal tax method) ����������������������������������� –300 –1,630 –830 3,710 7,660 10,170 13,700 17,220 15,710 12,860 11,400 89,97075 Exclusion of interest on small issue bonds ������ 80 90 90 90 90 90 100 110 110 120 120 1,01076 Special rules for certain film and TV
production ��������������������������������������������������� –190 –50 0 100 200 260 –420 –570 –270 –130 –50 –93077 Allow 20-percent deduction to certain pass-
through income ������������������������������������������� 29,195 50,518 52,668 54,406 56,904 60,728 25,001 0 0 0 0 300,225
Transportation: 78 Tonnage tax ��������������������������������������������������������� 140 140 140 140 140 140 140 140 140 140 140 1,40079 Deferral of tax on shipping companies ���������������� 10 10 10 10 10 10 10 10 10 10 10 10080 Exclusion of reimbursed employee parking
expenses �������������������������������������������������������� 1,686 1,759 1,861 2,006 2,063 2,130 2,238 2,343 2,448 2,565 2,740 22,15381 Exclusion for employer-provided transit passes �� 341 363 397 442 463 487 530 565 609 653 741 5,25082 Tax credit for certain expenditures for
maintaining railroad tracks ������������������������������ 140 170 170 130 80 60 40 30 30 20 10 74083 Exclusion of interest on bonds for Highway
Projects and rail-truck transfer facilities ���������� 170 160 160 140 140 130 130 120 110 110 100 1,300
Community and regional development: 84 Investment credit for rehabilitation of structures
(other than historic) ����������������������������������������� 10 0 0 0 0 0 0 0 0 0 0 085 Exclusion of interest for airport, dock, and similar
bonds �������������������������������������������������������������� 720 850 930 910 920 930 990 1,030 1,060 1,120 1,120 9,86086 Exemption of certain mutuals’ and cooperatives’
income ������������������������������������������������������������ 90 90 100 100 100 100 100 110 110 110 110 1,03087 Empowerment zones ������������������������������������������� 160 130 90 100 110 110 90 60 40 20 20 77088 New markets tax credit ���������������������������������������� 1,280 1,290 1,320 1,280 1,170 1,110 1,130 1,100 970 780 560 10,71089 Credit to holders of Gulf Tax Credit Bonds ���������� 100 110 120 100 90 90 80 80 70 70 60 87090 Recovery Zone Bonds 6 ��������������������������������������� 90 90 100 90 80 80 80 70 60 60 50 76091 Tribal Economic Development Bonds ������������������ 10 10 10 10 10 10 10 10 10 10 10 10092 Opportunity Zones ����������������������������������������������� 3,770 2,680 2,850 1,960 2,000 1,920 –6,080 –9,170 540 730 900 –1,67093 Employee retention credit ������������������������������������ 230 160 140 90 60 60 50 40 40 30 30 700
Education, training, employment, and social services:
Education: 94 Exclusion of scholarship and fellowship
income (normal tax method) ����������������������� 3,510 3,660 3,910 4,180 4,440 4,710 5,270 6,140 6,500 6,870 7,280 52,96095 Tax credits and deductions for postsecondary
education expenses 7 ���������������������������������� 10,730 10,070 14,140 14,450 14,450 14,310 14,180 14,350 14,130 13,930 13,710 137,72096 Deductibility of student-loan interest ���������������� 2,170 2,030 2,150 2,230 2,250 2,340 2,380 2,820 2,970 2,960 3,040 25,17097 Qualified tuition programs (includes Education
IRA) ������������������������������������������������������������ 2,420 2,670 2,950 3,280 3,680 4,160 5,130 6,160 7,320 8,830 10,840 55,02098 Exclusion of interest on student-loan bonds ���� 140 160 180 180 180 180 190 200 200 220 220 1,91099 Exclusion of interest on bonds for private
nonprofit educational facilities ��������������������� 1,910 2,280 2,480 2,430 2,440 2,480 2,610 2,740 2,810 2,970 2,970 26,210100 Credit for holders of zone academy bonds 8 ���� 150 130 110 90 80 60 50 50 40 40 40 690101 Exclusion of interest on savings bonds redeemed
to finance educational expenses �������������������� 30 40 40 40 40 40 50 50 50 50 50 450102 Parental personal exemption for students age
19 or over ���������������������������������������������������� 0 0 0 0 0 0 3,570 5,270 5,180 5,090 5,000 24,110

10. TAX EXPENDITURES 111
Table 10–1. ESTIMATES OF TOTAL INCOME TAX EXPENDITURES FOR FISCAL YEARS 2020–2030—Continued(In millions of dollars)
Total from corporations and individuals
2020 2021 2022 2023 2024 2025 2026 2027 2028 2029 20302021–2030
103 Deductibility of charitable contributions (education) �������������������������������������������������� 4,530 4,880 5,190 5,510 5,820 6,130 7,290 9,370 9,800 10,260 10,430 74,680
104 Exclusion of employer-provided educational assistance ��������������������������������������������������� 1,190 1,390 1,500 1,620 1,730 1,850 1,640 1,560 1,640 1,720 1,800 16,450
105 Special deduction for teacher expenses ���������� 170 170 170 170 170 170 180 210 210 210 220 1,880106 Discharge of student loan indebtedness ��������� 80 80 90 100 110 120 150 170 190 220 240 1,470107 Qualified school construction bonds 9 �������������� 570 540 520 490 470 440 410 390 360 330 320 4,270
Training, employment, and social services: 108 Work opportunity tax credit ������������������������������ 1,650 1,690 1,780 1,830 1,890 1,950 1,300 530 370 280 200 11,820109 Employer provided child care exclusion ����������� 580 570 570 610 650 690 920 1,060 1,120 1,190 1,260 8,640110 Employer-provided child care credit ���������������� 20 20 20 20 20 20 20 20 20 30 30 220111 Assistance for adopted foster children ������������� 620 660 700 750 800 850 900 960 1,020 1,080 1,150 8,870112 Adoption credit and exclusion �������������������������� 770 790 850 870 900 920 930 940 950 960 970 9,080113 Exclusion of employee meals and lodging
(other than military) ������������������������������������� 3,290 4,320 6,430 6,100 5,610 5,900 6,940 7,530 7,750 8,030 8,360 66,970114 Credit for child and dependent care expenses 3,190 3,080 3,300 3,440 3,530 3,580 3,700 3,880 3,970 4,060 4,160 36,700115 Credit for disabled access expenditures ���������� 10 10 10 10 10 10 10 10 10 10 10 100116 Deductibility of charitable contributions, other
than education and health �������������������������� 40,320 43,610 46,410 49,220 52,050 54,810 66,080 86,500 90,570 94,830 99,300 683,380117 Exclusion of certain foster care payments ������� 490 510 510 520 530 540 540 540 540 560 580 5,370118 Exclusion of parsonage allowances ���������������� 900 950 1,000 1,050 1,110 1,170 1,230 1,300 1,370 1,440 1,510 12,130119 Indian employment credit �������������������������������� 70 70 50 30 30 30 20 20 20 10 10 290120 Credit for employer differential wage payments ���� 0 0 0 0 0 0 10 10 10 20 20 70
Health: 121 Exclusion of employer contributions for medical
insurance premiums and medical care 10 ������ 191,350 197,530 211,550 224,320 235,050 248,420 290,960 322,500 340,250 358,670 377,880 2,807,130122 Self-employed medical insurance premiums ������� 7,430 7,740 8,150 8,720 9,290 9,930 11,330 12,450 13,140 13,820 14,550 109,120123 Medical Savings Accounts / Health Savings
Accounts ��������������������������������������������������������� 5,330 4,540 4,680 4,890 5,080 5,260 5,970 6,440 6,660 6,890 7,130 57,540124 Deductibility of medical expenses ����������������������� 7,100 7,960 8,480 9,250 10,050 10,900 16,800 20,970 22,760 24,630 26,610 158,410125 Exclusion of interest on hospital construction
bonds �������������������������������������������������������������� 2,730 3,250 3,540 3,470 3,480 3,540 3,740 3,920 4,010 4,260 4,250 37,460126 Refundable Premium Assistance Tax Credit 11 ���� 7,960 6,220 6,180 6,380 6,670 6,590 7,520 7,710 8,060 8,390 8,800 72,520127 Credit for employee health insurance expenses
of small business 12 ���������������������������������������� 40 40 30 10 10 0 0 0 0 0 0 90128 Deductibility of charitable contributions (health) �� 8,230 8,820 9,350 9,870 10,400 10,910 12,390 14,870 15,560 16,260 16,990 125,420129 Tax credit for orphan drug research ��������������������� 1,720 2,080 2,500 3,010 3,620 4,380 5,270 6,360 7,660 9,240 11,140 55,260130 Special Blue Cross/Blue Shield tax benefits �������� 140 190 250 280 300 320 340 360 380 410 440 3,270131 Tax credit for health insurance purchased by
certain displaced and retired individuals 13 ����� 0 0 0 0 0 0 0 0 0 0 0 0132 Distributions from retirement plans for premiums
for health and long-term care insurance ��������� 430 450 460 470 490 500 590 630 650 660 670 5,570133 Credit for family and sick leave taken by self-
employed individuals 14 ����������������������������������� 500 590 90 0 0 0 0 0 0 0 0 680
Income security: 134 Child credit 15 ������������������������������������������������������� 70,170 73,320 74,420 76,760 77,170 77,690 55,090 21,160 20,960 20,780 20,570 517,920135 Exclusion of railroad retirement (Social Security
equivalent) benefits ����������������������������������������� 310 290 270 250 240 220 220 210 180 160 140 2,180136 Exclusion of workers’ compensation benefits ������ 9,160 9,200 9,250 9,290 9,330 9,370 9,420 9,460 9,500 9,550 9,590 93,960137 Exclusion of public assistance benefits (normal
tax method) ����������������������������������������������������� 580 600 620 640 670 680 690 710 720 720 710 6,760138 Exclusion of special benefits for disabled coal
miners ������������������������������������������������������������� 20 30 20 20 20 20 20 20 10 10 10 180139 Exclusion of military disability pensions �������������� 160 160 170 170 170 180 200 210 220 220 220 1,920
Net exclusion of pension contributions and earnings:
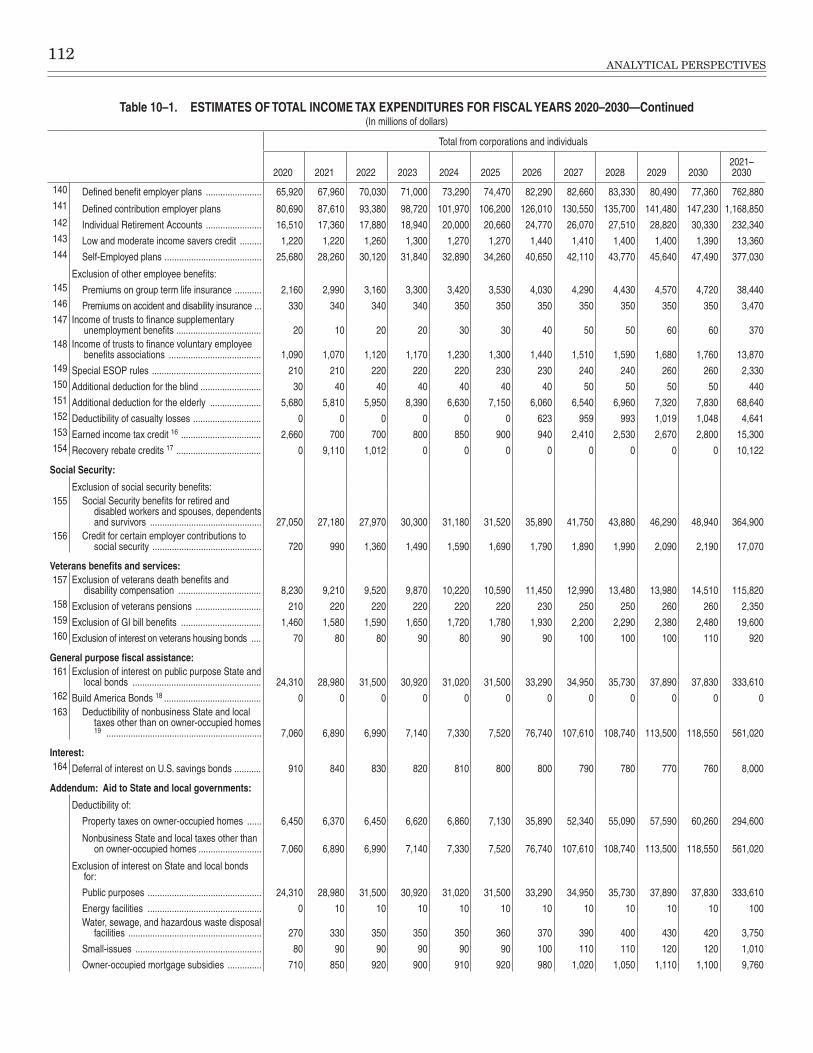
112ANALYTICAL PERSPECTIVES
Table 10–1. ESTIMATES OF TOTAL INCOME TAX EXPENDITURES FOR FISCAL YEARS 2020–2030—Continued(In millions of dollars)
Total from corporations and individuals
2020 2021 2022 2023 2024 2025 2026 2027 2028 2029 20302021–2030
140 Defined benefit employer plans ����������������������� 65,920 67,960 70,030 71,000 73,290 74,470 82,290 82,660 83,330 80,490 77,360 762,880141 Defined contribution employer plans 80,690 87,610 93,380 98,720 101,970 106,200 126,010 130,550 135,700 141,480 147,230 1,168,850142 Individual Retirement Accounts ����������������������� 16,510 17,360 17,880 18,940 20,000 20,660 24,770 26,070 27,510 28,820 30,330 232,340143 Low and moderate income savers credit ��������� 1,220 1,220 1,260 1,300 1,270 1,270 1,440 1,410 1,400 1,400 1,390 13,360144 Self-Employed plans ���������������������������������������� 25,680 28,260 30,120 31,840 32,890 34,260 40,650 42,110 43,770 45,640 47,490 377,030
Exclusion of other employee benefits: 145 Premiums on group term life insurance ����������� 2,160 2,990 3,160 3,300 3,420 3,530 4,030 4,290 4,430 4,570 4,720 38,440146 Premiums on accident and disability insurance ��� 330 340 340 340 350 350 350 350 350 350 350 3,470147 Income of trusts to finance supplementary
unemployment benefits ����������������������������������� 20 10 20 20 30 30 40 50 50 60 60 370148 Income of trusts to finance voluntary employee
benefits associations �������������������������������������� 1,090 1,070 1,120 1,170 1,230 1,300 1,440 1,510 1,590 1,680 1,760 13,870149 Special ESOP rules ��������������������������������������������� 210 210 220 220 220 230 230 240 240 260 260 2,330150 Additional deduction for the blind ������������������������� 30 40 40 40 40 40 40 50 50 50 50 440151 Additional deduction for the elderly ��������������������� 5,680 5,810 5,950 8,390 6,630 7,150 6,060 6,540 6,960 7,320 7,830 68,640152 Deductibility of casualty losses ���������������������������� 0 0 0 0 0 0 623 959 993 1,019 1,048 4,641153 Earned income tax credit 16 ��������������������������������� 2,660 700 700 800 850 900 940 2,410 2,530 2,670 2,800 15,300154 Recovery rebate credits 17 ����������������������������������� 0 9,110 1,012 0 0 0 0 0 0 0 0 10,122
Social Security:
Exclusion of social security benefits: 155 Social Security benefits for retired and
disabled workers and spouses, dependents and survivors ���������������������������������������������� 27,050 27,180 27,970 30,300 31,180 31,520 35,890 41,750 43,880 46,290 48,940 364,900
156 Credit for certain employer contributions to social security ��������������������������������������������� 720 990 1,360 1,490 1,590 1,690 1,790 1,890 1,990 2,090 2,190 17,070
Veterans benefits and services: 157 Exclusion of veterans death benefits and
disability compensation ���������������������������������� 8,230 9,210 9,520 9,870 10,220 10,590 11,450 12,990 13,480 13,980 14,510 115,820158 Exclusion of veterans pensions ��������������������������� 210 220 220 220 220 220 230 250 250 260 260 2,350159 Exclusion of GI bill benefits ��������������������������������� 1,460 1,580 1,590 1,650 1,720 1,780 1,930 2,200 2,290 2,380 2,480 19,600160 Exclusion of interest on veterans housing bonds ���� 70 80 80 90 80 90 90 100 100 100 110 920
General purpose fiscal assistance: 161 Exclusion of interest on public purpose State and
local bonds ����������������������������������������������������� 24,310 28,980 31,500 30,920 31,020 31,500 33,290 34,950 35,730 37,890 37,830 333,610162 Build America Bonds 18 ���������������������������������������� 0 0 0 0 0 0 0 0 0 0 0 0163 Deductibility of nonbusiness State and local
taxes other than on owner-occupied homes 19 ���������������������������������������������������������������� 7,060 6,890 6,990 7,140 7,330 7,520 76,740 107,610 108,740 113,500 118,550 561,020
Interest: 164 Deferral of interest on U�S� savings bonds ����������� 910 840 830 820 810 800 800 790 780 770 760 8,000
Addendum: Aid to State and local governments:
Deductibility of:
Property taxes on owner-occupied homes ������ 6,450 6,370 6,450 6,620 6,860 7,130 35,890 52,340 55,090 57,590 60,260 294,600
Nonbusiness State and local taxes other than on owner-occupied homes �������������������������� 7,060 6,890 6,990 7,140 7,330 7,520 76,740 107,610 108,740 113,500 118,550 561,020
Exclusion of interest on State and local bonds for:
Public purposes ����������������������������������������������� 24,310 28,980 31,500 30,920 31,020 31,500 33,290 34,950 35,730 37,890 37,830 333,610
Energy facilities ����������������������������������������������� 0 10 10 10 10 10 10 10 10 10 10 100Water, sewage, and hazardous waste disposal
facilities ������������������������������������������������������� 270 330 350 350 350 360 370 390 400 430 420 3,750
Small-issues ���������������������������������������������������� 80 90 90 90 90 90 100 110 110 120 120 1,010
Owner-occupied mortgage subsidies �������������� 710 850 920 900 910 920 980 1,020 1,050 1,110 1,100 9,760

10. TAX EXPENDITURES 113
Table 10–1. ESTIMATES OF TOTAL INCOME TAX EXPENDITURES FOR FISCAL YEARS 2020–2030—Continued(In millions of dollars)
Total from corporations and individuals
2020 2021 2022 2023 2024 2025 2026 2027 2028 2029 20302021–2030
Rental housing ������������������������������������������������� 1,200 1,430 1,550 1,530 1,530 1,560 1,640 1,720 1,770 1,870 1,870 16,470
Airports, docks, and similar facilities ���������������� 720 850 930 910 920 930 990 1,030 1,060 1,120 1,120 9,860
Student loans ��������������������������������������������������� 140 160 180 180 180 180 190 200 200 220 220 1,910
Private nonprofit educational facilities ������������� 1,910 2,280 2,480 2,430 2,440 2,480 2,610 2,740 2,810 2,970 2,970 26,210
Hospital construction ��������������������������������������� 2,730 3,250 3,540 3,470 3,480 3,540 3,740 3,920 4,010 4,260 4,250 37,460
Veterans’ housing �������������������������������������������� 70 80 80 90 80 90 90 100 100 100 110 9201 Firms can take an energy grant in lieu of the energy production credit or the energy investment credit for facilities whose construction began in 2009, 2010, or 2011� The effect of the
grant on outlays (in millions of dollars) is as follows: $0 in 2019 and thereafter�2 The alternative fuel mixture credit results in a reduction in excise tax receipts (in millions of dollars) as follows: 2020 $550; 2021 $1,020; 2022 $330 and $0 thereafter�3 In addition, the biodiesel producer tax credit results in a reduction in excise tax receipts (in millions of dollars) as follows: 2020 $5,090; 2021 $3,000; 2022 $2,720; 2023 $1,340 and $0
thereafter�4 In addition, the credit for holding clean renewable energy bonds has outlay effects of (in millions of dollars): 2020 $30; 2021 $40; 2022 $40; 2023 $40; 2024 $40; 2025 $40; 2026, $40;
2027 $40; 2028 $40; 2029 $40, and 2030 $40�5 In addition, the qualified energy conservation bonds have outlay effects of (in millions of dollars): 2020 $30; 2021 $40; 2022 $40; 2023 $40; 2024 $40; 2025 $40; 2026, $40; 2027 $40;
2028 $40; 2029 $40, and 2030 $40�6 In addition, recovery zone bonds have outlay effects (in millions of dollars) as follows: 2020 $90; 2021 $120; 2022 $120; 2023 $120; 2024 $110; 2025 $110; 2026, $110; 2027 $110;
2028 $110; 2029 $110, and 2030 $100�7 In addition, the tax credits for postsecondary education expenses have outlay effects of (in millions of dollars): 2020 $2810; 2021 $2950; 2022 $2980; 2023 $3020; 2024 $3010; 2025
$2980; 2026 $2950; 2027 $2920; 2028 $2880; 2029 $2850; and 2030 $28108 In addition, the credit for holders of zone academy bonds has outlay effects of (in millions of dollars): 2020 $30; 2021 $40; 2022 $40; 2023 $40; 2024 $40; 2025 $40; 2026 $40; 2027
$40; 2028 $40; 2029 $40, and 2030 $40�9 In addition, the provision for school construction bonds has outlay effects of (in millions of dollars): 2020 $460; 2021 $570; 2022 $560; 2023 $560; 2024 $560; 2025 $550; 2026 $550;
2027 $550; 2028 $540; 2029 $540, and 2030 $540�10 In addition, the employer contributions for health have effects on payroll tax receipts (in millions of dollars) as follows: 2020 $120,580; 2021 $131,100; 2022 $140,480; 2023
$147,030; 2024 $153,530; 2025 $161,600; 2026 $170,340; 2027 $179,460; 2028 $189,000; 2029 $198,890; and 2030 $209,140�11 In addition, the premium assistance credit provision has outlay effects (in millions of dollars) as follows: 2020 $44,550; 2021 $43,440; 2022 $35,290; 2023 $33,700; 2024 $34,770;
2025 $35,610; 2026 $36,290; 2027 $37,330; 2028 $39,380; 2029 $41,790; and 2030 $43,890�12 In addition, the small business credit provision has outlay effects (in millions of dollars) as follows: The outlays round down to zero�13 In addition, the effect of the health coverage tax credit on receipts has outlay effects of (in millions of dollars) $10 in 2020 and $0 thereafter�14 In addition, the credit for sick and family leave taken by self-employed individuals has outlay effects of (in millions of dollars): 15 In addition, the effect of the child tax credit on receipts has outlay effects of (in millions of dollars): The child tax credit line also includes the credit for other dependents (in millions of
dollars): 16 In addition, the earned income tax credit on receipts has outlay effects of (in millions of dollars):17 In addition, the recovery rebate credits have outlay effects of (in millions of dollars):18 In addition, the Build America Bonds have outlay effects of (in millions of dollars):19 Because of interactions with the $10,000 cap on state and local tax deductions for the years 2018 through 2025, these estimates understate the combined effects of repealing
deductions for both property taxes on owner occupied housing and other non-business taxes� The estimate of repealing both is (in millions of dollars):
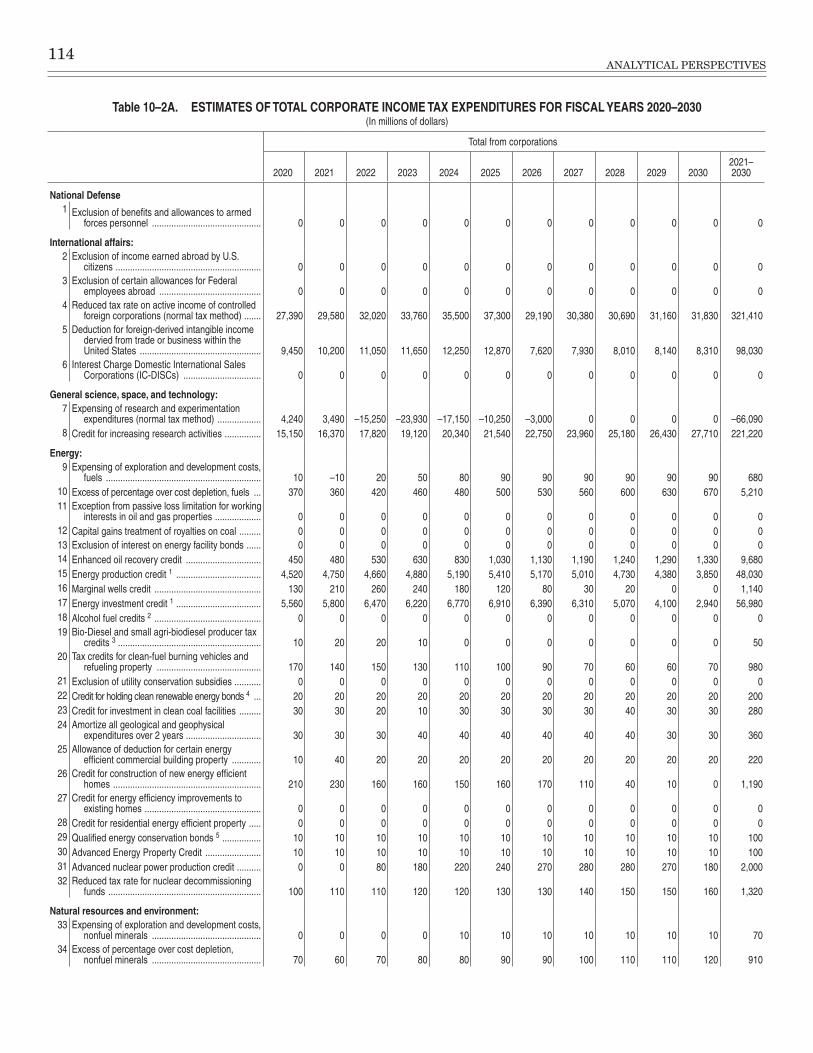
114ANALYTICAL PERSPECTIVES
Table 10–2A. ESTIMATES OF TOTAL CORPORATE INCOME TAX EXPENDITURES FOR FISCAL YEARS 2020–2030(In millions of dollars)
Total from corporations
2020 2021 2022 2023 2024 2025 2026 2027 2028 2029 20302021–2030
National Defense1 Exclusion of benefits and allowances to armed
forces personnel ��������������������������������������������� 0 0 0 0 0 0 0 0 0 0 0 0
International affairs: 2 Exclusion of income earned abroad by U�S�
citizens ������������������������������������������������������������ 0 0 0 0 0 0 0 0 0 0 0 03 Exclusion of certain allowances for Federal
employees abroad ������������������������������������������ 0 0 0 0 0 0 0 0 0 0 0 04 Reduced tax rate on active income of controlled
foreign corporations (normal tax method) ������� 27,390 29,580 32,020 33,760 35,500 37,300 29,190 30,380 30,690 31,160 31,830 321,4105 Deduction for foreign-derived intangible income
dervied from trade or business within the United States �������������������������������������������������� 9,450 10,200 11,050 11,650 12,250 12,870 7,620 7,930 8,010 8,140 8,310 98,030
6 Interest Charge Domestic International Sales Corporations (IC-DISCs) �������������������������������� 0 0 0 0 0 0 0 0 0 0 0 0
General science, space, and technology: 7 Expensing of research and experimentation
expenditures (normal tax method) ������������������ 4,240 3,490 –15,250 –23,930 –17,150 –10,250 –3,000 0 0 0 0 –66,0908 Credit for increasing research activities ��������������� 15,150 16,370 17,820 19,120 20,340 21,540 22,750 23,960 25,180 26,430 27,710 221,220
Energy: 9 Expensing of exploration and development costs,
fuels ���������������������������������������������������������������� 10 –10 20 50 80 90 90 90 90 90 90 68010 Excess of percentage over cost depletion, fuels ��� 370 360 420 460 480 500 530 560 600 630 670 5,21011 Exception from passive loss limitation for working
interests in oil and gas properties ������������������� 0 0 0 0 0 0 0 0 0 0 0 012 Capital gains treatment of royalties on coal ��������� 0 0 0 0 0 0 0 0 0 0 0 013 Exclusion of interest on energy facility bonds ������ 0 0 0 0 0 0 0 0 0 0 0 014 Enhanced oil recovery credit ������������������������������� 450 480 530 630 830 1,030 1,130 1,190 1,240 1,290 1,330 9,68015 Energy production credit 1 ����������������������������������� 4,520 4,750 4,660 4,880 5,190 5,410 5,170 5,010 4,730 4,380 3,850 48,03016 Marginal wells credit �������������������������������������������� 130 210 260 240 180 120 80 30 20 0 0 1,14017 Energy investment credit 1 ����������������������������������� 5,560 5,800 6,470 6,220 6,770 6,910 6,390 6,310 5,070 4,100 2,940 56,98018 Alcohol fuel credits 2 �������������������������������������������� 0 0 0 0 0 0 0 0 0 0 0 019 Bio-Diesel and small agri-biodiesel producer tax
credits 3 ����������������������������������������������������������� 10 20 20 10 0 0 0 0 0 0 0 5020 Tax credits for clean-fuel burning vehicles and
refueling property ������������������������������������������� 170 140 150 130 110 100 90 70 60 60 70 98021 Exclusion of utility conservation subsidies ����������� 0 0 0 0 0 0 0 0 0 0 0 022 Credit for holding clean renewable energy bonds 4 ��� 20 20 20 20 20 20 20 20 20 20 20 20023 Credit for investment in clean coal facilities ��������� 30 30 20 10 30 30 30 30 40 30 30 28024 Amortize all geological and geophysical
expenditures over 2 years ������������������������������� 30 30 30 40 40 40 40 40 40 30 30 36025 Allowance of deduction for certain energy
efficient commercial building property ������������ 10 40 20 20 20 20 20 20 20 20 20 22026 Credit for construction of new energy efficient
homes ������������������������������������������������������������� 210 230 160 160 150 160 170 110 40 10 0 1,19027 Credit for energy efficiency improvements to
existing homes ������������������������������������������������ 0 0 0 0 0 0 0 0 0 0 0 028 Credit for residential energy efficient property ����� 0 0 0 0 0 0 0 0 0 0 0 029 Qualified energy conservation bonds 5 ���������������� 10 10 10 10 10 10 10 10 10 10 10 10030 Advanced Energy Property Credit ����������������������� 10 10 10 10 10 10 10 10 10 10 10 10031 Advanced nuclear power production credit ���������� 0 0 80 180 220 240 270 280 280 270 180 2,00032 Reduced tax rate for nuclear decommissioning
funds ��������������������������������������������������������������� 100 110 110 120 120 130 130 140 150 150 160 1,320
Natural resources and environment: 33 Expensing of exploration and development costs,
nonfuel minerals ��������������������������������������������� 0 0 0 0 10 10 10 10 10 10 10 7034 Excess of percentage over cost depletion,
nonfuel minerals ��������������������������������������������� 70 60 70 80 80 90 90 100 110 110 120 910
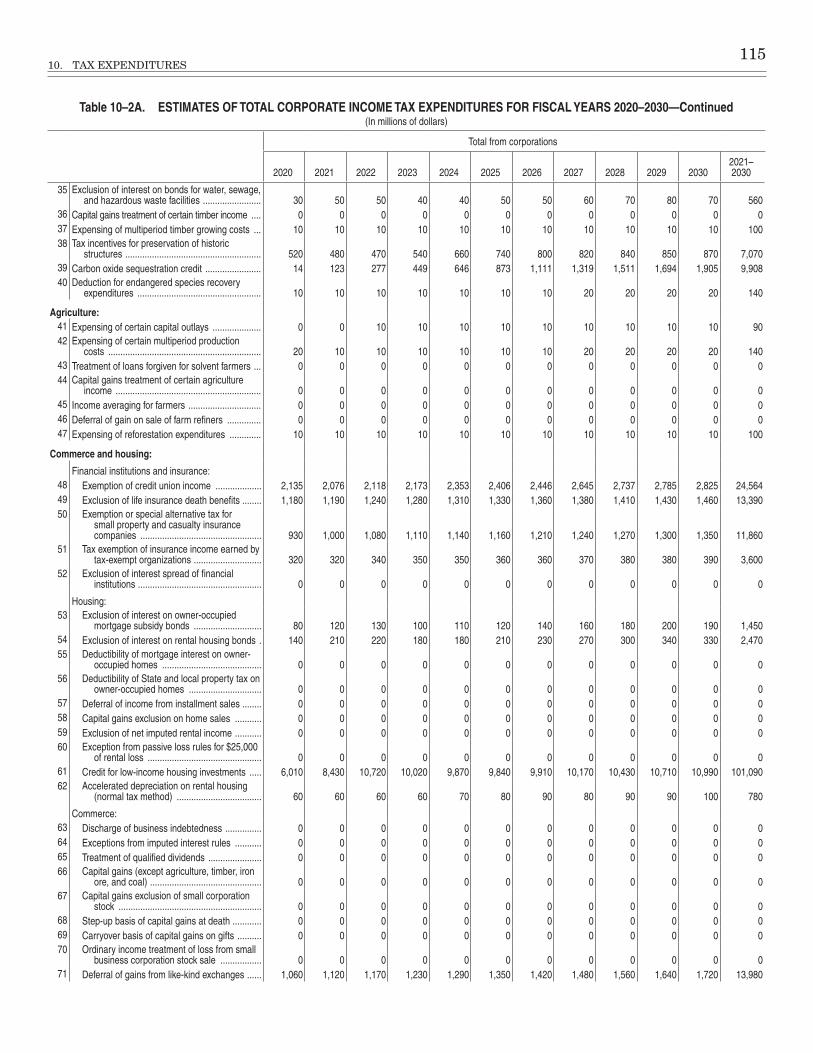
10. TAX EXPENDITURES 115
Table 10–2A. ESTIMATES OF TOTAL CORPORATE INCOME TAX EXPENDITURES FOR FISCAL YEARS 2020–2030—Continued(In millions of dollars)
Total from corporations
2020 2021 2022 2023 2024 2025 2026 2027 2028 2029 20302021–2030
35 Exclusion of interest on bonds for water, sewage, and hazardous waste facilities ������������������������ 30 50 50 40 40 50 50 60 70 80 70 560
36 Capital gains treatment of certain timber income ���� 0 0 0 0 0 0 0 0 0 0 0 037 Expensing of multiperiod timber growing costs ��� 10 10 10 10 10 10 10 10 10 10 10 10038 Tax incentives for preservation of historic
structures �������������������������������������������������������� 520 480 470 540 660 740 800 820 840 850 870 7,07039 Carbon oxide sequestration credit ����������������������� 14 123 277 449 646 873 1,111 1,319 1,511 1,694 1,905 9,90840 Deduction for endangered species recovery
expenditures ��������������������������������������������������� 10 10 10 10 10 10 10 20 20 20 20 140
Agriculture: 41 Expensing of certain capital outlays �������������������� 0 0 10 10 10 10 10 10 10 10 10 9042 Expensing of certain multiperiod production
costs ��������������������������������������������������������������� 20 10 10 10 10 10 10 20 20 20 20 14043 Treatment of loans forgiven for solvent farmers ��� 0 0 0 0 0 0 0 0 0 0 0 044 Capital gains treatment of certain agriculture
income ������������������������������������������������������������ 0 0 0 0 0 0 0 0 0 0 0 045 Income averaging for farmers ������������������������������ 0 0 0 0 0 0 0 0 0 0 0 046 Deferral of gain on sale of farm refiners �������������� 0 0 0 0 0 0 0 0 0 0 0 047 Expensing of reforestation expenditures ������������� 10 10 10 10 10 10 10 10 10 10 10 100
Commerce and housing:
Financial institutions and insurance: 48 Exemption of credit union income ������������������� 2,135 2,076 2,118 2,173 2,353 2,406 2,446 2,645 2,737 2,785 2,825 24,56449 Exclusion of life insurance death benefits �������� 1,180 1,190 1,240 1,280 1,310 1,330 1,360 1,380 1,410 1,430 1,460 13,39050 Exemption or special alternative tax for
small property and casualty insurance companies �������������������������������������������������� 930 1,000 1,080 1,110 1,140 1,160 1,210 1,240 1,270 1,300 1,350 11,860
51 Tax exemption of insurance income earned by tax-exempt organizations ���������������������������� 320 320 340 350 350 360 360 370 380 380 390 3,600
52 Exclusion of interest spread of financial institutions ��������������������������������������������������� 0 0 0 0 0 0 0 0 0 0 0 0
Housing: 53 Exclusion of interest on owner-occupied
mortgage subsidy bonds ���������������������������� 80 120 130 100 110 120 140 160 180 200 190 1,45054 Exclusion of interest on rental housing bonds � 140 210 220 180 180 210 230 270 300 340 330 2,47055 Deductibility of mortgage interest on owner-
occupied homes ����������������������������������������� 0 0 0 0 0 0 0 0 0 0 0 056 Deductibility of State and local property tax on
owner-occupied homes ������������������������������ 0 0 0 0 0 0 0 0 0 0 0 057 Deferral of income from installment sales �������� 0 0 0 0 0 0 0 0 0 0 0 058 Capital gains exclusion on home sales ����������� 0 0 0 0 0 0 0 0 0 0 0 059 Exclusion of net imputed rental income ����������� 0 0 0 0 0 0 0 0 0 0 0 060 Exception from passive loss rules for $25,000
of rental loss ����������������������������������������������� 0 0 0 0 0 0 0 0 0 0 0 061 Credit for low-income housing investments ����� 6,010 8,430 10,720 10,020 9,870 9,840 9,910 10,170 10,430 10,710 10,990 101,09062 Accelerated depreciation on rental housing
(normal tax method) ����������������������������������� 60 60 60 60 70 80 90 80 90 90 100 780
Commerce: 63 Discharge of business indebtedness ��������������� 0 0 0 0 0 0 0 0 0 0 0 064 Exceptions from imputed interest rules ����������� 0 0 0 0 0 0 0 0 0 0 0 065 Treatment of qualified dividends ���������������������� 0 0 0 0 0 0 0 0 0 0 0 066 Capital gains (except agriculture, timber, iron
ore, and coal) ���������������������������������������������� 0 0 0 0 0 0 0 0 0 0 0 067 Capital gains exclusion of small corporation
stock ����������������������������������������������������������� 0 0 0 0 0 0 0 0 0 0 0 068 Step-up basis of capital gains at death ������������ 0 0 0 0 0 0 0 0 0 0 0 069 Carryover basis of capital gains on gifts ���������� 0 0 0 0 0 0 0 0 0 0 0 070 Ordinary income treatment of loss from small
business corporation stock sale ����������������� 0 0 0 0 0 0 0 0 0 0 0 071 Deferral of gains from like-kind exchanges ������ 1,060 1,120 1,170 1,230 1,290 1,350 1,420 1,480 1,560 1,640 1,720 13,980
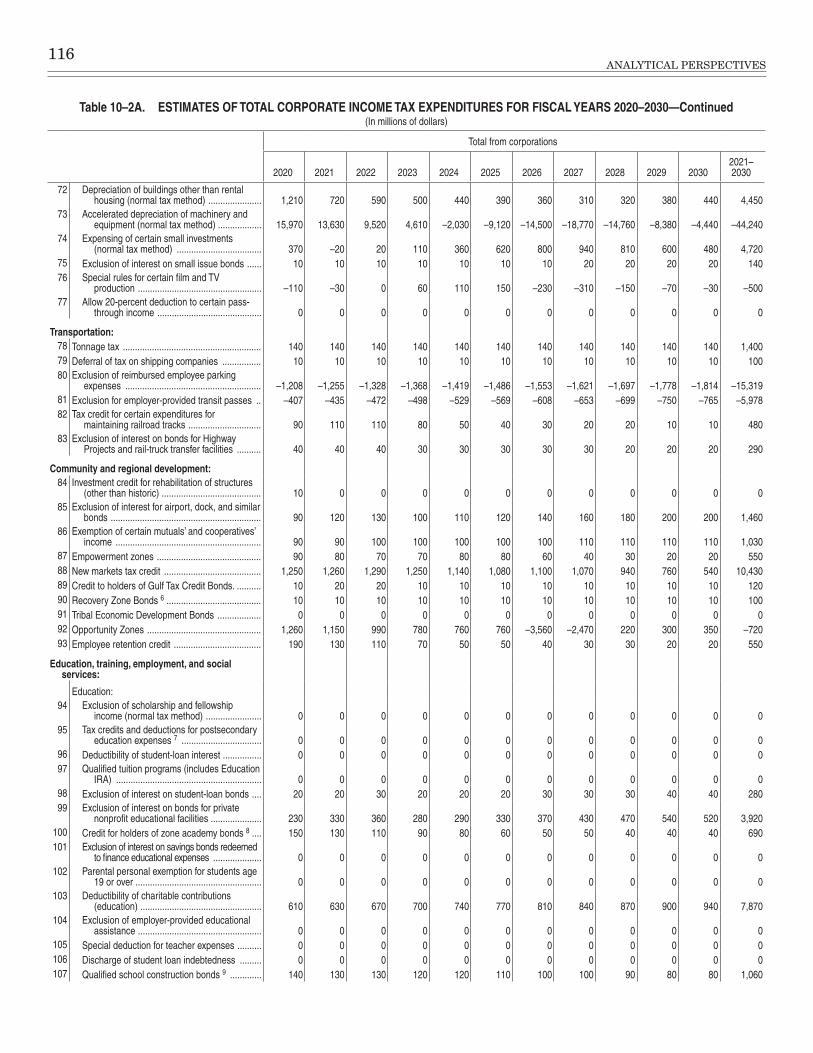
116ANALYTICAL PERSPECTIVES
Table 10–2A. ESTIMATES OF TOTAL CORPORATE INCOME TAX EXPENDITURES FOR FISCAL YEARS 2020–2030—Continued(In millions of dollars)
Total from corporations
2020 2021 2022 2023 2024 2025 2026 2027 2028 2029 20302021–2030
72 Depreciation of buildings other than rental housing (normal tax method) ���������������������� 1,210 720 590 500 440 390 360 310 320 380 440 4,450
73 Accelerated depreciation of machinery and equipment (normal tax method) ������������������ 15,970 13,630 9,520 4,610 –2,030 –9,120 –14,500 –18,770 –14,760 –8,380 –4,440 –44,240
74 Expensing of certain small investments (normal tax method) ����������������������������������� 370 –20 20 110 360 620 800 940 810 600 480 4,720
75 Exclusion of interest on small issue bonds ������ 10 10 10 10 10 10 10 20 20 20 20 14076 Special rules for certain film and TV
production ��������������������������������������������������� –110 –30 0 60 110 150 –230 –310 –150 –70 –30 –50077 Allow 20-percent deduction to certain pass-
through income ������������������������������������������� 0 0 0 0 0 0 0 0 0 0 0 0
Transportation: 78 Tonnage tax ��������������������������������������������������������� 140 140 140 140 140 140 140 140 140 140 140 1,40079 Deferral of tax on shipping companies ���������������� 10 10 10 10 10 10 10 10 10 10 10 10080 Exclusion of reimbursed employee parking
expenses �������������������������������������������������������� –1,208 –1,255 –1,328 –1,368 –1,419 –1,486 –1,553 –1,621 –1,697 –1,778 –1,814 –15,31981 Exclusion for employer-provided transit passes �� –407 –435 –472 –498 –529 –569 –608 –653 –699 –750 –765 –5,97882 Tax credit for certain expenditures for
maintaining railroad tracks ������������������������������ 90 110 110 80 50 40 30 20 20 10 10 48083 Exclusion of interest on bonds for Highway
Projects and rail-truck transfer facilities ���������� 40 40 40 30 30 30 30 30 20 20 20 290
Community and regional development: 84 Investment credit for rehabilitation of structures
(other than historic) ����������������������������������������� 10 0 0 0 0 0 0 0 0 0 0 085 Exclusion of interest for airport, dock, and similar
bonds �������������������������������������������������������������� 90 120 130 100 110 120 140 160 180 200 200 1,46086 Exemption of certain mutuals’ and cooperatives’
income ������������������������������������������������������������ 90 90 100 100 100 100 100 110 110 110 110 1,03087 Empowerment zones ������������������������������������������� 90 80 70 70 80 80 60 40 30 20 20 55088 New markets tax credit ���������������������������������������� 1,250 1,260 1,290 1,250 1,140 1,080 1,100 1,070 940 760 540 10,43089 Credit to holders of Gulf Tax Credit Bonds� ���������� 10 20 20 10 10 10 10 10 10 10 10 12090 Recovery Zone Bonds 6 ��������������������������������������� 10 10 10 10 10 10 10 10 10 10 10 10091 Tribal Economic Development Bonds ������������������ 0 0 0 0 0 0 0 0 0 0 0 092 Opportunity Zones ����������������������������������������������� 1,260 1,150 990 780 760 760 –3,560 –2,470 220 300 350 –72093 Employee retention credit ������������������������������������ 190 130 110 70 50 50 40 30 30 20 20 550
Education, training, employment, and social services:
Education: 94 Exclusion of scholarship and fellowship
income (normal tax method) ����������������������� 0 0 0 0 0 0 0 0 0 0 0 095 Tax credits and deductions for postsecondary
education expenses 7 ��������������������������������� 0 0 0 0 0 0 0 0 0 0 0 096 Deductibility of student-loan interest ���������������� 0 0 0 0 0 0 0 0 0 0 0 097 Qualified tuition programs (includes Education
IRA) ������������������������������������������������������������ 0 0 0 0 0 0 0 0 0 0 0 098 Exclusion of interest on student-loan bonds ���� 20 20 30 20 20 20 30 30 30 40 40 28099 Exclusion of interest on bonds for private
nonprofit educational facilities ��������������������� 230 330 360 280 290 330 370 430 470 540 520 3,920100 Credit for holders of zone academy bonds 8 ���� 150 130 110 90 80 60 50 50 40 40 40 690101 Exclusion of interest on savings bonds redeemed
to finance educational expenses �������������������� 0 0 0 0 0 0 0 0 0 0 0 0102 Parental personal exemption for students age
19 or over ���������������������������������������������������� 0 0 0 0 0 0 0 0 0 0 0 0103 Deductibility of charitable contributions
(education) �������������������������������������������������� 610 630 670 700 740 770 810 840 870 900 940 7,870104 Exclusion of employer-provided educational
assistance ��������������������������������������������������� 0 0 0 0 0 0 0 0 0 0 0 0105 Special deduction for teacher expenses ���������� 0 0 0 0 0 0 0 0 0 0 0 0106 Discharge of student loan indebtedness ��������� 0 0 0 0 0 0 0 0 0 0 0 0107 Qualified school construction bonds 9 ������������� 140 130 130 120 120 110 100 100 90 80 80 1,060
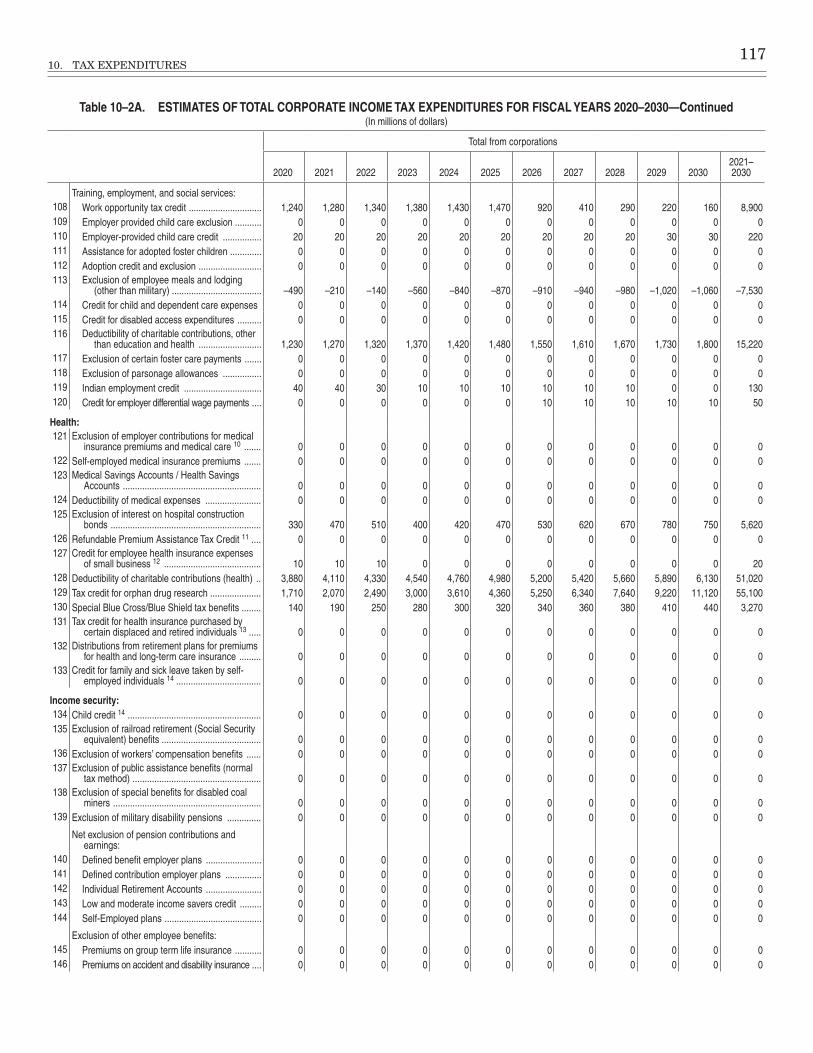
10. TAX EXPENDITURES 117
Table 10–2A. ESTIMATES OF TOTAL CORPORATE INCOME TAX EXPENDITURES FOR FISCAL YEARS 2020–2030—Continued(In millions of dollars)
Total from corporations
2020 2021 2022 2023 2024 2025 2026 2027 2028 2029 20302021–2030
Training, employment, and social services: 108 Work opportunity tax credit ������������������������������ 1,240 1,280 1,340 1,380 1,430 1,470 920 410 290 220 160 8,900109 Employer provided child care exclusion ����������� 0 0 0 0 0 0 0 0 0 0 0 0110 Employer-provided child care credit ���������������� 20 20 20 20 20 20 20 20 20 30 30 220111 Assistance for adopted foster children ������������� 0 0 0 0 0 0 0 0 0 0 0 0112 Adoption credit and exclusion �������������������������� 0 0 0 0 0 0 0 0 0 0 0 0113 Exclusion of employee meals and lodging
(other than military) ������������������������������������� –490 –210 –140 –560 –840 –870 –910 –940 –980 –1,020 –1,060 –7,530114 Credit for child and dependent care expenses 0 0 0 0 0 0 0 0 0 0 0 0115 Credit for disabled access expenditures ���������� 0 0 0 0 0 0 0 0 0 0 0 0116 Deductibility of charitable contributions, other
than education and health �������������������������� 1,230 1,270 1,320 1,370 1,420 1,480 1,550 1,610 1,670 1,730 1,800 15,220117 Exclusion of certain foster care payments ������� 0 0 0 0 0 0 0 0 0 0 0 0118 Exclusion of parsonage allowances ���������������� 0 0 0 0 0 0 0 0 0 0 0 0119 Indian employment credit �������������������������������� 40 40 30 10 10 10 10 10 10 0 0 130120 Credit for employer differential wage payments ���� 0 0 0 0 0 0 10 10 10 10 10 50
Health: 121 Exclusion of employer contributions for medical
insurance premiums and medical care 10 ������� 0 0 0 0 0 0 0 0 0 0 0 0122 Self-employed medical insurance premiums ������� 0 0 0 0 0 0 0 0 0 0 0 0123 Medical Savings Accounts / Health Savings
Accounts ��������������������������������������������������������� 0 0 0 0 0 0 0 0 0 0 0 0124 Deductibility of medical expenses ����������������������� 0 0 0 0 0 0 0 0 0 0 0 0125 Exclusion of interest on hospital construction
bonds �������������������������������������������������������������� 330 470 510 400 420 470 530 620 670 780 750 5,620126 Refundable Premium Assistance Tax Credit 11 ���� 0 0 0 0 0 0 0 0 0 0 0 0127 Credit for employee health insurance expenses
of small business 12 ���������������������������������������� 10 10 10 0 0 0 0 0 0 0 0 20128 Deductibility of charitable contributions (health) �� 3,880 4,110 4,330 4,540 4,760 4,980 5,200 5,420 5,660 5,890 6,130 51,020129 Tax credit for orphan drug research ��������������������� 1,710 2,070 2,490 3,000 3,610 4,360 5,250 6,340 7,640 9,220 11,120 55,100130 Special Blue Cross/Blue Shield tax benefits �������� 140 190 250 280 300 320 340 360 380 410 440 3,270131 Tax credit for health insurance purchased by
certain displaced and retired individuals 13 ����� 0 0 0 0 0 0 0 0 0 0 0 0132 Distributions from retirement plans for premiums
for health and long-term care insurance ��������� 0 0 0 0 0 0 0 0 0 0 0 0133 Credit for family and sick leave taken by self-
employed individuals 14 ����������������������������������� 0 0 0 0 0 0 0 0 0 0 0 0
Income security: 134 Child credit 14 ������������������������������������������������������� 0 0 0 0 0 0 0 0 0 0 0 0135 Exclusion of railroad retirement (Social Security
equivalent) benefits ����������������������������������������� 0 0 0 0 0 0 0 0 0 0 0 0136 Exclusion of workers’ compensation benefits ������ 0 0 0 0 0 0 0 0 0 0 0 0137 Exclusion of public assistance benefits (normal
tax method) ����������������������������������������������������� 0 0 0 0 0 0 0 0 0 0 0 0138 Exclusion of special benefits for disabled coal
miners ������������������������������������������������������������� 0 0 0 0 0 0 0 0 0 0 0 0139 Exclusion of military disability pensions �������������� 0 0 0 0 0 0 0 0 0 0 0 0
Net exclusion of pension contributions and earnings:
140 Defined benefit employer plans ����������������������� 0 0 0 0 0 0 0 0 0 0 0 0141 Defined contribution employer plans ��������������� 0 0 0 0 0 0 0 0 0 0 0 0142 Individual Retirement Accounts ����������������������� 0 0 0 0 0 0 0 0 0 0 0 0143 Low and moderate income savers credit ��������� 0 0 0 0 0 0 0 0 0 0 0 0144 Self-Employed plans ���������������������������������������� 0 0 0 0 0 0 0 0 0 0 0 0
Exclusion of other employee benefits: 145 Premiums on group term life insurance ����������� 0 0 0 0 0 0 0 0 0 0 0 0146 Premiums on accident and disability insurance ���� 0 0 0 0 0 0 0 0 0 0 0 0

118ANALYTICAL PERSPECTIVES
Table 10–2A. ESTIMATES OF TOTAL CORPORATE INCOME TAX EXPENDITURES FOR FISCAL YEARS 2020–2030—Continued(In millions of dollars)
Total from corporations
2020 2021 2022 2023 2024 2025 2026 2027 2028 2029 20302021–2030
147 Income of trusts to finance supplementary unemployment benefits ����������������������������������� 0 0 0 0 0 0 0 0 0 0 0 0
148 Income of trusts to finance voluntary employee benefits associations �������������������������������������� 1,090 1,070 1,120 1,170 1,230 1,300 1,440 1,510 1,590 1,680 1,760 13,870
149 Special ESOP rules ��������������������������������������������� 180 180 190 190 190 200 200 210 210 220 220 2,010150 Additional deduction for the blind ������������������������� 0 0 0 0 0 0 0 0 0 0 0 0151 Additional deduction for the elderly ��������������������� 0 0 0 0 0 0 0 0 0 0 0 0152 Deductibility of casualty losses ���������������������������� 0 0 0 0 0 0 0 0 0 0 0 0153 Earned income tax credit 15 ��������������������������������� 0 0 0 0 0 0 0 0 0 0 0 0154 Recovery rebate credits 16 ����������������������������������� 0 0 0 0 0 0 0 0 0 0 0 0
Social Security:
Exclusion of social security benefits: 155 Social Security benefits for retired and
disabled workers and spouses, dependents and survivors ���������������������������������������������� 0 0 0 0 0 0 0 0 0 0 0 0
156 Credit for certain employer contributions to social security ��������������������������������������������� 150 210 290 320 340 360 380 400 420 440 460 3,620
Veterans benefits and services: 157 Exclusion of veterans death benefits and
disability compensation ���������������������������������� 0 0 0 0 0 0 0 0 0 0 0 0158 Exclusion of veterans pensions ��������������������������� 0 0 0 0 0 0 0 0 0 0 0 0159 Exclusion of GI bill benefits ��������������������������������� 0 0 0 0 0 0 0 0 0 0 0 0160 Exclusion of interest on veterans housing bonds ����� 10 10 10 10 10 10 10 20 20 20 20 140
General purpose fiscal assistance: 161 Exclusion of interest on public purpose State and
local bonds ����������������������������������������������������� 2,900 4,210 4,520 3,540 3,710 4,160 4,720 5,520 5,990 6,910 6,650 49,930162 Build America Bonds 16 ��������������������������������������� 0 0 0 0 0 0 0 0 0 0 0 0163 Deductibility of nonbusiness State and local taxes
other than on owner-occupied homes �������������� 0 0 0 0 0 0 0 0 0 0 0 0
Interest: 164 Deferral of interest on U�S� savings bonds ����������� 0 0 0 0 0 0 0 0 0 0 0 0
Addendum: Aid to State and local governments:
Deductibility of: Property taxes on owner-occupied homes ������ 0 0 0 0 0 0 0 0 0 0 0 0Nonbusiness State and local taxes other than
on owner-occupied homes ������������������������� 0 0 0 0 0 0 0 0 0 0 0 0
Exclusion of interest on State and local bonds for: Public purposes ����������������������������������������������� 2,900 4,210 4,520 3,540 3,710 4,160 4,720 5,520 5,990 6,910 6,650 49,930Energy facilities ����������������������������������������������� 0 0 0 0 0 0 0 0 0 0 0 0Water, sewage, and hazardous waste disposal
facilities ������������������������������������������������������� 30 50 50 40 40 50 50 60 70 80 70 560Small-issues ���������������������������������������������������� 10 10 10 10 10 10 10 20 20 20 20 140Owner-occupied mortgage subsidies �������������� 80 120 130 100 110 120 140 160 180 200 190 1,450Rental housing ������������������������������������������������� 140 210 220 180 180 210 230 270 300 340 330 2,470Airports, docks, and similar facilities ���������������� 90 120 130 100 110 120 140 160 180 200 200 1,460Student loans ��������������������������������������������������� 20 20 30 20 20 20 30 30 30 40 40 280Private nonprofit educational facilities ������������� 230 330 360 280 290 330 370 430 470 540 520 3,920Hospital construction ��������������������������������������� 330 470 510 400 420 470 530 620 670 780 750 5,620Veterans’ housing �������������������������������������������� 10 10 10 10 10 10 10 20 20 20 20 140
See Table 10–1 footnotes for specific table information

10. TAX EXPENDITURES 119
Table 10–2B. ESTIMATES OF TOTAL INDIVIDUAL INCOME TAX EXPENDITURES FOR FISCAL YEARS 2020–2030(In millions of dollars)
Total from individuals
2020 2021 2022 2023 2024 2025 2026 2027 2028 2029 20302021–2030
National Defense1 Exclusion of benefits and allowances to armed
forces personnel ��������������������������������������������� 12,910 13,940 14,460 15,010 13,770 13,890 14,380 14,990 15,660 16,390 17,160 149,650
International affairs: 2 Exclusion of income earned abroad by U�S�
citizens ������������������������������������������������������������ 6,160 6,470 6,790 7,130 7,490 7,860 8,260 8,670 9,100 9,560 10,040 81,3703 Exclusion of certain allowances for Federal
employees abroad ������������������������������������������ 270 280 290 310 320 340 360 370 390 410 430 3,5004 Reduced tax rate on active income of controlled
foreign corporations (normal tax method) ������� 180 200 210 230 240 250 200 200 210 210 210 2,1505 Deduction for foreign-derived intangible income
dervied from trade or business within the United States �������������������������������������������������� 0 0 0 0 0 0 0 0 0 0 0 0
6 Interest Charge Domestic International Sales Corporations (IC-DISCs) �������������������������������� 890 1,370 1,440 1,510 1,590 1,690 2,010 2,280 2,410 2,520 2,600 19,420
General science, space, and technology: 7 Expensing of research and experimentation
expenditures (normal tax method) ������������������ 1,180 490 –1,850 –5,210 –5,050 –3,350 –1,180 0 0 0 0 –16,1508 Credit for increasing research activities ��������������� 1,790 1,930 2,090 2,240 2,380 2,520 2,670 2,830 2,990 3,170 3,360 26,180
Energy: 9 Expensing of exploration and development costs,
fuels ���������������������������������������������������������������� 30 –30 70 180 300 340 370 390 400 410 400 2,83010 Excess of percentage over cost depletion, fuels � 220 240 300 330 350 370 420 460 490 520 540 4,02011 Exception from passive loss limitation for working
interests in oil and gas properties ������������������� 20 20 10 20 20 20 20 20 20 20 20 19012 Capital gains treatment of royalties on coal ��������� 100 70 50 50 50 50 60 60 60 70 70 59013 Exclusion of interest on energy facility bonds ������ 0 10 10 10 10 10 10 10 10 10 10 10014 Enhanced oil recovery credit ������������������������������� 20 20 30 30 50 50 60 60 70 70 70 51015 Energy production credit 1 ����������������������������������� 500 530 520 540 580 600 570 560 530 490 430 5,35016 Marginal wells credit �������������������������������������������� 20 40 50 40 30 20 10 10 0 0 0 20017 Energy investment credit 1 ����������������������������������� 510 530 580 560 610 630 580 570 450 350 240 5,10018 Alcohol fuel credits 2 ������������������������������������������� 0 10 0 0 0 0 0 0 0 0 0 1019 Bio-Diesel and small agri-biodiesel producer tax
credits 3 ���������������������������������������������������������� 20 20 20 10 0 0 0 0 0 0 0 5020 Tax credits for clean-fuel burning vehicles and
refueling property ������������������������������������������� 400 300 330 310 270 260 240 200 180 170 160 2,42021 Exclusion of utility conservation subsidies ����������� 60 60 50 50 50 40 40 40 30 30 30 42022 Credit for holding clean renewable energy bonds
4 ���������������������������������������������������������������������� 50 50 50 50 50 50 50 50 50 50 50 50023 Credit for investment in clean coal facilities ��������� 0 0 0 0 0 0 0 0 0 0 0 024 Amortize all geological and geophysical
expenditures over 2 years ������������������������������� 50 50 60 60 70 70 70 70 70 70 70 66025 Allowance of deduction for certain energy
efficient commercial building property ������������ 150 150 110 90 90 90 90 90 90 90 90 98026 Credit for construction of new energy efficient
homes ������������������������������������������������������������� 110 140 120 100 100 100 100 60 20 10 0 75027 Credit for energy efficiency improvements to
existing homes ������������������������������������������������ 240 240 120 0 0 0 0 0 0 0 0 36028 Credit for residential energy efficient property ����� 2,370 2,390 1,980 1,450 420 120 0 0 0 0 0 6,36029 Qualified energy conservation bonds 5 ���������������� 20 20 20 20 20 20 20 20 20 20 20 20030 Advanced Energy Property Credit ����������������������� 0 0 0 0 0 0 0 0 0 0 0 031 Advanced nuclear power production credit ���������� 0 0 0 0 0 0 0 0 0 0 0 032 Reduced tax rate for nuclear decommissioning
funds ��������������������������������������������������������������� 0 0 0 0 0 0 0 0 0 0 0 0
Natural resources and environment: 33 Expensing of exploration and development costs,
nonfuel minerals ��������������������������������������������� 0 0 10 20 30 30 30 30 40 40 40 27034 Excess of percentage over cost depletion,
nonfuel minerals ��������������������������������������������� 40 40 50 60 60 70 70 80 90 90 100 710

120ANALYTICAL PERSPECTIVES
Table 10–2B. ESTIMATES OF TOTAL INDIVIDUAL INCOME TAX EXPENDITURES FOR FISCAL YEARS 2020–2030—Continued(In millions of dollars)
Total from individuals
2020 2021 2022 2023 2024 2025 2026 2027 2028 2029 20302021–2030
35 Exclusion of interest on bonds for water, sewage, and hazardous waste facilities ������������������������ 240 280 300 310 310 310 320 330 330 350 350 3,190
36 Capital gains treatment of certain timber income ���� 130 130 140 140 150 150 170 190 200 210 220 1,70037 Expensing of multiperiod timber growing costs ��� 40 50 50 60 60 60 70 70 80 70 70 64038 Tax incentives for preservation of historic
structures �������������������������������������������������������� 140 130 120 130 160 190 200 210 220 220 220 1,80039 Carbon oxide sequestration credit ����������������������� 0 0 0 0 0 0 0 0 0 0 0 040 Deduction for endangered species recovery
expenditures ��������������������������������������������������� 20 20 20 20 30 30 30 40 40 40 50 320
Agriculture: 41 Expensing of certain capital outlays �������������������� 80 120 150 150 160 170 210 230 240 250 260 1,94042 Expensing of certain multiperiod production
costs ��������������������������������������������������������������� 540 360 330 350 360 380 470 520 540 560 580 4,45043 Treatment of loans forgiven for solvent farmers ��� 50 50 60 60 60 60 70 70 70 70 70 64044 Capital gains treatment of certain agriculture
income ������������������������������������������������������������ 1,330 1,340 1,370 1,410 1,470 1,540 1,720 1,900 1,990 2,090 2,190 17,02045 Income averaging for farmers ������������������������������ 170 180 200 200 210 220 230 230 230 230 230 2,16046 Deferral of gain on sale of farm refiners �������������� 15 15 15 15 15 20 20 20 20 20 20 18047 Expensing of reforestation expenditures ������������� 40 50 50 60 60 60 70 70 80 70 70 640
Commerce and housing:
Financial institutions and insurance: 48 Exemption of credit union income ������������������� 0 0 0 0 0 0 0 0 0 0 0 049 Exclusion of life insurance death benefits �������� 10,510 10,370 10,820 11,160 11,560 12,070 12,850 13,780 14,290 14,670 15,120 126,69050 Exemption or special alternative tax for
small property and casualty insurance companies �������������������������������������������������� 0 0 0 0 0 0 0 0 0 0 0 0
51 Tax exemption of insurance income earned by tax-exempt organizations ���������������������������� 0 0 0 0 0 0 0 0 0 0 0 0
52 Exclusion of interest spread of financial institutions ��������������������������������������������������� 4,230 3,110 2,030 2,080 2,150 2,240 2,380 2,500 2,580 2,660 2,740 24,470
Housing: 53 Exclusion of interest on owner-occupied
mortgage subsidy bonds ���������������������������� 630 730 790 800 800 800 840 860 870 910 910 8,31054 Exclusion of interest on rental housing bonds � 1,060 1,220 1,330 1,350 1,350 1,350 1,410 1,450 1,470 1,530 1,540 14,00055 Deductibility of mortgage interest on owner-
occupied homes ����������������������������������������� 24,730 25,440 26,170 26,920 28,340 30,250 67,330 89,630 95,150 100,420 106,330 595,98056 Deductibility of State and local property tax on
owner-occupied homes ������������������������������ 6,450 6,370 6,450 6,620 6,860 7,130 35,890 52,340 55,090 57,590 60,260 294,60057 Deferral of income from installment sales �������� 1,480 1,470 1,460 1,510 1,550 1,610 1,670 1,730 1,800 1,870 1,950 16,62058 Capital gains exclusion on home sales ����������� 39,450 40,610 41,800 43,030 44,730 46,340 51,480 55,060 57,070 59,170 61,370 500,66059 Exclusion of net imputed rental income ����������� 123,210 130,590 139,290 148,090 153,210 154,180 176,960 180,390 183,950 187,880 191,440 1,645,98060 Exception from passive loss rules for $25,000
of rental loss ����������������������������������������������� 5,700 5,540 5,870 6,210 6,460 6,860 7,490 7,600 7,700 7,770 7,850 69,35061 Credit for low-income housing investments ����� 300 470 560 520 520 520 520 540 550 560 580 5,34062 Accelerated depreciation on rental housing
(normal tax method) ����������������������������������� 4,190 4,600 4,840 5,000 5,230 5,430 6,160 6,660 6,800 6,950 7,100 58,770
Commerce: 63 Discharge of business indebtedness ��������������� 40 30 40 20 20 10 30 30 30 30 40 28064 Exceptions from imputed interest rules ����������� 60 60 70 70 70 80 80 90 90 100 100 81065 Treatment of qualified dividends ���������������������� 29,450 30,760 32,130 33,560 34,710 36,250 39,120 42,250 44,290 46,140 48,030 387,24066 Capital gains (except agriculture, timber, iron
ore, and coal) ���������������������������������������������� 99,210 99,890 101,950 105,290 109,710 114,910 128,090 141,870 148,780 156,060 163,700 1,270,25067 Capital gains exclusion of small corporation
stock ����������������������������������������������������������� 1,410 1,530 1,640 1,750 1,850 1,930 2,000 2,080 2,160 2,250 2,350 19,54068 Step-up basis of capital gains at death ������������ 35,460 37,780 40,260 42,910 45,510 48,050 50,350 54,840 58,340 61,790 65,620 505,45069 Carryover basis of capital gains on gifts ���������� 2,610 3,050 3,560 3,820 4,070 4,090 4,750 5,430 5,270 5,210 5,300 44,55070 Ordinary income treatment of loss from small
business corporation stock sale ����������������� 70 70 70 70 80 80 80 80 90 90 90 80071 Deferral of gains from like-kind exchanges ������ 1,970 2,080 2,180 2,290 2,400 2,520 2,650 2,780 2,920 3,070 3,220 26,110
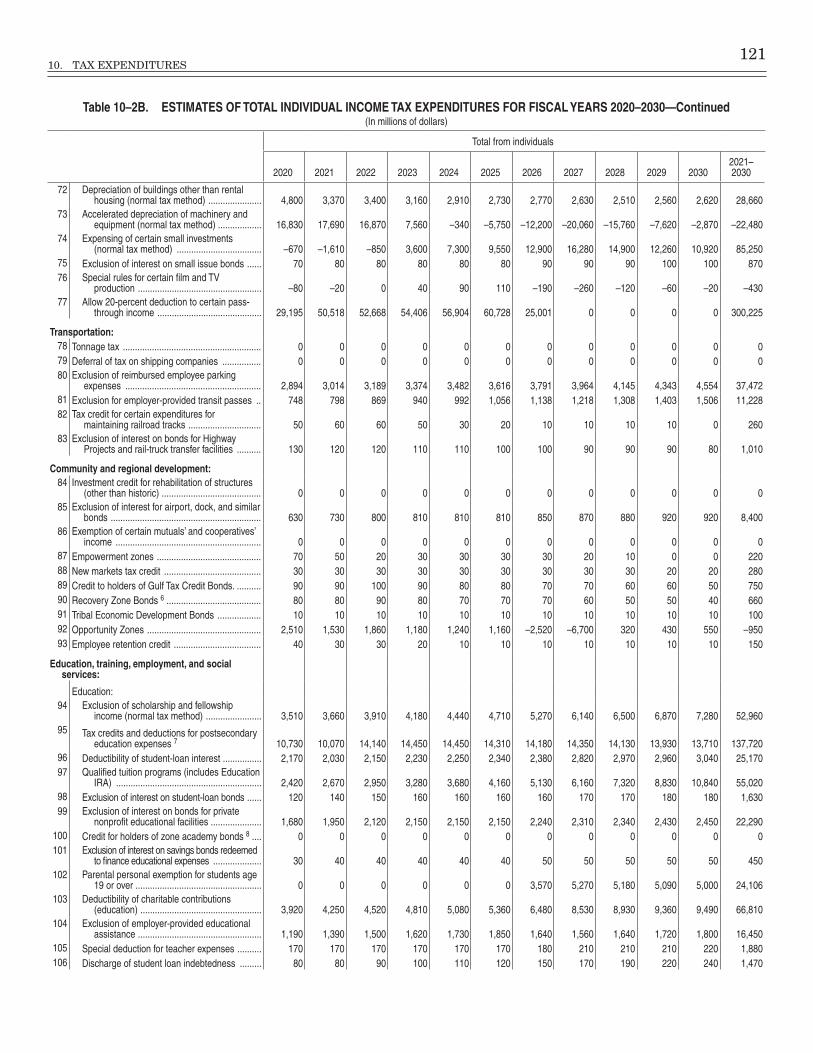
10. TAX EXPENDITURES 121
Table 10–2B. ESTIMATES OF TOTAL INDIVIDUAL INCOME TAX EXPENDITURES FOR FISCAL YEARS 2020–2030—Continued(In millions of dollars)
Total from individuals
2020 2021 2022 2023 2024 2025 2026 2027 2028 2029 20302021–2030
72 Depreciation of buildings other than rental housing (normal tax method) ���������������������� 4,800 3,370 3,400 3,160 2,910 2,730 2,770 2,630 2,510 2,560 2,620 28,660
73 Accelerated depreciation of machinery and equipment (normal tax method) ������������������ 16,830 17,690 16,870 7,560 –340 –5,750 –12,200 –20,060 –15,760 –7,620 –2,870 –22,480
74 Expensing of certain small investments (normal tax method) ����������������������������������� –670 –1,610 –850 3,600 7,300 9,550 12,900 16,280 14,900 12,260 10,920 85,250
75 Exclusion of interest on small issue bonds ������ 70 80 80 80 80 80 90 90 90 100 100 87076 Special rules for certain film and TV
production ��������������������������������������������������� –80 –20 0 40 90 110 –190 –260 –120 –60 –20 –43077 Allow 20-percent deduction to certain pass-
through income ������������������������������������������� 29,195 50,518 52,668 54,406 56,904 60,728 25,001 0 0 0 0 300,225
Transportation: 78 Tonnage tax ��������������������������������������������������������� 0 0 0 0 0 0 0 0 0 0 0 079 Deferral of tax on shipping companies ���������������� 0 0 0 0 0 0 0 0 0 0 0 080 Exclusion of reimbursed employee parking
expenses �������������������������������������������������������� 2,894 3,014 3,189 3,374 3,482 3,616 3,791 3,964 4,145 4,343 4,554 37,47281 Exclusion for employer-provided transit passes �� 748 798 869 940 992 1,056 1,138 1,218 1,308 1,403 1,506 11,22882 Tax credit for certain expenditures for
maintaining railroad tracks ������������������������������ 50 60 60 50 30 20 10 10 10 10 0 26083 Exclusion of interest on bonds for Highway
Projects and rail-truck transfer facilities ���������� 130 120 120 110 110 100 100 90 90 90 80 1,010
Community and regional development: 84 Investment credit for rehabilitation of structures
(other than historic) ����������������������������������������� 0 0 0 0 0 0 0 0 0 0 0 085 Exclusion of interest for airport, dock, and similar
bonds �������������������������������������������������������������� 630 730 800 810 810 810 850 870 880 920 920 8,40086 Exemption of certain mutuals’ and cooperatives’
income ������������������������������������������������������������ 0 0 0 0 0 0 0 0 0 0 0 087 Empowerment zones ������������������������������������������� 70 50 20 30 30 30 30 20 10 0 0 22088 New markets tax credit ���������������������������������������� 30 30 30 30 30 30 30 30 30 20 20 28089 Credit to holders of Gulf Tax Credit Bonds� ���������� 90 90 100 90 80 80 70 70 60 60 50 75090 Recovery Zone Bonds 6 ��������������������������������������� 80 80 90 80 70 70 70 60 50 50 40 66091 Tribal Economic Development Bonds ������������������ 10 10 10 10 10 10 10 10 10 10 10 10092 Opportunity Zones ����������������������������������������������� 2,510 1,530 1,860 1,180 1,240 1,160 –2,520 –6,700 320 430 550 –95093 Employee retention credit ������������������������������������ 40 30 30 20 10 10 10 10 10 10 10 150
Education, training, employment, and social services:
Education: 94 Exclusion of scholarship and fellowship
income (normal tax method) ����������������������� 3,510 3,660 3,910 4,180 4,440 4,710 5,270 6,140 6,500 6,870 7,280 52,96095 Tax credits and deductions for postsecondary
education expenses 7 10,730 10,070 14,140 14,450 14,450 14,310 14,180 14,350 14,130 13,930 13,710 137,72096 Deductibility of student-loan interest ���������������� 2,170 2,030 2,150 2,230 2,250 2,340 2,380 2,820 2,970 2,960 3,040 25,17097 Qualified tuition programs (includes Education
IRA) ������������������������������������������������������������ 2,420 2,670 2,950 3,280 3,680 4,160 5,130 6,160 7,320 8,830 10,840 55,02098 Exclusion of interest on student-loan bonds ������ 120 140 150 160 160 160 160 170 170 180 180 1,63099 Exclusion of interest on bonds for private
nonprofit educational facilities ��������������������� 1,680 1,950 2,120 2,150 2,150 2,150 2,240 2,310 2,340 2,430 2,450 22,290100 Credit for holders of zone academy bonds 8 ���� 0 0 0 0 0 0 0 0 0 0 0 0101 Exclusion of interest on savings bonds redeemed
to finance educational expenses �������������������� 30 40 40 40 40 40 50 50 50 50 50 450102 Parental personal exemption for students age
19 or over ���������������������������������������������������� 0 0 0 0 0 0 3,570 5,270 5,180 5,090 5,000 24,106103 Deductibility of charitable contributions
(education) �������������������������������������������������� 3,920 4,250 4,520 4,810 5,080 5,360 6,480 8,530 8,930 9,360 9,490 66,810104 Exclusion of employer-provided educational
assistance ��������������������������������������������������� 1,190 1,390 1,500 1,620 1,730 1,850 1,640 1,560 1,640 1,720 1,800 16,450105 Special deduction for teacher expenses ���������� 170 170 170 170 170 170 180 210 210 210 220 1,880106 Discharge of student loan indebtedness ��������� 80 80 90 100 110 120 150 170 190 220 240 1,470
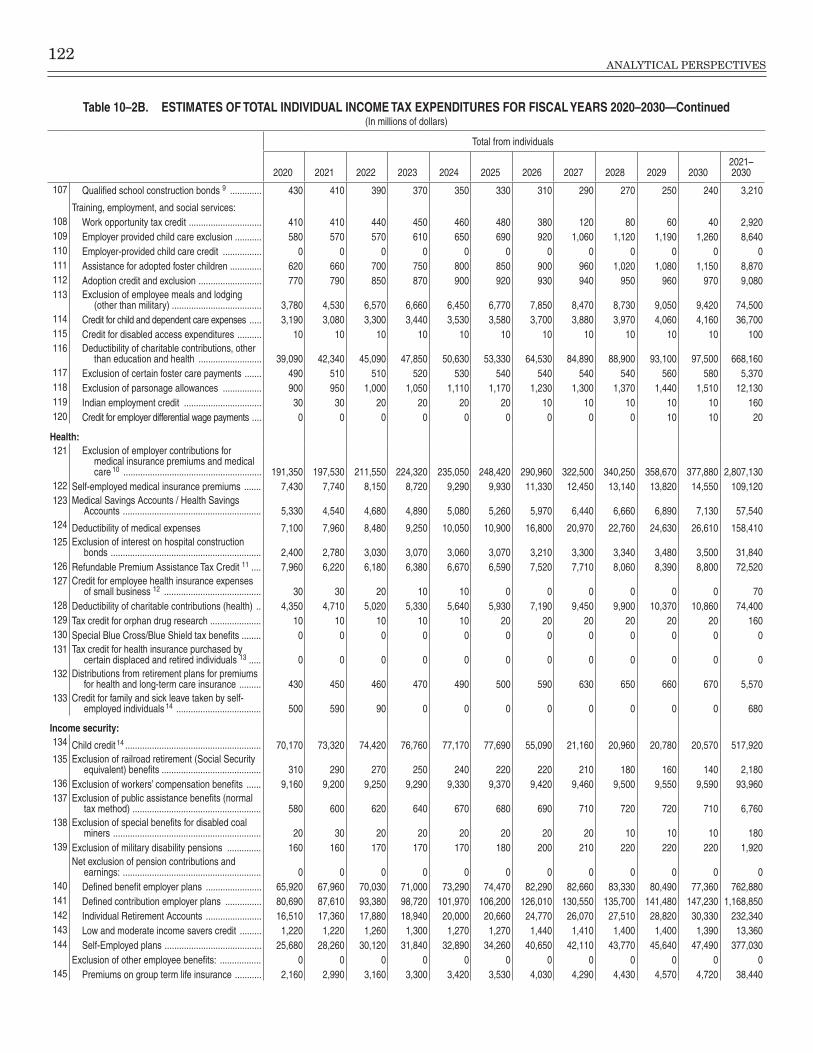
122ANALYTICAL PERSPECTIVES
Table 10–2B. ESTIMATES OF TOTAL INDIVIDUAL INCOME TAX EXPENDITURES FOR FISCAL YEARS 2020–2030—Continued(In millions of dollars)
Total from individuals
2020 2021 2022 2023 2024 2025 2026 2027 2028 2029 20302021–2030
107 Qualified school construction bonds 9 ������������� 430 410 390 370 350 330 310 290 270 250 240 3,210
Training, employment, and social services: 108 Work opportunity tax credit ������������������������������ 410 410 440 450 460 480 380 120 80 60 40 2,920109 Employer provided child care exclusion ����������� 580 570 570 610 650 690 920 1,060 1,120 1,190 1,260 8,640110 Employer-provided child care credit ���������������� 0 0 0 0 0 0 0 0 0 0 0 0111 Assistance for adopted foster children ������������� 620 660 700 750 800 850 900 960 1,020 1,080 1,150 8,870112 Adoption credit and exclusion �������������������������� 770 790 850 870 900 920 930 940 950 960 970 9,080113 Exclusion of employee meals and lodging
(other than military) ������������������������������������� 3,780 4,530 6,570 6,660 6,450 6,770 7,850 8,470 8,730 9,050 9,420 74,500114 Credit for child and dependent care expenses ����� 3,190 3,080 3,300 3,440 3,530 3,580 3,700 3,880 3,970 4,060 4,160 36,700115 Credit for disabled access expenditures ���������� 10 10 10 10 10 10 10 10 10 10 10 100116 Deductibility of charitable contributions, other
than education and health �������������������������� 39,090 42,340 45,090 47,850 50,630 53,330 64,530 84,890 88,900 93,100 97,500 668,160117 Exclusion of certain foster care payments ������� 490 510 510 520 530 540 540 540 540 560 580 5,370118 Exclusion of parsonage allowances ���������������� 900 950 1,000 1,050 1,110 1,170 1,230 1,300 1,370 1,440 1,510 12,130119 Indian employment credit �������������������������������� 30 30 20 20 20 20 10 10 10 10 10 160120 Credit for employer differential wage payments ���� 0 0 0 0 0 0 0 0 0 10 10 20
Health: 121 Exclusion of employer contributions for
medical insurance premiums and medical care 10 ��������������������������������������������������������� 191,350 197,530 211,550 224,320 235,050 248,420 290,960 322,500 340,250 358,670 377,880 2,807,130
122 Self-employed medical insurance premiums ������� 7,430 7,740 8,150 8,720 9,290 9,930 11,330 12,450 13,140 13,820 14,550 109,120123 Medical Savings Accounts / Health Savings
Accounts ��������������������������������������������������������� 5,330 4,540 4,680 4,890 5,080 5,260 5,970 6,440 6,660 6,890 7,130 57,540124 Deductibility of medical expenses 7,100 7,960 8,480 9,250 10,050 10,900 16,800 20,970 22,760 24,630 26,610 158,410125 Exclusion of interest on hospital construction
bonds �������������������������������������������������������������� 2,400 2,780 3,030 3,070 3,060 3,070 3,210 3,300 3,340 3,480 3,500 31,840126 Refundable Premium Assistance Tax Credit 11 ���� 7,960 6,220 6,180 6,380 6,670 6,590 7,520 7,710 8,060 8,390 8,800 72,520127 Credit for employee health insurance expenses
of small business 12 ���������������������������������������� 30 30 20 10 10 0 0 0 0 0 0 70128 Deductibility of charitable contributions (health) �� 4,350 4,710 5,020 5,330 5,640 5,930 7,190 9,450 9,900 10,370 10,860 74,400129 Tax credit for orphan drug research ��������������������� 10 10 10 10 10 20 20 20 20 20 20 160130 Special Blue Cross/Blue Shield tax benefits �������� 0 0 0 0 0 0 0 0 0 0 0 0131 Tax credit for health insurance purchased by
certain displaced and retired individuals 13 ����� 0 0 0 0 0 0 0 0 0 0 0 0132 Distributions from retirement plans for premiums
for health and long-term care insurance ��������� 430 450 460 470 490 500 590 630 650 660 670 5,570133 Credit for family and sick leave taken by self-
employed individuals 14 ����������������������������������� 500 590 90 0 0 0 0 0 0 0 0 680
Income security: 134 Child credit 14 �������������������������������������������������������� 70,170 73,320 74,420 76,760 77,170 77,690 55,090 21,160 20,960 20,780 20,570 517,920135 Exclusion of railroad retirement (Social Security
equivalent) benefits ����������������������������������������� 310 290 270 250 240 220 220 210 180 160 140 2,180136 Exclusion of workers’ compensation benefits ������ 9,160 9,200 9,250 9,290 9,330 9,370 9,420 9,460 9,500 9,550 9,590 93,960137 Exclusion of public assistance benefits (normal
tax method) ����������������������������������������������������� 580 600 620 640 670 680 690 710 720 720 710 6,760138 Exclusion of special benefits for disabled coal
miners ������������������������������������������������������������� 20 30 20 20 20 20 20 20 10 10 10 180139 Exclusion of military disability pensions �������������� 160 160 170 170 170 180 200 210 220 220 220 1,920
Net exclusion of pension contributions and earnings: ��������������������������������������������������������� 0 0 0 0 0 0 0 0 0 0 0 0
140 Defined benefit employer plans ����������������������� 65,920 67,960 70,030 71,000 73,290 74,470 82,290 82,660 83,330 80,490 77,360 762,880141 Defined contribution employer plans ��������������� 80,690 87,610 93,380 98,720 101,970 106,200 126,010 130,550 135,700 141,480 147,230 1,168,850142 Individual Retirement Accounts ����������������������� 16,510 17,360 17,880 18,940 20,000 20,660 24,770 26,070 27,510 28,820 30,330 232,340143 Low and moderate income savers credit ��������� 1,220 1,220 1,260 1,300 1,270 1,270 1,440 1,410 1,400 1,400 1,390 13,360144 Self-Employed plans ���������������������������������������� 25,680 28,260 30,120 31,840 32,890 34,260 40,650 42,110 43,770 45,640 47,490 377,030
Exclusion of other employee benefits: ����������������� 0 0 0 0 0 0 0 0 0 0 0 0145 Premiums on group term life insurance ����������� 2,160 2,990 3,160 3,300 3,420 3,530 4,030 4,290 4,430 4,570 4,720 38,440

10. TAX EXPENDITURES 123
Table 10–2B. ESTIMATES OF TOTAL INDIVIDUAL INCOME TAX EXPENDITURES FOR FISCAL YEARS 2020–2030—Continued(In millions of dollars)
Total from individuals
2020 2021 2022 2023 2024 2025 2026 2027 2028 2029 20302021–2030
146 Premiums on accident and disability insurance ��� 330 340 340 340 350 350 350 350 350 350 350 3,470147 Income of trusts to finance supplementary
unemployment benefits ����������������������������������� 20 10 20 20 30 30 40 50 50 60 60 370148 Income of trusts to finance voluntary employee
benefits associations �������������������������������������� 0 0 0 0 0 0 0 0 0 0 0 0149 Special ESOP rules ��������������������������������������������� 30 30 30 30 30 30 30 30 30 40 40 320150 Additional deduction for the blind ������������������������� 30 40 40 40 40 40 40 50 50 50 50 440151 Additional deduction for the elderly ��������������������� 5,680 5,810 5,950 8,390 6,630 7,150 6,060 6,540 6,960 7,320 7,830 68,640152 Deductibility of casualty losses ���������������������������� 0 0 0 0 0 0 620 960 990 1,020 1,050 4,640153 Earned income tax credit 15 ��������������������������������� 2,660 700 700 800 850 900 940 2,410 2,530 2,670 2,800 15,300154 Recovery rebate credits 16 ����������������������������������� 0 9,110 1,012 0 0 0 0 0 0 0 0 10,122
Social Security:
Exclusion of social security benefits: 155 Social Security benefits for retired and disabled
workers and spouses, dependents and survivors ��������������������������������������������������������� 27,050 27,180 27,970 30,300 31,180 31,520 35,890 41,750 43,880 46,290 48,940 364,900
156 Credit for certain employer contributions to social security ��������������������������������������������� 570 780 1,070 1,170 1,250 1,330 1,410 1,490 1,570 1,650 1,730 13,450
Veterans benefits and services: 157 Exclusion of veterans death benefits and
disability compensation ���������������������������������� 8,230 9,210 9,520 9,870 10,220 10,590 11,450 12,990 13,480 13,980 14,510 115,820158 Exclusion of veterans pensions ��������������������������� 210 220 220 220 220 220 230 250 250 260 260 2,350159 Exclusion of GI bill benefits ��������������������������������� 1,460 1,580 1,590 1,650 1,720 1,780 1,930 2,200 2,290 2,380 2,480 19,600160 Exclusion of interest on veterans housing bonds ����� 60 70 70 80 70 80 80 80 80 80 90 780
General purpose fiscal assistance: 161 Exclusion of interest on public purpose State and
local bonds ����������������������������������������������������� 21,410 24,770 26,980 27,380 27,310 27,340 28,570 29,430 29,740 30,980 31,180 283,680162 Build America Bonds 16 ��������������������������������������� 0 0 0 0 0 0 0 0 0 0 0 0163 Deductibility of nonbusiness State and local
taxes other than on owner-occupied homes 17 ��������������������������������������������������������������������� 7,060 6,890 6,990 7,140 7,330 7,520 76,740 107,610 108,740 113,500 118,550 561,020
Interest: 164 Deferral of interest on U�S� savings bonds ����������� 910 840 830 820 810 800 800 790 780 770 760 8,000
Addendum: Aid to State and local governments:
Deductibility of:
Property taxes on owner-occupied homes ������ 6,450 6,370 6,450 6,620 6,860 7,130 35,890 52,340 55,090 57,590 60,260 294,600
Nonbusiness State and local taxes other than on owner-occupied homes ������������������������� 7,060 6,890 6,990 7,140 7,330 7,520 76,740 107,610 108,740 113,500 118,550 561,020
Exclusion of interest on State and local bonds for:
Public purposes ������������������������������������������������ 21,410 24,770 26,980 27,380 27,310 27,340 28,570 29,430 29,740 30,980 31,180 283,680Energy facilities ����������������������������������������������� 0 10 10 10 10 10 10 10 10 10 10 100Water, sewage, and hazardous waste disposal
facilities ������������������������������������������������������� 240 280 300 310 310 310 320 330 330 350 350 3,190Small-issues ���������������������������������������������������� 70 80 80 80 80 80 90 90 90 100 100 870Owner-occupied mortgage subsidies �������������� 630 730 790 800 800 800 840 860 870 910 910 8,310Rental housing ������������������������������������������������� 1,060 1,220 1,330 1,350 1,350 1,350 1,410 1,450 1,470 1,530 1,540 14,000Airports, docks, and similar facilities ���������������� 630 730 800 810 810 810 850 870 880 920 920 8,400Student loans ��������������������������������������������������� 120 140 150 160 160 160 160 170 170 180 180 1,630Private nonprofit educational facilities ������������� 1,680 1,950 2,120 2,150 2,150 2,150 2,240 2,310 2,340 2,430 2,450 22,290Hospital construction ��������������������������������������� 2,400 2,780 3,030 3,070 3,060 3,070 3,210 3,300 3,340 3,480 3,500 31,840Veterans’ housing �������������������������������������������� 60 70 70 80 70 80 80 80 80 80 90 780
See Table 10–1 footnotes for specific table information
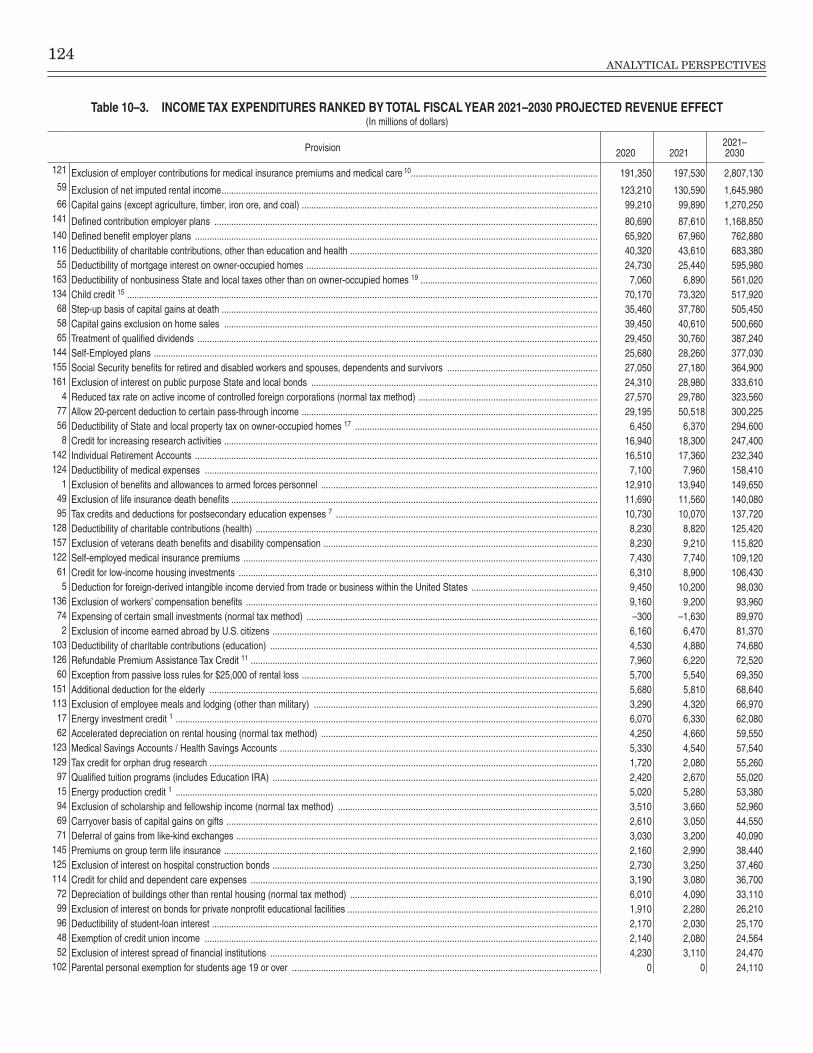
124ANALYTICAL PERSPECTIVES
Table 10–3. INCOME TAX EXPENDITURES RANKED BY TOTAL FISCAL YEAR 2021–2030 PROJECTED REVENUE EFFECT(In millions of dollars)
Provision 2020 20212021– 2030
121 Exclusion of employer contributions for medical insurance premiums and medical care 10����������������������������������������������������������������������������� 191,350 197,530 2,807,13059 Exclusion of net imputed rental income ����������������������������������������������������������������������������������������������������������������������������������������������������������� 123,210 130,590 1,645,98066 Capital gains (except agriculture, timber, iron ore, and coal) �������������������������������������������������������������������������������������������������������������������������� 99,210 99,890 1,270,250
141 Defined contribution employer plans �������������������������������������������������������������������������������������������������������������������������������������������������������������� 80,690 87,610 1,168,850140 Defined benefit employer plans ���������������������������������������������������������������������������������������������������������������������������������������������������������������������� 65,920 67,960 762,880116 Deductibility of charitable contributions, other than education and health ������������������������������������������������������������������������������������������������������ 40,320 43,610 683,380
55 Deductibility of mortgage interest on owner-occupied homes ������������������������������������������������������������������������������������������������������������������������ 24,730 25,440 595,980163 Deductibility of nonbusiness State and local taxes other than on owner-occupied homes 19 ������������������������������������������������������������������������� 7,060 6,890 561,020134 Child credit 15 �������������������������������������������������������������������������������������������������������������������������������������������������������������������������������������������������� 70,170 73,320 517,92068 Step-up basis of capital gains at death ����������������������������������������������������������������������������������������������������������������������������������������������������������� 35,460 37,780 505,45058 Capital gains exclusion on home sales ���������������������������������������������������������������������������������������������������������������������������������������������������������� 39,450 40,610 500,66065 Treatment of qualified dividends ��������������������������������������������������������������������������������������������������������������������������������������������������������������������� 29,450 30,760 387,240
144 Self-Employed plans ��������������������������������������������������������������������������������������������������������������������������������������������������������������������������������������� 25,680 28,260 377,030155 Social Security benefits for retired and disabled workers and spouses, dependents and survivors �������������������������������������������������������������� 27,050 27,180 364,900161 Exclusion of interest on public purpose State and local bonds ���������������������������������������������������������������������������������������������������������������������� 24,310 28,980 333,610
4 Reduced tax rate on active income of controlled foreign corporations (normal tax method) �������������������������������������������������������������������������� 27,570 29,780 323,56077 Allow 20-percent deduction to certain pass-through income �������������������������������������������������������������������������������������������������������������������������� 29,195 50,518 300,22556 Deductibility of State and local property tax on owner-occupied homes 17 ���������������������������������������������������������������������������������������������������� 6,450 6,370 294,600
8 Credit for increasing research activities ���������������������������������������������������������������������������������������������������������������������������������������������������������� 16,940 18,300 247,400142 Individual Retirement Accounts ���������������������������������������������������������������������������������������������������������������������������������������������������������������������� 16,510 17,360 232,340124 Deductibility of medical expenses ������������������������������������������������������������������������������������������������������������������������������������������������������������������ 7,100 7,960 158,410
1 Exclusion of benefits and allowances to armed forces personnel ������������������������������������������������������������������������������������������������������������������ 12,910 13,940 149,65049 Exclusion of life insurance death benefits ������������������������������������������������������������������������������������������������������������������������������������������������������� 11,690 11,560 140,08095 Tax credits and deductions for postsecondary education expenses 7 ������������������������������������������������������������������������������������������������������������ 10,730 10,070 137,720
128 Deductibility of charitable contributions (health) ��������������������������������������������������������������������������������������������������������������������������������������������� 8,230 8,820 125,420157 Exclusion of veterans death benefits and disability compensation ����������������������������������������������������������������������������������������������������������������� 8,230 9,210 115,820122 Self-employed medical insurance premiums �������������������������������������������������������������������������������������������������������������������������������������������������� 7,430 7,740 109,120
61 Credit for low-income housing investments ���������������������������������������������������������������������������������������������������������������������������������������������������� 6,310 8,900 106,4305 Deduction for foreign-derived intangible income dervied from trade or business within the United States ���������������������������������������������������� 9,450 10,200 98,030
136 Exclusion of workers’ compensation benefits ������������������������������������������������������������������������������������������������������������������������������������������������� 9,160 9,200 93,96074 Expensing of certain small investments (normal tax method) ������������������������������������������������������������������������������������������������������������������������ –300 –1,630 89,9702 Exclusion of income earned abroad by U�S� citizens �������������������������������������������������������������������������������������������������������������������������������������� 6,160 6,470 81,370
103 Deductibility of charitable contributions (education) ��������������������������������������������������������������������������������������������������������������������������������������� 4,530 4,880 74,680126 Refundable Premium Assistance Tax Credit 11 ����������������������������������������������������������������������������������������������������������������������������������������������� 7,960 6,220 72,52060 Exception from passive loss rules for $25,000 of rental loss �������������������������������������������������������������������������������������������������������������������������� 5,700 5,540 69,350
151 Additional deduction for the elderly ���������������������������������������������������������������������������������������������������������������������������������������������������������������� 5,680 5,810 68,640113 Exclusion of employee meals and lodging (other than military) ��������������������������������������������������������������������������������������������������������������������� 3,290 4,320 66,97017 Energy investment credit 1 ������������������������������������������������������������������������������������������������������������������������������������������������������������������������������ 6,070 6,330 62,08062 Accelerated depreciation on rental housing (normal tax method) ������������������������������������������������������������������������������������������������������������������ 4,250 4,660 59,550
123 Medical Savings Accounts / Health Savings Accounts ����������������������������������������������������������������������������������������������������������������������������������� 5,330 4,540 57,540129 Tax credit for orphan drug research ���������������������������������������������������������������������������������������������������������������������������������������������������������������� 1,720 2,080 55,26097 Qualified tuition programs (includes Education IRA) �������������������������������������������������������������������������������������������������������������������������������������� 2,420 2,670 55,02015 Energy production credit 1 ������������������������������������������������������������������������������������������������������������������������������������������������������������������������������ 5,020 5,280 53,38094 Exclusion of scholarship and fellowship income (normal tax method) ����������������������������������������������������������������������������������������������������������� 3,510 3,660 52,96069 Carryover basis of capital gains on gifts ��������������������������������������������������������������������������������������������������������������������������������������������������������� 2,610 3,050 44,55071 Deferral of gains from like-kind exchanges ����������������������������������������������������������������������������������������������������������������������������������������������������� 3,030 3,200 40,090
145 Premiums on group term life insurance ���������������������������������������������������������������������������������������������������������������������������������������������������������� 2,160 2,990 38,440125 Exclusion of interest on hospital construction bonds �������������������������������������������������������������������������������������������������������������������������������������� 2,730 3,250 37,460114 Credit for child and dependent care expenses ����������������������������������������������������������������������������������������������������������������������������������������������� 3,190 3,080 36,70072 Depreciation of buildings other than rental housing (normal tax method) ������������������������������������������������������������������������������������������������������ 6,010 4,090 33,11099 Exclusion of interest on bonds for private nonprofit educational facilities ������������������������������������������������������������������������������������������������������� 1,910 2,280 26,21096 Deductibility of student-loan interest ��������������������������������������������������������������������������������������������������������������������������������������������������������������� 2,170 2,030 25,17048 Exemption of credit union income ������������������������������������������������������������������������������������������������������������������������������������������������������������������ 2,140 2,080 24,56452 Exclusion of interest spread of financial institutions ��������������������������������������������������������������������������������������������������������������������������������������� 4,230 3,110 24,470
102 Parental personal exemption for students age 19 or over ������������������������������������������������������������������������������������������������������������������������������ 0 0 24,110

10. TAX EXPENDITURES 125
Table 10–3. INCOME TAX EXPENDITURES RANKED BY TOTAL FISCAL YEAR 2021–2030 PROJECTED REVENUE EFFECT—Continued(In millions of dollars)
Provision 2020 20212021– 2030
80 Exclusion of reimbursed employee parking expenses ������������������������������������������������������������������������������������������������������������������������������������ 1,686 1,759 22,153159 Exclusion of GI bill benefits ���������������������������������������������������������������������������������������������������������������������������������������������������������������������������� 1,460 1,580 19,60067 Capital gains exclusion of small corporation stock ����������������������������������������������������������������������������������������������������������������������������������������� 1,410 1,530 19,5406 Interest Charge Domestic International Sales Corporations (IC-DISCs) �������������������������������������������������������������������������������������������������������� 890 1,370 19,420
156 Credit for certain employer contributions to social security ���������������������������������������������������������������������������������������������������������������������������� 720 990 17,07044 Capital gains treatment of certain agriculture income ������������������������������������������������������������������������������������������������������������������������������������ 1,330 1,340 17,02057 Deferral of income from installment sales ������������������������������������������������������������������������������������������������������������������������������������������������������� 1,480 1,470 16,62054 Exclusion of interest on rental housing bonds ������������������������������������������������������������������������������������������������������������������������������������������������ 1,200 1,430 16,470
104 Exclusion of employer-provided educational assistance �������������������������������������������������������������������������������������������������������������������������������� 1,190 1,390 16,450153 Earned income tax credit 16 ���������������������������������������������������������������������������������������������������������������������������������������������������������������������������� 2,660 700 15,300148 Income of trusts to finance voluntary employee benefits associations ����������������������������������������������������������������������������������������������������������� 1,090 1,070 13,870143 Low and moderate income savers credit �������������������������������������������������������������������������������������������������������������������������������������������������������� 1,220 1,220 13,360118 Exclusion of parsonage allowances ��������������������������������������������������������������������������������������������������������������������������������������������������������������� 900 950 12,130108 Work opportunity tax credit ����������������������������������������������������������������������������������������������������������������������������������������������������������������������������� 1,650 1,690 11,82088 New markets tax credit ����������������������������������������������������������������������������������������������������������������������������������������������������������������������������������� 1,280 1,290 10,71014 Enhanced oil recovery credit �������������������������������������������������������������������������������������������������������������������������������������������������������������������������� 470 500 10,190
154 Recovery rebate credits 17 ������������������������������������������������������������������������������������������������������������������������������������������������������������������������������ 0 9,110 10,12239 Carbon oxide sequestration credit ������������������������������������������������������������������������������������������������������������������������������������������������������������������ 14 123 9,90885 Exclusion of interest for airport, dock, and similar bonds ������������������������������������������������������������������������������������������������������������������������������� 720 850 9,86053 Exclusion of interest on owner-occupied mortgage subsidy bonds ���������������������������������������������������������������������������������������������������������������� 710 850 9,76010 Excess of percentage over cost depletion, fuels �������������������������������������������������������������������������������������������������������������������������������������������� 590 600 9,230
112 Adoption credit and exclusion ������������������������������������������������������������������������������������������������������������������������������������������������������������������������� 770 790 9,08038 Tax incentives for preservation of historic structures �������������������������������������������������������������������������������������������������������������������������������������� 660 610 8,870
111 Assistance for adopted foster children ������������������������������������������������������������������������������������������������������������������������������������������������������������ 620 660 8,870109 Employer provided child care exclusion ���������������������������������������������������������������������������������������������������������������������������������������������������������� 580 570 8,640164 Deferral of interest on U�S� savings bonds ������������������������������������������������������������������������������������������������������������������������������������������������������ 910 840 8,000137 Exclusion of public assistance benefits (normal tax method) ������������������������������������������������������������������������������������������������������������������������� 580 600 6,76028 Credit for residential energy efficient property ������������������������������������������������������������������������������������������������������������������������������������������������ 2,370 2,390 6,360
132 Distributions from retirement plans for premiums for health and long-term care insurance ��������������������������������������������������������������������������� 430 450 5,570117 Exclusion of certain foster care payments ������������������������������������������������������������������������������������������������������������������������������������������������������ 490 510 5,37081 Exclusion for employer-provided transit passes ��������������������������������������������������������������������������������������������������������������������������������������������� 341 363 5,250
152 Deductibility of casualty losses ����������������������������������������������������������������������������������������������������������������������������������������������������������������������� 0 0 4,64142 Expensing of certain multiperiod production costs ����������������������������������������������������������������������������������������������������������������������������������������� 560 370 4,590
107 Qualified school construction bonds 9 ������������������������������������������������������������������������������������������������������������������������������������������������������������ 570 540 4,27035 Exclusion of interest on bonds for water, sewage, and hazardous waste facilities ����������������������������������������������������������������������������������������� 270 330 3,75051 Tax exemption of insurance income earned by tax-exempt organizations ����������������������������������������������������������������������������������������������������� 320 320 3,6009 Expensing of exploration and development costs, fuels ��������������������������������������������������������������������������������������������������������������������������������� 40 –40 3,5103 Exclusion of certain allowances for Federal employees abroad ��������������������������������������������������������������������������������������������������������������������� 270 280 3,500
146 Premiums on accident and disability insurance ���������������������������������������������������������������������������������������������������������������������������������������������� 330 340 3,47020 Tax credits for clean-fuel burning vehicles and refueling property ������������������������������������������������������������������������������������������������������������������ 570 440 3,400
130 Special Blue Cross/Blue Shield tax benefits ��������������������������������������������������������������������������������������������������������������������������������������������������� 140 190 3,270158 Exclusion of veterans pensions ���������������������������������������������������������������������������������������������������������������������������������������������������������������������� 210 220 2,350149 Special ESOP rules ���������������������������������������������������������������������������������������������������������������������������������������������������������������������������������������� 210 210 2,330135 Exclusion of railroad retirement (Social Security equivalent) benefits ������������������������������������������������������������������������������������������������������������ 310 290 2,18045 Income averaging for farmers ������������������������������������������������������������������������������������������������������������������������������������������������������������������������� 170 180 2,16041 Expensing of certain capital outlays ��������������������������������������������������������������������������������������������������������������������������������������������������������������� 80 120 2,03031 Advanced nuclear power production credit ����������������������������������������������������������������������������������������������������������������������������������������������������� 0 0 2,00026 Credit for construction of new energy efficient homes ������������������������������������������������������������������������������������������������������������������������������������ 320 370 1,940
139 Exclusion of military disability pensions ��������������������������������������������������������������������������������������������������������������������������������������������������������� 160 160 1,92098 Exclusion of interest on student-loan bonds ��������������������������������������������������������������������������������������������������������������������������������������������������� 140 160 1,910
105 Special deduction for teacher expenses ��������������������������������������������������������������������������������������������������������������������������������������������������������� 170 170 1,88036 Capital gains treatment of certain timber income ������������������������������������������������������������������������������������������������������������������������������������������� 130 130 1,70034 Excess of percentage over cost depletion, nonfuel minerals �������������������������������������������������������������������������������������������������������������������������� 110 100 1,620
106 Discharge of student loan indebtedness �������������������������������������������������������������������������������������������������������������������������������������������������������� 80 80 1,47078 Tonnage tax ���������������������������������������������������������������������������������������������������������������������������������������������������������������������������������������������������� 140 140 1,400
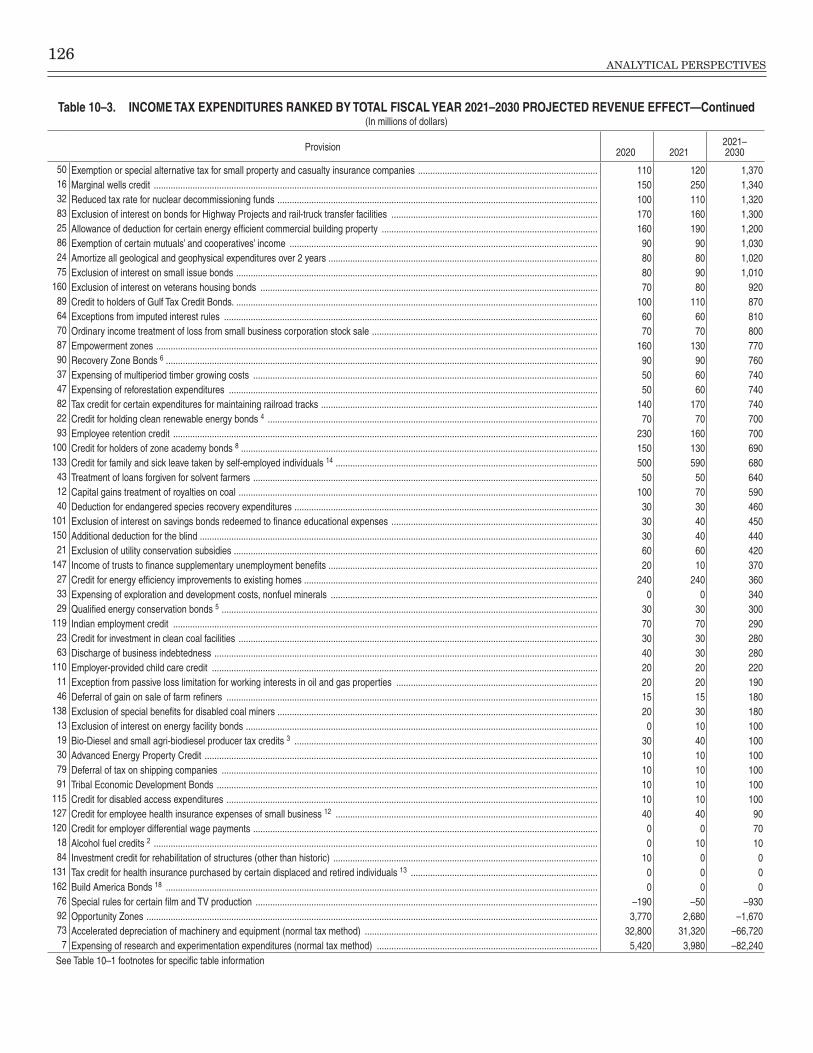
126ANALYTICAL PERSPECTIVES
Table 10–3. INCOME TAX EXPENDITURES RANKED BY TOTAL FISCAL YEAR 2021–2030 PROJECTED REVENUE EFFECT—Continued(In millions of dollars)
Provision 2020 20212021– 2030
50 Exemption or special alternative tax for small property and casualty insurance companies �������������������������������������������������������������������������� 110 120 1,37016 Marginal wells credit ��������������������������������������������������������������������������������������������������������������������������������������������������������������������������������������� 150 250 1,34032 Reduced tax rate for nuclear decommissioning funds ������������������������������������������������������������������������������������������������������������������������������������ 100 110 1,32083 Exclusion of interest on bonds for Highway Projects and rail-truck transfer facilities ������������������������������������������������������������������������������������� 170 160 1,30025 Allowance of deduction for certain energy efficient commercial building property ����������������������������������������������������������������������������������������� 160 190 1,20086 Exemption of certain mutuals’ and cooperatives’ income ������������������������������������������������������������������������������������������������������������������������������� 90 90 1,03024 Amortize all geological and geophysical expenditures over 2 years ��������������������������������������������������������������������������������������������������������������� 80 80 1,02075 Exclusion of interest on small issue bonds ����������������������������������������������������������������������������������������������������������������������������������������������������� 80 90 1,010
160 Exclusion of interest on veterans housing bonds ������������������������������������������������������������������������������������������������������������������������������������������� 70 80 92089 Credit to holders of Gulf Tax Credit Bonds� ����������������������������������������������������������������������������������������������������������������������������������������������������� 100 110 87064 Exceptions from imputed interest rules ���������������������������������������������������������������������������������������������������������������������������������������������������������� 60 60 81070 Ordinary income treatment of loss from small business corporation stock sale ��������������������������������������������������������������������������������������������� 70 70 80087 Empowerment zones �������������������������������������������������������������������������������������������������������������������������������������������������������������������������������������� 160 130 77090 Recovery Zone Bonds 6 ���������������������������������������������������������������������������������������������������������������������������������������������������������������������������������� 90 90 76037 Expensing of multiperiod timber growing costs ���������������������������������������������������������������������������������������������������������������������������������������������� 50 60 74047 Expensing of reforestation expenditures �������������������������������������������������������������������������������������������������������������������������������������������������������� 50 60 74082 Tax credit for certain expenditures for maintaining railroad tracks ������������������������������������������������������������������������������������������������������������������ 140 170 74022 Credit for holding clean renewable energy bonds 4 ���������������������������������������������������������������������������������������������������������������������������������������� 70 70 70093 Employee retention credit ������������������������������������������������������������������������������������������������������������������������������������������������������������������������������� 230 160 700
100 Credit for holders of zone academy bonds 8 ��������������������������������������������������������������������������������������������������������������������������������������������������� 150 130 690133 Credit for family and sick leave taken by self-employed individuals 14 ������������������������������������������������������������������������������������������������������������ 500 590 68043 Treatment of loans forgiven for solvent farmers ���������������������������������������������������������������������������������������������������������������������������������������������� 50 50 64012 Capital gains treatment of royalties on coal ���������������������������������������������������������������������������������������������������������������������������������������������������� 100 70 59040 Deduction for endangered species recovery expenditures ����������������������������������������������������������������������������������������������������������������������������� 30 30 460
101 Exclusion of interest on savings bonds redeemed to finance educational expenses ������������������������������������������������������������������������������������� 30 40 450150 Additional deduction for the blind �������������������������������������������������������������������������������������������������������������������������������������������������������������������� 30 40 44021 Exclusion of utility conservation subsidies ������������������������������������������������������������������������������������������������������������������������������������������������������ 60 60 420
147 Income of trusts to finance supplementary unemployment benefits ��������������������������������������������������������������������������������������������������������������� 20 10 37027 Credit for energy efficiency improvements to existing homes ������������������������������������������������������������������������������������������������������������������������� 240 240 36033 Expensing of exploration and development costs, nonfuel minerals �������������������������������������������������������������������������������������������������������������� 0 0 34029 Qualified energy conservation bonds 5 ����������������������������������������������������������������������������������������������������������������������������������������������������������� 30 30 300
119 Indian employment credit ������������������������������������������������������������������������������������������������������������������������������������������������������������������������������� 70 70 29023 Credit for investment in clean coal facilities ���������������������������������������������������������������������������������������������������������������������������������������������������� 30 30 28063 Discharge of business indebtedness �������������������������������������������������������������������������������������������������������������������������������������������������������������� 40 30 280
110 Employer-provided child care credit ��������������������������������������������������������������������������������������������������������������������������������������������������������������� 20 20 22011 Exception from passive loss limitation for working interests in oil and gas properties ����������������������������������������������������������������������������������� 20 20 19046 Deferral of gain on sale of farm refiners ��������������������������������������������������������������������������������������������������������������������������������������������������������� 15 15 180
138 Exclusion of special benefits for disabled coal miners ������������������������������������������������������������������������������������������������������������������������������������ 20 30 18013 Exclusion of interest on energy facility bonds ������������������������������������������������������������������������������������������������������������������������������������������������� 0 10 10019 Bio-Diesel and small agri-biodiesel producer tax credits 3 ����������������������������������������������������������������������������������������������������������������������������� 30 40 10030 Advanced Energy Property Credit ������������������������������������������������������������������������������������������������������������������������������������������������������������������ 10 10 10079 Deferral of tax on shipping companies ����������������������������������������������������������������������������������������������������������������������������������������������������������� 10 10 10091 Tribal Economic Development Bonds ������������������������������������������������������������������������������������������������������������������������������������������������������������� 10 10 100
115 Credit for disabled access expenditures ��������������������������������������������������������������������������������������������������������������������������������������������������������� 10 10 100127 Credit for employee health insurance expenses of small business 12 ������������������������������������������������������������������������������������������������������������ 40 40 90120 Credit for employer differential wage payments ���������������������������������������������������������������������������������������������������������������������������������������������� 0 0 7018 Alcohol fuel credits 2 ��������������������������������������������������������������������������������������������������������������������������������������������������������������������������������������� 0 10 1084 Investment credit for rehabilitation of structures (other than historic) ������������������������������������������������������������������������������������������������������������� 10 0 0
131 Tax credit for health insurance purchased by certain displaced and retired individuals 13 ����������������������������������������������������������������������������� 0 0 0162 Build America Bonds 18 ���������������������������������������������������������������������������������������������������������������������������������������������������������������������������������� 0 0 076 Special rules for certain film and TV production ��������������������������������������������������������������������������������������������������������������������������������������������� –190 –50 –93092 Opportunity Zones ������������������������������������������������������������������������������������������������������������������������������������������������������������������������������������������ 3,770 2,680 –1,67073 Accelerated depreciation of machinery and equipment (normal tax method) ������������������������������������������������������������������������������������������������ 32,800 31,320 –66,7207 Expensing of research and experimentation expenditures (normal tax method) ������������������������������������������������������������������������������������������� 5,420 3,980 –82,240
See Table 10–1 footnotes for specific table information
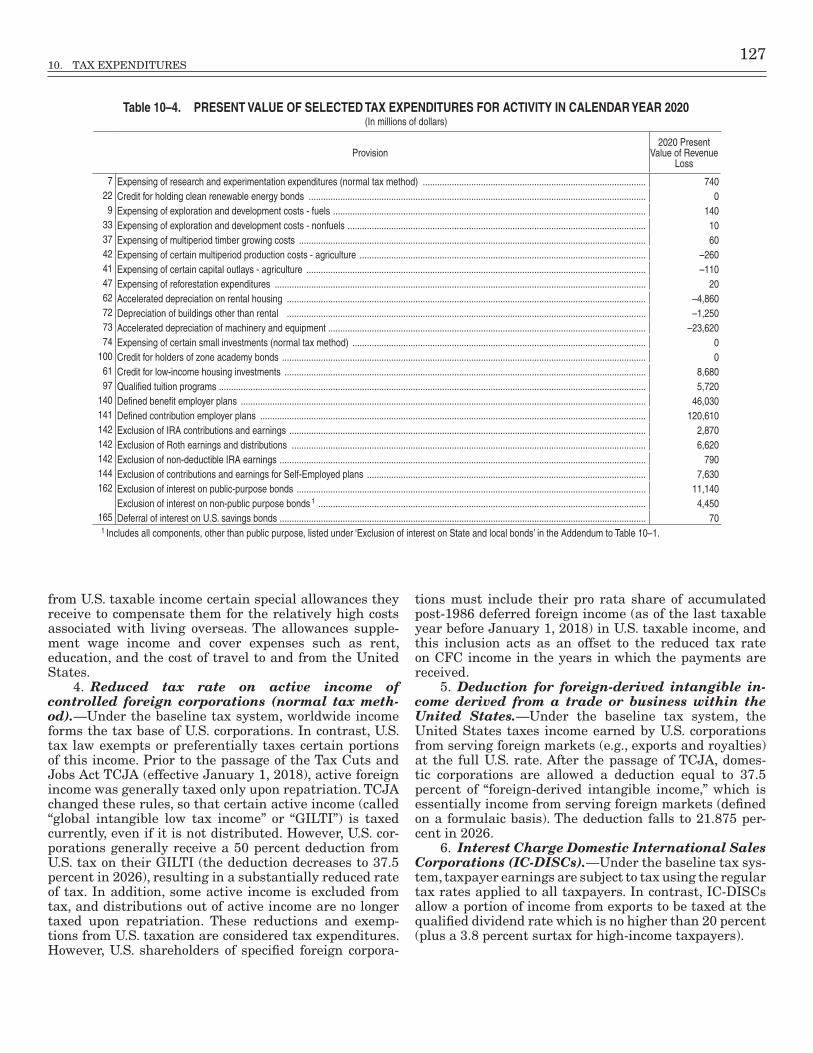
10. TAX EXPENDITURES 127
Table 10–4. PRESENT VALUE OF SELECTED TAX EXPENDITURES FOR ACTIVITY IN CALENDAR YEAR 2020(In millions of dollars)
Provision2020 Present
Value of Revenue Loss
7 Expensing of research and experimentation expenditures (normal tax method) �������������������������������������������������������������������������������������������� 74022 Credit for holding clean renewable energy bonds ������������������������������������������������������������������������������������������������������������������������������������������� 09 Expensing of exploration and development costs - fuels ��������������������������������������������������������������������������������������������������������������������������������� 140
33 Expensing of exploration and development costs - nonfuels ��������������������������������������������������������������������������������������������������������������������������� 1037 Expensing of multiperiod timber growing costs ����������������������������������������������������������������������������������������������������������������������������������������������� 6042 Expensing of certain multiperiod production costs - agriculture ���������������������������������������������������������������������������������������������������������������������� –26041 Expensing of certain capital outlays - agriculture �������������������������������������������������������������������������������������������������������������������������������������������� –11047 Expensing of reforestation expenditures ��������������������������������������������������������������������������������������������������������������������������������������������������������� 2062 Accelerated depreciation on rental housing ���������������������������������������������������������������������������������������������������������������������������������������������������� –4,86072 Depreciation of buildings other than rental ���������������������������������������������������������������������������������������������������������������������������������������������������� –1,25073 Accelerated depreciation of machinery and equipment ����������������������������������������������������������������������������������������������������������������������������������� –23,62074 Expensing of certain small investments (normal tax method) ������������������������������������������������������������������������������������������������������������������������� 0
100 Credit for holders of zone academy bonds ������������������������������������������������������������������������������������������������������������������������������������������������������ 061 Credit for low-income housing investments ����������������������������������������������������������������������������������������������������������������������������������������������������� 8,68097 Qualified tuition programs �������������������������������������������������������������������������������������������������������������������������������������������������������������������������������� 5,720
140 Defined benefit employer plans ����������������������������������������������������������������������������������������������������������������������������������������������������������������������� 46,030141 Defined contribution employer plans ��������������������������������������������������������������������������������������������������������������������������������������������������������������� 120,610142 Exclusion of IRA contributions and earnings ��������������������������������������������������������������������������������������������������������������������������������������������������� 2,870142 Exclusion of Roth earnings and distributions �������������������������������������������������������������������������������������������������������������������������������������������������� 6,620142 Exclusion of non-deductible IRA earnings ������������������������������������������������������������������������������������������������������������������������������������������������������� 790144 Exclusion of contributions and earnings for Self-Employed plans ������������������������������������������������������������������������������������������������������������������� 7,630162 Exclusion of interest on public-purpose bonds ������������������������������������������������������������������������������������������������������������������������������������������������ 11,140
Exclusion of interest on non-public purpose bonds 1 ��������������������������������������������������������������������������������������������������������������������������������������� 4,450165 Deferral of interest on U�S� savings bonds ������������������������������������������������������������������������������������������������������������������������������������������������������� 701 Includes all components, other than public purpose, listed under ‘Exclusion of interest on State and local bonds’ in the Addendum to Table 10–1�
from U.S. taxable income certain special allowances they receive to compensate them for the relatively high costs associated with living overseas. The allowances supple-ment wage income and cover expenses such as rent, education, and the cost of travel to and from the United States.
4. Reduced tax rate on active income of controlled foreign corporations (normal tax meth-od).—Under the baseline tax system, worldwide income forms the tax base of U.S. corporations. In contrast, U.S. tax law exempts or preferentially taxes certain portions of this income. Prior to the passage of the Tax Cuts and Jobs Act TCJA (effective January 1, 2018), active foreign income was generally taxed only upon repatriation. TCJA changed these rules, so that certain active income (called “global intangible low tax income” or “GILTI”) is taxed currently, even if it is not distributed. However, U.S. cor-porations generally receive a 50 percent deduction from U.S. tax on their GILTI (the deduction decreases to 37.5 percent in 2026), resulting in a substantially reduced rate of tax. In addition, some active income is excluded from tax, and distributions out of active income are no longer taxed upon repatriation. These reductions and exemp-tions from U.S. taxation are considered tax expenditures. However, U.S. shareholders of specified foreign corpora-
tions must include their pro rata share of accumulated post-1986 deferred foreign income (as of the last taxable year before January 1, 2018) in U.S. taxable income, and this inclusion acts as an offset to the reduced tax rate on CFC income in the years in which the payments are received.
5. Deduction for foreign-derived intangible in-come derived from a trade or business within the United States.—Under the baseline tax system, the United States taxes income earned by U.S. corporations from serving foreign markets (e.g., exports and royalties) at the full U.S. rate. After the passage of TCJA, domes-tic corporations are allowed a deduction equal to 37.5 percent of “foreign-derived intangible income,” which is essentially income from serving foreign markets (defined on a formulaic basis). The deduction falls to 21.875 per-cent in 2026.
6. Interest Charge Domestic International Sales Corporations (IC-DISCs).—Under the baseline tax sys-tem, taxpayer earnings are subject to tax using the regular tax rates applied to all taxpayers. In contrast, IC-DISCs allow a portion of income from exports to be taxed at the qualified dividend rate which is no higher than 20 percent (plus a 3.8 percent surtax for high-income taxpayers).

128ANALYTICAL PERSPECTIVES
General Science, Space, and Technology
7. Expensing of research and experimentation expenditures (normal tax method).—The baseline tax system allows a deduction for the cost of producing income. It requires taxpayers to capitalize the costs associated with investments over time to better match the streams of in-come and associated costs. Research and experimentation (R&E) projects can be viewed as investments because, if successful, their benefits accrue for several years. It is of-ten difficult, however, to identify whether a specific R&E project is successful and, if successful, what its expected life will be. Because of this ambiguity, the reference tax law baseline system would allow expensing of R&E ex-penditures. In contrast, under the normal tax method, the expensing of R&E expenditures is viewed as a tax expen-diture. The baseline assumed for the normal tax method is that all R&E expenditures are successful and have an expected life of five years. Current law requires R&E ex-penditures paid or incurred in taxable years beginning after December 31, 2021, to be capitalized and amortized over 5 years, while allowing R&E expenditures paid or incurred in prior taxable years to be expensed.
8. Credit for increasing research activities.—The baseline tax system would uniformly tax all returns to investments and not allow credits for particular activi-ties, investments, or industries. In contrast, the Tax Code allows an R&E credit of up to 20 percent of qualified re-search expenditures in excess of a base amount. The base amount of the credit is generally determined by multiply-ing a “fixed-base percentage” by the average amount of the company’s gross receipts for the prior four years. The taxpayer’s fixed base percentage generally is the ratio of its research expenses to gross receipts for 1984 through 1988. Taxpayers can elect the alternative simplified cred-it regime, which equals 14 percent of qualified research expenses that exceed 50 percent of the average qualified research expenses for the three preceding taxable years.
Energy
9. Expensing of exploration and development costs, fuels.—Under the baseline tax system, the costs of exploring and developing oil and gas wells and coal mines or other natural fuel deposits would be capitalized and then amortized (or depreciated) over an estimate of the economic life of the property. This insures that the net income from the well or mine is measured appropriately each year. In contrast to this treatment, current law al-lows immediate deduction, i.e., expensing, of intangible drilling costs for successful investments in domestic oil and gas wells (such as wages, the cost of using machin-ery for grading and drilling, and the cost of unsalvageable materials used in constructing wells). Current law also allows immediate deduction of eligible exploration and development costs for domestic coal mines and other natural fuel deposits. Because expensing allows recovery of costs sooner, it is more advantageous to the taxpayer than amortization. Expensing provisions for exploration expenditures apply only to properties for which a deduc-
tion for percentage depletion is allowable. For oil and gas wells, integrated oil companies may expense only 70 per-cent of intangible drilling costs and must amortize the remaining 30 percent over five years. Non-integrated oil companies may expense all such costs.
10. Excess of percentage over cost depletion, fu-els.—The baseline tax system would allow recovery of the costs of developing certain oil, gas, and mineral fuel properties using cost depletion. Cost depletion is similar in concept to depreciation, in that the costs of developing or acquiring the asset are capitalized and then gradually reduced over an estimate of the asset’s economic life, as is appropriate for measuring net income. In contrast, the Tax Code generally allows independent fuel producers and royalty owners to take percentage depletion deduc-tions rather than cost depletion on limited quantities of output. Under percentage depletion, taxpayers deduct a percentage of gross income from fossil fuel production. In certain cases the deduction is limited to a fraction of the asset’s net income. Over the life of an investment, per-centage depletion deductions can exceed the cost of the investment. Consequently, percentage depletion may pro-vide more advantageous tax treatment than would cost depletion, which limits deductions to an investment’s cost.
11. Exception from passive loss limitation for working interests in oil and gas properties.—The baseline tax system accepts current law’s general rule limiting taxpayers’ ability to deduct losses from pas-sive activities against nonpassive income (e.g., wages, interest, and dividends). Passive activities generally are defined as those in which the taxpayer does not materi-ally participate, though there are numerous additional considerations brought to bear on the determination of which activities are passive for a given taxpayer. Losses are limited in an attempt to limit tax sheltering activities. Passive losses that are unused may be carried forward and applied against future passive income. An exception from the passive loss limitation is provided for a working interest in an oil or gas property that the taxpayer holds directly or through an entity that does not limit the li-ability of the taxpayer with respect to the interest. Thus, taxpayers can deduct losses from such working interests against nonpassive income without regard to whether they materially participate in the activity.
12. Capital gains treatment of royalties on coal.—The baseline tax system generally would tax all income under the regular tax rate schedule. It would not allow preferentially low tax rates to apply to certain types or sources of income. For individuals, tax rates on regular income vary from 10 percent to 39.6 percent in the budget window (plus a 3.8 percent surtax on high income tax-payers), depending on the taxpayer’s income. In contrast, current law allows capital gains realized by individuals to be taxed at a preferentially low rate that is no higher than 20 percent (plus the 3.8 percent surtax). Certain sales of coal under royalty contracts qualify for taxation as capital gains rather than ordinary income, and so benefit from the preferentially low 20 percent maximum tax rate on capital gains.

10. TAX EXPENDITURES 129
13. Exclusion of interest on energy facility bonds.—The baseline tax system generally would tax all income under the regular tax rate schedule. It would not allow preferentially low (or zero) tax rates to apply to cer-tain types or sources of income. In contrast, the Tax Code allows interest earned on State and local bonds used to finance construction of certain energy facilities to be ex-empt from tax. These bonds are generally subject to the State private-activity-bond annual volume cap.
14. Enhanced oil recovery credit.—A credit is provided equal to 15 percent of the taxpayer’s costs for enhanced oil recovery on U.S. projects. The credit is re-duced in proportion to the ratio of the reference price of oil for the previous calendar year minus $28 (adjusted for inflation from 1990) to $6.
15. Energy production credit.—The baseline tax system would not allow credits for particular activities, investments, or industries. Instead, it generally would seek to tax uniformly all returns from investment-like activities. In contrast, the Tax Code provides a credit for certain electricity produced from wind energy, biomass, geothermal energy, solar energy, small irrigation power, municipal solid waste, or qualified hydropower and sold to an unrelated party. Wind facilities must have begun construction before January 1, 2022. Facilities that begin construction in 2017 receive 80 percent of the credit, fa-cilities that begin construction in 2018 receive 60 percent of the credit, facilities that begin construction in 2019 receive 40 percent of the credit, and facilities that begin construction in 2020-2021 receive 60 percent of the cred-it. Qualified facilities producing electricity from sources other than wind must begin construction before January 1, 2022. In addition to the electricity production credit, a ten-year income tax credit is allowed for the production of refined coal for facilities placed in service before January 1, 2012. The Tax Code also provided an income tax credit for Indian coal facilities. The Indian coal facilities credit expires on December 31, 2021.
16. Marginal wells credit.—A credit is provided for crude oil and natural gas produced from a qualified mar-ginal well. A marginal well is one that does not produce more than 1,095 barrel-of-oil equivalents per year, with this limit adjusted proportionately for the number of days the well is in production. The credit is no more than $3.00 per barrel of qualified crude oil production and $0.50 per thousand cubic feet of qualified natural gas production. The credit for natural gas is reduced in proportion to the amount by which the reference price of natural gas at the wellhead for the previous calendar year exceeds $1.67 per thousand cubic feet and is zero for a reference price that exceeds $2.00. The credit for crude oil is reduced in pro-portion to the amount by which the reference price of oil for the previous calendar year exceeds $15.00 per barrel and is zero for a reference price that exceeds $18.00. All dollar amounts are adjusted for inflation from 2004.
17. Energy investment credit.—The baseline tax system would not allow credits for particular activities, investments, or industries. Instead, it generally would seek to tax uniformly all returns from investment-like activities. However, the Tax Code provides credits for
investments in solar and geothermal energy property, qualified fuel cell power plants, stationary microturbine power plants, geothermal heat pumps, waste energy re-covery property, small wind property, offshore wind, and combined heat and power property. The credit is 30 per-cent for property that begins construction before 2020, 26 percent for property that begins construction in 2020-2022, and 22 percent for property that begins construction in 2023 and in all cases that is placed in service before January 1, 2026. The credit for offshore wind is 30 percent for facilities placed in service before January 1, 2026. A 10 percent credit is available for geothermal or qualified solar property placed in service after December 31, 2025. Owners of renewable power facilities that qualify for the energy production credit may instead elect to take an en-ergy investment credit at a rate specified by law.
18. Alcohol fuel credits.—The baseline tax system would not allow credits for particular activities, invest-ments, or industries. Instead, it generally would seek to tax uniformly all returns from investment-like activities. In contrast, the Tax Code provides an income tax credit for qualified cellulosic biofuel production which was re-named the Second generation biofuel producer credit. This provision expires on December 31, 2021.
19. Bio-diesel and small agri-biodiesel producer tax credits.—The baseline tax system would not allow credits for particular activities, investments, or indus-tries. Instead, it generally would seek to tax uniformly all returns from investment-like activities. However, the Tax Code allows an income tax credit for Bio-diesel and for Bio-diesel derived from virgin sources. In lieu of the Bio-diesel credit, the taxpayer could claim a refundable excise tax credit. In addition, small agri-biodiesel producers were eligible for a separate income tax credit for biodiesel production, and a separate credit was available for quali-fied renewable diesel fuel mixtures. This provision expires on December 31, 2022.
20. Tax credits for clean-fuel burning vehicles and refueling property.—The baseline tax system would not allow credits for particular activities, invest-ments, or industries. Instead, it generally would seek to tax uniformly all returns from investment-like activi-ties. In contrast, the Tax Code allows credits for plug-in electric-drive motor vehicles, alternative fuel vehicle refu-eling property, two-wheeled plug-in electric vehicles, and fuel cell motor vehicles. These provisions, except for the plug-in electric-drive motor vehicle credit, expired after December 31, 2017.
21. Exclusion of utility conservation subsidies.—The baseline tax system generally takes a comprehensive view of taxable income that includes a wide variety of (measurable) accretions to wealth. In certain circumstanc-es, public utilities offer rate subsidies to non-business customers who invest in energy conservation measures. These rate subsidies are equivalent to payments from the utility to its customer, and so represent accretions to wealth, income that would be taxable to the customer under the baseline tax system. In contrast, the Tax Code exempts these subsidies from the non-business custom-er’s gross income.
130ANALYTICAL PERSPECTIVES
22. Credit for holding clean renewable energy bonds.—The baseline tax system would uniformly tax all returns to investments and not allow credits for particu-lar activities, investments, or industries. In contrast, the Tax Code provides for the issuance of Clean Renewable Energy Bonds that entitle the bond holder to a Federal income tax credit in lieu of interest. As of March 2010, is-suers of the unused authorization of such bonds could opt to receive direct payment with the yield becoming fully taxable.
23. Credit for investment in clean coal facili-ties.—The baseline tax system would uniformly tax all returns to investments and not allow credits for particu-lar activities, investments, or industries. In contrast, the Tax Code provides investment tax credits for clean coal facilities producing electricity and for industrial gasifica-tion combined cycle projects.
24. Amortize all geological and geophysical ex-penditures over two years.—The baseline tax system allows taxpayers to deduct the decline in the economic value of an investment over its economic life. However, the Tax Code allows geological and geophysical expendi-tures incurred in connection with oil and gas exploration in the United States to be amortized over two years for non-integrated oil companies, a span of time that is gen-erally shorter than the economic life of the assets.
25. Allowance of deduction for certain energy ef-ficient commercial building property.—The baseline tax system would not allow deductions in lieu of normal depreciation allowances for particular investments in particular industries. Instead, it generally would seek to tax uniformly all returns from investment-like activities. In contrast, the Tax Code allows a deduction for certain energy efficient commercial building property. The basis of such property is reduced by the amount of the deduc-tion. Starting in 2021, the maximum deduction amount per square foot will be increased by a cost-of -living adjustment.
26. Credit for construction of new energy effi-cient homes.—The baseline tax system would not allow credits for particular activities, investments, or indus-tries. Instead, it generally would seek to tax uniformly all returns from investment-like activities. However, the Tax Code allowed contractors a tax credit of $2,000 for the construction of a qualified new energy-efficient home that had an annual level of heating and cooling energy consumption at least 50 percent below the an-nual consumption under the 2006 International Energy Conservation Code. The credit equaled $1,000 in the case of a new manufactured home that met a 30 percent stan-dard or requirements for EPA’s Energy Star homes. This provision expired on December 31, 2017.
27. Credit for energy efficiency improvements to existing homes.—The baseline tax system would not allow credits for particular activities, investments, or in-dustries. However, the Tax Code provided an investment tax credit for expenditures made on insulation, exterior windows, and doors that improved the energy efficiency of homes and met certain standards. The Tax Code also provided a credit for purchases of advanced main air cir-
culating fans, natural gas, propane, or oil furnaces or hot water boilers, and other qualified energy efficient prop-erty. This provision expired on December 31, 2017. But legislation enacted in 2020 allowed taxpayers to claim tax credits retroactively for three years.
28. Credit for residential energy efficient prop-erty.—The baseline tax system would uniformly tax all returns to investments and not allow credits for partic-ular activities, investments, or industries. However, the Tax Code provides a credit for the purchase of a qualified photovoltaic property and solar water heating property, as well as for fuel cell power plants, geothermal heat pumps, and small wind property used in or placed on a residence. The credit is 30 percent for property placed in service be-fore January 1, 2020, 26 percent for property placed in service in 2020- 2022, and 22 percent for property placed in service in 2023.
29. Credit for qualified energy conservation bonds.—The baseline tax system would uniformly tax all returns to investments and not allow credits for par-ticular activities, investments, or industries. However, the Tax Code provides for the issuance of energy conser-vation bonds which entitle the bond holder to a Federal income tax credit in lieu of interest. As of March 2010, is-suers of the unused authorization of such bonds could opt to receive direct payment with the yield becoming fully taxable.
30. Advanced energy property credit.—The base-line tax system would not allow credits for particular activities, investments, or industries. However, the Tax Code provides a 30 percent investment credit for prop-erty used in a qualified advanced energy manufacturing project. The Treasury Department may award up to $2.3 billion in tax credits for qualified investments.
31. Advanced nuclear power facilities produc-tion credit.—The baseline tax system would not allow credits or deductions for particular activities, invest-ments, or industries. Instead, it generally would seek to tax uniformly all returns from investment-like activities. In contrast, the Tax Code allows a tax credit equal to 1.8 cents times the number of kilowatt hours of electricity produced at a qualifying advanced nuclear power facil-ity. A taxpayer may claim no more than $125 million per 1,000 megawatts of capacity. The Treasury Department may allocate up to 6,000 megawatts of credit-eligible ca-pacity. Any unutilized national capacity limitation shall be allocated after December 31, 2020, according to priori-tization rules set forth by statute.
32. Reduced tax rate for nuclear decommission-ing funds.—The baseline tax system would uniformly tax all returns to investments and not allow special rates for particular activities, investments, or industries. In contrast, the Tax Code provides a special 20 percent tax rate for investments made by Nuclear Decommissioning Reserve Funds.
Natural Resources and Environment
33. Expensing of exploration and development costs, nonfuel minerals.—The baseline tax system
10. TAX EXPENDITURES 131
allows the taxpayer to deduct the depreciation of an as-set according to the decline in its economic value over time. However, certain capital outlays associated with exploration and development of nonfuel minerals may be expensed rather than depreciated over the life of the asset.
34. Excess of percentage over cost depletion, nonfuel minerals.—The baseline tax system allows the taxpayer to deduct the decline in the economic value of an investment over time. Under current law, however, most nonfuel mineral extractors may use percentage de-pletion (whereby the deduction is fixed as a percentage of receipts) rather than cost depletion, with percentage depletion rates ranging from 22 percent for sulfur to 5 percent for sand and gravel. Over the life of an invest-ment, percentage depletion deductions can exceed the cost of the investment. Consequently, percentage deple-tion may provide more advantageous tax treatment than would cost depletion, which limits deductions to an in-vestment’s cost.
35. Exclusion of interest on bonds for water, sew-age, and hazardous waste facilities.—The baseline tax system generally would tax all income under the regu-lar tax rate schedule. It would not allow preferentially low (or zero) tax rates to apply to certain types or sources of income. In contrast, the Tax Code allows interest earned on State and local bonds used to finance construction of sewage, water, or hazardous waste facilities to be exempt from tax. These bonds are generally subject to the State private-activity bond annual volume cap.
36. Capital gains treatment of certain timber.—The baseline tax system generally would tax all income under the regular tax rate schedule. It would not allow preferentially low tax rates to apply to certain types or sources of income. However, under current law certain timber sales can be treated as a capital gain rather than ordinary income and therefore subject to the lower cap-ital-gains tax rate. For individuals, tax rates on regular income vary from 10 percent to 39.6 percent in the budget window (plus a 3.8 percent surtax on high income tax-payers), depending on the taxpayer’s income. In contrast, current law allows capital gains to be taxed at a preferen-tially low rate that is no higher than 20 percent (plus the 3.8 percent surtax).
37. Expensing of multi-period timber growing costs.—The baseline tax system requires the taxpayer to capitalize costs associated with investment property. However, most of the production costs of growing timber may be expensed under current law rather than capi-talized and deducted when the timber is sold, thereby accelerating cost recovery.
38. Tax incentives for preservation of historic structures.—The baseline tax system would not allow credits for particular activities, investments, or indus-tries. However, expenditures to preserve and restore certified historic structures qualify for an investment tax credit of 20 percent for certified rehabilitation activities. The taxpayer’s recoverable basis must be reduced by the amount of the credit. The credit must be claimed ratably
over the five years after the property is placed in service, for property placed in service after December 31, 2017.
39. Carbon oxide sequestration credit.—The baseline tax system would uniformly tax all returns to investments and not allow credits for particular activi-ties, investments, or industries. In contrast, the Tax Code allows a credit for qualified carbon oxide captured at a qualified facility and disposed of in secure geological stor-age. In addition, the provision allows a credit for qualified carbon oxide that is captured at a qualified facility and used as a tertiary injectant in a qualified enhanced oil or natural gas recovery project. The credit differs accord-ing to whether the carbon was captured using equipment which was originally placed in service before February 9, 2018, or thereafter.
40. Deduction for endangered species recovery expenditures.—The baseline tax system would not allow deductions in addition to normal depreciation allowanc-es for particular investments in particular industries. Instead, it generally would seek to tax uniformly all re-turns from investment-like activities. In contrast, under current law farmers can deduct up to 25 percent of their gross income for expenses incurred as a result of site and habitat improvement activities that will benefit endan-gered species on their farm land, in accordance with site specific management actions included in species recovery plans approved pursuant to the Endangered Species Act of 1973.
Agriculture
41. Expensing of certain capital outlays.—The baseline tax system requires the taxpayer to capital-ize costs associated with investment property. However, farmers may expense certain expenditures for feed and fertilizer, for soil and water conservation measures, and certain other capital improvements under current law.
42. Expensing of certain multiperiod production costs.—The baseline tax system requires the taxpayer to capitalize costs associated with an investment over time. However, the production of livestock and crops with a production period greater than two years is exempt from the uniform cost capitalization rules (e.g., for costs for es-tablishing orchards or structure improvements), thereby accelerating cost recovery.
43. Treatment of loans forgiven for solvent farm-ers.—Because loan forgiveness increases a debtors net worth the baseline tax system requires debtors to include the amount of loan forgiveness as income or else reduce their recoverable basis in the property related to the loan. If the amount of forgiveness exceeds the basis, the excess forgiveness is taxable if the taxpayer is not insolvent. For bankrupt debtors, the amount of loan forgiveness reduces carryover losses, unused credits, and then basis, with the remainder of the forgiven debt excluded from taxation. Qualified farm debt that is forgiven, however, is excluded from income even when the taxpayer is solvent.
44. Capital gains treatment of certain agri-culture income.—For individuals, tax rates on regular income vary from 10 percent to 39.6 percent in the budget
132ANALYTICAL PERSPECTIVES
window (plus a 3.8 percent surtax on high income taxpay-ers), depending on the taxpayer’s income. The baseline tax system generally would tax all income under the regular tax rate schedule. It would not allow preferentially low tax rates to apply to certain types or sources of income. In contrast, current law allows capital gains to be taxed at a preferentially low rate that is no higher than 20 percent (plus the 3.8 percent surtax). Certain agricultural income, such as unharvested crops, qualify for taxation as capital gains rather than ordinary income, and so benefit from the preferentially low 20 percent maximum tax rate on capital gains.
45. Income averaging for farmers.—The baseline tax system generally taxes all earned income each year at the rate determined by the income tax. However, taxpay-ers may average their taxable income from farming and fishing over the previous three years.
46. Deferral of gain on sales of farm refiners.—The baseline tax system generally subjects capital gains to taxes the year that they are realized. However, the Tax Code allows a taxpayer who sells stock in a farm refiner to a farmers’ cooperative to defer recognition of the gain if the proceeds are re-invested in a qualified replacement property.
47. Expensing of reforestation expenditures.—The baseline tax system requires the taxpayer to capitalize costs associated with an investment over time. In con-trast, the Tax Code provides for the expensing of the first $10,000 in reforestation expenditures with 7-year amorti-zation of the remaining expenses.
Commerce and Housing
This category includes a number of tax expenditure provisions that also affect economic activity in other functional categories. For example, provisions related to investment, such as accelerated depreciation, could be classified under the energy, natural resources and envi-ronment, agriculture, or transportation categories.
48. Exemption of credit union income.—Under the baseline tax system, corporations pay taxes on their profits under the regular tax rate schedule. However, in the Tax Code the earnings of credit unions not distributed to members as interest or dividends are exempt from the income tax.
49. Exclusion of life insurance death bene-fits.—Under the baseline tax system, individuals and corporations would pay taxes on their income when it is (actually or constructively) received or accrued. Nevertheless, current law generally excludes from tax amounts received under life insurance contracts if such amounts are paid by reason of the death of the insured.
50. Exclusion or special alternative tax for small property and casualty insurance companies.—The baseline tax system would require corporations to pay taxes on their profits under the regular tax rate sched-ule. It would not allow preferentially low (or zero) tax rates to apply to certain types or sources of income. Under current law, however, stock non-life insurance compa-
nies are generally exempt from tax if their gross receipts for the taxable year do not exceed $600,000 and more than 50 percent of such gross receipts consist of premi-ums. Mutual non-life insurance companies are generally tax-exempt if their annual gross receipts do not exceed $150,000 and more than 35 percent of gross receipts consist of premiums. Also, non-life insurance companies with no more than a specified level of annual net written premiums generally may elect to pay tax only on their taxable investment income provided certain ownership diversification requirements are met. The underwriting income (premiums, less insurance losses and expenses) of electing companies is excluded from tax. The specified premium limit is indexed for inflation; for 2021, the pre-mium limit is $2.4 million.
51. Tax exemption of insurance income earned by tax-exempt organizations.—Under the baseline tax system, corporations pay taxes on their profits under the regular tax rate schedule. The baseline tax system would not allow preferentially low (or zero) tax rates to apply to certain types or sources of income. Generally the income generated by life and property and casualty insurance companies is subject to tax, albeit under special rules. However, income from insurance operations conducted by certain tax-exempt organizations, such as fraternal soci-eties, voluntary employee benefit associations, and others are exempt from tax.
52. Exclusion of interest spread of financial in-stitutions.—The baseline tax system generally would tax all income under the regular tax rate schedule. It would not allow preferentially low (or zero) tax rates to apply to certain types or sources of income. Consumers pay for some deposit-linked services, such as check cashing, by accepting a below-market interest rate on their demand deposits. If they received a market rate of interest on those deposits and paid explicit fees for the associated services, they would pay taxes on the full market rate and (unlike businesses) could not deduct the fees. The Government thus foregoes tax on the difference between the risk-free market interest rate and below-market interest rates on demand deposits, which under competitive conditions should equal the value of deposit services.
53. Exclusion of interest on owner-occupied mortgage subsidy bonds.—The baseline tax system generally would tax all income under the regular tax rate schedule. It would not allow preferentially low (or zero) tax rates to apply to certain types or sources of income. In contrast, the Tax Code allows interest earned on State and local bonds used to finance homes purchased by first-time, low-to-moderate-income buyers to be exempt from tax. These bonds are generally subject to the State pri-vate-activity-bond annual volume cap.
54. Exclusion of interest on rental housing bonds.—The baseline tax system generally would tax all income under the regular tax rate schedule. It would not allow preferentially low (or zero) tax rates to apply to certain types or sources of income. In contrast, the Tax Code allows interest earned on State and local govern-ment bonds used to finance multifamily rental housing projects to be tax-exempt.

10. TAX EXPENDITURES 133
55. Mortgage interest expense on owner-oc-cupied residences.—Under the baseline tax system, expenses incurred in earning income would be deductible. However, such expenses would not be deductible when the income or the return on an investment is not taxed. In con-trast, the Tax Code allows an exclusion from a taxpayer’s taxable income for the value of owner-occupied housing services and also allows the owner-occupant to deduct mortgage interest paid on his or her primary residence and one secondary residence as an itemized non-business deduction. In general, the mortgage interest deduction is limited to interest on debt no greater than the owner’s ba-sis in the residence, and is also limited to interest on debt of no more than $1 million. Interest on up to $100,000 of other debt secured by a lien on a principal or second residence is also deductible, irrespective of the purpose of borrowing, provided the total debt does not exceed the fair market value of the residence. As an alternative to the de-duction, holders of qualified Mortgage Credit Certificates issued by State or local governmental units or agencies may claim a tax credit equal to a proportion of their inter-est expense. In the case of taxable years beginning after December 31, 2017, and before January 1, 2026, (1) the $1 million limit is reduced to $750,000 for indebtedness incurred after December 15, 2017, and (2) the deduction for interest on home equity indebtedness is disallowed.
56. Deductibility of State and local property tax on owner-occupied homes.—Under the baseline tax system, expenses incurred in earning income would be de-ductible. However, such expenses would not be deductible when the income or the return on an investment is not taxed. In contrast, the Tax Code allows an exclusion from a taxpayer’s taxable income for the value of owner-occu-pied housing services and also allows the owner-occupant to deduct property taxes paid on real property. In the case of taxable years beginning after December 31, 2017, and before January 1, 2026, (1) the deduction for foreign real property taxes paid is disallowed and (2) the deduction for taxes paid in any taxable year, which includes the de-duction for property taxes on real property, is limited to $10,000 ($5,000 in the case of a married individual filing a separate return).
57. Deferral of income from installment sales.—The baseline tax system generally would tax all income under the regular tax rate schedule. It would not allow preferentially low (or zero) tax rates, or deferral of tax, to apply to certain types or sources of income. Dealers in real and personal property (i.e., sellers who regularly hold property for sale or resale) cannot defer taxable in-come from installment sales until the receipt of the loan repayment. Nondealers (i.e., sellers of real property used in their business) are required to pay interest on deferred taxes attributable to their total installment obligations in excess of $5 million. Only properties with sales prices ex-ceeding $150,000 are includable in the total. The payment of a market rate of interest eliminates the benefit of the tax deferral. The tax exemption for nondealers with total installment obligations of less than $5 million is, there-fore, a tax expenditure.
58. Capital gains exclusion on home sales.—The baseline tax system would not allow deductions and ex-emptions for certain types of income. In contrast, the Tax Code allows homeowners to exclude from gross income up to $250,000 ($500,000 in the case of a married couple fil-ing a joint return) of the capital gains from the sale of a principal residence. To qualify, the taxpayer must have owned and used the property as the taxpayer’s principal residence for a total of at least two of the five years pre-ceding the date of sale. In addition, the exclusion may not be used more than once every two years.
59. Exclusion of net imputed rental income.—Under the baseline tax system, the taxable income of a taxpayer who is an owner-occupant would include the implicit value of gross rental income on housing services earned on the investment in owner-occupied housing and would allow a deduction for expenses, such as interest, depreciation, property taxes, and other costs, associated with earning such rental income. In contrast, the Tax Code allows an exclusion from taxable income for the im-plicit gross rental income on housing services, while in certain circumstances allows a deduction for some costs associated with such income, such as for mortgage inter-est and property taxes.
60. Exception from passive loss rules for $25,000 of rental loss.—The baseline tax system accepts current law’s general rule limiting taxpayers’ ability to deduct losses from passive activities against nonpassive income (e.g., wages, interest, and dividends). Passive activities generally are defined as those in which the taxpayer does not materially participate, and there are numerous additional considerations brought to bear on the determi-nation of which activities are passive for a given taxpayer. Losses are limited in an attempt to limit tax sheltering activities. Passive losses that are unused may be carried forward and applied against future passive income. In contrast to the general restrictions on passive losses, the Tax Code exempts certain owners of rental real estate ac-tivities from “passive income” limitations. The exemption is limited to $25,000 in losses and phases out for taxpay-ers with income between $100,000 and $150,000.
61. Credit for low-income housing invest-ments.—The baseline tax system would uniformly tax all returns to investments and not allow credits for particu-lar activities, investments, or industries. However, under current law taxpayers who invest in certain low-income housing are eligible for a tax credit. The credit rate is set so that the present value of the credit is equal to at least 70 percent of the building’s qualified basis for new con-struction and 30 percent for (1) housing receiving other Federal benefits (such as tax-exempt bond financing) or (2) substantially rehabilitated existing housing. The cred-it can exceed these levels in certain statutorily defined and State designated areas where project development costs are higher. The credit is allowed in equal amounts over 10 years and is generally subject to a volume cap.
62. Accelerated depreciation on rental housing (normal tax method).—Under a comprehensive eco-nomic income tax, the costs of acquiring a building are capitalized and depreciated over time in accordance with

134ANALYTICAL PERSPECTIVES
the decline in the property’s economic value due to wear and tear or obsolescence. This insures that the net income from the rental property is measured appropriately each year. Current law allows depreciation that is accelerated relative to economic depreciation. However, the deprecia-tion provisions of the Tax Code are part of the reference tax law, and thus do not give rise to tax expenditures under reference tax law. Under normal tax baseline, in contrast, depreciation allowances reflect estimates of eco-nomic depreciation.
63. Discharge of business indebtedness.—Under the baseline tax system, all income would generally be taxed under the regular tax rate schedule. The baseline tax system would not allow preferentially low (or zero) tax rates to apply to certain types or sources of income. In contrast, the Tax Code allows an exclusion from a tax-payer’s taxable income for any discharge of qualified real property business indebtedness by taxpayers other than a C corporation. If the canceled debt is not reported as current income, however, the basis of the underlying prop-erty must be reduced by the amount canceled.
64. Exceptions from imputed interest rules.—Under the baseline tax system, holders (issuers) of debt instruments are generally required to report interest earned (paid) in the period it accrues, not when received. In addition, the amount of interest accrued is determined by the actual price paid, not by the stated principal and interest stipulated in the instrument. But under current law, any debt associated with the sale of property worth less than $250,000 is exempted from the general interest accounting rules. This general $250,000 exception is not a tax expenditure under reference tax law but is under normal tax baseline. Current law also includes exceptions for certain property worth more than $250,000. These are tax expenditure under reference tax law and normal tax baselines. These exceptions include, sales of personal resi-dences worth more than $250,000, and sales of farms and small businesses worth between $250,000 and $1 million.
65. Treatment of qualified dividends.—The base-line tax system generally would tax all income under the regular tax rate schedule. It would not allow preferen-tially low tax rates to apply to certain types or sources of income. For individuals, tax rates on regular income vary from 10 percent to 39.6 percent in the budget win-dow (plus a 3.8 percent surtax on high income taxpayers), depending on the taxpayer’s income. In contrast, under current law, qualified dividends are taxed at a preferen-tially low rate that is no higher than 20 percent (plus the 3.8 percent surtax).
66. Capital gains (except agriculture, timber, iron ore, and coal).—The baseline tax system generally would tax all income under the regular tax rate schedule. It would not allow preferentially low tax rates to apply to certain types or sources of income. For individuals, tax rates on regular income vary from 10 percent to 39.6 percent in the budget window (plus a 3.8 percent surtax on high income taxpayers), depending on the taxpayer’s income. In contrast, under current law, capital gains on assets held for more than one year are taxed at a prefer-
entially low rate that is no higher than 20 percent (plus the 3.8 percent surtax).
67. Capital gains exclusion of small corporation stock.—The baseline tax system would not allow deduc-tions and exemptions or provide preferential treatment of certain sources of income or types of activities. In con-trast, the Tax Code provided an exclusion of 50 percent, applied to ordinary rates with a maximum of a 28 percent tax rate, for capital gains from qualified small business stock held by individuals for more than 5 years; 75 per-cent for stock issued after February 17, 2009 and before September 28, 2010; and 100 percent for stock issued af-ter September 27, 2010. A qualified small business is a corporation whose gross assets do not exceed $50 million as of the date of issuance of the stock.
68. Step-up basis of capital gains at death.—Under the baseline tax system, unrealized capital gains would be taxed when assets are transferred at death. It would not allow for exempting gains upon transfer of the underlying assets to the heirs. In contrast, capital gains on assets held at the owner’s death are not subject to capital gains tax under current law. The cost basis of the appreci-ated assets is adjusted to the market value at the owner’s date of death which becomes the basis for the heirs.
69. Carryover basis of capital gains on gifts.—Under the baseline tax system, unrealized capital gains would be taxed when assets are transferred by gift. In contrast, when a gift of appreciated asset is made under current law, the donor’s basis in the transferred property (the cost that was incurred when the transferred property was first acquired) carries over to the donee. The carry-over of the donor’s basis allows a continued deferral of unrealized capital gains.
70. Ordinary income treatment of loss from small business corporation stock sale.—The baseline tax system limits to $3,000 the write-off of losses from capital assets, with carryover of the excess to future years. In contrast, the Tax Code allows up to $100,000 in losses from the sale of small business corporate stock (capital-ization less than $1 million) to be treated as ordinary losses and fully deducted.
71. Deferral of capital gains from like-kind ex-changes.—The baseline tax system generally would tax all income under the regular tax rate schedule. It would not allow preferentially low (or zero) tax rates, or deferral of tax, to apply to certain types or sources of income. In contrast, current law allows the deferral of accrued gains on assets transferred in qualified like-kind exchanges.
72. Depreciation of buildings other than rental housing (normal tax method).—Under a comprehen-sive economic income tax, the costs of acquiring a building are capitalized and depreciated over time in accordance with the decline in the property’s economic value due to wear and tear or obsolescence. This insures that the net income from the property is measured appropriately each year. Current law allows depreciation deductions that dif-fer from those under economic depreciation. However, the depreciation provisions of the Tax Code are part of the reference tax law, and thus do not give rise to tax expendi-tures under reference tax law. Under normal tax baseline,
10. TAX EXPENDITURES 135
in contrast, depreciation allowances reflect estimates of economic depreciation.
73. Accelerated depreciation of machinery and equipment (normal tax method).—Under a com-prehensive economic income tax, the costs of acquiring machinery and equipment are capitalized and depre-ciated over time in accordance with the decline in the property’s economic value due to wear and tear or obsoles-cence. This insures that the net income from the property is measured appropriately each year. Current law allows depreciation deductions that are accelerated relative to economic depreciation. In particular, through 2022, 100 percent of the purchase cost of qualified property is eli-gible to be expensed immediately; this percentage phases out to zero through 2027. The depreciation provisions of the Tax Code are part of the reference tax law, and thus do not give rise to tax expenditures under reference tax law. Under the normal tax baseline, in contrast, depreciation allowances reflect estimates of economic depreciation.
74. Expensing of certain small investments (normal tax method).—Under the reference tax law baseline, the costs of acquiring tangible property and com-puter software would be depreciated using the Tax Code’s depreciation provisions. Under the normal tax baseline, depreciation allowances are estimates of economic depre-ciation. However, subject to investment limitations, the Tax Code allows up to $1 million (indexed for inflation) in qualifying investments in tangible property and certain computer software to be expensed rather than depreci-ated over time.
75. Exclusion of interest on small issue bonds.—The baseline tax system generally would tax all income under the regular tax rate schedule. It would not allow preferentially low (or zero) tax rates to apply to certain types or sources of income. In contrast, the Tax Code allows interest earned on small issue industrial develop-ment bonds (IDBs) issued by State and local governments to finance manufacturing facilities to be tax exempt. Depreciable property financed with small issue IDBs must be depreciated, however, using the straight-line method. The annual volume of small issue IDBs is subject to the unified volume cap discussed in the mortgage hous-ing bond section above.
76. Special rules for certain film and TV pro-duction.—The baseline tax system generally would tax all income under the regular tax rate schedule. It would not allow deductions and exemptions or preferentially low (or zero) tax rates to apply to certain types or sources of income. In contrast, the Tax Code allowed taxpayers to deduct up to $15 million per production ($20 million in certain distressed areas) in non-capital expenditures incurred during the year. This provision is scheduled to expire at the end of 2025.
77. Allow 20-percent deduction to certain pass-through income.—The baseline tax system generally would tax all income under the regular tax rate schedule. It would not allow deductions and exemptions or prefer-entially low (or zero) tax rates to apply to certain types or sources of income. In contrast, for tax years 2018 to 2025, the Tax Code allows for a deduction equal to up to 20
percent of income attributable to domestic pass-through businesses, subject to certain limitations.
Transportation
78. Tonnage tax.—The baseline tax system general-ly would tax all profits and income under the regular tax rate schedule. U.S. shipping companies may choose to be subject to a tonnage tax based on gross shipping weight in lieu of an income tax, in which case profits would not be subject to tax under the regular tax rate schedule.
79. Deferral of tax on shipping companies.—The baseline tax system generally would tax all profits and income under the regular tax rate schedule. It would not allow preferentially low (or zero) tax rates to apply to cer-tain types or sources of income. In contrast, the Tax Code allows certain companies that operate U.S. flag vessels to defer income taxes on that portion of their income used for shipping purposes (e.g., primarily construction, mod-ernization and major repairs to ships, and repayment of loans to finance these investments).
80. Exclusion of reimbursed employee parking expenses.—Under the baseline tax system, all compensa-tion, including dedicated payments and in-kind benefits, would be included in taxable income. Dedicated payments and in-kind benefits represent accretions to wealth that do not differ materially from cash wages. In contrast, the Tax Code allows an exclusion from taxable income for em-ployee parking expenses that are paid for by the employer or that are received by the employee in lieu of wages. In 2021, the maximum amount of the parking exclusion is $270 per month. The tax expenditure estimate does not include any subsidy provided through employer-owned parking facilities. However, beginning in 2018, parking expenses are no longer deductible to employers (except government).
81. Exclusion for employer-provided transit passes.—Under the baseline tax system, all compensa-tion, including dedicated payments and in-kind benefits, would be included in taxable income. Dedicated payments and in-kind benefits represent accretions to wealth that do not differ materially from cash wages. In contrast, the Tax Code allows an exclusion from a taxpayer’s taxable income for passes, tokens, fare cards, and vanpool expens-es that are paid for by an employer or that are received by the employee in lieu of wages to defray an employee’s commuting costs. Due to a parity to parking provision, the maximum amount of the transit exclusion is $270 per month in 2021. However, beginning in 2018, transit expenses are no longer deductible to employers (except government).
82. Tax credit for certain expenditures for main-taining railroad tracks.—The baseline tax system would not allow credits for particular activities, invest-ments, or industries. However, the Tax Code allowed eligible taxpayers to claim a credit equal to the lesser of 50 percent of maintenance expenditures and the product of $3,500 and the number of miles of railroad track owned or leased. This provision applies to maintenance expendi-tures in taxable years beginning before January 1, 2017.

136ANALYTICAL PERSPECTIVES
83. Exclusion of interest on bonds for Highway Projects and rail-truck transfer facilities.—The baseline tax system generally would tax all income under the regular tax rate schedule. It would not allow prefer-entially low (or zero) tax rates to apply to certain types or sources of income. In contrast, the Tax Code provides for $15 billion of tax-exempt bond authority to finance quali-fied highway or surface freight transfer facilities.
Community and Regional Development
84. Investment credit for rehabilitation of struc-tures (other than historic).—The baseline tax system would uniformly tax all returns to investments and not allow credits for particular activities, investments, or industries. Under prior law, the Tax Code allowed a 10 percent investment tax credit for the rehabilitation of buildings that are used for business or productive ac-tivities and that were erected before 1936 for other than residential purposes. The taxpayer’s recoverable basis must be reduced by the amount of the credit. The credit is repealed for rehabilitation expenditures incurred after December 31, 2017.
85. Exclusion of interest for airport, dock, and similar bonds.—The baseline tax system generally would tax all income under the regular tax rate schedule. It would not allow preferentially low (or zero) tax rates to apply to certain types or sources of income. In con-trast, the Tax Code allows interest earned on State and local bonds issued to finance high-speed rail facilities and Government-owned airports, docks, wharves, and sport and convention facilities to be tax-exempt. These bonds are not subject to a volume cap.
86. Exemption of certain mutuals’ and coop-eratives’ income.—Under the baseline tax system, corporations pay taxes on their profits under the regu-lar tax rate schedule. In contrast, the Tax Code provides for the incomes of mutual and cooperative telephone and electric companies to be exempt from tax if at least 85 percent of their receipts are derived from patron service charges.
87. Empowerment zones.—The baseline tax sys-tem generally would tax all income under the regular tax rate schedule. It would not allow preferentially low tax rates to apply to certain types or sources of income, tax credits, and write-offs faster than economic depreciation. In contrast, the Tax Code allows qualifying businesses in designated economically depressed areas to receive tax benefits such as an employment credit and special tax-exempt financing. A taxpayer’s ability to accrue new tax benefits for empowerment zones expires on December 31, 2025.
88. New markets tax credit.—The baseline tax system would not allow credits for particular activities, investments, or industries. However, the Tax Code allows taxpayers who make qualified equity investments in a community development entity (CDE), which then make qualified investments in low-income communities, to be eligible for a tax credit that is received over 7 years. The total equity investment available for the credit across all
CDEs is generally $5 billion for each calendar year 2020 through 2025, the last year for which credit allocations are authorized.
89. Credit to holders of Gulf and Midwest Tax Credit Bonds.—The baseline tax system would not allow credits for particular activities, investments, or indus-tries. Instead, under current law taxpayers that own Gulf and Midwest Tax Credit bonds receive a non-refundable tax credit rather than interest. The credit is included in gross income.
90. Recovery Zone Bonds.—The baseline tax sys-tem would not allow credits for particular activities, investments, or industries. In addition, it would tax all income under the regular tax rate schedule. It would not allow preferentially low (or zero) tax rates to apply to cer-tain types or sources of income. In contrast, the Tax Code allowed local governments to issue up $10 billion in tax-able Recovery Zone Economic Development Bonds in 2009 and 2010 and receive a direct payment from Treasury equal to 45 percent of interest expenses. In addition, local governments could issue up to $15 billion in tax exempt Recovery Zone Facility Bonds. These bonds financed cer-tain kinds of business development in areas of economic distress.
91. Tribal Economic Development Bonds.—The baseline tax system generally would tax all income under the regular tax rate schedule. It would not allow prefer-entially low (or zero) tax rates to apply to certain types or sources of income. In contrast, the Tax Code was modified in 2009 to allow Indian tribal governments to issue tax exempt “tribal economic development bonds.” There is a national bond limitation of $2 billion on such bonds.
92. Opportunity Zones.—The baseline tax system generally would tax all income under the regular tax rate schedule. It would not allow deferral or exclusion from income for investments made within certain geographic regions. In contrast, the Tax Code allows the temporary deferral of the recognition of capital gain if reinvested prior to December 31, 2026, in a qualifying opportuni-ty fund which in turn invests in qualifying low-income communities designated as opportunity zones. For quali-fying investments held at least 5 years, 10 percent of the deferred gain is excluded from income; this exclusion in-creases to 15 percent for investments held for at least 7 years. In addition, capital gains from the sale or exchange of an investment in a qualified opportunity fund held for at least 10 years are excluded from gross income.
93. Disaster Employee Retention Credit.—The baseline tax system would not allow credits for particular activities, investments, or industries. In contrast, the Tax Code provides employers located in certain presidentially declared disaster areas during the years 2017 through 2020 a 40 percent credit for up to $6,000 in wages paid to each eligible employee while the business was inoperable as a result of the disaster. Only wages paid after the di-saster occurred and within 150 days of the last day of the incident period are eligible for the credit. Employers must reduce their deduction for wages paid by the amount of the credit claimed.

10. TAX EXPENDITURES 137
Education, Training, Employment, and Social Services
94. Exclusion of scholarship and fellowship income (normal tax method).—Scholarships and fel-lowships are excluded from taxable income to the extent they pay for tuition and course-related expenses of the grantee. Similarly, tuition reductions for employees of ed-ucational institutions and their families are not included in taxable income. From an economic point of view, schol-arships and fellowships are either gifts not conditioned on the performance of services, or they are rebates of ed-ucational costs. Thus, under the baseline tax system of the reference tax law method, this exclusion is not a tax expenditure because this method does not include either gifts or price reductions in a taxpayer’s gross income. The exclusion, however, is considered a tax expenditure under the normal tax method, which includes gift-like transfers of Government funds in gross income. (Many scholar-ships are derived directly or indirectly from Government funding.)
95. Tax credits for post-secondary education ex-penses.—The baseline tax system would not allow credits for particular activities, investments, or industries. Under current law in 2020, however, there are two credits for certain post-secondary education expenses. The American Opportunity Tax Credit allows a partially refundable credit of up to $2,500 per eligible student for qualified tu-ition and related expenses paid during each of the first four years of the student’s post-secondary education. The credit is phased out for taxpayers with modified adjusted gross income between $160,000 and $180,000 if married filing jointly ($80,000 and $90,000 for other taxpayers), not indexed. The Lifetime Learning Credit allows a non-refundable credit for 20 percent of an eligible student’s qualified tuition and fees, up to a maximum credit per return of $2,000. In Tax Year 2020, the credit is phased out ratably for taxpayers with modified AGI between $118,000 and $138,000 if married filing jointly ($59,000 and $69,000 for other taxpayers). Beginning with Tax Year 2021, the phaseout ranges for the Lifetime Learning credit are raised to conform to the ranges for the American Opportunity Tax Credit and indexing is eliminated. The Lifetime Learning credit can be claimed in any year in which post-secondary education expenses are incurred. Only one credit can be claimed per qualifying student. Married individuals filing separate returns cannot claim either credit. For tax years ending before December 31, 2020, certain taxpayers could choose to claim an above the line deduction for qualified tuition and related ex-penses rather than either of the two credits.
96. Deductibility of student loan interest.—The baseline tax system accepts current law’s general rule limiting taxpayers’ ability to deduct non-business in-terest expenses. In contrast, taxpayers may claim an above-the-line deduction of up to $2,500 on interest paid on an education loan. In Tax Year 2020, the maximum deduction is phased down ratably for taxpayers with modified AGI between $140,000 and $170,000 if married filing jointly ($70,000 and $85,000 for other taxpayers).
Married individuals filing separate returns cannot claim the deduction.
97. Qualified tuition programs (includes Education IRA).—The baseline tax system generally would tax all income under the regular tax rate sched-ule. It would not allow preferentially low (or zero) tax rates to apply to certain types or sources of income. Some States have adopted prepaid tuition plans, prepaid room and board plans, and college savings plans, which allow persons to pay in advance or save for college expenses for designated beneficiaries. Under current law, investment income, or the return on prepayments, is not taxed when earned, and is tax-exempt when withdrawn to pay for qualified expenses. Beginning in 2018, the definition of a qualified expense was expanded to include up to $10,000 per child per year of expenses for primary or secondary education, including tuition at religious schools.
98. Exclusion of interest on student-loan bonds.—The baseline tax system generally would tax all income under the regular tax rate schedule. It would not allow preferentially low (or zero) tax rates to apply to certain types or sources of income. In contrast, interest earned on State and local bonds issued to finance student loans is tax-exempt under current law. The volume of all such private activity bonds that each State may issue an-nually is limited.
99. Exclusion of interest on bonds for private nonprofit educational facilities.—The baseline tax system generally would tax all income under the regular tax rate schedule. It would not allow preferentially low (or zero) tax rates to apply to certain types or sources of income. In contrast, under current law interest earned on State and local Government bonds issued to finance the construction of facilities used by private nonprofit educa-tional institutions is not taxed.
100. Credit for holders of zone academy bonds.—The baseline tax system would not allow credits for particular activities, investments, or industries. Under current law, however, financial institutions that own zone academy bonds receive a non-refundable tax credit rath-er than interest. The credit is included in gross income. Proceeds from zone academy bonds may only be used to renovate, but not construct, qualifying schools and for certain other school purposes. The total amount of zone academy bonds that may be issued was limited to $1.4 billion in 2009 and 2010. As of March 2010, issuers of the unused authorization of such bonds could opt to receive direct payment with the yield becoming fully taxable. An additional $0.4 billion of these bonds with a tax credit was authorized to be issued each year in 2011 through 2016.
101. Exclusion of interest on savings bonds redeemed to finance educational expenses.—The baseline tax system generally would tax all income under the regular tax rate schedule. It would not allow prefer-entially low (or zero) tax rates to apply to certain types or sources of income. Under current law, however, inter-est earned on U.S. savings bonds issued after December 31, 1989, is tax-exempt if the bonds are transferred to an educational institution to pay for educational expenses. The tax exemption is phased out for taxpayers with AGI

138ANALYTICAL PERSPECTIVES
between $123,550 and $153,550 if married filing jointly ($82,350 and $97,350 for other taxpayers) in 2020.
102. Parental personal exemption for students age 19 or over.—Under the baseline tax system, a per-sonal exemption would be allowed for the taxpayer, as well as for the taxpayer’s spouse and dependents who do not claim a personal exemption on their own tax returns. These exemptions are repealed for taxable years begin-ning after December 31, 2017, and before January 1, 2026. However, the definitions regarding eligibility for depen-dent exemptions for children (and qualifying relatives), which determine eligibility for a number of family-related provisions, remain in place. These provisions include the new $500 credit for dependents other than qualifying children (Other Dependent Credit, or ODP). In general, to be considered a dependent child, a child would have to be under age 19. In contrast, the Tax Code allows taxpayers to consider their children aged 19 to 23 as dependents, as long as the children are full-time students and reside with the taxpayer for over half the year (with exceptions for temporary absences from home, such as for school at-tendance). Absent this provision, children over 18 would need to meet the more stringent rules for qualified rela-tives in order to qualify the taxpayer for certain benefits, including the ODP.
103. Charitable contributions to educational in-stitutions.—The baseline tax system would not allow a deduction for personal expenditures. In contrast, the Tax Code provides taxpayers a deduction for contributions to nonprofit educational institutions that are similar to personal expenditures. Moreover, taxpayers who donate capital assets to educational institutions can deduct the asset’s current value without being taxed on any apprecia-tion in value. An individual’s total charitable contribution generally may not exceed 50 percent (60 percent for tax years 2018 and 2025) of adjusted gross income; a corpo-ration’s total charitable contributions generally may not exceed 10 percent of pre-tax income.
104. Exclusion of employer-provided educa-tional assistance.—Under the baseline tax system, all compensation, including dedicated payments and in-kind benefits, should be included in taxable income because it represents accretions to wealth that do not materially differ from cash wages. Under current law, however, em-ployer-provided educational assistance is excluded from an employee’s gross income, even though the employer’s costs for this assistance are a deductible business ex-pense. The maximum exclusion is $5,250 per taxpayer. From March 2020 through December 31, 2025 employer-provided student loan payments are considered eligible educational assistance.
105. Special deduction for teacher expenses.—The baseline tax system would not allow a deduction for personal expenditures. In contrast, the Tax Code allowed educators in both public and private elementary and sec-ondary schools, who worked at least 900 hours during a school year as a teacher, instructor, counselor, principal or aide, to subtract up to $250 of qualified expenses, indexed to 2014, when determining their adjusted gross income (AGI).
106. Discharge of student loan indebtedness.—Under the baseline tax system, all compensation, including dedicated payments and in-kind benefits, should be included in taxable income. In contrast, the Tax Code allows certain professionals who perform in under-served areas or specific fields, and as a consequence have their student loans discharged, not to recognize such dis-charge as income.
107. Qualified school construction bonds.—The baseline tax system would not allow credits for particular activities, investments, or industries. Instead, it generally would seek to tax uniformly all returns from investment-like activities. In contrast, the Tax Code was modified in 2009 to provide a tax credit in lieu of interest to holders of qualified school construction bonds. The national vol-ume limit is $22.4 billion over 2009 and 2010. As of March 2010, issuers of such bonds could opt to receive direct pay-ment with the yield becoming fully taxable.
108. Work opportunity tax credit.—The baseline tax system would not allow credits for particular activi-ties, investments, or industries. Instead, it generally would seek to tax uniformly all returns from investment-like activities. In contrast, the Tax Code provides employers with a tax credit for qualified wages paid to individuals. The credit applies to employees who began work on or before December 31, 2025 and who are certified as mem-bers of various targeted groups. The amount of the credit that can be claimed is 25 percent of qualified wages for employment less than 400 hours and 40 percent for em-ployment of 400 hours or more. Generally, the maximum credit per employee is $2,400 and can only be claimed on the first year of wages an individual earns from an employer. However, the credit for long-term welfare recip-ients can be claimed on second year wages as well and has a $9,000 maximum. Also, certain categories of veterans are eligible for a higher maximum credit of up to $9,600. Employers must reduce their deduction for wages paid by the amount of the credit claimed.
109. Employer-provided child care exclu-sion.—Under the baseline tax system, all compensation, including dedicated payments and in-kind benefits, should be included in taxable income. In contrast, in Taxable Year 2020 up to $5,000 of employer-provided child care is excluded from an employee’s gross income even though the employer’s costs for the child care are a deductible business expense.
110. Employer-provided child care credit.—The baseline tax system would not allow credits for particular activities, investments, or industries. In contrast, current law provides a credit equal to 25 percent of qualified ex-penses for employee child care and 10 percent of qualified expenses for child care resource and referral services. Employer deductions for such expenses are reduced by the amount of the credit. The maximum total credit is limited to $150,000 per taxable year.
111. Assistance for adopted foster children.—Under the baseline tax system, all compensation, including dedicated payments and in-kind benefits, should be in-cluded in taxable income. Taxpayers who adopt eligible children from the public foster care system can receive
10. TAX EXPENDITURES 139
monthly payments for the children’s significant and varied needs and a reimbursement of up to $2,000 for nonrecurring adoption expenses; special needs adoptions receive the maximum benefit even if that amount is not spent. These payments are excluded from gross income under current law.
112. Adoption credit and exclusion.—The base-line tax system would not allow credits for particular activities. In contrast, taxpayers can receive a tax cred-it for qualified adoption expenses under current law. Taxpayers may also exclude qualified adoption expenses provided or reimbursed by an employer from income, sub-ject to the same maximum amounts and phase-out as the credit. The same expenses cannot qualify for tax benefits under both programs; however, a taxpayer may use the benefits of the exclusion and the tax credit for different expenses.
113. Exclusion of employee meals and lodging (other than military).—Under the baseline tax sys-tem, all compensation, including dedicated payments and in-kind benefits, should be included in taxable income. Furthermore, all compensation would generally be de-ductible by the employer. In contrast, under current law employer-provided meals and lodging are excluded from an employee’s gross income. Additionally, beginning in 2018, employers are allowed a deduction for only 50 per-cent of the expenses of employer-provided meals, except that in 2021 and 2022, employers are eligible for a full deduction on restaurant meals provided to employees. Employer-provided lodging is fully deductible by the em-ployer, in general.
114. Credit for child and dependent care expens-es.—The baseline tax system would not allow credits for particular activities or targeted at specific groups. In con-trast, the Tax Code provides a tax credit to parents who work or attend school and who have child and dependent care expenses. In taxable year 2020 expenditures up to a maximum $3,000 for one dependent and $6,000 for two or more dependents are eligible for the credit. The credit is equal to 35 percent of qualified expenditures for taxpay-ers with incomes of up to $15,000. The credit is reduced to a minimum of 20 percent by one percentage point for each $2,000 of income in excess of $15,000.
115. Credit for disabled access expenditures.—The baseline tax system would not allow credits for particular activities, investments, or industries. In con-trast, the Tax Code provides small businesses (less than $1 million in gross receipts or fewer than 31 full-time em-ployees) a 50 percent credit for expenditures in excess of $250 to remove access barriers for disabled persons. The credit is limited to $5,000.
116. Deductibility of charitable contributions, other than education and health.—The baseline tax system would not allow a deduction for personal expen-ditures including charitable contributions. In contrast, the Tax Code provides taxpayers a deduction for con-tributions to charitable, religious, and certain other nonprofit organizations. Taxpayers who donate capital assets to charitable organizations can deduct the assets’ current value without being taxed on any appreciation in
value. An individual’s total charitable contribution gener-ally may not exceed 50 percent (60 percent between 2018 and 2025) of adjusted gross income; a corporation’s total charitable contributions generally may not exceed 10 per-cent of pre-tax income.
117. Exclusion of certain foster care payments.—The baseline tax system generally would tax all income under the regular tax rate schedule. It would not allow preferentially low (or zero) tax rates to apply to certain types or sources of income. Foster parents provide a home and care for children who are wards of the State, under contract with the State. Under current law, compensa-tion received for this service is excluded from the gross incomes of foster parents; the expenses they incur are nondeductible.
118. Exclusion of parsonage allowances.—Under the baseline tax system, all compensation, including dedi-cated payments and in-kind benefits, would be included in taxable income. Dedicated payments and in-kind benefits represent accretions to wealth that do not differ materi-ally from cash wages. In contrast, the Tax Code allows an exclusion from a clergyman’s taxable income for the value of the clergyman’s housing allowance or the rental value of the clergyman’s parsonage.
119. Indian employment credit.—The baseline tax system would not allow credits for particular activities, investments, or industries. Instead, it generally would seek to tax uniformly all returns from investment-like activities. In contrast, the Tax Code provides employers with a tax credit for qualified wages paid to employees who are enrolled members of Indian tribes. The amount of the credit that could be claimed is 20 percent of the excess of qualified wages and health insurance costs paid by the employer in the current tax year over the amount of such wages and costs paid by the employer in 1993. Qualified wages and health insurance costs with respect to any employee for the taxable year could not exceed $20,000. Employees have to live on or near the reservation where they work to be eligible for the credit. Employers must re-duce their deduction for wages paid by the amount of the credit claimed. The credit does not apply to taxable years beginning after December 31, 2021.
120. Credit for employer differential wage pay-ments.—The baseline tax system would not allow credits for particular activities, investments, or industries. In con-trast, the Tax Code provides employers with a 20 percent tax credit for eligible differential wages paid to employees who are members of the uniformed services while on ac-tive duty for more than 30 days. The amount of eligible differential wage payments made to a qualified employee in a taxable year is capped at $20,000. Employers must reduce their deduction for wages paid by the amount of the credit claimed.
Health
121. Exclusion of employer contributions for medical insurance premiums and medical care.—Under the baseline tax system, all compensa-tion, including dedicated payments and in-kind benefits,
140ANALYTICAL PERSPECTIVES
should be included in taxable income. In contrast, under current law, employer-paid health insurance premiums and other medical expenses (including long-term care or Health Reimbursement Accounts) are not included in em-ployee gross income even though they are deducted as a business expense by the employee.
122. Self-employed medical insurance premi-ums.—Under the baseline tax system, all compensation and remuneration, including dedicated payments and in-kind benefits, should be included in taxable income. In contrast, under current law self-employed taxpayers may deduct their family health insurance premiums. Taxpayers without self-employment income are not eligible for this special deduction. The deduction is not available for any month in which the self-employed individual is eligible to participate in an employer-subsidized health plan and the deduction may not exceed the self-employed individual’s earned income from self-employment.
123. Medical Savings Accounts and Health Savings Accounts.—Under the baseline tax system, all compensation, including dedicated payments and in-kind benefits, should be included in taxable income. Also, the baseline tax system would not allow a deduction for per-sonal expenditures and generally would tax investment earnings. In contrast, individual contributions to Archer Medical Savings Accounts (Archer MSAs) and Health Savings Accounts (HSAs) are allowed as a deduction in determining adjusted gross income whether or not the in-dividual itemizes deductions. Employer contributions to Archer MSAs and HSAs are excluded from income and employment taxes. Archer MSAs and HSAs require that the individual have coverage by a qualifying high deduct-ible health plan. Earnings from the accounts are excluded from taxable income. Distributions from the accounts used for medical expenses are not taxable. The rules for HSAs are generally more flexible than for Archer MSAs and the deductible contribution amounts are greater (in 2019, $3,500 for taxpayers with individual coverage and $7,000 for taxpayers with family coverage). Thus, HSAs have largely replaced MSAs.
124. Deductibility of medical expenses.—The baseline tax system would not allow a deduction for personal expenditures. In contrast, under current law personal expenditures for medical care (including the costs of prescription drugs) exceeding 7.5 percent of the taxpayer’s adjusted gross income are deductible. For tax years beginning after 2012, only medical expenditures exceeding 10 percent of the taxpayer’s adjusted gross in-come are deductible. However, for the years 2013, 2014, 2015 and 2016, if either the taxpayer or the taxpayer’s spouse turned 65 before the end of the taxable year, the threshold remained at 7.5 percent of adjusted income. Beginning in 2017, the 10 percent threshold applied to all taxpayers, including those over 65.
125. Exclusion of interest on hospital construc-tion bonds.—The baseline tax system generally would tax all income under the regular tax rate schedule. It would not allow preferentially low (or zero) tax rates to apply to certain types or sources of income. In contrast, under current law interest earned on State and local gov-
ernment debt issued to finance hospital construction is excluded from income subject to tax.
126. Refundable Premium Assistance Tax Credit.—The baseline tax system would not allow cred-its for particular activities or targeted at specific groups. In contrast, for taxable years ending after 2013, the Tax Code provides a premium assistance credit to any eligible taxpayer for any qualified health insurance purchased through a Health Insurance Exchange. In general, an eligible taxpayer is a taxpayer with annual household in-come between 100 percent and 400 percent of the federal poverty level for a family of the taxpayer’s size and that does not have access to affordable minimum essential health care coverage. The amount of the credit equals the lesser of (1) the actual premiums paid by the taxpayer for such coverage or (2) the difference between the cost of a statutorily-identified benchmark plan offered on the exchange and a required payment by the taxpayer that increases with income. The American Rescue Plan Act of 2021 (P.L. 117-2) temporarily increased the Premium Tax Credit in three ways. For 2021 and 2022, the legislation increased the Premium Tax Credit for currently eligible individuals and families, providing access to free plans for those earning 100 to 150 percent of the federal poverty level, and expanded eligibility to newly include individu-als and families with income above 400 percent of the federal poverty level. The legislation also expanded eligi-bility in 2021 to individuals who receive unemployment insurance for any week in 2021. The legislation also elimi-nated the requirement for individuals to repay any excess advance payments of the Premium Tax Credit for 2020.
127. Credit for employee health insurance ex-penses of small business.—The baseline tax system would not allow credits for particular activities or target-ed at specific groups. In contrast, the Tax Code provides a tax credit to qualified small employers that make a certain level of non-elective contributions towards the purchase of certain health insurance coverage for its employees. To receive a credit, an employer must have fewer than 25 full-time-equivalent employees whose average annual full-time-equivalent wages from the em-ployer are less than $50,000 (indexed for taxable years after 2013). However, to receive a full credit, an employer must have no more than 10 full-time employees, and the average wage paid to these employees must be no more than $25,000 (indexed for taxable years after 2013). A qualifying employer may claim the credit for any taxable year beginning in 2010, 2011, 2012, and 2013 and for up to two years for insurance purchased through a Health Insurance Exchange thereafter. For taxable years begin-ning in 2010, 2011, 2012, and 2013, the maximum credit is 35 percent of premiums paid by qualified taxable em-ployers and 25 percent of premiums paid by qualified tax-exempt organizations. For taxable years beginning in 2014 and later years, the maximum tax credit increas-es to 50 percent of premiums paid by qualified taxable employers and 35 percent of premiums paid by qualified tax-exempt organizations.
128. Deductibility of charitable contributions to health institutions.—The baseline tax system would

10. TAX EXPENDITURES 141
not allow a deduction for personal expenditures includ-ing charitable contributions. In contrast, the Tax Code provides individuals and corporations a deduction for contributions to nonprofit health institutions. Tax expen-ditures resulting from the deductibility of contributions to other charitable institutions are listed under the edu-cation, training, employment, and social services function.
129. Tax credit for orphan drug research.—The baseline tax system would not allow credits for particular activities, investments, or industries. In contrast, under current law drug firms can claim a tax credit of 50 per-cent of the costs for clinical testing required by the Food and Drug Administration for drugs that treat rare physi-cal conditions or rare diseases. This rate is modified to 25 percent by TCJA for expenditures incurred or paid in tax years beginning after December 31, 2017.
130. Special Blue Cross/Blue Shield tax ben-efits.—The baseline tax system generally would tax all profits under the regular tax rate schedule using broadly applicable measures of baseline income. It would not al-low preferentially low tax rates to apply to certain types or sources of income. In contrast, certain Blue Cross and Blue Shield (BC/BS) health insurance providers and cer-tain other health insurers are provided with special tax benefits, provided that their percentage of total premium revenue expended on reimbursement for clinical services provided to enrollees or for activities that improve health care quality is not less than 85 percent for the taxable year. A qualifying insurer may take as a deduction 100 percent of any net increase in its unearned premium reserves, instead of the 80 percent allowed other insurers. A qualify-ing insurer is also allowed a special deduction equal to the amount by which 25 percent of its health-claim expenses exceeds its beginning-of-the-year accounting surplus. The deduction is limited to the insurer’s taxable income deter-mined without the special deduction.
131. Tax credit for health insurance purchased by certain displaced and retired individuals.—The baseline tax system would not allow credits for particular activities, investments, or industries. In contrast, the Tax Code provides a refundable tax credit of 72.5 percent for the purchase of health insurance coverage by individu-als eligible for Trade Adjustment Assistance and certain Pension Benefit Guarantee Corporation pension recipi-ents. This provision will expire on December 31, 2019.
132. Distributions from retirement plans for premiums for health and long-term care insur-ance.—Under the baseline tax system, all compensation, including dedicated and deferred payments, should be included in taxable income. In contrast, the Tax Code provides for tax-free distributions of up to $3,000 from governmental retirement plans for premiums for health and long term care premiums of public safety officers.
133. Credit for family and sick leave taken by self-employed individuals.—The baseline tax system would not allow credits for particular activities or tar-geted as specific groups. Under current law, however, self-employed individuals are allowed a refundable credit equal for certain family or sick leave taken. In general, the sick leave credit is equal to 100% of daily self-employment
income (equal to self-employment income divided by 260) during a period of qualified sick leave, up to $511 per day for 10 days. The family leave credit is equal to two thirds of daily self-employment income (but no greater than two thirds of $200) during a period of qualified family leave for up to 10 weeks. Under current law, the credit applies to leave taken prior to April 1, 2021.
Income Security
134. Child credit.—The baseline tax system would not allow credits for particular activities or targeted at specific groups. Under current law, however, taxpayers with children under age 17 can qualify for a $2,000 per child partially refundable child credit. Up to $1,400 per child of unclaimed credit due to insufficient tax liability may be refundable—taxpayers may claim a refund for 15 percent of earnings in excess of a $2,500 floor, up to the lesser of the amount of unused credit or $1,400 per child. To be eligible for the child credit, the child must have a Social Security Number (SSN). A taxpayer may also claim a nonrefundable credit of $500 for each qualifying child not eligible for the $2,000 credit (those over sixteen and those without SSNs) and for each dependent relative. The total combined child and other dependent credit is phased out for taxpayers at the rate of $50 per $1,000 of modi-fied AGI above $400,000 ($200,000 for single or head of household filers and $200,000 for married taxpayers filing separately). For tax years beginning after December 31, 2025, the credit returns to its pre-TCJA value of $1,000. At that time, up to the full value of the credit (subject to a phase-in of 15 percent of earnings in excess of $3,000) will be refundable and the $500 other dependent credit will expire. The credit will once again phase out at the rate of $50 per $1,000 of modified AGI above $110,000 ($75,000 for single or head of household filers and $55,000 for married taxpayers filing separately). The social secu-rity requirement will remain in place.
135. Exclusion of railroad Social Security equivalent benefits.—Under the baseline tax system, all compensation, including dedicated and deferred pay-ments, should be included in taxable income. In contrast, the Social Security Equivalent Benefit paid to railroad retirees is not generally subject to the income tax unless the recipient’s gross income reaches a certain thresh-old under current law. See provision number 156, Social Security benefits for retired workers, for discussion of the threshold.
136. Exclusion of workers’ compensation ben-efits.—Under the baseline tax system, all compensation, including dedicated payments and in-kind benefits, should be included in taxable income. However, workers compen-sation is not subject to the income tax under current law.
137. Exclusion of public assistance benefits (normal tax method).—Under the reference tax law baseline, gifts and transfers are not treated as income to the recipients. In contrast, the normal tax method considers cash transfers from the Government as part of the recipients’ income, and thus, treats the exclusion
142ANALYTICAL PERSPECTIVES
for public assistance benefits under current law as a tax expenditure.
138. Exclusion of special benefits for disabled coal miners.—Under the baseline tax system, all com-pensation, including dedicated payments and in-kind benefits, should be included in taxable income. However, disability payments to former coal miners out of the Black Lung Trust Fund, although income to the recipient, are not subject to the income tax.
139. Exclusion of military disability pen-sions.—Under the baseline tax system, all compensation, including dedicated payments and in-kind benefits, should be included in taxable income. In contrast, most of the military disability pension income received by current disabled military retirees is excluded from their income subject to tax.
140. Defined benefit employer plans.—Under the baseline tax system, all compensation, including deferred and dedicated payments, should be included in taxable income. In addition, investment income would be taxed as earned. In contrast, under current law certain contribu-tions to defined benefit pension plans are excluded from an employee’s gross income even though employers can deduct their contributions. In addition, the tax on the in-vestment income earned by defined benefit pension plans is deferred until the money is withdrawn.
141. Defined contribution employer plans.—Under the baseline tax system, all compensation, including deferred and dedicated payments, should be included in taxable income. In addition, investment income would be taxed as earned. In contrast, under current law individual taxpayers and employers can make tax-preferred contri-butions to employer-provided 401(k) and similar plans (e.g. 403(b) plans and the Federal Government’s Thrift Savings Plan). In 2020, an employee could exclude up to $19,500 of wages from AGI under a qualified arrange-ment with an employer’s 401(k) plan. Employees age 50 or over could exclude up to $26,000 in contributions. The defined contribution plan limit, including both employee and employer contributions, is $57,000 in 2020. The tax on contributions made by both employees and employers and the investment income earned by these plans is de-ferred until withdrawn.
142. Individual Retirement Accounts (IRAs).—Under the baseline tax system, all compensation, including deferred and dedicated payments, should be in-cluded in taxable income. In addition, investment income would be taxed as earned. In contrast, under current law individual taxpayers can take advantage of traditional and Roth IRAs to defer or otherwise reduce the tax on the return to their retirement savings. The IRA contribu-tion limit is $6,000 in 2020; taxpayers age 50 or over are allowed to make additional “catch-up’’ contributions of $1,000. Contributions to a traditional IRA are generally deductible but the deduction is phased out for workers with incomes above certain levels if the workers or their spouses are active participants in an employer-provided retirement plan. Contributions and account earnings are includible in income when withdrawn from traditional IRAs. Roth IRA contributions are not deductible, but earn-
ings and withdrawals are exempt from taxation. Income limits also apply to Roth IRA contributions.
143. Low and moderate-income savers’ cred-it.—The baseline tax system would not allow credits for particular activities or targeted at specific groups. In con-trast, the Tax Code provides an additional incentive for lower-income taxpayers to save through a nonrefundable credit of up to 50 percent on IRA and other retirement contributions of up to $2,000. This credit is in addition to any deduction or exclusion. The credit is completely phased out by $65,000 for joint filers, $48,750 for head of household filers, and $32,500 for other filers in 2020.
144. Self-employed plans.—Under the baseline tax system, all compensation, including deferred and dedi-cated payments, should be included in taxable income. In addition, investment income would be taxed as earned. In contrast, under current law self-employed individuals can make deductible contributions to their own retire-ment plans equal to 25 percent of their income, up to a maximum of $57,000 in 2020. Total plan contributions are limited to 25 percent of a firm’s total wages. The tax on the investment income earned by self-employed SEP, SIMPLE, and qualified plans is deferred until withdrawn.
145. Premiums on group term life insurance.—Under the baseline tax system, all compensation, including deferred and dedicated payments, should be in-cluded in taxable income. In contrast, under current law employer-provided life insurance benefits are excluded from an employee’s gross income (to the extent that the employer’s share of the total costs does not exceed the cost of $50,000 of such insurance) even though the employer’s costs for the insurance are a deductible business expense.
146. Premiums on accident and disability insur-ance.—Under the baseline tax system, all compensation, including dedicated payments and in-kind benefits, should be included in taxable income. In contrast, under current law employer-provided accident and disability benefits are excluded from an employee’s gross income even though the employer’s costs for the benefits are a deductible business expense.
147. Exclusion of investment income from Supplementary Unemployment Benefit Trusts.—Under the baseline tax system, all compensation, including dedicated payments and in-kind benefits, should be included in taxable income. In addition, invest-ment income would be taxed as earned. Under current law, employers may establish trusts to pay supplemen-tal unemployment benefits to employees separated from employment. Investment income earned by such trusts is exempt from taxation.
148. Exclusion of investment income from Voluntary Employee Benefit Associations trusts.—Under the baseline tax system, all compensation, including dedicated payments and in-kind benefits, should be in-cluded in taxable income. Under current law, employers may establish associations, or VEBAs, to pay employee benefits, which may include health benefit plans, life in-surance, and disability insurance, among other employee benefits. Investment income earned by such trusts is ex-empt from taxation.

10. TAX EXPENDITURES 143
149. Special Employee Stock Ownership Plan (ESOP) rules.— Under the baseline tax system, all com-pensation, including dedicated payments and in-kind benefits, should be included in taxable income. In addition, investment income would be taxed as earned. In contrast, employer-paid contributions (the value of stock issued to the ESOP) are deductible by the employer as part of em-ployee compensation costs. They are not included in the employees’ gross income for tax purposes, however, until they are paid out as benefits. In addition, the following special income tax provisions for ESOPs are intended to increase ownership of corporations by their employees: (1) annual employer contributions are subject to less restric-tive limitations than other qualified retirement plans; (2) ESOPs may borrow to purchase employer stock, guaran-teed by their agreement with the employer that the debt will be serviced by the payment (deductible by firm) of a portion of wages (excludable by the employees) to ser-vice the loan; (3) employees who sell appreciated company stock to the ESOP may defer any taxes due until they withdraw benefits; (4) dividends paid to ESOP-held stock are deductible by the employer; and (5) earnings are not taxed as they accrue.
150. Additional deduction for the blind.—Under the baseline tax system, the standard deduction is al-lowed. An additional standard deduction for a targeted group within a given filing status would not be allowed. In contrast, the Tax Code allows taxpayers who are blind to claim an additional $1,700 standard deduction if single, or $1,350 if married in 2019.
151. Additional deduction for the elderly.—Under the baseline tax system, the standard deduction is allowed. An additional standard deduction for a targeted group within a given filing status would not be allowed. In contrast, the Tax Code allows taxpayers who are 65 years or older to claim an additional $1,700 standard deduction if single, or $1,350 if married in 2020.
152. Deductibility of casualty losses.—Under the baseline tax system, neither the purchase of property nor insurance premiums to protect the property’s value are deductible as costs of earning income. Therefore, reim-bursement for insured loss of such property is not included as a part of gross income, and uninsured losses are not deductible. In contrast, the Tax Code provides a deduction for uninsured casualty and theft losses of more than $100 each, to the extent that total losses during the year exceed 10 percent of the taxpayer’s adjusted gross income. In the case of taxable years beginning after December 31, 2017, and before January 1, 2026, personal casualty losses are deductible only to the extent they are attributable to a Federally declared disaster area.
153. Earned income tax credit (EITC).—The baseline tax system would not allow credits for particular activities or targeted at specific groups. In contrast, the Tax Code provides an EITC to low-income workers at a maximum rate of 45 percent of income. In 2020, for a fam-ily with one qualifying child, the credit is 34 percent of the first $10,540 of earned income. The credit is 40 percent of the first $14,800 of income for a family with two qualify-ing children, and it is 45 percent of the first $14,800 of
income for a family with three or more qualifying chil-dren. Low-income workers with no qualifying children are eligible for a 7.65 percent credit on the first $7,030 of earned income. The credit plateaus and then phases out with the greater of AGI or earnings at income levels and rates which depend upon how many qualifying children are eligible and marital status. In 2020, the phase-down for married filers begins at incomes $5,890 ($5,800 for fil-ers without children) greater than for otherwise similar unmarried filers. Earned income tax credits in excess of tax liabilities owed through the individual income tax system are refundable to individuals. Beginning in 2018, the parameters of the EITC are indexed by the chained CPI, which results in a smaller inflation adjustment than previously. This change is permanent.
154. Recovery rebate credits.—The baseline tax system would not allow credits for particular activities or targeted at specific groups. In contrast, the Coronavirus Aid, Relief, and Economic Security (CARES) Act provid-ed rebates of $1,200 ($2,400 for married couples filing jointly) and 500 per child. The total rebate amount be-gins phasing out at adjusted gross income over $75,000 ($150,000 for married couples filing jointly, $112,500 heads of household). This was followed by the Consolidated Appropriations Act which provided rebates of $600 per el-igible taxpayer ($1,200 for married couples filing jointly) plus an additional $600 per child, with phase out features similar to CARES.
Social Security
155. Social Security benefits for retired and disabled workers and spouses, dependents, and survivors.—The baseline tax system would tax Social Security benefits to the extent that contributions to Social Security were not previously taxed. Thus, the portion of Social Security benefits that is attributable to employer contributions and to earnings on employer and employee contributions (and not attributable to employee contribu-tions which are taxed at the time of contribution) would be subject to tax. In contrast, the Tax Code may not tax all of the Social Security benefits that exceed the beneficiary’s contributions from previously taxed income. Actuarially, previously taxed contributions generally do not exceed 15 percent of benefits, even for retirees receiving the highest levels of benefits. Therefore, up to 85 percent of recipients’ Social Security and Railroad Social Security Equivalent retirement benefits are included in (phased into) the in-come tax base if the recipient’s provisional income exceeds certain base amounts. (Provisional income is equal to oth-er items included in adjusted gross income plus foreign or U.S. possession income, tax-exempt interest, and one half of Social Security and Railroad Social Security Equivalent retirement benefits.) The untaxed portion of the benefits received by taxpayers who are below the income amounts at which 85 percent of the benefits are taxable is counted as a tax expenditure. Benefits paid to disabled workers and to spouses, dependents, and survivors are treated in a similar manner. Railroad Social Security Equivalent benefits are treated like Social Security benefits. See
144ANALYTICAL PERSPECTIVES
also provision number 136, Exclusion of railroad Social Security equivalent benefits.
156. Credit for certain employer social security contributions.—Under the baseline tax system, employ-er contributions to Social Security represent labor cost and are deductible expenses. Under current law, how-ever, certain employers are allowed a tax credit, instead of a deduction, against taxes paid on tips received from customers in connection with the providing, delivering, or serving of food or beverages for consumption. The tip credit equals the full amount of the employer’s share of FICA taxes paid on the portion of tips, when added to the employee’s non-tip wages, in excess of $5.15 per hour. The credit is available only with respect to FICA taxes paid on tips.
Veterans Benefits and Services
157. Exclusion of veterans death benefits and disability compensation.—Under the baseline tax sys-tem, all compensation, including dedicated payments and in-kind benefits, should be included in taxable income because they represent accretions to wealth that do not materially differ from cash wages. In contrast, all com-pensation due to death or disability paid by the Veterans Administration is excluded from taxable income under current law.
158. Exclusion of veterans pensions.—Under the baseline tax system, all compensation, including dedi-cated payments and in-kind benefits, should be included in taxable income because they represent accretions to wealth that do not materially differ from cash wages. Under current law, however, pension payments made by the Veterans Administration are excluded from gross income.
159. Exclusion of G.I. Bill benefits.—Under the baseline tax system, all compensation, including dedi-cated payments and in-kind benefits, should be included in taxable income because they represent accretions to wealth that do not materially differ from cash wages. Under current law, however, G.I. Bill benefits paid by the Veterans Administration are excluded from gross income.
160. Exclusion of interest on veterans housing bonds.—The baseline tax system generally would tax all income under the regular tax rate schedule. It would not allow preferentially low (or zero) tax rates to apply to cer-tain types or sources of income. In contrast, under current law, interest earned on general obligation bonds issued by State and local governments to finance housing for veter-ans is excluded from taxable income.
General Government
161. Exclusion of interest on public purpose State and local bonds.—The baseline tax system gen-erally would tax all income under the regular tax rate schedule. It would not allow preferentially low (or zero) tax rates to apply to certain types or sources of income. In contrast, under current law interest earned on State and local government bonds issued to finance public-pur-pose construction (e.g., schools, roads, sewers), equipment acquisition, and other public purposes is tax-exempt. Interest on bonds issued by Indian tribal governments for essential governmental purposes is also tax-exempt.
162. Build America Bonds.—The baseline tax sys-tem would not allow credits for particular activities or targeted at specific groups. In contrast, the Tax Code in 2009 allowed State and local governments to issue tax-able bonds through 2010 and receive a direct payment from Treasury equal to 35 percent of interest expenses. Alternatively, State and local governments could issue taxable bonds and the private lenders receive the 35 per-cent credit which is included in taxable income.
163. Deductibility of nonbusiness State and local taxes other than on owner-occupied homes.—Under the baseline tax system, a deduction for personal consumption expenditures would not be allowed. In con-trast, the Tax Code allows taxpayers who itemize their deductions to claim a deduction for State and local in-come taxes (or, at the taxpayer’s election, State and local sales taxes) and property taxes, even though these taxes primarily pay for services that, if purchased directly by taxpayers, would not be deductible. (The estimates for this tax expenditure do not include the estimates for the deductibility of State and local property tax on owner-oc-cupied homes. See item 57.) In the case of taxable years beginning after December 31, 2017, and before January 1, 2026, (1) the deduction for foreign real property taxes paid is disallowed and (2) the deduction for taxes paid in any taxable year, which includes the deduction for proper-ty taxes on real property, is limited to $10,000 ($5,000 in the case of a married individual filing a separate return).
Interest
164. Deferral of interest on U.S. savings bonds.—The baseline tax system would uniformly tax all returns to investments and not allow an exemption or deferral for particular activities, investments, or industries. In con-trast, taxpayers may defer paying tax on interest earned on U.S. savings bonds until the bonds are redeemed.
APPENDIX
Performance Measures and the Economic Effects of Tax Expenditures
The Government Performance and Results Act of 1993 (GPRA) directs Federal agencies to develop annual and strategic plans for their programs and activities. These
plans set out performance objectives to be achieved over a specific time period. Most of these objectives are achieved through direct expenditure programs. Tax expenditures—spending programs implemented through the tax code by reducing tax obligations for certain activities—contribute

10. TAX EXPENDITURES 145
to achieving these goals in a manner similar to direct ex-penditure programs.
Tax expenditures by definition work through the tax system and, particularly, the income tax. Thus, they may be relatively advantageous policy approaches when the benefit or incentive is related to income and is intended to be widely available. Because there is an existing pub-lic administrative and private compliance structure for the tax system, income-based programs that require little oversight might be efficiently run through the tax system. In addition, some tax expenditures actually sim-plify the operation of the tax system. Tax expenditures also implicitly subsidize certain activities in a manner similar to direct expenditures. For example, exempting employer-sponsored health insurance from income taxa-tion is equivalent to a direct spending subsidy equal to the forgone tax obligations for this type of compensation. Spending, regulatory or tax-disincentive policies can also modify behavior, but may have different economic effects. Finally, a variety of tax expenditure tools can be used, e.g., deductions, credits, exemptions, deferrals, floors, ceil-ings, phase-ins, phase-outs, and these can be dependent on income, expenses, or demographic characteristics (age, number of family members, etc.). This wide range of policy instruments means that tax expenditures can be flexible and can have very different economic effects.
Tax expenditures also have limitations. In many cases they add to the complexity of the tax system, which raises both administrative and compliance costs. For example, exemptions, deductions, credits, and phase-outs can com-plicate filing and decision-making. The income tax system may have little or no contact with persons who have no or very low incomes, and does not require information on certain characteristics of individuals used in some spend-ing programs, such as wealth or duration of employment. These features may reduce the effectiveness of tax ex-penditures for addressing socioeconomic disparities. Tax expenditures also generally do not enable the same degree of agency discretion as an outlay program. For example, grant or direct Federal service delivery programs can pri-oritize activities to be addressed with specific resources in a way that is difficult to emulate with tax expenditures.
Outlay programs have advantages where the direct provision of government services is particularly warrant-ed, such as equipping and maintaining the armed forces or administering the system of justice. Outlay programs may also be specifically designed to meet the needs of low-income families who would not otherwise be subject to income taxes or need to file a tax return. Outlay pro-grams may also receive more year-to-year oversight and fine tuning through the legislative and executive budget process. In addition, many different types of spending programs include direct Government provision; credit programs; and payments to State and local governments, the private sector, or individuals in the form of grants or contracts, which provide flexibility for policy design. On the other hand, certain outlay programs may rely less directly on economic incentives and private-market pro-vision than tax incentives, thereby reducing the relative efficiency of spending programs for some goals. Finally,
spending programs, particularly on the discretionary side, may respond less rapidly to changing activity levels and economic conditions than tax expenditures.
Regulations may have more direct and immediate ef-fects than outlay and tax-expenditure programs because regulations apply directly and immediately to the regu-lated party (i.e., the intended actor), generally in the private sector. Regulations can also be fine-tuned more quickly than tax expenditures because they can often be changed as needed by the Executive Branch without legislation. Like tax expenditures, regulations often rely largely on voluntary compliance, rather than detailed in-spections and policing. As such, the public administrative costs tend to be modest relative to the private resource costs associated with modifying activities. Historically, regulations have tended to rely on proscriptive measures, as opposed to economic incentives. This reliance can di-minish their economic efficiency, although this feature can also promote full compliance where (as in certain safety-related cases) policymakers believe that trade-offs with economic considerations are not of paramount im-portance. Also, regulations generally do not directly affect Federal outlays or receipts. Thus, like tax expenditures, they may escape the degree of scrutiny that outlay pro-grams receive.
A Framework for Evaluating the Effectiveness of Tax Expenditures
Across all major budgetary categories—from housing and health to space, technology, agriculture, and national defense—tax expenditures make up a significant portion of Federal activity and affect every area of the economy. For these reasons, a comprehensive evaluation framework that examines incentives, direct results, and spillover effects will benefit the budgetary process by informing de-cisions on tax expenditure policy.
As described above, tax expenditures, like spending and regulatory programs, have a variety of objectives and economic effects. These include encouraging certain types of activities (e.g., saving for retirement or investing in cer-tain sectors); increasing certain types of after-tax income (e.g., favorable tax treatment of Social Security income); and reducing private compliance costs and Government administrative costs (e.g., the exclusion for up to $500,000 of capital gains on home sales). Some of these objectives are well-suited to quantitative measurement and evalua-tion, while others are less well-suited.
Performance measurement is generally concerned with inputs, outputs, and outcomes. In the case of tax expen-ditures, the principal input is usually the revenue effect. Outputs are quantitative or qualitative measures of goods and services, or changes in income and investment, direct-ly produced by these inputs. Outcomes, in turn, represent the changes in the economy, society, or environment that are the ultimate goals of programs. Evaluations assess whether programs are meeting intended goals, but may also encompass analyzing whether initiatives are supe-rior to other policy alternatives.
146ANALYTICAL PERSPECTIVES
Similar to prior years, the Administration is work-ing towards examining the objectives and effects of the wide range of tax expenditures in the President’s Budget, despite challenges related to data availability, measure-ment, and analysis. Evaluations include an assessment of whether tax expenditures are achieving intended policy results in an efficient manner, with minimal bur-dens on individual taxpayers, consumers, and firms, and an examination of possible unintended effects and their consequences.
As an illustration of how evaluations can inform budgetary decisions, consider education, and research in-vestment credits.
Education. There are millions of individuals taking ad-vantage of tax credits designed to help pay for educational expenses. There are a number of different credits avail-able as well as other important forms of Federal support for higher education such as subsidized student loans and grants. An evaluation would explore the possible relation-ships between use of the credits and the use of student loans and grants, seeking to answer, for example, whether the use of credits reduces or increases the likelihood of students applying for loans. Such an evaluation would allow stakeholders to determine the need for programs—whether they involve tax credits, subsidized loans, or grants.
Investment. A series of tax expenditures reduce the cost of investment, both in specific activities such as research and experimentation, extractive industries, and certain financial activities, and more generally throughout the economy, through accelerated depreciation for plant and equipment. These provisions can be evaluated along a number of dimensions. For example, it is useful to con-sider the strength of the incentives by measuring their effects on the cost of capital (the return which invest-ments must yield to cover their costs) and effective tax rates. The impact of these provisions on the amount of cor-responding forms of investment (e.g., research spending, exploration activity, equipment) might also be estimated. In some cases, such as research, there is evidence that this private investment can provide significant positive exter-nalities—that is, economic benefits that are not reflected in the market transactions between private parties. It could be useful to quantify these externalities and com-pare them with the size of tax expenditures. Measures could also indicate the effects on production from these investments such as numbers or values of patents, en-
ergy production and reserves, and industrial production. Issues to be considered include the extent to which the preferences increase production (as opposed to benefiting existing output) and their cost-effectiveness relative to other policies. Analysis could also consider objectives that are more difficult to measure but could be ultimate goals, such as promoting energy security or economic growth. Such an assessment is likely to involve tax analysis as well as consideration of non-tax matters such as market structure, scientific, and other information.
The tax proposals subject to these analyses include items that indirectly affect the estimated value of tax expenditures (such as changes in income tax rates), pro-posals that make reforms to improve tax compliance and administration, as well as proposals which would change, add, or delete tax expenditures.
Barriers to Evaluation. Developing a framework that is sufficiently comprehensive, accurate, and flexible is a significant challenge. Evaluations are constrained by the availability of appropriate data and challenges in eco-nomic modeling:
• Data availability—Data may not exist, or may not exist in an analytically appropriate form, to con-duct rigorous evaluations of certain types of expen-ditures. For example, measuring the effects of tax expenditures designed to achieve tax neutrality for individuals and firms earning income abroad, and foreign firms could require data from foreign govern-ments or firms which are not readily available.
• Analytical constraints—Evaluations of tax expen-ditures face analytical constraints even when data are available. For example, individuals might have access to several tax expenditures and programs aimed at improving the same outcome. Isolating the effect of a single tax credit is challenging absent a well-specified research design.
• Resources—Tax expenditure analyses are seriously constrained by staffing considerations. Evaluations typically require expert analysts who are often en-gaged in other areas of work related to the budget.
The Executive Branch is focused on addressing these challenges to lay the foundation for the analysis of tax ex-penditures comprehensively, alongside evaluations of the effectiveness of direct spending initiatives.

147
SPECIAL TOPICS

149
11. AID TO STATE AND LOCAL GOVERNMENTS
The analysis in this chapter focuses on Federal spend-ing that is provided to State and local governments, U.S. territories, and American Indian Tribal governments to help fund programs administered by those entities. This type of Federal spending is known as Federal financial assistance, primarily administered as grants.
In 2020 the Federal Government spent $829 billion on aid to State, local, tribal and territorial governments. Spending on grants was 4 percent of GDP in 2020. These funds support activities that touch every American, such as education, transportation infrastructure, workforce ini-tiatives, community development, and homeland security.
The Budget provides $1.1 trillion in outlays for aid to State, local, tribal and territorial governments in 2022, an increase of 7 percent from spending in 2021, which is es-timated to be $1 trillion. Total Federal grant spending to State and local governments is estimated to be 5 percent of GDP in 2022.
Background and Analysis
Federal grants are authorized by the Congress in stat-ute, which then establishes the purpose of the grant and how it is awarded. Most often Federal grants are award-ed as direct cash assistance, but Federal grants can also include in-kind assistance—non-monetary aid, such as commodities purchased for the National School Lunch Program—and Federal revenues or assets shared with State and local governments.
In its 2020 State Expenditure Report, the National Association of State Budget Officers (NASBO) reports that 14 percent of total State spending, which is estimat-ed to be about $2.26 trillion1 in State fiscal year2 2020 came from Federal funds. “Overall, total state expendi-tures (including general funds, other state funds, bonds and federal funds) increased 3.2 percent in 2018, 5.1 per-cent in fiscal 2019 and are estimated to have grown 7.7 percent in fiscal 2020.”3
Table 11-1, below, shows Federal grants spending by decade, actual spending in 2020, and estimated spending in 2021 and 2022. Table 11-2 shows the Budget’s fund-ing level for grants in every Budget account, organized by functional category, BEA category, and by Federal Agency.
The Federal budget classifies grants by general area or function. Of the total proposed grant spending in
1 “2020 State Expenditure Report.” National Association of State Budget Officers, 2020. p. 1.
2 According to “The Fiscal Survey of States” published by the Na-tional Association of State Budget Officers (Fall 2019, p. VI), “Forty-six States begin their fiscal years in July and end them in June. The excep-tions are New York, which starts its fiscal year on April 1; Texas, with a September 1 start date; and Alabama and Michigan, which start their fiscal years on October 1.”
3 “2020 State Expenditure Report.” National Association of State Budget Officers, 2010. p. 2.
2022, 56 percent is for health programs, with most of the funding for Medicaid. Beyond health programs, 15 percent of Federal aid is estimated to go to income secu-rity programs; 8 percent to transportation programs; 12 percent to education, training, and social services; and 9 percent for all other functions.
The Federal budget also classifies grant spending by BEA category—discretionary or mandatory.4 Funding for discretionary grant programs is determined annually through appropriations acts. Outlays for discretionary grant programs account for 31 percent of total grant spending in 2020. Funding for mandatory programs is provided directly in authorizing legislation that estab-lishes eligibility criteria or benefit formulas; funding for mandatory programs usually is not limited by the annual appropriations process. Outlays for mandatory grant pro-grams account for 69 percent of total grant spending in 2020. Section B of Table 11-1 shows the distribution of grants between mandatory and discretionary spending.
Since much of this budget authority will outlay in future fiscal years, the increase in outlays in 2022 is considerably smaller then will increase over the next couple years. In 2022, grants provided from discretionary funding are esti-mated to have outlays of $360 billion, an increase of roughly one percent from 2021. The three largest discretionary pro-grams in 2022 are estimated to be Federal-aid Highways programs, with outlays of $46 billion; Tenant Based Rental Assistance, with outlays of $30 billion; and Education for the Disadvantaged (Title 1), with outlays of $56 billion.5
In 2022, outlays for mandatory grant programs are es-timated to be $751 billion, an increase of 8 percent from spending in 2021, which is estimated to be $695 billion. Medicaid is by far the largest mandatory grant program with estimated outlays of $571 billion in 2022. After Medicaid, the three largest mandatory grant programs by outlays in 2022 are: Child Nutrition programs, which in-clude the School Breakfast Program, the National School Lunch Program and others, $32 billion; the Temporary Assistance for Needy Families program, $17 billion; and the Children’s Health Insurance Program, $17 billion.6
Federal spending by State for major grants, includ-ing the programs mentioned above, may be found on the OMB website at www.whitehouse.gov/omb/Analytical-Perspectives/. This supplemental material includes two
4 For more information on these categories, see Chapter 6, “Budget Concepts,’’ in this volume.
5 Obligation data by State for programs in each of these budget ac-counts may be found in the State-by-State tables included with other Budget materials on the OMB website.
6 Obligation data by State for programs in each of these budget ac-counts may be found in the State-by-State tables included with other budget materials on the OMB web site.7 https://www.cfo.gov/wp-con-tent/uploads/2021/Managing-for-Results-Performance-Management-Playbook-for-Federal-Awarding-Agencies.pdf.
150ANALYTICAL PERSPECTIVES
tables that summarize State-by-State spending for major grant programs, one summarizing obligations for each program by agency and bureau, and another summariz-ing total obligation across all programs for each State, followed by 45 individual tables showing State-by-State obligation data for each grant program. The programs shown in these State-by-State tables cover 95 percent of total grants to State and local governments.
In 2020 and 2021, the Federal government provided significant financial assistance to State, local, tribal and territorial governments to help them respond to the health and economic crises caused by the COVID-19 pan-demic. Most recently, the American Rescue Plan Act of 2021 (ARP) included funding to set up community vacci-nation sites, scale up testing and tracing, eliminate supply shortage problems, invest in high-quality treatments, and address disparities in obtaining quality healthcare.
The Administration is committed to effective im-plementation and strong stewardship of these ARP funds. To support this effort, on March 19 OMB issued M-21-20 to provide guidance to Federal agencies on the equity and accountability requirements for the Federal assistance programs in the Act. OMB has also worked to provide temporary emergency administrative relief to Federal agencies and recipients for the administration of grants and cooperative agreements. Going forward, the Administration will continue to take proactive steps to foster accountability, performance, and public trust in these ARP programs, while implementing sound financial management of these resources.
OTHER SOURCES OF INFORMATION ON FEDERAL GRANTS
A number of other sources provide State-by-State spending data and other information on Federal grants, but may use a broader definition of grants beyond what is included in this chapter.
The website Grants.gov is a primary source of infor-mation for communities wishing to apply for grants and other financial assistance. Grants.gov hosts all competi-tive open notices of opportunities to apply for Federal grants.
The System for Award Management hosted by the General Services Administration contains detailed Assistance Listings (formerly known as the Catalog of Federal Domestic Assistance) of grant and other as-sistance programs; discussions of eligibility criteria, application procedures, and estimated obligations; and related information. The Assistance Listings are avail-able on the internet at https://beta.sam.gov.
Current and updated grant receipt information by State and local governments and other non-Federal en-tities can be found on USASpending.gov. This public website includes additional detail on Federal spending, including contract and loan information.
The Federal Audit Clearinghouse maintains an online database (https://harvester.census.gov/facweb/) that provides public access to audit reports conducted un-der OMB guidance located at 2 CFR part 200, Uniform Administrative Requirements, Cost Principles, and Audit Requirements for Federal Awards. Information is avail-able for each audited entity, including the amount of Federal money expended by program and whether there were audit findings.
The Bureau of Economic Analysis, in the Department of Commerce, produces the monthly Survey of Current Business, which provides data on the National income and product accounts (NIPA), a broad statistical concept encompassing the entire economy. These accounts, which are available at bea.gov/national, include data on Federal grants to State and local governments.
In addition, information on grants and awards can be found through individual Federal Agencies’ websites:7
7 https://www.cfo.gov/wp-content/uploads/2021/Managing-for-Re-sults-Performance-Management-Playbook-for-Federal-Awarding-Agen-cies.pdf.

11. AID TO STATE AND LOCAL GOVERNMENTS 151
• USDA Current Research Information System, https://cris.nifa.usda.gov/DOD Medical Research Programs, https://cdmrp.army.mil/search.aspx
• Department of Education, Institute of Education Sciences, Funded Research Grants and Contracts, https://www2.ed.gov/fund/grants-apply.html
• Department of Health and Human Services (HHS) Grants, https://www.hhs.gov/grants/grants/in-dex.html
• HHS Tracking Accountability in Government Grants System (TAGGS), https://taggs.hhs.gov/Advanced-Search.cfm
• National Institutes of Health (NIH) Grants and Funding, https://grants.nih.gov/funding/index.htm
• Department of Housing and Urban Development Grants, https://www.hud.gov/program_offices/spm/gmomgmt/grantsinfo
• Department of Justice Grants, https://www.justice.gov/grants
• Department of Labor Employment and Training Ad-ministration (ETA), Grants Awarded, https://www.doleta.gov/grants/grants_awarded.cfm
• Department of Transportation Grants, https://www.transportation.gov/grants
• Environmental Protection Agency (EPA), https://www.epa.gov/grants
• National Library of Medicine (NLM), Health Servic-es Research Projects in Progress (HSRProj), https://wwwcf.nlm.nih.gov/hsr_project/home_proj.cfm
• National Science Foundation (NSF) Awards, https://www.nsf.gov/awardsearch/
• Small Business Innovation Research (SBIR) and Small Business Technology Transfer (STTR) Awards, https://www.sbir.gov/sbirsearch/award/all
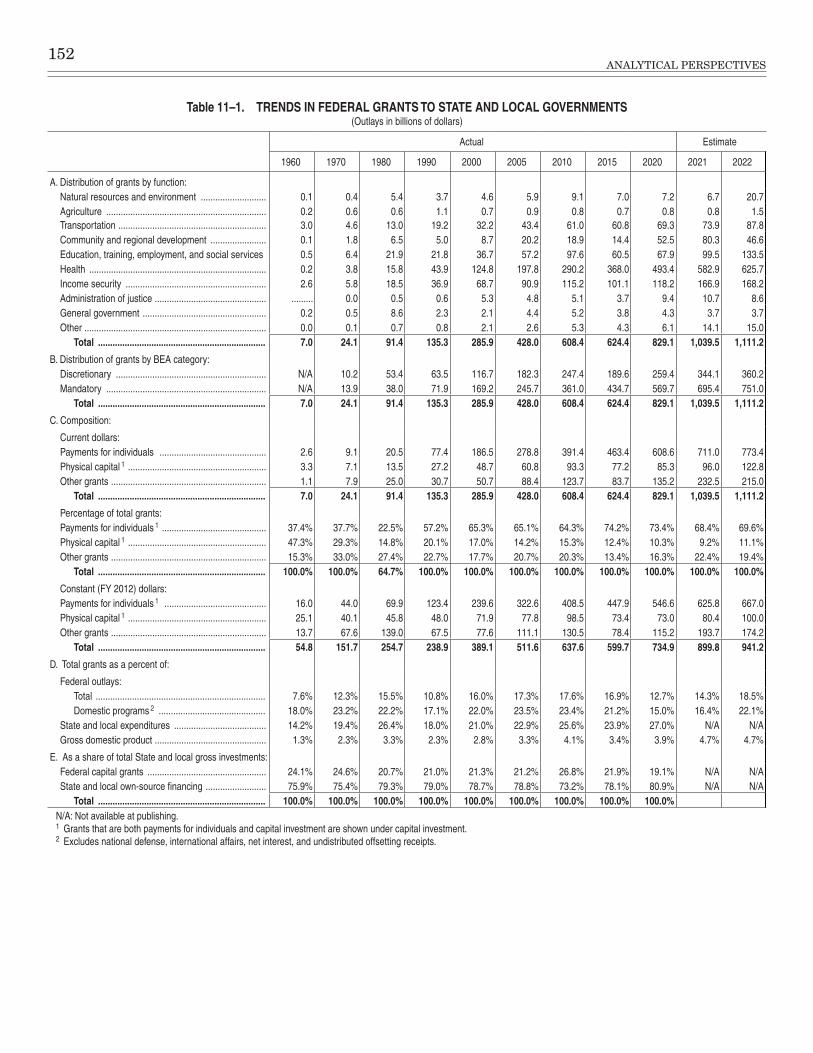
152ANALYTICAL PERSPECTIVES
Table 11–1. TRENDS IN FEDERAL GRANTS TO STATE AND LOCAL GOVERNMENTS(Outlays in billions of dollars)
Actual Estimate
1960 1970 1980 1990 2000 2005 2010 2015 2020 2021 2022
A� Distribution of grants by function:Natural resources and environment ��������������������������� 0�1 0�4 5�4 3�7 4�6 5�9 9�1 7�0 7�2 6�7 20�7Agriculture ������������������������������������������������������������������ 0�2 0�6 0�6 1�1 0�7 0�9 0�8 0�7 0�8 0�8 1�5Transportation ������������������������������������������������������������� 3�0 4�6 13�0 19�2 32�2 43�4 61�0 60�8 69�3 73�9 87�8Community and regional development ����������������������� 0�1 1�8 6�5 5�0 8�7 20�2 18�9 14�4 52�5 80�3 46�6Education, training, employment, and social services 0�5 6�4 21�9 21�8 36�7 57�2 97�6 60�5 67�9 99�5 133�5Health ������������������������������������������������������������������������� 0�2 3�8 15�8 43�9 124�8 197�8 290�2 368�0 493�4 582�9 625�7Income security ���������������������������������������������������������� 2�6 5�8 18�5 36�9 68�7 90�9 115�2 101�1 118�2 166�9 168�2Administration of justice ���������������������������������������������� ��������� 0�0 0�5 0�6 5�3 4�8 5�1 3�7 9�4 10�7 8�6General government ��������������������������������������������������� 0�2 0�5 8�6 2�3 2�1 4�4 5�2 3�8 4�3 3�7 3�7Other ��������������������������������������������������������������������������� 0�0 0�1 0�7 0�8 2�1 2�6 5�3 4�3 6�1 14�1 15�0
Total ..................................................................... 7.0 24.1 91.4 135.3 285.9 428.0 608.4 624.4 829.1 1,039.5 1,111.2
B� Distribution of grants by BEA category:Discretionary �������������������������������������������������������������� N/A 10�2 53�4 63�5 116�7 182�3 247�4 189�6 259�4 344�1 360�2Mandatory ������������������������������������������������������������������ N/A 13�9 38�0 71�9 169�2 245�7 361�0 434�7 569�7 695�4 751�0
Total ..................................................................... 7.0 24.1 91.4 135.3 285.9 428.0 608.4 624.4 829.1 1,039.5 1,111.2
C� Composition:
Current dollars:Payments for individuals �������������������������������������������� 2�6 9�1 20�5 77�4 186�5 278�8 391�4 463�4 608�6 711�0 773�4Physical capital 1 ��������������������������������������������������������� 3�3 7�1 13�5 27�2 48�7 60�8 93�3 77�2 85�3 96�0 122�8Other grants ���������������������������������������������������������������� 1�1 7�9 25�0 30�7 50�7 88�4 123�7 83�7 135�2 232�5 215�0
Total ..................................................................... 7.0 24.1 91.4 135.3 285.9 428.0 608.4 624.4 829.1 1,039.5 1,111.2
Percentage of total grants:Payments for individuals 1 ������������������������������������������� 37�4% 37�7% 22�5% 57�2% 65�3% 65�1% 64�3% 74�2% 73�4% 68�4% 69�6%Physical capital 1 ��������������������������������������������������������� 47�3% 29�3% 14�8% 20�1% 17�0% 14�2% 15�3% 12�4% 10�3% 9�2% 11�1%Other grants ���������������������������������������������������������������� 15�3% 33�0% 27�4% 22�7% 17�7% 20�7% 20�3% 13�4% 16�3% 22�4% 19�4%
Total ..................................................................... 100.0% 100.0% 64.7% 100.0% 100.0% 100.0% 100.0% 100.0% 100.0% 100.0% 100.0%
Constant (FY 2012) dollars:Payments for individuals 1 ������������������������������������������ 16�0 44�0 69�9 123�4 239�6 322�6 408�5 447�9 546�6 625�8 667�0Physical capital 1 ��������������������������������������������������������� 25�1 40�1 45�8 48�0 71�9 77�8 98�5 73�4 73�0 80�4 100�0Other grants ���������������������������������������������������������������� 13�7 67�6 139�0 67�5 77�6 111�1 130�5 78�4 115�2 193�7 174�2
Total ..................................................................... 54.8 151.7 254.7 238.9 389.1 511.6 637.6 599.7 734.9 899.8 941.2
D� Total grants as a percent of:
Federal outlays:Total ���������������������������������������������������������������������� 7�6% 12�3% 15�5% 10�8% 16�0% 17�3% 17�6% 16�9% 12�7% 14�3% 18�5%Domestic programs 2 �������������������������������������������� 18�0% 23�2% 22�2% 17�1% 22�0% 23�5% 23�4% 21�2% 15�0% 16�4% 22�1%
State and local expenditures �������������������������������������� 14�2% 19�4% 26�4% 18�0% 21�0% 22�9% 25�6% 23�9% 27�0% N/A N/AGross domestic product ���������������������������������������������� 1�3% 2�3% 3�3% 2�3% 2�8% 3�3% 4�1% 3�4% 3�9% 4�7% 4�7%
E� As a share of total State and local gross investments:Federal capital grants ������������������������������������������������� 24�1% 24�6% 20�7% 21�0% 21�3% 21�2% 26�8% 21�9% 19�1% N/A N/AState and local own-source financing ������������������������� 75�9% 75�4% 79�3% 79�0% 78�7% 78�8% 73�2% 78�1% 80�9% N/A N/A
Total ..................................................................... 100.0% 100.0% 100.0% 100.0% 100.0% 100.0% 100.0% 100.0% 100.0%N/A: Not available at publishing�1 Grants that are both payments for individuals and capital investment are shown under capital investment�2 Excludes national defense, international affairs, net interest, and undistributed offsetting receipts�

11. AID TO STATE AND LOCAL GOVERNMENTS 153
Table 11–2. FEDERAL GRANTS TO STATE AND LOCAL GOVERNMENTS—BUDGET AUTHORITY AND OUTLAYS(In millions of dollars)
Function, Category, Agency and ProgramBudget Authority Outlays
2020 Actual 2021 Estimate 2022 Estimate 2020 Actual 2021 Estimate 2022 Estimate
Energy
Discretionary: Department of Energy:
Energy Programs: Energy Efficiency and Renewable Energy ������������������������������������������������������������������ 387 404 863 296 325 511
Mandatory: Department of Energy:
Energy Programs: Energy Efficiency and Renewable Energy ������������������������������������������������������������������ ���������� ���������� 17,300 ���������� ���������� 5,790
Tennessee Valley Authority: Tennessee Valley Authority Fund �������������������������������������������������������������������������������� 528 508 492 528 508 492
Total, mandatory ................................................................................................................ 528 508 17,792 528 508 6,282Total, Energy ...................................................................................................................... 915 912 18,655 824 833 6,793
Natural Resources and Environment
Discretionary: Department of Agriculture:
Farm Service Agency: Grassroots Source Water Protection Program ����������������������������������������������������������� 7 7 7 7 7 7
Natural Resources Conservation Service: Watershed Rehabilitation Program ����������������������������������������������������������������������������� 11 41 ���������� 16 46 51Watershed and Flood Prevention Operations ������������������������������������������������������������� 294 726 148 174 428 88
Forest Service: State and Private Forestry ������������������������������������������������������������������������������������������ 222 219 255 211 420 471
Department of Commerce: National Oceanic and Atmospheric Administration:
Operations, Research, and Facilities �������������������������������������������������������������������������� 109 107 151 107 105 148Pacific Coastal Salmon Recovery ������������������������������������������������������������������������������� 65 65 65 62 92 80
Department of the Interior: Office of Surface Mining Reclamation and Enforcement:
Regulation and Technology ���������������������������������������������������������������������������������������� 69 43 65 64 58 63Abandoned Mine Reclamation Fund �������������������������������������������������������������������������� 115 115 165 50 90 106
United States Geological Survey: Surveys, Investigations, and Research ���������������������������������������������������������������������� 7 8 8 7 7 8
United States Fish and Wildlife Service: Cooperative Endangered Species Conservation Fund ���������������������������������������������� 36 30 43 66 32 44State Wildlife Grants ��������������������������������������������������������������������������������������������������� 68 72 82 62 67 78
National Park Service: National Recreation and Preservation ������������������������������������������������������������������������ 71 74 75 61 85 81Land Acquisition and State Assistance ���������������������������������������������������������������������� 140 –23 ���������� 35 90 139Historic Preservation Fund ����������������������������������������������������������������������������������������� 119 144 152 82 152 218
Department-Wide Programs: Energy Community Revitalization Program ���������������������������������������������������������������� ���������� ���������� 169 ���������� ���������� 17
Environmental Protection Agency: State and Tribal Assistance Grants ����������������������������������������������������������������������������� 4,546 4,344 5,130 4,019 2,842 3,649Hazardous Substance Superfund ������������������������������������������������������������������������������� 250 250 250 244 244 254Leaking Underground Storage Tank Trust Fund ��������������������������������������������������������� 83 84 83 88 76 79
Total, discretionary ............................................................................................................ 6,212 6,306 6,848 5,355 4,841 5,581
Mandatory: Department of Agriculture:
Farm Service Agency: Grassroots Source Water Protection Program ����������������������������������������������������������� ���������� ���������� ���������� 5 ���������� ����������
Department of Commerce:

154ANALYTICAL PERSPECTIVES
Table 11–2. FEDERAL GRANTS TO STATE AND LOCAL GOVERNMENTS—BUDGET AUTHORITY AND OUTLAYS—Continued(In millions of dollars)
Function, Category, Agency and ProgramBudget Authority Outlays
2020 Actual 2021 Estimate 2022 Estimate 2020 Actual 2021 Estimate 2022 Estimate
National Oceanic and Atmospheric Administration: Gulf Coast Ecosystem Restoration Science, Observation, Monitoring, and
Technology ������������������������������������������������������������������������������������������������������������ 6 6 6 6 6 6Department of the Interior:
Bureau of Land Management: Miscellaneous Permanent Payment Accounts ������������������������������������������������������������ 59 28 48 58 25 35
Office of Surface Mining Reclamation and Enforcement: Payments to States in Lieu of Coal Fee Receipts ������������������������������������������������������� ���������� ���������� ���������� ���������� 10 7Abandoned Mine Reclamation Fund �������������������������������������������������������������������������� 129 115 112 148 143 131
United States Fish and Wildlife Service: Federal Aid in Wildlife Restoration ������������������������������������������������������������������������������ 672 725 847 751 775 810Cooperative Endangered Species Conservation Fund ���������������������������������������������� 66 86 90 66 78 84Coastal Impact Assistance ����������������������������������������������������������������������������������������� ���������� ���������� ���������� ���������� 1 1Sport Fish Restoration ������������������������������������������������������������������������������������������������ 458 513 498 421 469 504
National Park Service: Land Acquisition and State Assistance ���������������������������������������������������������������������� 115 507 519 8 55 137
Departmental Offices: National Forests Fund, Payment to States ����������������������������������������������������������������� 4 4 5 4 4 5Leases of Lands Acquired for Flood Control, Navigation, and Allied Purpos es �������� 35 28 30 35 28 30States Share from Certain Gulf of Mexico Leases ����������������������������������������������������� 353 249 363 353 249 363
Corps of Engineers--Civil Works: South Dakota Terrestrial Wildlife Habitat Restoration Trust Fund ������������������������������� 2 2 3 1 2 2
Environmental Protection Agency: State and Tribal Assistance Grants ����������������������������������������������������������������������������� ���������� ���������� 25,400 ���������� ���������� 12,700Environmental Programs and Management ��������������������������������������������������������������� ���������� 43 540 ���������� 3 282
Total, mandatory ................................................................................................................ 1,899 2,306 28,461 1,856 1,848 15,097Total, Natural Resources and Environment .................................................................... 8,111 8,612 35,309 7,211 6,689 20,678
Agriculture
Discretionary: Department of Agriculture:
National Institute of Food and Agriculture: Extension Activities ����������������������������������������������������������������������������������������������������� 446 562 ���������� 429 380 492
National Institute of Food and Agriculture ���������������������������������������������������������������������� ���������� ���������� 979 ���������� ���������� 536Research and Education Activities ����������������������������������������������������������������������������� 373 389 ���������� 292 328 333
Agricultural Marketing Service: Payments to States and Possessions ������������������������������������������������������������������������� 1 6 ���������� 1 6 ����������
Farm Service Agency: State Mediation Grants ����������������������������������������������������������������������������������������������� 6 7 7 5 7 7
Total, discretionary ............................................................................................................ 826 964 986 727 721 1,368
Mandatory: Department of Agriculture:
Agricultural Marketing Service: Payments to States and Possessions ������������������������������������������������������������������������� 80 185 85 77 92 85
Total, Agriculture ............................................................................................................... 906 1,149 1,071 804 813 1,453
Commerce and Housing Credit
Discretionary: Department of Commerce:
National Oceanic and Atmospheric Administration: Fisheries Disaster Assistance ������������������������������������������������������������������������������������ 300 300 ���������� 85 390 380
Mandatory: Department of Commerce:
National Telecommunications and Information Administration:
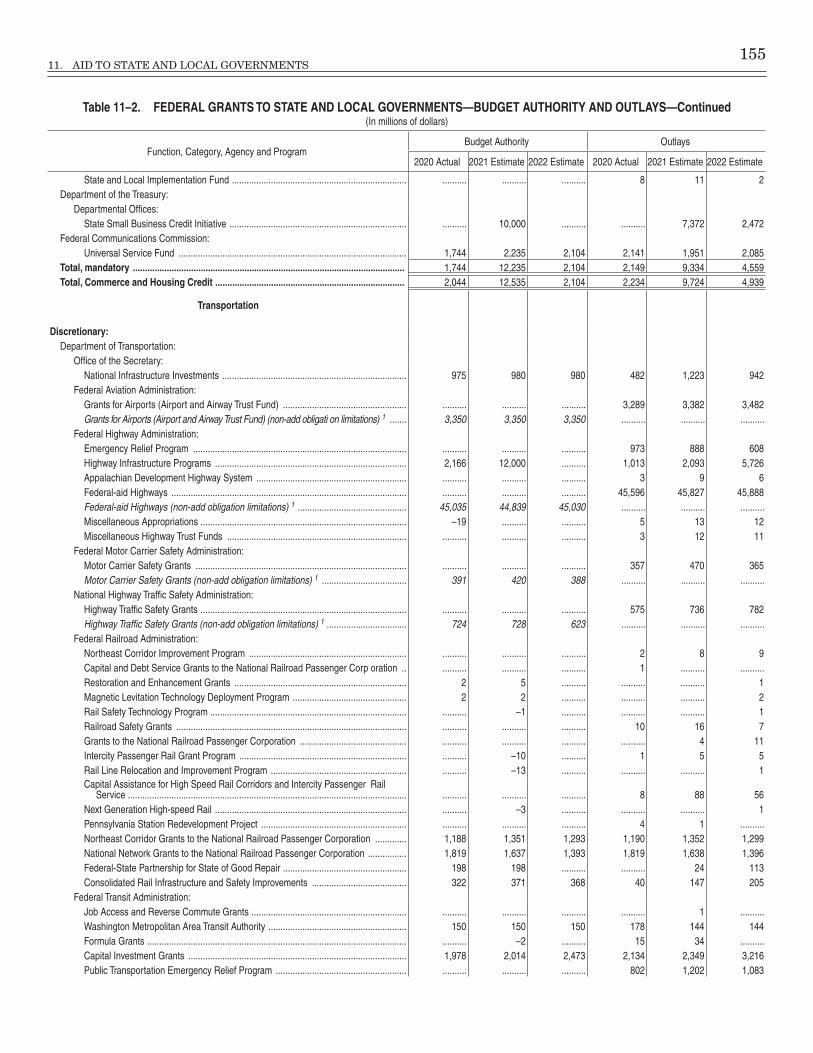
11. AID TO STATE AND LOCAL GOVERNMENTS 155
Table 11–2. FEDERAL GRANTS TO STATE AND LOCAL GOVERNMENTS—BUDGET AUTHORITY AND OUTLAYS—Continued(In millions of dollars)
Function, Category, Agency and ProgramBudget Authority Outlays
2020 Actual 2021 Estimate 2022 Estimate 2020 Actual 2021 Estimate 2022 Estimate
State and Local Implementation Fund ������������������������������������������������������������������������ ���������� ���������� ���������� 8 11 2Department of the Treasury:
Departmental Offices: State Small Business Credit Initiative ������������������������������������������������������������������������� ���������� 10,000 ���������� ���������� 7,372 2,472
Federal Communications Commission: Universal Service Fund ���������������������������������������������������������������������������������������������� 1,744 2,235 2,104 2,141 1,951 2,085
Total, mandatory ................................................................................................................ 1,744 12,235 2,104 2,149 9,334 4,559Total, Commerce and Housing Credit .............................................................................. 2,044 12,535 2,104 2,234 9,724 4,939
Transportation
Discretionary: Department of Transportation:
Office of the Secretary: National Infrastructure Investments ���������������������������������������������������������������������������� 975 980 980 482 1,223 942
Federal Aviation Administration: Grants for Airports (Airport and Airway Trust Fund) ��������������������������������������������������� ���������� ���������� ���������� 3,289 3,382 3,482Grants for Airports (Airport and Airway Trust Fund) (non-add obligati on limitations) 1 ������� 3,350 3,350 3,350 ���������� ���������� ����������
Federal Highway Administration: Emergency Relief Program ���������������������������������������������������������������������������������������� ���������� ���������� ���������� 973 888 608Highway Infrastructure Programs ������������������������������������������������������������������������������� 2,166 12,000 ���������� 1,013 2,093 5,726Appalachian Development Highway System �������������������������������������������������������������� ���������� ���������� ���������� 3 9 6Federal-aid Highways ������������������������������������������������������������������������������������������������� ���������� ���������� ���������� 45,596 45,827 45,888Federal-aid Highways (non-add obligation limitations) 1 ��������������������������������������������� 45,035 44,839 45,030 ���������� ���������� ����������Miscellaneous Appropriations ������������������������������������������������������������������������������������� –19 ���������� ���������� 5 13 12Miscellaneous Highway Trust Funds �������������������������������������������������������������������������� ���������� ���������� ���������� 3 12 11
Federal Motor Carrier Safety Administration: Motor Carrier Safety Grants ��������������������������������������������������������������������������������������� ���������� ���������� ���������� 357 470 365Motor Carrier Safety Grants (non-add obligation limitations) 1 ����������������������������������� 391 420 388 ���������� ���������� ����������
National Highway Traffic Safety Administration: Highway Traffic Safety Grants ������������������������������������������������������������������������������������� ���������� ���������� ���������� 575 736 782Highway Traffic Safety Grants (non-add obligation limitations) 1 ��������������������������������� 724 728 623 ���������� ���������� ����������
Federal Railroad Administration: Northeast Corridor Improvement Program ����������������������������������������������������������������� ���������� ���������� ���������� 2 8 9Capital and Debt Service Grants to the National Railroad Passenger Corp oration �� ���������� ���������� ���������� 1 ���������� ����������Restoration and Enhancement Grants ����������������������������������������������������������������������� 2 5 ���������� ���������� ���������� 1Magnetic Levitation Technology Deployment Program ����������������������������������������������� 2 2 ���������� ���������� ���������� 2Rail Safety Technology Program ��������������������������������������������������������������������������������� ���������� –1 ���������� ���������� ���������� 1Railroad Safety Grants ����������������������������������������������������������������������������������������������� ���������� ���������� ���������� 10 16 7Grants to the National Railroad Passenger Corporation �������������������������������������������� ���������� ���������� ���������� ���������� 4 11Intercity Passenger Rail Grant Program ��������������������������������������������������������������������� ���������� –10 ���������� 1 5 5Rail Line Relocation and Improvement Program �������������������������������������������������������� ���������� –13 ���������� ���������� ���������� 1Capital Assistance for High Speed Rail Corridors and Intercity Passenger Rail
Service ������������������������������������������������������������������������������������������������������������������� ���������� ���������� ���������� 8 88 56Next Generation High-speed Rail ������������������������������������������������������������������������������� ���������� –3 ���������� ���������� ���������� 1Pennsylvania Station Redevelopment Project ������������������������������������������������������������ ���������� ���������� ���������� 4 1 ����������Northeast Corridor Grants to the National Railroad Passenger Corporation ������������� 1,188 1,351 1,293 1,190 1,352 1,299National Network Grants to the National Railroad Passenger Corporation ���������������� 1,819 1,637 1,393 1,819 1,638 1,396Federal-State Partnership for State of Good Repair ��������������������������������������������������� 198 198 ���������� ���������� 24 113Consolidated Rail Infrastructure and Safety Improvements ��������������������������������������� 322 371 368 40 147 205
Federal Transit Administration: Job Access and Reverse Commute Grants ���������������������������������������������������������������� ���������� ���������� ���������� ���������� 1 ����������Washington Metropolitan Area Transit Authority ��������������������������������������������������������� 150 150 150 178 144 144Formula Grants ����������������������������������������������������������������������������������������������������������� ���������� –2 ���������� 15 34 ����������Capital Investment Grants ������������������������������������������������������������������������������������������ 1,978 2,014 2,473 2,134 2,349 3,216Public Transportation Emergency Relief Program ������������������������������������������������������ ���������� ���������� ���������� 802 1,202 1,083

156ANALYTICAL PERSPECTIVES
Table 11–2. FEDERAL GRANTS TO STATE AND LOCAL GOVERNMENTS—BUDGET AUTHORITY AND OUTLAYS—Continued(In millions of dollars)
Function, Category, Agency and ProgramBudget Authority Outlays
2020 Actual 2021 Estimate 2022 Estimate 2020 Actual 2021 Estimate 2022 Estimate
Discretionary Grants (Highway Trust Fund, Mass Transit Account) ���������������������������� ���������� ���������� ���������� ���������� 15 ����������Transit Formula Grants ����������������������������������������������������������������������������������������������� ���������� ���������� ���������� 9,909 9,601 9,962Transit Formula Grants (non-add obligation limitations) 1 ������������������������������������������� 11,372 11,450 11,450 ���������� ���������� ����������
Pipeline and Hazardous Materials Safety Administration: Pipeline Safety ������������������������������������������������������������������������������������������������������������ 56 58 56 56 77 69Trust Fund Share of Pipeline Safety ��������������������������������������������������������������������������� 8 8 11 8 8 11
Total, discretionary ............................................................................................................ 8,845 18,745 6,724 68,473 71,367 75,414Total, obligation limitations (non-add) 1 �������������������������������������������������������������������������������� 60,872 60,787 60,841 ���������� ���������� ����������
Mandatory: Department of Homeland Security:
United States Coast Guard: Boat Safety ����������������������������������������������������������������������������������������������������������������� 112 126 119 105 119 119
Department of Transportation: American Jobs Plan Funding for Transportation Infrastructure ����������������������������������� ���������� ���������� 75,740 ���������� ���������� 11,576
Federal Aviation Administration: Grants for Airports (Airport and Airway Trust Fund) ��������������������������������������������������� 3,579 5,575 3,168 ���������� ���������� ����������
Federal Highway Administration: Federal-aid Highways ������������������������������������������������������������������������������������������������� 45,350 45,283 45,343 731 742 726Miscellaneous Appropriations ������������������������������������������������������������������������������������� –1 ���������� ���������� ���������� ���������� ����������
Federal Motor Carrier Safety Administration: Motor Carrier Safety Grants ��������������������������������������������������������������������������������������� 388 388 388 ���������� ���������� ����������
National Highway Traffic Safety Administration: Highway Traffic Safety Grants ������������������������������������������������������������������������������������� 661 665 560 ���������� ���������� ����������
Federal Railroad Administration: Northeast Corridor Grants to the National Railroad Passenger Corporation ������������� ���������� 969 ���������� ���������� 969 ����������National Network Grants to the National Railroad Passenger Corporation ���������������� ���������� 729 ���������� ���������� 729 ����������
Federal Transit Administration: Transit Formula Grants ����������������������������������������������������������������������������������������������� 11,344 11,422 11,422 ���������� ���������� ����������
Total, mandatory ................................................................................................................ 61,433 65,157 136,740 836 2,559 12,421Total, Transportation .......................................................................................................... 70,278 83,902 143,464 69,309 73,926 87,835
Community and Regional Development
Discretionary: Department of Agriculture:
Rural Utilities Service: Distance Learning, Telemedicine, and Broadband Program �������������������������������������� 470 555 672 72 447 566Rural Water and Waste Disposal Program Account ��������������������������������������������������� 657 617 717 614 741 802
Rural Housing Service: Rural Community Facilities Program Account ������������������������������������������������������������ 86 60 60 61 65 53
Rural Business-Cooperative Service: Rural Business Program Account ������������������������������������������������������������������������������� 92 61 81 58 78 84
Department of Commerce: Economic Development Administration:
Economic Development Assistance Programs ����������������������������������������������������������� 1,763 3,296 359 302 1,046 1,748Department of Homeland Security:
Federal Emergency Management Agency: Federal Assistance ����������������������������������������������������������������������������������������������������� 3,025 2,915 2,905 2,023 2,047 2,872State and Local Programs ������������������������������������������������������������������������������������������ ���������� ���������� ���������� 273 131 ����������Disaster Relief Fund ��������������������������������������������������������������������������������������������������� 62,546 18,892 19,299 43,317 40,738 12,503
Department of Housing and Urban Development: Community Planning and Development:
Community Development Fund ���������������������������������������������������������������������������������� 8,425 3,475 3,770 5,235 9,196 9,676Brownfields Redevelopment ��������������������������������������������������������������������������������������� ���������� ���������� ���������� ���������� 2 1
Office of Lead Hazard Control and Healthy Homes:
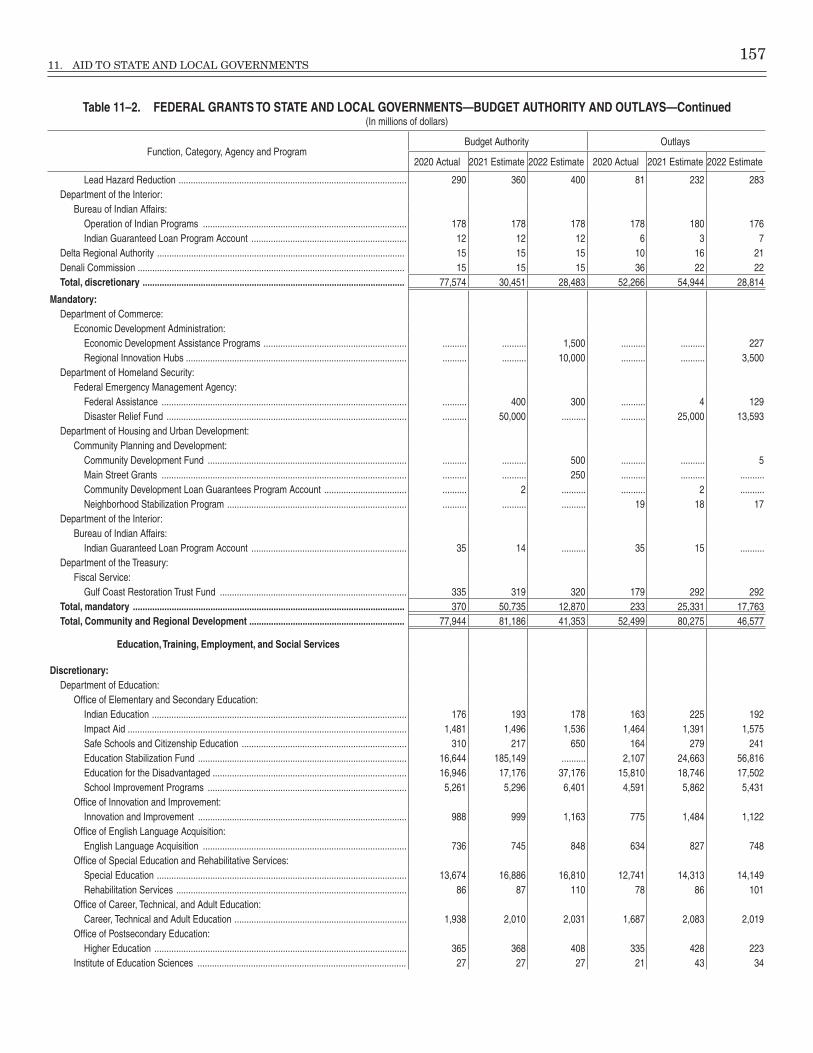
11. AID TO STATE AND LOCAL GOVERNMENTS 157
Table 11–2. FEDERAL GRANTS TO STATE AND LOCAL GOVERNMENTS—BUDGET AUTHORITY AND OUTLAYS—Continued(In millions of dollars)
Function, Category, Agency and ProgramBudget Authority Outlays
2020 Actual 2021 Estimate 2022 Estimate 2020 Actual 2021 Estimate 2022 Estimate
Lead Hazard Reduction ���������������������������������������������������������������������������������������������� 290 360 400 81 232 283Department of the Interior:
Bureau of Indian Affairs: Operation of Indian Programs ������������������������������������������������������������������������������������ 178 178 178 178 180 176Indian Guaranteed Loan Program Account ���������������������������������������������������������������� 12 12 12 6 3 7
Delta Regional Authority ������������������������������������������������������������������������������������������������������ 15 15 15 10 16 21Denali Commission �������������������������������������������������������������������������������������������������������������� 15 15 15 36 22 22Total, discretionary ............................................................................................................ 77,574 30,451 28,483 52,266 54,944 28,814
Mandatory: Department of Commerce:
Economic Development Administration: Economic Development Assistance Programs ����������������������������������������������������������� ���������� ���������� 1,500 ���������� ���������� 227Regional Innovation Hubs ������������������������������������������������������������������������������������������� ���������� ���������� 10,000 ���������� ���������� 3,500
Department of Homeland Security: Federal Emergency Management Agency:
Federal Assistance ����������������������������������������������������������������������������������������������������� ���������� 400 300 ���������� 4 129Disaster Relief Fund ��������������������������������������������������������������������������������������������������� ���������� 50,000 ���������� ���������� 25,000 13,593
Department of Housing and Urban Development: Community Planning and Development:
Community Development Fund ���������������������������������������������������������������������������������� ���������� ���������� 500 ���������� ���������� 5Main Street Grants ����������������������������������������������������������������������������������������������������� ���������� ���������� 250 ���������� ���������� ����������Community Development Loan Guarantees Program Account ���������������������������������� ���������� 2 ���������� ���������� 2 ����������Neighborhood Stabilization Program �������������������������������������������������������������������������� ���������� ���������� ���������� 19 18 17
Department of the Interior: Bureau of Indian Affairs:
Indian Guaranteed Loan Program Account ���������������������������������������������������������������� 35 14 ���������� 35 15 ����������Department of the Treasury:
Fiscal Service: Gulf Coast Restoration Trust Fund ����������������������������������������������������������������������������� 335 319 320 179 292 292
Total, mandatory ................................................................................................................ 370 50,735 12,870 233 25,331 17,763Total, Community and Regional Development ................................................................ 77,944 81,186 41,353 52,499 80,275 46,577
Education, Training, Employment, and Social Services
Discretionary: Department of Education:
Office of Elementary and Secondary Education: Indian Education ��������������������������������������������������������������������������������������������������������� 176 193 178 163 225 192Impact Aid ������������������������������������������������������������������������������������������������������������������� 1,481 1,496 1,536 1,464 1,391 1,575Safe Schools and Citizenship Education �������������������������������������������������������������������� 310 217 650 164 279 241Education Stabilization Fund �������������������������������������������������������������������������������������� 16,644 185,149 ���������� 2,107 24,663 56,816Education for the Disadvantaged �������������������������������������������������������������������������������� 16,946 17,176 37,176 15,810 18,746 17,502School Improvement Programs ���������������������������������������������������������������������������������� 5,261 5,296 6,401 4,591 5,862 5,431
Office of Innovation and Improvement: Innovation and Improvement �������������������������������������������������������������������������������������� 988 999 1,163 775 1,484 1,122
Office of English Language Acquisition: English Language Acquisition ������������������������������������������������������������������������������������ 736 745 848 634 827 748
Office of Special Education and Rehabilitative Services: Special Education ������������������������������������������������������������������������������������������������������� 13,674 16,886 16,810 12,741 14,313 14,149Rehabilitation Services ����������������������������������������������������������������������������������������������� 86 87 110 78 86 101
Office of Career, Technical, and Adult Education: Career, Technical and Adult Education ����������������������������������������������������������������������� 1,938 2,010 2,031 1,687 2,083 2,019
Office of Postsecondary Education: Higher Education �������������������������������������������������������������������������������������������������������� 365 368 408 335 428 223
Institute of Education Sciences �������������������������������������������������������������������������������������� 27 27 27 21 43 34
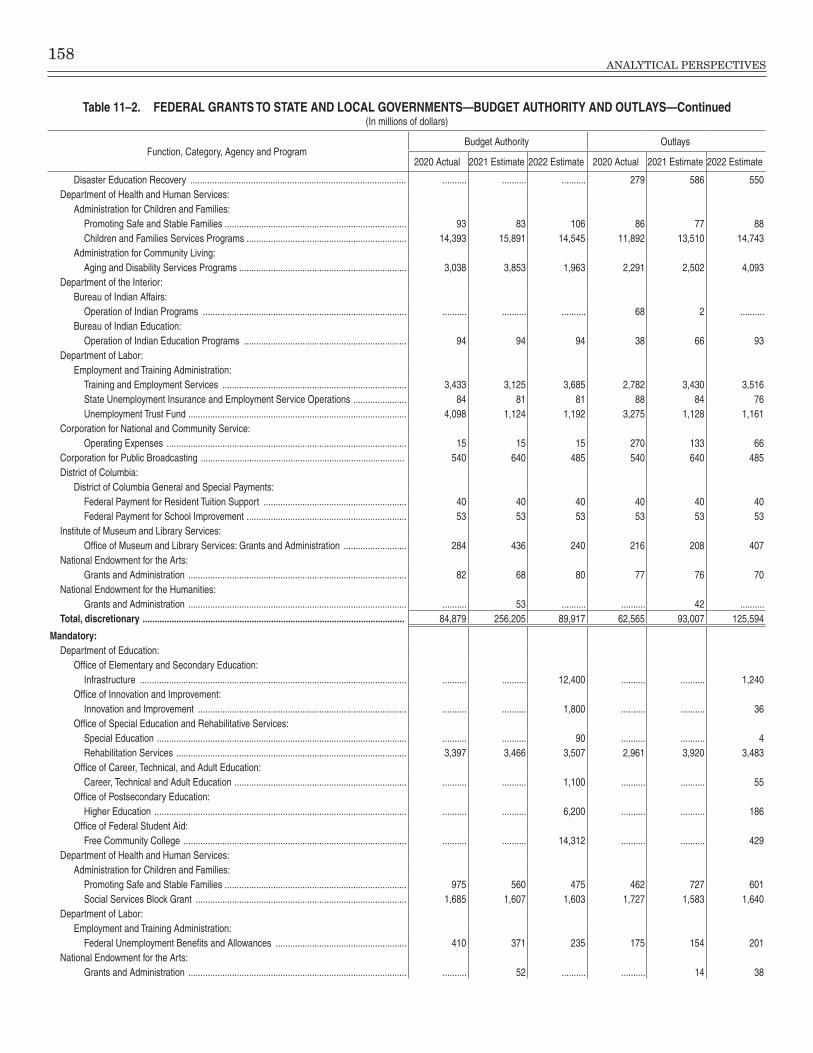
158ANALYTICAL PERSPECTIVES
Table 11–2. FEDERAL GRANTS TO STATE AND LOCAL GOVERNMENTS—BUDGET AUTHORITY AND OUTLAYS—Continued(In millions of dollars)
Function, Category, Agency and ProgramBudget Authority Outlays
2020 Actual 2021 Estimate 2022 Estimate 2020 Actual 2021 Estimate 2022 Estimate
Disaster Education Recovery ����������������������������������������������������������������������������������������� ���������� ���������� ���������� 279 586 550Department of Health and Human Services:
Administration for Children and Families: Promoting Safe and Stable Families ��������������������������������������������������������������������������� 93 83 106 86 77 88Children and Families Services Programs ������������������������������������������������������������������ 14,393 15,891 14,545 11,892 13,510 14,743
Administration for Community Living: Aging and Disability Services Programs ��������������������������������������������������������������������� 3,038 3,853 1,963 2,291 2,502 4,093
Department of the Interior: Bureau of Indian Affairs:
Operation of Indian Programs ������������������������������������������������������������������������������������ ���������� ���������� ���������� 68 2 ����������Bureau of Indian Education:
Operation of Indian Education Programs ������������������������������������������������������������������� 94 94 94 38 66 93Department of Labor:
Employment and Training Administration: Training and Employment Services ���������������������������������������������������������������������������� 3,433 3,125 3,685 2,782 3,430 3,516State Unemployment Insurance and Employment Service Operations ���������������������� 84 81 81 88 84 76Unemployment Trust Fund ������������������������������������������������������������������������������������������ 4,098 1,124 1,192 3,275 1,128 1,161
Corporation for National and Community Service: Operating Expenses ��������������������������������������������������������������������������������������������������� 15 15 15 270 133 66
Corporation for Public Broadcasting ������������������������������������������������������������������������������������ 540 640 485 540 640 485District of Columbia:
District of Columbia General and Special Payments: Federal Payment for Resident Tuition Support ����������������������������������������������������������� 40 40 40 40 40 40Federal Payment for School Improvement ������������������������������������������������������������������ 53 53 53 53 53 53
Institute of Museum and Library Services: Office of Museum and Library Services: Grants and Administration �������������������������� 284 436 240 216 208 407
National Endowment for the Arts: Grants and Administration ������������������������������������������������������������������������������������������ 82 68 80 77 76 70
National Endowment for the Humanities: Grants and Administration ������������������������������������������������������������������������������������������ ���������� 53 ���������� ���������� 42 ����������
Total, discretionary ............................................................................................................ 84,879 256,205 89,917 62,565 93,007 125,594
Mandatory: Department of Education:
Office of Elementary and Secondary Education: Infrastructure �������������������������������������������������������������������������������������������������������������� ���������� ���������� 12,400 ���������� ���������� 1,240
Office of Innovation and Improvement: Innovation and Improvement �������������������������������������������������������������������������������������� ���������� ���������� 1,800 ���������� ���������� 36
Office of Special Education and Rehabilitative Services: Special Education ������������������������������������������������������������������������������������������������������� ���������� ���������� 90 ���������� ���������� 4Rehabilitation Services ����������������������������������������������������������������������������������������������� 3,397 3,466 3,507 2,961 3,920 3,483
Office of Career, Technical, and Adult Education: Career, Technical and Adult Education ����������������������������������������������������������������������� ���������� ���������� 1,100 ���������� ���������� 55
Office of Postsecondary Education: Higher Education �������������������������������������������������������������������������������������������������������� ���������� ���������� 6,200 ���������� ���������� 186
Office of Federal Student Aid: Free Community College �������������������������������������������������������������������������������������������� ���������� ���������� 14,312 ���������� ���������� 429
Department of Health and Human Services: Administration for Children and Families:
Promoting Safe and Stable Families ��������������������������������������������������������������������������� 975 560 475 462 727 601Social Services Block Grant ��������������������������������������������������������������������������������������� 1,685 1,607 1,603 1,727 1,583 1,640
Department of Labor: Employment and Training Administration:
Federal Unemployment Benefits and Allowances ������������������������������������������������������ 410 371 235 175 154 201National Endowment for the Arts:
Grants and Administration ������������������������������������������������������������������������������������������ ���������� 52 ���������� ���������� 14 38
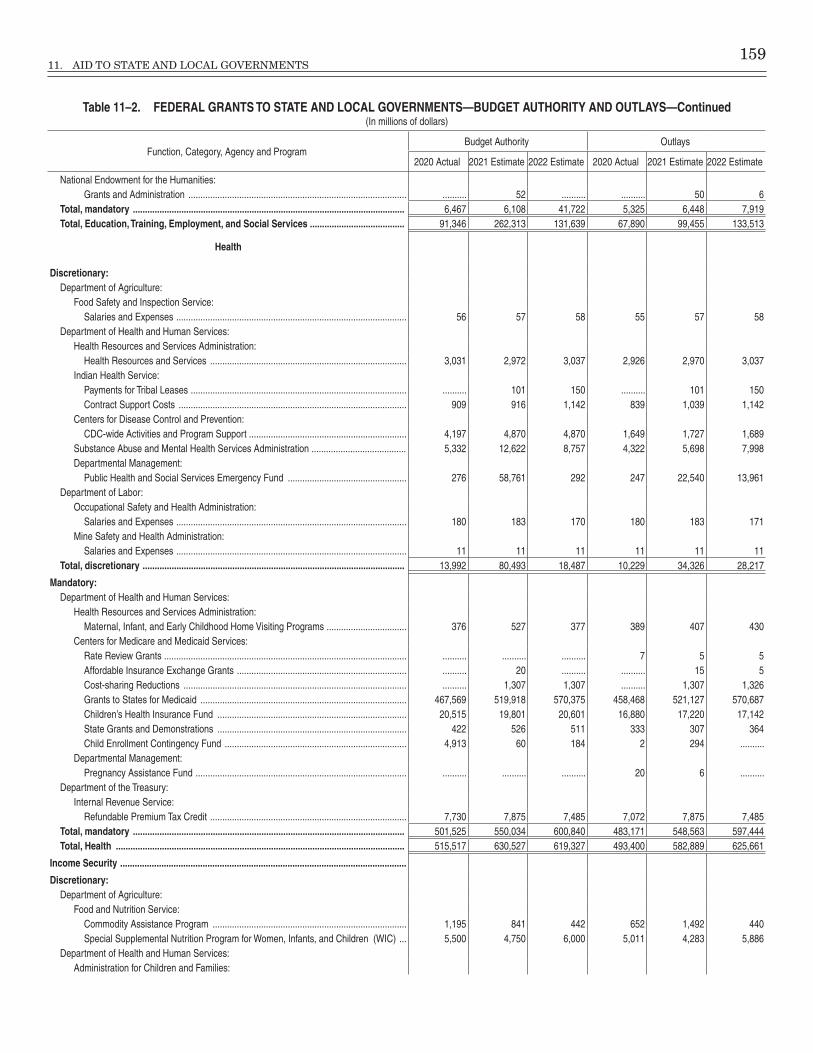
11. AID TO STATE AND LOCAL GOVERNMENTS 159
Table 11–2. FEDERAL GRANTS TO STATE AND LOCAL GOVERNMENTS—BUDGET AUTHORITY AND OUTLAYS—Continued(In millions of dollars)
Function, Category, Agency and ProgramBudget Authority Outlays
2020 Actual 2021 Estimate 2022 Estimate 2020 Actual 2021 Estimate 2022 Estimate
National Endowment for the Humanities: Grants and Administration ������������������������������������������������������������������������������������������ ���������� 52 ���������� ���������� 50 6
Total, mandatory ................................................................................................................ 6,467 6,108 41,722 5,325 6,448 7,919Total, Education, Training, Employment, and Social Services ....................................... 91,346 262,313 131,639 67,890 99,455 133,513
Health
Discretionary: Department of Agriculture:
Food Safety and Inspection Service: Salaries and Expenses ����������������������������������������������������������������������������������������������� 56 57 58 55 57 58
Department of Health and Human Services: Health Resources and Services Administration:
Health Resources and Services ��������������������������������������������������������������������������������� 3,031 2,972 3,037 2,926 2,970 3,037Indian Health Service:
Payments for Tribal Leases ����������������������������������������������������������������������������������������� ���������� 101 150 ���������� 101 150Contract Support Costs ���������������������������������������������������������������������������������������������� 909 916 1,142 839 1,039 1,142
Centers for Disease Control and Prevention: CDC-wide Activities and Program Support ����������������������������������������������������������������� 4,197 4,870 4,870 1,649 1,727 1,689
Substance Abuse and Mental Health Services Administration ��������������������������������������� 5,332 12,622 8,757 4,322 5,698 7,998Departmental Management:
Public Health and Social Services Emergency Fund ������������������������������������������������� 276 58,761 292 247 22,540 13,961Department of Labor:
Occupational Safety and Health Administration: Salaries and Expenses ����������������������������������������������������������������������������������������������� 180 183 170 180 183 171
Mine Safety and Health Administration: Salaries and Expenses ����������������������������������������������������������������������������������������������� 11 11 11 11 11 11
Total, discretionary ............................................................................................................ 13,992 80,493 18,487 10,229 34,326 28,217
Mandatory: Department of Health and Human Services:
Health Resources and Services Administration: Maternal, Infant, and Early Childhood Home Visiting Programs ��������������������������������� 376 527 377 389 407 430
Centers for Medicare and Medicaid Services: Rate Review Grants ���������������������������������������������������������������������������������������������������� ���������� ���������� ���������� 7 5 5Affordable Insurance Exchange Grants ���������������������������������������������������������������������� ���������� 20 ���������� ���������� 15 5Cost-sharing Reductions �������������������������������������������������������������������������������������������� ���������� 1,307 1,307 ���������� 1,307 1,326Grants to States for Medicaid ������������������������������������������������������������������������������������� 467,569 519,918 570,375 458,468 521,127 570,687Children’s Health Insurance Fund ������������������������������������������������������������������������������ 20,515 19,801 20,601 16,880 17,220 17,142State Grants and Demonstrations ������������������������������������������������������������������������������ 422 526 511 333 307 364Child Enrollment Contingency Fund ��������������������������������������������������������������������������� 4,913 60 184 2 294 ����������
Departmental Management: Pregnancy Assistance Fund ��������������������������������������������������������������������������������������� ���������� ���������� ���������� 20 6 ����������
Department of the Treasury: Internal Revenue Service:
Refundable Premium Tax Credit ��������������������������������������������������������������������������������� 7,730 7,875 7,485 7,072 7,875 7,485Total, mandatory ................................................................................................................ 501,525 550,034 600,840 483,171 548,563 597,444Total, Health ....................................................................................................................... 515,517 630,527 619,327 493,400 582,889 625,661
Income Security ......................................................................................................................
Discretionary: Department of Agriculture:
Food and Nutrition Service: Commodity Assistance Program �������������������������������������������������������������������������������� 1,195 841 442 652 1,492 440Special Supplemental Nutrition Program for Women, Infants, and Children (WIC) ��� 5,500 4,750 6,000 5,011 4,283 5,886
Department of Health and Human Services: Administration for Children and Families:

160ANALYTICAL PERSPECTIVES
Table 11–2. FEDERAL GRANTS TO STATE AND LOCAL GOVERNMENTS—BUDGET AUTHORITY AND OUTLAYS—Continued(In millions of dollars)
Function, Category, Agency and ProgramBudget Authority Outlays
2020 Actual 2021 Estimate 2022 Estimate 2020 Actual 2021 Estimate 2022 Estimate
Low Income Home Energy Assistance ����������������������������������������������������������������������� 4,640 8,250 3,850 3,812 7,178 5,260Refugee and Entrant Assistance �������������������������������������������������������������������������������� 524 535 1,500 496 2,000 1,925Payments to States for the Child Care and Development Block Grant ����������������������� 9,314 54,899 7,365 7,021 18,299 26,351
Department of Homeland Security: Federal Emergency Management Agency:
Federal Assistance ����������������������������������������������������������������������������������������������������� 325 130 130 251 299 131Emergency Food and Shelter ������������������������������������������������������������������������������������� ���������� ���������� ���������� 2 ���������� ����������
Department of Housing and Urban Development: Public and Indian Housing Programs:
Public Housing Operating Fund ���������������������������������������������������������������������������������� 5,171 ���������� ���������� 4,580 1,833 ����������Revitalization of Severely Distressed Public Housing (HOPE VI) ������������������������������� ���������� ���������� ���������� 4 4 4Native Hawaiian Housing Block Grant ������������������������������������������������������������������������ 2 2 7 1 3 5Tenant Based Rental Assistance �������������������������������������������������������������������������������� 25,171 30,821 30,519 24,632 26,101 30,436Public Housing Capital Fund �������������������������������������������������������������������������������������� 2,839 ���������� ���������� 2,220 2,553 1,823Native American Programs ����������������������������������������������������������������������������������������� 1,124 825 1,000 627 922 946Housing Certificate Fund �������������������������������������������������������������������������������������������� ���������� ���������� ���������� 20 27 15Choice Neighborhoods Initiative ��������������������������������������������������������������������������������� 175 200 250 124 144 185Self-Sufficiency Programs ������������������������������������������������������������������������������������������ 130 155 175 77 105 134Public Housing Fund �������������������������������������������������������������������������������������������������� ���������� 7,687 8,424 ���������� 3,729 5,753
Community Planning and Development: Homeless Assistance Grants ������������������������������������������������������������������������������������� 5,481 1,600 1,867 1,216 2,485 2,574Home Investment Partnership Program ��������������������������������������������������������������������� 1,350 1,350 1,850 827 1,161 1,267Housing Opportunities for Persons with AIDS ������������������������������������������������������������ 475 430 450 317 439 459Permanent Supportive Housing ���������������������������������������������������������������������������������� ���������� ���������� ���������� ���������� 5 ����������
Housing Programs: Project-based Rental Assistance �������������������������������������������������������������������������������� 345 350 355 272 277 282
Department of Labor: Employment and Training Administration:
Unemployment Trust Fund ������������������������������������������������������������������������������������������ 1,118 3,316 3,249 964 3,864 3,480Total, discretionary ............................................................................................................ 64,879 116,141 67,433 53,126 77,203 87,356
Mandatory: Department of Agriculture:
Agricultural Marketing Service: Funds for Strengthening Markets, Income, and Supply (section 32) �������������������������� 1,167 1,191 1,219 947 1,421 1,245
Food and Nutrition Service: Supplemental Nutrition Assistance Program �������������������������������������������������������������� 8,121 10,320 8,559 8,006 10,173 8,717Commodity Assistance Program �������������������������������������������������������������������������������� 24 61 24 16 57 33Special Supplemental Nutrition Program for Women, Infants, and Children (WIC) ��� ���������� 881 ���������� ���������� 471 177Child Nutrition Programs �������������������������������������������������������������������������������������������� 32,587 26,573 28,257 22,709 31,928 32,178
Department of Health and Human Services: Administration for Children and Families:
Payments to States for Child Support Enforcement and Family Support Pr ograms �� 4,566 4,439 4,194 4,424 4,388 4,157Contingency Fund ������������������������������������������������������������������������������������������������������ 608 608 608 628 608 608Payments for Foster Care and Permanency ��������������������������������������������������������������� 9,108 10,415 9,965 8,836 10,764 10,242Child Care Entitlement to States �������������������������������������������������������������������������������� 2,917 3,550 3,550 2,979 3,187 3,447Temporary Assistance for Needy Families ����������������������������������������������������������������� 16,736 17,736 16,736 16,551 16,667 17,267
Department of Homeland Security: Federal Emergency Management Agency:
Federal Assistance ����������������������������������������������������������������������������������������������������� ���������� 510 ���������� ���������� ���������� 352Department of Housing and Urban Development:
Public and Indian Housing Programs: Native Hawaiian Housing Block Grant ������������������������������������������������������������������������ ���������� 5 ���������� ���������� 1 3Native American Programs ����������������������������������������������������������������������������������������� ���������� 740 400 ���������� 101 483Public Housing Fund �������������������������������������������������������������������������������������������������� ���������� ���������� 40,000 ���������� ���������� 1,200
Community Planning and Development:

11. AID TO STATE AND LOCAL GOVERNMENTS 161
Table 11–2. FEDERAL GRANTS TO STATE AND LOCAL GOVERNMENTS—BUDGET AUTHORITY AND OUTLAYS—Continued(In millions of dollars)
Function, Category, Agency and ProgramBudget Authority Outlays
2020 Actual 2021 Estimate 2022 Estimate 2020 Actual 2021 Estimate 2022 Estimate
Home Investment Partnership Program ��������������������������������������������������������������������� ���������� 4,950 7,000 ���������� 1 679Department of the Treasury:
Departmental Offices: Homeowner Assistance Fund ������������������������������������������������������������������������������������� ���������� 9,958 ���������� ���������� 9,923 11
Total, mandatory ................................................................................................................ 75,834 91,937 120,512 65,096 89,690 80,799Total, Income Security ....................................................................................................... 140,713 208,078 187,945 118,222 166,893 168,155
Social Security
Mandatory: Social Security Administration:
Federal Disability Insurance Trust Fund ��������������������������������������������������������������������� 3 7 2 14 10 7
Veterans Benefits and Services ............................................................................................
Discretionary: Department of Veterans Affairs:
Veterans Health Administration: Medical Community Care ������������������������������������������������������������������������������������������� 1,424 1,991 1,766 1,424 1,991 1,766Medical Services �������������������������������������������������������������������������������������������������������� 1,297 1,012 705 1,297 1,012 705
Departmental Administration: Grants for Construction of State Extended Care Facilities ����������������������������������������� 240 590 ���������� 214 405 230Grants for Construction of Veterans Cemeteries �������������������������������������������������������� 45 45 45 44 93 45
Total, discretionary ............................................................................................................ 3,006 3,638 2,516 2,979 3,501 2,746
Mandatory: Department of Veterans Affairs:
Veterans Health Administration: Veterans Medical Care and Health Fund �������������������������������������������������������������������� ���������� 538 ���������� ���������� ���������� 538
Total, Veterans Benefits and Services ............................................................................. 3,006 4,176 2,516 2,979 3,501 3,284
Administration of Justice ......................................................................................................
Discretionary: Department of Housing and Urban Development:
Fair Housing and Equal Opportunity: Fair Housing Activities ������������������������������������������������������������������������������������������������ 73 73 85 65 71 77
Department of Justice: Legal Activities and U�S� Marshals:
Assets Forfeiture Fund ����������������������������������������������������������������������������������������������� 21 21 21 15 20 20Office of Justice Programs:
Research, Evaluation, and Statistics �������������������������������������������������������������������������� 17 17 17 4 4 4State and Local Law Enforcement Assistance ����������������������������������������������������������� 605 605 605 918 1,305 1,269Juvenile Justice Programs ������������������������������������������������������������������������������������������ 301 320 772 224 319 483Community Oriented Policing Services ���������������������������������������������������������������������� 288 331 596 150 384 523Violence against Women Prevention and Prosecution Programs ������������������������������ 500 510 981 427 514 493
Equal Employment Opportunity Commission: Salaries and Expenses ����������������������������������������������������������������������������������������������� 31 28 32 46 40 42
Federal Drug Control Programs: High Intensity Drug Trafficking Areas Program ����������������������������������������������������������� 264 290 294 252 358 248
State Justice Institute: Salaries and Expenses ����������������������������������������������������������������������������������������������� 7 7 8 7 7 12
Total, discretionary ............................................................................................................ 2,107 2,202 3,411 2,108 3,022 3,171
Mandatory: Department of Housing and Urban Development:
Fair Housing and Equal Opportunity: Fair Housing Activities ������������������������������������������������������������������������������������������������ ���������� 19 ���������� ���������� ���������� 8
Department of Justice: Legal Activities and U�S� Marshals:
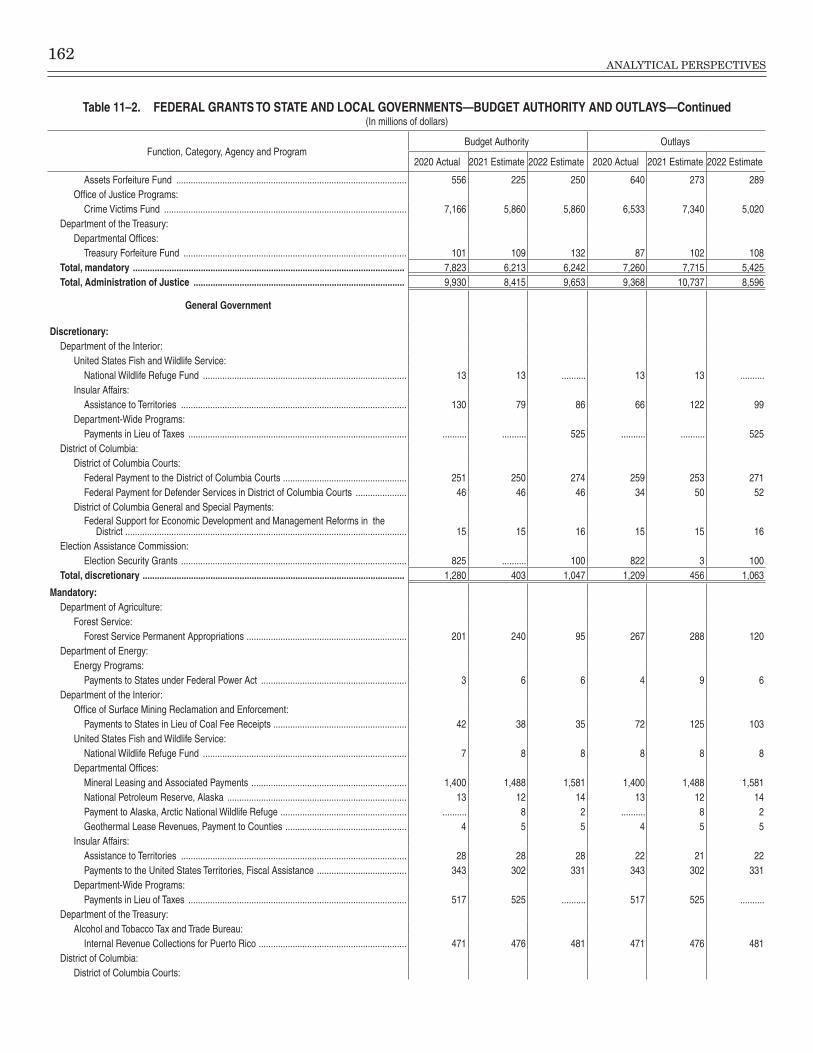
162ANALYTICAL PERSPECTIVES
Table 11–2. FEDERAL GRANTS TO STATE AND LOCAL GOVERNMENTS—BUDGET AUTHORITY AND OUTLAYS—Continued(In millions of dollars)
Function, Category, Agency and ProgramBudget Authority Outlays
2020 Actual 2021 Estimate 2022 Estimate 2020 Actual 2021 Estimate 2022 Estimate
Assets Forfeiture Fund ����������������������������������������������������������������������������������������������� 556 225 250 640 273 289Office of Justice Programs:
Crime Victims Fund ���������������������������������������������������������������������������������������������������� 7,166 5,860 5,860 6,533 7,340 5,020Department of the Treasury:
Departmental Offices: Treasury Forfeiture Fund �������������������������������������������������������������������������������������������� 101 109 132 87 102 108
Total, mandatory ................................................................................................................ 7,823 6,213 6,242 7,260 7,715 5,425Total, Administration of Justice ....................................................................................... 9,930 8,415 9,653 9,368 10,737 8,596
General Government
Discretionary: Department of the Interior:
United States Fish and Wildlife Service: National Wildlife Refuge Fund ������������������������������������������������������������������������������������ 13 13 ���������� 13 13 ����������
Insular Affairs: Assistance to Territories ��������������������������������������������������������������������������������������������� 130 79 86 66 122 99
Department-Wide Programs: Payments in Lieu of Taxes ������������������������������������������������������������������������������������������ ���������� ���������� 525 ���������� ���������� 525
District of Columbia: District of Columbia Courts:
Federal Payment to the District of Columbia Courts ��������������������������������������������������� 251 250 274 259 253 271Federal Payment for Defender Services in District of Columbia Courts ��������������������� 46 46 46 34 50 52
District of Columbia General and Special Payments: Federal Support for Economic Development and Management Reforms in the
District �������������������������������������������������������������������������������������������������������������������� 15 15 16 15 15 16Election Assistance Commission:
Election Security Grants ��������������������������������������������������������������������������������������������� 825 ���������� 100 822 3 100Total, discretionary ............................................................................................................ 1,280 403 1,047 1,209 456 1,063
Mandatory: Department of Agriculture:
Forest Service: Forest Service Permanent Appropriations ������������������������������������������������������������������ 201 240 95 267 288 120
Department of Energy: Energy Programs:
Payments to States under Federal Power Act ������������������������������������������������������������ 3 6 6 4 9 6Department of the Interior:
Office of Surface Mining Reclamation and Enforcement: Payments to States in Lieu of Coal Fee Receipts ������������������������������������������������������� 42 38 35 72 125 103
United States Fish and Wildlife Service: National Wildlife Refuge Fund ������������������������������������������������������������������������������������ 7 8 8 8 8 8
Departmental Offices: Mineral Leasing and Associated Payments ���������������������������������������������������������������� 1,400 1,488 1,581 1,400 1,488 1,581National Petroleum Reserve, Alaska �������������������������������������������������������������������������� 13 12 14 13 12 14Payment to Alaska, Arctic National Wildlife Refuge ���������������������������������������������������� ���������� 8 2 ���������� 8 2Geothermal Lease Revenues, Payment to Counties �������������������������������������������������� 4 5 5 4 5 5
Insular Affairs: Assistance to Territories ��������������������������������������������������������������������������������������������� 28 28 28 22 21 22Payments to the United States Territories, Fiscal Assistance ������������������������������������� 343 302 331 343 302 331
Department-Wide Programs: Payments in Lieu of Taxes ������������������������������������������������������������������������������������������ 517 525 ���������� 517 525 ����������
Department of the Treasury: Alcohol and Tobacco Tax and Trade Bureau:
Internal Revenue Collections for Puerto Rico ������������������������������������������������������������� 471 476 481 471 476 481District of Columbia:
District of Columbia Courts:
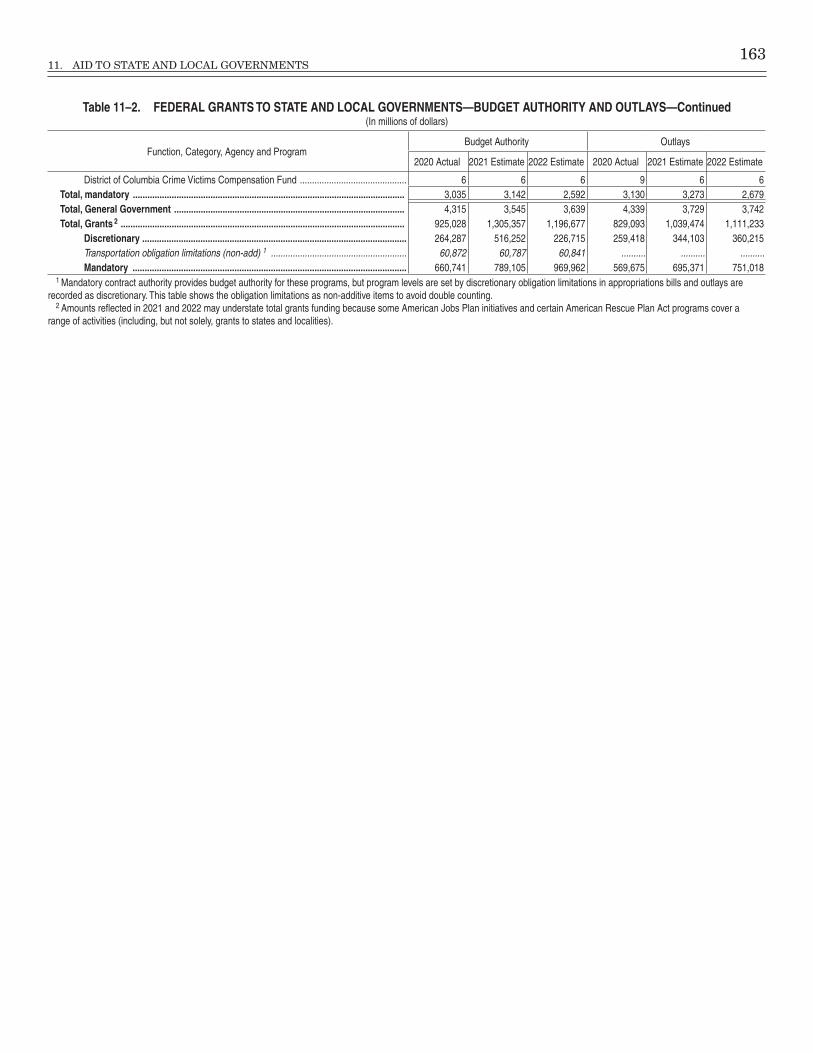
11. AID TO STATE AND LOCAL GOVERNMENTS 163
Table 11–2. FEDERAL GRANTS TO STATE AND LOCAL GOVERNMENTS—BUDGET AUTHORITY AND OUTLAYS—Continued(In millions of dollars)
Function, Category, Agency and ProgramBudget Authority Outlays
2020 Actual 2021 Estimate 2022 Estimate 2020 Actual 2021 Estimate 2022 Estimate
District of Columbia Crime Victims Compensation Fund �������������������������������������������� 6 6 6 9 6 6Total, mandatory ................................................................................................................ 3,035 3,142 2,592 3,130 3,273 2,679Total, General Government ............................................................................................... 4,315 3,545 3,639 4,339 3,729 3,742Total, Grants 2 ..................................................................................................................... 925,028 1,305,357 1,196,677 829,093 1,039,474 1,111,233
Discretionary ............................................................................................................. 264,287 516,252 226,715 259,418 344,103 360,215Transportation obligation limitations (non-add) 1 �������������������������������������������������������� 60,872 60,787 60,841 ���������� ���������� ����������Mandatory ................................................................................................................. 660,741 789,105 969,962 569,675 695,371 751,018
1 Mandatory contract authority provides budget authority for these programs, but program levels are set by discretionary obligation limitations in appropriations bills and outlays are recorded as discretionary� This table shows the obligation limitations as non-additive items to avoid double counting�
2 Amounts reflected in 2021 and 2022 may understate total grants funding because some American Jobs Plan initiatives and certain American Rescue Plan Act programs cover a range of activities (including, but not solely, grants to states and localities)�


165
12. INFORMATION TECHNOLOGY AND CYBERSECURITY FUNDING
Federal Information Technology (IT) provides Americans with important services and information, and is the foundation of how Government serves the public in the digital age. The President proposes spending $58.4 billion on IT at civilian agencies in FY 20221, which will be used to deliver critical citizen services, keep sensi-tive data and systems secure, and further the vision of digital Government. The Budget also supports the imple-mentation of Federal laws that enable agency technology planning, oversight, funding, and accountability practices and Office of Management and Budget (OMB) guidance to agencies on the strategic use of IT to enable mission outcomes. It supports the modernization of antiquated and often unsecured IT; agency migration to secure, cost-effective commercial cloud solutions and shared services; the recruitment, retention, and reskilling of the Federal technology and cybersecurity workforce to ensure higher value service delivery; and the reduction of cybersecurity risk across the Federal enterprise.
Cybersecurity is an important component of the Administration’s IT modernization efforts, and the President remains dedicated to securing the Federal enter-prise from cyber-related threats. The President’s Budget includes approximately $9.8 billion for civilian cyberse-curity funding, which supports the protection of Federal IT and our Nation’s most valuable information including the personal information of the American public. These investments will, in alignment with the Administration’s priorities, focus on addressing root cause structural is-sues, promoting stronger collaboration and coordination among Federal agencies, and addressing capability chal-lenges that have impeded the Government’s technology vision.
Federal Spending on IT and Cybersecurity
As shown in Table 12-1, the Federal Government Budget for IT at civilian Federal agencies is estimated to be $58.4 billion in 2022. This figure is a 2.4 percent in-crease from the estimate reported for 2021. Chart 12-1 shows trending information for Federal civilian IT spend-ing from 2020 forward.2 The 2022 Budget includes funding for 4,531 investments at 25 agencies. These investments support the three IT Portfolio areas shown in Chart 12-2.
Of those 4,531 IT investments, 546 are considered ma-jor IT investments. As outlined in OMB Circular A-11 and FY 2022 Capital Planning and Investment Control (CPIC) Guidance, agencies determine if an IT investment
1 The scope of the analysis in this chapter refers to agencies repre-sented on the IT Dashboard, located at https://www.itdashboard.gov/. This analysis excludes the Department of Defense
2 Note that as of the 2020 CPIC guidance, IT related grants made to State and local governments are no longer included in agency IT invest-ment submissions.
is classified as major based on whether the associated investment: has significant program or policy implica-tions; has high executive visibility; has high development, operating, or maintenance costs; or requires special management attention because of its importance to the mission or function of the agency. For all major IT invest-ments, agencies are required to submit Business Cases, which provide additional transparency regarding the cost, schedule, risk, and performance data related to its spend-ing. OMB requires that agency Chief Information Officers (CIOs) provide risk ratings for all major IT investments on the IT Dashboard website on a continuous basis and assess how risks for major development efforts are being addressed and mitigated.
Cybersecurity is a top priority for this Administration, and recent events, such as the SolarWinds cyber inci-dent, have shown that adversaries continue to target Federal systems. Recognizing that this is a critical issue that must be prioritized, the President’s Budget includes approximately $9.8 billion of budget authority for civil-ian cybersecurity-related activities. This figure is a 14 percent increase from the estimate reported for 2021. Cybersecurity budgetary priorities will continue to seek to reduce the risk and impact of cyber incidents (e.g. SolarWinds), based on data-driven, risk-based assess-ments of the threat environment and the current Federal cybersecurity posture. Table 12-2 provides an agency level view of cybersecurity spending. Table 12-3 provides an overview of civilian Chief Financial Officers (CFO) Act Agency cybersecurity spending as aligned to the National Institute of Standards and Technology (NIST) Cybersecurity Framework functions: Identify, Protect, Detect, Respond, and Recover.
The remainder of this chapter describes important as-pects of the latest initiatives undertaken with respect to Federal IT policies and projects, as well as cybersecurity policy and spending.
IT Modernization
Agencies prioritize the modernization of Federal IT systems to better deliver their mission and services to the American public in an effective, efficient, and secure manner. Agencies are continuing to deploy standards-based platforms and systems, leveraging commercial capabilities that replace highly-customized government technology. The Federal Government has been focused on enhancing Federal IT and digital services, reducing cybersecurity risks to the Federal mission, and building a modern IT and cybersecurity workforce. Federal agen-cies’ ongoing efforts to modernize their IT will enhance mission effectiveness and reduce mission risks through a series of complementary initiatives that will drive sus-

166ANALYTICAL PERSPECTIVES
tained change in Federal technology, deployment, security, and service delivery.
Notable IT Modernization efforts include Cloud Adoption, Shared Services, and IPv6, among other efforts. The Federal Government will continue to accelerate the adoption of cloud technologies to improve the efficiency of Government business and communications. Cloud Adoption positioned Federal agencies to convert to maxi-mum telework during the COVID-19 pandemic, rapidly and proficiently enabling the continuity of their missions. Shared Services include the Government-wide identi-fication and creation of centralized capabilities, shared governance, and performance expectations that are cur-rent for common functions across government. These will lead the way to transform the Federal Government by en-abling the delivery of innovative, flexible, and competitive solutions and services that improve mission support ser-vice quality and decrease the total cost of services across the Federal enterprise. The Federal Government is also continuing its transition to Internet Protocol 6 (IPv6), replacing IPv4. The global demand for IP addresses has grown exponentially with the ever-increasing number of users, devices, and virtual entities connecting to the Internet, resulting in the exhaustion of readily available IPv4 addresses in all regions of the world. While stop-gap measures have served to extend IPv4’s viability thus far, it is imperative that IPv6, with its vastly larger address space, sees widespread adoption in the near future. This will accommodate Internet growth and innovation, giving
better support to mobility, security, and virtualized net-work services.
Technology Modernization Fund
The Budget includes $500 million for the Technology Modernization Fund (TMF), building on the $1 billion provided in the American Rescue Plan, to strengthen Federal cybersecurity and retire antiquated technology systems. With the continuously evolving IT and cyber landscape, these investments are an important down payment on delivering modern and secure services to the American public, and continued investment in IT will be necessary to ensure the United States meets the acceler-ated pace of modernization. The funding provided to TMF through the American Rescue Plan recognizes the critical need to provide funding to address urgent IT moderniza-tion challenges, bolster cybersecurity defenses following the SolarWinds incident, and improve the delivery of COVID-19 relief. The Administration will prioritize proj-ects that focus on high-priority systems modernization, cybersecurity, public-facing digital services, and cross-government services and infrastructure. To implement the TMF funding provided through the American Rescue Plan, the TMF model has been updated to include re-payment flexibilities that may accelerate modernization efforts to better serve the American public.
The TMF is an innovative funding vehicle that gives agencies additional ways to deliver services to the
$37,332 $37,470 $36,981$38,734
$41,513$43,297
$44,924
$48,747
$51,877
$55,985$57,087
$58,439
$40,975 $40,690 $41,271
$44,445
$49,965$52,212
$25,000
$35,000
$45,000
$55,000
$65,000
2011 2012 2013 2014 2015 2016 2017 2018 2019 2020 2021 2022
Chart 12-1. Trends in Federal Civilian IT Spending
Federal IT Spending Without Grants
Federal IT Spending With Grants
Notes: Investments labeled as ‘Part 06 – Grants to State and Local IT Investments’ were excluded from FY 2011 – 2015 figures. Investments labeled ‘Part 04 - Grants and Other Transferred Funding’ were excluded in FY 2016 figures. FY 2017 – 2020 estimates did not include these types of investments.
Millions of dollars
45.0% 44.2% 10.7%
0% 20% 40% 60% 80% 100%
Chart 12-2. 2022 Federal Civilian IT Investment Portfolio Summary
IT Infrastructure, Security, and ManagementMission DeliveryAdministrative Services and Support Systems

12. INFORMATION TECHNOLOGY AND CYBERSECURITY FUNDING 167
American public more quickly, to better secure sensitive systems and data, and to use taxpayer dollars more ef-ficiently.3 The mission of the TMF is to enable agencies to accelerate transformation of the way they use technology to deliver their mission and services to the American pub-lic in an effective, efficient, and secure manner. Agencies must apply and compete for TMF funds. The TMF awards are levers to accelerate modernization across the Government in a manner that demonstrates efficient management of taxpayer resources.
Since its start in March 2019, the TMF Board has awarded ten initiatives a total of approximately $79.4 mil-lion. In 2020, the TMF Board awarded $15 million for one new modernization project – the Automated Commercial Environment Collections Module (ACE). This project serves to update the Customs and Border Protection’s (CPB’s) 30-year old collection tool, the Automated Commercial System (ACS), to meet the demands of the CBP mission and provide the agency with a flexible se-cure platform to support the growing complexities of global trade and CBP enforcement.
Improving the IT and Cyber Workforce
Maintaining and securing Federal IT requires a large, highly capable IT and Cyber workforce. A current focus
3 See https://tmf.cio.gov/
for policies guiding the strengthening of the Federal IT workforce is the direction given to Federal agencies to build a workforce able to leverage data as a strategic as-set to support economic growth, increase the effectiveness of the Federal Government, facilitate oversight, and pro-mote transparency.
To accomplish this goal, agencies need a workforce that is highly trained and equipped with modern-day technical skills in areas such as data science, cyber-security, and artificial intelligence. As technology is a rapidly-changing field, the Administration is commit-ted to investing in the Federal workforce to ensure they are equipped to adapt and develop their skills. To date, the Government has taken steps to expand the IT workforce, and provide training and other professional development opportunities to build skillsets and capac-ity Government-wide.
The President’s Budget continues to invest in the IT and Cyber workforce, to make the Government an at-tractive employer for top-tier talent, improve our ability to oversee and administer Government-wide programs, and better deliver services to the American people. For example, a highly skilled IT workforce is essential for the Government’s ability to innovate in artificial in-telligence and machine learning. Agencies need staff who understand these technologies, both to generate the foundational data needed for them to operate, as well as to manage the automated services to ensure they are accurate, fair, and aligned to the needs of the Government and the American people. Agencies also need cross-functional professionals who can work in ar-eas like financial management, acquisition, and privacy protections, to drive value across a range of Government domains. Ultimately, a strong cadre of cybersecurity and IT professionals will allow the Government to run more efficiently and effectively, and drive more user-centric services to the American people.
United States Digital Service
Americans expect and deserve their interactions with the Federal Government to be simple, fast, and responsive. The United States Digital Service (USDS) is enhanc-ing the Federal Government’s most critical public-facing digital services through design and technology expertise. USDS recruits some of the country’s top technical talent and partners directly with Federal Agencies to ensure that critical services reach the public. USDS projects not only provide the public with better digital services, but also help streamline agency processes and save taxpayer dollars. Recognizing this, the Administration requested and Congress appropriated $200 million through the American Rescue Plan for USDS that is being used to increase the number of USDS personnel. This will allow USDS to quickly address technology emergencies, ensure access and equity are integrated into products and pro-cesses, and help agencies modernize their systems for long-term stability.
Table 12–1. ESTIMATED FY 2022 CIVILIAN FEDERAL IT SPENDING AND PERCENTAGE BY AGENCY
(In millions of dollars)
Agency FY 2022 Percent of Total
Department of Veterans Affairs �������������������������������������������� $8,495 14�5%Department of Homeland Security �������������������������������������� $8,150 13�9%Department of Health and Human Services ������������������������ $6,956 11�9%Department of the Treasury ������������������������������������������������� $5,967 10�2%Department of Transportation ���������������������������������������������� $3,694 6�3%Department of Justice ��������������������������������������������������������� $3,475 5�9%Department of Energy ��������������������������������������������������������� $3,245 5�6%Department of Agriculture ��������������������������������������������������� $2,762 4�7%Department of State ������������������������������������������������������������ $2,756 4�7%Department of Commerce ��������������������������������������������������� $2,598 4�4%Social Security Administration ��������������������������������������������� $2,157 3�7%National Aeronautics and Space Administration ����������������� $2,145 3�7%Department of the Interior ��������������������������������������������������� $1,502 2�6%Department of Education ����������������������������������������������������� $982 1�7%Department of Labor ����������������������������������������������������������� $819 1�4%General Services Administration ����������������������������������������� $702 1�2%Department of Housing and Urban Development ���������������� $437 0�7%Environmental Protection Agency ��������������������������������������� $370 0�6%U�S� Army Corps of Engineers ��������������������������������������������� $269 0�5%U�S� Agency for International Development ������������������������� $263 0�4%National Science Foundation ����������������������������������������������� $165 0�3%Nuclear Regulatory Commission ����������������������������������������� $152 0�3%Office of Personnel Management ���������������������������������������� $141 0�2%National Archives and Records Administration �������������������� $127 0�2%Small Business Administration �������������������������������������������� $109 0�2%
Total .......................................................................... $58,439 100.0%This analysis excludes the Department of Defense
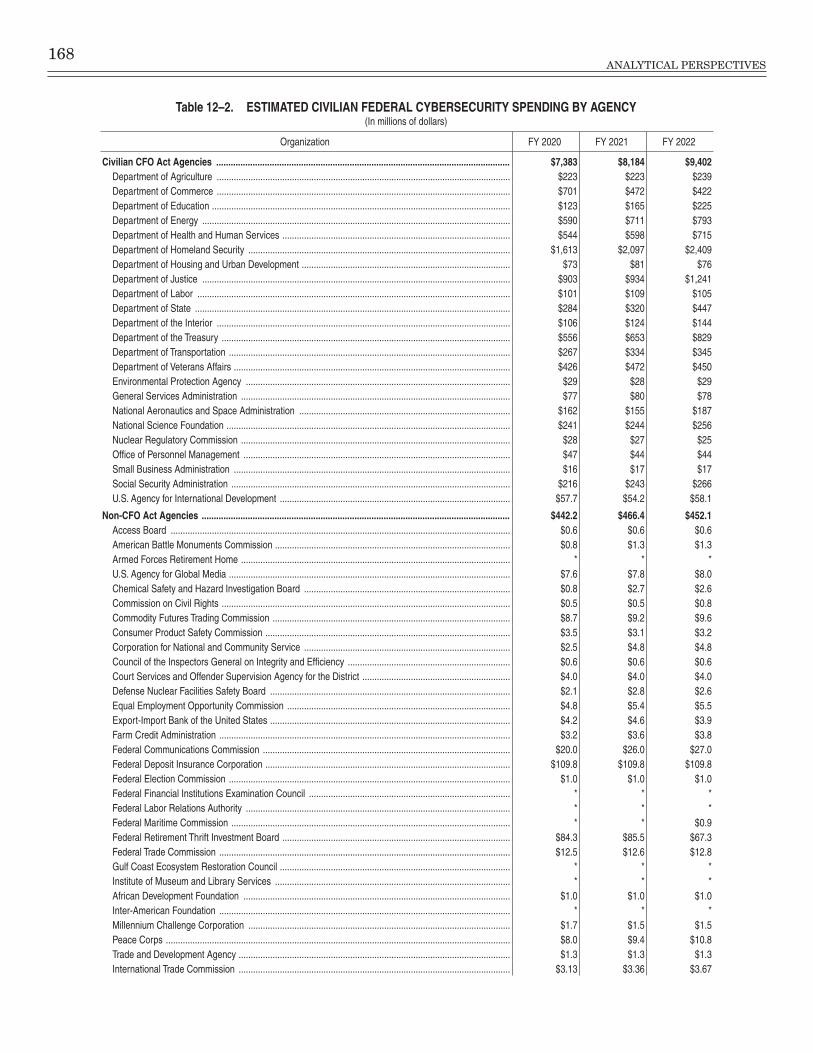
168ANALYTICAL PERSPECTIVES
Table 12–2. ESTIMATED CIVILIAN FEDERAL CYBERSECURITY SPENDING BY AGENCY(In millions of dollars)
Organization FY 2020 FY 2021 FY 2022
Civilian CFO Act Agencies ......................................................................................................................... $7,383 $8,184 $9,402Department of Agriculture ������������������������������������������������������������������������������������������������������������������������� $223 $223 $239Department of Commerce ������������������������������������������������������������������������������������������������������������������������� $701 $472 $422Department of Education ��������������������������������������������������������������������������������������������������������������������������� $123 $165 $225Department of Energy ������������������������������������������������������������������������������������������������������������������������������� $590 $711 $793Department of Health and Human Services ���������������������������������������������������������������������������������������������� $544 $598 $715Department of Homeland Security ������������������������������������������������������������������������������������������������������������ $1,613 $2,097 $2,409Department of Housing and Urban Development �������������������������������������������������������������������������������������� $73 $81 $76Department of Justice ������������������������������������������������������������������������������������������������������������������������������� $903 $934 $1,241Department of Labor ��������������������������������������������������������������������������������������������������������������������������������� $101 $109 $105Department of State ���������������������������������������������������������������������������������������������������������������������������������� $284 $320 $447Department of the Interior ������������������������������������������������������������������������������������������������������������������������� $106 $124 $144Department of the Treasury ����������������������������������������������������������������������������������������������������������������������� $556 $653 $829Department of Transportation �������������������������������������������������������������������������������������������������������������������� $267 $334 $345Department of Veterans Affairs ������������������������������������������������������������������������������������������������������������������ $426 $472 $450Environmental Protection Agency ������������������������������������������������������������������������������������������������������������� $29 $28 $29General Services Administration ��������������������������������������������������������������������������������������������������������������� $77 $80 $78National Aeronautics and Space Administration ��������������������������������������������������������������������������������������� $162 $155 $187National Science Foundation ��������������������������������������������������������������������������������������������������������������������� $241 $244 $256Nuclear Regulatory Commission ��������������������������������������������������������������������������������������������������������������� $28 $27 $25Office of Personnel Management �������������������������������������������������������������������������������������������������������������� $47 $44 $44Small Business Administration ������������������������������������������������������������������������������������������������������������������ $16 $17 $17Social Security Administration ������������������������������������������������������������������������������������������������������������������� $216 $243 $266U�S� Agency for International Development ����������������������������������������������������������������������������������������������� $57�7 $54�2 $58�1
Non-CFO Act Agencies ............................................................................................................................... $442.2 $466.4 $452.1Access Board �������������������������������������������������������������������������������������������������������������������������������������������� $0�6 $0�6 $0�6American Battle Monuments Commission ������������������������������������������������������������������������������������������������� $0�8 $1�3 $1�3Armed Forces Retirement Home ��������������������������������������������������������������������������������������������������������������� * * *U�S� Agency for Global Media �������������������������������������������������������������������������������������������������������������������� $7�6 $7�8 $8�0Chemical Safety and Hazard Investigation Board ������������������������������������������������������������������������������������� $0�8 $2�7 $2�6Commission on Civil Rights ����������������������������������������������������������������������������������������������������������������������� $0�5 $0�5 $0�8Commodity Futures Trading Commission �������������������������������������������������������������������������������������������������� $8�7 $9�2 $9�6Consumer Product Safety Commission ����������������������������������������������������������������������������������������������������� $3�5 $3�1 $3�2Corporation for National and Community Service ������������������������������������������������������������������������������������� $2�5 $4�8 $4�8Council of the Inspectors General on Integrity and Efficiency ������������������������������������������������������������������� $0�6 $0�6 $0�6Court Services and Offender Supervision Agency for the District ������������������������������������������������������������� $4�0 $4�0 $4�0Defense Nuclear Facilities Safety Board ��������������������������������������������������������������������������������������������������� $2�1 $2�8 $2�6Equal Employment Opportunity Commission �������������������������������������������������������������������������������������������� $4�8 $5�4 $5�5Export-Import Bank of the United States ��������������������������������������������������������������������������������������������������� $4�2 $4�6 $3�9Farm Credit Administration ������������������������������������������������������������������������������������������������������������������������ $3�2 $3�6 $3�8Federal Communications Commission ������������������������������������������������������������������������������������������������������ $20�0 $26�0 $27�0Federal Deposit Insurance Corporation ����������������������������������������������������������������������������������������������������� $109�8 $109�8 $109�8Federal Election Commission �������������������������������������������������������������������������������������������������������������������� $1�0 $1�0 $1�0Federal Financial Institutions Examination Council ����������������������������������������������������������������������������������� * * *Federal Labor Relations Authority ������������������������������������������������������������������������������������������������������������� * * *Federal Maritime Commission ������������������������������������������������������������������������������������������������������������������� * * $0�9Federal Retirement Thrift Investment Board ���������������������������������������������������������������������������������������������� $84�3 $85�5 $67�3Federal Trade Commission ������������������������������������������������������������������������������������������������������������������������ $12�5 $12�6 $12�8Gulf Coast Ecosystem Restoration Council ����������������������������������������������������������������������������������������������� * * *Institute of Museum and Library Services ������������������������������������������������������������������������������������������������� * * *African Development Foundation �������������������������������������������������������������������������������������������������������������� $1�0 $1�0 $1�0Inter-American Foundation ������������������������������������������������������������������������������������������������������������������������ * * *Millennium Challenge Corporation ������������������������������������������������������������������������������������������������������������ $1�7 $1�5 $1�5Peace Corps ���������������������������������������������������������������������������������������������������������������������������������������������� $8�0 $9�4 $10�8Trade and Development Agency ���������������������������������������������������������������������������������������������������������������� $1�3 $1�3 $1�3International Trade Commission ���������������������������������������������������������������������������������������������������������������� $3�13 $3�36 $3�67
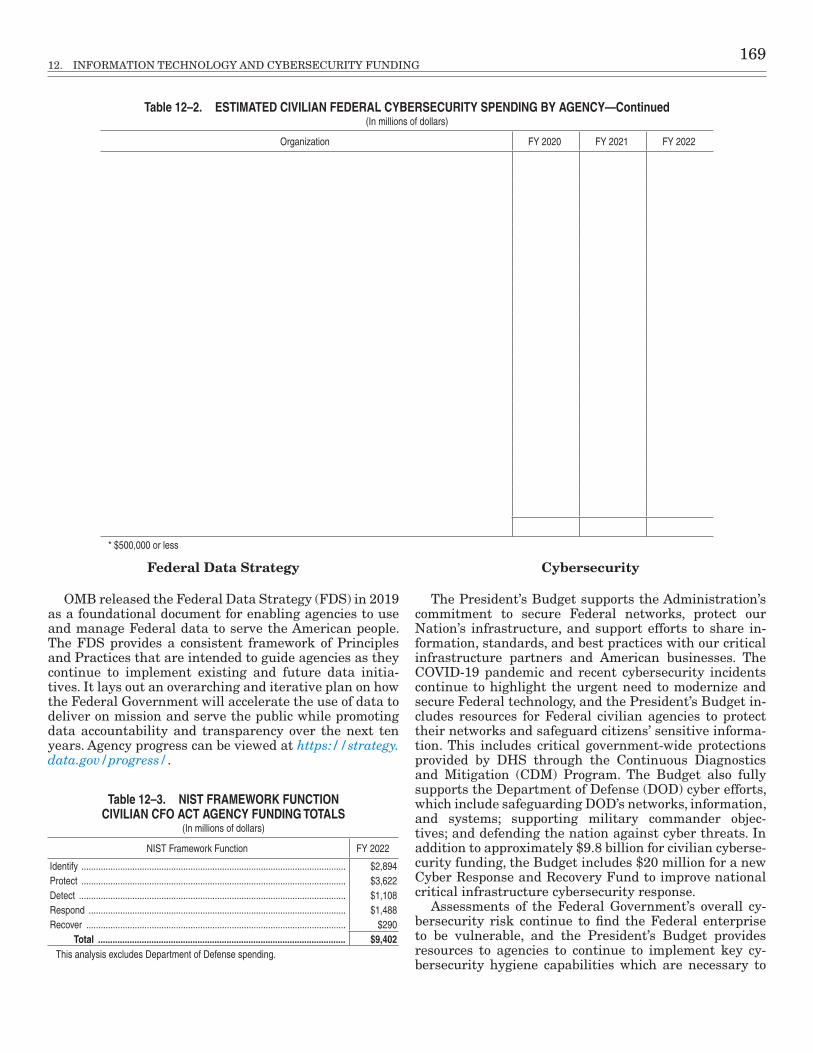
12. INFORMATION TECHNOLOGY AND CYBERSECURITY FUNDING 169
(In millions of dollars)
Organization FY 2020 FY 2021 FY 2022
Marine Mammal Commission �������������������������������������������������������������������������������������������������������������������� * * *Merit Systems Protection Board ���������������������������������������������������������������������������������������������������������������� $1 0� $0 7� $0 6�Morris K Udall and Stewart L Udall Foundation � � ��������������������������������������������������������������������������������������� * * *National Archives and Records Administration ������������������������������������������������������������������������������������������ $7 7� $7 8� $7 8�National Credit Union Administration ��������������������������������������������������������������������������������������������������������� $7 4� $7 3� $7 3�National Endowment for the Arts ��������������������������������������������������������������������������������������������������������������� $1 3� $1 2� $1 2�National Endowment for the Humanities ��������������������������������������������������������������������������������������������������� $1 0� $1 2� $1 2�National Labor Relations Board ����������������������������������������������������������������������������������������������������������������� $2 2� $2 3� $3 3�National Transportation Safety Board �������������������������������������������������������������������������������������������������������� $1 5� $1 7� $1 8�Nuclear Waste Technical Review Board ���������������������������������������������������������������������������������������������������� * * *Occupational Safety and Health Review Commission ������������������������������������������������������������������������������� $1 0� $1 0� $1 1�Office of Government Ethics ���������������������������������������������������������������������������������������������������������������������� * * *Office of Special Counsel �������������������������������������������������������������������������������������������������������������������������� * * *Presidio Trust ��������������������������������������������������������������������������������������������������������������������������������������������� * * *Privacy and Civil Liberties Oversight Board ���������������������������������������������������������������������������������������������� $1 4� $1 4� $1 4�Securities and Exchange Commission ������������������������������������������������������������������������������������������������������ $52 8� $44 3� $52 1�Selective Service System �������������������������������������������������������������������������������������������������������������������������� * $2 0� $5 0�Smithsonian Institution ������������������������������������������������������������������������������������������������������������������������������ $8 4� $9 9� $12 8�Surface Transportation Board �������������������������������������������������������������������������������������������������������������������� $2 3� $1 5� $1 4�Tennessee Valley Authority ������������������������������������������������������������������������������������������������������������������������ $41 4� $53 5� $37 8�U S Army Corps of Engineers � � ������������������������������������������������������������������������������������������������������������������� $18 8� $20 3� $20 4�United States Holocaust Memorial Museum ��������������������������������������������������������������������������������������������� $1 6� $1 7� $2 2�United States Institute of Peace ���������������������������������������������������������������������������������������������������������������� * * *National Gallery of Art ������������������������������������������������������������������������������������������������������������������������������� $2 1� $2 1� $2 1�Postal Regulatory Commission ����������������������������������������������������������������������������������������������������������������� * * *
Total $7,825 6� $8,650 1� $9,854 5�* $500,000 or less
Federal Data Strategy
OMB released the Federal Data Strategy (FDS) in 2019 as a foundational document for enabling agencies to use and manage Federal data to serve the American people. The FDS provides a consistent framework of Principles and Practices that are intended to guide agencies as they continue to implement existing and future data initia-tives. It lays out an overarching and iterative plan on how the Federal Government will accelerate the use of data to deliver on mission and serve the public while promoting data accountability and transparency over the next ten years. Agency progress can be viewed at https://strategy.data.gov/progress/.
Cybersecurity
The President’s Budget supports the Administration’s commitment to secure Federal networks, protect our Nation’s infrastructure, and support efforts to share in-formation, standards, and best practices with our critical infrastructure partners and American businesses. The COVID-19 pandemic and recent cybersecurity incidents continue to highlight the urgent need to modernize and secure Federal technology, and the President’s Budget in-cludes resources for Federal civilian agencies to protect their networks and safeguard citizens’ sensitive informa-tion. This includes critical government-wide protections provided by DHS through the Continuous Diagnostics and Mitigation (CDM) Program. The Budget also fully supports the Department of Defense (DOD) cyber efforts, which include safeguarding DOD’s networks, information, and systems; supporting military commander objec-tives; and defending the nation against cyber threats. In addition to approximately $9.8 billion for civilian cyberse-curity funding, the Budget includes $20 million for a new Cyber Response and Recovery Fund to improve national critical infrastructure cybersecurity response.
Assessments of the Federal Government’s overall cy-bersecurity risk continue to find the Federal enterprise to be vulnerable, and the President’s Budget provides resources to agencies to continue to implement key cy-bersecurity hygiene capabilities which are necessary to
Table 12–2. ESTIMATED CIVILIAN FEDERAL CYBERSECURITY SPENDING BY AGENCY—Continued
Table 12–3. NIST FRAMEWORK FUNCTION CIVILIAN CFO ACT AGENCY FUNDING TOTALS
(In millions of dollars)
NIST Framework Function FY 2022
Identify ������������������������������������������������������������������������������������������������������������� $2,894Protect ������������������������������������������������������������������������������������������������������������� $3,622Detect �������������������������������������������������������������������������������������������������������������� $1,108Respond ���������������������������������������������������������������������������������������������������������� $1,488Recover ����������������������������������������������������������������������������������������������������������� $290
Total ...................................................................................................... $9,402This analysis excludes Department of Defense spending�

170ANALYTICAL PERSPECTIVES
defend against cyber criminals and nation-state actors. This section addresses various areas of cybersecurity, including supply chain risk management, Coordinated Vulnerability Disclosure (CVD), and data methodology for assessing the threat environment and the current Federal cybersecurity posture.
With the passage of the SECURE Technology Act in 2018, agencies are required to assess the risks to their respective information and communications technology supply chains. In addition to agency Supply Chain Risk Management (SCRM) programs, enterprise wide risk is evaluated through the Federal Acquisition Security Council (FASC). The FASC will make recommendations on potential exclusion and removal orders to the Secretaries of Defense and Homeland Security as well as the Director of National Intelligence to address risk to each of their enterprises. These critical steps help agencies safeguard information and communication technology from emerg-ing threats and support the need to establish standards for the acquisition community around SCRM.
Among the most effective methods for obtaining new in-sights to improve agency information-security programs, CVD enables agencies to coordinate with cybersecurity talent from outside the government to resolve and dis-close cybersecurity vulnerabilities in affected products and services, while providing protection for those who uncover these vulnerabilities through good-faith secu-rity research. In Fiscal Year 2020, OMB, in coordination
with the Department of Homeland Security (DHS), is-sued memorandum M-20-32, Improving Vulnerability Identification, Management, and Remediation, providing guidance for agencies on management of vulnerability re-search and CVD programs, as well as Binding Operational Directive 20-01 (BOD-20-01), Develop and Publish a Vulnerability Disclosure Policy, which directed agencies to develop implementation plans providing timelines and milestones for CVD to cover all Federal information sys-tems by May 2, 2021.
Section 630 of the Consolidated Appropriations Act, 2017 (P. L. 115–31) as amended 31 U.S.C. § 1105 (a)(35) to require that an analysis of Federal cybersecuri-ty funding be incorporated into the President’s Budget. The Federal spending estimates in this analysis utilize funding and programmatic information collected on the Executive Branch’s cybersecurity activities that protect agency information systems, and also on activities that broadly involve cybersecurity such as the development of standards, research and development, and the inves-tigation of cybercrimes. Agencies provide funding data at a level of detail sufficient to consolidate information to determine total governmental spending on cybersecurity. Within each agency, FY 2020 actual levels reflect the ac-tual budgetary resources available in the prior year, FY 2021 estimates reflect the estimated budgetary resources available in the current year, and FY 2022 levels are to reflect levels consistent with the President’s Budget.
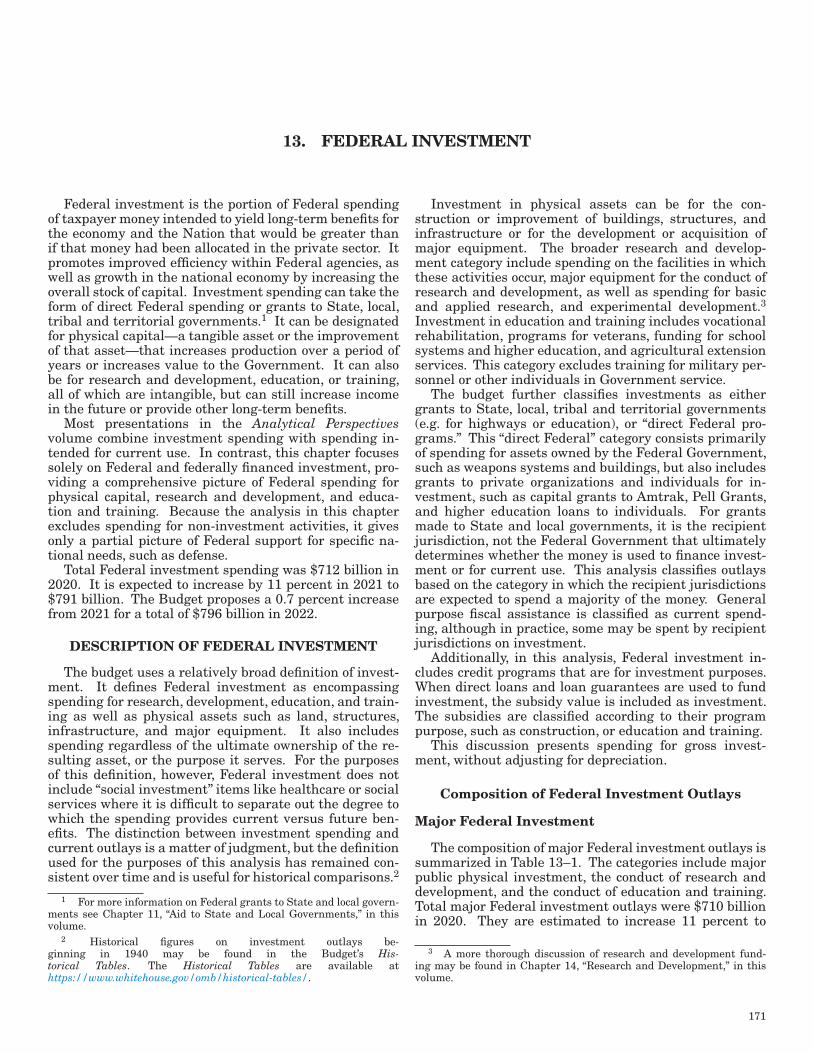
171
13. FEDERAL INVESTMENT
Federal investment is the portion of Federal spending of taxpayer money intended to yield long-term benefits for the economy and the Nation that would be greater than if that money had been allocated in the private sector. It promotes improved efficiency within Federal agencies, as well as growth in the national economy by increasing the overall stock of capital. Investment spending can take the form of direct Federal spending or grants to State, local, tribal and territorial governments.1 It can be designated for physical capital—a tangible asset or the improvement of that asset—that increases production over a period of years or increases value to the Government. It can also be for research and development, education, or training, all of which are intangible, but can still increase income in the future or provide other long-term benefits.
Most presentations in the Analytical Perspectives volume combine investment spending with spending in-tended for current use. In contrast, this chapter focuses solely on Federal and federally financed investment, pro-viding a comprehensive picture of Federal spending for physical capital, research and development, and educa-tion and training. Because the analysis in this chapter excludes spending for non-investment activities, it gives only a partial picture of Federal support for specific na-tional needs, such as defense.
Total Federal investment spending was $712 billion in 2020. It is expected to increase by 11 percent in 2021 to $791 billion. The Budget proposes a 0.7 percent increase from 2021 for a total of $796 billion in 2022.
DESCRIPTION OF FEDERAL INVESTMENT
The budget uses a relatively broad definition of invest-ment. It defines Federal investment as encompassing spending for research, development, education, and train-ing as well as physical assets such as land, structures, infrastructure, and major equipment. It also includes spending regardless of the ultimate ownership of the re-sulting asset, or the purpose it serves. For the purposes of this definition, however, Federal investment does not include “social investment” items like healthcare or social services where it is difficult to separate out the degree to which the spending provides current versus future ben-efits. The distinction between investment spending and current outlays is a matter of judgment, but the definition used for the purposes of this analysis has remained con-sistent over time and is useful for historical comparisons.2
1 For more information on Federal grants to State and local govern-ments see Chapter 11, “Aid to State and Local Governments,” in this volume.
2 Historical figures on investment outlays be-ginning in 1940 may be found in the Budget’s His-torical Tables. The Historical Tables are available at https://www.whitehouse.gov/omb/historical-tables/.
Investment in physical assets can be for the con-struction or improvement of buildings, structures, and infrastructure or for the development or acquisition of major equipment. The broader research and develop-ment category include spending on the facilities in which these activities occur, major equipment for the conduct of research and development, as well as spending for basic and applied research, and experimental development.3 Investment in education and training includes vocational rehabilitation, programs for veterans, funding for school systems and higher education, and agricultural extension services. This category excludes training for military per-sonnel or other individuals in Government service.
The budget further classifies investments as either grants to State, local, tribal and territorial governments (e.g. for highways or education), or “direct Federal pro-grams.” This “direct Federal’’ category consists primarily of spending for assets owned by the Federal Government, such as weapons systems and buildings, but also includes grants to private organizations and individuals for in-vestment, such as capital grants to Amtrak, Pell Grants, and higher education loans to individuals. For grants made to State and local governments, it is the recipient jurisdiction, not the Federal Government that ultimately determines whether the money is used to finance invest-ment or for current use. This analysis classifies outlays based on the category in which the recipient jurisdictions are expected to spend a majority of the money. General purpose fiscal assistance is classified as current spend-ing, although in practice, some may be spent by recipient jurisdictions on investment.
Additionally, in this analysis, Federal investment in-cludes credit programs that are for investment purposes. When direct loans and loan guarantees are used to fund investment, the subsidy value is included as investment. The subsidies are classified according to their program purpose, such as construction, or education and training.
This discussion presents spending for gross invest-ment, without adjusting for depreciation.
Composition of Federal Investment Outlays
Major Federal Investment
The composition of major Federal investment outlays is summarized in Table 13–1. The categories include major public physical investment, the conduct of research and development, and the conduct of education and training. Total major Federal investment outlays were $710 billion in 2020. They are estimated to increase 11 percent to
3 A more thorough discussion of research and development fund-ing may be found in Chapter 14, “Research and Development,’’ in this volume.
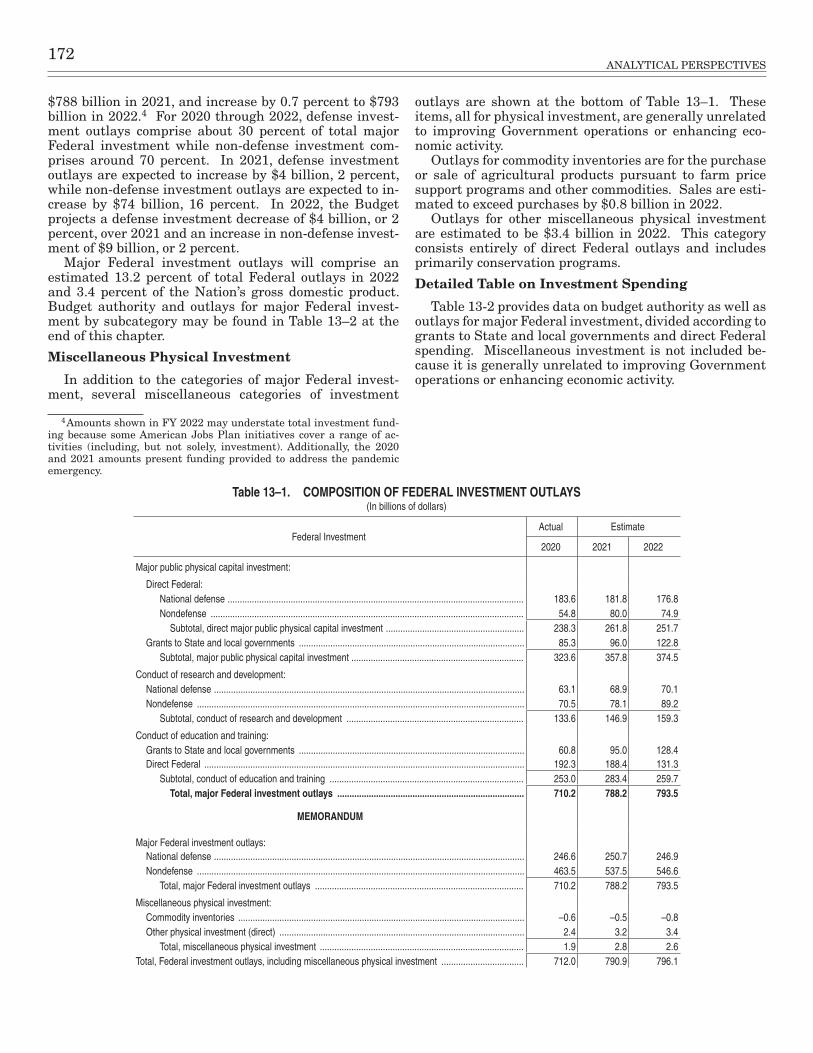
172ANALYTICAL PERSPECTIVES
$788 billion in 2021, and increase by 0.7 percent to $793 billion in 2022.4 For 2020 through 2022, defense invest-ment outlays comprise about 30 percent of total major Federal investment while non-defense investment com-prises around 70 percent. In 2021, defense investment outlays are expected to increase by $4 billion, 2 percent, while non-defense investment outlays are expected to in-crease by $74 billion, 16 percent. In 2022, the Budget projects a defense investment decrease of $4 billion, or 2 percent, over 2021 and an increase in non-defense invest-ment of $9 billion, or 2 percent.
Major Federal investment outlays will comprise an estimated 13.2 percent of total Federal outlays in 2022 and 3.4 percent of the Nation’s gross domestic product. Budget authority and outlays for major Federal invest-ment by subcategory may be found in Table 13–2 at the end of this chapter.
Miscellaneous Physical Investment
In addition to the categories of major Federal invest-ment, several miscellaneous categories of investment
4 Amounts shown in FY 2022 may understate total investment fund-ing because some American Jobs Plan initiatives cover a range of ac-tivities (including, but not solely, investment). Additionally, the 2020 and 2021 amounts present funding provided to address the pandemic emergency.
outlays are shown at the bottom of Table 13–1. These items, all for physical investment, are generally unrelated to improving Government operations or enhancing eco-nomic activity.
Outlays for commodity inventories are for the purchase or sale of agricultural products pursuant to farm price support programs and other commodities. Sales are esti-mated to exceed purchases by $0.8 billion in 2022.
Outlays for other miscellaneous physical investment are estimated to be $3.4 billion in 2022. This category consists entirely of direct Federal outlays and includes primarily conservation programs.
Detailed Table on Investment Spending
Table 13-2 provides data on budget authority as well as outlays for major Federal investment, divided according to grants to State and local governments and direct Federal spending. Miscellaneous investment is not included be-cause it is generally unrelated to improving Government operations or enhancing economic activity.
Table 13–1. COMPOSITION OF FEDERAL INVESTMENT OUTLAYS(In billions of dollars)
Federal InvestmentActual Estimate
2020 2021 2022
Major public physical capital investment:
Direct Federal:National defense �������������������������������������������������������������������������������������������������������������������������� 183�6 181�8 176�8Nondefense ��������������������������������������������������������������������������������������������������������������������������������� 54�8 80�0 74�9
Subtotal, direct major public physical capital investment ��������������������������������������������������������� 238�3 261�8 251�7Grants to State and local governments ��������������������������������������������������������������������������������������������� 85�3 96�0 122�8
Subtotal, major public physical capital investment ����������������������������������������������������������������������� 323�6 357�8 374�5
Conduct of research and development:National defense �������������������������������������������������������������������������������������������������������������������������������� 63�1 68�9 70�1Nondefense ��������������������������������������������������������������������������������������������������������������������������������������� 70�5 78�1 89�2
Subtotal, conduct of research and development ������������������������������������������������������������������������� 133�6 146�9 159�3
Conduct of education and training:Grants to State and local governments ��������������������������������������������������������������������������������������������� 60�8 95�0 128�4Direct Federal ������������������������������������������������������������������������������������������������������������������������������������ 192�3 188�4 131�3
Subtotal, conduct of education and training �������������������������������������������������������������������������������� 253�0 283�4 259�7Total, major Federal investment outlays ............................................................................. 710.2 788.2 793.5
MEMORANDUM
Major Federal investment outlays:National defense �������������������������������������������������������������������������������������������������������������������������������� 246�6 250�7 246�9Nondefense ��������������������������������������������������������������������������������������������������������������������������������������� 463�5 537�5 546�6
Total, major Federal investment outlays �������������������������������������������������������������������������������������� 710�2 788�2 793�5
Miscellaneous physical investment:Commodity inventories ���������������������������������������������������������������������������������������������������������������������� –0�6 –0�5 –0�8Other physical investment (direct) ����������������������������������������������������������������������������������������������������� 2�4 3�2 3�4
Total, miscellaneous physical investment ������������������������������������������������������������������������������������ 1�9 2�8 2�6Total, Federal investment outlays, including miscellaneous physical investment ���������������������������������� 712�0 790�9 796�1
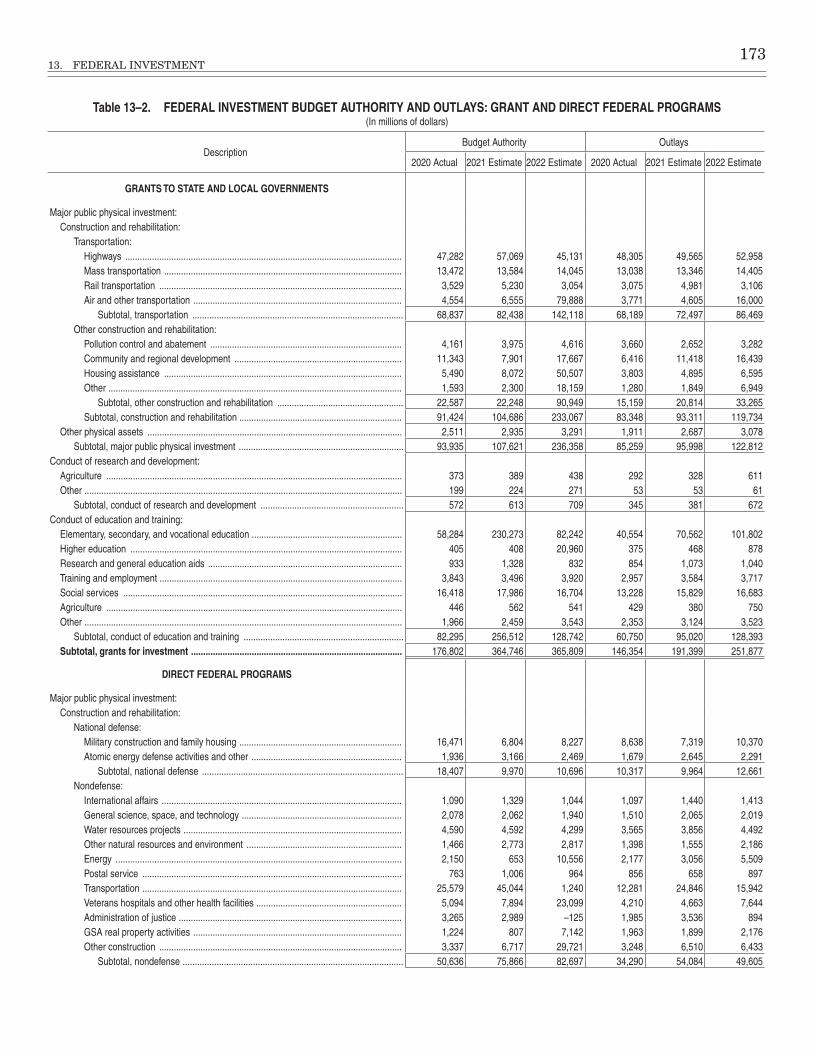
13. FEDERAL INVESTMENT 173
Table 13–2. FEDERAL INVESTMENT BUDGET AUTHORITY AND OUTLAYS: GRANT AND DIRECT FEDERAL PROGRAMS(In millions of dollars)
DescriptionBudget Authority Outlays
2020 Actual 2021 Estimate 2022 Estimate 2020 Actual 2021 Estimate 2022 Estimate
GRANTS TO STATE AND LOCAL GOVERNMENTS
Major public physical investment: Construction and rehabilitation:
Transportation: Highways ������������������������������������������������������������������������������������������������������������������ 47,282 57,069 45,131 48,305 49,565 52,958Mass transportation �������������������������������������������������������������������������������������������������� 13,472 13,584 14,045 13,038 13,346 14,405Rail transportation ���������������������������������������������������������������������������������������������������� 3,529 5,230 3,054 3,075 4,981 3,106Air and other transportation �������������������������������������������������������������������������������������� 4,554 6,555 79,888 3,771 4,605 16,000
Subtotal, transportation ��������������������������������������������������������������������������������������� 68,837 82,438 142,118 68,189 72,497 86,469Other construction and rehabilitation:
Pollution control and abatement ������������������������������������������������������������������������������� 4,161 3,975 4,616 3,660 2,652 3,282Community and regional development ��������������������������������������������������������������������� 11,343 7,901 17,667 6,416 11,418 16,439Housing assistance �������������������������������������������������������������������������������������������������� 5,490 8,072 50,507 3,803 4,895 6,595Other ������������������������������������������������������������������������������������������������������������������������� 1,593 2,300 18,159 1,280 1,849 6,949
Subtotal, other construction and rehabilitation ���������������������������������������������������� 22,587 22,248 90,949 15,159 20,814 33,265Subtotal, construction and rehabilitation ������������������������������������������������������������������� 91,424 104,686 233,067 83,348 93,311 119,734
Other physical assets ��������������������������������������������������������������������������������������������������������� 2,511 2,935 3,291 1,911 2,687 3,078Subtotal, major public physical investment �������������������������������������������������������������������� 93,935 107,621 236,358 85,259 95,998 122,812
Conduct of research and development: Agriculture �������������������������������������������������������������������������������������������������������������������������� 373 389 438 292 328 611Other ����������������������������������������������������������������������������������������������������������������������������������� 199 224 271 53 53 61
Subtotal, conduct of research and development ����������������������������������������������������������� 572 613 709 345 381 672Conduct of education and training:
Elementary, secondary, and vocational education �������������������������������������������������������������� 58,284 230,273 82,242 40,554 70,562 101,802Higher education ���������������������������������������������������������������������������������������������������������������� 405 408 20,960 375 468 878Research and general education aids �������������������������������������������������������������������������������� 933 1,328 832 854 1,073 1,040Training and employment ���������������������������������������������������������������������������������������������������� 3,843 3,496 3,920 2,957 3,584 3,717Social services ������������������������������������������������������������������������������������������������������������������� 16,418 17,986 16,704 13,228 15,829 16,683Agriculture �������������������������������������������������������������������������������������������������������������������������� 446 562 541 429 380 750Other ����������������������������������������������������������������������������������������������������������������������������������� 1,966 2,459 3,543 2,353 3,124 3,523
Subtotal, conduct of education and training ������������������������������������������������������������������ 82,295 256,512 128,742 60,750 95,020 128,393Subtotal, grants for investment ....................................................................................... 176,802 364,746 365,809 146,354 191,399 251,877
DIRECT FEDERAL PROGRAMS
Major public physical investment: Construction and rehabilitation:
National defense: Military construction and family housing ������������������������������������������������������������������� 16,471 6,804 8,227 8,638 7,319 10,370Atomic energy defense activities and other �������������������������������������������������������������� 1,936 3,166 2,469 1,679 2,645 2,291
Subtotal, national defense ����������������������������������������������������������������������������������� 18,407 9,970 10,696 10,317 9,964 12,661Nondefense:
International affairs ��������������������������������������������������������������������������������������������������� 1,090 1,329 1,044 1,097 1,440 1,413General science, space, and technology ������������������������������������������������������������������ 2,078 2,062 1,940 1,510 2,065 2,019Water resources projects ������������������������������������������������������������������������������������������ 4,590 4,592 4,299 3,565 3,856 4,492Other natural resources and environment ���������������������������������������������������������������� 1,466 2,773 2,817 1,398 1,555 2,186Energy ���������������������������������������������������������������������������������������������������������������������� 2,150 653 10,556 2,177 3,056 5,509Postal service ����������������������������������������������������������������������������������������������������������� 763 1,006 964 856 658 897Transportation ����������������������������������������������������������������������������������������������������������� 25,579 45,044 1,240 12,281 24,846 15,942Veterans hospitals and other health facilities ������������������������������������������������������������ 5,094 7,894 23,099 4,210 4,663 7,644Administration of justice �������������������������������������������������������������������������������������������� 3,265 2,989 –125 1,985 3,536 894GSA real property activities �������������������������������������������������������������������������������������� 1,224 807 7,142 1,963 1,899 2,176Other construction ���������������������������������������������������������������������������������������������������� 3,337 6,717 29,721 3,248 6,510 6,433
Subtotal, nondefense ������������������������������������������������������������������������������������������� 50,636 75,866 82,697 34,290 54,084 49,605
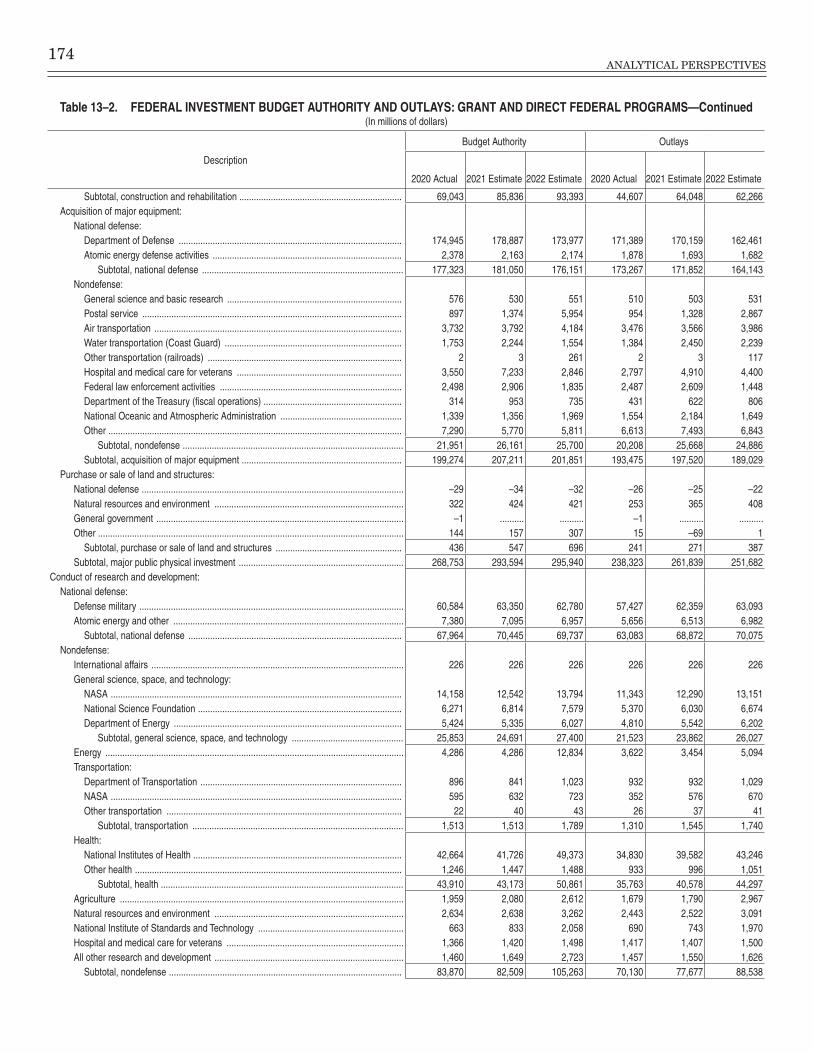
174ANALYTICAL PERSPECTIVES
Table 13–2. FEDERAL INVESTMENT BUDGET AUTHORITY AND OUTLAYS: GRANT AND DIRECT FEDERAL PROGRAMS—Continued(In millions of dollars)
Description
Budget Authority Outlays
2020 Actual 2021 Estimate 2022 Estimate 2020 Actual 2021 Estimate 2022 Estimate
Subtotal, construction and rehabilitation ������������������������������������������������������������������� 69,043 85,836 93,393 44,607 64,048 62,266Acquisition of major equipment:
National defense: Department of Defense �������������������������������������������������������������������������������������������� 174,945 178,887 173,977 171,389 170,159 162,461Atomic energy defense activities ������������������������������������������������������������������������������ 2,378 2,163 2,174 1,878 1,693 1,682
Subtotal, national defense ����������������������������������������������������������������������������������� 177,323 181,050 176,151 173,267 171,852 164,143Nondefense:
General science and basic research ������������������������������������������������������������������������ 576 530 551 510 503 531Postal service ����������������������������������������������������������������������������������������������������������� 897 1,374 5,954 954 1,328 2,867Air transportation ������������������������������������������������������������������������������������������������������ 3,732 3,792 4,184 3,476 3,566 3,986Water transportation (Coast Guard) ������������������������������������������������������������������������� 1,753 2,244 1,554 1,384 2,450 2,239Other transportation (railroads) �������������������������������������������������������������������������������� 2 3 261 2 3 117Hospital and medical care for veterans �������������������������������������������������������������������� 3,550 7,233 2,846 2,797 4,910 4,400Federal law enforcement activities ��������������������������������������������������������������������������� 2,498 2,906 1,835 2,487 2,609 1,448Department of the Treasury (fiscal operations) ��������������������������������������������������������� 314 953 735 431 622 806National Oceanic and Atmospheric Administration �������������������������������������������������� 1,339 1,356 1,969 1,554 2,184 1,649Other ������������������������������������������������������������������������������������������������������������������������� 7,290 5,770 5,811 6,613 7,493 6,843
Subtotal, nondefense ������������������������������������������������������������������������������������������� 21,951 26,161 25,700 20,208 25,668 24,886Subtotal, acquisition of major equipment ������������������������������������������������������������������ 199,274 207,211 201,851 193,475 197,520 189,029
Purchase or sale of land and structures: National defense ������������������������������������������������������������������������������������������������������������ –29 –34 –32 –26 –25 –22Natural resources and environment ������������������������������������������������������������������������������ 322 424 421 253 365 408General government ������������������������������������������������������������������������������������������������������ –1 ���������� ���������� –1 ���������� ����������Other ������������������������������������������������������������������������������������������������������������������������������ 144 157 307 15 –69 1
Subtotal, purchase or sale of land and structures ���������������������������������������������������� 436 547 696 241 271 387Subtotal, major public physical investment �������������������������������������������������������������������� 268,753 293,594 295,940 238,323 261,839 251,682
Conduct of research and development: National defense:
Defense military ������������������������������������������������������������������������������������������������������������� 60,584 63,350 62,780 57,427 62,359 63,093Atomic energy and other ����������������������������������������������������������������������������������������������� 7,380 7,095 6,957 5,656 6,513 6,982
Subtotal, national defense ���������������������������������������������������������������������������������������� 67,964 70,445 69,737 63,083 68,872 70,075Nondefense:
International affairs �������������������������������������������������������������������������������������������������������� 226 226 226 226 226 226General science, space, and technology:
NASA ������������������������������������������������������������������������������������������������������������������������ 14,158 12,542 13,794 11,343 12,290 13,151National Science Foundation ������������������������������������������������������������������������������������ 6,271 6,814 7,579 5,370 6,030 6,674Department of Energy ���������������������������������������������������������������������������������������������� 5,424 5,335 6,027 4,810 5,542 6,202
Subtotal, general science, space, and technology ���������������������������������������������� 25,853 24,691 27,400 21,523 23,862 26,027Energy ��������������������������������������������������������������������������������������������������������������������������� 4,286 4,286 12,834 3,622 3,454 5,094Transportation:
Department of Transportation ����������������������������������������������������������������������������������� 896 841 1,023 932 932 1,029NASA ������������������������������������������������������������������������������������������������������������������������ 595 632 723 352 576 670Other transportation ������������������������������������������������������������������������������������������������� 22 40 43 26 37 41
Subtotal, transportation ��������������������������������������������������������������������������������������� 1,513 1,513 1,789 1,310 1,545 1,740Health:
National Institutes of Health �������������������������������������������������������������������������������������� 42,664 41,726 49,373 34,830 39,582 43,246Other health �������������������������������������������������������������������������������������������������������������� 1,246 1,447 1,488 933 996 1,051
Subtotal, health ���������������������������������������������������������������������������������������������������� 43,910 43,173 50,861 35,763 40,578 44,297Agriculture ��������������������������������������������������������������������������������������������������������������������� 1,959 2,080 2,612 1,679 1,790 2,967Natural resources and environment ������������������������������������������������������������������������������ 2,634 2,638 3,262 2,443 2,522 3,091National Institute of Standards and Technology ������������������������������������������������������������ 663 833 2,058 690 743 1,970Hospital and medical care for veterans ������������������������������������������������������������������������� 1,366 1,420 1,498 1,417 1,407 1,500All other research and development ������������������������������������������������������������������������������ 1,460 1,649 2,723 1,457 1,550 1,626
Subtotal, nondefense ������������������������������������������������������������������������������������������������ 83,870 82,509 105,263 70,130 77,677 88,538
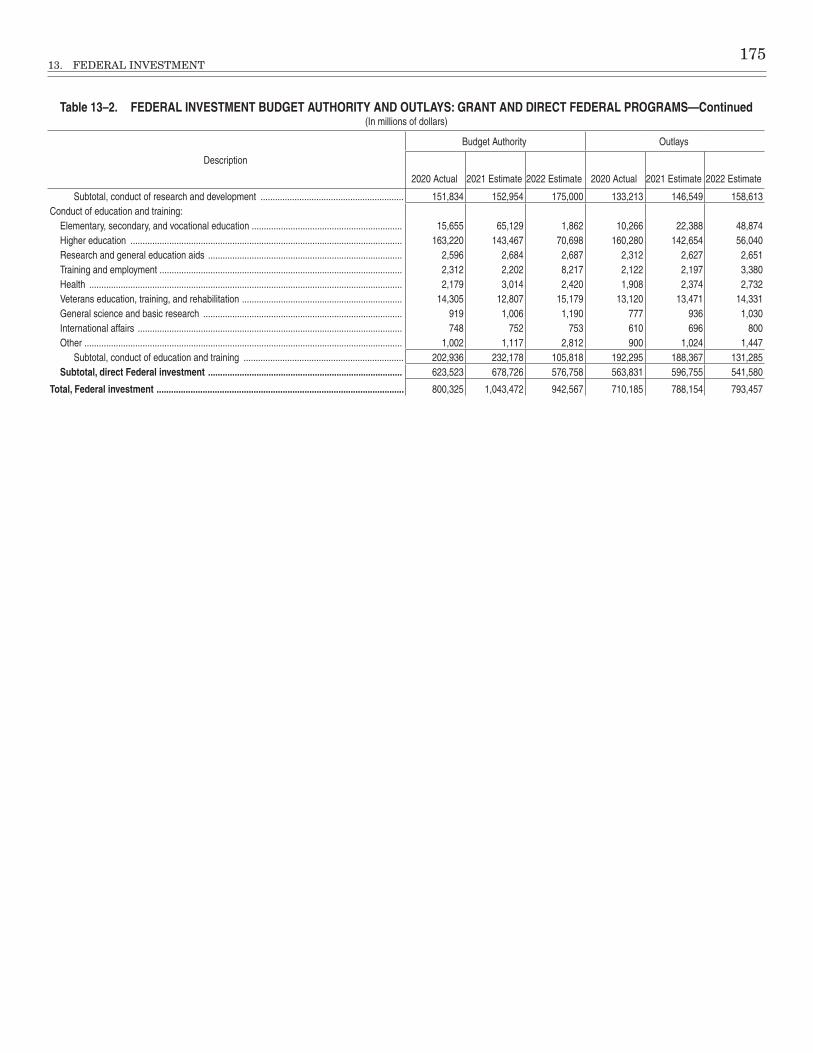
13. FEDERAL INVESTMENT 175
Table 13–2. FEDERAL INVESTMENT BUDGET AUTHORITY AND OUTLAYS: GRANT AND DIRECT FEDERAL PROGRAMS—Continued(In millions of dollars)
Description
Budget Authority Outlays
2020 Actual 2021 Estimate 2022 Estimate 2020 Actual 2021 Estimate 2022 Estimate
Subtotal, conduct of research and development ����������������������������������������������������������� 151,834 152,954 175,000 133,213 146,549 158,613Conduct of education and training:
Elementary, secondary, and vocational education �������������������������������������������������������������� 15,655 65,129 1,862 10,266 22,388 48,874Higher education ���������������������������������������������������������������������������������������������������������������� 163,220 143,467 70,698 160,280 142,654 56,040Research and general education aids �������������������������������������������������������������������������������� 2,596 2,684 2,687 2,312 2,627 2,651Training and employment ���������������������������������������������������������������������������������������������������� 2,312 2,202 8,217 2,122 2,197 3,380Health ��������������������������������������������������������������������������������������������������������������������������������� 2,179 3,014 2,420 1,908 2,374 2,732Veterans education, training, and rehabilitation ������������������������������������������������������������������ 14,305 12,807 15,179 13,120 13,471 14,331General science and basic research ���������������������������������������������������������������������������������� 919 1,006 1,190 777 936 1,030International affairs ������������������������������������������������������������������������������������������������������������� 748 752 753 610 696 800Other ����������������������������������������������������������������������������������������������������������������������������������� 1,002 1,117 2,812 900 1,024 1,447
Subtotal, conduct of education and training ������������������������������������������������������������������ 202,936 232,178 105,818 192,295 188,367 131,285Subtotal, direct Federal investment ................................................................................ 623,523 678,726 576,758 563,831 596,755 541,580
Total, Federal investment ...................................................................................................... 800,325 1,043,472 942,567 710,185 788,154 793,457

177
14. RESEARCH AND DEVELOPMENT
Investments in research and development (R&D) are necessary to help spur innovation across the economy and renew America’s global leadership. R&D is also critical to tackling the climate crisis and driving the emerging technologies that will power future industries and create good-paying jobs across the nation. The 2022 Budget proposes $171.26 billion, a 9 percent increase, in total research and development across the Federal Government. A breakdown of the request by the major
funding Department or agency is shown in the table at the end of this chapter. In addition to the 2022 Budget figures discussed in this chapter, the American Jobs Plan includes major R&D investments, including $50 billion in the National Science Foundation, $30 billion in additional funding for R&D that spurs innovation and job creation and $40 billion to upgrade research infrastructure in lab-oratories across the country.
FEDERAL R&D DATA
R&D is the collection of efforts directed toward gaining greater knowledge or understanding and ap-plying knowledge toward the production of useful materials, devices, and methods. R&D investments can be characterized as basic research, applied research, experimental development, R&D equipment, or R&D facilities. The Office of Management and Budget (OMB) has used those or similar categories in its collection of R&D data since 1949. Please note that R&D crosscuts in specific topical areas as mandated by law will be re-ported separately in forthcoming Supplements to the President’s 2022 Budget.
Background on Federal R&D Funding
More than 20 Federal agencies fund R&D in the United States. The character of the R&D that these agencies fund depends on the mission of each agency and on the role of R&D in accomplishing it. Table 14–1 shows agency-by-agency spending on basic research, applied research, experimental development, and R&D equipment and facilities.
Basic research is systematic study directed toward a fuller knowledge or understanding of the fundamental aspects of phenomena and of observable facts without specific applications toward processes or products in
mind. Basic research, however, may include activities with broad applications in mind.
Applied research is systematic study to gain knowledge or understanding necessary to determine the means by which a recognized and specific need may be met.
Experimental development is creative and systematic work, drawing on knowledge gained from research and practical experience, which is directed at producing new products or processes or improving existing products or processes. Like research, experimental development will result in gaining additional knowledge.
Research and development equipment includes acqui-sition or design and production of movable equipment, such as spectrometers, research satellites, detectors, and other instruments. At a minimum, this category includes programs devoted to the purchase or construction of R&D equipment.
Research and development facilities include the ac-quisition, design, and construction of, or major repairs or alterations to, all physical facilities for use in R&D activi-ties. Facilities include land, buildings, and fixed capital equipment, regardless of whether the facilities are to be used by the Government or by a private organization, and regardless of where title to the property may rest. This category includes such fixed facilities as reactors, wind tunnels, and particle accelerators.
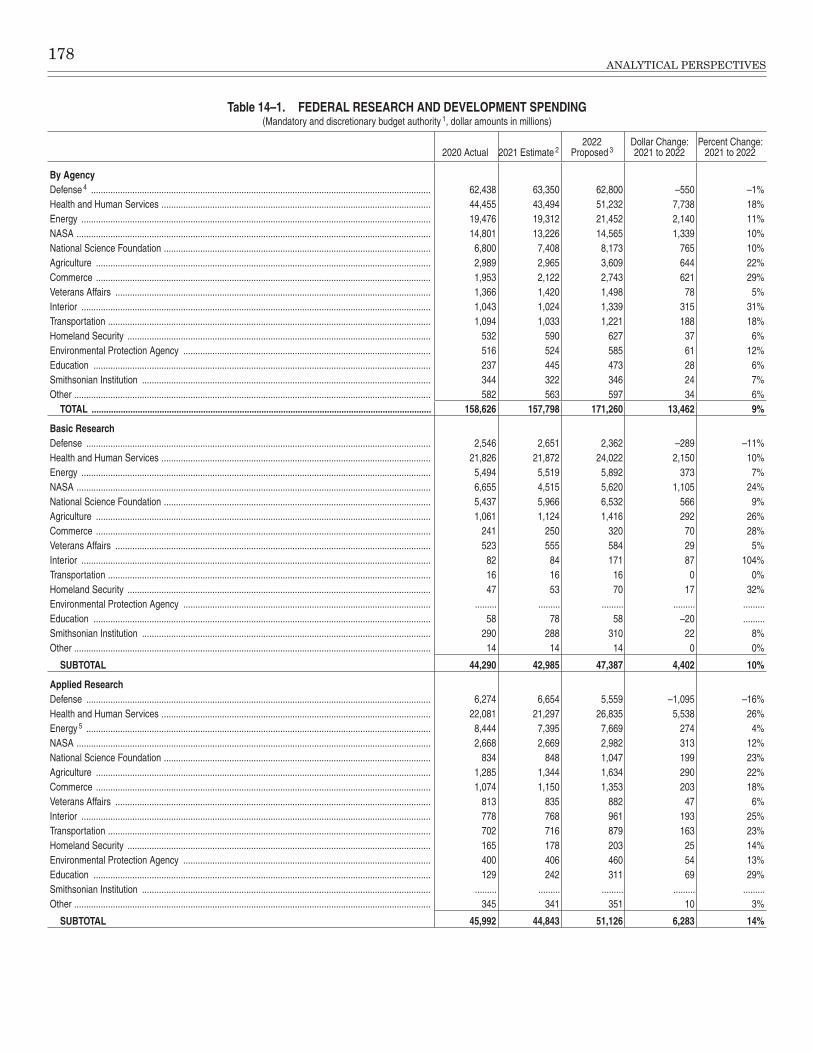
178ANALYTICAL PERSPECTIVES
Table 14–1. FEDERAL RESEARCH AND DEVELOPMENT SPENDING (Mandatory and discretionary budget authority 1, dollar amounts in millions)
2020 Actual 2021 Estimate 22022
Proposed 3Dollar Change: 2021 to 2022
Percent Change: 2021 to 2022
By AgencyDefense 4 �������������������������������������������������������������������������������������������������������������������������������������������� 62,438 63,350 62,800 –550 –1%Health and Human Services ��������������������������������������������������������������������������������������������������������������� 44,455 43,494 51,232 7,738 18%Energy ������������������������������������������������������������������������������������������������������������������������������������������������ 19,476 19,312 21,452 2,140 11%NASA �������������������������������������������������������������������������������������������������������������������������������������������������� 14,801 13,226 14,565 1,339 10%National Science Foundation �������������������������������������������������������������������������������������������������������������� 6,800 7,408 8,173 765 10%Agriculture ������������������������������������������������������������������������������������������������������������������������������������������ 2,989 2,965 3,609 644 22%Commerce ������������������������������������������������������������������������������������������������������������������������������������������ 1,953 2,122 2,743 621 29%Veterans Affairs ���������������������������������������������������������������������������������������������������������������������������������� 1,366 1,420 1,498 78 5%Interior ������������������������������������������������������������������������������������������������������������������������������������������������ 1,043 1,024 1,339 315 31%Transportation ������������������������������������������������������������������������������������������������������������������������������������� 1,094 1,033 1,221 188 18%Homeland Security ����������������������������������������������������������������������������������������������������������������������������� 532 590 627 37 6%Environmental Protection Agency ������������������������������������������������������������������������������������������������������ 516 524 585 61 12%Education ������������������������������������������������������������������������������������������������������������������������������������������� 237 445 473 28 6%Smithsonian Institution ����������������������������������������������������������������������������������������������������������������������� 344 322 346 24 7%Other ��������������������������������������������������������������������������������������������������������������������������������������������������� 582 563 597 34 6%
TOTAL ............................................................................................................................................ 158,626 157,798 171,260 13,462 9%
Basic ResearchDefense ���������������������������������������������������������������������������������������������������������������������������������������������� 2,546 2,651 2,362 –289 –11%Health and Human Services ��������������������������������������������������������������������������������������������������������������� 21,826 21,872 24,022 2,150 10%Energy ������������������������������������������������������������������������������������������������������������������������������������������������ 5,494 5,519 5,892 373 7%NASA �������������������������������������������������������������������������������������������������������������������������������������������������� 6,655 4,515 5,620 1,105 24%National Science Foundation �������������������������������������������������������������������������������������������������������������� 5,437 5,966 6,532 566 9%Agriculture ������������������������������������������������������������������������������������������������������������������������������������������ 1,061 1,124 1,416 292 26%Commerce ������������������������������������������������������������������������������������������������������������������������������������������ 241 250 320 70 28%Veterans Affairs ���������������������������������������������������������������������������������������������������������������������������������� 523 555 584 29 5%Interior ������������������������������������������������������������������������������������������������������������������������������������������������ 82 84 171 87 104%Transportation ������������������������������������������������������������������������������������������������������������������������������������� 16 16 16 0 0%Homeland Security ����������������������������������������������������������������������������������������������������������������������������� 47 53 70 17 32%Environmental Protection Agency ������������������������������������������������������������������������������������������������������ ��������� ��������� ��������� ��������� ���������Education ������������������������������������������������������������������������������������������������������������������������������������������� 58 78 58 –20 ���������Smithsonian Institution ����������������������������������������������������������������������������������������������������������������������� 290 288 310 22 8%Other ��������������������������������������������������������������������������������������������������������������������������������������������������� 14 14 14 0 0%
SUBTOTAL 44,290 42,985 47,387 4,402 10%
Applied ResearchDefense ���������������������������������������������������������������������������������������������������������������������������������������������� 6,274 6,654 5,559 –1,095 –16%Health and Human Services ��������������������������������������������������������������������������������������������������������������� 22,081 21,297 26,835 5,538 26%Energy 5 ���������������������������������������������������������������������������������������������������������������������������������������������� 8,444 7,395 7,669 274 4%NASA �������������������������������������������������������������������������������������������������������������������������������������������������� 2,668 2,669 2,982 313 12%National Science Foundation �������������������������������������������������������������������������������������������������������������� 834 848 1,047 199 23%Agriculture ������������������������������������������������������������������������������������������������������������������������������������������ 1,285 1,344 1,634 290 22%Commerce ������������������������������������������������������������������������������������������������������������������������������������������ 1,074 1,150 1,353 203 18%Veterans Affairs ���������������������������������������������������������������������������������������������������������������������������������� 813 835 882 47 6%Interior ������������������������������������������������������������������������������������������������������������������������������������������������ 778 768 961 193 25%Transportation ������������������������������������������������������������������������������������������������������������������������������������� 702 716 879 163 23%Homeland Security ����������������������������������������������������������������������������������������������������������������������������� 165 178 203 25 14%Environmental Protection Agency ������������������������������������������������������������������������������������������������������ 400 406 460 54 13%Education ������������������������������������������������������������������������������������������������������������������������������������������� 129 242 311 69 29%Smithsonian Institution ����������������������������������������������������������������������������������������������������������������������� ��������� ��������� ��������� ��������� ���������Other ��������������������������������������������������������������������������������������������������������������������������������������������������� 345 341 351 10 3%
SUBTOTAL 45,992 44,843 51,126 6,283 14%
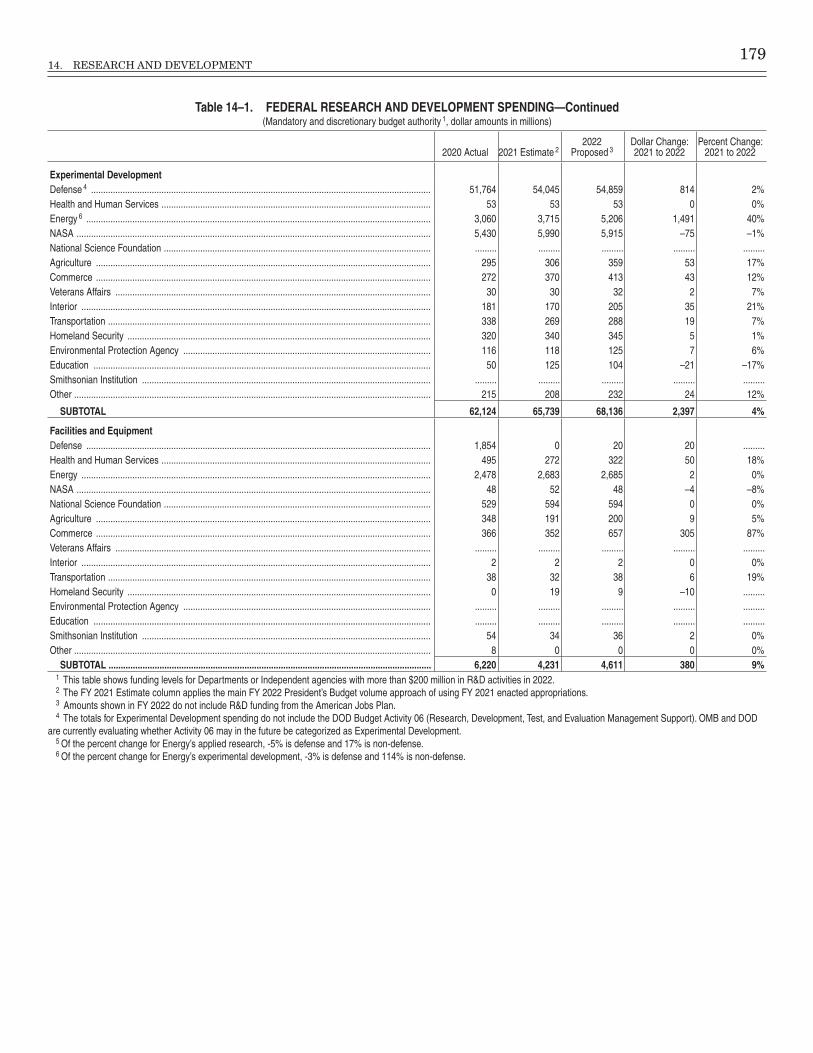
14. RESEARCH AND DEVELOPMENT 179
Table 14–1. FEDERAL RESEARCH AND DEVELOPMENT SPENDING —Continued(Mandatory and discretionary budget authority 1, dollar amounts in millions)
2020 Actual 2021 Estimate 22022
Proposed 3Dollar Change: 2021 to 2022
Percent Change: 2021 to 2022
Experimental DevelopmentDefense 4 �������������������������������������������������������������������������������������������������������������������������������������������� 51,764 54,045 54,859 814 2%Health and Human Services ��������������������������������������������������������������������������������������������������������������� 53 53 53 0 0%Energy 6 ���������������������������������������������������������������������������������������������������������������������������������������������� 3,060 3,715 5,206 1,491 40%NASA �������������������������������������������������������������������������������������������������������������������������������������������������� 5,430 5,990 5,915 –75 –1%National Science Foundation �������������������������������������������������������������������������������������������������������������� ��������� ��������� ��������� ��������� ���������Agriculture ������������������������������������������������������������������������������������������������������������������������������������������ 295 306 359 53 17%Commerce ������������������������������������������������������������������������������������������������������������������������������������������ 272 370 413 43 12%Veterans Affairs ���������������������������������������������������������������������������������������������������������������������������������� 30 30 32 2 7%Interior ������������������������������������������������������������������������������������������������������������������������������������������������ 181 170 205 35 21%Transportation ������������������������������������������������������������������������������������������������������������������������������������� 338 269 288 19 7%Homeland Security ����������������������������������������������������������������������������������������������������������������������������� 320 340 345 5 1%Environmental Protection Agency ������������������������������������������������������������������������������������������������������ 116 118 125 7 6%Education ������������������������������������������������������������������������������������������������������������������������������������������� 50 125 104 –21 –17%Smithsonian Institution ����������������������������������������������������������������������������������������������������������������������� ��������� ��������� ��������� ��������� ���������Other ��������������������������������������������������������������������������������������������������������������������������������������������������� 215 208 232 24 12%
SUBTOTAL 62,124 65,739 68,136 2,397 4%
Facilities and EquipmentDefense ���������������������������������������������������������������������������������������������������������������������������������������������� 1,854 0 20 20 ���������Health and Human Services ��������������������������������������������������������������������������������������������������������������� 495 272 322 50 18%Energy ������������������������������������������������������������������������������������������������������������������������������������������������ 2,478 2,683 2,685 2 0%NASA �������������������������������������������������������������������������������������������������������������������������������������������������� 48 52 48 –4 –8%National Science Foundation �������������������������������������������������������������������������������������������������������������� 529 594 594 0 0%Agriculture ������������������������������������������������������������������������������������������������������������������������������������������ 348 191 200 9 5%Commerce ������������������������������������������������������������������������������������������������������������������������������������������ 366 352 657 305 87%Veterans Affairs ���������������������������������������������������������������������������������������������������������������������������������� ��������� ��������� ��������� ��������� ���������Interior ������������������������������������������������������������������������������������������������������������������������������������������������ 2 2 2 0 0%Transportation ������������������������������������������������������������������������������������������������������������������������������������� 38 32 38 6 19%Homeland Security ����������������������������������������������������������������������������������������������������������������������������� 0 19 9 –10 ���������Environmental Protection Agency ������������������������������������������������������������������������������������������������������ ��������� ��������� ��������� ��������� ���������Education ������������������������������������������������������������������������������������������������������������������������������������������� ��������� ��������� ��������� ��������� ���������Smithsonian Institution ����������������������������������������������������������������������������������������������������������������������� 54 34 36 2 0%Other ��������������������������������������������������������������������������������������������������������������������������������������������������� 8 0 0 0 0%
SUBTOTAL ..................................................................................................................................... 6,220 4,231 4,611 380 9%1 This table shows funding levels for Departments or Independent agencies with more than $200 million in R&D activities in 2022�2 The FY 2021 Estimate column applies the main FY 2022 President’s Budget volume approach of using FY 2021 enacted appropriations�3 Amounts shown in FY 2022 do not include R&D funding from the American Jobs Plan� 4 The totals for Experimental Development spending do not include the DOD Budget Activity 06 (Research, Development, Test, and Evaluation Management Support)� OMB and DOD
are currently evaluating whether Activity 06 may in the future be categorized as Experimental Development�5 Of the percent change for Energy’s applied research, -5% is defense and 17% is non-defense�6 Of the percent change for Energy’s experimental development, -3% is defense and 114% is non-defense�

181
15. CREDIT AND INSURANCE
The Federal Government offers direct loans and loan guarantees to support a wide range of activities including home ownership, student loans, small business, farming, energy, infrastructure investment, and exports. In addi-tion, Government-sponsored enterprises (GSEs) operate under Federal charters for the purpose of enhancing credit availability for targeted sectors. Through its insur-ance programs, the Federal Government insures deposits at depository institutions, guarantees private-sector de-fined-benefit pensions, and insures against some other risks such as flood and terrorism.
This chapter discusses the roles of these diverse programs. The first section discusses individual cred-it programs and GSEs. The second section reviews Federal deposit insurance, pension guarantees, di-saster insurance, and insurance against terrorism and other security-related risks. This year’s chapter includes a brief analysis of the Troubled Asset Relief Program (TARP), which was previously contained in a separate chapter.
I. CREDIT IN VARIOUS SECTORS
Housing Credit Programs
Through housing credit programs, the Federal Government promotes homeownership among various target groups, including low- and moderate-income peo-ple, veterans, and rural residents. In times of economic crisis, the Federal Government’s role and target market can expand dramatically.
Coronavirus Disease 2019 (COVID-19): Impact and Federal Response
Loss of income and other hardships due to COVID-19 have left many homeowners unable to meet their fi-nancial obligations, including mortgage payments. In response, Congress and Federal agencies have provided relief in the form of foreclosure moratoriums, payment forbearance, credit reporting protections and enhanced loss mitigation. For example, the Coronavirus Aid, Relief and Economic Security (CARES) Act required a 60-day foreclosure and eviction moratorium and up to one year of payment forbearance with no additional fees for home-owners with Federally-backed mortgages. More recently, the Departments of Housing and Urban Development, Veterans Affairs and Agriculture extended the foreclosure and eviction moratorium and forbearance enrollment window through June 30, 2021, and provided up to an ad-ditional six months of forbearance for certain borrowers.
Federal Housing Administration
The Federal Housing Administration (FHA) guar-antees single-family mortgages that provide access to homeownership for households who may have difficulty obtaining a conventional mortgage. In addition to tradi-tional single-family “forward” mortgages, FHA insures “reverse” mortgages for seniors (Home Equity Conversion
Mortgages, described below) and loans for the construc-tion, rehabilitation, and refinancing of multifamily housing, hospitals and other healthcare facilities.
FHA Single-Family Forward Mortgages
FHA has been a primary facilitator of mortgage cred-it for first-time and minority homebuyers, a pioneer of products such as the 30-year self-amortizing mortgage, and a vehicle to enhance credit for many low- to moder-ate-income households. One of the major benefits of an FHA-insured mortgage is that it provides a homeowner-ship option for borrowers who, though they can only make a modest down-payment, can show that they are credit-worthy and have sufficient income to afford the house they want to buy. In 2020, 83 percent of FHA purchase mortgages were obtained by first-time homebuyers. Of all FHA loans (purchase and refinance), 33 percent served minority borrowers and 50 percent served low- to moder-ate-income borrowers.
FHA Home Equity Conversion Mortgages
Home Equity Conversion Mortgages (HECMs), or “re-verse” mortgages, are designed to support aging in place by enabling elderly homeowners to borrow against the eq-uity in their homes without having to make repayments during their lifetime (unless they move, refinance or fail to meet certain requirements). A HECM is known as a “reverse” mortgage because the change in home equity over time is generally the opposite of a forward mortgage. While a traditional forward mortgage starts with a small amount of equity and builds equity with amortization of the loan, a HECM starts with a large equity cushion that declines over time as the loan accrues interest and pre-miums. The risk of HECMs is therefore weighted toward the end of the mortgage, while forward mortgage risk is concentrated in the first 10 years.

182ANALYTICAL PERSPECTIVES
FHA Mutual Mortgage Insurance (MMI) Fund
FHA guarantees for forward and reverse mortgages are administered under the Mutual Mortgage Insurance (MMI) Fund. At the end of 2020, the MMI Fund had $1.295 trillion in total mortgages outstanding and a capi-tal ratio of 6.10 percent, remaining above the 2 percent statutory minimum for the fifth straight year and in-creasing from the 2019 level of 4.84 percent. Although the capital ratio has improved, the serious delinquency (SDQ) rate1, a key indicator of portfolio performance, increased from 3.9 percent to 11.6 percent as many FHA borrowers experienced financial hardship due to COVID-19. The im-pact of this elevated SDQ rate on the health of the MMI Fund is uncertain at this time as borrowers continue to work through available loss mitigation options. For more information on the financial status of the MMI Fund, please see the Annual Report to Congress Regarding the Financial Status of the FHA Mutual Mortgage Insurance Fund, Fiscal Year 2020.2
FHA’s new origination volume in 2020 was $310 bil-lion for forward mortgages and $16 billion for HECMs, and the Budget projects $247 billion and $16 billion, re-spectively, for 2022.
FHA Multifamily and Healthcare Guarantees
In addition to the single-family mortgage insurance pro-vided through the MMI Fund, FHA’s General Insurance and Special Risk Insurance (GISRI) loan programs con-tinue to facilitate the construction, rehabilitation, and refinancing of multifamily housing, hospitals and other healthcare facilities. The credit enhancement provided by FHA enables borrowers to obtain long-term, fixed-rate fi-nancing, which mitigates interest rate risk and facilitates lower monthly mortgage payments. This can improve the financial sustainability of multifamily housing and healthcare facilities, and may also translate into more af-fordable rents and lower healthcare costs for consumers.
GISRI’s new origination loan volume for all programs in 2020 was $26 billion and the Budget projects $33 bil-lion for 2022. The total amount of guarantees outstanding on mortgages in the FHA GISRI Fund were $165 billion at the end of 2020.
VA Housing Loan Program
The Department of Veterans Affairs (VA) assists vet-erans, members of the Selected Reserve, and active duty personnel in purchasing homes in recognition of their service to the Nation. The VA housing loan program effec-tively substitutes a Federal guarantee for the borrower’s down payment, meaning more favorable lending terms for veterans. Under this program, VA does not guarantee the entire mortgage loan, but typically fully guarantees the first 25 percent of losses upon default. In fiscal year 2020, VA guaranteed a total of 428,1421 new purchase home
1 The SDQ rate tracks the percentage of FHA-insured mortgages where the borrower is 90 or more days delinquent, including mortgages in foreclosure and bankruptcy.
2 https://www.hud.gov/sites/dfiles/Housing/documents/2020FHAAnnualReportMMIFund.pdf
loans, providing approximately $32 billion in guarantees. Additionally, 662,065 veteran borrowers lowered inter-est rates on their home mortgages through streamlined refinancing. VA provided approximately $94 billion in guarantees for 1,246,816 VA loans in 2020. That followed $44 billion in guarantees for 624,546 VA loans closed in FY 2019.
VA, in cooperation with VA-guaranteed loan servicers, also assists borrowers through home retention options and alternatives to foreclosure. VA intervenes when needed to help veterans and service members avoid fore-closure through loan modifications, special forbearances, repayment plans, and acquired loans, as well as assis-tance to complete compromised sales or deeds-in-lieu of foreclosure. These standard efforts helped resolve over 93 percent of defaulted VA-guaranteed loans and assisted over 119,000 veterans retain homeownership or avoid foreclosure in 2020. These efforts resulted in $3.4 billion in avoided guaranteed claim payments. As noted above, VA has responded to the COVID crisis by providing special CARES Act forbearances to support otherwise-current borrowers through the pandemic. As of September 30, 2020, 200,460 VA borrowers were participating in a spe-cial CARES Act forbearance.
Rural Housing Service
The Rural Housing Service (RHS) at the U.S. Depart-ment of Agriculture (USDA) offers direct and guaranteed loans to help very-low- to moderate-income rural resi-dents buy and maintain adequate, affordable housing. RHS housing loans and loan guarantees differ from other Federal housing loan programs in that they are means-tested, making them more accessible to low-income, rural residents. The single family housing guaranteed loan program is designed to provide home loan guarantees for moderate-income rural residents whose incomes are between 80 percent and 115 percent (maximum for the program) of area median income.
RHS has traditionally offered both direct and guar-anteed homeownership loans. The direct single family housing loans have been historically funded at $1 billion a year, while the single family housing guaranteed loan program, authorized in 1990 at $100 million, has grown into a $24 billion loan program annually. USDA also of-fers direct and guaranteed multifamily housing loans, as well as housing repair loans.
Education Credit Programs
The Department of Education (ED) direct student loan program is one of the largest Federal credit programs, with $1.315 trillion in Direct Loan principal outstanding at the end of 2020. The Federal student loan programs provide students and their families with the funds to help meet postsecondary education costs. Because funding for the loan programs is provided through mandatory bud-get authority, student loans are considered separately for budget purposes from other Federal student financial as-sistance programs (which are largely discretionary), but
15. CREDIT AND INSURANCE 183
should be viewed as part of the overall Federal effort to expand access to higher education.
Loans for higher education were first authorized under the William D. Ford program, which was included in the Higher Education Act of 1965. The direct loan program was authorized by the Student Loan Reform Act of 1993 (Public Law 103–66). The enactment of the Student Aid and Fiscal Responsibility Act (SAFRA) of 2010 (Public Law 111–152) ended the guaranteed Federal Financial Education Loan (FFEL) program. On July 1, 2010, ED be-came the sole originator of Federal student loans through the Direct Loan program.
Under the current direct loan program, the Federal Government partners with over 6,000 institutions of high-er education, which then disburse loan funds to students. Loans are available to students and parents of students regardless of income and only Parent and Graduate PLUS loans includes a minimal credit check. There are three types of Direct Loans: Federal Direct Subsidized Stafford Loans, Federal Direct Unsubsidized Stafford Loans, and Federal Direct PLUS Loans, each with different terms.
The Direct Loan program offers a variety of repay-ment options including income-driven repayment ones for all student borrowers. Depending on the plan, monthly payments are capped at no more than 10 or 15 percent of borrower discretionary income with any remaining balance after 20 or 25 years forgiven. In addition, borrow-ers working in public service professions while making 10 years of qualifying payments are eligible for Public Service Loan Forgiveness (PSLF).
Small Business and Farm Credit Programs
The Government offers direct loans and loan guarantees to small businesses and farmers, who may have difficulty obtaining credit elsewhere. It also provides guarantees of debt issued by certain investment funds that invest in small businesses. Two GSEs, the Farm Credit System and the Federal Agricultural Mortgage Corporation, increase liquidity in the agricultural lending market.
Small Business Administration
SBA ensures that small businesses across the Nation have the tools and resources needed to start, grow, and recover their business. SBA has grown significantly since the agency’s creation in 1953, both in terms of the total assistance provided and the array of programs offered to small business owners. SBA’s lending programs com-plement credit markets by offering creditworthy small businesses access to affordable credit through private lenders when they cannot otherwise obtain financing on reasonable terms or conditions.
In 2020, SBA provided $19.6 billion in loan guarantees to assist small business owners with access to affordable capital through its largest program, the 7(a) General Business Loan Guarantee program. This program pro-vides access to financing for general business operations, such as operating and capital expenses. In addition, through the 504 Certified Development Company (CDC) and Refinance Programs, SBA supported approximately
$6.7 billion in guaranteed loans for fixed-asset financing and provided the opportunity for small businesses to re-finance existing 504 CDC loans. These programs enable small businesses to secure financing for assets such as machinery and equipment, construction, and commercial real estate, and to take advantage of current low interest rates and free up resources for expansion. Furthermore, the Small Business Investment Company (SBIC) Program supports privately-owned and operated venture capi-tal investment firms that invest in small businesses. In 2020, SBA supported $3.1 billion in SBIC venture capi-tal investments. In addition to these guaranteed lending programs, the 7(m) Direct Microloan program supports the smallest of businesses, startups, and underserved entrepreneurs through loans of up to $50,000 made by non-profit intermediaries. In 2020, SBA recorded a record year by facilitating nearly $85 million in microlending.
SBA continues to be a valuable source for American communities who need access to low-interest loans to recover quickly in the wake of disaster, especially due to the COVID-19 pandemic. At the end of 2020, the SBA was working 275 active disaster assistance declarations and approved disaster loans totaling $195 billion in lending to businesses, homeowners, renters, and property owners. To further assist with COVID-19 relief, Congress created the Paycheck Protection Program (PPP) under the CARES Act to provide small businesses with funds to provide up to 8 weeks of payroll costs, including benefits. In 2020, the PPP provided an additional 5.2 million loans worth more than $525 billion.
Community Development Financial Institutions
Since its creation in 1994, the Department of the Treasury’s Community Development Financial Institutions (CDFI) Fund has, through different grant, loan, and tax credit programs, worked to expand the avail-ability of credit, investment capital, and financial services for underserved people and communities by supporting the growth and capacity of a national network of CDFIs, investors, and financial service providers. Today, there are over 1,000 Certified CDFIs nationwide, including a vari-ety of loan funds, community development banks, credit unions, and venture capital funds. CDFI certification also enables some non-depository financial institutions to apply for financing programs offered by certain Federal Home Loan Banks.
Unlike other CDFI Fund programs, the CDFI Bond Guarantee Program (BGP), enacted through the Small Business Jobs Act of 2010, does not offer grants, but is instead a Federal credit program. The BGP was designed to provide CDFIs greater access to low-cost, long-term, fixed-rate capital.
Under the BGP, Treasury provides a 100-percent guar-antee on long-term bonds of at least $100 million issued to qualified CDFIs, with a maximum maturity of 30 years. To date, Treasury has issued $1.7 billion in bond guaran-tee commitments to 25 CDFIs, $1.3 billion of which has been disbursed to help finance affordable housing, charter schools, commercial real estate, community healthcare

184ANALYTICAL PERSPECTIVES
facilities and other eligible uses in 27 States and the District of Columbia.
Farm Service Agency
Farm operating loans were first offered in 1937 by the newly created Farm Security Administration to assist family farmers who were unable to obtain credit from a commercial source to buy equipment, livestock, or seed. Farm ownership loans were authorized in 1961 to pro-vide family farmers with financial assistance to purchase farmland. Presently, the Farm Service Agency (FSA) assists low-income family farmers in starting and main-taining viable farming operations. Emphasis is placed on aiding beginning and socially disadvantaged farmers. Legislation mandates that a portion of appropriated funds are set-aside for exclusive use by underserved groups.
FSA offers operating loans and ownership loans, both of which may be either direct or guaranteed loans. Operating loans provide credit to farmers and ranchers for annual production expenses and purchases of live-stock, machinery, and equipment, while farm ownership loans assist producers in acquiring and developing their farming or ranching operations. As a condition of eligibil-ity for direct loans, borrowers must be unable to obtain private credit at reasonable rates and terms. As FSA is the “lender of last resort,” default rates on FSA direct loans are generally higher than those on private-sector loans. FSA-guaranteed farm loans are made to more creditworthy borrowers who have access to private cred-it markets. Because the private loan originators must retain 10 percent of the risk, they exercise care in exam-ining the repayment ability of borrowers. The subsidy rates for the direct programs fluctuate largely because of changes in the interest component of the subsidy rate. Since the early 1990’s, the majority of FSA loan assis-tance has been through guarantees rather than direct lending.
In 2020, FSA provided loans and loan guarantees to almost 35,000 family farmers totaling $7.5 billion. In re-cent years, FSA assistance has been at record levels due to various adversities in the agricultural economy. The av-erage size of farm ownership loans remained consistent over the past few years, with new customers receiving the bulk of the direct loans. Direct and guaranteed loan programs provided assistance totaling $3.45 billion to more than 19,500 beginning farmers. The majority of as-sistance provided in the operating loan program during 2020 was to beginning farmers. Sixty percent of direct operating loans were made to beginning farmers. A begin-ning farmer is an individual or entity who: has operated a farm for not more than 10 years; substantially partici-pates in farm operation; and, for farm ownership loans, the applicant cannot own a farm greater than 30 percent of the average size farm in the county at time of applica-tion. If the applicant is an entity, all entity members must be related by blood or marriage, and all members must be eligible beginning farmers.
Loans for socially disadvantaged farmers totaled $1.09 billion, of which $739 million was in the farm ownership program and $349 million in the farm operating program.
Lending to minority and women farmers was a significant portion of overall assistance provided, with $1.09 billion in loans and loan guarantees provided to more than 6,850 farmers. Loan assistance provided to beginning and so-cially disadvantaged farmers increased in 2020 compared to 2019, fulfilling an initiative of the Department to ex-pand lending to underserved groups as a percentage of total loans made.
The FSA Microloan program increases overall direct and guaranteed lending to small niche producers and minorities. This program dramatically simplifies appli-cation procedures for small loans and implement more flexible eligibility and experience requirements. Demand for the micro-loan program continues to grow while de-linquencies and defaults remain at or below those of the regular FSA operating loan program.
Energy and Infrastructure Credit Programs
The Department of Energy (DOE) administers three credit programs: Title XVII the Advanced Technology Vehicle Manufacturing (ATVM) loan program, and the Tribal Energy Loan Guarantee Program. Title XVII of the Energy Policy Act of 2005 (Public Law 109–58) au-thorizes DOE to issue loan guarantees for projects that employ innovative technologies to reduce air pollutants or man-made greenhouse gases. Most Title XVII loan authority requires borrowers to pay the credit subsidy cost, though Congress did appropriate $161 million for credit subsidy (net of subsequent rescissions) to sup-port loan guarantees for renewable energy and efficient end-use technologies. The FY 2022 President’s Budget requests $150 million in discretionary credit subsidy to support eligible projects. To date, DOE has issued (and amended) three loan guarantees totaling over $11 bil-lion to support the construction of two new commercial nuclear power reactors. DOE has one active conditional commitment of $2 billion to support an innovative pet-coke to methanol facility integrated with carbon capture and storage. DOE has over $22.4 billion in available loan guarantee authority available and is actively working with applicants proceeding to conditional commitment and financial close.
The American Reinvestment and Recovery Act of 2009 (Public Law 111–5) amended the program’s au-thorizing statute and appropriated credit subsidy to support loan guarantees on a temporary basis for com-mercial or advanced renewable energy systems, electric power transmission systems, and leading-edge biofuel projects. Authority for the temporary program to extend new loans expired September 30, 2011. Over $16 bil-lion in loans and loan guarantees was disbursed under 24 of the loan guarantees issued prior to the program’s expiration.
Section 136 of the Energy Independence and Security Act of 2007 (Public Law 110–140) authorizes DOE to issue loans to support the development of advanced tech-nology vehicles and qualifying components. In 2009, the Congress appropriated $7.5 billion in credit subsidy to support a maximum of $25 billion in loans under ATVM.
15. CREDIT AND INSURANCE 185
From 2009 to 2011, DOE issued five loans totaling over $8 billion to support the manufacturing of advanced technol-ogy vehicles. DOE has over $2.4 billion in credit subsidy balances available to support up to $17.7 billion in loans and is actively working with applicants proceeding to con-ditional commitment and financial close.
Title XXVI of the Energy Policy Act of 1992, as amended (Public Law 102-486, Public Law 109-58) authorizes DOE to guarantee up to $2 billion in loans to Indian tribes for energy development. In 2017, the Congress appropriated $8.5 million in credit subsidy to support tribal energy development. DOE issued a solicitation in 2018 and is ac-tively working with applicants proceeding to conditional commitment and financial close.
Electric and Telecommunications Loans
Rural Utilities Service (RUS) programs of the USDA provide grants and loans to support the distribution of rural electrification, telecommunications, distance learn-ing, and broadband infrastructure systems.
In 2020, RUS delivered $6.34 billion in direct electri-fication loans (including $5.49 billion in FFB Electric Loans, $750 million in electric underwriting, and $104 million rural energy savings loans), $93 million in direct telecommunications loans, and $394 million in Reconnect broadband loans.
USDA Rural Infrastructure and Business Development Programs
USDA, through a variety of Rural Development (RD) programs, provides grants, direct loans, and loan guar-antees to communities for constructing facilities such as healthcare clinics, police stations, and water systems, as well as to assist rural businesses and cooperatives in creating new community infrastructure (e.g., educa-tional and healthcare networks) and to diversify the rural economy and employment opportunities. In 2020, RD provided $1.3 billion in Community Facility (CF) di-rect loans, which are for communities of 20,000 or less. The CF programs have the flexibility to finance more than 100 separate types of essential community infra-structure that ultimately improve access to healthcare, education, public safety and other critical facilities and services. RD also provided $1.4 billion in water and wastewater (W&W) direct loans, and guaranteed $1.7 billion in rural business loans, which will help create and save jobs in rural America. The 2018 Farm Bill gave CF and W&W loan guarantees new authorization to serve communities of 50,000 or less and allowed the pro-grams to charge a fee to offset the loan subsidy cost. RD began executing the programs with the new authorities in 2020.
Water Infrastructure
The Environmental Protection Agency’s (EPA) Water Infrastructure Finance and Innovation Act (WIFIA) program accelerates investment in the Nation’s wa-ter infrastructure by providing long-term, low-cost supplemental loans for projects of regional or national significance. In 2020, EPA selected fifty-eight borrowers
to apply for a WIFIA loan totaling approximately $6 bil-lion. Those projects will leverage $7 billion in private capital, in addition to other funding sources, to help fi-nance a total of over $15 billion in water infrastructure investments. The selected projects demonstrate the broad range of project types that the WIFIA program can fi-nance, including wastewater, drinking water, stormwater, and water reuse projects.
Transportation Infrastructure
The Department of Transportation (DOT) adminis-ters credit programs that fund critical transportation infrastructure projects, often using innovative financ-ing methods. The two predominant programs are the Transportation Infrastructure Finance and Innovation Act (TIFIA) and the Railroad Rehabilitation and Improvement Financing (RRIF) loan programs. DOT’s Build America Bureau administers these programs, as well as Private Activity Bonds and the Nationally Significant Freight and Highway Projects (INFRA) grant program, all under one roof. The Bureau serves as the single point of con-tact for States, municipalities, and other project sponsors looking to utilize Federal transportation expertise, apply for Federal transportation credit and grant programs, and explore ways to access private capital in public-private partnerships. As with the 2021 Budget, the 2022 Budget will reflect the TIFIA and RRIF programs’ accounts in the Office of the Secretary, where the Bureau is housed, rather than in the Federal Highway Administration and Federal Railroad Administration.
Transportation Infrastructure Finance and Innovation Act (TIFIA)
Established by the Transportation Equity Act for the 21st century (TEA–21) (Public Law 105–178) in 1998, the TIFIA program is designed to fill market gaps and leverage substantial private co-investment by provid-ing supplemental and subordinate capital to projects of national or regional significance. Through TIFIA, DOT provides three types of Federal credit assistance to high-way, transit, rail, and intermodal projects: direct loans, loan guarantees, and lines of credit.
TIFIA can help advance qualified, large-scale projects that otherwise might be delayed or deferred because of size, complexity, or uncertainty over the timing of rev-enues at a relatively low budgetary cost. Each dollar of subsidy provided for TIFIA can provide approximately $14 in credit assistance, and leverage additional non-Fed-eral transportation infrastructure investment. Congress authorized $300 million for TIFIA in 2021.
Railroad Rehabilitation and Improvement Financing (RRIF)
Also established by TEA–21 in 1998, the RRIF pro-gram provides loans or loan guarantees with an interest rate equal to the Treasury rate for similar-term securi-ties. TEA–21 also stipulates that non-Federal sources pay the subsidy cost of the loan (a “Credit Risk Premium”), thereby allowing the program to operate without Federal subsidy appropriations. The RRIF program assists proj-
186ANALYTICAL PERSPECTIVES
ects that improve rail safety, enhance the environment, promote economic development, or enhance the capacity of the national rail network. While refinancing existing debt is an eligible use of RRIF proceeds, capital invest-ment projects that would not occur without a RRIF loan are prioritized. Since its inception, $6.3 billion in direct loans have been made under the RRIF program.
The Fixing America’s Surface Transportation (FAST) Act (Public Law 114–94) included programmatic changes to enhance the RRIF program to mirror the qualities of TIFIA, including broader eligibility, a loan term that can be as long as 35 years from project completion, and a fully subordinated loan under certain conditions. Additionally, in 2016 the Congress appropriated $1.96 million to assist Class II and Class III Railroads in preparing and apply-ing for direct loans and loan guarantees.
In the Consolidated Appropriations Act, 2018 (Public Law 115-141), for the first time in RRIF’s history, the Congress appropriated $25 million in subsidy budget au-thority for direct loans and loan guarantees to the RRIF program. This appropriation allows DOT to issue RRIF loans without requiring credit risk premiums from bor-rowers to cover the subsidy costs of the loans.
International Credit Programs
Through 2020, seven unique Federal agencies provide direct loans, loan guarantees, and insurance to a variety of private and sovereign borrowers: USDA, the Department of Defense, the Department of State, the Department of the Treasury, the Agency for International Development (USAID), the Export-Import Bank (ExIm), and the International Development Finance Corporation (DFC). These programs are intended to level the playing field for U.S. exporters, deliver robust support for U.S. goods and services, stabilize international financial markets, enhance security, and promote sustainable development.
Federal export credit programs counter official financ-ing that foreign governments around the world, largely in Europe and Japan, but also increasingly in emerging markets such as China and Brazil, provide their export-ers, usually through export credit agencies (ECAs). The U.S. Government has worked since the 1970’s to constrain official credit support through a multilateral agree-ment in the Organization for Economic Cooperation and Development (OECD). This agreement has established standards for Government-backed financing of exports. In addition to ongoing work in keeping these OECD stan-dards up-to-date, the U.S. Government established the International Working Group (IWG) on Export Credits to set up a new framework that will include China and other non-OECD countries, which until now have not been sub-ject to export credit standards. The process of establishing these new standards, which is not yet complete, advances a Congressional mandate to reduce subsidized export fi-nancing programs.
Export Support Programs
When the private sector is unable or unwilling to pro-vide financing, the Export-Import Bank, the U.S. Export
Credit Agency (“ECA”), fills the gap for American busi-nesses by equipping them with the financing support necessary to level the playing field against foreign com-petitors. ExIm support includes direct loans and loan guarantees for creditworthy foreign buyers to help secure export sales from U.S. exporters. It also includes work-ing capital guarantees and export credit insurance to help U.S. exporters secure financing for overseas sales. USDA’s Export Credit Guarantee Programs (also known as GSM programs) similarly help to level the playing field. Like programs of other agricultural exporting nations, GSM programs guarantee payment from countries and entities that want to import U.S. agricultural products but can-not easily obtain credit. The GSM 102 program provides guarantees for credit extended with short-term repay-ment terms not to exceed 18 months.
Exchange Stabilization Fund
Consistent with U.S. obligations in the International Monetary Fund regarding global financial stability, the Exchange Stabilization Fund (ESF) managed by the Department of the Treasury may provide loans or credits to a foreign entity or government of a foreign country. A loan or credit may not be made for more than six months in any 12-month period unless the President gives the Congress a written statement that unique or emergency circumstances require that the loan or credit be for more than six months. The CARES Act established within the ESF an Economic Stabilization Program with $500 billion in appropriations with temporary authority for up to $500 billion in lending and other eligible investments for: 1) airlines and certain airline industry-related businesses; 2) businesses critical to maintaining national security; and 3) programs or facilities established by the Board of Governors of the Federal Reserve System for the purpose of providing liquidity to the financial system pursuant to Section 13(3) of the Federal Reserve Act. The Consolidated Appropriations Act, 2021 (P. L. 116-260) rescinded this au-thority, though any loans and investments already made will remain active until obligations are fully liquidated.
Sovereign Lending and Guarantees
The U.S. Government can extend short-to-medium-term loan guarantees that cover potential losses that might be incurred by lenders if a country defaults on its borrowings; for example, the U.S. may guarantee another country’s sovereign bond issuance. The purpose of this tool is to provide the Nation’s sovereign international part-ners access to necessary, urgent, and relatively affordable financing during temporary periods of strain when they cannot access such financing in international financial markets, and to support critical reforms that will enhance long-term fiscal sustainability, often in concert with sup-port from international financial institutions such as the International Monetary Fund. The goal of sovereign loan guarantees is to help lay the economic groundwork for the Nation’s international partners to graduate to an unenhanced bond issuance in the international capital markets. For example, as part of the U.S. response to fis-cal crises, the U.S. Government has extended sovereign
15. CREDIT AND INSURANCE 187
loan guarantees to Tunisia, Jordan, Ukraine, and Iraq to enhance their access to capital markets while promoting economic policy adjustment.
Development Programs
Credit is an important tool in U.S. bilateral assistance to promote sustainable development. On January 2, 2020, the U.S. International Development Finance Corporation launched to consolidate, modernize, and reform the U.S. Government’s “development finance” capabilities. The DFC provides loans, guarantees, and other investment tools such as equity and political risk insurance to fa-cilitate and incentivize private-sector investment in emerging markets that will have positive developmental impact, and meet national security objectives. Through the DFC’s equity program, the U.S. Government will part-ner with allies and deliver financially-sound alternatives to State-led initiatives from countries like China.
The Government-Sponsored Enterprises (GSEs)
Fannie Mae and Freddie Mac
The Federal National Mortgage Association, or Fannie Mae, created in 1938, and the Federal Home Loan Mortgage Corporation, or Freddie Mac, created in 1970, were established to support the stability and liquidity of a secondary market for residential mortgage loans. Fannie Mae’s and Freddie Mac’s public missions were lat-er broadened to promote affordable housing. The Federal Home Loan Bank (FHLB) System, created in 1932, is comprised of eleven individual banks with shared liabili-ties. Together they lend money to financial institutions, mainly banks and thrifts, that are involved in mortgage financing to varying degrees, and they also finance some mortgages using their own funds. The mission of the FHLB System is broadly defined as promoting housing finance, and the System also has specific requirements to support affordable housing.
Together these three GSEs currently are involved, in one form or another, with approximately half of residen-tial mortgages outstanding in the U.S. today.
History of the Conservatorship of Fannie Mae and Freddie Mac and Budgetary Effects
Growing stress and losses in the mortgage markets in 2007 and 2008 seriously eroded the capital of Fannie Mae and Freddie Mac. Legislation enacted in July 2008 strengthened regulation of the housing GSEs through the creation of the Federal Housing Finance Agency (FHFA), a new independent regulator of housing GSEs, and pro-vided the Department of the Treasury with authorities to purchase securities from Fannie Mae and Freddie Mac.
On September 6, 2008, FHFA placed Fannie Mae and Freddie Mac under Federal conservatorship. The next day, the U.S. Treasury launched various programs to provide temporary financial support to Fannie Mae and Freddie Mac under the temporary authority to purchase securi-ties. Treasury entered into agreements with Fannie Mae
and Freddie Mac to make investments in senior preferred stock in each GSE in order to ensure that each company maintains a positive net worth. The cumulative funding commitment through these Preferred Stock Purchase Agreements (PSPAs) with Fannie Mae and Freddie Mac was set at $445.5 billion. In total, as of December 31, 2020, $191.5 billion has been invested in Fannie Mae and Freddie Mac. The remaining commitment amount is $254.1 billion.
The PSPAs also generally require that Fannie Mae and Freddie Mac pay quarterly dividends to Treasury, though the terms governing the amount of those dividends have changed several times pursuant to agreements between Treasury and Fannie Mae and Freddie Mac. The most re-cent changes, announced on January 14, 2021, permit the GSEs to suspend dividend payments until they achieve minimum capital levels established by FHFA through a regulatory framework published in 2020. The Budget projects those levels will not be reached during the Budget window and accordingly reflects no dividends through 2031. Through December 31, 2020, the GSEs have paid a total of $301.0 billion in dividend payments to Treasury on the senior preferred stock.
The Temporary Payroll Tax Cut Continuation Act of 2011 (Public Law 112–78) required that Fannie Mae and Freddie Mac increase their annual credit guarantee fees on single-family mortgage acquisitions between 2012 and 2021 by an average of at least 0.10 percentage point. A mortgage acquired during this time period will be subject to the fee while the loan remains outstanding. The Budget does not assume the fee will apply to loans acquired af-ter the October 1, 2021 sunset date, but does assume the fees will apply for the life of the loans acquired prior to the sunset. The Budget estimates these fees, which are remitted directly to the Treasury and are not included in the PSPA amounts, will result in deficit reduction of $25.2 billion from 2022 through 2031.
In addition, effective January 1, 2015 FHFA directed Fannie Mae and Freddie Mac to set aside 0.042 percent-age points for each dollar of the unpaid principal balance of new business purchases (including but not limited to mortgages purchased for securitization) in each year to fund several Federal affordable housing programs created by Housing and Economic Recovery act of 2008, including the Housing Trust Fund and the Capital Magnet Fund. The 2022 Budget projects these assessments will gener-ate $4.4 billion for the affordable housing funds from 2022 through 2031. In addition, though not funded by these as-sessments, the Budget reflects proposals in the American Jobs Plan to provide $45 billion for the Housing Trust Fund and $12 billion for the Capital Magnet Fund over the Budget window.
Future of the Housing Finance System
Fannie Mae and Freddie Mac are in their twelfth year of conservatorship, and Congress has not yet enacted leg-islation to define the GSEs’ long-term role in the housing finance system. The Administration is committed to hous-
188ANALYTICAL PERSPECTIVES
ing finance policy that expands fair and equitable access to homeownership and affordable rental opportunities, protects taxpayers, and promotes financial stability. The Administration has a key role in shaping, and a key inter-est in the outcome of, housing finance reform, and stands ready to work with Congress in support of these goals.
The Farm Credit System (Banks and Associations)
The Farm Credit System (FCS or System) is a GSE composed of a nationwide network of borrower-owned cooperative lending institutions originally authorized by the Congress in 1916. The FCS’s mission is to provide sound and dependable credit to American farmers, ranch-ers, producers or harvesters of aquatic products, their cooperatives, and farm-related businesses. The institu-tions serve rural America by providing financing for rural residential real estate; rural communication, energy, and water infrastructure; and agricultural exports. In addi-tion, maintaining special policies and programs for the extension of credit to young, beginning, and small farm-ers (YBS) and ranchers is a legislative mandate for the System.
The financial condition of the System’s banks and asso-ciations remains fundamentally sound. The ratio of capital to assets remained stable at 16.4 percent on December 31, 2020, compared with 16.9 percent on December 31, 2019. Capital consisted of $65.5 billion that is available to ab-sorb losses. For the 12-month period preceding December 31, 2020, net income equaled $6.0 billion compared with $5.4 billion for the same period of the previous year.
Over the 12-month period ending December 31, 2020, System assets grew 9.7 percent, primarily due to higher cash and investment balances and increased real estate mortgage loans from continued demand by new and ex-isting customers. During the same period, nonperforming assets as a percentage of loans and other property owned fell to 0.06 percent from 0.82 percent in 2019.
The number of FCS institutions continues to decrease due to consolidation. As of December 31, 2020, the System consisted of four banks and 67 associations, compared with seven banks and 104 associations in September 2002. Of the 71 FCS banks and associations rated un-der the Financial Institution Rating System (FIRS), 67 of them had one of the top two examination ratings (1 or 2 on a 1 to 5 scale) and accounted for over 98.5 percent of gross Systems assets. Four FCS institutions had a rating of 3 or lower.
The System, while continuing to record strong earnings and capital growth, remains exposed to a variety of risks associated with its portfolio concentration in agriculture and rural America. Agricultural producers in certain key crop and livestock sectors have endured several years of low prices and decreasing cash flows. The emergence of COVID-19 increased the uncertainty and risk in the general economy and the farm economy. Amid the chal-lenging economic environment, the combination of farm commodity programs, disaster assistance, crop insurance, and the Coronavirus Food Assistance Program payments is supporting the U.S. farm sector. In fall 2020, producers
started seeing improved prices for some agricultural com-modities because of relatively strong demand.
FCS Performance and YBS Portfolio
Both the dollar volume of the System’s total loans out-standing and the dollar volume of YBS loans outstanding increased in 2019. While young, beginning, and small farmers are not mutually exclusive groups, and thus can-not be added across categories, it is important to note the growth of activity within each group. For example, total System loan dollar volume outstanding increased by 6.3 percent in 2019, with loan dollar volume outstanding to young farmers increasing by 3.3 percent, to begin-ning farmers by 3.9 percent, and to small farmers by 4.6 percent.
The number of total System loans outstanding and YBS loans outstanding remained relatively flat in 2019. The number of total System loans outstanding increased by 0.5 percent. The number of loans outstanding to YBS increased by 1.0 percent, 1.8 percent, and 0.6 percent respectively.
The System’s overall loan dollar volume increased by 5.4 percent, with YBS new loan dollar volume growing by 7.3 percent, 8.0 percent, and 15.9 percent, respectively. For total System loans, the number of new loans made in 2019 increased by 4.8 percent. Again, that growth is reflected across YBS loans, with the number of loans to young farmers increasing by 5.9 percent, to beginning farmers by 8.1 percent, and to small farmers by 7.8 percent.
In 2019, the System reported making a total of 269,939 new loans, totaling $90.9 billion. Out of these, loans to young farmers represented 18.2 percent of all loans made and 11.1 percent of the dollar volume of loans made. Loans made to beginning farmers represented 24.9 percent of all System loans made during the year and 15.7 percent of the dollar volume of loans made. Loans to small farm-ers represented 45.7 percent of all loans made during the year and 15.9 percent of the dollar volume of loans made.
Federal Agricultural Mortgage Corporation (Farmer Mac)
Farmer Mac was established in 1988 as a federally chartered instrumentality of the United States and an institution of the System to facilitate a secondary market for farm real estate and rural housing loans. Farmer Mac is not liable for any debt or obligation of the other System institutions, and no other System institutions are liable for any debt or obligation of Farmer Mac. The Farm Credit System Reform Act of 1996 expanded Farmer Mac’s role from a guarantor of securities backed by loan pools to a direct purchaser of mortgages, enabling it to form pools to securitize. The Food, Conservation, and Energy Act of 2008 expanded Farmer Mac’s program authorities by al-lowing it to purchase and guarantee securities backed by rural utility loans made by cooperatives.
Farmer Mac continues to meet core capital and regu-latory risk-based capital requirements. As of September 30, 2020, Farmer Mac’s total outstanding program volume (loans purchased and guaranteed, standby loan purchase commitments, and AgVantage bonds purchased and guar-

15. CREDIT AND INSURANCE 189
anteed) amounted to $22.0 billion, which represents an increase of 5.1 percent from the level a year ago. Of to-tal program activity, $18.7 billion were on-balance sheet loans and guaranteed securities, and $3.3 billion were off-balance-sheet obligations. Total assets were $24.0 bil-lion, with non-program investments (including cash and
cash equivalents) accounting for $4.5 billion of those as-sets. Farmer Mac’s net income attributable to common stockholders (“net income”) for the first three quarters of calendar year 2020 was $59.7 million. Net income decreased compared to the same period in 2019 during which Farmer Mac reported net income of $64.6 million.
II. INSURANCE PROGRAMS
Deposit Insurance
Federal deposit insurance promotes stability in the U.S. financial system. Prior to the establishment of Federal deposit insurance, depository institution failures often caused depositors to lose confidence in the banking system and rush to withdraw deposits. Such sudden withdrawals caused serious disruption to the economy. In 1933, in the midst of the Great Depression, a system of Federal de-posit insurance was established to protect depositors and to prevent bank failures from causing widespread disrup-tion in financial markets.
Today, the Federal Deposit Insurance Corporation (FDIC) insures deposits in banks and savings associa-tions (thrifts) using the resources available in its Deposit Insurance Fund (DIF). The National Credit Union Administration (NCUA) insures deposits (shares) in most credit unions through the National Credit Union Share Insurance Fund (SIF). (Some credit unions are privately insured.) As of September 30, 2020, the FDIC insured $8.9 trillion of deposits at 5,033 commercial banks and thrifts, and the NCUA insured nearly $1.4 trillion of shares at 5,133 credit unions.
Since its creation, the Federal deposit insurance sys-tem has undergone many reforms. As a result of the 2008 financial crisis, several reforms were enacted to protect both the immediate and longer-term integrity of the Federal deposit insurance system. The Helping Families Save Their Homes Act of 2009 (Public Law 111–22) pro-vided NCUA with tools to protect the SIF and the financial stability of the credit union system. Notably, the Act:
• Established the Temporary Corporate Credit Union Stabilization Fund (TCCUSF), allowing NCUA to segregate the losses of corporate credit unions and providing a mechanism for assessing those losses to federally insured credit unions over an extended period of time; On September 28, 2017, the NCUA Board voted unanimously to close the TCCUSF ef-fective October 1, 2017, ahead of its sunset date of June 30, 2021, the assets and liabilities of the TC-CUSF were distributed into the SIF;
• Provided flexibility to the NCUA Board by permit-ting use of a restoration plan to spread insurance premium assessments over a period of up to eight
years, or longer in extraordinary circumstances, if the SIF equity ratio fell below 1.2 percent; and
• Permanently increased the Share Insurance Fund’s borrowing authority to $6 billion.
The Dodd-Frank Wall Street Reform and Consumer Protection (Dodd-Frank) Act of 2010 (P.L. 111–203) es-tablished new DIF reserve ratio requirements. The Act requires the FDIC to achieve a minimum DIF reserve ra-tio (ratio of the deposit insurance fund balance to total estimated insured deposits) of 1.35 percent by 2020, up from 1.15 percent in 2016. On September 30, 2018, the DIF reserve ratio reached 1.36 percent. In addition to raising the minimum reserve ratio, the Dodd-Frank Act also:
• Eliminated the FDIC’s requirement to rebate premi-ums when the DIF reserve ratio is between 1.35 and 1.5 percent;
• Gave the FDIC discretion to suspend or limit re-bates when the DIF reserve ratio is 1.5 percent or higher, effectively removing the 1.5 percent cap on the DIF; and
• Required the FDIC to offset the effect on small in-sured depository institutions (defined as banks with assets less than $10 billion) when setting assess-ments to raise the reserve ratio from 1.15 to 1.35 percent. In implementing the Dodd-Frank Act, the FDIC issued a final rule setting a long-term (i.e., beyond 2028) reserve ratio target of 2 percent, a goal that FDIC considers necessary to maintain a positive fund balance during economic crises while permitting steady long-term assessment rates that provide transparency and predictability to the bank-ing sector.
The Dodd-Frank Act also permanently increased the insured deposit level to $250,000 per account at banks or credit unions insured by the FDIC or NCUA.
Recent Fund Performance
As of December 31, 2020, the FDIC DIF balance stood at $117.9 billion, a one-year increase of $7.6 billion. The growth in the DIF balance is primarily a result of assess-ment revenue inflows. The reserve ratio on December 31, 2020, was 1.29 percent.
As of December 31, 2020, the number of insured insti-tutions on the FDIC’s “problem list” (institutions with the highest risk ratings) totaled 56, which represented a de-crease of 94 percent from December 2010, the peak year

190ANALYTICAL PERSPECTIVES
for bank failures during the financial crisis. Furthermore, the assets held by problem institutions were nearly 87 percent below the level in December 2009, the peak year for assets held by problem institutions.
The NCUA-administered SIF ended December 2020 with assets of $19.1 billion and an equity ratio of 1.26 percent. On September 28, 2017, NCUA raised the normal operating level of the SIF equity ratio to 1.39 percent and lowered it to 1.38 percent in December 2018. If the ratio exceeds the normal operating level, a distribution is nor-mally paid to insured credit unions to reduce the equity ratio.
The health of the credit union industry has markedly improved since the financial crisis. As of December 31, 2020, NCUA reserved $177 million in the SIF to cover potential losses, an increase of 51.5 percent from the $117 million reserved as of December 31, 2019. This increase was driven by an adjustment in the application of NCUA’s reserve modeling. The ratio of insured shares in problem institutions to total insured shares decreased slightly from 0.79 percent in December 2019 to 0.65 percent in December 2020. This is a significant reduction from a high of 5.7 percent in December 2009.
Restoring the Deposit Insurance Funds
As of June 30, 2020, the DIF reserve ratio fell to 1.30 percent, below the statutory minimum of 1.35 percent. The decline was a result of strong one-time growth in in-sured deposits. On September 15, 2020, FDIC adopted a Restoration Plan to restore the DIF reserve ratio to at least 1.35 percent within 8 years.
Budget Outlook
The Budget estimates DIF net outlays of -$62.7 billion over the current 10-year budget window (2022–2031). This $62.7 billion in net inflows to the DIF is a $9.5 billion increase of net inflows over the previous 10-year window (2021–2030) for the 2021 President’s Budget. The fall in the reserve ratio and public data on the banking indus-try accounted for most of this change, which reflects both projections of resolution outlays, and premiums necessary to reach the historic long-run DIF target of 1.5 percent. Although the FDIC has authority to borrow up to $100 billion from Treasury to maintain sufficient DIF balances, the Budget does not anticipate FDIC utilizing its borrow-ing authority because the DIF is projected to maintain positive operating cash flows over the entire 10-year bud-get horizon.
Pension Guarantees
The Pension Benefit Guaranty Corporation (PBGC) insures the pension benefits of workers and retirees in covered defined-benefit pension plans. PBGC operates two legally and financially separated insurance programs: single-employer plans and multiemployer plans.
Single-Employer Insurance Program
Under the single-employer program, PBGC pays ben-efits, up to a guaranteed level, when a company’s plan
closes without enough assets to pay future benefits. PBGC’s claims exposure is the amount by which guaran-teed benefits exceed assets in insured plans. In the near term, the risk of loss stems from financially distressed firms with underfunded plans. In the longer term, loss exposure results from the possibility that well-funded plans become underfunded due to inadequate contribu-tions, poor investment results, or increased liabilities, and that the healthy firms sponsoring those plans become distressed.
PBGC monitors companies with large underfunded plans and acts to protect the interests of the pension in-surance program’s stakeholders where possible. Under its Early Warning Program, PBGC works with companies to mitigate risks to pension plans posed by corporate trans-actions or otherwise protect the insurance program from avoidable losses. However, PBGC’s authority to manage risks to the insurance program is limited. Most private insurers can diversify or reinsure their catastrophic risks as well as flexibly price these risks. Unlike private insur-ers, Federal law does not allow PBGC to deny insurance coverage to a defined-benefit plan or adjust premiums ac-cording to risk. Both types of PBGC premiums, the flat rate (a per person charge paid by all plans) and the vari-able rate (paid by underfunded plans), are set in statute.
Claims against PBGC’s insurance programs are highly variable. One large pension plan termination may result in a larger claim against PBGC than the termination of many smaller plans. The future financial health of the PBGC will continue to depend largely on the termination of a limited number of very large plans and the extent to which future premiums cover future claims.
Single-employer plans generally provide benefits to the employees of one employer. When an underfunded single-employer plan terminates, usually in the bankruptcy context, PBGC becomes trustee of the plan, applies legal limits on payouts, and pays benefits over the lifetime of plan participants and beneficiaries. The amount of ben-efit paid is determined after taking into account (a) the benefit that a participant had accrued in the terminated plan, (b) the availability of assets from the terminated plan to cover benefits, and (c) the legal maximum benefit level set in statute. In 2021, the maximum annual pay-ment guaranteed under the single-employer program was $72,409.08 for a retiree aged 65.
Multiemployer Insurance Program
Multiemployer plans are collectively bargained pen-sion plans maintained by one or more labor unions and more than one unrelated employer, usually within the same or related industries. PBGC’s role in the multi-employer program is more like that of a re-insurer; if a company contributing to a multiemployer plan fails, its liabilities are assumed by the other employers in the plan, not by PBGC. PBGC becomes responsible for insurance coverage when the plan runs out of money to pay benefits at the statutorily guaranteed level, which usually occurs after most or all contributing employers have withdrawn from the plan, leaving the plan without sufficient income. PBGC provides insolvent multiemployer plans with fi-

15. CREDIT AND INSURANCE 191
nancial assistance in the form of loans sufficient to pay guaranteed benefits and administrative expenses. Since multiemployer plans do not receive PBGC assistance un-til their assets are fully depleted, financial assistance is almost never repaid. Guaranteed benefits under the mul-tiemployer program are calculated based on the benefit that a participant would have received under the insol-vent plan, subject to the legal multiemployer maximum set in statute. The maximum guaranteed amount de-pends on the participant’s years of service and the rate at which benefits are accrued. For example, for a participant with 30 years of service, PBGC guarantees 100 percent of the pension benefit up to a yearly amount of $3,960. If the pension exceeds that amount, PBGC guarantees 75 percent of the rest of the pension benefit up to a total maximum guarantee of $12,870 per year for a participant with 30 years of service. This limit has been in place since 2001 and is not adjusted for inflation or cost-of-living increases.
In recent years, many multiemployer pension plans have become severely underfunded as a result of struc-tural flaws in how these plans are funded and operated, employers withdrawing from plans, and demographic challenges. In 2001, only 15 plans covering about 80,000 participants were under 40 percent funded using esti-mated market rates. By 2017, this had grown to over 330 plans covering over 4 million participants. While many plans have benefited from an improving economy and will recover, about 14 million participants in the multi-employer system are in plans that, before the enactment of the American Rescue Plan Act of 2021 (ARPA) (Public Law 117–2), projected that they would become insolvent within twenty years.
As of September 30, 2020, the single-employer pro-gram reported a positive net position of $15.5 billion, while the multiemployer program reported a long-term actuarial deficit of $63.7 billion. Following enactment of ARPA on March 11, 2021, the solvency crisis in the multi-employer program is less urgent. Under ARPA, Congress established a new Special Financial Assistance program for financially troubled multiemployer plans, funded en-tirely by Treasury general revenues. PBGC will provide one-time payments to eligible plans to enable them to pay benefits at the plan level.
Premiums
The single-employer program’s financial position is projected to continue improving over the next 10 years, in part because the Congress has raised premiums in that program several times. Before enactment of ARPA, the multiemployer program was projected to run out of funds in 2026. Particularly in the multiemployer program, premium rates remain much lower than what a private financial institution would charge for insuring the same risk.
Disaster Insurance
Flood Insurance
The Federal Government provides flood insurance through the National Flood Insurance Program (NFIP), which is administered by the Department of Homeland Security (DHS) Federal Emergency Management Agency (FEMA). Flood insurance is available to homeowners, renters, businesses, and State and local governments in communities that have adopted and enforce minimum floodplain management measures. Coverage is limited to buildings and their contents. At the end of 2020, the pro-gram had over five million policies worth $1.3 trillion in force in nearly 22,000 communities. The program is cur-rently authorized until September 30, 2021.
The Congress established NFIP in 1968 to make flood insurance coverage widely available, to combine a pro-gram of insurance with flood mitigation measures to reduce the Nation’s risk of loss from floods, and to reduce Federal disaster-assistance expenditures on flood losses. The NFIP requires participating communities to adopt certain land use ordinances consistent with FEMA’s flood-plain management regulations and take other mitigation efforts to reduce flood-related losses in high flood hazard areas (“Special Flood Hazard Areas”) identified through partnership with FEMA, States, and local communities. These efforts have resulted in substantial reductions in the risk of flood-related losses nationwide. Since the 1970’s, flood insurance rates have been based on static measurements using the Flood Insurance Rate Map. Technology has evolved, and so has FEMA’s understand-ing of flood risk. To ensure policyholders make informed decisions on the purchase of adequate insurance and on mitigation actions to protect against flood risk, in FY 2021 FEMA introduced a new pricing methodology, Risk Rating 2.0-Equity in Action. Risk Rating 2.0-Equity in Action builds on flood hazard information and incorpo-rates private sector data sets, catastrophe models, and evolving actuarial science. The system includes addition-al flood risk variables such as flood frequency, multiple flood types (riverine, storm surge, coastal, pluvial), and distance to water along with individual property charac-teristics. Risk Rating 2.0-Equity in Action also addresses premium inequities by taking into account the cost to re-build as a factor in the premium, so that policyholders with low-valued home are no longer subsidizing higher-valued homes. New policies effective on or after October 1, 2021 will be subject to the new pricing methodology. and existing policyholders will be able to take advantage of immediate decreases in their premiums upon renewal. All remaining existing policyholders will be subject to the new methodology beginning April 1, 2022.
FEMA’s Community Rating System offers discounts on policy premiums in communities that adopt and enforce more stringent floodplain land use ordinances than those identified in FEMA’s regulations and/or engage in miti-gation activities beyond those required by the NFIP. The discounts provide an incentive for communities to imple-ment new flood protection activities that can help save

192ANALYTICAL PERSPECTIVES
lives and property when a flood occurs. Further, NFIP of-fers flood mitigation assistance grants for planning and carrying out activities to reduce the risk of flood damage to structures covered by NFIP, which may include demoli-tion or relocation of a structure, elevation or flood-proofing a structure, and community-wide mitigation efforts that will reduce future flood claims for the NFIP. In particular, flood mitigation assistance grants targeted toward repeti-tive and severe repetitive loss properties not only help owners of high-risk property, but also reduce the dispro-portionate drain these properties cause on the National Flood Insurance Fund.
Due to the catastrophic nature of flooding, with hur-ricanes Harvey, katrina, and Sandy as notable examples, insured flood damages can far exceed premium revenue and deplete the program’s reserves. On those occasions, the NFIP exercises its borrowing authority through the Treasury to meet flood insurance claim obligations. While the program needed appropriations in the early 1980s to repay the funds borrowed during the 1970’s, it was able to repay all borrowed funds with interest using only pre-mium dollars between 1986 and 2004. In 2005, however, Hurricanes katrina, Rita, and Wilma generated more flood insurance claims than the cumulative number of claims paid from 1968 to 2004. Hurricane Sandy in 2012 gener-ated $8.8 billion in flood insurance claims. As a result, in 2013 the Congress increased the borrowing authority for the fund to $30.425 billion. After the estimated $2.4 bil-lion and $670 million in flood insurance claims generated by the Louisiana flooding of August 2016 and Hurricane Matthew in October 2016, respectively, the NFIP used its borrowing authority again, bringing the total outstanding debt to Treasury to $24.6 billion.
In the fall 2017, Hurricanes Harvey and Irma struck the southern coast of the United States, resulting in catastrophic flood damage across Texas, Louisiana, and Florida. To pay claims, NFIP exhausted all borrowing authority. The Congress provided $16 billion in debt can-cellation to the NFIP, bringing its debt to $20.525 billion. To pay Hurricane Harvey flood claims, NFIP also received more than $1 billion in reinsurance payments as a result of transferring risk to the private reinsurance market at the beginning of 2017. FEMA continues to mature its reinsurance program and transfer additional risk to the private market.
In July 2012, resulting largely from experiences during Hurricanes katrina, Rita, and Wilma in 2005, the Biggert Waters Flood Insurance Reform Act of 2012 (subtitle A of title II of Public Law 112–141; BW–12) was signed into law. In addition to reauthorizing the NFIP for five years, the bill required the NFIP generally to move to full risk-based premium rates and strengthened the NFIP financially and operationally. In 2013, the NFIP began phasing in risk-based premiums for certain properties, as required by the law, and began collecting a policyholder Reserve Fund assessment that is available to meet the ex-pected future obligations of the flood insurance program.
In March 2014, largely in reaction to premium increas-es initiated by BW–12, the Homeowner Flood Insurance Affordability Act of 2014 (HFIAA) (Public Law 113–89)
was signed into law, further reforming the NFIP and re-vising many sections of BW–12. Notably, HFIAA repealed and adjusted many of the major premium increases in-troduced by BW–12 and required retroactive refunds of collected BW–12 premium increases, introduced a phase-in to higher full-risk premiums for structures newly mapped into the Special Flood Hazard Area until full-risk rates are achieved, and created an Office of the Flood Insurance Advocate. HFIAA also introduced a fixed an-nual surcharge of $25 for primary residents and $250 for all other policies to be deposited into the Reserve Fund.
The 2018-2022 FEMA Strategic Plan creates a shared vision for the NFIP and other FEMA programs to build a more prepared and resilient Nation. The Strategic Plan sets out three overarching goals: Building a culture of preparedness, Readying the Nation for catastrophic events, and reducing the complexity of FEMA. While the NFIP supports all three goals, it is central to building a culture of preparedness. To that end, FEMA is pursuing initiatives including:
1. Providing products that clearly and accurately com-municate flood risk;
2. Helping individuals, businesses, and communities understand their risks and the available options like the NFIP to best manage those risks;
3. Transforming the NFIP into a simpler, customer-focused program that policyholders value and trust; and
4. Doubling the number of properties covered by flood insurance (either the NFIP or private insurance) by 2022.
Crop Insurance
Subsidized Federal crop insurance, administered by USDA’s Risk Management Agency (RMA) on behalf of the Federal Crop Insurance Corporation (FCIC), assists farm-ers in managing yield and revenue shortfalls due to bad weather or other natural disasters. The program is a co-operative partnership between the Federal Government and the private insurance industry. Private insurance companies sell and service crop insurance policies. The Federal Government, in turn, pays private companies an administrative and operating expense subsidy to cover expenses associated with selling and servicing these poli-cies. The Federal Government also provides reinsurance through the Standard Reinsurance Agreement (SRA) and pays companies an “underwriting gain” if they have a profitable year. For the 2022 Budget, the payments to the companies are projected to be $2.9 billion in com-bined subsidies. The Federal Government also subsidizes premiums for farmers as a way to encourage farmers to participate in the program.
The most basic type of crop insurance is catastrophic coverage (CAT), which compensates the farmer for losses in excess of 50 percent of the individual’s average yield at
15. CREDIT AND INSURANCE 193
55 percent of the expected market price. The CAT premium is entirely subsidized, and farmers pay only an administra-tive fee. Higher levels of coverage, called “buy-up,” are also available. A portion of the premium for buy-up coverage is paid by FCIC on behalf of producers and varies by cov-erage level – generally, the higher the coverage level, the lower the percent of premium subsidized. The remaining (unsubsidized) premium amount is owed by the producer and represents an out-of-pocket expense.
For 2020, the 5 principal crops (corn, soybeans, wheat, cotton, and sorghum) accounted for over 72 percent of to-tal liability, and approximately 85 percent of the total U.S. planted acres of the 10 principal row crops (also including barley, peanuts, potatoes, rice, and tobacco) were covered by crop insurance. Producers can purchase both yield and revenue-based insurance products which are underwrit-ten on the basis of a producer’s actual production history (APH). Revenue insurance programs protect against loss of revenue resulting from low prices, low yields, or a combination of both. Revenue insurance has enhanced traditional yield insurance by adding price as an insur-able component.
In addition to price and revenue insurance, FCIC has made available other plans of insurance to pro-vide protection for a variety of crops grown across the United States. For example, “area plans” of insur-ance offer protection based on a geographic area (most commonly, a county), and do not directly insure an in-dividual farm. Often, the loss trigger is based on an index, such as a rainfall or vegetative index, which is established by a Government entity (for example, the National Oceanic and Atmospheric Administration or United States Geological Survey). One such plan is the pilot Rainfall and Vegetation Index plan, which insures against a decline in an index value covering Pasture, Rangeland, and Forage. These pilot programs meet the needs of livestock producers who purchase insurance for protection from losses of forage produced for grazing or harvested for hay. In 2020, there were around 33 thousand Rainfall Index policies earning premiums, covering over 160 million acres of pasture, rangeland and forage. In 2020, there was about $172 million in liability for those producers who purchased livestock coverage and $13 billion in liability for those producers who purchased coverage for milk.
A crop insurance policy also contains coverage compensating farmers when they are prevented from planting their crops due to weather and other per-ils. When an insured farmer is unable to plant the planned crop within the planting time period because of excessive drought or moisture, the farmer may file a prevented planting claim, which pays the farmer a portion of the full coverage level. It is optional for the farmer to plant a second crop on the acreage. If the farmer does, the prevented planting claim on the first crop is reduced and the farmer’s APH is recorded for that year. If the farmer does not plant a second crop, the farmer gets the full prevented planting claim, and the farmer’s APH is held harmless for premium cal-
culation purposes the following year. Buy-up coverage for prevented planting is limited to 5 percent.
RMA is continuously working to develop new prod-ucts and to expand or improve existing products in order to cover more agricultural commodities. In 2020, RMA added new coverage for hurricanes which pro-vided over $150 million in payments during an active hurricane season. RMA implemented a new option that allows producers to cover a portion of their poli-cy’s deductible in the event of a widespread loss. RMA also implemented new coverage for strawberries and improvements to it livestock and whole farm coverage. For more information and additional crop insurance program details, please reference RMA’s website www.rma.usda.gov.
Farm Credit System Insurance Corporation (FCSIC)
Although not specifically disaster-related, FCSIC, an independent Government-controlled corporation, en-sures the timely payment of principal and interest on FCS obligations on which the System banks are jointly and severally liable. If the Corporation does not have suf-ficient funds to ensure payment on insured obligations, System banks will be required to make payments under joint and several liability, as required by section 4.4(a)(2) of the Farm Credit Act (Public Law 92–181, as amended). The insurance provided by the Insurance Fund is limited to the resources in the Insurance Fund. System obliga-tions are not guaranteed by the U.S. Government. On December 31, 2020, the assets in the Insurance Fund to-taled $5.5 billion. As of December 31, 2020, the Insurance Fund as a percentage of adjusted insured debt was 1.93 percent. This was slightly below the statutory secure base amount of 2.00 percent. As of December 31, 2020, outstanding insured System obligations increased 9.9 percent compared with that of December 31, 2019, from $323 billion to $294 billion.
Insurance against Security-Related Risks
Terrorism Risk Insurance
The Terrorism Risk Insurance Program (TRIP) was au-thorized by the Terrorism Risk Insurance Act of 2002 to ensure the continued availability of property and casualty insurance following the terrorist attacks of September 11, 2001. TRIP’s initial three-year authorization established a system of shared public and private compensation for insured property and casualty losses arising from certi-fied acts of foreign terrorism.
TRIP was originally intended to be temporary, but has been repeatedly extended, and is currently set to expire on December 31, 2027, after it was reauthorized by the Terrorism Risk Insurance Program Reauthorization Act of 2019 (Public Law 116–94). The prior reauthorization, the Terrorism Risk Insurance Program Reauthorization Act of 2015 (Public Law 114–1), made several program changes to reduce potential Federal liability. Over the first five of those extension years, the loss threshold that
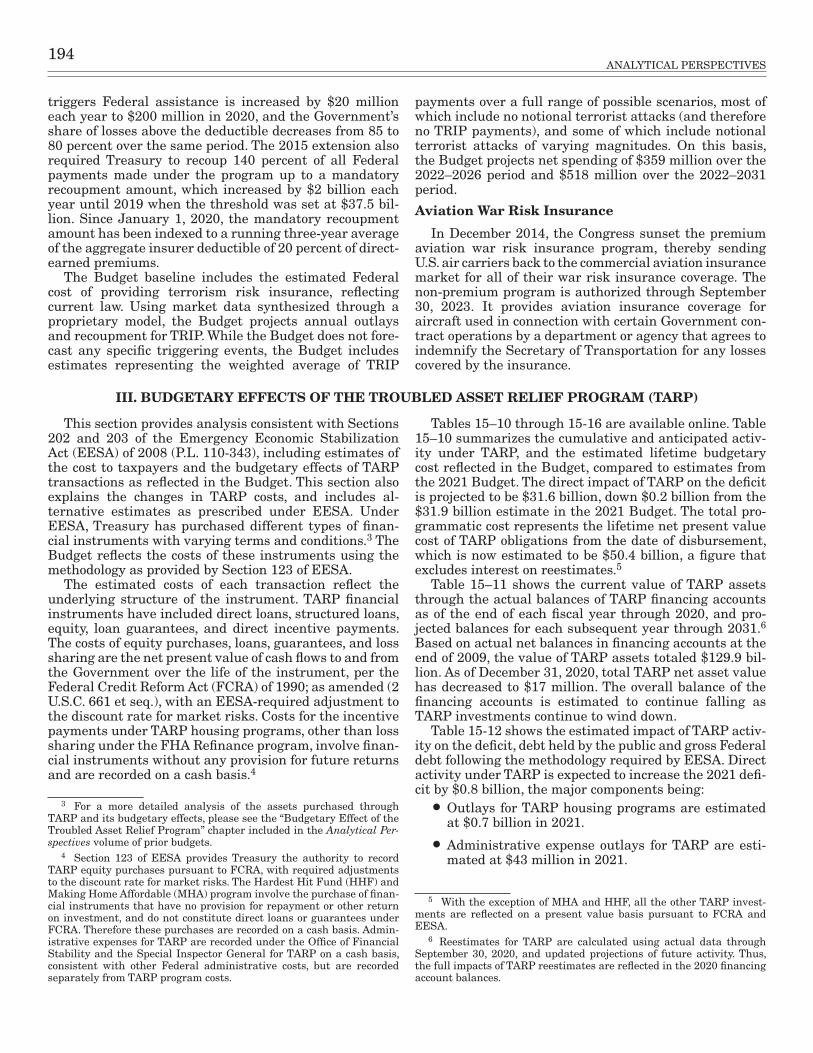
194ANALYTICAL PERSPECTIVES
triggers Federal assistance is increased by $20 million each year to $200 million in 2020, and the Government’s share of losses above the deductible decreases from 85 to 80 percent over the same period. The 2015 extension also required Treasury to recoup 140 percent of all Federal payments made under the program up to a mandatory recoupment amount, which increased by $2 billion each year until 2019 when the threshold was set at $37.5 bil-lion. Since January 1, 2020, the mandatory recoupment amount has been indexed to a running three-year average of the aggregate insurer deductible of 20 percent of direct-earned premiums.
The Budget baseline includes the estimated Federal cost of providing terrorism risk insurance, reflecting current law. Using market data synthesized through a proprietary model, the Budget projects annual outlays and recoupment for TRIP. While the Budget does not fore-cast any specific triggering events, the Budget includes estimates representing the weighted average of TRIP
payments over a full range of possible scenarios, most of which include no notional terrorist attacks (and therefore no TRIP payments), and some of which include notional terrorist attacks of varying magnitudes. On this basis, the Budget projects net spending of $359 million over the 2022–2026 period and $518 million over the 2022–2031 period.
Aviation War Risk Insurance
In December 2014, the Congress sunset the premium aviation war risk insurance program, thereby sending U.S. air carriers back to the commercial aviation insurance market for all of their war risk insurance coverage. The non-premium program is authorized through September 30, 2023. It provides aviation insurance coverage for aircraft used in connection with certain Government con-tract operations by a department or agency that agrees to indemnify the Secretary of Transportation for any losses covered by the insurance.
III. BUDGETARY EFFECTS OF THE TROUBLED ASSET RELIEF PROGRAM (TARP)
This section provides analysis consistent with Sections 202 and 203 of the Emergency Economic Stabilization Act (EESA) of 2008 (P.L. 110-343), including estimates of the cost to taxpayers and the budgetary effects of TARP transactions as reflected in the Budget. This section also explains the changes in TARP costs, and includes al-ternative estimates as prescribed under EESA. Under EESA, Treasury has purchased different types of finan-cial instruments with varying terms and conditions.3 The Budget reflects the costs of these instruments using the methodology as provided by Section 123 of EESA.
The estimated costs of each transaction reflect the underlying structure of the instrument. TARP financial instruments have included direct loans, structured loans, equity, loan guarantees, and direct incentive payments. The costs of equity purchases, loans, guarantees, and loss sharing are the net present value of cash flows to and from the Government over the life of the instrument, per the Federal Credit Reform Act (FCRA) of 1990; as amended (2 U.S.C. 661 et seq.), with an EESA-required adjustment to the discount rate for market risks. Costs for the incentive payments under TARP housing programs, other than loss sharing under the FHA Refinance program, involve finan-cial instruments without any provision for future returns and are recorded on a cash basis.4
3 For a more detailed analysis of the assets purchased through TARP and its budgetary effects, please see the “Budgetary Effect of the Troubled Asset Relief Program” chapter included in the Analytical Per-spectives volume of prior budgets.
4 Section 123 of EESA provides Treasury the authority to record TARP equity purchases pursuant to FCRA, with required adjustments to the discount rate for market risks. The Hardest Hit Fund (HHF) and Making Home Affordable (MHA) program involve the purchase of finan-cial instruments that have no provision for repayment or other return on investment, and do not constitute direct loans or guarantees under FCRA. Therefore these purchases are recorded on a cash basis. Admin-istrative expenses for TARP are recorded under the Office of Financial Stability and the Special Inspector General for TARP on a cash basis, consistent with other Federal administrative costs, but are recorded separately from TARP program costs.
Tables 15–10 through 15-16 are available online. Table 15–10 summarizes the cumulative and anticipated activ-ity under TARP, and the estimated lifetime budgetary cost reflected in the Budget, compared to estimates from the 2021 Budget. The direct impact of TARP on the deficit is projected to be $31.6 billion, down $0.2 billion from the $31.9 billion estimate in the 2021 Budget. The total pro-grammatic cost represents the lifetime net present value cost of TARP obligations from the date of disbursement, which is now estimated to be $50.4 billion, a figure that excludes interest on reestimates.5
Table 15–11 shows the current value of TARP assets through the actual balances of TARP financing accounts as of the end of each fiscal year through 2020, and pro-jected balances for each subsequent year through 2031.6 Based on actual net balances in financing accounts at the end of 2009, the value of TARP assets totaled $129.9 bil-lion. As of December 31, 2020, total TARP net asset value has decreased to $17 million. The overall balance of the financing accounts is estimated to continue falling as TARP investments continue to wind down.
Table 15-12 shows the estimated impact of TARP activ-ity on the deficit, debt held by the public and gross Federal debt following the methodology required by EESA. Direct activity under TARP is expected to increase the 2021 defi-cit by $0.8 billion, the major components being:
• Outlays for TARP housing programs are estimated at $0.7 billion in 2021.
• Administrative expense outlays for TARP are esti-mated at $43 million in 2021.
5 With the exception of MHA and HHF, all the other TARP invest-ments are reflected on a present value basis pursuant to FCRA and EESA.
6 Reestimates for TARP are calculated using actual data through September 30, 2020, and updated projections of future activity. Thus, the full impacts of TARP reestimates are reflected in the 2020 financing account balances.

15. CREDIT AND INSURANCE 195
• Outlays for the Special Inspector General for TARP are estimated at $19 million in 2021.
• TARP reestimates and interest on reestimates will increase the deficit by $0.8 million in 2021.
• Debt service is estimated at $759 million for 2021 and then expected to increase to $964 million by 2031, largely due to outlays for TARP housing pro-grams. Total debt service will continue over time af-ter TARP winds down, due to the financing of past TARP costs.
Debt net of financial assets due to TARP is estimated to be $35.6 billion as of the end of 2021. This is $2.2 billion lower than the projected debt held net of financial assets for 2021 that was reflected in the 2021 Budget.
Table 15-13 reflects the estimated effects of TARP transactions on the deficit and debt, as calculated on a cash basis. Under cash basis reporting, the 2021 deficit would be $11 million lower than the $0.8 billion estimate now reflected in the Budget. However, the impact of TARP on the Federal debt, and on debt held net of financial as-sets, is the same on a cash basis as under FCRA and therefore these data are not repeated in Table15-13.
Table 15-14 shows detailed information on upward and downward reestimates to program costs. The current re-estimate of $0.8 million reflects an increase in estimated TARP costs from the 2021 Budget. This increase was due
in large part to interest effects and continued progress winding down TARP investments over the past year.
The 2022 Budget, as shown in table 15–15, reflects a to-tal TARP deficit impact of $31.6 billion. This is a decrease of $0.2 billion from the 2021 Budget projection of $31.9 bil-lion. The estimated 2021 TARP deficit impact reflected in Table 15-15 differs from the programmatic cost of $50.4 bil-lion in the Budget because the deficit impact includes $18.8 billion in cumulative downward adjustments for interest on subsidy reestimates. See footnote 2 in Table 15-15.
Table 15-16 compares the OMB estimate for TARP’s deficit impact to the deficit impact estimated by CBO in its “Report on the Troubled Asset Relief Program—March 2020.”7
CBO estimates the total cost of TARP at $31.4 billion, based on estimated lifetime TARP disbursements of $444 billion. The Budget reflects a total deficit cost of $31.6 bil-lion, based estimated disbursements of $449 billion. CBO and OMB cost estimates for TARP have generally con-verged over time as TARP equity programs have wound down.
7 Available at: https://www.cbo.gov/publication/56300
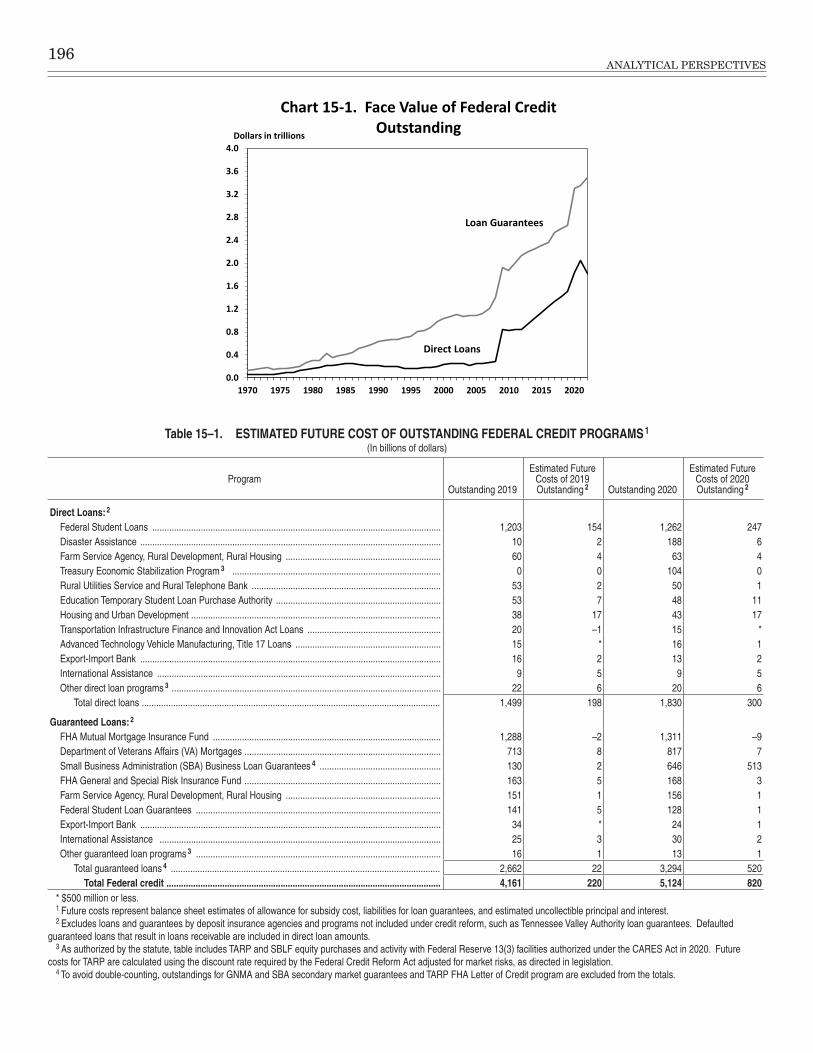
196ANALYTICAL PERSPECTIVES
0.0
0.4
0.8
1.2
1.6
2.0
2.4
2.8
3.2
3.6
4.0
1970 1975 1980 1985 1990 1995 2000 2005 2010 2015 2020
Dollars in trillions
Chart 15-1. Face Value of Federal Credit Outstanding
Loan Guarantees
Direct Loans
Table 15–1. ESTIMATED FUTURE COST OF OUTSTANDING FEDERAL CREDIT PROGRAMS 1
(In billions of dollars)
ProgramOutstanding 2019
Estimated Future Costs of 2019 Outstanding 2 Outstanding 2020
Estimated Future Costs of 2020 Outstanding 2
Direct Loans: 2
Federal Student Loans ����������������������������������������������������������������������������������������������������������������������� 1,203 154 1,262 247Disaster Assistance ���������������������������������������������������������������������������������������������������������������������������� 10 2 188 6Farm Service Agency, Rural Development, Rural Housing ���������������������������������������������������������������� 60 4 63 4Treasury Economic Stabilization Program 3 �������������������������������������������������������������������������������������� 0 0 104 0Rural Utilities Service and Rural Telephone Bank ������������������������������������������������������������������������������ 53 2 50 1Education Temporary Student Loan Purchase Authority �������������������������������������������������������������������� 53 7 48 11Housing and Urban Development ������������������������������������������������������������������������������������������������������� 38 17 43 17Transportation Infrastructure Finance and Innovation Act Loans ������������������������������������������������������� 20 –1 15 *Advanced Technology Vehicle Manufacturing, Title 17 Loans ������������������������������������������������������������ 15 * 16 1Export-Import Bank ���������������������������������������������������������������������������������������������������������������������������� 16 2 13 2International Assistance ��������������������������������������������������������������������������������������������������������������������� 9 5 9 5Other direct loan programs 3 ��������������������������������������������������������������������������������������������������������������� 22 6 20 6
Total direct loans ��������������������������������������������������������������������������������������������������������������������������� 1,499 198 1,830 300
Guaranteed Loans: 2
FHA Mutual Mortgage Insurance Fund ���������������������������������������������������������������������������������������������� 1,288 –2 1,311 –9Department of Veterans Affairs (VA) Mortgages ��������������������������������������������������������������������������������� 713 8 817 7Small Business Administration (SBA) Business Loan Guarantees 4 �������������������������������������������������� 130 2 646 513FHA General and Special Risk Insurance Fund ��������������������������������������������������������������������������������� 163 5 168 3Farm Service Agency, Rural Development, Rural Housing ���������������������������������������������������������������� 151 1 156 1Federal Student Loan Guarantees ����������������������������������������������������������������������������������������������������� 141 5 128 1Export-Import Bank ���������������������������������������������������������������������������������������������������������������������������� 34 * 24 1International Assistance �������������������������������������������������������������������������������������������������������������������� 25 3 30 2Other guaranteed loan programs 3 ����������������������������������������������������������������������������������������������������� 16 1 13 1
Total guaranteed loans 4 ��������������������������������������������������������������������������������������������������������������� 2,662 22 3,294 520Total Federal credit ................................................................................................................. 4,161 220 5,124 820
* $500 million or less�1 Future costs represent balance sheet estimates of allowance for subsidy cost, liabilities for loan guarantees, and estimated uncollectible principal and interest� 2 Excludes loans and guarantees by deposit insurance agencies and programs not included under credit reform, such as Tennessee Valley Authority loan guarantees� Defaulted
guaranteed loans that result in loans receivable are included in direct loan amounts�3 As authorized by the statute, table includes TARP and SBLF equity purchases and activity with Federal Reserve 13(3) facilities authorized under the CARES Act in 2020� Future
costs for TARP are calculated using the discount rate required by the Federal Credit Reform Act adjusted for market risks, as directed in legislation�4 To avoid double-counting, outstandings for GNMA and SBA secondary market guarantees and TARP FHA Letter of Credit program are excluded from the totals�
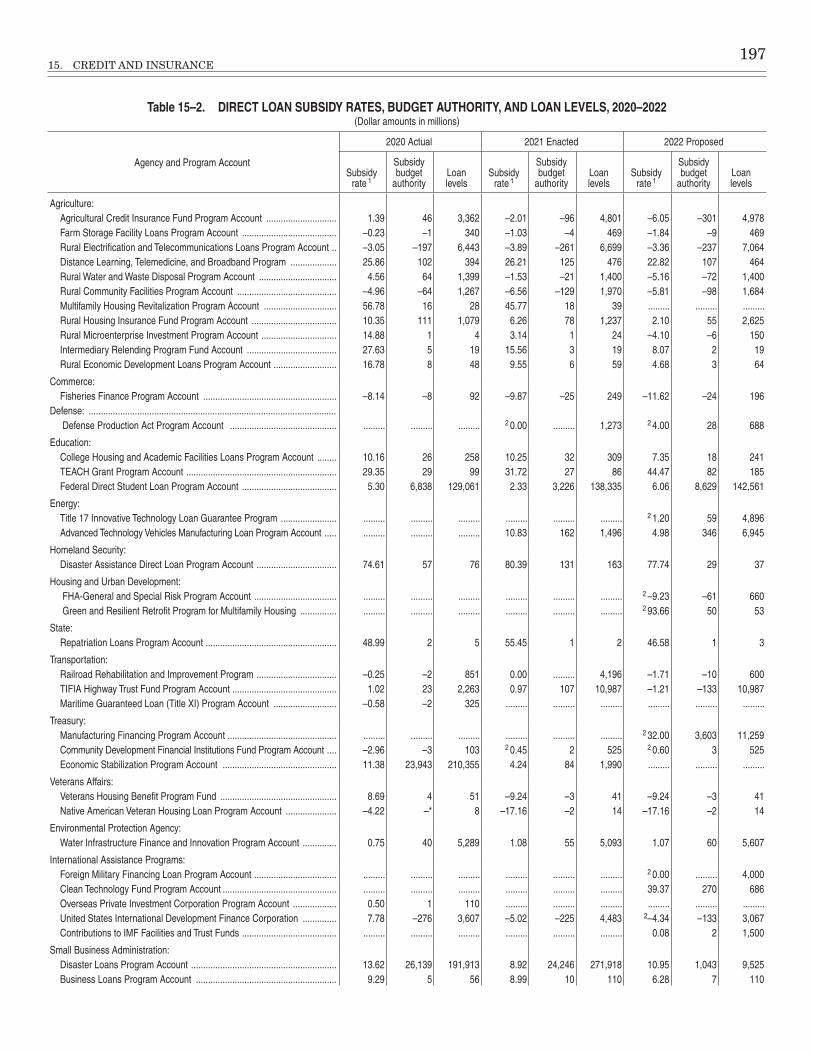
15. CREDIT AND INSURANCE 197
Table 15–2. DIRECT LOAN SUBSIDY RATES, BUDGET AUTHORITY, AND LOAN LEVELS, 2020–2022(Dollar amounts in millions)
Agency and Program Account
2020 Actual 2021 Enacted 2022 Proposed
Subsidy rate 1
Subsidy budget
authorityLoan levels
Subsidy rate 1
Subsidy budget
authorityLoan levels
Subsidy rate 1
Subsidy budget
authorityLoan levels
Agriculture:Agricultural Credit Insurance Fund Program Account ����������������������������� 1�39 46 3,362 –2�01 –96 4,801 –6�05 –301 4,978Farm Storage Facility Loans Program Account ��������������������������������������� –0�23 –1 340 –1�03 –4 469 –1�84 –9 469Rural Electrification and Telecommunications Loans Program Account �� –3�05 –197 6,443 –3�89 –261 6,699 –3�36 –237 7,064Distance Learning, Telemedicine, and Broadband Program ������������������� 25�86 102 394 26�21 125 476 22�82 107 464Rural Water and Waste Disposal Program Account �������������������������������� 4�56 64 1,399 –1�53 –21 1,400 –5�16 –72 1,400Rural Community Facilities Program Account ����������������������������������������� –4�96 –64 1,267 –6�56 –129 1,970 –5�81 –98 1,684Multifamily Housing Revitalization Program Account ������������������������������ 56�78 16 28 45�77 18 39 ��������� ��������� ���������Rural Housing Insurance Fund Program Account ����������������������������������� 10�35 111 1,079 6�26 78 1,237 2�10 55 2,625Rural Microenterprise Investment Program Account ������������������������������� 14�88 1 4 3�14 1 24 –4�10 –6 150Intermediary Relending Program Fund Account ������������������������������������� 27�63 5 19 15�56 3 19 8�07 2 19Rural Economic Development Loans Program Account �������������������������� 16�78 8 48 9�55 6 59 4�68 3 64
Commerce:Fisheries Finance Program Account ������������������������������������������������������� –8�14 –8 92 –9�87 –25 249 –11�62 –24 196
Defense: ������������������������������������������������������������������������������������������������������ Defense Production Act Program Account �������������������������������������������� ��������� ��������� ��������� 2 0�00 ��������� 1,273 2 4�00 28 688
Education:College Housing and Academic Facilities Loans Program Account �������� 10�16 26 258 10�25 32 309 7�35 18 241TEACH Grant Program Account �������������������������������������������������������������� 29�35 29 99 31�72 27 86 44�47 82 185Federal Direct Student Loan Program Account ��������������������������������������� 5�30 6,838 129,061 2�33 3,226 138,335 6�06 8,629 142,561
Energy:Title 17 Innovative Technology Loan Guarantee Program ����������������������� ��������� ��������� ��������� ��������� ��������� ��������� 2 1�20 59 4,896Advanced Technology Vehicles Manufacturing Loan Program Account ����� ��������� ��������� ��������� 10�83 162 1,496 4�98 346 6,945
Homeland Security:Disaster Assistance Direct Loan Program Account ��������������������������������� 74�61 57 76 80�39 131 163 77�74 29 37
Housing and Urban Development: FHA-General and Special Risk Program Account ���������������������������������� ��������� ��������� ��������� ��������� ��������� ��������� 2 –9�23 –61 660 Green and Resilient Retrofit Program for Multifamily Housing ��������������� ��������� ��������� ��������� ��������� ��������� ��������� 2 93�66 50 53
State:Repatriation Loans Program Account ������������������������������������������������������ 48�99 2 5 55�45 1 2 46�58 1 3
Transportation:Railroad Rehabilitation and Improvement Program ��������������������������������� –0�25 –2 851 0�00 ��������� 4,196 –1�71 –10 600TIFIA Highway Trust Fund Program Account ������������������������������������������� 1�02 23 2,263 0�97 107 10,987 –1�21 –133 10,987Maritime Guaranteed Loan (Title XI) Program Account �������������������������� –0�58 –2 325 ��������� ��������� ��������� ��������� ��������� ���������
Treasury:Manufacturing Financing Program Account ��������������������������������������������� ��������� ��������� ��������� ��������� ��������� ��������� 2 32�00 3,603 11,259Community Development Financial Institutions Fund Program Account ���� –2�96 –3 103 2 0�45 2 525 2 0�60 3 525Economic Stabilization Program Account ����������������������������������������������� 11�38 23,943 210,355 4�24 84 1,990 ��������� ��������� ���������
Veterans Affairs:Veterans Housing Benefit Program Fund ������������������������������������������������ 8�69 4 51 –9�24 –3 41 –9�24 –3 41Native American Veteran Housing Loan Program Account ��������������������� –4�22 –* 8 –17�16 –2 14 –17�16 –2 14
Environmental Protection Agency:Water Infrastructure Finance and Innovation Program Account �������������� 0�75 40 5,289 1�08 55 5,093 1�07 60 5,607
International Assistance Programs:Foreign Military Financing Loan Program Account ���������������������������������� ��������� ��������� ��������� ��������� ��������� ��������� 2 0�00 ��������� 4,000Clean Technology Fund Program Account ����������������������������������������������� ��������� ��������� ��������� ��������� ��������� ��������� 39�37 270 686Overseas Private Investment Corporation Program Account ������������������ 0�50 1 110 ��������� ��������� ��������� ��������� ��������� ���������United States International Development Finance Corporation �������������� 7�78 –276 3,607 –5�02 –225 4,483 2–4�34 –133 3,067Contributions to IMF Facilities and Trust Funds ��������������������������������������� ��������� ��������� ��������� ��������� ��������� ��������� 0�08 2 1,500
Small Business Administration:Disaster Loans Program Account ������������������������������������������������������������ 13�62 26,139 191,913 8�92 24,246 271,918 10�95 1,043 9,525Business Loans Program Account ���������������������������������������������������������� 9�29 5 56 8�99 10 110 6�28 7 110
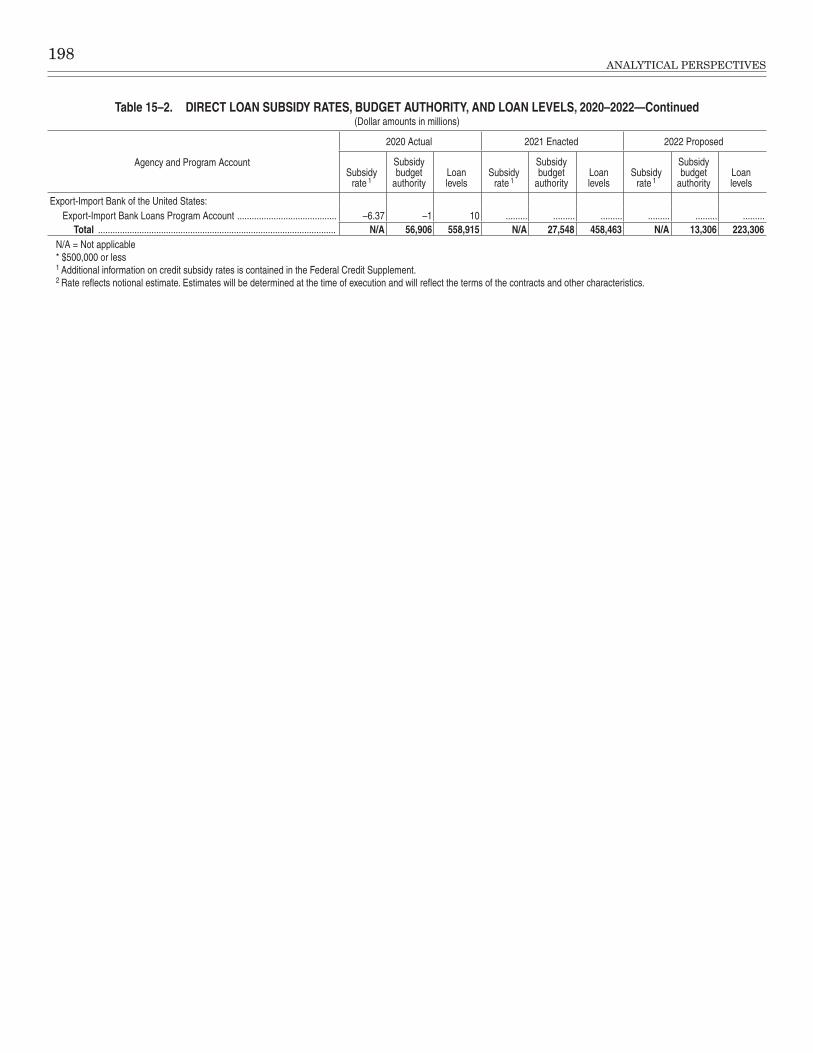
198ANALYTICAL PERSPECTIVES
Table 15–2. DIRECT LOAN SUBSIDY RATES, BUDGET AUTHORITY, AND LOAN LEVELS, 2020–2022—Continued(Dollar amounts in millions)
Agency and Program Account
2020 Actual 2021 Enacted 2022 Proposed
Subsidy rate 1
Subsidy budget
authorityLoan levels
Subsidy rate 1
Subsidy budget
authorityLoan levels
Subsidy rate 1
Subsidy budget
authorityLoan levels
Export-Import Bank of the United States: Export-Import Bank Loans Program Account ����������������������������������������� –6�37 –1 10 ��������� ��������� ��������� ��������� ��������� ���������
Total �������������������������������������������������������������������������������������������������� N/A 56,906 558,915 N/A 27,548 458,463 N/A 13,306 223,306N/A = Not applicable* $500,000 or less1 Additional information on credit subsidy rates is contained in the Federal Credit Supplement�2 Rate reflects notional estimate� Estimates will be determined at the time of execution and will reflect the terms of the contracts and other characteristics�
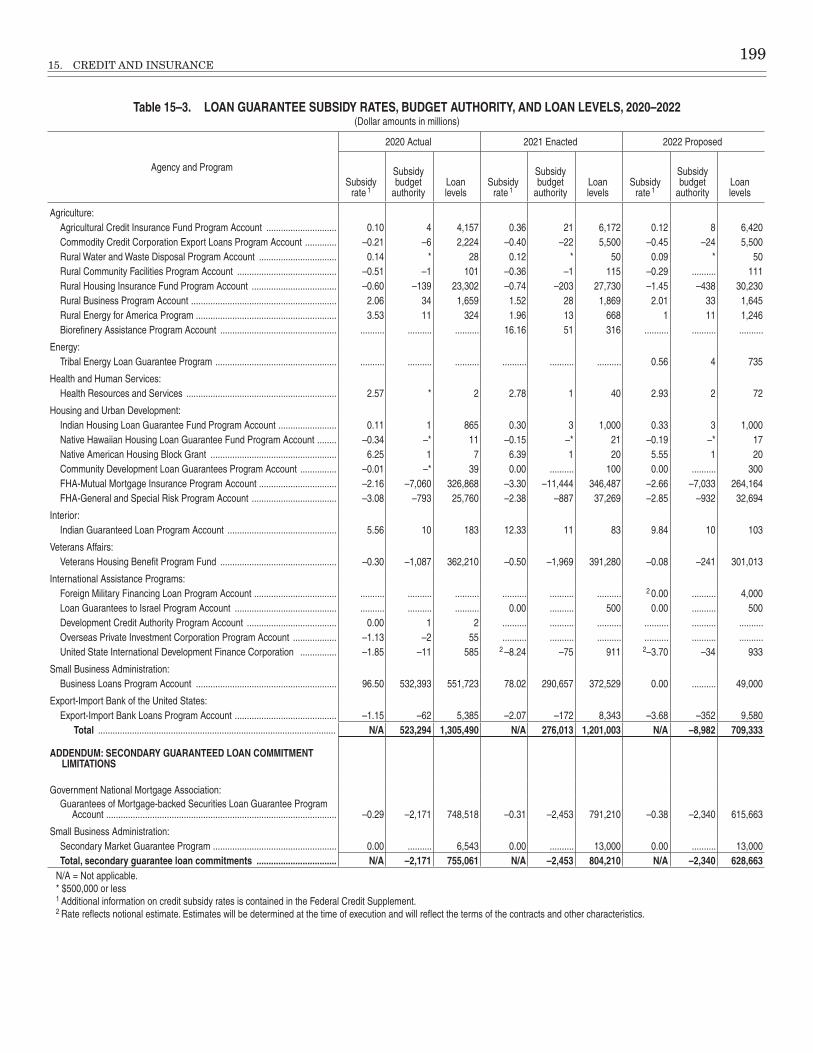
15. CREDIT AND INSURANCE 199
Table 15–3. LOAN GUARANTEE SUBSIDY RATES, BUDGET AUTHORITY, AND LOAN LEVELS, 2020–2022(Dollar amounts in millions)
Agency and Program
2020 Actual 2021 Enacted 2022 Proposed
Subsidy rate 1
Subsidy budget
authorityLoan levels
Subsidy rate 1
Subsidy budget
authorityLoan levels
Subsidy rate 1
Subsidy budget
authorityLoan levels
Agriculture:Agricultural Credit Insurance Fund Program Account ����������������������������� 0�10 4 4,157 0�36 21 6,172 0�12 8 6,420Commodity Credit Corporation Export Loans Program Account ������������� –0�21 –6 2,224 –0�40 –22 5,500 –0�45 –24 5,500Rural Water and Waste Disposal Program Account �������������������������������� 0�14 * 28 0�12 * 50 0�09 * 50Rural Community Facilities Program Account ����������������������������������������� –0�51 –1 101 –0�36 –1 115 –0�29 ���������� 111Rural Housing Insurance Fund Program Account ����������������������������������� –0�60 –139 23,302 –0�74 –203 27,730 –1�45 –438 30,230Rural Business Program Account ������������������������������������������������������������ 2�06 34 1,659 1�52 28 1,869 2�01 33 1,645Rural Energy for America Program ���������������������������������������������������������� 3�53 11 324 1�96 13 668 1 11 1,246Biorefinery Assistance Program Account ������������������������������������������������ ���������� ���������� ���������� 16�16 51 316 ���������� ���������� ����������
Energy:Tribal Energy Loan Guarantee Program �������������������������������������������������� ���������� ���������� ���������� ���������� ���������� ���������� 0�56 4 735
Health and Human Services:Health Resources and Services �������������������������������������������������������������� 2�57 * 2 2�78 1 40 2�93 2 72
Housing and Urban Development:Indian Housing Loan Guarantee Fund Program Account ������������������������ 0�11 1 865 0�30 3 1,000 0�33 3 1,000Native Hawaiian Housing Loan Guarantee Fund Program Account �������� –0�34 –* 11 –0�15 –* 21 –0�19 –* 17Native American Housing Block Grant ���������������������������������������������������� 6�25 1 7 6�39 1 20 5�55 1 20Community Development Loan Guarantees Program Account ��������������� –0�01 –* 39 0�00 ���������� 100 0�00 ���������� 300FHA-Mutual Mortgage Insurance Program Account �������������������������������� –2�16 –7,060 326,868 –3�30 –11,444 346,487 –2�66 –7,033 264,164FHA-General and Special Risk Program Account ����������������������������������� –3�08 –793 25,760 –2�38 –887 37,269 –2�85 –932 32,694
Interior:Indian Guaranteed Loan Program Account ��������������������������������������������� 5�56 10 183 12�33 11 83 9�84 10 103
Veterans Affairs:Veterans Housing Benefit Program Fund ������������������������������������������������ –0�30 –1,087 362,210 –0�50 –1,969 391,280 –0�08 –241 301,013
International Assistance Programs:Foreign Military Financing Loan Program Account ���������������������������������� ���������� ���������� ���������� ���������� ���������� ���������� 2 0�00 ���������� 4,000Loan Guarantees to Israel Program Account ������������������������������������������ ���������� ���������� ���������� 0�00 ���������� 500 0�00 ���������� 500Development Credit Authority Program Account ������������������������������������� 0�00 1 2 ���������� ���������� ���������� ���������� ���������� ����������Overseas Private Investment Corporation Program Account ������������������ –1�13 –2 55 ���������� ���������� ���������� ���������� ���������� ����������United State International Development Finance Corporation ��������������� –1�85 –11 585 2 –8�24 –75 911 2–3�70 –34 933
Small Business Administration:Business Loans Program Account ���������������������������������������������������������� 96�50 532,393 551,723 78�02 290,657 372,529 0�00 ���������� 49,000
Export-Import Bank of the United States:Export-Import Bank Loans Program Account ������������������������������������������ –1�15 –62 5,385 –2�07 –172 8,343 –3�68 –352 9,580
Total �������������������������������������������������������������������������������������������������� N/A 523,294 1,305,490 N/A 276,013 1,201,003 N/A –8,982 709,333
ADDENDUM: SECONDARY GUARANTEED LOAN COMMITMENT LIMITATIONS
Government National Mortgage Association:Guarantees of Mortgage-backed Securities Loan Guarantee Program
Account ����������������������������������������������������������������������������������������������� –0�29 –2,171 748,518 –0�31 –2,453 791,210 –0�38 –2,340 615,663
Small Business Administration:Secondary Market Guarantee Program ��������������������������������������������������� 0�00 ���������� 6,543 0�00 ���������� 13,000 0�00 ���������� 13,000Total, secondary guarantee loan commitments ................................. N/A –2,171 755,061 N/A –2,453 804,210 N/A –2,340 628,663
N/A = Not applicable�* $500,000 or less1 Additional information on credit subsidy rates is contained in the Federal Credit Supplement�2 Rate reflects notional estimate� Estimates will be determined at the time of execution and will reflect the terms of the contracts and other characteristics�
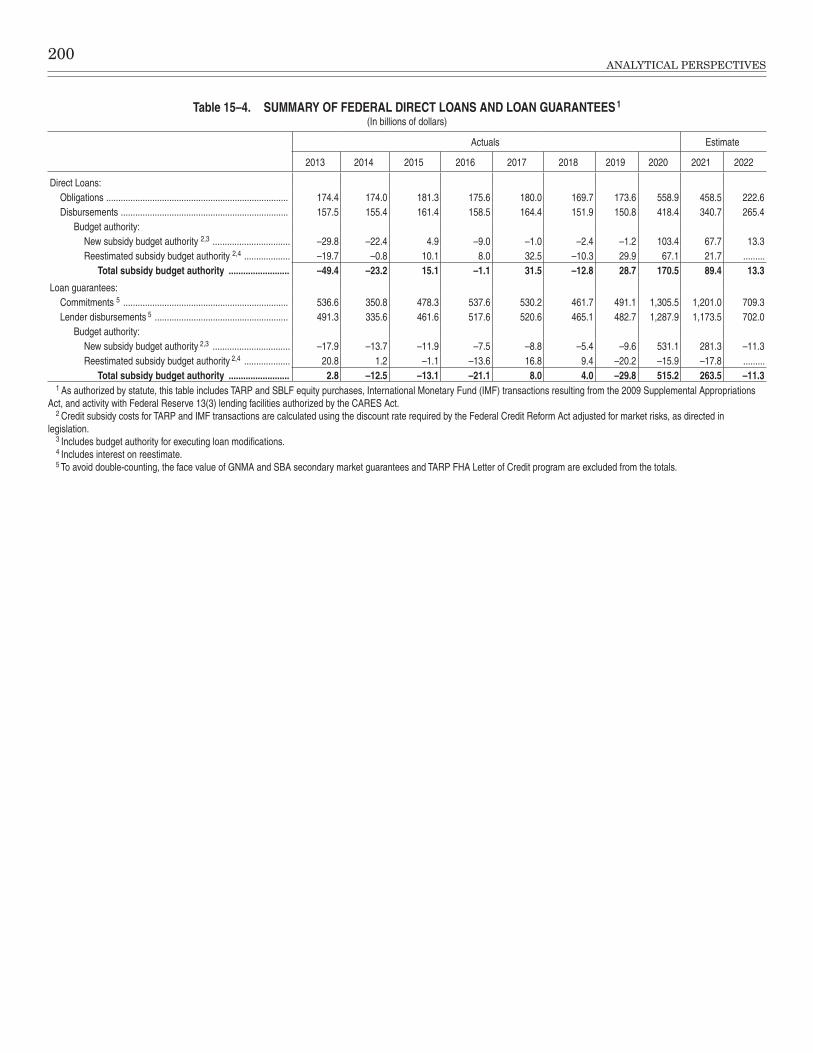
200ANALYTICAL PERSPECTIVES
Table 15–4. SUMMARY OF FEDERAL DIRECT LOANS AND LOAN GUARANTEES 1
(In billions of dollars)
Actuals Estimate
2013 2014 2015 2016 2017 2018 2019 2020 2021 2022
Direct Loans: Obligations ��������������������������������������������������������������������������� 174�4 174�0 181�3 175�6 180�0 169�7 173�6 558�9 458�5 222�6Disbursements ��������������������������������������������������������������������� 157�5 155�4 161�4 158�5 164�4 151�9 150�8 418�4 340�7 265�4
Budget authority:New subsidy budget authority 2,3 �������������������������������� –29�8 –22�4 4�9 –9�0 –1�0 –2�4 –1�2 103�4 67�7 13�3Reestimated subsidy budget authority 2,4 ������������������� –19�7 –0�8 10�1 8�0 32�5 –10�3 29�9 67�1 21�7 ���������
Total subsidy budget authority ......................... –49.4 –23.2 15.1 –1.1 31.5 –12.8 28.7 170.5 89.4 13.3
Loan guarantees: Commitments 5 �������������������������������������������������������������������� 536�6 350�8 478�3 537�6 530�2 461�7 491�1 1,305�5 1,201�0 709�3Lender disbursements 5 ������������������������������������������������������� 491�3 335�6 461�6 517�6 520�6 465�1 482�7 1,287�9 1,173�5 702�0
Budget authority:New subsidy budget authority 2,3 �������������������������������� –17�9 –13�7 –11�9 –7�5 –8�8 –5�4 –9�6 531�1 281�3 –11�3Reestimated subsidy budget authority 2,4 ������������������� 20�8 1�2 –1�1 –13�6 16�8 9�4 –20�2 –15�9 –17�8 ���������
Total subsidy budget authority ......................... 2.8 –12.5 –13.1 –21.1 8.0 4.0 –29.8 515.2 263.5 –11.31 As authorized by statute, this table includes TARP and SBLF equity purchases, International Monetary Fund (IMF) transactions resulting from the 2009 Supplemental Appropriations
Act, and activity with Federal Reserve 13(3) lending facilities authorized by the CARES Act�2 Credit subsidy costs for TARP and IMF transactions are calculated using the discount rate required by the Federal Credit Reform Act adjusted for market risks, as directed in
legislation�3 Includes budget authority for executing loan modifications�4 Includes interest on reestimate�5 To avoid double-counting, the face value of GNMA and SBA secondary market guarantees and TARP FHA Letter of Credit program are excluded from the totals�
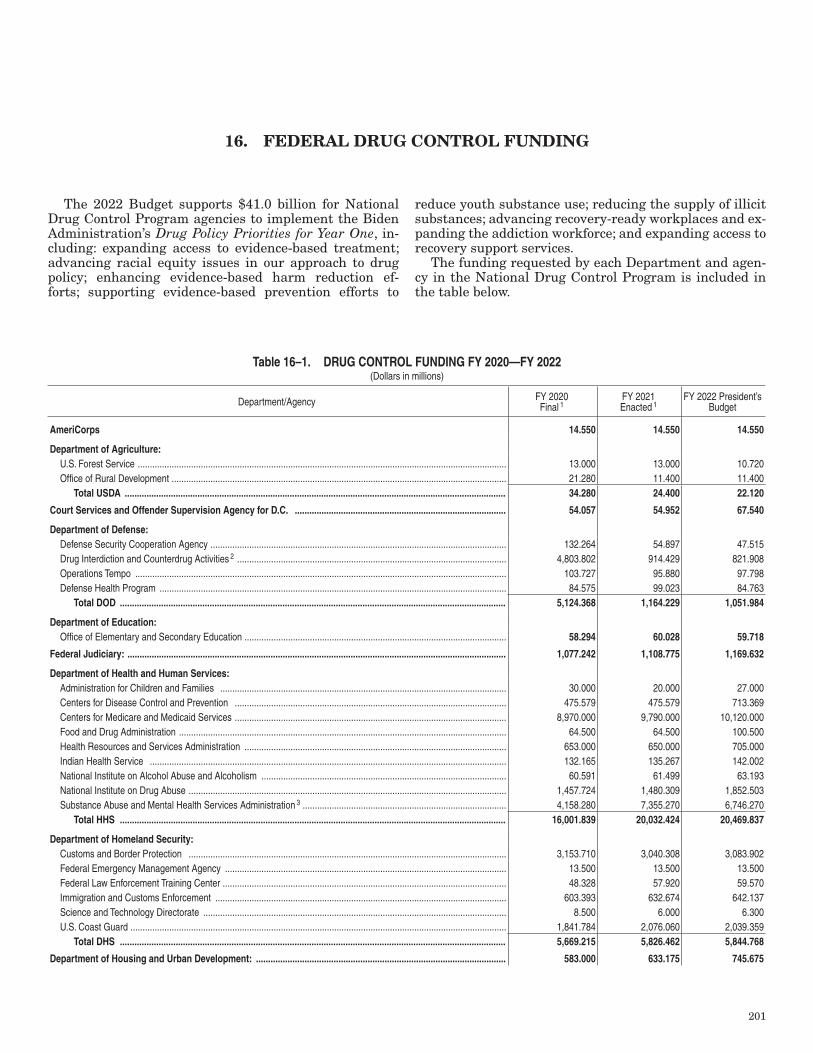
201
16. FEDERAL DRUG CONTROL FUNDING
The 2022 Budget supports $41.0 billion for National Drug Control Program agencies to implement the Biden Administration’s Drug Policy Priorities for Year One, in-cluding: expanding access to evidence-based treatment; advancing racial equity issues in our approach to drug policy; enhancing evidence-based harm reduction ef-forts; supporting evidence-based prevention efforts to
reduce youth substance use; reducing the supply of illicit substances; advancing recovery-ready workplaces and ex-panding the addiction workforce; and expanding access to recovery support services.
The funding requested by each Department and agen-cy in the National Drug Control Program is included in the table below.
Table 16–1. DRUG CONTROL FUNDING FY 2020—FY 2022 (Dollars in millions)
Department/Agency FY 2020 Final 1
FY 2021 Enacted 1
FY 2022 President’s Budget
AmeriCorps 14.550 14.550 14.550
Department of Agriculture:U�S� Forest Service �������������������������������������������������������������������������������������������������������������������������������������������������������� 13�000 13�000 10�720Office of Rural Development ������������������������������������������������������������������������������������������������������������������������������������������ 21�280 11�400 11�400
Total USDA ............................................................................................................................................................. 34.280 24.400 22.120
Court Services and Offender Supervision Agency for D.C. ....................................................................................... 54.057 54.952 67.540
Department of Defense:Defense Security Cooperation Agency �������������������������������������������������������������������������������������������������������������������������� 132�264 54�897 47�515Drug Interdiction and Counterdrug Activities 2 ��������������������������������������������������������������������������������������������������������������� 4,803�802 914�429 821�908Operations Tempo ��������������������������������������������������������������������������������������������������������������������������������������������������������� 103�727 95�880 97�798Defense Health Program ����������������������������������������������������������������������������������������������������������������������������������������������� 84�575 99�023 84�763
Total DOD ............................................................................................................................................................... 5,124.368 1,164.229 1,051.984
Department of Education:Office of Elementary and Secondary Education ������������������������������������������������������������������������������������������������������������ 58.294 60.028 59.718
Federal Judiciary: ............................................................................................................................................................ 1,077.242 1,108.775 1,169.632
Department of Health and Human Services:Administration for Children and Families ���������������������������������������������������������������������������������������������������������������������� 30�000 20�000 27�000Centers for Disease Control and Prevention ���������������������������������������������������������������������������������������������������������������� 475�579 475�579 713�369Centers for Medicare and Medicaid Services ���������������������������������������������������������������������������������������������������������������� 8,970�000 9,790�000 10,120�000Food and Drug Administration ��������������������������������������������������������������������������������������������������������������������������������������� 64�500 64�500 100�500Health Resources and Services Administration ������������������������������������������������������������������������������������������������������������ 653�000 650�000 705�000Indian Health Service ��������������������������������������������������������������������������������������������������������������������������������������������������� 132�165 135�267 142�002National Institute on Alcohol Abuse and Alcoholism ����������������������������������������������������������������������������������������������������� 60�591 61�499 63�193National Institute on Drug Abuse ����������������������������������������������������������������������������������������������������������������������������������� 1,457�724 1,480�309 1,852�503Substance Abuse and Mental Health Services Administration 3 ������������������������������������������������������������������������������������ 4,158�280 7,355�270 6,746�270
Total HHS ............................................................................................................................................................... 16,001.839 20,032.424 20,469.837
Department of Homeland Security:Customs and Border Protection ����������������������������������������������������������������������������������������������������������������������������������� 3,153�710 3,040�308 3,083�902Federal Emergency Management Agency �������������������������������������������������������������������������������������������������������������������� 13�500 13�500 13�500Federal Law Enforcement Training Center ��������������������������������������������������������������������������������������������������������������������� 48�328 57�920 59�570Immigration and Customs Enforcement ������������������������������������������������������������������������������������������������������������������������ 603�393 632�674 642�137Science and Technology Directorate ����������������������������������������������������������������������������������������������������������������������������� 8�500 6�000 6�300U�S� Coast Guard ����������������������������������������������������������������������������������������������������������������������������������������������������������� 1,841�784 2,076�060 2,039�359
Total DHS ............................................................................................................................................................... 5,669.215 5,826.462 5,844.768
Department of Housing and Urban Development: ....................................................................................................... 583.000 633.175 745.675
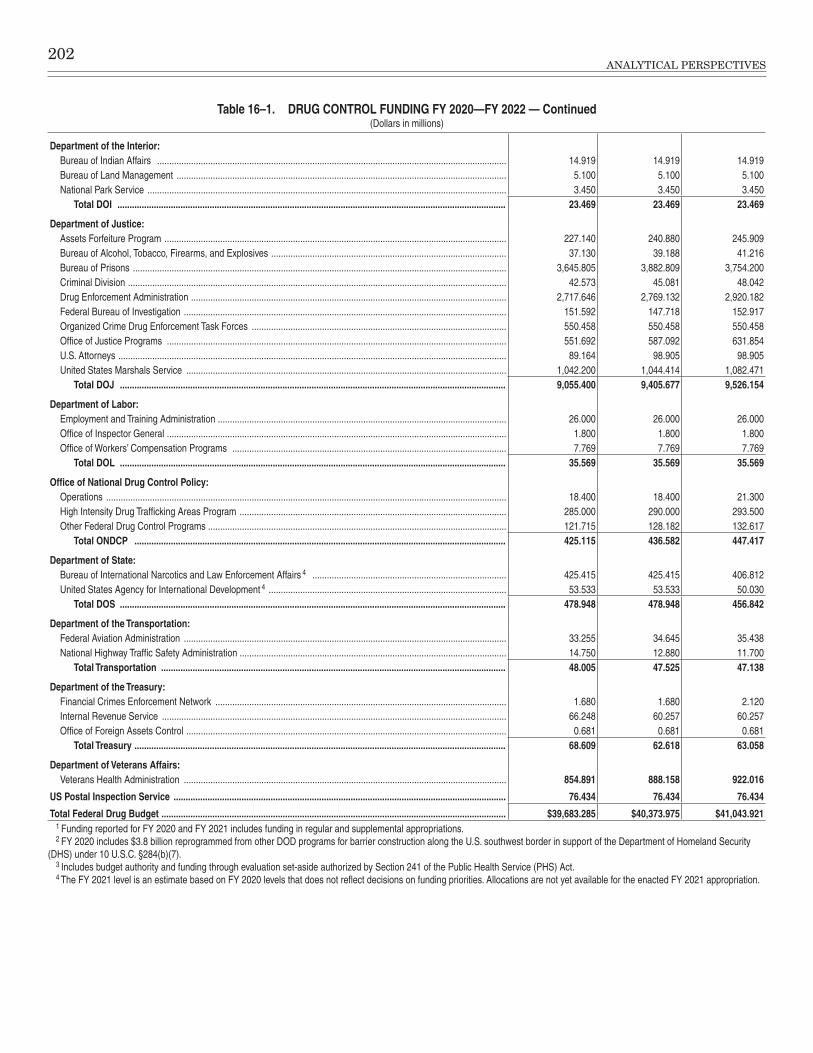
202ANALYTICAL PERSPECTIVES
Table 16–1. DRUG CONTROL FUNDING FY 2020—FY 2022 — Continued(Dollars in millions)
Department of the Interior:Bureau of Indian Affairs ������������������������������������������������������������������������������������������������������������������������������������������������ 14�919 14�919 14�919Bureau of Land Management ���������������������������������������������������������������������������������������������������������������������������������������� 5�100 5�100 5�100National Park Service ���������������������������������������������������������������������������������������������������������������������������������������������������� 3�450 3�450 3�450
Total DOI ................................................................................................................................................................ 23.469 23.469 23.469
Department of Justice:Assets Forfeiture Program ��������������������������������������������������������������������������������������������������������������������������������������������� 227�140 240�880 245�909Bureau of Alcohol, Tobacco, Firearms, and Explosives ������������������������������������������������������������������������������������������������� 37�130 39�188 41�216Bureau of Prisons ���������������������������������������������������������������������������������������������������������������������������������������������������������� 3,645�805 3,882�809 3,754�200Criminal Division ������������������������������������������������������������������������������������������������������������������������������������������������������������ 42�573 45�081 48�042Drug Enforcement Administration ���������������������������������������������������������������������������������������������������������������������������������� 2,717�646 2,769�132 2,920�182Federal Bureau of Investigation ������������������������������������������������������������������������������������������������������������������������������������� 151�592 147�718 152�917Organized Crime Drug Enforcement Task Forces ��������������������������������������������������������������������������������������������������������� 550�458 550�458 550�458Office of Justice Programs �������������������������������������������������������������������������������������������������������������������������������������������� 551�692 587�092 631�854U�S� Attorneys ���������������������������������������������������������������������������������������������������������������������������������������������������������������� 89�164 98�905 98�905United States Marshals Service ������������������������������������������������������������������������������������������������������������������������������������ 1,042�200 1,044�414 1,082�471
Total DOJ ............................................................................................................................................................... 9,055.400 9,405.677 9,526.154
Department of Labor:Employment and Training Administration ����������������������������������������������������������������������������������������������������������������������� 26�000 26�000 26�000Office of Inspector General �������������������������������������������������������������������������������������������������������������������������������������������� 1�800 1�800 1�800Office of Workers’ Compensation Programs ����������������������������������������������������������������������������������������������������������������� 7�769 7�769 7�769
Total DOL ............................................................................................................................................................... 35.569 35.569 35.569
Office of National Drug Control Policy:Operations ��������������������������������������������������������������������������������������������������������������������������������������������������������������������� 18�400 18�400 21�300High Intensity Drug Trafficking Areas Program �������������������������������������������������������������������������������������������������������������� 285�000 290�000 293�500Other Federal Drug Control Programs ��������������������������������������������������������������������������������������������������������������������������� 121�715 128�182 132�617
Total ONDCP ......................................................................................................................................................... 425.115 436.582 447.417
Department of State:Bureau of International Narcotics and Law Enforcement Affairs 4 �������������������������������������������������������������������������������� 425�415 425�415 406�812United States Agency for International Development 4 �������������������������������������������������������������������������������������������������� 53�533 53�533 50�030
Total DOS ............................................................................................................................................................... 478.948 478.948 456.842
Department of the Transportation:Federal Aviation Administration ������������������������������������������������������������������������������������������������������������������������������������� 33�255 34�645 35�438National Highway Traffic Safety Administration �������������������������������������������������������������������������������������������������������������� 14�750 12�880 11�700
Total Transportation .............................................................................................................................................. 48.005 47.525 47.138
Department of the Treasury:Financial Crimes Enforcement Network ������������������������������������������������������������������������������������������������������������������������ 1�680 1�680 2�120Internal Revenue Service ���������������������������������������������������������������������������������������������������������������������������������������������� 66�248 60�257 60�257Office of Foreign Assets Control ������������������������������������������������������������������������������������������������������������������������������������ 0�681 0�681 0�681
Total Treasury ......................................................................................................................................................... 68.609 62.618 63.058
Department of Veterans Affairs:Veterans Health Administration ������������������������������������������������������������������������������������������������������������������������������������� 854.891 888.158 922.016
US Postal Inspection Service ......................................................................................................................................... 76.434 76.434 76.434
Total Federal Drug Budget .............................................................................................................................................. $39,683.285 $40,373.975 $41,043.9211 Funding reported for FY 2020 and FY 2021 includes funding in regular and supplemental appropriations�2 FY 2020 includes $3�8 billion reprogrammed from other DOD programs for barrier construction along the U�S� southwest border in support of the Department of Homeland Security
(DHS) under 10 U�S�C� §284(b)(7)�3 Includes budget authority and funding through evaluation set-aside authorized by Section 241 of the Public Health Service (PHS) Act� 4 The FY 2021 level is an estimate based on FY 2020 levels that does not reflect decisions on funding priorities� Allocations are not yet available for the enacted FY 2021 appropriation�
203
TECHNICAL BUDGET ANALYSES

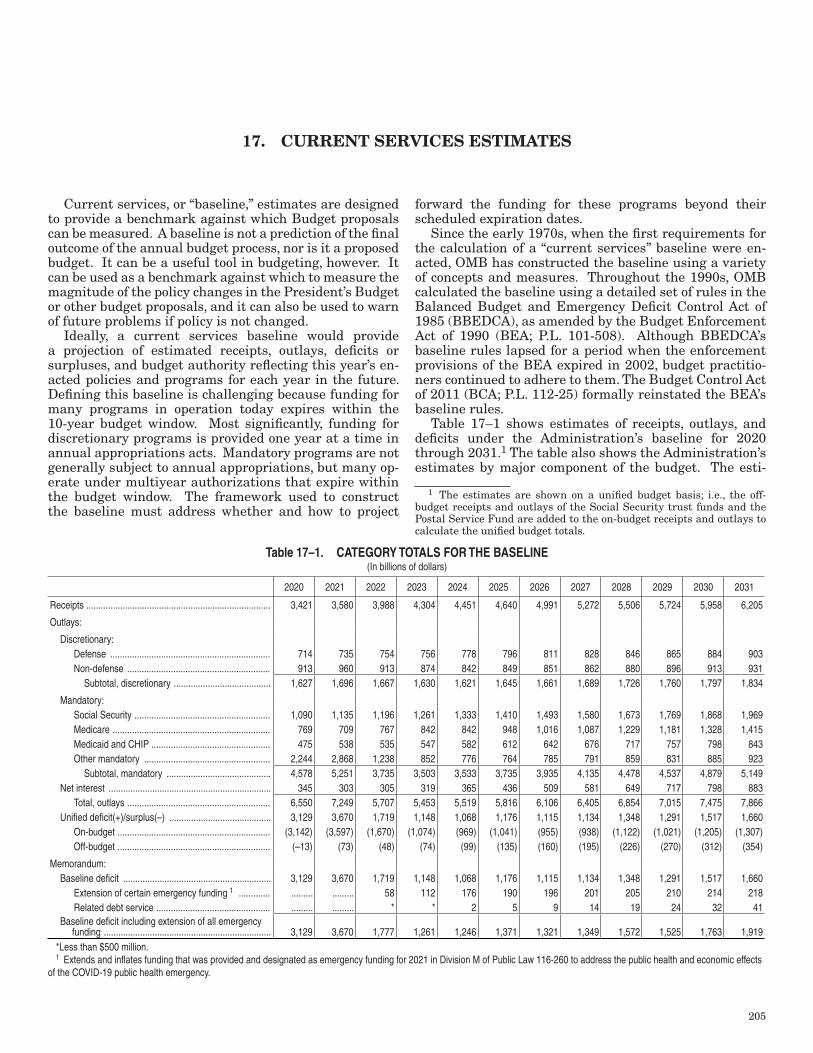
205
17. CURRENT SERVICES ESTIMATES
Current services, or “baseline,” estimates are designed to provide a benchmark against which Budget proposals can be measured. A baseline is not a prediction of the final outcome of the annual budget process, nor is it a proposed budget. It can be a useful tool in budgeting, however. It can be used as a benchmark against which to measure the magnitude of the policy changes in the President’s Budget or other budget proposals, and it can also be used to warn of future problems if policy is not changed.
Ideally, a current services baseline would provide a projection of estimated receipts, outlays, deficits or surpluses, and budget authority reflecting this year’s en-acted policies and programs for each year in the future. Defining this baseline is challenging because funding for many programs in operation today expires within the 10-year budget window. Most significantly, funding for discretionary programs is provided one year at a time in annual appropriations acts. Mandatory programs are not generally subject to annual appropriations, but many op-erate under multiyear authorizations that expire within the budget window. The framework used to construct the baseline must address whether and how to project
forward the funding for these programs beyond their scheduled expiration dates.
Since the early 1970s, when the first requirements for the calculation of a “current services” baseline were en-acted, OMB has constructed the baseline using a variety of concepts and measures. Throughout the 1990s, OMB calculated the baseline using a detailed set of rules in the Balanced Budget and Emergency Deficit Control Act of 1985 (BBEDCA), as amended by the Budget Enforcement Act of 1990 (BEA; P.L. 101-508). Although BBEDCA’s baseline rules lapsed for a period when the enforcement provisions of the BEA expired in 2002, budget practitio-ners continued to adhere to them. The Budget Control Act of 2011 (BCA; P.L. 112-25) formally reinstated the BEA’s baseline rules.
Table 17–1 shows estimates of receipts, outlays, and deficits under the Administration’s baseline for 2020 through 2031.1 The table also shows the Administration’s estimates by major component of the budget. The esti-
1 The estimates are shown on a unified budget basis; i.e., the off-budget receipts and outlays of the Social Security trust funds and the Postal Service Fund are added to the on-budget receipts and outlays to calculate the unified budget totals.
Table 17–1. CATEGORY TOTALS FOR THE BASELINE(In billions of dollars)
2020 2021 2022 2023 2024 2025 2026 2027 2028 2029 2030 2031
Receipts ���������������������������������������������������������������������������� 3,421 3,580 3,988 4,304 4,451 4,640 4,991 5,272 5,506 5,724 5,958 6,205
Outlays:
Discretionary:Defense ������������������������������������������������������������������ 714 735 754 756 778 796 811 828 846 865 884 903Non-defense ����������������������������������������������������������� 913 960 913 874 842 849 851 862 880 896 913 931
Subtotal, discretionary ���������������������������������������� 1,627 1,696 1,667 1,630 1,621 1,645 1,661 1,689 1,726 1,760 1,797 1,834
Mandatory:Social Security �������������������������������������������������������� 1,090 1,135 1,196 1,261 1,333 1,410 1,493 1,580 1,673 1,769 1,868 1,969Medicare ����������������������������������������������������������������� 769 709 767 842 842 948 1,016 1,087 1,229 1,181 1,328 1,415Medicaid and CHIP ������������������������������������������������� 475 538 535 547 582 612 642 676 717 757 798 843Other mandatory ���������������������������������������������������� 2,244 2,868 1,238 852 776 764 785 791 859 831 885 923
Subtotal, mandatory ������������������������������������������� 4,578 5,251 3,735 3,503 3,533 3,735 3,935 4,135 4,478 4,537 4,879 5,149Net interest ������������������������������������������������������������������� 345 303 305 319 365 436 509 581 649 717 798 883
Total, outlays ����������������������������������������������������������� 6,550 7,249 5,707 5,453 5,519 5,816 6,106 6,405 6,854 7,015 7,475 7,866Unified deficit(+)/surplus(–) ������������������������������������������ 3,129 3,670 1,719 1,148 1,068 1,176 1,115 1,134 1,348 1,291 1,517 1,660
On-budget ��������������������������������������������������������������� (3,142) (3,597) (1,670) (1,074) (969) (1,041) (955) (938) (1,122) (1,021) (1,205) (1,307)Off-budget ��������������������������������������������������������������� (–13) (73) (48) (74) (99) (135) (160) (195) (226) (270) (312) (354)
Memorandum:Baseline deficit ������������������������������������������������������������� 3,129 3,670 1,719 1,148 1,068 1,176 1,115 1,134 1,348 1,291 1,517 1,660
Extension of certain emergency funding 1 ������������� ��������� ��������� 58 112 176 190 196 201 205 210 214 218Related debt service ����������������������������������������������� ��������� ��������� * * 2 5 9 14 19 24 32 41
Baseline deficit including extension of all emergency funding ��������������������������������������������������������������������� 3,129 3,670 1,777 1,261 1,246 1,371 1,321 1,349 1,572 1,525 1,763 1,919
*Less than $500 million� 1 Extends and inflates funding that was provided and designated as emergency funding for 2021 in Division M of Public Law 116-260 to address the public health and economic effects
of the COVID-19 public health emergency�
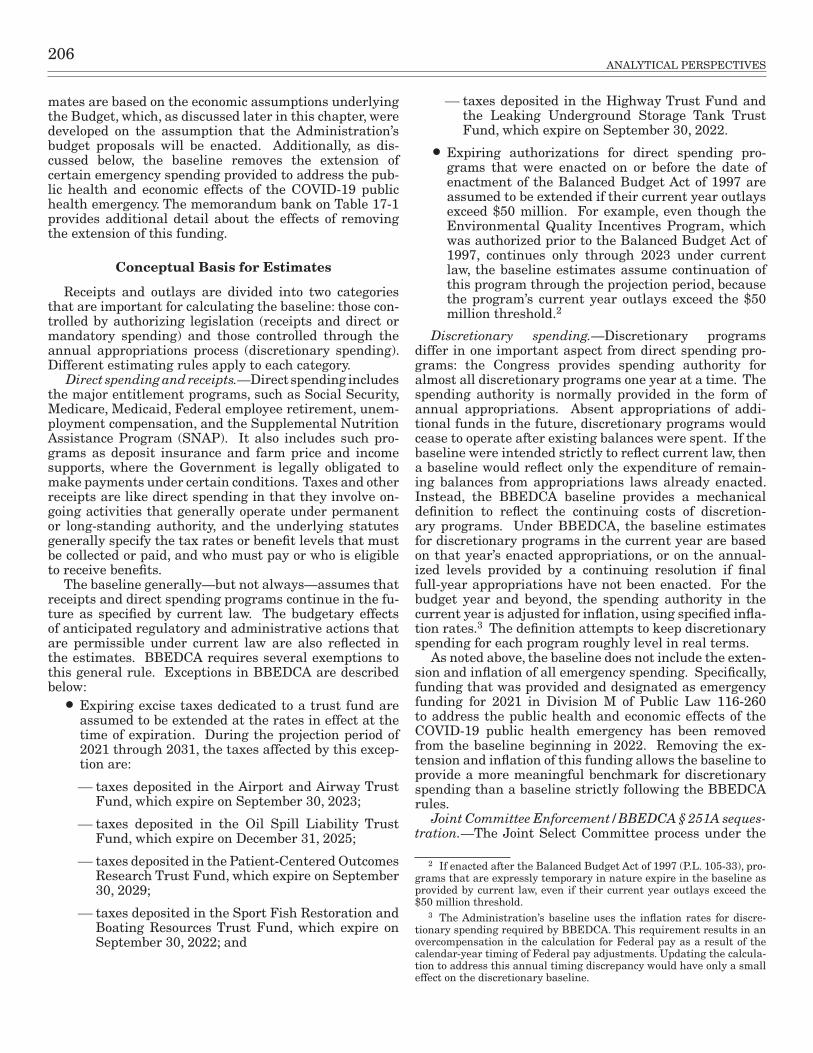
206ANALYTICAL PERSPECTIVES
mates are based on the economic assumptions underlying the Budget, which, as discussed later in this chapter, were developed on the assumption that the Administration’s budget proposals will be enacted. Additionally, as dis-cussed below, the baseline removes the extension of certain emergency spending provided to address the pub-lic health and economic effects of the COVID-19 public health emergency. The memorandum bank on Table 17-1 provides additional detail about the effects of removing the extension of this funding.
Conceptual Basis for Estimates
Receipts and outlays are divided into two categories that are important for calculating the baseline: those con-trolled by authorizing legislation (receipts and direct or mandatory spending) and those controlled through the annual appropriations process (discretionary spending). Different estimating rules apply to each category.
Direct spending and receipts.—Direct spending includes the major entitlement programs, such as Social Security, Medicare, Medicaid, Federal employee retirement, unem-ployment compensation, and the Supplemental Nutrition Assistance Program (SNAP). It also includes such pro-grams as deposit insurance and farm price and income supports, where the Government is legally obligated to make payments under certain conditions. Taxes and other receipts are like direct spending in that they involve on-going activities that generally operate under permanent or long-standing authority, and the underlying statutes generally specify the tax rates or benefit levels that must be collected or paid, and who must pay or who is eligible to receive benefits.
The baseline generally—but not always—assumes that receipts and direct spending programs continue in the fu-ture as specified by current law. The budgetary effects of anticipated regulatory and administrative actions that are permissible under current law are also reflected in the estimates. BBEDCA requires several exemptions to this general rule. Exceptions in BBEDCA are described below:
• Expiring excise taxes dedicated to a trust fund are assumed to be extended at the rates in effect at the time of expiration. During the projection period of 2021 through 2031, the taxes affected by this excep-tion are:
� taxes deposited in the Airport and Airway Trust Fund, which expire on September 30, 2023;
� taxes deposited in the Oil Spill Liability Trust Fund, which expire on December 31, 2025;
� taxes deposited in the Patient-Centered Outcomes Research Trust Fund, which expire on September 30, 2029;
� taxes deposited in the Sport Fish Restoration and Boating Resources Trust Fund, which expire on September 30, 2022; and
� taxes deposited in the Highway Trust Fund and the Leaking Underground Storage Tank Trust Fund, which expire on September 30, 2022.
• Expiring authorizations for direct spending pro-grams that were enacted on or before the date of enactment of the Balanced Budget Act of 1997 are assumed to be extended if their current year outlays exceed $50 million. For example, even though the Environmental Quality Incentives Program, which was authorized prior to the Balanced Budget Act of 1997, continues only through 2023 under current law, the baseline estimates assume continuation of this program through the projection period, because the program’s current year outlays exceed the $50 million threshold.2
Discretionary spending.—Discretionary programs differ in one important aspect from direct spending pro-grams: the Congress provides spending authority for almost all discretionary programs one year at a time. The spending authority is normally provided in the form of annual appropriations. Absent appropriations of addi-tional funds in the future, discretionary programs would cease to operate after existing balances were spent. If the baseline were intended strictly to reflect current law, then a baseline would reflect only the expenditure of remain-ing balances from appropriations laws already enacted. Instead, the BBEDCA baseline provides a mechanical definition to reflect the continuing costs of discretion-ary programs. Under BBEDCA, the baseline estimates for discretionary programs in the current year are based on that year’s enacted appropriations, or on the annual-ized levels provided by a continuing resolution if final full-year appropriations have not been enacted. For the budget year and beyond, the spending authority in the current year is adjusted for inflation, using specified infla-tion rates.3 The definition attempts to keep discretionary spending for each program roughly level in real terms.
As noted above, the baseline does not include the exten-sion and inflation of all emergency spending. Specifically, funding that was provided and designated as emergency funding for 2021 in Division M of Public Law 116-260 to address the public health and economic effects of the COVID-19 public health emergency has been removed from the baseline beginning in 2022. Removing the ex-tension and inflation of this funding allows the baseline to provide a more meaningful benchmark for discretionary spending than a baseline strictly following the BBEDCA rules.
Joint Committee Enforcement/BBEDCA § 251A seques-tration.—The Joint Select Committee process under the
2 If enacted after the Balanced Budget Act of 1997 (P.L. 105-33), pro-grams that are expressly temporary in nature expire in the baseline as provided by current law, even if their current year outlays exceed the $50 million threshold.
3 The Administration’s baseline uses the inflation rates for discre-tionary spending required by BBEDCA. This requirement results in an overcompensation in the calculation for Federal pay as a result of the calendar-year timing of Federal pay adjustments. Updating the calcula-tion to address this annual timing discrepancy would have only a small effect on the discretionary baseline.
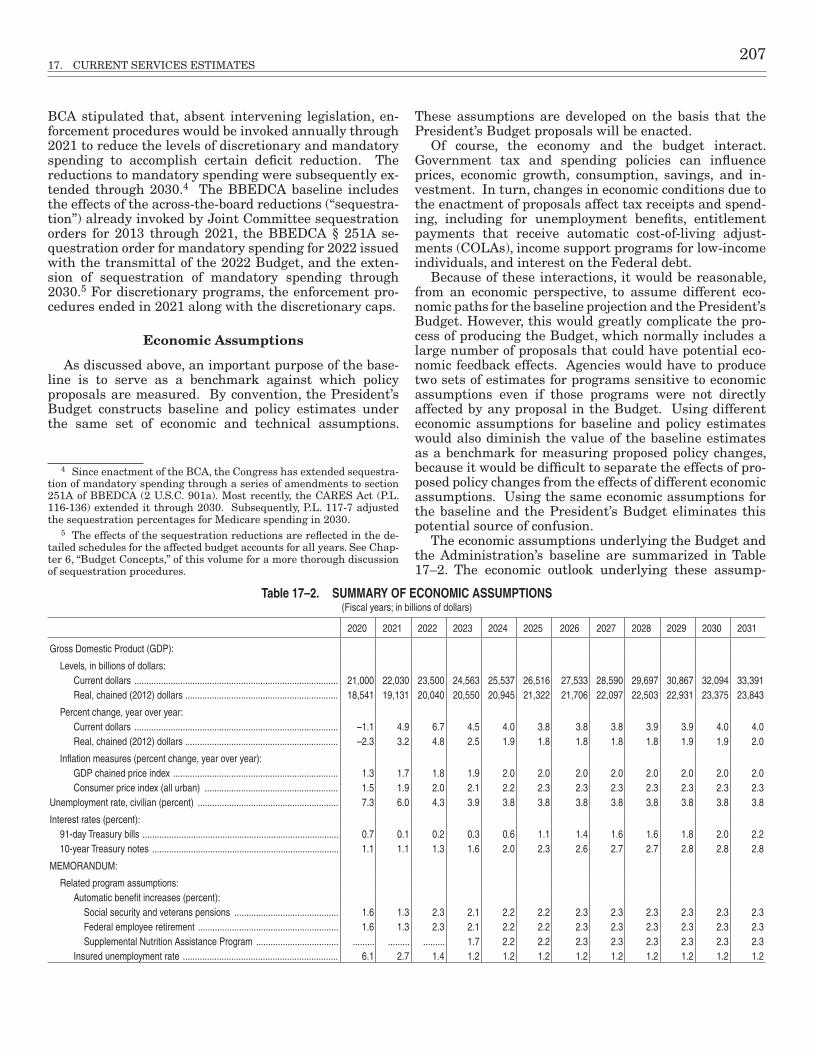
17. CURRENT SERVICES ESTIMATES 207
BCA stipulated that, absent intervening legislation, en-forcement procedures would be invoked annually through 2021 to reduce the levels of discretionary and mandatory spending to accomplish certain deficit reduction. The reductions to mandatory spending were subsequently ex-tended through 2030.4 The BBEDCA baseline includes the effects of the across-the-board reductions (“sequestra-tion”) already invoked by Joint Committee sequestration orders for 2013 through 2021, the BBEDCA § 251A se-questration order for mandatory spending for 2022 issued with the transmittal of the 2022 Budget, and the exten-sion of sequestration of mandatory spending through 2030.5 For discretionary programs, the enforcement pro-cedures ended in 2021 along with the discretionary caps.
Economic Assumptions
As discussed above, an important purpose of the base-line is to serve as a benchmark against which policy proposals are measured. By convention, the President’s Budget constructs baseline and policy estimates under the same set of economic and technical assumptions.
4 Since enactment of the BCA, the Congress has extended sequestra-tion of mandatory spending through a series of amendments to section 251A of BBEDCA (2 U.S.C. 901a). Most recently, the CARES Act (P.L. 116-136) extended it through 2030. Subsequently, P.L. 117-7 adjusted the sequestration percentages for Medicare spending in 2030.
5 The effects of the sequestration reductions are reflected in the de-tailed schedules for the affected budget accounts for all years. See Chap-ter 6, “Budget Concepts,” of this volume for a more thorough discussion of sequestration procedures.
These assumptions are developed on the basis that the President’s Budget proposals will be enacted.
Of course, the economy and the budget interact. Government tax and spending policies can influence prices, economic growth, consumption, savings, and in-vestment. In turn, changes in economic conditions due to the enactment of proposals affect tax receipts and spend-ing, including for unemployment benefits, entitlement payments that receive automatic cost-of-living adjust-ments (COLAs), income support programs for low-income individuals, and interest on the Federal debt.
Because of these interactions, it would be reasonable, from an economic perspective, to assume different eco-nomic paths for the baseline projection and the President’s Budget. However, this would greatly complicate the pro-cess of producing the Budget, which normally includes a large number of proposals that could have potential eco-nomic feedback effects. Agencies would have to produce two sets of estimates for programs sensitive to economic assumptions even if those programs were not directly affected by any proposal in the Budget. Using different economic assumptions for baseline and policy estimates would also diminish the value of the baseline estimates as a benchmark for measuring proposed policy changes, because it would be difficult to separate the effects of pro-posed policy changes from the effects of different economic assumptions. Using the same economic assumptions for the baseline and the President’s Budget eliminates this potential source of confusion.
The economic assumptions underlying the Budget and the Administration’s baseline are summarized in Table 17–2. The economic outlook underlying these assump-
Table 17–2. SUMMARY OF ECONOMIC ASSUMPTIONS(Fiscal years; in billions of dollars)
2020 2021 2022 2023 2024 2025 2026 2027 2028 2029 2030 2031
Gross Domestic Product (GDP):
Levels, in billions of dollars:Current dollars ������������������������������������������������������������������������������������ 21,000 22,030 23,500 24,563 25,537 26,516 27,533 28,590 29,697 30,867 32,094 33,391Real, chained (2012) dollars ��������������������������������������������������������������� 18,541 19,131 20,040 20,550 20,945 21,322 21,706 22,097 22,503 22,931 23,375 23,843
Percent change, year over year:Current dollars ������������������������������������������������������������������������������������ –1�1 4�9 6�7 4�5 4�0 3�8 3�8 3�8 3�9 3�9 4�0 4�0Real, chained (2012) dollars ��������������������������������������������������������������� –2�3 3�2 4�8 2�5 1�9 1�8 1�8 1�8 1�8 1�9 1�9 2�0
Inflation measures (percent change, year over year):GDP chained price index �������������������������������������������������������������������� 1�3 1�7 1�8 1�9 2�0 2�0 2�0 2�0 2�0 2�0 2�0 2�0Consumer price index (all urban) ������������������������������������������������������� 1�5 1�9 2�0 2�1 2�2 2�3 2�3 2�3 2�3 2�3 2�3 2�3
Unemployment rate, civilian (percent) ���������������������������������������������������������� 7�3 6�0 4�3 3�9 3�8 3�8 3�8 3�8 3�8 3�8 3�8 3�8
Interest rates (percent):91-day Treasury bills ��������������������������������������������������������������������������������� 0�7 0�1 0�2 0�3 0�6 1�1 1�4 1�6 1�6 1�8 2�0 2�210-year Treasury notes ����������������������������������������������������������������������������� 1�1 1�1 1�3 1�6 2�0 2�3 2�6 2�7 2�7 2�8 2�8 2�8
MEMORANDUM:
Related program assumptions:Automatic benefit increases (percent):
Social security and veterans pensions ������������������������������������������� 1�6 1�3 2�3 2�1 2�2 2�2 2�3 2�3 2�3 2�3 2�3 2�3Federal employee retirement ���������������������������������������������������������� 1�6 1�3 2�3 2�1 2�2 2�2 2�3 2�3 2�3 2�3 2�3 2�3Supplemental Nutrition Assistance Program ���������������������������������� ��������� ��������� ��������� 1�7 2�2 2�2 2�3 2�3 2�3 2�3 2�3 2�3
Insured unemployment rate ���������������������������������������������������������������� 6�1 2�7 1�4 1�2 1�2 1�2 1�2 1�2 1�2 1�2 1�2 1�2
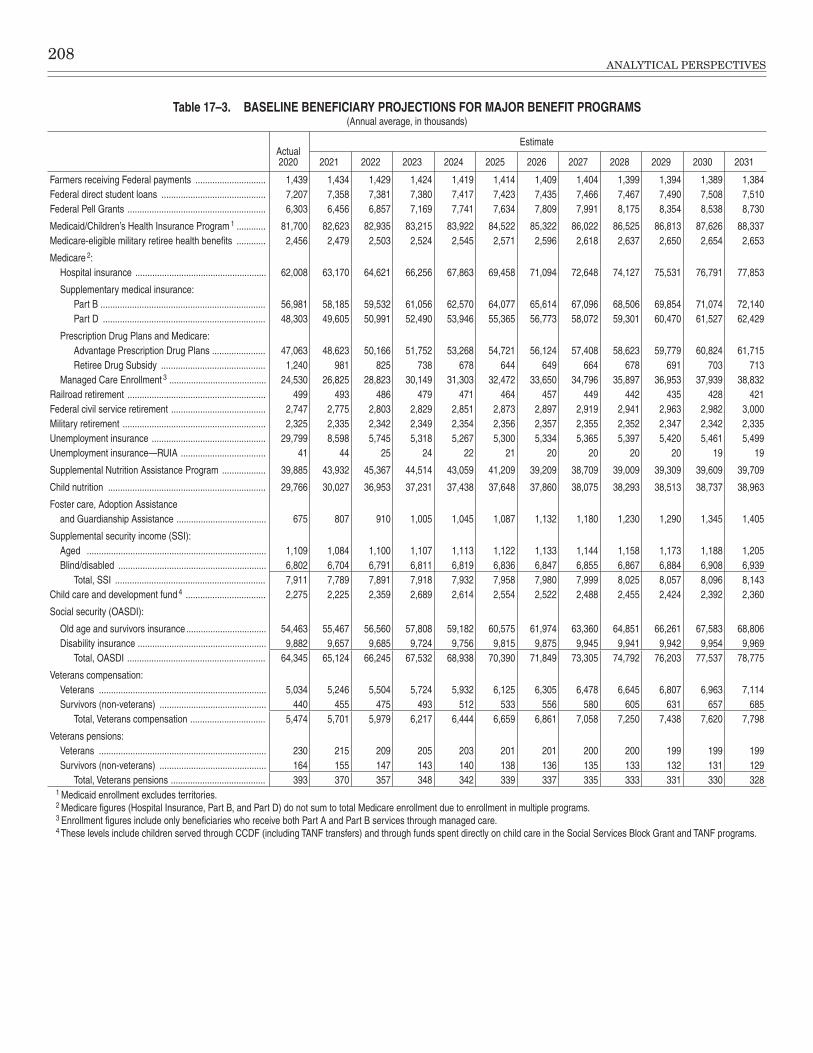
208ANALYTICAL PERSPECTIVES
Table 17–3. BASELINE BENEFICIARY PROJECTIONS FOR MAJOR BENEFIT PROGRAMS(Annual average, in thousands)
Actual2020
Estimate
2021 2022 2023 2024 2025 2026 2027 2028 2029 2030 2031
Farmers receiving Federal payments ����������������������������� 1,439 1,434 1,429 1,424 1,419 1,414 1,409 1,404 1,399 1,394 1,389 1,384Federal direct student loans ������������������������������������������� 7,207 7,358 7,381 7,380 7,417 7,423 7,435 7,466 7,467 7,490 7,508 7,510Federal Pell Grants ��������������������������������������������������������� 6,303 6,456 6,857 7,169 7,741 7,634 7,809 7,991 8,175 8,354 8,538 8,730
Medicaid/Children’s Health Insurance Program 1 ������������ 81,700 82,623 82,935 83,215 83,922 84,522 85,322 86,022 86,525 86,813 87,626 88,337Medicare-eligible military retiree health benefits ������������ 2,456 2,479 2,503 2,524 2,545 2,571 2,596 2,618 2,637 2,650 2,654 2,653
Medicare 2:Hospital insurance ������������������������������������������������������ 62,008 63,170 64,621 66,256 67,863 69,458 71,094 72,648 74,127 75,531 76,791 77,853
Supplementary medical insurance:Part B �������������������������������������������������������������������� 56,981 58,185 59,532 61,056 62,570 64,077 65,614 67,096 68,506 69,854 71,074 72,140 Part D ������������������������������������������������������������������� 48,303 49,605 50,991 52,490 53,946 55,365 56,773 58,072 59,301 60,470 61,527 62,429
Prescription Drug Plans and Medicare:Advantage Prescription Drug Plans ���������������������� 47,063 48,623 50,166 51,752 53,268 54,721 56,124 57,408 58,623 59,779 60,824 61,715 Retiree Drug Subsidy ������������������������������������������� 1,240 981 825 738 678 644 649 664 678 691 703 713
Managed Care Enrollment 3 ���������������������������������������� 24,530 26,825 28,823 30,149 31,303 32,472 33,650 34,796 35,897 36,953 37,939 38,832 Railroad retirement ��������������������������������������������������������� 499 493 486 479 471 464 457 449 442 435 428 421Federal civil service retirement ��������������������������������������� 2,747 2,775 2,803 2,829 2,851 2,873 2,897 2,919 2,941 2,963 2,982 3,000Military retirement ����������������������������������������������������������� 2,325 2,335 2,342 2,349 2,354 2,356 2,357 2,355 2,352 2,347 2,342 2,335Unemployment insurance ����������������������������������������������� 29,799 8,598 5,745 5,318 5,267 5,300 5,334 5,365 5,397 5,420 5,461 5,499Unemployment insurance—RUIA ����������������������������������� 41 44 25 24 22 21 20 20 20 20 19 19
Supplemental Nutrition Assistance Program ������������������ 39,885 43,932 45,367 44,514 43,059 41,209 39,209 38,709 39,009 39,309 39,609 39,709
Child nutrition ����������������������������������������������������������������� 29,766 30,027 36,953 37,231 37,438 37,648 37,860 38,075 38,293 38,513 38,737 38,963
Foster care, Adoption Assistanceand Guardianship Assistance ������������������������������������� 675 807 910 1,005 1,045 1,087 1,132 1,180 1,230 1,290 1,345 1,405
Supplemental security income (SSI):Aged �������������������������������������������������������������������������� 1,109 1,084 1,100 1,107 1,113 1,122 1,133 1,144 1,158 1,173 1,188 1,205 Blind/disabled ������������������������������������������������������������� 6,802 6,704 6,791 6,811 6,819 6,836 6,847 6,855 6,867 6,884 6,908 6,939
Total, SSI �������������������������������������������������������������� 7,911 7,789 7,891 7,918 7,932 7,958 7,980 7,999 8,025 8,057 8,096 8,143 Child care and development fund 4 ��������������������������������� 2,275 2,225 2,359 2,689 2,614 2,554 2,522 2,488 2,455 2,424 2,392 2,360
Social security (OASDI):
Old age and survivors insurance ��������������������������������� 54,463 55,467 56,560 57,808 59,182 60,575 61,974 63,360 64,851 66,261 67,583 68,806Disability insurance ����������������������������������������������������� 9,882 9,657 9,685 9,724 9,756 9,815 9,875 9,945 9,941 9,942 9,954 9,969
Total, OASDI ��������������������������������������������������������� 64,345 65,124 66,245 67,532 68,938 70,390 71,849 73,305 74,792 76,203 77,537 78,775
Veterans compensation:Veterans ��������������������������������������������������������������������� 5,034 5,246 5,504 5,724 5,932 6,125 6,305 6,478 6,645 6,807 6,963 7,114Survivors (non-veterans) �������������������������������������������� 440 455 475 493 512 533 556 580 605 631 657 685
Total, Veterans compensation ������������������������������� 5,474 5,701 5,979 6,217 6,444 6,659 6,861 7,058 7,250 7,438 7,620 7,798
Veterans pensions:Veterans ��������������������������������������������������������������������� 230 215 209 205 203 201 201 200 200 199 199 199Survivors (non-veterans) �������������������������������������������� 164 155 147 143 140 138 136 135 133 132 131 129
Total, Veterans pensions ��������������������������������������� 393 370 357 348 342 339 337 335 333 331 330 3281 Medicaid enrollment excludes territories�2 Medicare figures (Hospital Insurance, Part B, and Part D) do not sum to total Medicare enrollment due to enrollment in multiple programs�3 Enrollment figures include only beneficiaries who receive both Part A and Part B services through managed care�4 These levels include children served through CCDF (including TANF transfers) and through funds spent directly on child care in the Social Services Block Grant and TANF programs�

17. CURRENT SERVICES ESTIMATES 209
Table 17–5. RECEIPTS BY SOURCE IN THE PROJECTION OF BASELINE(In billions of dollars)
2020 Actual
Estimate
2021 2022 2023 2024 2025 2026 2027 2028 2029 2030 2031
Individual income taxes ���������������������������������������� 1,608�7 1,703�7 2,005�3 2,173�9 2,209�9 2,346�8 2,645�8 2,851�5 2,986�4 3,127�5 3,274�7 3,431�4Corporation income taxes ������������������������������������� 211�8 268�5 265�9 367�2 412�0 432�3 424�6 423�7 432�9 431�6 433�3 438�5Social insurance and retirement receipts ������������� 1,310�0 1,296�2 1,416�7 1,467�1 1,526�4 1,577�1 1,639�1 1,699�5 1,778�6 1,845�4 1,921�8 1,996�3
(On-budget) ����������������������������������������������������� (344�5) (352�0) (385�1) (399�5) (413�2) (423�7) (437�2) (452�6) (473�7) (490�5) (511�7) (528�9)(Off-budget) ����������������������������������������������������� (965�4) (944�1) (1,031�6) (1,067�6) (1,113�2) (1,153�4) (1,201�8) (1,246�9) (1,304�9) (1,354�9) (1,410�1) (1,467�4)
Excise taxes ��������������������������������������������������������� 86�8 74�1 81�9 85�5 90�1 90�2 91�1 92�0 91�8 93�9 96�6 97�3Estate and gift taxes ��������������������������������������������� 17�6 17�6 20�8 22�3 23�6 24�6 25�1 37�8 39�0 40�7 43�2 45�9Customs duties ����������������������������������������������������� 68�6 84�8 57�4 45�2 45�5 46�5 47�8 49�2 50�8 52�6 54�6 56�8Miscellaneous receipts ����������������������������������������� 117�7 134�7 140�2 143�1 143�1 122�9 117�3 117�8 126�3 132�0 133�6 139�1
Total, receipts ................................................. 3,421.2 3,579.5 3,988.2 4,304.2 4,450.6 4,640.3 4,990.8 5,271.5 5,505.7 5,723.7 5,957.8 6,205.3(On-budget) ������������������������������������������������ (2,455�7) (2,635�4) (2,956�6) (3,236�6) (3,337�4) (3,486�9) (3,789�0) (4,024�7) (4,200�8) (4,368�8) (4,547�8) (4,737�9)(Off-budget) ������������������������������������������������ (965�4) (944�1) (1,031�6) (1,067�6) (1,113�2) (1,153�4) (1,201�8) (1,246�9) (1,304�9) (1,354�9) (1,410�1) (1,467�4)
tions is discussed in greater detail in Chapter 2 of this volume.
Major Programmatic Assumptions
A number of programmatic assumptions must be made to calculate the baseline estimates. These include as-sumptions about annual cost-of-living adjustments in the indexed programs and the number of beneficiaries who will receive payments from the major benefit programs. Assumptions about various automatic cost-of-living-adjustments are shown in Table 17–2, and assumptions about baseline caseload projections for the major benefit programs are shown in Table 17–3. These assumptions affect baseline estimates of direct spending for each of these programs, and they also affect estimates of the dis-cretionary baseline for a limited number of programs. For the administrative expenses for Medicare, Railroad Retirement, and unemployment insurance, the discretion-ary baseline is increased (or decreased) for changes in the number of beneficiaries in addition to the adjustments for inflation described earlier. It is also necessary to make assumptions about the continuation of expiring programs and provisions. As explained above, in the baseline esti-mates provided here, expiring excise taxes dedicated to a trust fund are extended at current rates. In general, mandatory programs with spending of at least $50 mil-lion in the current year are also assumed to continue, unless the programs are explicitly temporary in nature. Table 17–4, available at https://www.whitehouse.gov/omb/analytical-perspectives/, provides a listing of man-datory programs and taxes assumed to continue in the baseline after their expiration.6 Many other important assumptions must be made in order to calculate the base-line estimates. These include the timing and content of
6 All discretionary programs with enacted non-emergency appro-priations in the current year, as well as emergency appropriations other than those enacted in in Division M of Public Law 116-260, are assumed to continue, and are therefore not presented in Table 17-4.
regulations that will be issued over the projection period, the use of administrative discretion under current law, and other assumptions about the way programs operate. Table 17–4 lists many of these assumptions and their ef-fects on the baseline estimates. The list is not intended to be exhaustive; the variety and complexity of Government programs are too great to provide a complete list. Instead, the table shows some of the more important assumptions.
Current Services Receipts, Outlays, and Budget Authority
Receipts.—Table 17–5 shows the Administration’s baseline receipts by major source. Table 17–6 shows the scheduled increases in the Social Security taxable earn-ings base, which affect both payroll tax receipts for the program and the initial benefit levels for certain retirees.
Outlays.—Table 17–7 shows the growth from 2021 to 2022 and average annual growth over the five-year and ten-year periods for certain discretionary and ma-jor mandatory programs. Tables 17–8 and 17–9 show the Administration’s baseline outlays by function and by agency, respectively. A more detailed presentation of these outlays (by function, category, subfunction, and program) is available on the internet as part of Table 17–12 at https://www.whitehouse.gov/omb/analytical-perspectives/.
Budget authority.—Tables 17–10 and 17–11 show estimates of budget authority in the Administration’s baseline by function and by agency, respectively. A more detailed presentation of this budget authority with pro-gram-level estimates is also available on the internet as part of Table 17–12 at https://www.whitehouse.gov/omb/analytical-perspectives/.
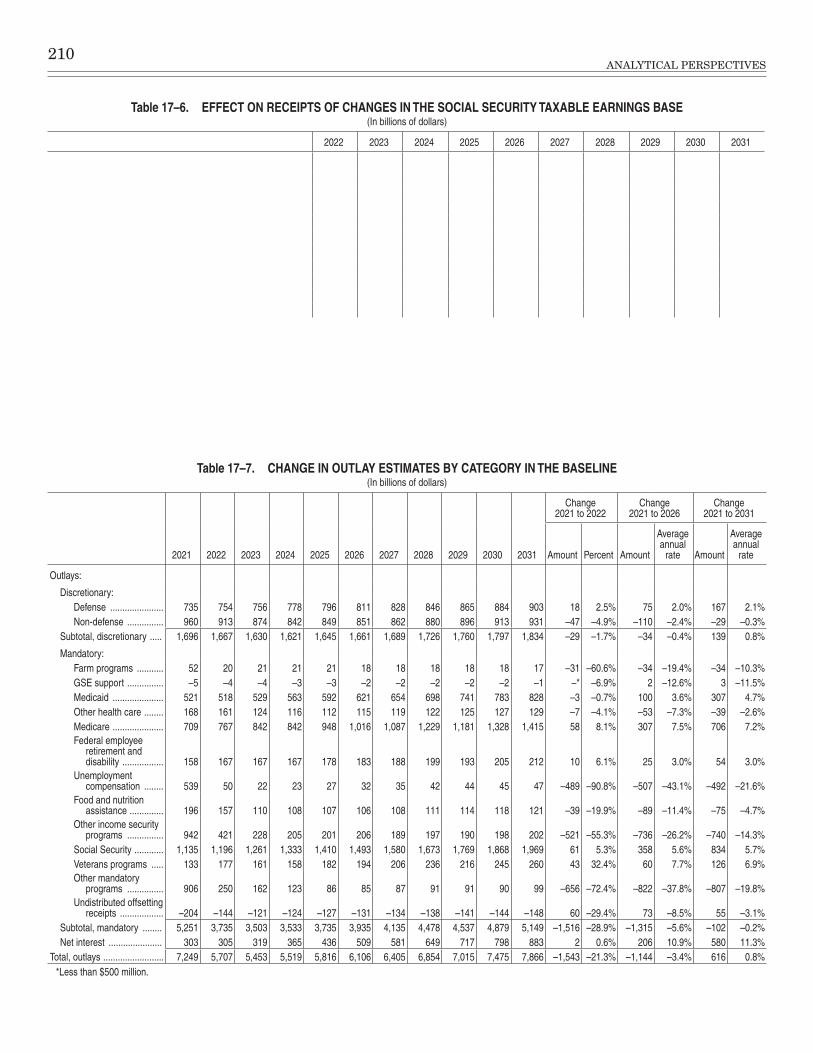
210ANALYTICAL PERSPECTIVES
Table 17–6. EFFECT ON RECEIPTS OF CHANGES IN THE SOCIAL SECURITY TAXABLE EARNINGS BASE(In billions of dollars)
2022 2023 2024 2025 2026 2027 2028 2029 2030 2031
Social security (OASDI) taxable earnings base increases:$142,800 to $145,500 on Jan 1, 2022 � ����������������������������������������� 1 5� 3 8� 4 1� 4 4� 4 7� 5 1� 5 6� 6 0� 6 5� 7 0�$145,500 to $153,000 on Jan 1, 2023 � ����������������������������������������� ��������� 4 3� 10 6� 11 4� 12 3� 13 2� 14 3� 15 5� 16 8� 18 2�$153,000 to $159,000 on Jan 1, 2024 � ����������������������������������������� ��������� ��������� 3 4� 8 3� 8 9� 9 7� 10 5� 11 3� 12 3� 13 3�$159,000 to $164,700 on Jan 1, 2025 � ����������������������������������������� ��������� ��������� ��������� 3 2� 7 9� 8 5� 9 2� 10 0� 10 8� 11 7�$164,700 to $171,300 on Jan 1, 2026 � ����������������������������������������� ��������� ��������� ��������� ��������� 3 7� 9 1� 9 9� 10 7� 11 6� 12 6�$171,300 to $176,400 on Jan 1, 2027 � ����������������������������������������� ��������� ��������� ��������� ��������� ��������� 2 9� 7 1� 7 7� 8 3� 9 0�$176,400 to $182,400 on Jan 1, 2028 � ����������������������������������������� ��������� ��������� ��������� ��������� ��������� ��������� 3 4� 8 5� 9 2� 10 0�$182,400 to $189,000 on Jan 1, 2029 � ����������������������������������������� ��������� ��������� ��������� ��������� ��������� ��������� ��������� 3 8� 9 4� 10 2�$189,000 to $195,600 on Jan 1, 2030 � ����������������������������������������� ��������� ��������� ��������� ��������� ��������� ��������� ��������� ��������� 3 9� 9 5�$195,600 to $203,100 on Jan 1, 2031 � ����������������������������������������� ��������� ��������� ��������� ��������� ��������� ��������� ��������� ��������� ��������� 4 4�
Table 17–7. CHANGE IN OUTLAY ESTIMATES BY CATEGORY IN THE BASELINE(In billions of dollars)
2021 2022 2023 2024 2025 2026 2027 2028 2029 2030 2031
Change 2021 to 2022
Change 2021 to 2026
Change 2021 to 2031
Amount Percent Amount
Average annual
rate Amount
Average annual
rate
Outlays:
Discretionary:Defense ���������������������� 735 754 756 778 796 811 828 846 865 884 903 18 2�5% 75 2�0% 167 2�1%Non-defense ��������������� 960 913 874 842 849 851 862 880 896 913 931 –47 –4�9% –110 –2�4% –29 –0�3%
Subtotal, discretionary ����� 1,696 1,667 1,630 1,621 1,645 1,661 1,689 1,726 1,760 1,797 1,834 –29 –1�7% –34 –0�4% 139 0�8%
Mandatory:Farm programs ����������� 52 20 21 21 21 18 18 18 18 18 17 –31 –60�6% –34 –19�4% –34 –10�3%GSE support ��������������� –5 –4 –4 –3 –3 –2 –2 –2 –2 –2 –1 –* –6�9% 2 –12�6% 3 –11�5%Medicaid ��������������������� 521 518 529 563 592 621 654 698 741 783 828 –3 –0�7% 100 3�6% 307 4�7%Other health care �������� 168 161 124 116 112 115 119 122 125 127 129 –7 –4�1% –53 –7�3% –39 –2�6%Medicare ��������������������� 709 767 842 842 948 1,016 1,087 1,229 1,181 1,328 1,415 58 8�1% 307 7�5% 706 7�2%Federal employee
retirement and disability ����������������� 158 167 167 167 178 183 188 199 193 205 212 10 6�1% 25 3�0% 54 3�0%
Unemployment compensation �������� 539 50 22 23 27 32 35 42 44 45 47 –489 –90�8% –507 –43�1% –492 –21�6%
Food and nutrition assistance �������������� 196 157 110 108 107 106 108 111 114 118 121 –39 –19�9% –89 –11�4% –75 –4�7%
Other income security programs ��������������� 942 421 228 205 201 206 189 197 190 198 202 –521 –55�3% –736 –26�2% –740 –14�3%
Social Security ������������ 1,135 1,196 1,261 1,333 1,410 1,493 1,580 1,673 1,769 1,868 1,969 61 5�3% 358 5�6% 834 5�7%Veterans programs ����� 133 177 161 158 182 194 206 236 216 245 260 43 32�4% 60 7�7% 126 6�9%Other mandatory
programs ��������������� 906 250 162 123 86 85 87 91 91 90 99 –656 –72�4% –822 –37�8% –807 –19�8%Undistributed offsetting
receipts ������������������ –204 –144 –121 –124 –127 –131 –134 –138 –141 –144 –148 60 –29�4% 73 –8�5% 55 –3�1%Subtotal, mandatory �������� 5,251 3,735 3,503 3,533 3,735 3,935 4,135 4,478 4,537 4,879 5,149 –1,516 –28�9% –1,315 –5�6% –102 –0�2%Net interest ���������������������� 303 305 319 365 436 509 581 649 717 798 883 2 0�6% 206 10�9% 580 11�3%
Total, outlays ������������������������� 7,249 5,707 5,453 5,519 5,816 6,106 6,405 6,854 7,015 7,475 7,866 –1,543 –21�3% –1,144 –3�4% 616 0�8%*Less than $500 million�
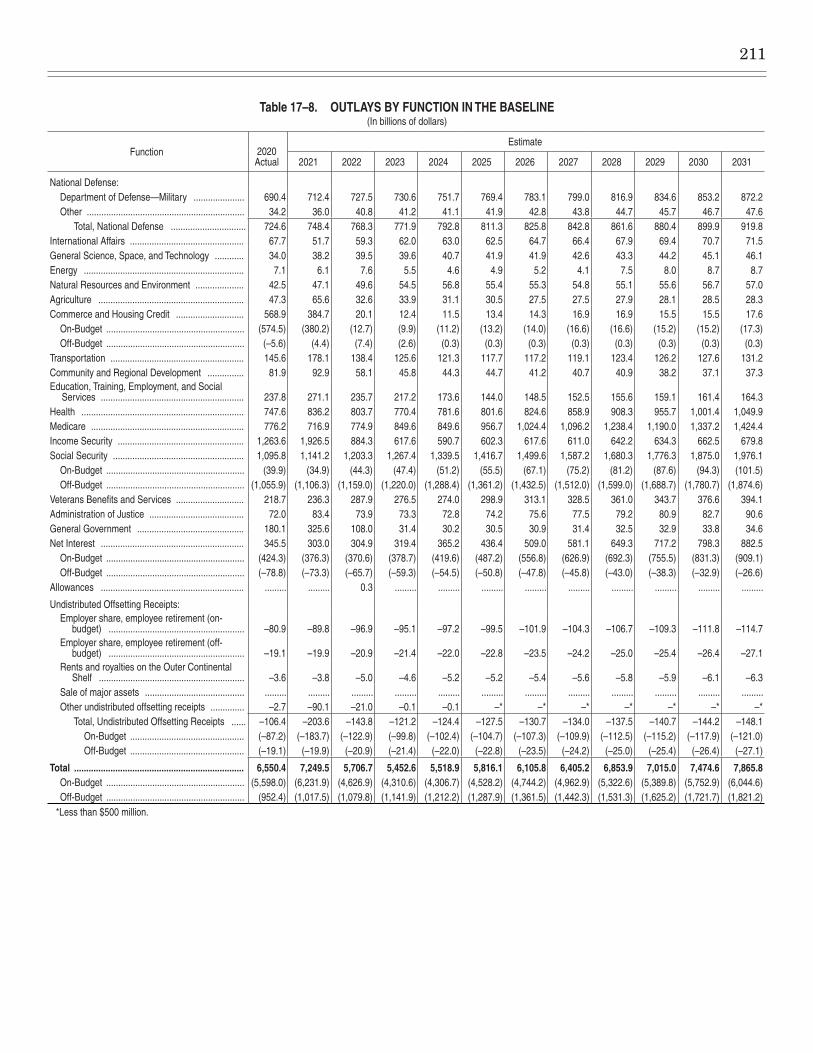
211
Table 17–8. OUTLAYS BY FUNCTION IN THE BASELINE(In billions of dollars)
Function 2020 Actual
Estimate
2021 2022 2023 2024 2025 2026 2027 2028 2029 2030 2031
National Defense:Department of Defense—Military ��������������������� 690�4 712�4 727�5 730�6 751�7 769�4 783�1 799�0 816�9 834�6 853�2 872�2Other ����������������������������������������������������������������� 34�2 36�0 40�8 41�2 41�1 41�9 42�8 43�8 44�7 45�7 46�7 47�6
Total, National Defense ������������������������������� 724�6 748�4 768�3 771�9 792�8 811�3 825�8 842�8 861�6 880�4 899�9 919�8International Affairs ����������������������������������������������� 67�7 51�7 59�3 62�0 63�0 62�5 64�7 66�4 67�9 69�4 70�7 71�5General Science, Space, and Technology ������������ 34�0 38�2 39�5 39�6 40�7 41�9 41�9 42�6 43�3 44�2 45�1 46�1Energy ������������������������������������������������������������������ 7�1 6�1 7�6 5�5 4�6 4�9 5�2 4�1 7�5 8�0 8�7 8�7Natural Resources and Environment �������������������� 42�5 47�1 49�6 54�5 56�8 55�4 55�3 54�8 55�1 55�6 56�7 57�0Agriculture ������������������������������������������������������������ 47�3 65�6 32�6 33�9 31�1 30�5 27�5 27�5 27�9 28�1 28�5 28�3Commerce and Housing Credit ���������������������������� 568�9 384�7 20�1 12�4 11�5 13�4 14�3 16�9 16�9 15�5 15�5 17�6
On-Budget ��������������������������������������������������������� (574�5) (380�2) (12�7) (9�9) (11�2) (13�2) (14�0) (16�6) (16�6) (15�2) (15�2) (17�3)Off-Budget ��������������������������������������������������������� (–5�6) (4�4) (7�4) (2�6) (0�3) (0�3) (0�3) (0�3) (0�3) (0�3) (0�3) (0�3)
Transportation ������������������������������������������������������� 145�6 178�1 138�4 125�6 121�3 117�7 117�2 119�1 123�4 126�2 127�6 131�2Community and Regional Development ��������������� 81�9 92�9 58�1 45�8 44�3 44�7 41�2 40�7 40�9 38�2 37�1 37�3Education, Training, Employment, and Social
Services ����������������������������������������������������������� 237�8 271�1 235�7 217�2 173�6 144�0 148�5 152�5 155�6 159�1 161�4 164�3Health ������������������������������������������������������������������� 747�6 836�2 803�7 770�4 781�6 801�6 824�6 858�9 908�3 955�7 1,001�4 1,049�9Medicare ��������������������������������������������������������������� 776�2 716�9 774�9 849�6 849�6 956�7 1,024�4 1,096�2 1,238�4 1,190�0 1,337�2 1,424�4Income Security ���������������������������������������������������� 1,263�6 1,926�5 884�3 617�6 590�7 602�3 617�6 611�0 642�2 634�3 662�5 679�8Social Security ������������������������������������������������������ 1,095�8 1,141�2 1,203�3 1,267�4 1,339�5 1,416�7 1,499�6 1,587�2 1,680�3 1,776�3 1,875�0 1,976�1
On-Budget ��������������������������������������������������������� (39�9) (34�9) (44�3) (47�4) (51�2) (55�5) (67�1) (75�2) (81�2) (87�6) (94�3) (101�5)Off-Budget ��������������������������������������������������������� (1,055�9) (1,106�3) (1,159�0) (1,220�0) (1,288�4) (1,361�2) (1,432�5) (1,512�0) (1,599�0) (1,688�7) (1,780�7) (1,874�6)
Veterans Benefits and Services ���������������������������� 218�7 236�3 287�9 276�5 274�0 298�9 313�1 328�5 361�0 343�7 376�6 394�1Administration of Justice ��������������������������������������� 72�0 83�4 73�9 73�3 72�8 74�2 75�6 77�5 79�2 80�9 82�7 90�6General Government �������������������������������������������� 180�1 325�6 108�0 31�4 30�2 30�5 30�9 31�4 32�5 32�9 33�8 34�6Net Interest ����������������������������������������������������������� 345�5 303�0 304�9 319�4 365�2 436�4 509�0 581�1 649�3 717�2 798�3 882�5
On-Budget ��������������������������������������������������������� (424�3) (376�3) (370�6) (378�7) (419�6) (487�2) (556�8) (626�9) (692�3) (755�5) (831�3) (909�1)Off-Budget ��������������������������������������������������������� (–78�8) (–73�3) (–65�7) (–59�3) (–54�5) (–50�8) (–47�8) (–45�8) (–43�0) (–38�3) (–32�9) (–26�6)
Allowances ����������������������������������������������������������� ��������� ��������� 0�3 ��������� ��������� ��������� ��������� ��������� ��������� ��������� ��������� ���������
Undistributed Offsetting Receipts:Employer share, employee retirement (on-
budget) �������������������������������������������������������� –80�9 –89�8 –96�9 –95�1 –97�2 –99�5 –101�9 –104�3 –106�7 –109�3 –111�8 –114�7Employer share, employee retirement (off-
budget) �������������������������������������������������������� –19�1 –19�9 –20�9 –21�4 –22�0 –22�8 –23�5 –24�2 –25�0 –25�4 –26�4 –27�1Rents and royalties on the Outer Continental
Shelf ������������������������������������������������������������ –3�6 –3�8 –5�0 –4�6 –5�2 –5�2 –5�4 –5�6 –5�8 –5�9 –6�1 –6�3Sale of major assets ����������������������������������������� ��������� ��������� ��������� ��������� ��������� ��������� ��������� ��������� ��������� ��������� ��������� ���������Other undistributed offsetting receipts �������������� –2�7 –90�1 –21�0 –0�1 –0�1 –* –* –* –* –* –* –*
Total, Undistributed Offsetting Receipts ������ –106�4 –203�6 –143�8 –121�2 –124�4 –127�5 –130�7 –134�0 –137�5 –140�7 –144�2 –148�1On-Budget ����������������������������������������������� (–87�2) (–183�7) (–122�9) (–99�8) (–102�4) (–104�7) (–107�3) (–109�9) (–112�5) (–115�2) (–117�9) (–121�0)Off-Budget ����������������������������������������������� (–19�1) (–19�9) (–20�9) (–21�4) (–22�0) (–22�8) (–23�5) (–24�2) (–25�0) (–25�4) (–26�4) (–27�1)
Total ...................................................................... 6,550.4 7,249.5 5,706.7 5,452.6 5,518.9 5,816.1 6,105.8 6,405.2 6,853.9 7,015.0 7,474.6 7,865.8On-Budget ��������������������������������������������������������� (5,598�0) (6,231�9) (4,626�9) (4,310�6) (4,306�7) (4,528�2) (4,744�2) (4,962�9) (5,322�6) (5,389�8) (5,752�9) (6,044�6)Off-Budget ��������������������������������������������������������� (952�4) (1,017�5) (1,079�8) (1,141�9) (1,212�2) (1,287�9) (1,361�5) (1,442�3) (1,531�3) (1,625�2) (1,721�7) (1,821�2)
*Less than $500 million�
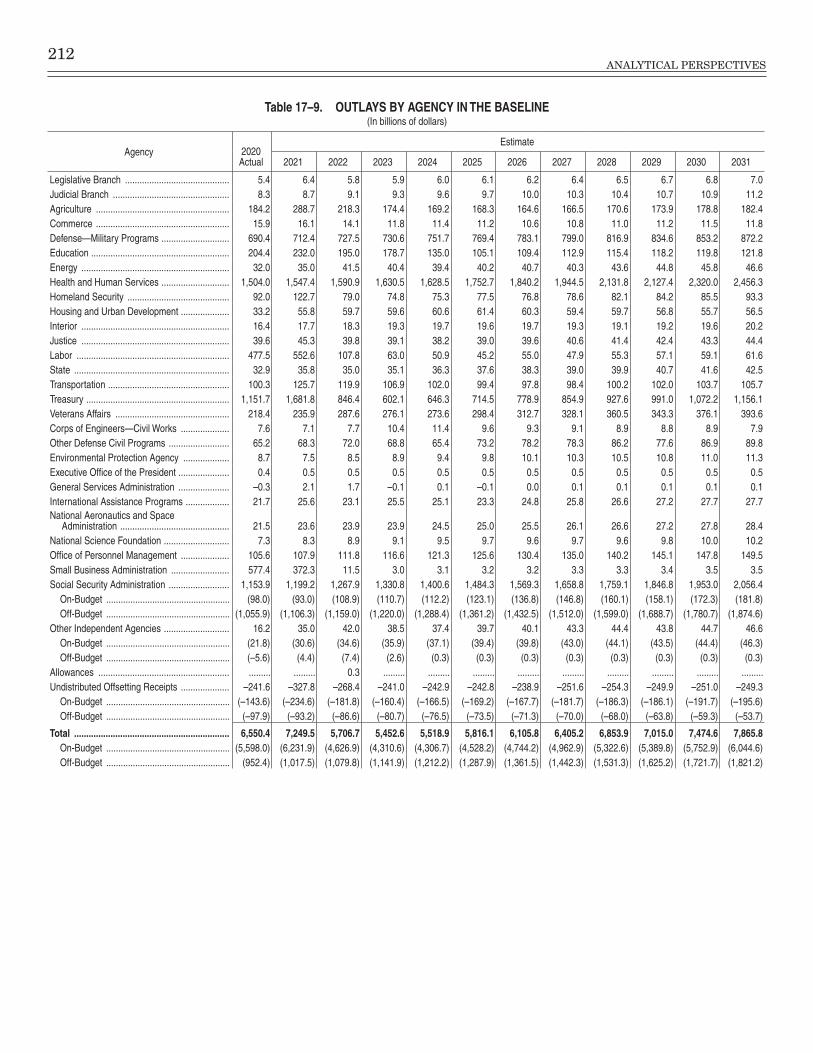
212ANALYTICAL PERSPECTIVES
Table 17–9. OUTLAYS BY AGENCY IN THE BASELINE(In billions of dollars)
Agency 2020 Actual
Estimate
2021 2022 2023 2024 2025 2026 2027 2028 2029 2030 2031
Legislative Branch ������������������������������������������� 5�4 6�4 5�8 5�9 6�0 6�1 6�2 6�4 6�5 6�7 6�8 7�0Judicial Branch ������������������������������������������������ 8�3 8�7 9�1 9�3 9�6 9�7 10�0 10�3 10�4 10�7 10�9 11�2Agriculture ������������������������������������������������������� 184�2 288�7 218�3 174�4 169�2 168�3 164�6 166�5 170�6 173�9 178�8 182�4Commerce ������������������������������������������������������� 15�9 16�1 14�1 11�8 11�4 11�2 10�6 10�8 11�0 11�2 11�5 11�8Defense—Military Programs ���������������������������� 690�4 712�4 727�5 730�6 751�7 769�4 783�1 799�0 816�9 834�6 853�2 872�2Education ��������������������������������������������������������� 204�4 232�0 195�0 178�7 135�0 105�1 109�4 112�9 115�4 118�2 119�8 121�8Energy ������������������������������������������������������������� 32�0 35�0 41�5 40�4 39�4 40�2 40�7 40�3 43�6 44�8 45�8 46�6Health and Human Services ���������������������������� 1,504�0 1,547�4 1,590�9 1,630�5 1,628�5 1,752�7 1,840�2 1,944�5 2,131�8 2,127�4 2,320�0 2,456�3Homeland Security ������������������������������������������ 92�0 122�7 79�0 74�8 75�3 77�5 76�8 78�6 82�1 84�2 85�5 93�3Housing and Urban Development �������������������� 33�2 55�8 59�7 59�6 60�6 61�4 60�3 59�4 59�7 56�8 55�7 56�5Interior ������������������������������������������������������������� 16�4 17�7 18�3 19�3 19�7 19�6 19�7 19�3 19�1 19�2 19�6 20�2Justice ������������������������������������������������������������� 39�6 45�3 39�8 39�1 38�2 39�0 39�6 40�6 41�4 42�4 43�3 44�4Labor ��������������������������������������������������������������� 477�5 552�6 107�8 63�0 50�9 45�2 55�0 47�9 55�3 57�1 59�1 61�6State ���������������������������������������������������������������� 32�9 35�8 35�0 35�1 36�3 37�6 38�3 39�0 39�9 40�7 41�6 42�5Transportation �������������������������������������������������� 100�3 125�7 119�9 106�9 102�0 99�4 97�8 98�4 100�2 102�0 103�7 105�7Treasury ����������������������������������������������������������� 1,151�7 1,681�8 846�4 602�1 646�3 714�5 778�9 854�9 927�6 991�0 1,072�2 1,156�1Veterans Affairs ����������������������������������������������� 218�4 235�9 287�6 276�1 273�6 298�4 312�7 328�1 360�5 343�3 376�1 393�6Corps of Engineers—Civil Works �������������������� 7�6 7�1 7�7 10�4 11�4 9�6 9�3 9�1 8�9 8�8 8�9 7�9Other Defense Civil Programs ������������������������� 65�2 68�3 72�0 68�8 65�4 73�2 78�2 78�3 86�2 77�6 86�9 89�8Environmental Protection Agency ������������������� 8�7 7�5 8�5 8�9 9�4 9�8 10�1 10�3 10�5 10�8 11�0 11�3Executive Office of the President ��������������������� 0�4 0�5 0�5 0�5 0�5 0�5 0�5 0�5 0�5 0�5 0�5 0�5General Services Administration ��������������������� –0�3 2�1 1�7 –0�1 0�1 –0�1 0�0 0�1 0�1 0�1 0�1 0�1International Assistance Programs ������������������ 21�7 25�6 23�1 25�5 25�1 23�3 24�8 25�8 26�6 27�2 27�7 27�7National Aeronautics and Space
Administration ��������������������������������������������� 21�5 23�6 23�9 23�9 24�5 25�0 25�5 26�1 26�6 27�2 27�8 28�4National Science Foundation ��������������������������� 7�3 8�3 8�9 9�1 9�5 9�7 9�6 9�7 9�6 9�8 10�0 10�2Office of Personnel Management �������������������� 105�6 107�9 111�8 116�6 121�3 125�6 130�4 135�0 140�2 145�1 147�8 149�5Small Business Administration ������������������������ 577�4 372�3 11�5 3�0 3�1 3�2 3�2 3�3 3�3 3�4 3�5 3�5Social Security Administration ������������������������� 1,153�9 1,199�2 1,267�9 1,330�8 1,400�6 1,484�3 1,569�3 1,658�8 1,759�1 1,846�8 1,953�0 2,056�4
On-Budget ��������������������������������������������������� (98�0) (93�0) (108�9) (110�7) (112�2) (123�1) (136�8) (146�8) (160�1) (158�1) (172�3) (181�8)Off-Budget ��������������������������������������������������� (1,055�9) (1,106�3) (1,159�0) (1,220�0) (1,288�4) (1,361�2) (1,432�5) (1,512�0) (1,599�0) (1,688�7) (1,780�7) (1,874�6)
Other Independent Agencies ��������������������������� 16�2 35�0 42�0 38�5 37�4 39�7 40�1 43�3 44�4 43�8 44�7 46�6On-Budget ��������������������������������������������������� (21�8) (30�6) (34�6) (35�9) (37�1) (39�4) (39�8) (43�0) (44�1) (43�5) (44�4) (46�3)Off-Budget ��������������������������������������������������� (–5�6) (4�4) (7�4) (2�6) (0�3) (0�3) (0�3) (0�3) (0�3) (0�3) (0�3) (0�3)
Allowances ������������������������������������������������������ ��������� ��������� 0�3 ��������� ��������� ��������� ��������� ��������� ��������� ��������� ��������� ���������Undistributed Offsetting Receipts �������������������� –241�6 –327�8 –268�4 –241�0 –242�9 –242�8 –238�9 –251�6 –254�3 –249�9 –251�0 –249�3
On-Budget ��������������������������������������������������� (–143�6) (–234�6) (–181�8) (–160�4) (–166�5) (–169�2) (–167�7) (–181�7) (–186�3) (–186�1) (–191�7) (–195�6)Off-Budget ��������������������������������������������������� (–97�9) (–93�2) (–86�6) (–80�7) (–76�5) (–73�5) (–71�3) (–70�0) (–68�0) (–63�8) (–59�3) (–53�7)
Total ................................................................ 6,550.4 7,249.5 5,706.7 5,452.6 5,518.9 5,816.1 6,105.8 6,405.2 6,853.9 7,015.0 7,474.6 7,865.8On-Budget ��������������������������������������������������� (5,598�0) (6,231�9) (4,626�9) (4,310�6) (4,306�7) (4,528�2) (4,744�2) (4,962�9) (5,322�6) (5,389�8) (5,752�9) (6,044�6)Off-Budget ��������������������������������������������������� (952�4) (1,017�5) (1,079�8) (1,141�9) (1,212�2) (1,287�9) (1,361�5) (1,442�3) (1,531�3) (1,625�2) (1,721�7) (1,821�2)

213
Table 17–10. BUDGET AUTHORITY BY FUNCTION IN THE BASELINE(In billions of dollars)
Function 2020 Actual
Estimate
2021 2022 2023 2024 2025 2026 2027 2028 2029 2030 2031
National Defense:Department of Defense—Military ���������������� 738�8 713�8 732�7 749�1 765�3 782�4 799�7 817�2 835�2 853�9 873�0 893�1Other ������������������������������������������������������������ 35�7 40�2 40�4 41�2 42�0 42�9 43�8 44�6 45�5 46�4 47�3 48�3
Total, National Defense ������������������������� 774�5 754�0 773�0 790�3 807�3 825�3 843�5 861�8 880�8 900�4 920�4 941�4International Affairs ������������������������������������������ 73�2 84�5 78�9 81�9 84�7 87�1 94�0 99�3 101�4 103�5 105�7 107�2General Science, Space, and Technology ������� 37�5 38�6 38�9 39�7 40�5 41�4 42�3 43�1 44�1 45�0 45�9 46�9Energy ������������������������������������������������������������� 6�6 5�3 8�0 5�4 5�7 5�0 5�2 4�6 7�9 8�6 9�1 9�3Natural Resources and Environment ��������������� 54�2 49�5 51�0 52�7 53�8 54�5 53�6 54�6 55�8 57�1 58�0 59�8Agriculture ������������������������������������������������������� 70�6 46�2 25�4 25�9 26�4 26�5 26�6 26�7 27�0 27�3 27�6 27�0Commerce and Housing Credit ����������������������� 1,247�4 –211�1 19�4 21�9 26�1 29�6 33�2 35�2 36�3 37�4 38�6 41�1
On-Budget ��������������������������������������������������� (1,247�1) (–221�4) (19�2) (21�6) (25�8) (29�3) (32�9) (34�9) (36�1) (37�1) (38�3) (40�8)Off-Budget ��������������������������������������������������� (0�3) (10�3) (0�3) (0�3) (0�3) (0�3) (0�3) (0�3) (0�3) (0�3) (0�3) (0�3)
Transportation �������������������������������������������������� 171�9 209�1 106�8 107�8 108�8 108�5 110�3 112�3 115�4 117�1 117�5 119�8Community and Regional Development ���������� 134�4 80�8 32�1 32�7 33�4 34�1 35�8 36�5 37�0 37�6 38�3 38�9Education, Training, Employment, and Social
Services ������������������������������������������������������ 268�6 477�8 129�1 134�4 140�7 145�7 151�0 155�1 158�2 161�8 164�1 167�2Health �������������������������������������������������������������� 923�7 903�7 740�3 728�3 758�1 793�4 829�2 868�9 918�6 965�7 1,010�8 1,060�8Medicare ���������������������������������������������������������� 819�8 703�4 839�1 830�5 850�9 957�9 1,025�6 1,097�4 1,239�6 1,191�2 1,338�4 1,425�8Income Security ����������������������������������������������� 1,329�1 1,974�5 827�0 607�3 602�8 616�3 622�8 622�2 647�5 652�6 674�5 692�5Social Security ������������������������������������������������� 1,099�2 1,145�0 1,207�3 1,273�3 1,345�8 1,423�4 1,506�8 1,594�8 1,688�2 1,784�4 1,883�4 1,984�7
On-Budget ��������������������������������������������������� (39�9) (34�9) (44�3) (47�4) (51�2) (55�5) (67�1) (75�2) (81�2) (87�6) (94�3) (101�5)Off-Budget ��������������������������������������������������� (1,059�3) (1,110�1) (1,163�0) (1,225�9) (1,294�6) (1,367�9) (1,439�6) (1,519�6) (1,606�9) (1,696�9) (1,789�0) (1,883�2)
Veterans Benefits and Services ����������������������� 233�6 256�0 263�4 269�9 288�8 303�0 317�4 332�9 348�9 365�0 381�4 399�2Administration of Justice ���������������������������������� 70�3 72�6 75�7 74�5 75�0 77�0 78�8 80�6 82�4 84�2 86�0 93�8General Government ��������������������������������������� 182�1 400�8 29�6 29�9 30�5 31�1 31�8 32�4 33�1 33�7 34�4 35�4Net Interest ������������������������������������������������������ 344�8 303�0 304�9 319�4 365�1 436�4 509�0 581�1 649�3 717�2 798�3 882�5
On-Budget ��������������������������������������������������� (423�6) (376�3) (370�5) (378�7) (419�6) (487�2) (556�8) (626�9) (692�3) (755�5) (831�3) (909�1)Off-Budget ��������������������������������������������������� (–78�8) (–73�3) (–65�7) (–59�3) (–54�5) (–50�8) (–47�8) (–45�8) (–43�0) (–38�3) (–32�9) (–26�6)
Allowances ������������������������������������������������������ ��������� ��������� 0�3 ��������� ��������� ��������� ��������� ��������� ��������� ��������� ��������� ���������
Undistributed Offsetting Receipts:Employer share, employee retirement (on-
budget) ��������������������������������������������������� –80�9 –89�8 –96�9 –95�1 –97�2 –99�5 –101�9 –104�3 –106�7 –109�3 –111�8 –114�7Employer share, employee retirement (off-
budget) ��������������������������������������������������� –19�1 –19�9 –20�9 –21�4 –22�0 –22�8 –23�5 –24�2 –25�0 –25�4 –26�4 –27�1Rents and royalties on the Outer
Continental Shelf ������������������������������������ –3�6 –3�8 –5�0 –4�6 –5�2 –5�2 –5�4 –5�6 –5�8 –5�9 –6�1 –6�3Sale of major assets ������������������������������������ ��������� ��������� ��������� ��������� ��������� ��������� ��������� ��������� ��������� ��������� ��������� ���������Other undistributed offsetting receipts ��������� –2�7 –90�1 –21�0 –0�1 –0�1 –* –* –* –* –* –* –*
Total, Undistributed Offsetting Receipts –106�4 –203�6 –143�8 –121�2 –124�4 –127�5 –130�7 –134�0 –137�5 –140�7 –144�2 –148�1On-Budget ����������������������������������������� (–87�2) (–183�7) (–122�9) (–99�8) (–102�4) (–104�7) (–107�3) (–109�9) (–112�5) (–115�2) (–117�9) (–121�0)Off-Budget ����������������������������������������� (–19�1) (–19�9) (–20�9) (–21�4) (–22�0) (–22�8) (–23�5) (–24�2) (–25�0) (–25�4) (–26�4) (–27�1)
Total ................................................................ 7,735.3 7,090.1 5,406.5 5,304.6 5,520.1 5,868.8 6,186.1 6,505.4 6,933.9 7,149.1 7,588.4 7,985.4On-Budget ��������������������������������������������������� (6,773�7) (6,062�8) (4,329�8) (4,159�1) (4,301�6) (4,574�1) (4,817�4) (5,055�5) (5,394�7) (5,515�7) (5,858�3) (6,155�6)Off-Budget ��������������������������������������������������� (961�6) (1,027�2) (1,076�7) (1,145�5) (1,218�5) (1,294�7) (1,368�7) (1,449�9) (1,539�2) (1,633�4) (1,730�0) (1,829�8)
MEMORANDUM
Discretionary Budget Authority:National Defense ����������������������������������������� 756�6 740�8 758�9 775�7 792�9 810�5 828�5 846�8 865�6 884�9 904�6 924�7International Affairs �������������������������������������� 59�2 62�6 63�8 65�1 66�4 67�8 69�2 70�7 72�1 73�6 75�1 76�7Domestic ����������������������������������������������������� 1,082�5 812�8 655�6 669�3 684�0 699�2 714�8 730�7 746�8 763�4 780�2 797�5
Total, Discretionary �������������������������������� 1,898�3 1,616�2 1,478�3 1,510�1 1,543�3 1,577�5 1,612�5 1,648�2 1,684�6 1,721�9 1,759�9 1,798�9*Less than $500 million�
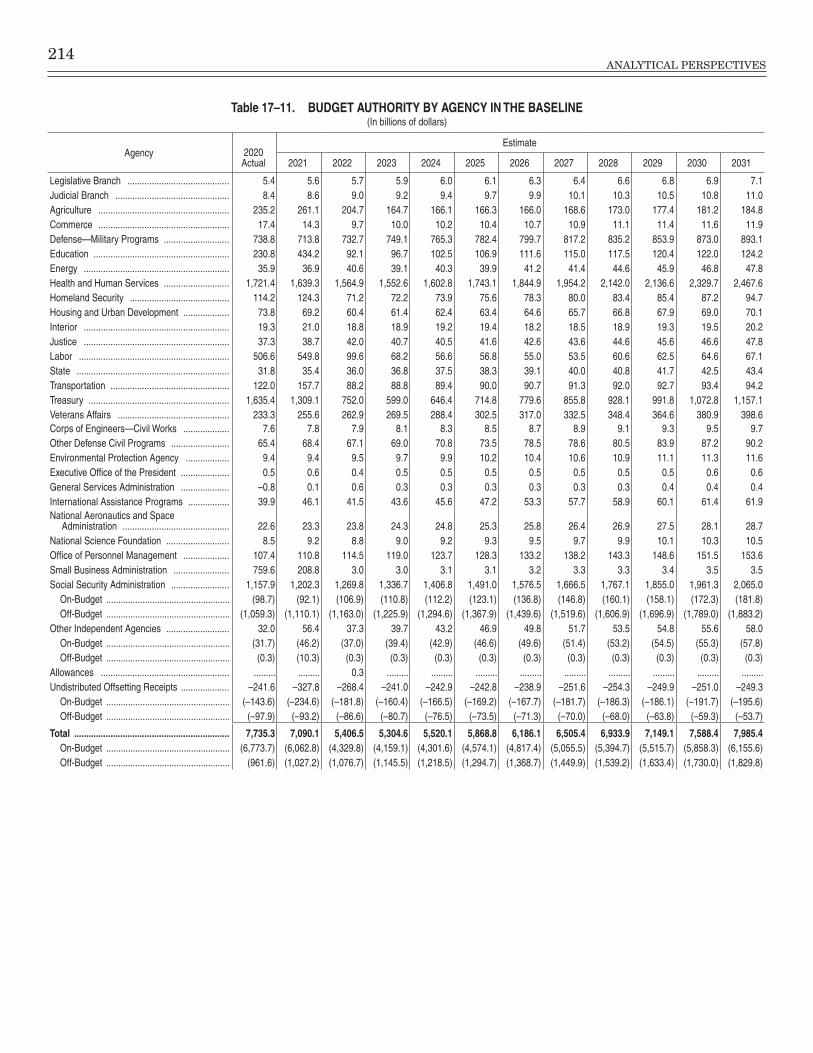
214ANALYTICAL PERSPECTIVES
Table 17–11. BUDGET AUTHORITY BY AGENCY IN THE BASELINE(In billions of dollars)
Agency 2020Actual
Estimate
2021 2022 2023 2024 2025 2026 2027 2028 2029 2030 2031
Legislative Branch ������������������������������������������ 5�4 5�6 5�7 5�9 6�0 6�1 6�3 6�4 6�6 6�8 6�9 7�1Judicial Branch ����������������������������������������������� 8�4 8�6 9�0 9�2 9�4 9�7 9�9 10�1 10�3 10�5 10�8 11�0Agriculture ������������������������������������������������������ 235�2 261�1 204�7 164�7 166�1 166�3 166�0 168�6 173�0 177�4 181�2 184�8Commerce ������������������������������������������������������ 17�4 14�3 9�7 10�0 10�2 10�4 10�7 10�9 11�1 11�4 11�6 11�9Defense—Military Programs ��������������������������� 738�8 713�8 732�7 749�1 765�3 782�4 799�7 817�2 835�2 853�9 873�0 893�1Education �������������������������������������������������������� 230�8 434�2 92�1 96�7 102�5 106�9 111�6 115�0 117�5 120�4 122�0 124�2Energy ������������������������������������������������������������ 35�9 36�9 40�6 39�1 40�3 39�9 41�2 41�4 44�6 45�9 46�8 47�8Health and Human Services ��������������������������� 1,721�4 1,639�3 1,564�9 1,552�6 1,602�8 1,743�1 1,844�9 1,954�2 2,142�0 2,136�6 2,329�7 2,467�6Homeland Security ����������������������������������������� 114�2 124�3 71�2 72�2 73�9 75�6 78�3 80�0 83�4 85�4 87�2 94�7Housing and Urban Development ������������������� 73�8 69�2 60�4 61�4 62�4 63�4 64�6 65�7 66�8 67�9 69�0 70�1Interior ������������������������������������������������������������ 19�3 21�0 18�8 18�9 19�2 19�4 18�2 18�5 18�9 19�3 19�5 20�2Justice ������������������������������������������������������������ 37�3 38�7 42�0 40�7 40�5 41�6 42�6 43�6 44�6 45�6 46�6 47�8Labor �������������������������������������������������������������� 506�6 549�8 99�6 68�2 56�6 56�8 55�0 53�5 60�6 62�5 64�6 67�1State ��������������������������������������������������������������� 31�8 35�4 36�0 36�8 37�5 38�3 39�1 40�0 40�8 41�7 42�5 43�4Transportation ������������������������������������������������� 122�0 157�7 88�2 88�8 89�4 90�0 90�7 91�3 92�0 92�7 93�4 94�2Treasury ���������������������������������������������������������� 1,635�4 1,309�1 752�0 599�0 646�4 714�8 779�6 855�8 928�1 991�8 1,072�8 1,157�1Veterans Affairs ���������������������������������������������� 233�3 255�6 262�9 269�5 288�4 302�5 317�0 332�5 348�4 364�6 380�9 398�6Corps of Engineers—Civil Works ������������������� 7�6 7�8 7�9 8�1 8�3 8�5 8�7 8�9 9�1 9�3 9�5 9�7Other Defense Civil Programs ������������������������ 65�4 68�4 67�1 69�0 70�8 73�5 78�5 78�6 80�5 83�9 87�2 90�2Environmental Protection Agency ������������������ 9�4 9�4 9�5 9�7 9�9 10�2 10�4 10�6 10�9 11�1 11�3 11�6Executive Office of the President �������������������� 0�5 0�6 0�4 0�5 0�5 0�5 0�5 0�5 0�5 0�5 0�6 0�6General Services Administration �������������������� –0�8 0�1 0�6 0�3 0�3 0�3 0�3 0�3 0�3 0�4 0�4 0�4International Assistance Programs ����������������� 39�9 46�1 41�5 43�6 45�6 47�2 53�3 57�7 58�9 60�1 61�4 61�9National Aeronautics and Space
Administration �������������������������������������������� 22�6 23�3 23�8 24�3 24�8 25�3 25�8 26�4 26�9 27�5 28�1 28�7National Science Foundation �������������������������� 8�5 9�2 8�8 9�0 9�2 9�3 9�5 9�7 9�9 10�1 10�3 10�5Office of Personnel Management ������������������� 107�4 110�8 114�5 119�0 123�7 128�3 133�2 138�2 143�3 148�6 151�5 153�6Small Business Administration ����������������������� 759�6 208�8 3�0 3�0 3�1 3�1 3�2 3�3 3�3 3�4 3�5 3�5Social Security Administration ������������������������ 1,157�9 1,202�3 1,269�8 1,336�7 1,406�8 1,491�0 1,576�5 1,666�5 1,767�1 1,855�0 1,961�3 2,065�0
On-Budget ��������������������������������������������������� (98�7) (92�1) (106�9) (110�8) (112�2) (123�1) (136�8) (146�8) (160�1) (158�1) (172�3) (181�8)Off-Budget ��������������������������������������������������� (1,059�3) (1,110�1) (1,163�0) (1,225�9) (1,294�6) (1,367�9) (1,439�6) (1,519�6) (1,606�9) (1,696�9) (1,789�0) (1,883�2)
Other Independent Agencies �������������������������� 32�0 56�4 37�3 39�7 43�2 46�9 49�8 51�7 53�5 54�8 55�6 58�0On-Budget ��������������������������������������������������� (31�7) (46�2) (37�0) (39�4) (42�9) (46�6) (49�6) (51�4) (53�2) (54�5) (55�3) (57�8)Off-Budget ��������������������������������������������������� (0�3) (10�3) (0�3) (0�3) (0�3) (0�3) (0�3) (0�3) (0�3) (0�3) (0�3) (0�3)
Allowances ����������������������������������������������������� ��������� ��������� 0�3 ��������� ��������� ��������� ��������� ��������� ��������� ��������� ��������� ���������Undistributed Offsetting Receipts �������������������� –241�6 –327�8 –268�4 –241�0 –242�9 –242�8 –238�9 –251�6 –254�3 –249�9 –251�0 –249�3
On-Budget ��������������������������������������������������� (–143�6) (–234�6) (–181�8) (–160�4) (–166�5) (–169�2) (–167�7) (–181�7) (–186�3) (–186�1) (–191�7) (–195�6)Off-Budget ��������������������������������������������������� (–97�9) (–93�2) (–86�6) (–80�7) (–76�5) (–73�5) (–71�3) (–70�0) (–68�0) (–63�8) (–59�3) (–53�7)
Total ................................................................ 7,735.3 7,090.1 5,406.5 5,304.6 5,520.1 5,868.8 6,186.1 6,505.4 6,933.9 7,149.1 7,588.4 7,985.4On-Budget ��������������������������������������������������� (6,773�7) (6,062�8) (4,329�8) (4,159�1) (4,301�6) (4,574�1) (4,817�4) (5,055�5) (5,394�7) (5,515�7) (5,858�3) (6,155�6)Off-Budget ��������������������������������������������������� (961�6) (1,027�2) (1,076�7) (1,145�5) (1,218�5) (1,294�7) (1,368�7) (1,449�9) (1,539�2) (1,633�4) (1,730�0) (1,829�8)
215
18. TRUST FUNDS AND FEDERAL FUNDS
As is common for State and local government budgets, the budget for the Federal Government contains infor-mation about collections and expenditures for different types of funds. This chapter presents summary informa-tion about the transactions of the two major fund groups used by the Federal Government, trust funds and Federal funds. It also presents information about the income and outgo of the major trust funds and certain Federal funds that are financed by dedicated collections in a manner similar to trust funds.
The Federal Funds Group
The Federal funds group includes all financial transac-tions of the Government that are not required by law to be recorded in trust funds. It accounts for a larger share of the budget than the trust funds group.
The Federal funds group includes the “general fund,” which is used for the general purposes of Government rather than being restricted by law to a specific program. The general fund is the largest fund in the Government and it receives all collections not dedicated for some other fund, including virtually all income taxes and many ex-cise taxes. The general fund is used for all programs that are not supported by trust, special, or revolving funds.
The Federal funds group also includes special funds and revolving funds, both of which receive collections that are dedicated by law for specific purposes. Where the law requires that Federal fund collections be dedicated to a particular program, the collections and associated disbursements are recorded in special fund receipt and expenditure accounts.1 An example is the portion of the Outer Continental Shelf mineral leasing receipts depos-ited into the Land and Water Conservation Fund. Money in special fund receipt accounts must be appropriated be-fore it can be obligated and spent. The majority of special fund collections are derived from the Government’s power to impose taxes or fines, or otherwise compel payment, as in the case of the Crime Victims Fund. In addition, a significant amount of collections credited to special funds is derived from certain types of business-like activity, such as the sale of Government land or other assets or the use of Government property. These collections include receipts from timber sales and royalties from oil and gas extraction.
Revolving funds are used to conduct continuing cycles of business-like activity. Revolving funds receive proceeds from the sale of products or services, and these proceeds fi-nance ongoing activities that continue to provide products
1 There are two types of budget accounts: expenditure (or appropria-tion) accounts and receipt accounts. Expenditure accounts are used to record outlays and receipt accounts are used to record governmental receipts and offsetting receipts. For further detail on expenditure and receipt accounts, see Chapter 6, “Budget Concepts,” in this volume.
or services. Instead of being deposited in receipt accounts, the proceeds are recorded in revolving fund expenditure accounts. The proceeds are generally available for obliga-tion and expenditure without further legislative action. Outlays for programs with revolving funds are reported both gross and net of these proceeds; gross outlays include the expenditures from the proceeds and net program out-lays are derived by subtracting the proceeds from gross outlays. Because the proceeds of these sales are recorded as offsets to outlays within expenditure accounts rather than receipt accounts, the proceeds are known as “offset-ting collections.”2 There are two classes of revolving funds in the Federal funds group. Public enterprise funds, such as the Postal Service Fund, conduct business-like opera-tions mainly with the public. Intragovernmental funds, such as the Federal Buildings Fund, conduct business-like operations mainly within and between Government agencies.
The Trust Funds Group
The trust funds group consists of funds that are des-ignated by law as trust funds. Like special funds and revolving funds, trust funds receive collections that are dedicated by law for specific purposes. Some of the larg-er trust funds are used to budget for social insurance programs, such as Social Security, Medicare, and unem-ployment compensation. Other large trust funds are used to budget for military and Federal civilian employees’ re-tirement benefits, highway and transit construction and maintenance, and airport and airway development and maintenance. There are a few trust revolving funds that are credited with collections earmarked by law to carry out a cycle of business-type operations. There are also a few small trust funds that have been established to carry out the terms of a conditional gift or bequest.
There is no substantive difference between special funds in the Federal funds group and trust funds, or be-tween revolving funds in the Federal funds group and trust revolving funds. Whether a particular fund is des-ignated in law as a trust fund is, in many cases, arbitrary. For example, the National Service Life Insurance Fund is a trust fund, but the Servicemen’s Group Life Insurance Fund is a Federal fund, even though both receive dedi-cated collections from veterans and both provide life insurance payments to veterans’ beneficiaries.
The Federal Government uses the term “trust fund” dif-ferently than the way in which it is commonly used. In common usage, the term is used to refer to a private fund that has a beneficiary who owns the trust’s income and may also own the trust’s assets. A custodian or trustee manages
2 See Chapter 9 in this volume for more information on offsetting collections and offsetting receipts.
216ANALYTICAL PERSPECTIVES
the assets on behalf of the beneficiary according to the terms of the trust agreement, as established by a trustor. Neither the trustee nor the beneficiary can change the terms of the trust agreement; only the trustor can change the terms of the agreement. In contrast, the Federal Government owns and manages the assets and the earnings of most Federal trust funds, and can unilaterally change the law to raise or lower future trust fund collections and payments or change the purpose for which the collections are used. Only a few small Federal trust funds are managed pursuant to a trust agreement whereby the Government acts as the trustee; even then, the Government generally owns the funds and has some ability to alter the amount deposited into or paid out of the funds.
Deposit funds, which are funds held by the Government as a custodian on behalf of individuals or a non-Feder-al entity, are similar to private-sector trust funds. The Government makes no decisions about the amount of money placed in deposit funds or about how the proceeds are spent. For this reason, these funds are not classified as Federal trust funds, but are instead considered to be non-budgetary and excluded from the Federal budget.3
The income of a Federal Government trust fund must be used for the purposes specified in law. The income of some trust funds, such as the Federal Employees Health Benefits fund, is spent almost as quickly as it is collected. In other cases, such as the military and Federal civilian employees’ retirement trust funds, the trust fund income is not spent as quickly as it is collected. Currently, these funds do not use all of their annual income (which includes intragovernmental interest income). This surplus of in-come over outgo adds to the trust fund’s balance, which is available for future expenditures. Trust fund balances are generally required by law to be invested in Federal se-curities issued by the Department of the Treasury.4 The National Railroad Retirement Investment Trust is a rare example of a Government trust fund authorized to invest balances in equity markets.
A trust fund normally consists of one or more receipt accounts (to record income) and an expenditure account (to record outgo). However, a few trust funds, such as the Veterans Special Life Insurance fund, are established by law as trust revolving funds. Such a fund is similar to a revolving fund in the Federal funds group in that it may consist of a single account to record both income and outgo. Trust revolving funds are used to conduct cycle of business-type operations; offsetting collections are credited to the funds (which are also expenditure accounts) and the funds’ outlays are displayed net of the offsetting collections.
Income and Outgo by Fund Group
Table 18–1 shows income, outgo, and the surplus or def-icit by fund group and in the aggregate (netted to avoid double-counting) from which the total unified budget re-
3 Deposit funds are also discussed in Chapter 7 of this volume, “Cov-erage of the Budget.”
4 Securities held by trust funds (and by other Government accounts), debt held by the public, and gross Federal debt are discussed in Chapter 4 of this volume, “Federal Borrowing and Debt.”
ceipts, outlays, and surplus or deficit are derived. Income consists mostly of governmental receipts (derived from governmental activity, primarily income, payroll, and ex-cise taxes). Income also includes offsetting receipts, which include proprietary receipts (derived from business-like transactions with the public), interfund collections (de-rived from payments from a fund in one fund group to a fund in the other fund group), and gifts. Outgo consists of payments made to the public or to a fund in the other fund group.
Two types of transactions are treated specially in the table. First, income and outgo for each fund group ex-clude all transactions that occur between funds within the same fund group.5 These intrafund transactions consti-tute outgo and income for the individual funds that make and collect the payments, but they are offsetting within the fund group as a whole. The totals for each fund group measure only the group’s transactions with the public and the other fund group. Second, outgo is calculated net of the collections from Federal sources that are credited to expenditure accounts (which, as noted above, are referred to as offsetting collections); the spending that is financed by those collections is included in outgo and the collec-tions from Federal sources are subsequently subtracted from outgo.6 Although it would be conceptually correct to add interfund offsetting collections from Federal sources to income for a particular fund, this cannot be done at the present time because the budget data do not provide this type of detail. As a result, both interfund and intra-fund offsetting collections from Federal sources are offset against outgo in Table 18–1 and are not shown separately.
The vast majority of the interfund transactions in the table are payments by the Federal funds to the trust funds. These payments include interest payments from the gen-eral fund to the trust funds for interest earned on trust fund balances invested in interest-bearing Treasury se-curities. The payments also include payments by Federal agencies to Federal employee benefits trust funds and Social Security trust funds on behalf of current employees and general fund transfers to employee retirement trust funds to amortize the unfunded liabilities of these funds. In addition, the payments include general fund transfers to the Supplementary Medical Insurance trust fund for the cost of Medicare Parts B (outpatient and physician benefits) and D (prescription drug benefits) that is not covered by premiums or other income from the public.
In addition to investing their balances with the Treasury, some funds in the Federal funds group and
5 For example, the railroad retirement trust funds pay the equiva-lent of Social Security benefits to railroad retirees in addition to the regular railroad pension. These benefits are financed by a payment from the Federal Old-Age and Survivors Insurance trust fund to the railroad retirement trust funds. The payment and collection are not included in Table 18–1 so that the total trust fund income and outgo shown in the table reflect transactions with the public and with Federal funds.
6 Collections from non-Federal sources are shown as income and spending that is financed by those collections is shown as outgo. For example, postage stamp fees are deposited as offsetting collections in the Postal Service Fund. As a result, the Fund’s income reported in Table 18–1 includes postage stamp fees and the Fund’s outgo is gross disbursements, including disbursements financed by those fees.

18. TRUST FUNDS AND FEDERAL FUNDS 217
most trust funds are authorized to borrow from the gen-eral fund of the Treasury.7 Similar to the treatment of funds invested with the Treasury, borrowed funds are not recorded as receipts of the fund or included in the income of the fund. Rather, the borrowed funds finance outlays by the fund in excess of available receipts. Subsequently, any excess fund receipts are transferred from the fund to the general fund in repayment of the borrowing. The repayment is not recorded as an outlay of the fund or in-cluded in fund outgo. This treatment is consistent with
7 For example, the Unemployment Trust Fund is authorized to bor-row from the general fund for unemployment benefits; the Bonneville Power Administration Fund, a revolving fund in the Department of En-ergy, is authorized to borrow from the general fund; and the Black Lung Disability Trust Fund, a trust fund in the Department of Labor, is autho-rized to receive appropriations of repayable advances from the general fund, which constitute a form of borrowing.
the broad principle that borrowing and debt redemption are not budgetary transactions but rather a means of fi-nancing deficits or disposing of surpluses.8
Some income in both Federal funds and trust funds consists of offsetting receipts.9 Offsetting receipts are not considered governmental receipts (such as taxes), but they are instead recorded on the outlay side of the bud-get.10 Expenditures resulting from offsetting receipts are recorded as gross outlays and the collections of offsetting receipts are then subtracted from gross outlays to derive
8 Borrowing and debt repayment are discussed in Chapter 4 of this volume, “Federal Borrowing and Debt,” and Chapter 6 of this volume, “Budget Concepts.”
9 Interest on borrowed funds is an example of an intragovernmental offsetting receipt and Medicare Part B’s premiums are an example of offsetting receipts from the public.
10 For further discussion of offsetting receipts, see Chapter 9 of this volume, “Offsetting Collections and Offsetting Receipts.”
Table 18–1. RECEIPTS, OUTLAYS AND SURPLUS OR DEFICIT BY FUND GROUP(In billions of dollars)
2020 Actual
Estimate
2021 2022 2023 2024 2025 2026
Receipts:
Federal funds cash income:From the public ������������������������������������������������������������������������������������������������������������ 2,428�0 2,698�5 2,989�8 3,395�5 3,524�2 3,692�7 3,915�1From trust funds ���������������������������������������������������������������������������������������������������������� 1�2 2�0 1�9 1�7 1�6 1�6 1�5
Total, Federal funds cash income ���������������������������������������������������������������������������� 2,429�1 2,700�5 2,991�7 3,397�3 3,525�9 3,694�3 3,916�6
Trust funds cash income:From the public ������������������������������������������������������������������������������������������������������������ 1,618�5 1,591�8 1,774�5 1,857�7 1,940�5 2,012�4 2,091�0From Federal funds:
Interest ��������������������������������������������������������������������������������������������������������������������� 135�2 124�2 124�6 119�8 118�6 115�3 108�3Other ������������������������������������������������������������������������������������������������������������������������ 758�7 1,022�4 774�7 817�0 864�2 915�3 980�3
Total, Trust funds cash income �������������������������������������������������������������������������� 2,512�4 2,738�4 2,673�7 2,794�6 2,923�3 3,043�0 3,179�6
Offsetting collections from the public and offsetting receipts:Federal funds ��������������������������������������������������������������������������������������������������������������� –378�4 –473�7 –347�0 –353�1 –361�7 –376�2 –370�3Trust funds ������������������������������������������������������������������������������������������������������������������� –1,142�0 –1,384�4 –1,144�2 –1,197�7 –1,259�7 –1,323�2 –1,393�8
Total, offsetting collections from the public and offsetting receipts �������������������������� –1,520�4 –1,858�1 –1,491�3 –1,550�8 –1,621�4 –1,699�4 –1,764�1Unified budget receipts:
Federal funds ������������������������������������������������������������������������������������������������� 2,050�7 2,226�8 2,644�7 3,044�1 3,164�2 3,318�0 3,546�3Trust funds ����������������������������������������������������������������������������������������������������� 1,370�4 1,354�0 1,529�5 1,596�9 1,663�6 1,719�9 1,785�8
Total, unified budget receipts ������������������������������������������������������������������� 3,421�2 3,580�8 4,174�2 4,641�0 4,827�8 5,037�9 5,332�1
Outlays:Federal funds cash outgo �������������������������������������������������������������������������������������������������� 5,505�5 6,483�8 4,975�0 4,901�5 5,053�7 5,235�7 5,362�4Trust funds cash outgo ������������������������������������������������������������������������������������������������������ 2,565�3 2,623�8 2,527�4 2,662�3 2,754�5 2,971�5 3,147�9
Offsetting collections from the public and offsetting receipts:Federal funds ��������������������������������������������������������������������������������������������������������������� –378�4 –473�7 –347�0 –353�1 –361�7 –376�2 –370�3Trust funds ������������������������������������������������������������������������������������������������������������������� –1,142�0 –1,384�4 –1,144�2 –1,197�7 –1,259�7 –1,323�2 –1,393�8
Total, offsetting collections from the public and offsetting receipts �������������������������� –1,520�4 –1,858�1 –1,491�3 –1,550�8 –1,621�4 –1,699�4 –1,764�1Unified budget outlays:
Federal funds ������������������������������������������������������������������������������������������������� 5,127�1 6,010�1 4,627�9 4,548�4 4,692�0 4,859�4 4,992�2Trust funds ����������������������������������������������������������������������������������������������������� 1,423�3 1,239�3 1,383�2 1,464�6 1,494�8 1,648�3 1,754�1
Total, unified budget outlays �������������������������������������������������������������������� 6,550�4 7,249�5 6,011�1 6,013�0 6,186�8 6,507�7 6,746�3
Surplus or deficit(–):Federal funds ��������������������������������������������������������������������������������������������������������������������� –3,076�4 –3,783�4 –1,983�2 –1,504�2 –1,527�9 –1,541�4 –1,445�8Trust funds ������������������������������������������������������������������������������������������������������������������������� –52�8 114�7 146�3 132�3 168�9 71�6 31�7
Total, unified surplus/deficit(–) ������������������������������������������������������������������������������������� –3,129�2 –3,668�7 –1,837�0 –1,371�9 –1,359�0 –1,469�8 –1,414�2Note: Receipts include governmental, interfund, and proprietary, and exclude intrafund receipts (which are offset against intrafund payments so that cash income and cash outgo are
not overstated)�

218ANALYTICAL PERSPECTIVES
Table 18–2. COMPARISON OF TOTAL FEDERAL FUND AND TRUST FUND RECEIPTS TO UNIFIED
BUDGET RECEIPTS, FISCAL YEAR 2020(In billions of dollars)
Gross Federal fund and Trust fund cash income:Federal funds ��������������������������������������������������������������������������������������������������� 2,787 1�Trust funds ������������������������������������������������������������������������������������������������������� 2,573 5�
Total, gross Federal fund and Trust fund cash income ������������������������������ 5,360 6�
Deduct: intrabudgetary offsetting collections (from funds within same fund group):Federal funds ��������������������������������������������������������������������������������������������� –327 8�Trust funds ������������������������������������������������������������������������������������������������� –53 8�
Subtotal, intrabudgetary offsetting collections ��������������������������������������� –381 6�
Deduct: intrafund receipts (from funds within same fund group):Federal funds ��������������������������������������������������������������������������������������������� –30 2�Trust funds ������������������������������������������������������������������������������������������������� –7 3�
Subtotal, intrafund receipts �������������������������������������������������������������������� –37 5�Federal fund and Trust fund cash income net of intrabudgetary
offsetting collections and intrafund receipts:Federal funds ����������������������������������������������������������������������������������������� 2,429 1�Trust funds ��������������������������������������������������������������������������������������������� 2,512 4�
Total, Federal fund and Trust fund cash income net of intrafund receipts ���������������������������������������������������������������������������������������� 4,941 6�
Deduct: offsetting collections from the public:Federal funds ������������������������������������������������������������������������������������ –246 2�Trust funds ���������������������������������������������������������������������������������������� –61 4�
Subtotal, offsetting collections from the public ���������������������������� –307 5�Deduct other offsetting receipts:
Federal fund receipts from Trust funds ��������������������������������������������� –1 2�Trust fund receipts from Federal funds:
Interest in receipt accounts ���������������������������������������������������������� –135 2�General fund payments to Medicare Parts B and D �������������������� –359 5�Employing agencies’ payments for pensions, Social Security,
and Medicare �������������������������������������������������������������������������� –91 9�General fund payments for unfunded liabilities of Federal
employees’ retirement funds ��������������������������������������������������� –138 7�Transfer of taxation of Social Security and RRB benefits to
OASDI, HI, and RRB �������������������������������������������������������������� –67 2�Other receipts from Federal funds ����������������������������������������������� –101 4�
Subtotal, Trust fund receipts from Federal funds �������������������� –893 9�Proprietary receipts:
Federal funds ������������������������������������������������������������������������������� –116 6�Trust funds ����������������������������������������������������������������������������������� –186 7�
Subtotal, proprietary receipts ������������������������������������������������� –303 4�Offsetting governmental receipts:
Federal funds ������������������������������������������������������������������������������� –14 4�Trust funds ����������������������������������������������������������������������������������� –*
Subtotal, offsetting governmental receipts ����������������������������� –14 5�Subtotal, other offsetting receipts �������������������������������������� –1,212 9�
Unified budget receipts:Federal funds �������������������������������������������������������������������������� 2,050 7�Trust funds ������������������������������������������������������������������������������ 1,370 4�
Total, unified budget receipts ��������������������������������������������� 3,421 2�
Memoradum:
Gross receipts:1
Federal funds ��������������������������������������������������������������������������������������������� 2,213 2�Trust funds ������������������������������������������������������������������������������������������������� 2,458 4�
Total, gross receipts ������������������������������������������������������������������������������� 4,671 5�* $50 million or less�1 Gross income excluding offsetting collections�
net outlays. Net outlays reflect the Government’s net transactions with the public.
As shown in Table 18–1, 40 percent of all governmen-tal receipts were deposited in trust funds in 2020 and the remaining 60 percent of governmental receipts were depos-ited in Federal funds, which, as noted above, include the general fund. As noted above, most outlays between the trust fund and Federal fund groups (interfund outlays) flow from Federal funds to trust funds, rather than from trust funds to Federal funds. As a result, while trust funds ac-counted for 22 percent of total 2020 outlays, they accounted for 25 percent of 2020 outlays net of interfund transactions.
Because the income for Federal funds and trust funds recorded in Table 18–1 includes offsetting receipts and offsetting collections from the public, offsetting receipts and offsetting collections from the public must be deduct-ed from the two fund groups’ combined gross income in order to reconcile to total governmental receipts in the unified budget. Similarly, because the outgo for Federal funds and trust funds in Table 18–1 consists of outlays gross of offsetting receipts and offsetting collections from the public, the amount of the offsetting receipts and off-setting collections from the public must be deducted from the sum of the Federal funds’ and the trust funds’ gross outgo in order to reconcile to total (net) unified budget outlays. Table 18–2 reconciles, for fiscal year 2020, the gross total of all trust fund and Federal fund receipts with the receipt total of the unified budget.
Income, Outgo, and Balances of Trust Funds
Table 18–3 shows, for the trust funds group as a whole, the funds’ balance at the start of each year, income and outgo during the year, and the end-of-year balance. Income and outgo are divided between transactions with the public and transactions with Federal funds. Receipts from Federal funds are divided between interest and oth-er interfund receipts.
The definitions of income and outgo in this table dif-fer from those in Table 18–1 in one important way. Trust fund collections that are offset against outgo (offsetting collections from Federal sources) within expenditure ac-counts instead of being deposited in separate receipt accounts are classified as income in this table, but not in Table 18–1. This classification is consistent with the defi-nitions of income and outgo for trust funds used elsewhere in the budget. It has the effect of increasing both income and outgo by the amount of the offsetting collections from Federal sources. The difference was approximately $54 billion in 2020. Table 18–3, therefore, provides a more complete summary of trust fund income and outgo.
In 2020, the trust funds group ran a deficit of $53 bil-lion. This was the first time in several decades that the trust fund group ran a deficit rather than a surplus. The net deficit was largely the result of the impacts of the Coronavirus pandemic and the Government’s response to the pandemic on the Unemployment Insurance and Medicare trust funds. The trust fund group is expected to run a $115 billion surplus in 2021 and to continue to run surpluses over the next several years. The resulting
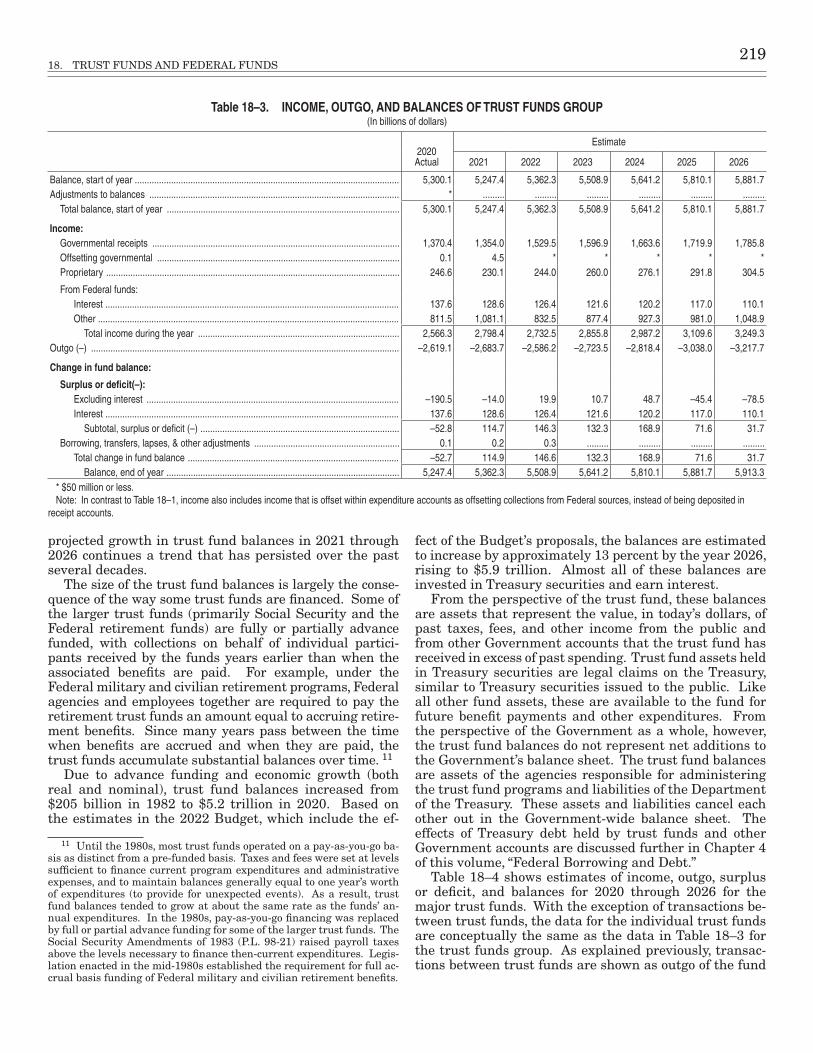
18. TRUST FUNDS AND FEDERAL FUNDS 219
projected growth in trust fund balances in 2021 through 2026 continues a trend that has persisted over the past several decades.
The size of the trust fund balances is largely the conse-quence of the way some trust funds are financed. Some of the larger trust funds (primarily Social Security and the Federal retirement funds) are fully or partially advance funded, with collections on behalf of individual partici-pants received by the funds years earlier than when the associated benefits are paid. For example, under the Federal military and civilian retirement programs, Federal agencies and employees together are required to pay the retirement trust funds an amount equal to accruing retire-ment benefits. Since many years pass between the time when benefits are accrued and when they are paid, the trust funds accumulate substantial balances over time. 11
Due to advance funding and economic growth (both real and nominal), trust fund balances increased from $205 billion in 1982 to $5.2 trillion in 2020. Based on the estimates in the 2022 Budget, which include the ef-
11 Until the 1980s, most trust funds operated on a pay-as-you-go ba-sis as distinct from a pre-funded basis. Taxes and fees were set at levels sufficient to finance current program expenditures and administrative expenses, and to maintain balances generally equal to one year’s worth of expenditures (to provide for unexpected events). As a result, trust fund balances tended to grow at about the same rate as the funds’ an-nual expenditures. In the 1980s, pay-as-you-go financing was replaced by full or partial advance funding for some of the larger trust funds. The Social Security Amendments of 1983 (P.L. 98-21) raised payroll taxes above the levels necessary to finance then-current expenditures. Legis-lation enacted in the mid-1980s established the requirement for full ac-crual basis funding of Federal military and civilian retirement benefits.
fect of the Budget’s proposals, the balances are estimated to increase by approximately 13 percent by the year 2026, rising to $5.9 trillion. Almost all of these balances are invested in Treasury securities and earn interest.
From the perspective of the trust fund, these balances are assets that represent the value, in today’s dollars, of past taxes, fees, and other income from the public and from other Government accounts that the trust fund has received in excess of past spending. Trust fund assets held in Treasury securities are legal claims on the Treasury, similar to Treasury securities issued to the public. Like all other fund assets, these are available to the fund for future benefit payments and other expenditures. From the perspective of the Government as a whole, however, the trust fund balances do not represent net additions to the Government’s balance sheet. The trust fund balances are assets of the agencies responsible for administering the trust fund programs and liabilities of the Department of the Treasury. These assets and liabilities cancel each other out in the Government-wide balance sheet. The effects of Treasury debt held by trust funds and other Government accounts are discussed further in Chapter 4 of this volume, “Federal Borrowing and Debt.”
Table 18–4 shows estimates of income, outgo, surplus or deficit, and balances for 2020 through 2026 for the major trust funds. With the exception of transactions be-tween trust funds, the data for the individual trust funds are conceptually the same as the data in Table 18–3 for the trust funds group. As explained previously, transac-tions between trust funds are shown as outgo of the fund
Table 18–3. INCOME, OUTGO, AND BALANCES OF TRUST FUNDS GROUP(In billions of dollars)
2020 Actual
Estimate
2021 2022 2023 2024 2025 2026
Balance, start of year ������������������������������������������������������������������������������������������������������������� 5,300�1 5,247�4 5,362�3 5,508�9 5,641�2 5,810�1 5,881�7Adjustments to balances ������������������������������������������������������������������������������������������������������� * ��������� ��������� ��������� ��������� ��������� ���������
Total balance, start of year ������������������������������������������������������������������������������������������������ 5,300�1 5,247�4 5,362�3 5,508�9 5,641�2 5,810�1 5,881�7
Income:Governmental receipts ������������������������������������������������������������������������������������������������������ 1,370�4 1,354�0 1,529�5 1,596�9 1,663�6 1,719�9 1,785�8Offsetting governmental ���������������������������������������������������������������������������������������������������� 0�1 4�5 * * * * *Proprietary ������������������������������������������������������������������������������������������������������������������������� 246�6 230�1 244�0 260�0 276�1 291�8 304�5
From Federal funds:Interest ������������������������������������������������������������������������������������������������������������������������� 137�6 128�6 126�4 121�6 120�2 117�0 110�1Other ���������������������������������������������������������������������������������������������������������������������������� 811�5 1,081�1 832�5 877�4 927�3 981�0 1,048�9
Total income during the year ����������������������������������������������������������������������������������� 2,566�3 2,798�4 2,732�5 2,855�8 2,987�2 3,109�6 3,249�3Outgo (–) ������������������������������������������������������������������������������������������������������������������������������� –2,619�1 –2,683�7 –2,586�2 –2,723�5 –2,818�4 –3,038�0 –3,217�7
Change in fund balance:
Surplus or deficit(–):Excluding interest �������������������������������������������������������������������������������������������������������� –190�5 –14�0 19�9 10�7 48�7 –45�4 –78�5Interest ������������������������������������������������������������������������������������������������������������������������� 137�6 128�6 126�4 121�6 120�2 117�0 110�1
Subtotal, surplus or deficit (–) ���������������������������������������������������������������������������������� –52�8 114�7 146�3 132�3 168�9 71�6 31�7Borrowing, transfers, lapses, & other adjustments ������������������������������������������������������������ 0�1 0�2 0�3 ��������� ��������� ��������� ���������
Total change in fund balance ��������������������������������������������������������������������������������������� –52�7 114�9 146�6 132�3 168�9 71�6 31�7Balance, end of year ������������������������������������������������������������������������������������������������ 5,247�4 5,362�3 5,508�9 5,641�2 5,810�1 5,881�7 5,913�3
* $50 million or less�Note: In contrast to Table 18–1, income also includes income that is offset within expenditure accounts as offsetting collections from Federal sources, instead of being deposited in
receipt accounts�

220ANALYTICAL PERSPECTIVES
that makes the payment and as income of the fund that collects it in the data for an individual trust fund, but the collections are offset against outgo in the data for the trust fund group as a whole.
As noted above, trust funds are funded by a combi-nation of payments from the public and payments from Federal funds, including payments directly from the general fund and payments from agency appropriations. Similarly, the fund outgo amounts in Table 18–4 repre-sent both outflows to the public—such as for the provision of benefit payments or the purchase of goods or services—and outflows to other Government accounts—such as for reimbursement for services provided by other agencies or payment of interest on borrowing from Treasury.
Because trust funds and Federal special and revolv-ing funds conduct transactions both with the public and with other Government accounts, the surplus or deficit of an individual fund may differ from the fund’s impact on the surplus or deficit of the Federal Government. Transactions with the public affect both the surplus or deficit of an individual fund and the Federal Government surplus or deficit. Transactions with other Government accounts affect the surplus or deficit of the particular fund. However, because that same transaction is offset in another Government account, there is no net impact on the total Federal Government surplus or deficit.
A brief description of the major trust funds is given below; additional information for these and other trust funds can be found in the Status of Funds tables in the Budget Appendix.
• Social Security Trust Funds: The Social Security trust funds consist of the Old Age and Survivors In-surance (OASI) trust fund and the Disability Insur-ance (DI) trust fund. The trust funds are funded by payroll taxes from employers and employees, inter-est earnings on trust fund balances, Federal agency payments as employers, and a portion of the income taxes paid on Social Security benefits.
• Medicare Trust Funds: Like the Social Security trust funds, the Medicare Hospital Insurance (HI) trust fund is funded by payroll taxes from employers and employees, Federal agency payments as employ-ers, and a portion of the income taxes paid on Social Security benefits. The HI trust fund also receives transfers from the general fund of the Treasury for certain HI benefits and premiums from certain vol-untary participants. The other Medicare trust fund, Supplementary Medical Insurance (SMI), finances Part B (outpatient and physician benefits) and Part
D (prescription drug benefits). SMI receives pre-mium payments from covered individuals, transfers from States toward Part D benefits, excise taxes on manufacturers and importers of brand-name pre-scription drugs, and transfers from the general fund of the Treasury for the portion of Part B and Part D costs not covered by premiums or transfers from States. In addition, like other trust funds, these two trust funds receive interest earnings on their trust fund balances.
• Highway Trust Fund: The fund finances Federal high-way and transit infrastructure projects, as well as highway and vehicle safety activities. The Highway Trust Fund is financed by Federal motor fuel taxes and associated fees, and, in recent years, by general fund transfers, as those taxes and fees have been in-adequate to support current levels of spending.
• Unemployment Trust Fund: The Unemployment Trust Fund is funded by Federal and State taxes on employers, payments from Federal agencies, taxes on certain employees, and interest earnings on trust fund balances. Unemployment insurance is administered largely by the States, following Fed-eral guidelines. The Unemployment Trust Fund is composed of individual accounts for each State and several Federal accounts, including accounts related to the separate unemployment insurance program for railroad employees.
• Civilian and military retirement trust funds: The Civil Service Retirement and Disability Fund is funded by employee and agency payments, general fund transfers for the unfunded portion of retirement costs, and interest earnings on trust fund balances. The Military Retirement Fund likewise is funded by payments from the Department of Defense, general fund transfers for unfunded retirement costs, and interest earnings on trust fund balances.
Table 18–5 shows income, outgo, and balances of two Federal funds that are designated as special funds. These funds are similar to trust funds in that they are financed by dedicated receipts, the excess of income over outgo is invested in Treasury securities, the interest earnings add to fund balances, and the balances remain available to cover future expenditures. The table is illustrative of the Federal funds group, which includes many revolving funds and special funds.

18. TRUST FUNDS AND FEDERAL FUNDS 221
Table 18–4. INCOME, OUTGO, AND BALANCES OF MAJOR TRUST FUNDS(In billions of dollars)
2020Actual
Estimate
2021 2022 2023 2024 2025 2026
Airport and Airway Trust Fund
Balance, start of year ������������������������������������������������������������������������������������������������������������� 17�9 9�0 15�3 14�5 14�8 16�1 18�3Adjustments to balances ������������������������������������������������������������������������������������������������������� –1�4 ��������� ��������� ��������� ��������� ��������� ���������
Total balance, start of year ������������������������������������������������������������������������������������������������ 16�5 9�0 15�3 14�5 14�8 16�1 18�3
Income:Governmental receipts ������������������������������������������������������������������������������������������������������ 9�0 9�3 15�3 17�8 18�7 19�6 20�3Offsetting governmental ���������������������������������������������������������������������������������������������������� ��������� ��������� ��������� ��������� ��������� ��������� ���������Proprietary ������������������������������������������������������������������������������������������������������������������������� 0�1 0�1 0�1 0�1 0�1 0�1 0�1
Intrabudgetary:Intrafund ���������������������������������������������������������������������������������������������������������������������� ��������� ��������� ��������� ��������� ��������� ��������� ���������Interest ������������������������������������������������������������������������������������������������������������������������� 0�4 0�2 0�2 0�2 0�2 0�3 0�3Other intrabudgetary ���������������������������������������������������������������������������������������������������� 0�1 14�0 * * * 0�1 0�1
Total income during the year ����������������������������������������������������������������������������������� 9�5 23�7 15�6 18�1 19�0 20�0 20�8Outgo (–) ������������������������������������������������������������������������������������������������������������������������������� –17�1 –17�3 –16�5 –17�8 –17�7 –17�8 –17�0
Change in fund balance:
Surplus or deficit(–):Excluding interest �������������������������������������������������������������������������������������������������������� –7�9 6�1 –1�1 0�2 1�1 1�9 3�4Interest ������������������������������������������������������������������������������������������������������������������������� 0�4 0�2 0�2 0�2 0�2 0�3 0�3
Subtotal, surplus or deficit (–) ���������������������������������������������������������������������������������� –7�5 6�3 –0�9 0�3 1�3 2�2 3�7Borrowing, transfers, lapses, & other adjustments ������������������������������������������������������������ * ��������� ��������� ��������� ��������� ��������� ���������
Total change in fund balance ��������������������������������������������������������������������������������������� –7�5 6�3 –0�9 0�3 1�3 2�2 3�7Balance, end of year ������������������������������������������������������������������������������������������������ 9�0 15�3 14�5 14�8 16�1 18�3 22�1
Civil Service Retirement and Disability Fund
Balance, start of year ������������������������������������������������������������������������������������������������������������� 939�7 962�1 982�7 1,002�1 1,014�6 1,025�0 1,033�5Adjustments to balances ������������������������������������������������������������������������������������������������������� ��������� ��������� ��������� ��������� ��������� ��������� ���������
Total balance, start of year ������������������������������������������������������������������������������������������������ 939�7 962�1 982�7 1,002�1 1,014�6 1,025�0 1,033�5
Income:Governmental receipts ������������������������������������������������������������������������������������������������������ 5�1 5�7 6�1 6�5 6�9 7�4 7�8Offsetting governmental ���������������������������������������������������������������������������������������������������� ��������� ��������� ��������� ��������� ��������� ��������� ���������Proprietary ������������������������������������������������������������������������������������������������������������������������� ��������� ��������� ��������� ��������� ��������� ��������� ���������
Intrabudgetary:Intrafund ���������������������������������������������������������������������������������������������������������������������� ��������� ��������� ��������� ��������� ��������� ��������� ���������Interest ������������������������������������������������������������������������������������������������������������������������� 25�1 21�8 19�7 18�7 18�2 18�1 18�2Other intrabudgetary ���������������������������������������������������������������������������������������������������� 83�3 86�6 90�4 87�4 88�7 90�0 91�5
Total income during the year ����������������������������������������������������������������������������������� 113�5 114�1 116�2 112�6 113�8 115�4 117�6Outgo (–) ������������������������������������������������������������������������������������������������������������������������������� –91�2 –93�5 –96�8 –100�1 –103�5 –106�9 –110�4
Change in fund balance:
Surplus or deficit(–):Excluding interest �������������������������������������������������������������������������������������������������������� –2�7 –1�3 –0�3 –6�2 –7�8 –9�5 –11�0Interest ������������������������������������������������������������������������������������������������������������������������� 25�1 21�8 19�7 18�7 18�2 18�1 18�2
Subtotal, surplus or deficit (–) ���������������������������������������������������������������������������������� 22�4 20�6 19�5 12�5 10�4 8�6 7�2Borrowing, transfers, lapses, & other adjustments ������������������������������������������������������������ ��������� ��������� ��������� ��������� ��������� ��������� ���������
Total change in fund balance ��������������������������������������������������������������������������������������� 22�4 20�6 19�5 12�5 10�4 8�6 7�2Balance, end of year ������������������������������������������������������������������������������������������������ 962�1 982�7 1,002�1 1,014�6 1,025�0 1,033�5 1,040�7
Employees and Retired Employees Health Benefits Funds
Balance, start of year ������������������������������������������������������������������������������������������������������������� 27�5 28�1 29�6 30�9 32�1 33�0 34�3Adjustments to balances ������������������������������������������������������������������������������������������������������� ��������� ��������� ��������� ��������� ��������� ��������� ���������
Total balance, start of year ������������������������������������������������������������������������������������������������ 27�5 28�1 29�6 30�9 32�1 33�0 34�3
Income:Governmental receipts ������������������������������������������������������������������������������������������������������ ��������� ��������� ��������� ��������� ��������� ��������� ���������
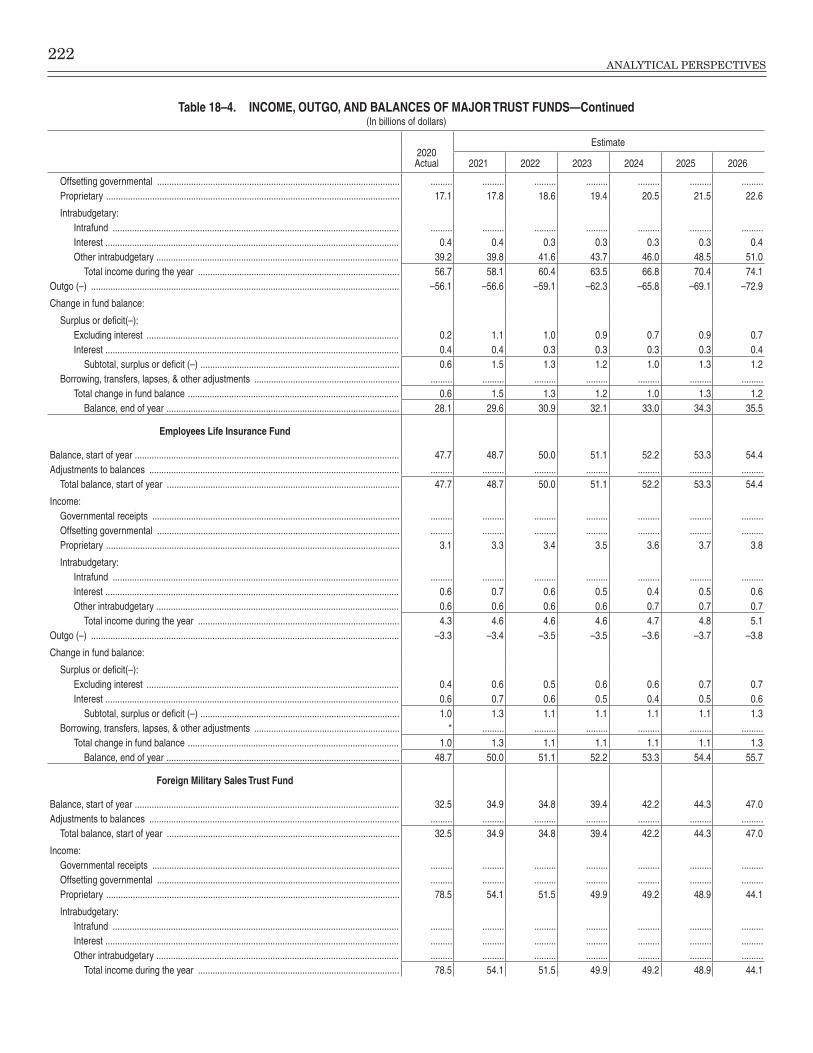
222ANALYTICAL PERSPECTIVES
Table 18–4. INCOME, OUTGO, AND BALANCES OF MAJOR TRUST FUNDS—Continued(In billions of dollars)
2020Actual
Estimate
2021 2022 2023 2024 2025 2026
Offsetting governmental ���������������������������������������������������������������������������������������������������� ��������� ��������� ��������� ��������� ��������� ��������� ���������Proprietary ������������������������������������������������������������������������������������������������������������������������� 17�1 17�8 18�6 19�4 20�5 21�5 22�6
Intrabudgetary:Intrafund ���������������������������������������������������������������������������������������������������������������������� ��������� ��������� ��������� ��������� ��������� ��������� ���������Interest ������������������������������������������������������������������������������������������������������������������������� 0�4 0�4 0�3 0�3 0�3 0�3 0�4Other intrabudgetary ���������������������������������������������������������������������������������������������������� 39�2 39�8 41�6 43�7 46�0 48�5 51�0
Total income during the year ����������������������������������������������������������������������������������� 56�7 58�1 60�4 63�5 66�8 70�4 74�1Outgo (–) ������������������������������������������������������������������������������������������������������������������������������� –56�1 –56�6 –59�1 –62�3 –65�8 –69�1 –72�9
Change in fund balance:
Surplus or deficit(–):Excluding interest �������������������������������������������������������������������������������������������������������� 0�2 1�1 1�0 0�9 0�7 0�9 0�7Interest ������������������������������������������������������������������������������������������������������������������������� 0�4 0�4 0�3 0�3 0�3 0�3 0�4
Subtotal, surplus or deficit (–) ���������������������������������������������������������������������������������� 0�6 1�5 1�3 1�2 1�0 1�3 1�2Borrowing, transfers, lapses, & other adjustments ������������������������������������������������������������ ��������� ��������� ��������� ��������� ��������� ��������� ���������
Total change in fund balance ��������������������������������������������������������������������������������������� 0�6 1�5 1�3 1�2 1�0 1�3 1�2Balance, end of year ������������������������������������������������������������������������������������������������ 28�1 29�6 30�9 32�1 33�0 34�3 35�5
Employees Life Insurance Fund
Balance, start of year ������������������������������������������������������������������������������������������������������������� 47�7 48�7 50�0 51�1 52�2 53�3 54�4Adjustments to balances ������������������������������������������������������������������������������������������������������� ��������� ��������� ��������� ��������� ��������� ��������� ���������
Total balance, start of year ������������������������������������������������������������������������������������������������ 47�7 48�7 50�0 51�1 52�2 53�3 54�4
Income:Governmental receipts ������������������������������������������������������������������������������������������������������ ��������� ��������� ��������� ��������� ��������� ��������� ���������Offsetting governmental ���������������������������������������������������������������������������������������������������� ��������� ��������� ��������� ��������� ��������� ��������� ���������Proprietary ������������������������������������������������������������������������������������������������������������������������� 3�1 3�3 3�4 3�5 3�6 3�7 3�8
Intrabudgetary:Intrafund ���������������������������������������������������������������������������������������������������������������������� ��������� ��������� ��������� ��������� ��������� ��������� ���������Interest ������������������������������������������������������������������������������������������������������������������������� 0�6 0�7 0�6 0�5 0�4 0�5 0�6Other intrabudgetary ���������������������������������������������������������������������������������������������������� 0�6 0�6 0�6 0�6 0�7 0�7 0�7
Total income during the year ����������������������������������������������������������������������������������� 4�3 4�6 4�6 4�6 4�7 4�8 5�1Outgo (–) ������������������������������������������������������������������������������������������������������������������������������� –3�3 –3�4 –3�5 –3�5 –3�6 –3�7 –3�8
Change in fund balance:
Surplus or deficit(–):Excluding interest �������������������������������������������������������������������������������������������������������� 0�4 0�6 0�5 0�6 0�6 0�7 0�7Interest ������������������������������������������������������������������������������������������������������������������������� 0�6 0�7 0�6 0�5 0�4 0�5 0�6
Subtotal, surplus or deficit (–) ���������������������������������������������������������������������������������� 1�0 1�3 1�1 1�1 1�1 1�1 1�3Borrowing, transfers, lapses, & other adjustments ������������������������������������������������������������ * ��������� ��������� ��������� ��������� ��������� ���������
Total change in fund balance ��������������������������������������������������������������������������������������� 1�0 1�3 1�1 1�1 1�1 1�1 1�3Balance, end of year ������������������������������������������������������������������������������������������������ 48�7 50�0 51�1 52�2 53�3 54�4 55�7
Foreign Military Sales Trust Fund
Balance, start of year ������������������������������������������������������������������������������������������������������������� 32�5 34�9 34�8 39�4 42�2 44�3 47�0Adjustments to balances ������������������������������������������������������������������������������������������������������� ��������� ��������� ��������� ��������� ��������� ��������� ���������
Total balance, start of year ������������������������������������������������������������������������������������������������ 32�5 34�9 34�8 39�4 42�2 44�3 47�0
Income:Governmental receipts ������������������������������������������������������������������������������������������������������ ��������� ��������� ��������� ��������� ��������� ��������� ���������Offsetting governmental ���������������������������������������������������������������������������������������������������� ��������� ��������� ��������� ��������� ��������� ��������� ���������Proprietary ������������������������������������������������������������������������������������������������������������������������� 78�5 54�1 51�5 49�9 49�2 48�9 44�1
Intrabudgetary:Intrafund ���������������������������������������������������������������������������������������������������������������������� ��������� ��������� ��������� ��������� ��������� ��������� ���������Interest ������������������������������������������������������������������������������������������������������������������������� ��������� ��������� ��������� ��������� ��������� ��������� ���������Other intrabudgetary ���������������������������������������������������������������������������������������������������� ��������� ��������� ��������� ��������� ��������� ��������� ���������
Total income during the year ����������������������������������������������������������������������������������� 78�5 54�1 51�5 49�9 49�2 48�9 44�1
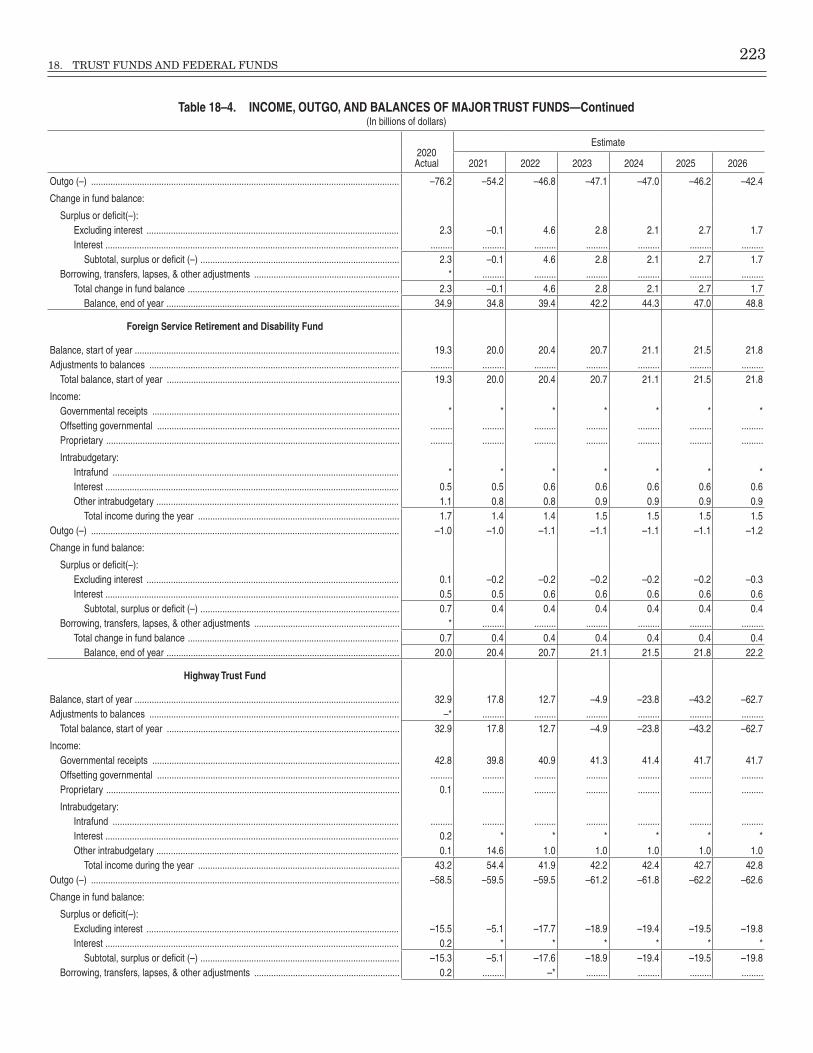
18. TRUST FUNDS AND FEDERAL FUNDS 223
Table 18–4. INCOME, OUTGO, AND BALANCES OF MAJOR TRUST FUNDS—Continued(In billions of dollars)
2020Actual
Estimate
2021 2022 2023 2024 2025 2026
Outgo (–) ������������������������������������������������������������������������������������������������������������������������������� –76�2 –54�2 –46�8 –47�1 –47�0 –46�2 –42�4
Change in fund balance:
Surplus or deficit(–):Excluding interest �������������������������������������������������������������������������������������������������������� 2�3 –0�1 4�6 2�8 2�1 2�7 1�7Interest ������������������������������������������������������������������������������������������������������������������������� ��������� ��������� ��������� ��������� ��������� ��������� ���������
Subtotal, surplus or deficit (–) ���������������������������������������������������������������������������������� 2�3 –0�1 4�6 2�8 2�1 2�7 1�7Borrowing, transfers, lapses, & other adjustments ������������������������������������������������������������ * ��������� ��������� ��������� ��������� ��������� ���������
Total change in fund balance ��������������������������������������������������������������������������������������� 2�3 –0�1 4�6 2�8 2�1 2�7 1�7Balance, end of year ������������������������������������������������������������������������������������������������ 34�9 34�8 39�4 42�2 44�3 47�0 48�8
Foreign Service Retirement and Disability Fund
Balance, start of year ������������������������������������������������������������������������������������������������������������� 19�3 20�0 20�4 20�7 21�1 21�5 21�8Adjustments to balances ������������������������������������������������������������������������������������������������������� ��������� ��������� ��������� ��������� ��������� ��������� ���������
Total balance, start of year ������������������������������������������������������������������������������������������������ 19�3 20�0 20�4 20�7 21�1 21�5 21�8
Income:Governmental receipts ������������������������������������������������������������������������������������������������������ * * * * * * *Offsetting governmental ���������������������������������������������������������������������������������������������������� ��������� ��������� ��������� ��������� ��������� ��������� ���������Proprietary ������������������������������������������������������������������������������������������������������������������������� ��������� ��������� ��������� ��������� ��������� ��������� ���������
Intrabudgetary:Intrafund ���������������������������������������������������������������������������������������������������������������������� * * * * * * *Interest ������������������������������������������������������������������������������������������������������������������������� 0�5 0�5 0�6 0�6 0�6 0�6 0�6Other intrabudgetary ���������������������������������������������������������������������������������������������������� 1�1 0�8 0�8 0�9 0�9 0�9 0�9
Total income during the year ����������������������������������������������������������������������������������� 1�7 1�4 1�4 1�5 1�5 1�5 1�5Outgo (–) ������������������������������������������������������������������������������������������������������������������������������� –1�0 –1�0 –1�1 –1�1 –1�1 –1�1 –1�2
Change in fund balance:
Surplus or deficit(–):Excluding interest �������������������������������������������������������������������������������������������������������� 0�1 –0�2 –0�2 –0�2 –0�2 –0�2 –0�3Interest ������������������������������������������������������������������������������������������������������������������������� 0�5 0�5 0�6 0�6 0�6 0�6 0�6
Subtotal, surplus or deficit (–) ���������������������������������������������������������������������������������� 0�7 0�4 0�4 0�4 0�4 0�4 0�4Borrowing, transfers, lapses, & other adjustments ������������������������������������������������������������ * ��������� ��������� ��������� ��������� ��������� ���������
Total change in fund balance ��������������������������������������������������������������������������������������� 0�7 0�4 0�4 0�4 0�4 0�4 0�4Balance, end of year ������������������������������������������������������������������������������������������������ 20�0 20�4 20�7 21�1 21�5 21�8 22�2
Highway Trust Fund
Balance, start of year ������������������������������������������������������������������������������������������������������������� 32�9 17�8 12�7 –4�9 –23�8 –43�2 –62�7Adjustments to balances ������������������������������������������������������������������������������������������������������� –* ��������� ��������� ��������� ��������� ��������� ���������
Total balance, start of year ������������������������������������������������������������������������������������������������ 32�9 17�8 12�7 –4�9 –23�8 –43�2 –62�7
Income:Governmental receipts ������������������������������������������������������������������������������������������������������ 42�8 39�8 40�9 41�3 41�4 41�7 41�7Offsetting governmental ���������������������������������������������������������������������������������������������������� ��������� ��������� ��������� ��������� ��������� ��������� ���������Proprietary ������������������������������������������������������������������������������������������������������������������������� 0�1 ��������� ��������� ��������� ��������� ��������� ���������
Intrabudgetary:Intrafund ���������������������������������������������������������������������������������������������������������������������� ��������� ��������� ��������� ��������� ��������� ��������� ���������Interest ������������������������������������������������������������������������������������������������������������������������� 0�2 * * * * * *Other intrabudgetary ���������������������������������������������������������������������������������������������������� 0�1 14�6 1�0 1�0 1�0 1�0 1�0
Total income during the year ����������������������������������������������������������������������������������� 43�2 54�4 41�9 42�2 42�4 42�7 42�8Outgo (–) ������������������������������������������������������������������������������������������������������������������������������� –58�5 –59�5 –59�5 –61�2 –61�8 –62�2 –62�6
Change in fund balance:
Surplus or deficit(–):Excluding interest �������������������������������������������������������������������������������������������������������� –15�5 –5�1 –17�7 –18�9 –19�4 –19�5 –19�8Interest ������������������������������������������������������������������������������������������������������������������������� 0�2 * * * * * *
Subtotal, surplus or deficit (–) ���������������������������������������������������������������������������������� –15�3 –5�1 –17�6 –18�9 –19�4 –19�5 –19�8Borrowing, transfers, lapses, & other adjustments ������������������������������������������������������������ 0�2 ��������� –* ��������� ��������� ��������� ���������

224ANALYTICAL PERSPECTIVES
Table 18–4. INCOME, OUTGO, AND BALANCES OF MAJOR TRUST FUNDS—Continued(In billions of dollars)
2020Actual
Estimate
2021 2022 2023 2024 2025 2026
Total change in fund balance ��������������������������������������������������������������������������������������� –15�1 –5�1 –17�6 –18�9 –19�4 –19�5 –19�8Balance, end of year ������������������������������������������������������������������������������������������������ 17�8 12�7 –4�9 –23�8 –43�2 –62�7 –82�5
Medicare: Hospital Insurance (HI) Trust Fund
Balance, start of year ������������������������������������������������������������������������������������������������������������� 198�9 134�4 113�5 160�7 183�3 221�2 240�1Adjustments to balances ������������������������������������������������������������������������������������������������������� ��������� ��������� ��������� ��������� ��������� ��������� ���������
Total balance, start of year ������������������������������������������������������������������������������������������������ 198�9 134�4 113�5 160�7 183�3 221�2 240�1
Income:Governmental receipts ������������������������������������������������������������������������������������������������������ 292�6 287�8 359�3 383�2 400�6 418�8 436�5Offsetting governmental ���������������������������������������������������������������������������������������������������� ��������� ��������� ��������� ��������� ��������� ��������� ���������Proprietary ������������������������������������������������������������������������������������������������������������������������� 13�5 12�2 12�6 12�9 13�2 13�6 14�0
Intrabudgetary:Intrafund ���������������������������������������������������������������������������������������������������������������������� ��������� ��������� ��������� ��������� ��������� ��������� ���������Interest ������������������������������������������������������������������������������������������������������������������������� 5�3 2�4 2�4 2�4 1�9 1�1 0�1Other intrabudgetary ���������������������������������������������������������������������������������������������������� 33�8 33�5 36�7 39�3 42�2 45�5 52�6
Total income during the year ����������������������������������������������������������������������������������� 345�3 335�9 411�0 437�8 458�0 479�1 503�3Outgo (–) ������������������������������������������������������������������������������������������������������������������������������� –409�8 –356�8 –363�8 –415�2 –420�1 –460�2 –487�8
Change in fund balance:
Surplus or deficit(–):Excluding interest �������������������������������������������������������������������������������������������������������� –69�9 –23�2 44�8 20�2 36�0 17�7 15�3Interest ������������������������������������������������������������������������������������������������������������������������� 5�3 2�4 2�4 2�4 1�9 1�1 0�1
Subtotal, surplus or deficit (–) ���������������������������������������������������������������������������������� –64�5 –20�9 47�2 22�6 37�9 18�8 15�5Borrowing, transfers, lapses, & other adjustments ������������������������������������������������������������ ��������� ��������� ��������� ��������� ��������� ��������� ���������
Total change in fund balance ��������������������������������������������������������������������������������������� –64�5 –20�9 47�2 22�6 37�9 18�8 15�5Balance, end of year ������������������������������������������������������������������������������������������������ 134�4 113�5 160�7 183�3 221�2 240�1 255�5
Medicare: Supplementary Insurance (SMI) Trust Fund
Balance, start of year ������������������������������������������������������������������������������������������������������������� 104�1 88�9 179�3 187�3 207�9 271�7 303�4Adjustments to balances ������������������������������������������������������������������������������������������������������� ��������� ��������� ��������� ��������� ��������� ��������� ���������
Total balance, start of year ������������������������������������������������������������������������������������������������ 104�1 88�9 179�3 187�3 207�9 271�7 303�4
Income:Governmental receipts ������������������������������������������������������������������������������������������������������ 3�2 2�7 2�8 1�6 4�0 2�8 2�8Offsetting governmental ���������������������������������������������������������������������������������������������������� ��������� ��������� ��������� ��������� ��������� ��������� ���������Proprietary ������������������������������������������������������������������������������������������������������������������������� 129�7 137�3 153�2 169�3 184�8 199�3 215�1
Intrabudgetary:Intrafund ���������������������������������������������������������������������������������������������������������������������� ��������� ��������� ��������� ��������� ��������� ��������� ���������Interest ������������������������������������������������������������������������������������������������������������������������� 2�2 2�4 5�0 5�4 6�0 5�2 5�3Other intrabudgetary ���������������������������������������������������������������������������������������������������� 359�5 461�1 423�2 459�8 495�5 532�6 572�2
Total income during the year ����������������������������������������������������������������������������������� 494�5 603�5 584�1 636�1 690�4 739�8 795�4Outgo (–) ������������������������������������������������������������������������������������������������������������������������������� –509�7 –513�1 –576�1 –615�6 –626�5 –708�1 –764�3
Change in fund balance:
Surplus or deficit(–):Excluding interest �������������������������������������������������������������������������������������������������������� –17�4 88�0 3�0 15�1 57�8 26�6 25�9Interest ������������������������������������������������������������������������������������������������������������������������� 2�2 2�4 5�0 5�4 6�0 5�2 5�3
Subtotal, surplus or deficit (–) ���������������������������������������������������������������������������������� –15�1 90�4 8�0 20�6 63�8 31�7 31�1Borrowing, transfers, lapses, & other adjustments ������������������������������������������������������������ * ��������� ��������� ��������� ��������� ��������� ���������
Total change in fund balance ��������������������������������������������������������������������������������������� –15�1 90�4 8�0 20�6 63�8 31�7 31�1Balance, end of year ������������������������������������������������������������������������������������������������ 88�9 179�3 187�3 207�9 271�7 303�4 334�5
Military Retirement Fund
Balance, start of year ������������������������������������������������������������������������������������������������������������� 818�5 898�1 989�6 1,091�1 1,200�8 1,320�5 1,439�3Adjustments to balances ������������������������������������������������������������������������������������������������������� ��������� ��������� ��������� ��������� ��������� ��������� ���������
Total balance, start of year ������������������������������������������������������������������������������������������������ 818�5 898�1 989�6 1,091�1 1,200�8 1,320�5 1,439�3

18. TRUST FUNDS AND FEDERAL FUNDS 225
Table 18–4. INCOME, OUTGO, AND BALANCES OF MAJOR TRUST FUNDS—Continued(In billions of dollars)
2020Actual
Estimate
2021 2022 2023 2024 2025 2026
Income:Governmental receipts ������������������������������������������������������������������������������������������������������ ��������� ��������� ��������� ��������� ��������� ��������� ���������Offsetting governmental ���������������������������������������������������������������������������������������������������� ��������� ��������� ��������� ��������� ��������� ��������� ���������Proprietary ������������������������������������������������������������������������������������������������������������������������� ��������� ��������� ��������� ��������� ��������� ��������� ���������
Intrabudgetary:Intrafund ���������������������������������������������������������������������������������������������������������������������� ��������� ��������� ��������� ��������� ��������� ��������� ���������Interest ������������������������������������������������������������������������������������������������������������������������� 19�7 21�8 29�4 31�6 35�3 37�3 33�6Other intrabudgetary ���������������������������������������������������������������������������������������������������� 122�2 133�3 142�5 145�1 147�9 152�0 156�3
Total income during the year ����������������������������������������������������������������������������������� 141�9 155�1 171�9 176�7 183�1 189�3 189�8Outgo (–) ������������������������������������������������������������������������������������������������������������������������������� –62�3 –63�6 –70�4 –66�9 –63�5 –70�4 –72�2
Change in fund balance:
Surplus or deficit(–):Excluding interest �������������������������������������������������������������������������������������������������������� 59�9 69�7 72�1 78�1 84�4 81�6 84�0Interest ������������������������������������������������������������������������������������������������������������������������� 19�7 21�8 29�4 31�6 35�3 37�3 33�6
Subtotal, surplus or deficit (–) ���������������������������������������������������������������������������������� 79�6 91�5 101�5 109�8 119�6 118�9 117�6Borrowing, transfers, lapses, & other adjustments ������������������������������������������������������������ ��������� ��������� ��������� ��������� ��������� ��������� ���������
Total change in fund balance ��������������������������������������������������������������������������������������� 79�6 91�5 101�5 109�8 119�6 118�9 117�6Balance, end of year ������������������������������������������������������������������������������������������������ 898�1 989�6 1,091�1 1,200�8 1,320�5 1,439�3 1,557�0
Railroad Retirement Trust Funds
Balance, start of year ������������������������������������������������������������������������������������������������������������� 23�3 21�3 20�7 19�1 17�1 15�1 13�1Adjustments to balances ������������������������������������������������������������������������������������������������������� –0�1 ��������� ��������� ��������� ��������� ��������� ���������
Total balance, start of year ������������������������������������������������������������������������������������������������ 23�2 21�3 20�7 19�1 17�1 15�1 13�1
Income:Governmental receipts ������������������������������������������������������������������������������������������������������ 4�4 4�6 5�2 5�3 5�4 5�5 5�5Offsetting governmental ���������������������������������������������������������������������������������������������������� ��������� ��������� ��������� ��������� ��������� ��������� ���������Proprietary ������������������������������������������������������������������������������������������������������������������������� * ��������� ��������� ��������� ��������� ��������� ���������
Intrabudgetary:Intrafund ���������������������������������������������������������������������������������������������������������������������� 5�0 5�2 5�7 5�5 5�6 5�6 5�7Interest ������������������������������������������������������������������������������������������������������������������������� 1�5 3�2 0�3 0�4 0�4 0�4 0�4Other intrabudgetary ���������������������������������������������������������������������������������������������������� 0�7 0�8 0�8 0�8 0�8 0�8 1�0
Total income during the year ����������������������������������������������������������������������������������� 11�6 13�8 11�9 12�0 12�2 12�4 12�7Outgo (–) ������������������������������������������������������������������������������������������������������������������������������� –13�5 –14�4 –13�7 –14�0 –14�2 –14�3 –14�5
Change in fund balance:
Surplus or deficit(–):Excluding interest �������������������������������������������������������������������������������������������������������� –3�3 –3�8 –2�1 –2�4 –2�4 –2�4 –2�3Interest ������������������������������������������������������������������������������������������������������������������������� 1�5 3�2 0�3 0�4 0�4 0�4 0�4
Subtotal, surplus or deficit (–) ���������������������������������������������������������������������������������� –1�8 –0�6 –1�7 –2�0 –1�9 –2�0 –1�8Borrowing, transfers, lapses, & other adjustments ������������������������������������������������������������ –* –0�1 0�1 ��������� ��������� ��������� ���������
Total change in fund balance ��������������������������������������������������������������������������������������� –1�9 –0�7 –1�6 –2�0 –1�9 –2�0 –1�8Balance, end of year ������������������������������������������������������������������������������������������������ 21�3 20�7 19�1 17�1 15�1 13�1 11�3
Social Security: Disability Insurance (DI) Trust Fund
Balance, start of year ������������������������������������������������������������������������������������������������������������� 96�4 97�1 92�9 96�4 101�0 107�8 114�6Adjustments to balances ������������������������������������������������������������������������������������������������������� ��������� ��������� ��������� ��������� ��������� ��������� ���������
Total balance, start of year ������������������������������������������������������������������������������������������������ 96�4 97�1 92�9 96�4 101�0 107�8 114�6
Income:Governmental receipts ������������������������������������������������������������������������������������������������������ 140�1 137�1 149�9 155�6 162�2 168�2 175�2Offsetting governmental ���������������������������������������������������������������������������������������������������� ��������� ��������� ��������� ��������� ��������� ��������� ���������Proprietary ������������������������������������������������������������������������������������������������������������������������� 0�1 0�1 0�1 0�1 0�1 0�1 0�1
Intrabudgetary:Intrafund ���������������������������������������������������������������������������������������������������������������������� ��������� ��������� ��������� ��������� ��������� ��������� ���������Interest ������������������������������������������������������������������������������������������������������������������������� 2�8 2�7 2�4 2�1 2�0 2�1 2�2
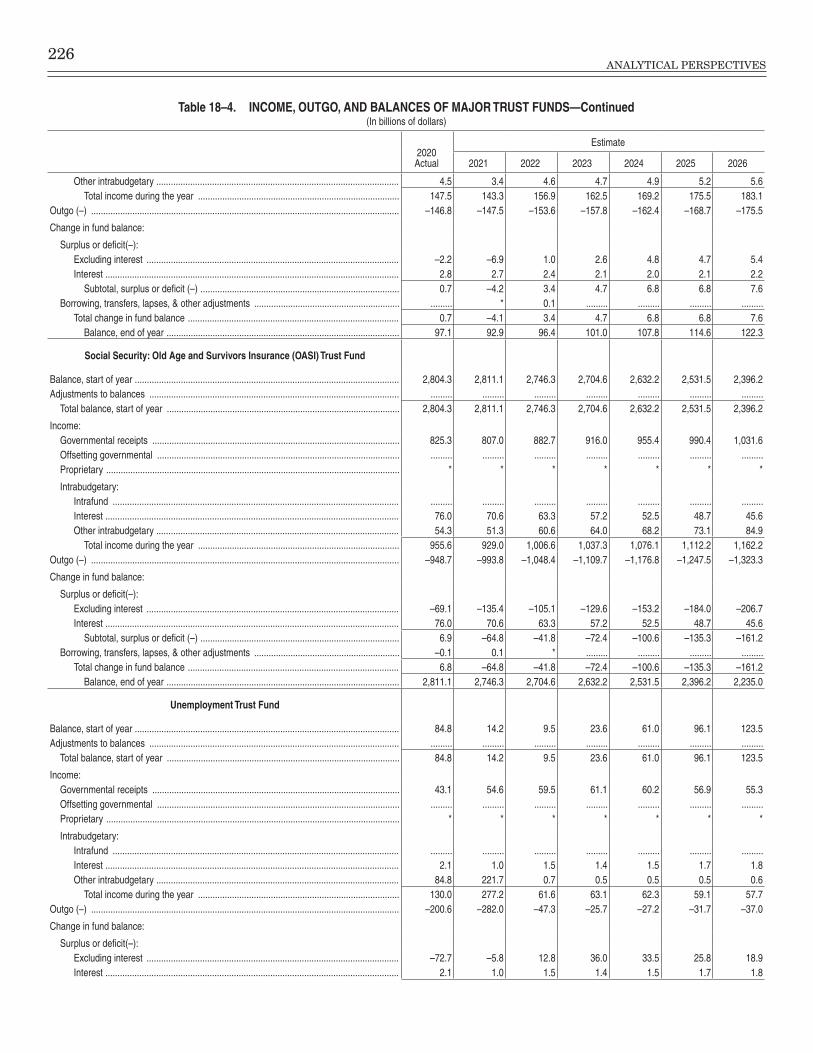
226ANALYTICAL PERSPECTIVES
Table 18–4. INCOME, OUTGO, AND BALANCES OF MAJOR TRUST FUNDS—Continued(In billions of dollars)
2020Actual
Estimate
2021 2022 2023 2024 2025 2026
Other intrabudgetary ���������������������������������������������������������������������������������������������������� 4�5 3�4 4�6 4�7 4�9 5�2 5�6Total income during the year ����������������������������������������������������������������������������������� 147�5 143�3 156�9 162�5 169�2 175�5 183�1
Outgo (–) ������������������������������������������������������������������������������������������������������������������������������� –146�8 –147�5 –153�6 –157�8 –162�4 –168�7 –175�5
Change in fund balance:
Surplus or deficit(–):Excluding interest �������������������������������������������������������������������������������������������������������� –2�2 –6�9 1�0 2�6 4�8 4�7 5�4Interest ������������������������������������������������������������������������������������������������������������������������� 2�8 2�7 2�4 2�1 2�0 2�1 2�2
Subtotal, surplus or deficit (–) ���������������������������������������������������������������������������������� 0�7 –4�2 3�4 4�7 6�8 6�8 7�6Borrowing, transfers, lapses, & other adjustments ������������������������������������������������������������ ��������� * 0�1 ��������� ��������� ��������� ���������
Total change in fund balance ��������������������������������������������������������������������������������������� 0�7 –4�1 3�4 4�7 6�8 6�8 7�6Balance, end of year ������������������������������������������������������������������������������������������������ 97�1 92�9 96�4 101�0 107�8 114�6 122�3
Social Security: Old Age and Survivors Insurance (OASI) Trust Fund
Balance, start of year ������������������������������������������������������������������������������������������������������������� 2,804�3 2,811�1 2,746�3 2,704�6 2,632�2 2,531�5 2,396�2Adjustments to balances ������������������������������������������������������������������������������������������������������� ��������� ��������� ��������� ��������� ��������� ��������� ���������
Total balance, start of year ������������������������������������������������������������������������������������������������ 2,804�3 2,811�1 2,746�3 2,704�6 2,632�2 2,531�5 2,396�2
Income:Governmental receipts ������������������������������������������������������������������������������������������������������ 825�3 807�0 882�7 916�0 955�4 990�4 1,031�6Offsetting governmental ���������������������������������������������������������������������������������������������������� ��������� ��������� ��������� ��������� ��������� ��������� ���������Proprietary ������������������������������������������������������������������������������������������������������������������������� * * * * * * *
Intrabudgetary:Intrafund ���������������������������������������������������������������������������������������������������������������������� ��������� ��������� ��������� ��������� ��������� ��������� ���������Interest ������������������������������������������������������������������������������������������������������������������������� 76�0 70�6 63�3 57�2 52�5 48�7 45�6Other intrabudgetary ���������������������������������������������������������������������������������������������������� 54�3 51�3 60�6 64�0 68�2 73�1 84�9
Total income during the year ����������������������������������������������������������������������������������� 955�6 929�0 1,006�6 1,037�3 1,076�1 1,112�2 1,162�2Outgo (–) ������������������������������������������������������������������������������������������������������������������������������� –948�7 –993�8 –1,048�4 –1,109�7 –1,176�8 –1,247�5 –1,323�3
Change in fund balance:
Surplus or deficit(–):Excluding interest �������������������������������������������������������������������������������������������������������� –69�1 –135�4 –105�1 –129�6 –153�2 –184�0 –206�7Interest ������������������������������������������������������������������������������������������������������������������������� 76�0 70�6 63�3 57�2 52�5 48�7 45�6
Subtotal, surplus or deficit (–) ���������������������������������������������������������������������������������� 6�9 –64�8 –41�8 –72�4 –100�6 –135�3 –161�2Borrowing, transfers, lapses, & other adjustments ������������������������������������������������������������ –0�1 0�1 * ��������� ��������� ��������� ���������
Total change in fund balance ��������������������������������������������������������������������������������������� 6�8 –64�8 –41�8 –72�4 –100�6 –135�3 –161�2Balance, end of year ������������������������������������������������������������������������������������������������ 2,811�1 2,746�3 2,704�6 2,632�2 2,531�5 2,396�2 2,235�0
Unemployment Trust Fund
Balance, start of year ������������������������������������������������������������������������������������������������������������� 84�8 14�2 9�5 23�6 61�0 96�1 123�5Adjustments to balances ������������������������������������������������������������������������������������������������������� ��������� ��������� ��������� ��������� ��������� ��������� ���������
Total balance, start of year ������������������������������������������������������������������������������������������������ 84�8 14�2 9�5 23�6 61�0 96�1 123�5
Income:Governmental receipts ������������������������������������������������������������������������������������������������������ 43�1 54�6 59�5 61�1 60�2 56�9 55�3Offsetting governmental ���������������������������������������������������������������������������������������������������� ��������� ��������� ��������� ��������� ��������� ��������� ���������Proprietary ������������������������������������������������������������������������������������������������������������������������� * * * * * * *
Intrabudgetary:Intrafund ���������������������������������������������������������������������������������������������������������������������� ��������� ��������� ��������� ��������� ��������� ��������� ���������Interest ������������������������������������������������������������������������������������������������������������������������� 2�1 1�0 1�5 1�4 1�5 1�7 1�8Other intrabudgetary ���������������������������������������������������������������������������������������������������� 84�8 221�7 0�7 0�5 0�5 0�5 0�6
Total income during the year ����������������������������������������������������������������������������������� 130�0 277�2 61�6 63�1 62�3 59�1 57�7Outgo (–) ������������������������������������������������������������������������������������������������������������������������������� –200�6 –282�0 –47�3 –25�7 –27�2 –31�7 –37�0
Change in fund balance:
Surplus or deficit(–):Excluding interest �������������������������������������������������������������������������������������������������������� –72�7 –5�8 12�8 36�0 33�5 25�8 18�9Interest ������������������������������������������������������������������������������������������������������������������������� 2�1 1�0 1�5 1�4 1�5 1�7 1�8
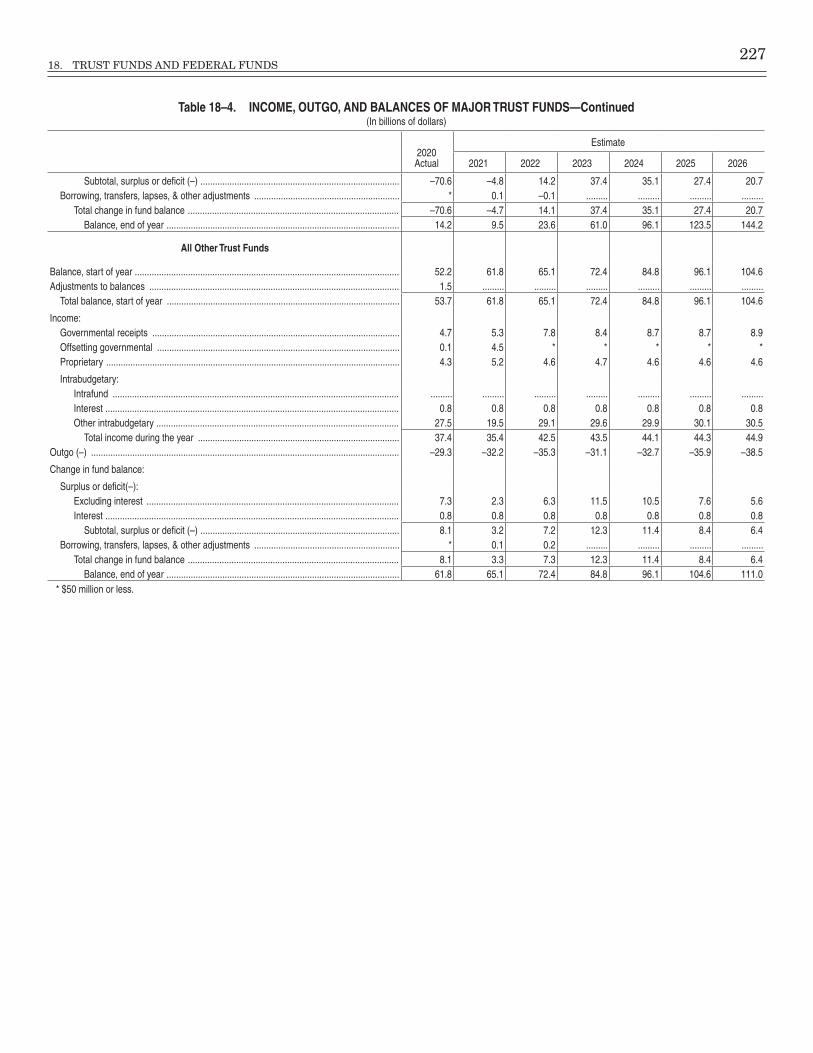
18. TRUST FUNDS AND FEDERAL FUNDS 227
Table 18–4. INCOME, OUTGO, AND BALANCES OF MAJOR TRUST FUNDS—Continued(In billions of dollars)
2020Actual
Estimate
2021 2022 2023 2024 2025 2026
Subtotal, surplus or deficit (–) ���������������������������������������������������������������������������������� –70�6 –4�8 14�2 37�4 35�1 27�4 20�7Borrowing, transfers, lapses, & other adjustments ������������������������������������������������������������ * 0�1 –0�1 ��������� ��������� ��������� ���������
Total change in fund balance ��������������������������������������������������������������������������������������� –70�6 –4�7 14�1 37�4 35�1 27�4 20�7Balance, end of year ������������������������������������������������������������������������������������������������ 14�2 9�5 23�6 61�0 96�1 123�5 144�2
All Other Trust Funds
Balance, start of year ������������������������������������������������������������������������������������������������������������� 52�2 61�8 65�1 72�4 84�8 96�1 104�6Adjustments to balances ������������������������������������������������������������������������������������������������������� 1�5 ��������� ��������� ��������� ��������� ��������� ���������
Total balance, start of year ������������������������������������������������������������������������������������������������ 53�7 61�8 65�1 72�4 84�8 96�1 104�6
Income:Governmental receipts ������������������������������������������������������������������������������������������������������ 4�7 5�3 7�8 8�4 8�7 8�7 8�9Offsetting governmental ���������������������������������������������������������������������������������������������������� 0�1 4�5 * * * * *Proprietary ������������������������������������������������������������������������������������������������������������������������� 4�3 5�2 4�6 4�7 4�6 4�6 4�6
Intrabudgetary:Intrafund ���������������������������������������������������������������������������������������������������������������������� ��������� ��������� ��������� ��������� ��������� ��������� ���������Interest ������������������������������������������������������������������������������������������������������������������������� 0�8 0�8 0�8 0�8 0�8 0�8 0�8Other intrabudgetary ���������������������������������������������������������������������������������������������������� 27�5 19�5 29�1 29�6 29�9 30�1 30�5
Total income during the year ����������������������������������������������������������������������������������� 37�4 35�4 42�5 43�5 44�1 44�3 44�9Outgo (–) ������������������������������������������������������������������������������������������������������������������������������� –29�3 –32�2 –35�3 –31�1 –32�7 –35�9 –38�5
Change in fund balance:
Surplus or deficit(–):Excluding interest �������������������������������������������������������������������������������������������������������� 7�3 2�3 6�3 11�5 10�5 7�6 5�6Interest ������������������������������������������������������������������������������������������������������������������������� 0�8 0�8 0�8 0�8 0�8 0�8 0�8
Subtotal, surplus or deficit (–) ���������������������������������������������������������������������������������� 8�1 3�2 7�2 12�3 11�4 8�4 6�4Borrowing, transfers, lapses, & other adjustments ������������������������������������������������������������ * 0�1 0�2 ��������� ��������� ��������� ���������
Total change in fund balance ��������������������������������������������������������������������������������������� 8�1 3�3 7�3 12�3 11�4 8�4 6�4Balance, end of year ������������������������������������������������������������������������������������������������ 61�8 65�1 72�4 84�8 96�1 104�6 111�0
* $50 million or less�

228ANALYTICAL PERSPECTIVES
Table 18–5. INCOME, OUTGO, AND BALANCES OF SELECTED SPECIAL FUNDS(In billions of dollars)
2020 Actual
Estimate
2021 2022 2023 2024 2025 2026
Abandoned Mine Reclamation Fund
Balance, start of year ������������������������������������������������������������������������������������������������������������� 2�7 2�6 2�4 2�2 1�9 1�6 1�4Adjustments to balances ������������������������������������������������������������������������������������������������������� ��������� ��������� ��������� ��������� ��������� ��������� ���������
Total balance, start of year ������������������������������������������������������������������������������������������������ 2�7 2�6 2�4 2�2 1�9 1�6 1�4
Income:Governmental receipts ������������������������������������������������������������������������������������������������������ 0�1 0�1 ��������� ��������� ��������� ��������� ���������Offsetting governmental ���������������������������������������������������������������������������������������������������� ��������� ��������� ��������� ��������� ��������� ��������� ���������Proprietary ������������������������������������������������������������������������������������������������������������������������� ��������� ��������� ��������� ��������� ��������� ��������� ���������
Intrabudgetary:Intrafund ���������������������������������������������������������������������������������������������������������������������� ��������� ��������� ��������� ��������� ��������� ��������� ���������Interest ������������������������������������������������������������������������������������������������������������������������� 0�1 * * * * * *Other intrabudgetary ���������������������������������������������������������������������������������������������������� ��������� ��������� ��������� ��������� ��������� ��������� ���������
Total income during the year ����������������������������������������������������������������������������������� 0�2 0�1 * * * * *Outgo (–) ������������������������������������������������������������������������������������������������������������������������������� –0�3 –0�3 –0�3 –0�3 –0�3 –0�3 –0�3
Change in fund balance:
Surplus or deficit(–):Excluding interest �������������������������������������������������������������������������������������������������������� –0�1 –0�2 –0�3 –0�3 –0�3 –0�3 –0�3Interest ������������������������������������������������������������������������������������������������������������������������� 0�1 * * * * * *
Subtotal, surplus or deficit (–) ���������������������������������������������������������������������������������� –0�1 –0�1 –0�3 –0�3 –0�3 –0�3 –0�3Borrowing, transfers, lapses, & other adjustments ������������������������������������������������������������ ��������� –* ��������� ��������� ��������� ��������� ���������
Total change in fund balance ��������������������������������������������������������������������������������������� –0�1 –0�2 –0�3 –0�3 –0�3 –0�3 –0�3Balance, end of year ������������������������������������������������������������������������������������������������ 2�6 2�4 2�2 1�9 1�6 1�4 1�1
Department of Defense Medicare-Eligible Retiree Health Care Fund
Balance, start of year ������������������������������������������������������������������������������������������������������������� 252�2 264�2 275�5 291�1 307�0 323�6 340�1Adjustments to balances ������������������������������������������������������������������������������������������������������� ��������� ��������� ��������� ��������� ��������� ��������� ���������
Total balance, start of year ������������������������������������������������������������������������������������������������ 252�2 264�2 275�5 291�1 307�0 323�6 340�1
Income:Governmental receipts ������������������������������������������������������������������������������������������������������ ��������� ��������� ��������� ��������� ��������� ��������� ���������Offsetting governmental ���������������������������������������������������������������������������������������������������� ��������� ��������� ��������� ��������� ��������� ��������� ���������Proprietary ������������������������������������������������������������������������������������������������������������������������� ��������� ��������� ��������� ��������� ��������� ��������� ���������
Intrabudgetary:Intrafund ���������������������������������������������������������������������������������������������������������������������� 14�7 15�6 16�8 17�5 18�2 19�0 19�8Interest ������������������������������������������������������������������������������������������������������������������������� 7�8 7�1 10�7 11�0 11�6 11�4 8�9Other intrabudgetary ���������������������������������������������������������������������������������������������������� ��������� ��������� ��������� ��������� ��������� ��������� ���������
Total income during the year ����������������������������������������������������������������������������������� 22�5 22�7 27�5 28�5 29�8 30�4 28�7Outgo (–) ������������������������������������������������������������������������������������������������������������������������������� –10�6 –11�4 –11�9 –12�6 –13�2 –13�9 –14�6
Change in fund balance:
Surplus or deficit(–):Excluding interest �������������������������������������������������������������������������������������������������������� 4�1 4�2 4�9 4�9 5�0 5�1 5�2Interest ������������������������������������������������������������������������������������������������������������������������� 7�8 7�1 10�7 11�0 11�6 11�4 8�9
Subtotal, surplus or deficit (–) ���������������������������������������������������������������������������������� 12�0 11�3 15�5 16�0 16�6 16�5 14�1Borrowing, transfers, lapses, & other adjustments ������������������������������������������������������������ ��������� ��������� ��������� ��������� ��������� ��������� ���������
Total change in fund balance ��������������������������������������������������������������������������������������� 12�0 11�3 15�5 16�0 16�6 16�5 14�1Balance, end of year ������������������������������������������������������������������������������������������������ 264�2 275�5 291�1 307�0 323�6 340�1 354�2
* $50 million or less�

229
19. COMPARISON OF ACTUAL TO ESTIMATED TOTALS
The Budget is required by statute to compare bud-get year estimates of receipts and outlays with the subsequent actual receipts and outlays for that year. This chapter meets that requirement by comparing the actual receipts, outlays, and deficit for 2020 with the current ser-vices estimates shown in the 2020 Budget, published in March 2019.1 It also presents a more detailed compari-son for mandatory and related programs, and reconciles the actual receipts, outlays, and deficit totals shown here with the figures for 2020 previously published by the Department of the Treasury.
Receipts
Actual receipts for 2020 were $3,421 billion, $221 bil-lion less than the $3,643 billion current services estimate in the 2020 Budget, which was published in March 2019. As shown in Table 19-1, this decrease was the net effect of legislative changes, economic conditions that differed from what had been expected, and technical factors that resulted in different tax liabilities and collection patterns than had been assumed.
Policy differences. Legislated tax changes enacted after March 2019 reduced 2020 receipts by a net $173 billion relative to the 2020 Budget current services estimate. The Taxpayer First Act (P.L. 116-25) changed management and oversight of the Internal Revenue Service to improve
1 The current services concept is discussed in Chapter 17, “Current Services Estimates.’’ For mandatory programs and receipts, the March 2019 current services estimate was based on laws then in place, adjust-ed for certain expiring provisions. For discretionary programs, the cur-rent services estimate was based on the discretionary spending limits enacted in the Budget Control Act of 2011 (BCA). Spending for Over-seas Contingency Operations, was estimated based on annualizing the amounts provided in the 2019 appropriations and increasing for infla-tion. The current services estimates also reflected the effects of discre-tionary and mandatory sequestration as required by the BCA following failure of the Joint Select Committee on Deficit Reduction to meet its deficit reduction target. For a detailed explanation of the 2019 estimate, see “Current Services Estimates,” Chapter 26 in Analytical Perspectives, Budget of the United States Government, Fiscal Year 2020.
customer service, expanded the use of electronic informa-tion systems in part by relaxing restrictions to mandate electronic filing based on the number of returns to be filed by a taxpayer, and increased the penalty for late returns, among other provisions; it was signed into law on July 1, 2019, and increased 2020 receipts by an estimated $5 mil-lion. The Further Consolidated Appropriations Act, 2020 (P.L. 116-94), repealed the medical device excise tax, the annual fee on health insurance providers, and the excise tax on high cost employer-sponsored health coverage; modified required distribution rules for designated bene-ficiaries of defined contribution retirement plans; reduced the medical expense deduction floor from 10 percent to 7.5 percent of a taxpayer’s adjusted gross income; and in-cluded tax incentives for economic growth and community development, energy production and efficiency, and green economy jobs. It also extended a number of provisions set to expire at the end of 2019, including the New Markets Tax Credit; Work Opportunity Credit; and excise tax rates on beer, wine, and distilled spirits; among others. Finally, it provided tax relief for taxpayers affected by federally-declared disasters that occurred in 2018 or 2019. This Act was signed into law on December 20, 2019, and reduced 2020 receipts by an estimated $26 billion. The United States-Mexico-Canada Agreement Implementation Act (P.L. 116-113) revised certain tariffs and addressed trade barriers; it was signed into law on January 29, 2020, and increased 2020 receipts by an estimate $1 million. The Families First Coronavirus Response Act (P.L. 116-127) provided fully refundable credits against payroll taxes to compensate employers (including self-employed indi-viduals) for paid sick leave and family and medical leave mandated in the Act; it was signed into law on March 18, 2020, and decreased 2020 receipts by an estimated $1 bil-lion. The Coronavirus Aid, Relief, and Economic Security (CARES) Act (P.L. 116-136), allowed employers and self-employed individuals to defer payment of the employer’s share of Social Security taxes incurred from March 27 through December 31, 2020; provided a refundable
Table 19–1. COMPARISON OF ACTUAL 2020 RECEIPTS WITH THE INITIAL CURRENT SERVICES ESTIMATES(In billions of dollars)
Estimate (March 2019)
Changes
Total Changes ActualPolicy Economic Technical
Individual income taxes ����������������������������������������������������������� 1,822 –139 –102 28 –213 1,609Corporation income taxes �������������������������������������������������������� 256 –19 –24 –1 –44 212Social insurance and retirement receipts �������������������������������� 1,296 ��������� –38 53 14 1,310Excise taxes ���������������������������������������������������������������������������� 108 –15 –1 –5 –22 87Estate and gift taxes ���������������������������������������������������������������� 19 ��������� –0 –1 –2 18Customs duties ������������������������������������������������������������������������ 48 0 –4 24 20 69Miscellaneous receipts ������������������������������������������������������������ 94 0 37 –12 24 118
Total receipts ����������������������������������������������������������������������� 3,643 –173 –133 84 –221 3,421* $500 million or less
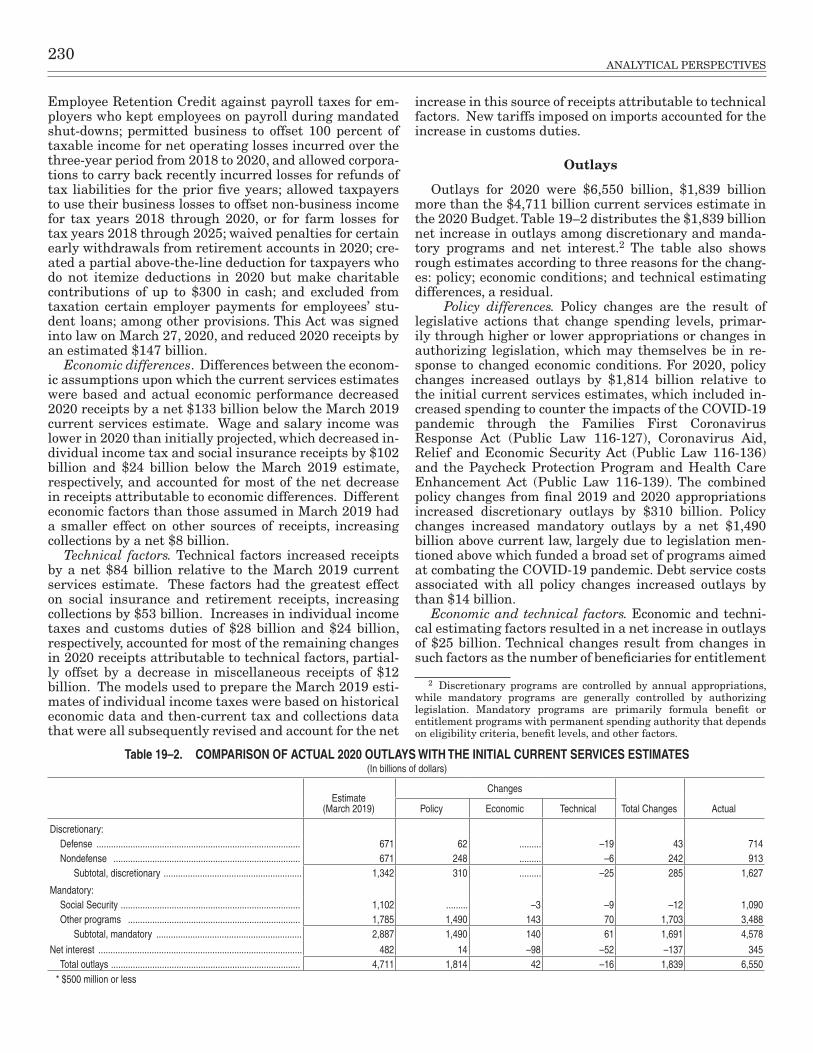
230ANALYTICAL PERSPECTIVES
Employee Retention Credit against payroll taxes for em-ployers who kept employees on payroll during mandated shut-downs; permitted business to offset 100 percent of taxable income for net operating losses incurred over the three-year period from 2018 to 2020, and allowed corpora-tions to carry back recently incurred losses for refunds of tax liabilities for the prior five years; allowed taxpayers to use their business losses to offset non-business income for tax years 2018 through 2020, or for farm losses for tax years 2018 through 2025; waived penalties for certain early withdrawals from retirement accounts in 2020; cre-ated a partial above-the-line deduction for taxpayers who do not itemize deductions in 2020 but make charitable contributions of up to $300 in cash; and excluded from taxation certain employer payments for employees’ stu-dent loans; among other provisions. This Act was signed into law on March 27, 2020, and reduced 2020 receipts by an estimated $147 billion.
Economic differences. Differences between the econom-ic assumptions upon which the current services estimates were based and actual economic performance decreased 2020 receipts by a net $133 billion below the March 2019 current services estimate. Wage and salary income was lower in 2020 than initially projected, which decreased in-dividual income tax and social insurance receipts by $102 billion and $24 billion below the March 2019 estimate, respectively, and accounted for most of the net decrease in receipts attributable to economic differences. Different economic factors than those assumed in March 2019 had a smaller effect on other sources of receipts, increasing collections by a net $8 billion.
Technical factors. Technical factors increased receipts by a net $84 billion relative to the March 2019 current services estimate. These factors had the greatest effect on social insurance and retirement receipts, increasing collections by $53 billion. Increases in individual income taxes and customs duties of $28 billion and $24 billion, respectively, accounted for most of the remaining changes in 2020 receipts attributable to technical factors, partial-ly offset by a decrease in miscellaneous receipts of $12 billion. The models used to prepare the March 2019 esti-mates of individual income taxes were based on historical economic data and then-current tax and collections data that were all subsequently revised and account for the net
increase in this source of receipts attributable to technical factors. New tariffs imposed on imports accounted for the increase in customs duties.
Outlays
Outlays for 2020 were $6,550 billion, $1,839 billion more than the $4,711 billion current services estimate in the 2020 Budget. Table 19–2 distributes the $1,839 billion net increase in outlays among discretionary and manda-tory programs and net interest.2 The table also shows rough estimates according to three reasons for the chang-es: policy; economic conditions; and technical estimating differences, a residual.
Policy differences. Policy changes are the result of legislative actions that change spending levels, primar-ily through higher or lower appropriations or changes in authorizing legislation, which may themselves be in re-sponse to changed economic conditions. For 2020, policy changes increased outlays by $1,814 billion relative to the initial current services estimates, which included in-creased spending to counter the impacts of the COVID-19 pandemic through the Families First Coronavirus Response Act (Public Law 116-127), Coronavirus Aid, Relief and Economic Security Act (Public Law 116-136) and the Paycheck Protection Program and Health Care Enhancement Act (Public Law 116-139). The combined policy changes from final 2019 and 2020 appropriations increased discretionary outlays by $310 billion. Policy changes increased mandatory outlays by a net $1,490 billion above current law, largely due to legislation men-tioned above which funded a broad set of programs aimed at combating the COVID-19 pandemic. Debt service costs associated with all policy changes increased outlays by than $14 billion.
Economic and technical factors. Economic and techni-cal estimating factors resulted in a net increase in outlays of $25 billion. Technical changes result from changes in such factors as the number of beneficiaries for entitlement
2 Discretionary programs are controlled by annual appropriations, while mandatory programs are generally controlled by authorizing legislation. Mandatory programs are primarily formula benefit or entitlement programs with permanent spending authority that depends on eligibility criteria, benefit levels, and other factors.
Table 19–2. COMPARISON OF ACTUAL 2020 OUTLAYS WITH THE INITIAL CURRENT SERVICES ESTIMATES(In billions of dollars)
Estimate (March 2019)
Changes
Total Changes ActualPolicy Economic Technical
Discretionary:Defense ������������������������������������������������������������������������������������ 671 62 ��������� –19 43 714Nondefense ����������������������������������������������������������������������������� 671 248 ��������� –6 242 913
Subtotal, discretionary ��������������������������������������������������������� 1,342 310 ��������� –25 285 1,627
Mandatory:Social Security �������������������������������������������������������������������������� 1,102 ��������� –3 –9 –12 1,090Other programs ����������������������������������������������������������������������� 1,785 1,490 143 70 1,703 3,488
Subtotal, mandatory ������������������������������������������������������������ 2,887 1,490 140 61 1,691 4,578
Net interest ������������������������������������������������������������������������������������ 482 14 –98 –52 –137 345Total outlays ������������������������������������������������������������������������������ 4,711 1,814 42 –16 1,839 6,550
* $500 million or less
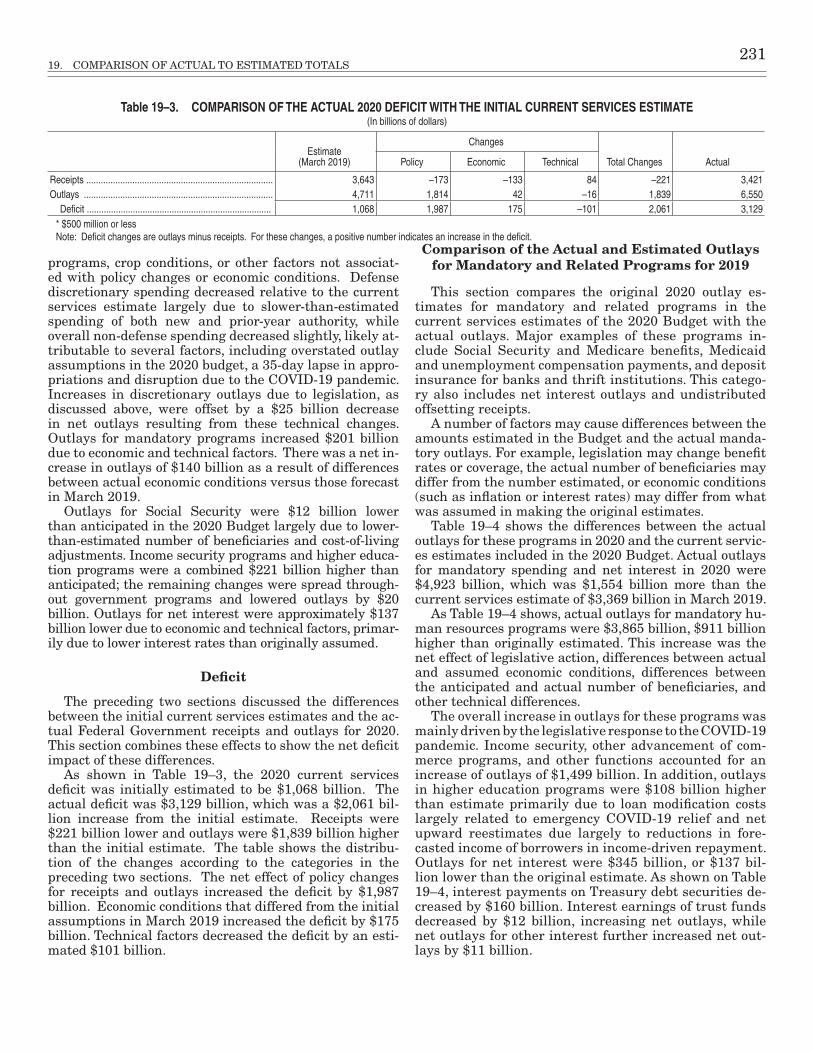
19. COMPARISON OF ACTUAL TO ESTIMATED TOTALS 231
programs, crop conditions, or other factors not associat-ed with policy changes or economic conditions. Defense discretionary spending decreased relative to the current services estimate largely due to slower-than-estimated spending of both new and prior-year authority, while overall non-defense spending decreased slightly, likely at-tributable to several factors, including overstated outlay assumptions in the 2020 budget, a 35-day lapse in appro-priations and disruption due to the COVID-19 pandemic. Increases in discretionary outlays due to legislation, as discussed above, were offset by a $25 billion decrease in net outlays resulting from these technical changes. Outlays for mandatory programs increased $201 billion due to economic and technical factors. There was a net in-crease in outlays of $140 billion as a result of differences between actual economic conditions versus those forecast in March 2019.
Outlays for Social Security were $12 billion lower than anticipated in the 2020 Budget largely due to lower-than-estimated number of beneficiaries and cost-of-living adjustments. Income security programs and higher educa-tion programs were a combined $221 billion higher than anticipated; the remaining changes were spread through-out government programs and lowered outlays by $20 billion. Outlays for net interest were approximately $137 billion lower due to economic and technical factors, primar-ily due to lower interest rates than originally assumed.
Deficit
The preceding two sections discussed the differences between the initial current services estimates and the ac-tual Federal Government receipts and outlays for 2020. This section combines these effects to show the net deficit impact of these differences.
As shown in Table 19–3, the 2020 current services deficit was initially estimated to be $1,068 billion. The actual deficit was $3,129 billion, which was a $2,061 bil-lion increase from the initial estimate. Receipts were $221 billion lower and outlays were $1,839 billion higher than the initial estimate. The table shows the distribu-tion of the changes according to the categories in the preceding two sections. The net effect of policy changes for receipts and outlays increased the deficit by $1,987 billion. Economic conditions that differed from the initial assumptions in March 2019 increased the deficit by $175 billion. Technical factors decreased the deficit by an esti-mated $101 billion.
Comparison of the Actual and Estimated Outlays for Mandatory and Related Programs for 2019
This section compares the original 2020 outlay es-timates for mandatory and related programs in the current services estimates of the 2020 Budget with the actual outlays. Major examples of these programs in-clude Social Security and Medicare benefits, Medicaid and unemployment compensation payments, and deposit insurance for banks and thrift institutions. This catego-ry also includes net interest outlays and undistributed offsetting receipts.
A number of factors may cause differences between the amounts estimated in the Budget and the actual manda-tory outlays. For example, legislation may change benefit rates or coverage, the actual number of beneficiaries may differ from the number estimated, or economic conditions (such as inflation or interest rates) may differ from what was assumed in making the original estimates.
Table 19–4 shows the differences between the actual outlays for these programs in 2020 and the current servic-es estimates included in the 2020 Budget. Actual outlays for mandatory spending and net interest in 2020 were $4,923 billion, which was $1,554 billion more than the current services estimate of $3,369 billion in March 2019.
As Table 19–4 shows, actual outlays for mandatory hu-man resources programs were $3,865 billion, $911 billion higher than originally estimated. This increase was the net effect of legislative action, differences between actual and assumed economic conditions, differences between the anticipated and actual number of beneficiaries, and other technical differences.
The overall increase in outlays for these programs was mainly driven by the legislative response to the COVID-19 pandemic. Income security, other advancement of com-merce programs, and other functions accounted for an increase of outlays of $1,499 billion. In addition, outlays in higher education programs were $108 billion higher than estimate primarily due to loan modification costs largely related to emergency COVID-19 relief and net upward reestimates due largely to reductions in fore-casted income of borrowers in income-driven repayment. Outlays for net interest were $345 billion, or $137 bil-lion lower than the original estimate. As shown on Table 19–4, interest payments on Treasury debt securities de-creased by $160 billion. Interest earnings of trust funds decreased by $12 billion, increasing net outlays, while net outlays for other interest further increased net out-lays by $11 billion.
Table 19–3. COMPARISON OF THE ACTUAL 2020 DEFICIT WITH THE INITIAL CURRENT SERVICES ESTIMATE(In billions of dollars)
Estimate (March 2019)
Changes
Total Changes ActualPolicy Economic Technical
Receipts ����������������������������������������������������������������������������� 3,643 –173 –133 84 –221 3,421Outlays ������������������������������������������������������������������������������ 4,711 1,814 42 –16 1,839 6,550
Deficit ���������������������������������������������������������������������������� 1,068 1,987 175 –101 2,061 3,129* $500 million or less Note: Deficit changes are outlays minus receipts� For these changes, a positive number indicates an increase in the deficit�
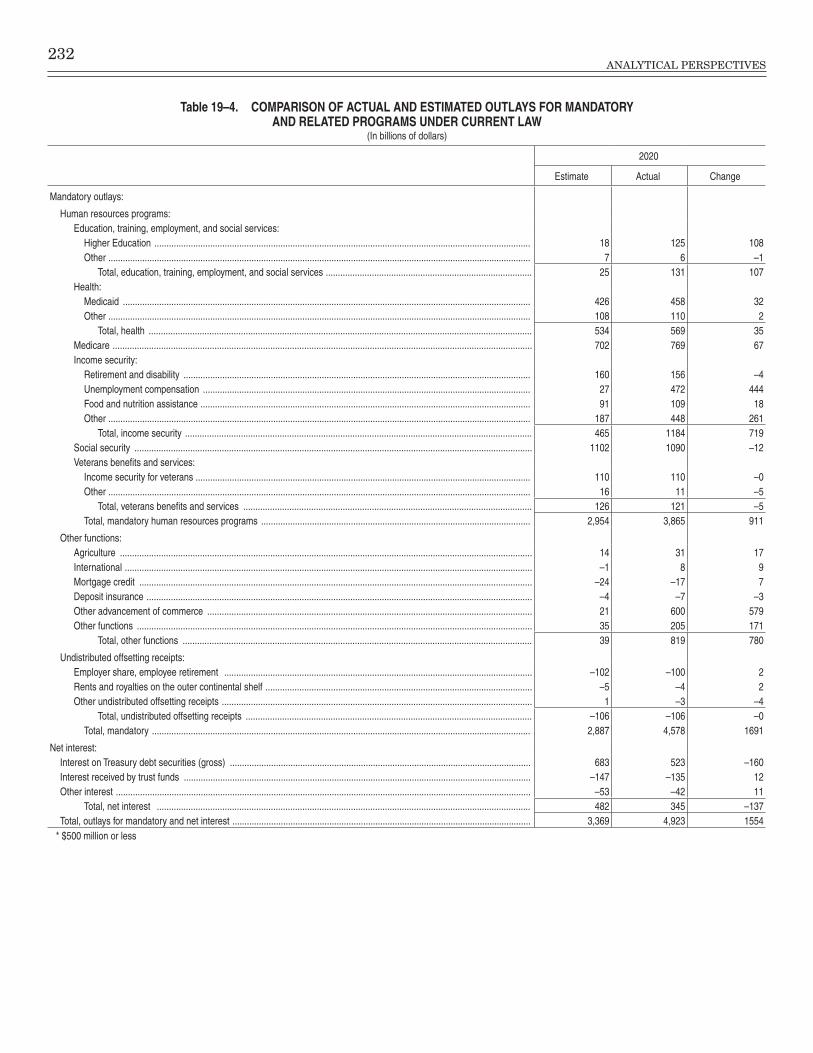
232ANALYTICAL PERSPECTIVES
Table 19–4. COMPARISON OF ACTUAL AND ESTIMATED OUTLAYS FOR MANDATORY AND RELATED PROGRAMS UNDER CURRENT LAW
(In billions of dollars)
2020
Estimate Actual Change
Mandatory outlays:
Human resources programs:Education, training, employment, and social services:
Higher Education ����������������������������������������������������������������������������������������������������������������������������������������������������������� 18 125 108Other ������������������������������������������������������������������������������������������������������������������������������������������������������������������������������ 7 6 –1
Total, education, training, employment, and social services ������������������������������������������������������������������������������������� 25 131 107Health:
Medicaid ������������������������������������������������������������������������������������������������������������������������������������������������������������������������ 426 458 32Other ������������������������������������������������������������������������������������������������������������������������������������������������������������������������������ 108 110 2
Total, health �������������������������������������������������������������������������������������������������������������������������������������������������������������� 534 569 35Medicare ����������������������������������������������������������������������������������������������������������������������������������������������������������������������������� 702 769 67Income security:
Retirement and disability ����������������������������������������������������������������������������������������������������������������������������������������������� 160 156 –4Unemployment compensation ��������������������������������������������������������������������������������������������������������������������������������������� 27 472 444Food and nutrition assistance ���������������������������������������������������������������������������������������������������������������������������������������� 91 109 18Other ������������������������������������������������������������������������������������������������������������������������������������������������������������������������������ 187 448 261
Total, income security ����������������������������������������������������������������������������������������������������������������������������������������������� 465 1184 719Social security �������������������������������������������������������������������������������������������������������������������������������������������������������������������� 1102 1090 –12Veterans benefits and services:
Income security for veterans ������������������������������������������������������������������������������������������������������������������������������������������ 110 110 –0Other ������������������������������������������������������������������������������������������������������������������������������������������������������������������������������ 16 11 –5
Total, veterans benefits and services ����������������������������������������������������������������������������������������������������������������������� 126 121 –5Total, mandatory human resources programs ��������������������������������������������������������������������������������������������������������������� 2,954 3,865 911
Other functions:Agriculture �������������������������������������������������������������������������������������������������������������������������������������������������������������������������� 14 31 17International ������������������������������������������������������������������������������������������������������������������������������������������������������������������������ –1 8 9Mortgage credit ������������������������������������������������������������������������������������������������������������������������������������������������������������������ –24 –17 7Deposit insurance ��������������������������������������������������������������������������������������������������������������������������������������������������������������� –4 –7 –3Other advancement of commerce �������������������������������������������������������������������������������������������������������������������������������������� 21 600 579Other functions ������������������������������������������������������������������������������������������������������������������������������������������������������������������� 35 205 171
Total, other functions ������������������������������������������������������������������������������������������������������������������������������������������������ 39 819 780
Undistributed offsetting receipts:Employer share, employee retirement ������������������������������������������������������������������������������������������������������������������������������� –102 –100 2Rents and royalties on the outer continental shelf �������������������������������������������������������������������������������������������������������������� –5 –4 2Other undistributed offsetting receipts �������������������������������������������������������������������������������������������������������������������������������� 1 –3 –4
Total, undistributed offsetting receipts ���������������������������������������������������������������������������������������������������������������������� –106 –106 –0Total, mandatory ������������������������������������������������������������������������������������������������������������������������������������������������������������ 2,887 4,578 1691
Net interest:Interest on Treasury debt securities (gross) ���������������������������������������������������������������������������������������������������������������������������� 683 523 –160Interest received by trust funds ����������������������������������������������������������������������������������������������������������������������������������������������� –147 –135 12Other interest ��������������������������������������������������������������������������������������������������������������������������������������������������������������������������� –53 –42 11
Total, net interest ���������������������������������������������������������������������������������������������������������������������������������������������������������� 482 345 –137Total, outlays for mandatory and net interest ��������������������������������������������������������������������������������������������������������������������������� 3,369 4,923 1554
* $500 million or less

19. COMPARISON OF ACTUAL TO ESTIMATED TOTALS 233
Reconciliation of Differences with Amounts Published by the Treasury for 2020
Table 19-5 provides a reconciliation of the receipts, outlays, and deficit totals for 2019 published by the Department of the Treasury in the September 2020 Monthly Treasury Statement (MTS) and those published in this Budget. The Department of the Treasury made no adjustments to the estimates for the Combined Statement of Receipts, Outlays, and Balances. Additional adjust-ments for the 2022 Budget increased receipts by $1,207 million and decreased outlays by $1,476 million. Some of these adjustments were for financial transactions that are not reported to the Department of the Treasury but are included in the Budget, including those for the Affordable Housing Program, the Electric Reliability Organization, the Federal Financial Institutions Examination Council Appraisal Subcommittee, Federal Retirement Thrift
Investment Board Program Expenses, the National Oilheat Research Alliance, the Public Company Accounting Oversight Board, the Puerto Rico Oversight Board, the Securities Investor Protection Corporation, fees and payments related to the Standard Setting Body, and the United Mine Workers of America benefit funds. There was also an adjustment for the National Railroad Retirement Investment Trust (NRRIT), which relates to a conceptual difference in reporting. NRRIT reports to the Department of the Treasury with a one-month lag so that the fiscal year total provided in the Treasury Combined Statement covers September 2019 through August 2020. The Budget has been adjusted to reflect NRRIT transac-tions that occurred during the actual fiscal year, which begins October 1. In addition, the Budget also reflects agency adjustments to 2020 outlays reported to Treasury after preparation of the Treasury Combined Statement.
Table 19–5. RECONCILIATION OF FINAL AMOUNTS FOR 2020(In millions of dollars)
Receipts Outlays Deficit
Totals published by Treasury (September MTS) 3,419,955 6,551,872 3,131,917Miscellaneous Treasury adjustments �������������������������������������������������������������������������������������������������������������������������������������������������������� ��������� ��������� ���������
Totals published by Treasury in Combined Statement 3,419,955 6,551,872 3,131,917Affordable Housing Program �������������������������������������������������������������������������������������������������������������������������������������������������������������������� 343 343 ���������Electric Reliability Organization ���������������������������������������������������������������������������������������������������������������������������������������������������������������� 100 100 ���������Federal Financial Institutions Examination Council Appraisal Subcommittee ������������������������������������������������������������������������������������������ 14 14 ���������Federal Retirement Thrift Investment Board Program Expenses ������������������������������������������������������������������������������������������������������������� ��������� –21 –21National Oilheat Research Alliance ���������������������������������������������������������������������������������������������������������������������������������������������������������� 7 7 ���������National Railroad Retirement Investment Trust ���������������������������������������������������������������������������������������������������������������������������������������� ��������� 822 822Postal Service ������������������������������������������������������������������������������������������������������������������������������������������������������������������������������������������� ��������� –3,205 –3,205Public Company Accounting Oversight Board ������������������������������������������������������������������������������������������������������������������������������������������ 270 266 –4Puerto Rico Oversight Board �������������������������������������������������������������������������������������������������������������������������������������������������������������������� 58 58 ���������Securities Investor Protection Corporation ����������������������������������������������������������������������������������������������������������������������������������������������� 373 82 –291Standard Setting Body ������������������������������������������������������������������������������������������������������������������������������������������������������������������������������ 31 31 ���������United Mine Workers of America benefit funds ���������������������������������������������������������������������������������������������������������������������������������������� 14 13 –1Other ��������������������������������������������������������������������������������������������������������������������������������������������������������������������������������������������������������� –3 14 17
Total adjustments, net �������������������������������������������������������������������������������������������������������������������������������������������������������������������������� 1,207 –1,476 –2,683
Totals in the Budget 3,421,162 6,550,396 3,129,234
MEMORANDUM:Total change since year-end statement ���������������������������������������������������������������������������������������������������������������������������������������������������� 1,207 –1,476 –2,683


E X EC U T I V E O F F I C E O F T H E P R E S I D E N TOFFICE OF MANAGEMENT AND BUDGET
WASHINGTON, D.C. 20503