analytical precision and accuracy in x-ray fluorescence analysis
TRANSCRIPT

1. IntroductionWhen analytical samples are irradiated with
x-rays emitted from an x-ray tube or radioactivesource, fluorescent x-rays are generated in thesample and can be measured for quantitativeanalysis of its elements. X-ray fluorescenceanalysis is rapid, precise and non-destructive.
X-ray intensity, which is measured from thenumber of accumulated counts of x-ray photonsper unit time, is always accompanied by a smallcounting statistical fluctuation which conform tothe Gaussian distribution with a standard devia-tion equal to the square root of the total counts.The precision of an x-ray measurement can,therefore, be predicted by the measured inten-sity. For example, an accumulated intensity ofone million counted x-ray photons has a stan-dard deviation of 0.1%, and for one hundredmillion counts the standard deviation is 0.01%.
When an x-ray beam propagates through asample, its intensity is modified by matrix ele-ment effects, including the generation of char-acteristic x-rays, absorption of the emitted x-rays along their paths, and the enhancement ef-fect due to secondary excitation. Studies ofthese modification processes and related x-rayphysical phenomena lead to the derivation ofmathematical correction formulae. The develop-ment of these x-ray correction methods domi-nates the analytical performance of the x-rayfluorescence method.
2. Correction of Matrix Element Effects
The advances in x-ray fluorescence instru-ments and applications have led to the need fordevelopments of practical and effective mathe-matical correction formulae. A number of cor-rection methods have been developed (see forexample, Lachance and Traill [1], Rasberry andHeinrich [2], etc.). Beattie and Brissey [3] de-rived a basic correction formula for the relation-ship between the intensity of characteristic x-rays and the weight fraction of constituent ele-ments, which was the product of a term con-taining the intensity of measured analytical x-rays and a correction factor containing the con-centrations of the constituent elements.
A classification of the correction equationspublished in the literature is carried out fromthe standpoint of mathematical simplicity andshown in the following:1) The correction term of constituent elements
consists of a constant plus the sum of prod-ucts of x-ray intensities and correction fac-tors, or the sum of the product of weightfractions and corrections coefficients.
2) The correction factor may or may not in-clude the term with the analyte element.
3) The correction coefficients are mostlytreated as constants, which is efficient inthe case of small concentration changes ofmatrix elements.
4) In order to develop wider applicable correc-tion equations and improve the eliminationof analytical errors, terms with variable cor-rection coefficients are used in the correc-
THE RIGAKU JOURNALVOL. 21 / NO. 2 / 2004, 26–38
ANALYTICAL PRECISION AND ACCURACY IN X-RAY FLUO-RESCENCE ANALYSIS
TOMOYA ARAI
Rigaku Industrial Corporation, Akaoji, Takatsuki, Osaka 569-1146 Japan
The analytical precision and accuracy in x-ray spectrochemical analysis are discussed;measured x-ray intensity is always accompanied by a small counting statistical fluctuationwhich conforms to the Gaussian distributions with a standard deviation of the square root ofthe total counts. Since the measured characteristic x-rays modified with matrix effect give riseto analytical errors, it is necessary to correct their intensity of an analyzing element. After manymatrix corrections derived empirically and theoretically are reviewed, analytical examples ofcopper and copper alloys, stainless steels and heat resistance and high temperature alloys areinvestigated using a comparison parameter of RMS-difference. Calibration curve method,which is induced from the relationship between calculated intensity with fundamental parame-ter method and measured intensity, is revealed for quantitative determinations. Segregation insolidified materials is touch upon, which is strongly related to analytical accuracy.
26 The Rigaku Journal

tion formulae, which are affected with thethird or the fourth constituent elements.
5) Least-squares methods have been used forthe determination of correction coefficientsand correction equations by using experi-mental data from a large number of stan-dard samples. However, after the develop-ment of the fundamental parameter method,calculated intensities have been used forthe derivation of correction coefficients andequations as well as for the verification ofexperimentally determined coefficients andequations. Since there exist many correc-tion methods for quantitative analysis, it isnecessary for practical applications to knowabout the characteristics of matrix correc-tion equations for selecting the proper fit-ting algorithm for the analyzed sample.
Rousseau [4] reviewed the concept of the in-fluence coefficients in matrix correction methodfrom the standpoint of theoretical and experi-mental approaches.
The development of the fundamental-para-meters method has been carried out by a num-ber of x-ray scientists. At first, Sherman [5]studied the generation of characteristic x-raystheoretically. Shiraiwa and Fujino [6] proceededthis method even more accurately and verifiedit experimentally. For the spectral distribution ofa primary x-ray source, they combined Ku-lenkampff’s formulae [7] of continuous x-rayswith their own measured intensity ratios of con-tinuous x-rays and tungsten L series x-rays froma side window x-ray tube. Criss and Birks [8]further developed the method by measuring theprimary x-ray intensity distributions from sidewindow x-ray tubes and using mini-computersystems to control x-ray fluorescent spectrome-ters [9].
To improve the performance of an x-ray spec-trometer, a high-power end-window x-ray tubewith a thin beryllium window was developed byMachlett [10]. A remarkable improvement in theanalytical performances for light elements wasachieved by a closely coupling of the x-raysource with the sample and a high transmit-tance window. In order to accomplish a reliablefundamental parameter method, the primary x-ray distributions from end window x-ray tubeswere measured by Arai, Shoji and Omote [11]. Itwas found that the output of the x-ray spectraldistribution at the long wavelength region wasincreased.
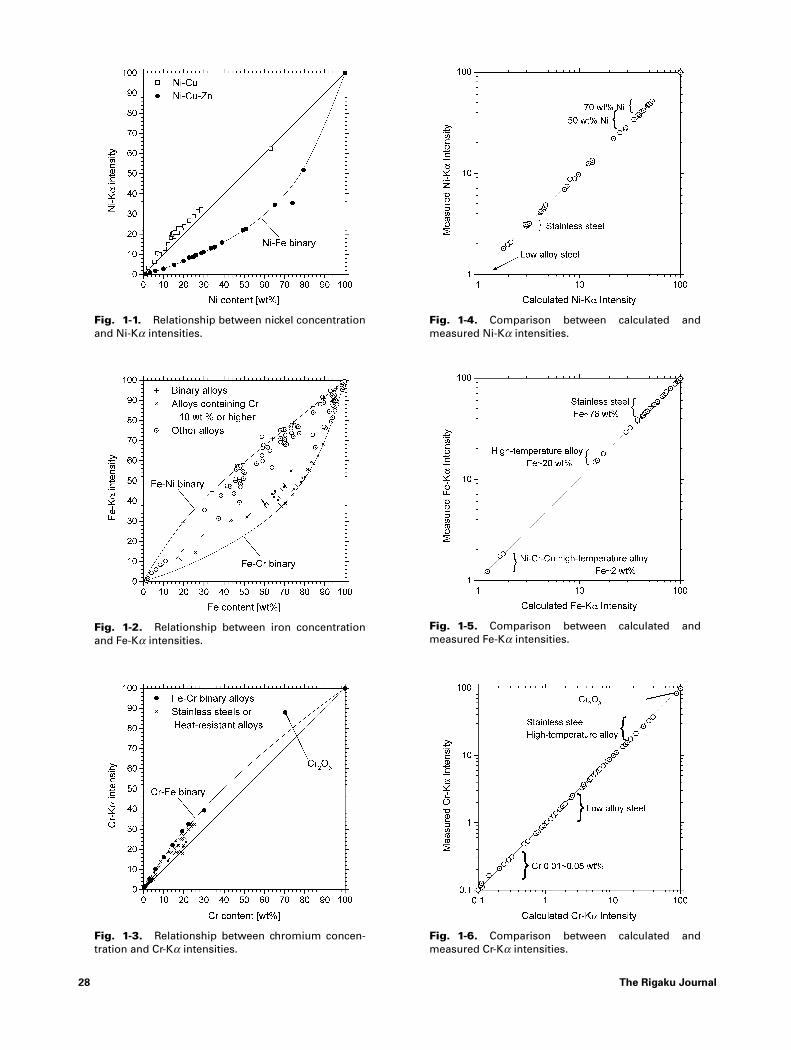
Fig. 1 shows the comparison between mea-sured and calculated intensities of varioussteels and alloy metals. At low concentrations
background intensity corrections should be ap-plied and at the higher intensity ranges themeasured intensity requires a counting loss cor-rection. Samples used in Fig. 1 are shown inTable 1.
Rousseau [12] inspected coefficients, equa-tions and methods of matrix corrections forhigh accuracy analysis and wider applicablecorrection equations based on the method de-veloped by Claisse and Quintin [13] and Criss[8].
Furthermore, Rigaku tried to compare mea-sured and calculated intensities based on itsown developed fundamental-parametersmethod. Using the primary x-ray distributionfrom the end window x-ray tube, preciselymatching calibration curves were obtained.Using these curves, direct quantitative analysiswas then carried out by iterative computer algo-rithms without the need of matrix correctionequations. The analytical results will be shownfor stainless steel and high alloy analysis.
3. Quantitative Analysis of Copper andCopper Alloys
X-ray fluorescence analysis has been appliedwidely owing to its—in comparison with currentroutine wet chemical methods—high speed per-formance and, particularly important, non-de-structive analytical procedure in industrial use.X-ray analysis of copper and copper alloys aretypical examples where four-digit figure resultscan be expected, since the high reproducibilityof X-ray intensity measurements and the mini-mization of segregation errors owing to a largeanalyzed surface influences the X-ray analyticalerror.
Table 2 shows the relationship between theintensities of Cu-Ka x-rays and surface treat-ment. The intensities emitted from coarse sur-faces exhibit a reduction; the intensity after sur-face treatment by a belt-surfacer (#400, No. 4) isnearly the same as after Lathe-treatment (∇∇∇,No. 1). In routine procedures, it is shown thatthe same surface treatment should be adopted.In Table 3, the simple repeatability for Cu-Ka x-rays by using a Rigaku fixed channel spectrom-eter is shown. The coefficient of variation for
Vol. 21 No. 2 2004 27
Table 1. Measured samples in Fig. 1.
28 The Rigaku Journal
Fig. 1-1. Relationship between nickel concentrationand Ni-Ka intensities.
Fig. 1-2. Relationship between iron concentrationand Fe-Ka intensities.
Fig. 1-3. Relationship between chromium concen-tration and Cr-Ka intensities.
Fig. 1-4. Comparison between calculated andmeasured Ni-Ka intensities.
Fig. 1-5. Comparison between calculated andmeasured Fe-Ka intensities.
Fig. 1-6. Comparison between calculated andmeasured Cr-Ka intensities.

Cu-Ka x-rays is 0.046% and the variation of Zn-Ka x-rays is 0.022%. Under the above condi-tions, the x-ray analytical results of pure brasssamples are illustrated in Table 4. The spreadwidth of calibrations curves is 0.019 wt/56–65wt% in the case of copper and 0.024 wt%/34–44wt% in the zinc, using the quadratic equationssolved by the least squares method. In thismeasurement the analytical accuracy consistsof the chemical analysis errors, the effects ofsurface treatment and the statistical fluctuationsof x-ray intensities.
On the right hand side of Table 4 the sums ofx-ray concentrations of copper and zinc and thedifferences between concentration sums of
chemical and x-ray values are shown, which in-dicate the reliability of x-ray analytical results.
In Fig. 2, the relationship between zinc con-centrations and the intensities of Zn-Ka and Zn-Kb1 x-rays, normalized to pure metal intensities,is illustrated. The high intensities of Zn-Ka x-rays and the remarkable intensity reductions ofZn-Kb1 x-rays are caused by the low-absorptionof Zn-Ka x-rays and the high absorption of Zn-Kb1 by the copper component. In Table 5, the in-tensity ratio of Zn-Kb1/Zn-Ka against zinc con-centrations are tabulated.
When a small amount of additional elementssuch as tin, lead, iron and manganese is al-loyed, the intensities of Zn-Ka x-rays decreases
Vol. 21 No. 2 2004 29
Table 2. Relationship between x-ray intensity of Cu-Ka and surface treatments. Sample: Specialbrass (Cu content: 73.82 wt%) Measuring condition: spinning.
Table 3. Precision of x-ray intensity of copper and zinc in brass. Sample: BS-33, Equipment: RigakuSimultix.
Table 4. Quantitative analysis of copper and zinc in brass. Equipment: Rigaku Simultix(40 kV–5 mA, 40 sec. FT), Surface treatment of the samples: Milling finish.

owing to the high absorption by these ele-ments. This is shown in Fig. 2 for the case ofNBS brass samples, which include smallamounts of such additional elements, and fornickel silver alloy samples. Because of theirshort wavelengths, Sn-K and Pb-L x-rays can ex-cite Cu-K and Zn-K x-rays, whereby an increaseof measured intensities of Cu-Ka and Zn-Ka x-rays can be expected. However, secondary exci-tation can be disregarded, as the concentrationof tin and lead is low. The similarity of low ab-sorption by nickel, copper and zinc is responsi-ble for small correction coefficients of Cu-Kaand Zn-Ka x-rays in nickel.
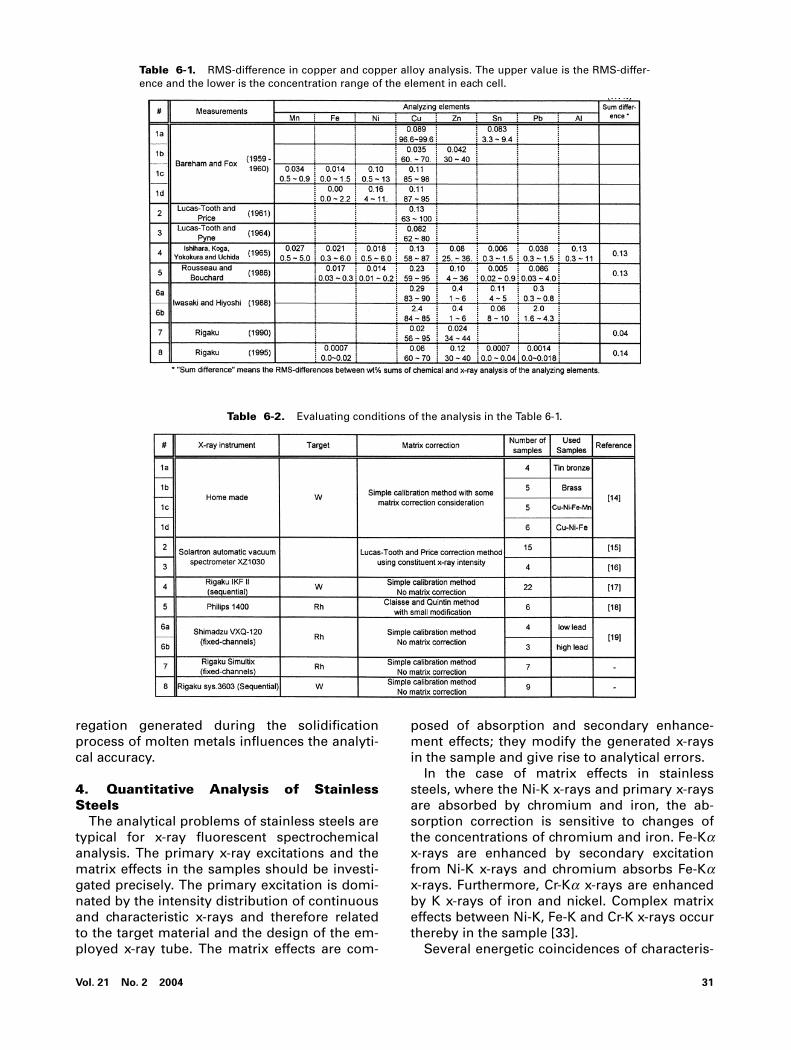
In order to review the analytical accuracy ofnumerous reports, a comparison parameter isintroduced, defined as the root mean square be-tween chemical analyses and non-corrected orcorrected x-ray values (abbreviated as RMS-dif-ference). Table 6 shows the RMS-difference ofcopper and copper alloys, which were reportedby many researchers.
Bareham and Fox [14] developed their own x-ray spectrometer and analyzed copper and cop-per alloys. In order to compensate for the ma-trix effects, beforehand the concentrations ofthe additional elements were measured, whichunderwent inconsiderable influence by matrix
effects. Then the calibration curves for Cu-Kaand Zn-Ka x-rays were prepared with classifica-tions based on the concentration of the addi-tional elements, and used for the determinationof accurate concentrations of copper and zinc. Itwas a noticeable result that the analytical accu-racy of pure brass samples shown in 1b in Table6-1 was small.
Lucas-Tooth and Price [15] showed the analyt-ical accuracy of corrected copper concentra-tions in brass samples and Lucas-Tooth andPyne [16] indicated that the ten-times repeata-bility for copper concentrations with fresh sur-face measurements in a day was 0.065 wt%; theanalytical accuracy was equal to this repeatabil-ity.
Ishihara, Koga, Yokokura and Uchida [17] pre-pared calibrations of special brass and specialbronze for the x-ray determination based on asimple calibration method.
Rousseau and Bouchard [18] verified the cor-rection equations derived by Claisse andQuintin [13] and Criss [8] using calculated inten-sities based on the fundamental parametermethod and x-ray measurements of NBS cop-per alloys. A detailed comparison of measuredand calculated x-ray intensities was given.
Iwasaki and Hiyoshi [19] studied the segrega-tion of bronze alloys. The analytical results oforiginal cast samples analyzed by means of x-ray and ICP methods were compared with thoseof recast samples which were prepared with acentrifugal casting machine. RMS-differences inTable 8 show the x-ray analytical results be-tween the originally casted and recasted sam-ples. In the case of high concentrations of lead,large differences between cast and recast sam-ples were found in copper and lead analyses. Intin analysis, however, small differences are de-noted between them. In zinc analysis a small re-duction of the zinc concentration arises from es-caping vapor, exhibiting small differences.
Rigaku measured pure brass samples usingthe Rigaku sequential and fixed channel spec-trometers. The analytical accuracies of copperand zinc using Rigaku fixed channel simultane-ous spectrometers are superior to those ofRigaku sequential spectrometers. As the count-ing circuits of the fixed channel spectrometerhandle a high throughput of electronic signalsfrom x-ray photons, high precision measure-ments can be carried out in short time.
The analytical examples of copper and copperalloys indicated that high precision measure-ments are possible and four-digits analyses areexhibited; inhomogeneity-effects like the seg-
30 The Rigaku Journal
Fig. 2. Relationship among concentration. mea-sured and calculated x-ray intensity of various alloys.
Table 5. Intensity ratios of Zn-Kb1/Zn-Ka in brasssamples.
regation generated during the solidificationprocess of molten metals influences the analyti-cal accuracy.
4. Quantitative Analysis of StainlessSteels
The analytical problems of stainless steels aretypical for x-ray fluorescent spectrochemicalanalysis. The primary x-ray excitations and thematrix effects in the samples should be investi-gated precisely. The primary excitation is domi-nated by the intensity distribution of continuousand characteristic x-rays and therefore relatedto the target material and the design of the em-ployed x-ray tube. The matrix effects are com-
posed of absorption and secondary enhance-ment effects; they modify the generated x-raysin the sample and give rise to analytical errors.
In the case of matrix effects in stainlesssteels, where the Ni-K x-rays and primary x-raysare absorbed by chromium and iron, the ab-sorption correction is sensitive to changes ofthe concentrations of chromium and iron. Fe-Kax-rays are enhanced by secondary excitationfrom Ni-K x-rays and chromium absorbs Fe-Kax-rays. Furthermore, Cr-Ka x-rays are enhancedby K x-rays of iron and nickel. Complex matrixeffects between Ni-K, Fe-K and Cr-K x-rays occurthereby in the sample [33].
Several energetic coincidences of characteris-
Vol. 21 No. 2 2004 31
Table 6-1. RMS-difference in copper and copper alloy analysis. The upper value is the RMS-differ-ence and the lower is the concentration range of the element in each cell.
Table 6-2. Evaluating conditions of the analysis in the Table 6-1.

tic x-rays require spectral corrections for line-overlaps, including Mn-Ka x-rays with Cr-Kb1 x-rays, Co-Ka with Fe-Kb1, S-Ka with Mo-La andP-Ka with Mo-L l.
In Table 7 the analytical accuracy based onseveral reported papers is compiled and RMS-differences are adopted. Sugimoto [20] pro-posed a matrix effect correction method on thebasis of the use of weight fractions of con-
stituent elements and also studied the correc-tion method using the intensities of constituentelements. It was clarified that the use of weightfractions and measured intensities of the con-stituent elements is equivalent from the stand-point of analytical accuracy. For the derivationof the correction equation, he referred to the pa-pers of Beattie and Brissey [3], Anderman [21]and Burcham [22]. The correction equation con-
32 The Rigaku Journal
Table 7-1. RMS-difference in stainless steel analysis. The upper value is the RMS-difference andthe lower is the concentration range of the element in each cell.
Table 7-2. Evaluating conditions of the analysis in the Table 7-1.

sists of products of an intensity term of mea-sured x-rays and correction factors, howeverthe iron term was excluded in either case ofweight fraction or intensity corrections, but thecorrection terms of nickel and chromium wereincluded. For the sake of clarifying the startingpoint of the studies, the chemical analysis er-rors were shown and are tabulated in Table 8.The x-ray analytical errors are two or threetimes as large as those of the chemical analysis.
Lachance and Traill [23] derived simple cor-rection equations based on the weight fractionsof the constituent elements. The weight fractionof an analyzed element was proportional to thex-ray intensity which carries the correction fac-tor of one plus the sum of the products ofweight fraction and correction coefficients, “a”,of the constituent elements. Most of the “a”-co-efficients could be calculated by using absorp-tion coefficients, and the results in Table 7 indi-cate the effectiveness of assuming constant “a”correction coefficients.
Shiraiwa and Fujino [24] studied the genera-tion process of x-ray fluorescent x-rays andcompleted the fundamental parameter methodafter Sherman studies [5]. The physical processof the generation of x-rays was analyzed pre-cisely. For obtaining the primary x-ray tubespectrum, they combined continuous x-rays andthe L-series of characteristic x-rays from tung-sten. After calculating the intensities of fluores-cent x-rays, correction equations were derivedfor the analysis of low alloy and stainless steels.In Table 7 the RMS-difference of stainless steelsare shown.
After Criss and Birks measured the primary x-ray intensity distributions, they developed thefundamental parameter method and comparedthree correction methods [8]. The first one wasthe purely experimentally determined correc-tion method based on the commonly usedequations, the second was a correction equa-tion method using monochromatic x-rays se-lected for excitation of the characteristic x-rays,and the third method was a correction calcula-tion using the fundamental parameter method.In Table 7, the results of the first calculation areshown.
In 1978, Criss and Birks developed a newcomputer program NRLXRF combining funda-mental parameter calculations and experimen-tally derived corrections for applications with awider range of constituents and more accurateanalyses. RMS-differences measured in 1978are improved from the results in 1968.
Mochizuki [25] derived a unique correction
method. At first, the intensities of Cr-Ka x-rayswere measured using binary alloys of iron andchromium; after nickel was added, the influenceof nickel to Cr-Ka x-rays was investigated.
Abe [26] discussed the analysis of stainlesssteels based on the JIS correction methodwhich was authorized by the committee of theiron and steel institute in Japan. Because anend window x-ray tube equipped with a thinberyllium window and a rhodium target wasused, the analytical results of light elementswere accurate enough for industrial applica-tions. Three kinds of correction coefficients inthe JIS formula were used and independentlydetermined. RMS-differences in Table 7 are themean values of three correction calculations.The spread degrees of RMS-differences usingeach correction coefficients are very similar tothe mean values of RMS difference in Table 7.
The ASTM group [27] adopted a simple cali-bration method for x-ray analysis of stainlesssteels. X-ray analytical values in the reportswere pooled among five laboratories joint tothe ASTM group.
Ito, Sato and Narita [28] concluded that therewere no differences between analytical resultsof a-coefficients methods and the JIS correctionmethod for stainless steel analysis. For theoverlap-correction of Cr-Kb1 x-rays with Mn-Kax-rays, they tried to use the weight fraction ofchromium and the intensity of Cr-Ka x-rays, andshowed that elimination of Cr-Kb1 x-ray influ-ences the manganese weight fraction in anycase.
Rousseau and Bouchard [18] compared mea-sured x-ray intensities with those calculated bythe fundamental parameter method. A con-frontation figure of measured and calculated x-ray intensities was shown. After the Claisse-Quintin [13] and Criss-Birks [8] equations wereinspected using the calculated intensities, themodified equations based on the Claisse-Quintin equation were derived by means ofadding the third correction terms to theLachance-Trail equation. Many NBS sampleswere analyzed and good analytical results wereobtained.
Vol. 21 No. 2 2004 33
Table 8. Chemical analysis errors of stainlesssteels.

Gunicheva, Finkelshtein and Afonin [29] ana-lyzed NBS standard samples and private sam-ples using the Claisse-Quintin equation withsome modifications. Fairly good accuracy fornickel and chromium was obtained.
Broll, Caussin and Peter [30] studied funda-mental parameter methods for the determina-tion of matrix correction equations and theLachance-Traill equation; they developed amethod with some modifications for quantita-tive determinations and showed analytical re-sults of BAS stainless steels.
Rigaku analyzed stainless steel samples sup-plied by NBS, BAS and JIS. For matrix correc-tions they adopted the Rigaku fundamental-pa-rameters method for the calculation of x-ray in-tensities and prepared calibration curves frommeasured and calculated x-ray intensities. Byusing the established calibration curves, weightfractions of constituent elements were calcu-lated by means of iterative algorithms. Al-though confidence problems originating fromthe physical constants exist in the calculated in-tensities, the calculated analysis values can beaccepted on the basis of RMS-differencesshown in Table 7.
5. Quantitative Analysis of Heat Resis-tance and High Temperature Alloys
Abbott [31], who was the first developer of acommercial x-ray fluorescent spectrometer, pre-sented a strip chart record of high alloy steel(16-25-6) (see Fig. 3). In Fig. 4 the measurementof NBS 1155 high alloy steel with a today’s in-strument is illustrated. Since the fluorescent in-tensities and spectral resolution are sufficientlyhigh for practical applications, the differencebetween these two pictures exhibits the histori-cal progress of 50-years development.
As pointed out by Abbott, the x-ray method iswell suitable for analyzing heat resistance andhigh temperature alloys which consist of nickel,cobalt, iron, and chromium as major con-stituents, and low concentrations of varyingother elements. Because the concentrations ofthe constituent elements influences the metal-lurgical properties of high temperature and heatresistance alloys, quantitative determination re-quires high precision. Studies of RMS-differ-ences are shown in Table 9.
Rickenbach [32] showed the precision and ac-curacy of nickel and chromium analysis. Themeasured precision of nickel and chromium inan A286 metal was shown as the compositeerror within a day and extending several days.The mean value of the nickel error was
0.03 wt%/26.2 wt% and for chromium it was0.023 wt%/14.5 wt%. They are one-fifth of theRMS-differences in Table 9. It was noted that nomatrix corrections were required for specimenswith only small concentration variations.
Lucas-Tooth and Pyne [16] discussed a for-mula where the correction factor is a constantplus the sum of products of the individual x-rayintensities of the constituent elements with cor-rection coefficients. RMS-differences of 0.07wt% in chromium and 0.032 wt% in manganesewere reported.
A third report sponsored by the ASTM com-mittee in 1964 was presented by Gillieson,Reed, Milliken and Young [33]. Simultaneously,a report about spectrochemical analysis of hightemperature alloys by spark excitation wasgiven. Referring to the matrix correction meth-
34 The Rigaku Journal
Fig. 3. Spectrum of 16-25-6 alloy taken by Abbott[31].
Fig. 4. Spectrum of NBS1155 taken by usingRigaku ZSX 100e.

Vol. 21 No. 2 2004 35
Tab
le9
-1.
RM
S-d
iffer
ence
in h
eat
resi
stan
ce s
teel
an
d h
igh
tem
per
atu
re a
lloy
anal
ysis
. Th
e u
pp
er v
alu
e is
th
e R
MS
-diff
eren
ce a
nd
th
e lo
wer
is t
he
con
cen
trat
ion
ran
ge
of
the
elem
ent
in e
ach
cel
l.
Tab
le9
-2.
Eva
luat
ing
co
nd
itio
ns
of
the
anal
ysis
in t
he
Tab
le 9
-1.

ods by Lucas-Tooth and Price [15] and Lucas-Tooth and Pyne [16], they applied a correctionon the basis of x-ray intensities of the con-stituent elements. For higher accuracy, the mea-sured intensities of aluminum and silicon con-stituents should be added in order to improvethe matrix correction.
Lachance and Traill [23] studied simple matrixcorrection equations that were one plus thesum of products of the weight fraction of con-stituent elements and correction coefficients.Based on the analysis of high nickel alloys thatare selected from the application report, RMS-differences were calculated and are shown inTable 9.
On the basis of the Lachance-Traill equations,Caldwell [34] derived two kinds of correctionequations. The first one was a fixed correctioncoefficient equation and the second one was avariable correction coefficient equation forwider concentration applications, on which thethird or fourth constituent elements exerted re-form. RMS-differences of major constituents invariable correction coefficient calculations im-proved those of the fixed correction coefficientmethod.
Ito, Sato and Narita [35] studied the JIS cor-rection equations that consist of the product ofa factor containing a quadratic polynomial ofthe intensity of the measured x-rays, and a ma-trix correction factor. The coefficients of the in-tensity part were determined by least- squaresalgorithms from binary alloys with knownchemical composition or from mathematicalmodels; the second factor is one plus the sumof products of the weight fractions of the con-stituent elements and correction coefficients.Excluded are the terms containing the base con-stituent and the measured elements. In practicalapplications for nickel base alloys the correctioncoefficients of light and heavy elements fromiron-based alloys were used; for the analysis ofthe major constituent elements, chromium,iron, and cobalt in nickel base alloys, the correc-tion coefficients were determined experimen-tally.
Griffiths and Webster [36] discussed the de-rivation of matrix correction equations in detail.They adopted the modified Lachance-Traillequation, in which the calibration constants ofthe x-ray intensity terms were determined by re-gression analysis and the correction factorswere calculated with a program theoreticallyderived by de Jongh [37]. The two kinds ofRMS-differences of authenticated sample analy-sis are shown in Table 9. The values in the
upper line are the calculated results based onnormal matrix correction in the ALPHAS pro-gram, and the second values in the lower lineare derived with the use of correction coeffi-cients calculated under the condition of a fixed60 : 20 : 20 constituent sample.
Itoh, Sato, Ide and Okochi [38] studied theanalysis of high alloys using the product of ap-parent concentrations and one plus the sum ofproducts of weight fractions of the constituentelements and theoretically calculated correctioncoefficients. They compared the correctionmethods and clarified that there were no differ-ences between them; based on their experimen-tal findings they proposed a correction methodwhich was authorized by the JIS committee.The results of analytical accuracy were two ormore times higher than those of x-ray analyticalprecision.
Rigaku analyzed high nickel alloys of NBS andspecially prepared samples. For the matrix cor-rection, they adopted the Rigaku fundamentalparameter method and prepared calibrationcurves, which were used for the determinationof the constituent elements. The RMS-differ-ences in these studies were fairly small.
6. Segregation Influencing AnalyticalAccuracy
The influence of inhomogeneity phenomenaon the analytical accuracy is one of the mostimportant factors. The internal soundness of aningot which was studied by Marburg [39] be-queathed that the inhomogeneity induced in thecooling process from molten metals intimatedstrong effects to analytical problems to besolved.
Stoops and McKee [40] studied the reductionof analytical accuracy for titanium concentra-tions owing to segregation of nickel base alloysof M252 (19 wt% chromium, 10 wt% cobalt,10 wt% molybdenum, 2.5 wt% titanium, 3 wt%iron, 1 wt% aluminum, 0.15 wt % carbon and0.35 wt% silicon). Since a major portion of tita-nium can be found in the grain boundaries ofcarbide or carbon-nitride particles, the differ-ences between regular chemical and x-rayanalysis values indicate a wider distribution,which is 5 to 10% of the amount of titanium pre-sent. When chemical analysis is carried outusing samples scooped up from the x-ray ana-lytical surface, x-ray values are nearly equal tothat of chemical analysis, i.e., 0.5–1% of theamount of titanium present.
It is well known that in the rapidly cooledsteel low concentration manganese and impu-
36 The Rigaku Journal
rity sulfur are dispersed and moderate analyti-cal accuracy in manganese and sulfur determi-nation can be found. In sufficiently annealedsteel, small particles of manganese sulfide areprecipitated in the grain boundaries of steelgrains and the large deviations of Mn-Ka and S-Ka x-rays are found.
Free cutting metals that are among the mostwidely used industrial materials are typical ex-amples for exhibiting segregation phenomenain metals. Small metal particles like lead insteels and copper alloys influence machine pro-cessing of high-speed cutting.
The following is associated with copper alloyanalysis previously mentioned. Iwasaki andHiyoshi studied lead segregation in bronze al-loys [19]. According to the microscopic observa-tions surface pictures of a cast bronze shows amixture of ground metal of copper and leadprecipitated particles and in the recast picturesthe surface with scattering of lead small parti-cles can be seen. From cast sample surfacecomparing with that of recast samples Cu-Ka x-rays exhibit higher intensities and Pb-La x-raysshow lower intensities. In recast sample sur-faces, Cu-Ka x-rays show lower intensities andPb-La x-rays are higher intensities because ofabsorption of Cu-Ka x-rays and the exciting ofbare surfaces of many small particles of lead onanalyzing surface.
In the analysis of lead free cutting steels (Pbcontent: 0.1–0.3 wt%), small particles of leadmetal (1–15 mm) are scattered in steel. T. Arai re-ported that simple repeatability of Pb-La x-raysis 0.003 wt% and RMS-difference of lead is0.018 wt% [41].
The characteristics of segregation or inhomo-geneity have been recognized as one of naturalphenomena or the discoveries through experi-mental works. If some studies or works havebeen attained a success after long or hardworks, possibilities of the second and the thirdsuccess or discovery will be increased on thebases of research works and their process.
7. Concluding RemarksElemental analysis of materials may be ab-
solute or relative. Gravimetric analysis is a typi-cal example for the former, while x-ray fluores-cence and optical emission methods representthe latter. In the case of a relative analysis, stan-dard samples are required, which are attachedto reliable or authenticated analytical valuessupported by absolute analyses. The valuesguaranteed by absolute analysis are the meanvalues of volume analysis, while x-ray analytical
values represent surface analysis with an infor-mation depth of 5 to 50 micrometers. In order toreduce the analytical uncertainty, which origi-nates from the differences between volume andsurface analysis, homogeneous samples shouldbe used. For the sake of reducing the effect ofinhomogeneity on the sample surface, large an-alyzed surfaces of 3 to 10 centimeter squaredare recommended.
The results of the pure brass analysis clarifythat small analytical errors and the close agree-ment between chemical and x-ray analysis par-allel the quality of homogeneity of the analyzedsamples. In the x-ray analysis of stainless steelsit is possible to reduce the analytical error by means of an optimized matrix correctionmethod. For the confidence of x-ray analysis itis necessary to analyze the iron concentrationand to supervise the sum of x-ray analyticalconcentration values of the constituent ele-ments. In order to perform high alloy analysis, itis necessary to have knowledge about x-ray andchemical analysis and of the metallurgical phe-nomena occurring in the process of the samplepreparation.
Since the analytical accuracy is defined by acombination of errors of chemical analysis, un-certainty in the measured x-ray intensity, anduncorrected matrix effects by the constituent el-ements, the observed accuracy can be reducedby effective matrix corrections adapted to x-rayanalysis and elimination of other systematic er-rors may be activated.
Rome was not built in a day!!
AcknowledgmentsIn commemoration of the receipt of the 2004
Birks award at the Denver x-ray conference, thewriting of this paper was made possible with aninvitation by Dr. Hideo Toraya, Director of X-rayResearch Laboratory, Rigaku Corporation andEditor-in-Chief of Rigaku Journal, Dr. Ting C.Huang, Associate Editor-in-Chief and Emeritusof IBM Almaden Research Center at San Jose,CA, USA and Dr. Michael K. Mantler, Editor forthe Rigaku Journal and Professor at the ViennaUniversity of Technology, Austria. The authorwishes to express his thanks to them. He also isindebted to many distinguished x-ray scientistsfor permitting to utilize a number of their re-ports. He thanks Dr. Takashi Yamada, Mr. NaokiKawahara, Dr. Makoto Doi and Mr. Takashi Shojifor their assistance in the preparation of thepaper.
Vol. 21 No. 2 2004 37
References
[ 1 ] G. R. Lachance and R. J. Traill, Canadian Spectroscopy11 (1966) 43–48.
[ 2 ] S. D. Rassberry and K. F. J. Heinrich, Analytical Chem-istry 46 (1974) 81–89.
[ 3 ] H. J. Beattie and R. M. Brissey, Analytical Chemistry26 (1954) 980–983.
[ 4 ] R. M. Rousseau, Advances in X-Ray Analysis 37(1994) 639–646.
[ 5 ] J. Sherman, Spectrochimica Acta 7 (1955) 283–306.[ 6 ] T. Shiraiwa and N. Fujino, Japanese Journal of Ap-
plied Physics 5 (1966) 54–67.[ 7 ] H. Kulenkampff, Annalen der Physik 69 (1922) 548.[ 8 ] J. W. Criss and L. S. Birks, Analytical Chemistry 40
(1968) 1080–1086. J. W. Criss, L. S. Birks and J. V. Gilfrich, AnalyticalChemistry 50 (1978) 33–37.
[ 9 ] J. V. Gilfrich and L. S. Birks., Analytical Chemistry 40(1968) 1077–1080. J. V. Gilfrich, P. G. Burkhalter, R. R. Whitlock, E. S. War-den and L. S. Birks, Analytical Chemistry 43 (1971)934–936. D. B. Brown and J. V. Gilfrich., Journal of AppliedPhysics 71 (1971) 4044–4046.D. B. Brown, J. V. Gilfrich and M. C. Peckerar, Journalof Applied Physics 46 (1975) 4537–4540.
[10] G. R. Mahn, Cathode Press 22 (1965) 41–46.[11] T. Arai, T. Shoji and K. Omote, Advances in X-ray
Analysis 29 (1985) 413–422.[12] R. M. Rousseau, X-ray Spectrometry 13 (1984) 115–
120.R. M. Rousseau, X-ray Spectrometry 13 (1984) 121–125.
[13] F. Claisse and M. Quintin, Canadian Spectroscopy 12(1967) 129–146.
[14] F. R. Bareham and J. G. M. Fox, Journal of the Instituteof Metals 88 (1960) 344–351.
[15] H. J. Lucas-Tooth and B. J. Price, Metallurgia 64(1961) 149–152.
[16] J. Lucas-Tooth and C. Pyne, Advances in X-ray Analy-sis 7 (1963) 523–541.
[17] Y. Ishihara, M. Koga, S. Yokokura and S. Uchida, X-rayAnalysis, Japan 2 (1965) 165–172. (in Japanese)
[18] R. M. Rousseau and M. Bouchard, X-ray Spectrometry15 (1986) 207–215.
[19] K. Iwasaki and K. Hiyoshi, Bunseki Kagaku 37 (1988)
152–156. (in Japanese)[20] M. Sugimoto, Japan Analyst 11 (1962) 1168–1176. (in
Japanese)M. Sugimoto, Japan Analyst 12 (1964) 475–482. (inJapanese)
[21] J. W. Kemp and G. Anderman, A.R.L. Report, Septem-ber, (1955).
[22] H. D. Burnham, J. Hower and L. C. Jones, AnalyticalChemistry 29 (1957) 1827–1834.
[23] G. R. Lachance and R. J. Traill, Canadian Spectroscopy11 (1966) 63–71.
[24] T. Shiraiwa and N. Fujino, Advances in X-ray Analysis11 (1967) 63–94.
[25] H. Mochizuki, Advances in X-ray Chemical Analysis,Japan 6 (1971) 104–114.
[26] T. Abe, Journal of the Japan Institute of Metals 13(1974) 425–437.
[27] ASTM E572-1976, 275-280.[28] M. Ito, S. Sato and M. Narita, X-ray Spectrometry 10
(1981) 103–108.[29] T. N. Gunicheva, A. L. Finkelshtein and V. P. Afonin, X-
ray Spectrometry 19 (1990) 237–242.[30] N. Broll, P. Caussin and M. Peter, X-ray Spectrometry
21 (1992) 43–49.[31] J. L. Abbott, The Iron Age, October 28 (1948) 58–62.
J. L. Abbott, The Iron Age, November 4 (1948) 121–124.
[32] J. R. Rickenbach Jr., Advances in X-ray Analysis 6(1962) 352–360.
[33] A. H. Gillieson, D. J. Reed, K. S. Milliken and M. J.Young, ASTM special technical publication No. 376(1964) 3–22.
[34] V. E. Caldwell, X-ray Spectrometry 5 (1976) 31–35.[35] M. Ito, S. Sato and M. Narita, Tetsu-to-Hagané 69
(1983) 169–176. (in Japanese)[36] J. M. Griffiths and H. W. M. Webster, X-ray Spectrom-
etry 15 (1986) 61–72.[37] W. K. de Jongh, X-ray Spectrometry 2 (1973) 151–158.[38] S. Itoh, K. Sato, K. Ide and H. Okochi, Bunseki Kagaku
35 (1986) 33–37. (in Japanese)[39] E. Marburg, Journal of Metals, February (1953) 157–
172. [40] R. F. Stoops and K. H. McKee, Analytical Chemistry 33
(1961) 589–592.[41] T. Arai, The Rigaku Denki Journal 3 (1961) 207–208. (in
Japanese)
38 The Rigaku Journal