analytical report -...
TRANSCRIPT

Analytical Report
1
Drought in Sri Lanka – January2017 ERCC Analytical Team and JRC Drought Team –26 January 2017
1. Map
2. Situation analysis Sri Lanka1 is currently experiencing a severe drought. This drought situation has been caused
by a severe lack of rainfall during the last second Inter-monsoon season (IM2) which is
normally characterised by heavy rainfall from October to November. (see details in section 3
– Drought analysis)
IM2 is currently being followed by the north-eastern monsoon (cold dry weather season)
which will last until March and which will not change the situation2 until the first Inter-
monsoon season will start again. In May, high amounts of rain (up to 3.000mm) are expected
to occur as usual. These events are reinforced by an exceptional lack of rain in previous
months. For example, in December 2016, only 53mm rain has fallen while the monthly
average in December is usually 160mm (+90mm).
According to the National Disaster Management Centre, 260 000 families are affected by the drought which is considered the worst of the past 40 years.
1 See details on Sri Lanka Geography and Climate in Annex I
2 The north-east monsoon season has maximum rainfall of 1.280mm in mountainous areas and 200mm in
coastal areas in the West.

Analytical Report
2
Drought in Sri Lanka – January2017 ERCC Analytical Team and JRC Drought Team –26 January 2017
The most affected districts are Batticaloa, Kalutara, Jaffna, Mannar and Karunegala , the key
paddy-growing districts in Sri Lanka (more details on the ECHO Crisis Flash 1 on Sri Lanka –
Drought)
The total water availability amounts at the moment to only 29% of its total capacity.
This lack of water hurts both the agriculture and hydro-power production.
The country's food production is severely affected (low yields, failed crops and decreased
food stocks) and the total water availability in the major reservoirs (which are the major
sources of drinking water and irrigation) is decreasing.
The caused distress for agriculture affects the country's food production and therefore also
the available food stocks. This creates a potential threat of food scarcity.
FAO reports that the yield for the paddy crop is 19% lower than in 2016.
While the government is taking measures to provide food and to control the rising food
prices, in particular the subsistence farm household might require assistance in form of
humanitarian aid and emergency recovery assistance. They are located in the North
Western-, North Central-, Uva- and the Southern provinces.
According to FAO, the government is providing millers with 150 000 tonnes of paddy rice in
order to reduce food prices and to further import 250 000 tonnes of rice.
An ECHO field assessment mission has been launched to further assess the impact of the
drought on the most vulnerable population and the subsequent most immediate
humanitarian needs. In particular, there is a need to assess the humanitarian impacts on
small scale paddy farmers, agricultural daily labours and other agricultural livelihood holdings
in paddy-growing regions of the country.
A Food Security- and Nutrition assessment mission co-led by WFP and the Government of Sri
Lanka is also planned for the first half of February.
For more details on the humanitarian response read ECHO Crisis Flash 1 on Sri Lanka –
Drought enclosed to this report.
1. Recommendations on ECHO involvement Assistance via the Humanitarian Aid budget will be decided upon reception of the
assessment reports on the identified need of the most vulnerable populations.
Assistance via the Union Civil Protection Mechanism could be provided if the government
identifies a specific area of intervention that corresponds to the available civil protection
expertise and capacity (in the case of drought, such intervention would focus on technical
expertise in water management system, water purification units). A practical example could
be the identification of a critical infrastructure such as a hydro-power plant that is at risk due
to the scarcity of water.
2. Methodology used to assess the severity of the drought impact The monitoring of a drought phenomenon is done via the combination of meteorological and
biophysical indicators. The assessment of the societal vulnerability to droughts is performed
via a targeted analysis of social, economic and infrastructural indicators.

Analytical Report
3
Drought in Sri Lanka – January2017 ERCC Analytical Team and JRC Drought Team –26 January 2017
The combination of the information on 1) the occurrence and severity of a drought, on 2) the
assets at risk and on 3) the societal vulnerability in the drought affected areas is translated in
a Likelihood of Drought Impact (LDI) indicator. The LDI provides an indicator that shows who
is likely to be impacted by a drought, where, when and to what degree.
In addition to LDI, the standardized precipitation index (SPI) which compares the rainfall
accumulated over a certain number of months at a location with the long-term average for
the same location is analysed (for the description of SPI see annex 2).
To complete the analysis the vegetation, the Soil moisture and Land Surface Temperature
(LST) anomalies is considered.
In particular to assess drought impacts on vegetation, a good indicator is the Fraction of
Absorbed Photo-synthetically Active Radiation (fAPAR), which represents the fraction of the
solar energy that is absorbed by the vegetation.
3. Drought analysis By mid-October 2016, it was reported that rainfall was missing in September (SWM) and the
rains fallen in October did not make up for the deficit. (JRC)
The drought situation continues since November – as shown by the following reported
indicators.
The Likelihood of Drought Impact (LDI) indicator from the Global Drought Observatory
(GDO), shown below, demonstrates that Sri Lanka is affected by a medium likelihood of
drought impacts. The JRC Report shows the different levels of drought warning, and the
amount of people interested in the affected areas. The indicator shown is the Likelihood of
Drought Impact (LDI).
REPORT ON SRI LANKA (SRI LANKA) Eight-day period starting on 19 December (19/12 - 27/12) http://edo.jrc.ec.europa.eu/gdo/php/index.php?id=2002&ndx=LDIv2&scope=famine&lon=80.54544&lat=7.49236&refDate=2016-12-19
Likelihood of Impact Population Area [km2] % Pop.
Low, 1 18.869.397 62.927 95.10
Medium, 2
High, 3
in affected areas 18.869.397 62.927 95.10
total 19.842.536 66.173
REPORT ON SRI LANKA (SRI LANKA) Eight-day period starting on 27 December (27/12 – 31/12) http://edo.jrc.ec.europa.eu/gdo/php/index.php?id=2002&ndx=LDIv2&scope=famine&lon=80.54544&lat=7.49236&refDate=2016-12-27
Likelihood of Impact Population Area [km2] % Pop.
Low, 1 4.386.242 14.628 22.11
Medium, 2 14.006.862 46.711 70.59
High, 3 476.293 1.588 2.40
in affected areas 18.869.397 62.927 95.10
total 19.842.536 66.173

Analytical Report
4
Drought in Sri Lanka – January2017 ERCC Analytical Team and JRC Drought Team –26 January 2017
REPORT ON SRI LANKA (SRI LANKA) Eight-day period starting on 01 January (01/01 – 08/01) http://edo.jrc.ec.europa.eu/gdo/php/index.php?id=2002&lon=80.545444507813&lat=7.4923576494141&aruId=get&ctyId=get&refDate=2017-01-01
Likelihood of Impact population Area [km2] % Pop.
Low, 1 4.386.242
14.628 22.11
Medium, 2 14.483.155 48.300 72.99
in affected areas 18.869.397 62.927 95.10
total 19.842.536 66.173
REPORT ON SRI LANKA (SRI LANKA) Eight-day period starting on 09 January (09/01 – 16/01) http://edo.jrc.ec.europa.eu/gdo/php/index.php?id=2002&lon=80.545444507813&lat=7.4923576494141&aruId=get&ctyId=get&refDate=2017-01-09
Likelihood of Impact population area [km2] % Pop.
Low, 1 4.386.242
14.628 22.11
Medium, 2 14.483.155 48.300 72.99
in affected areas 18.869.397 62.927 95.10
total 19.842.536 66.173
The reports show that in the last month almost all of Sri Lanka’s population was experiencing
at least low likelihood of drought impact. In the 8-day period starting 27 December, 71%
experienced a medium and 2.4 % a high likelihood of drought impact. The situation remained
stable over the following weeks until mid-January 2017, highlighting an increasing severity of
the drought.
The temporal evolution of the likelihood of drought can be seen in Figure 4. On the vertical
axis is shown the percentage of the region affected, horizontally time is shown. A precise
date and a vertical line show the date of observation.
Since October, the likelihood of drought impact surpasses 50%, rising to 100% in December.
High and medium likelihood is shown frequently.
Figure 4: Temporal evolution of the likelihood of drought (from JRC-GDO).

Analytical Report
5
Drought in Sri Lanka – January2017 ERCC Analytical Team and JRC Drought Team –26 January 2017
What we see in the Figure 5 is the total observed rainfall per month (blue bars), the standard
deviation (green bars) and the mean (white dots) for the last 3 years. The date of the
observation is indicated as a black line, which is continued over all graphs.
Figure 5: Temporal evolution of monthly total rainfall (from JRC-GDO).
The monthly rainfall since July remains consequently below the mean (white dot). Ignoring
the peak in June, for the year 2016 the rain amount remained below the mean for most of
the year.
Below (Figure 6) are the monthly SPI calculations for 1, 3 and 6 months accumulation
periods. Please note that in the analysis on the Global Drought Observatory (GDO), longer
periods are provided. These are not shown, but available at the links from the table of the
LDI. The SPI indicates the severity of a wet or dry event, with increasing negative values
indicating increasing severity of a drought.

Analytical Report
6
Drought in Sri Lanka – January2017 ERCC Analytical Team and JRC Drought Team –26 January 2017
Figure 6: Temporal evolution of SPI at different accumulation period (from JRC-GDO).
All the short-term SPI accumulation periods (1 and 3) show a drought situation from August
to December, with an SPI of approximately -1.5 to -3, indicating continuous medium to
severe drought conditions. SPI-6 states a severe worsening starting from November, when
the long-lasting drought potentially impacts streamflow and reservoirs: drought, after
affecting the climatologically wet IM2 season, continues into the Northeast Monsoon
Season, with conditions drier than those climatology expected for the anyway relatively dry
NEM season. This has a very likely impact on the water stored in the numerous reservoirs
and will likely impact the following growing seasons.
3.1. Vegetation anomalies The vegetation anomalies are measured using the Fraction of Absorbed Photosynthetically
Active Radiation (fAPAR). For the description of fAPAR see annex 3.
The fAPAR anomaly maps shown in Figure 7 demonstrate extended areas of negative
deviation of the vegetation health and/or cover as compared to the historical conditions for
that period, and can be used jointly with SPI to detect likely effects of rainfall/soil moisture
deficits.
Analytical Report
7
Drought in Sri Lanka – January2017 ERCC Analytical Team and JRC Drought Team –26 January 2017
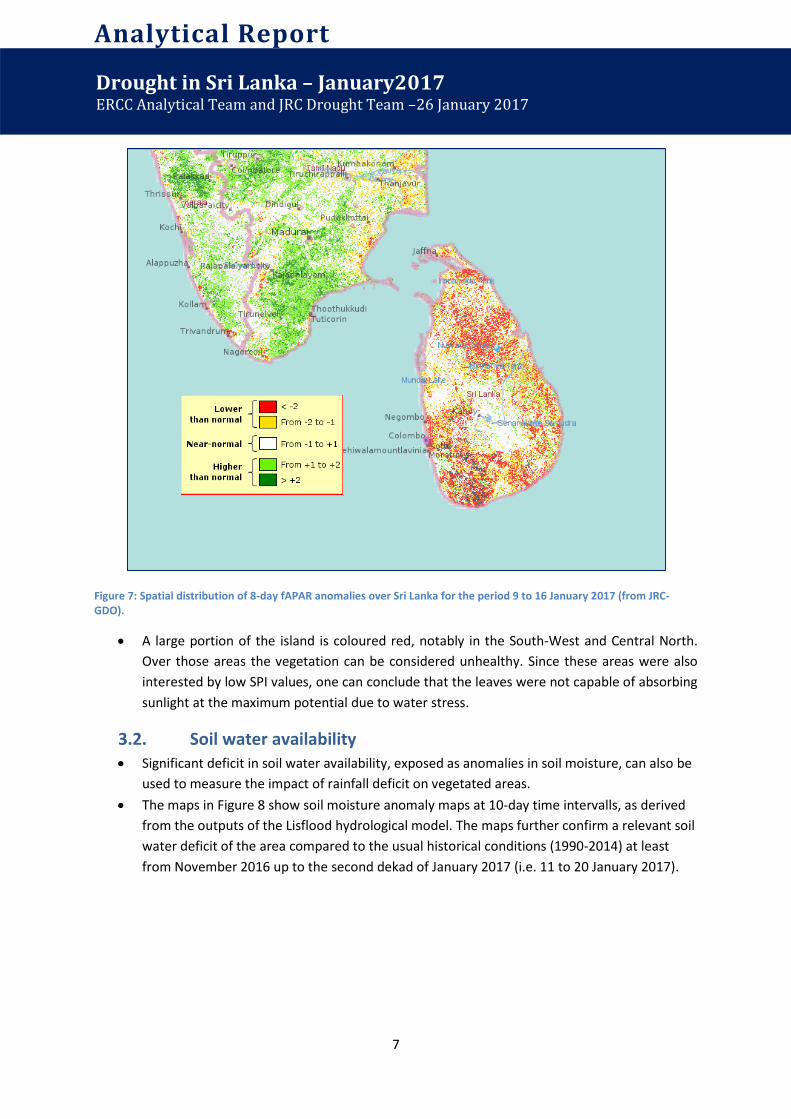
Figure 7: Spatial distribution of 8-day fAPAR anomalies over Sri Lanka for the period 9 to 16 January 2017 (from JRC-GDO).
A large portion of the island is coloured red, notably in the South-West and Central North.
Over those areas the vegetation can be considered unhealthy. Since these areas were also
interested by low SPI values, one can conclude that the leaves were not capable of absorbing
sunlight at the maximum potential due to water stress.
3.2. Soil water availability Significant deficit in soil water availability, exposed as anomalies in soil moisture, can also be
used to measure the impact of rainfall deficit on vegetated areas.
The maps in Figure 8 show soil moisture anomaly maps at 10-day time intervalls, as derived
from the outputs of the Lisflood hydrological model. The maps further confirm a relevant soil
water deficit of the area compared to the usual historical conditions (1990-2014) at least
from November 2016 up to the second dekad of January 2017 (i.e. 11 to 20 January 2017).

Analytical Report
8
Drought in Sri Lanka – January2017 ERCC Analytical Team and JRC Drought Team –26 January 2017
Figure 8: Spatial distribution of decadal soil moisture anomalies over Sri Lanka (produced by JRC but not available in GDO). The colour scale is the same as in Figure 7.
Similarly, anomalies of monthly land surface temperatures (LST) are used as remotely sensed
proxy of the vegetation water stress. The maps reported in Figure 9 further highlight the
occurrence of dryer than usual conditions.

Analytical Report
9
Drought in Sri Lanka – January2017 ERCC Analytical Team and JRC Drought Team –26 January 2017
Figure 9: Spatial distribution of monthly Land Surface Temperature (LST) anomalies over Sri Lanka (produced by JRC but not available in GDO). The colour scale is the same as in Figure 7.
It should be noted that both the soil moisture anomalies and the land surface temperature
anomalies are not available yet among the operational outputs of GDO, but they are
currently produced within the same framework in view of a future expansion of the platform.
4. Impact on the population FAO reports that the yield of the paddy crop in the 2nd monsoon season or Yala is 19% lower
than 2016 at 1.6 million tonnes. This is due to unfavourable weather conditions in the main
production areas.
More than 260 000 families from 7 provinces are affected by the dry conditions. (Sri Lanka
Disaster Management Centre)
The 2017 Yala crop, to be planted in April is cause for concern, because of the low water
levels in the main reservoirs, should the rains not improve in the coming weeks.
The prospects for the main season maize crop are unfavourable. These have to be harvested
in February.
Subsistence farm households, particularly in the North Western, North Central, Uva and
Southern provinces, will likely be most affected and require some humanitarian and
emergency recovery assistance, says colombopage.com.
FAO reports that the government started to release about 150 000 tonnes of paddy rice to
millers, in order to reduce food prices. Further there will be an import of 250 000 tonnes of
rice.
"These measures aim to improve market availabilities and ease prices of rice, which have
increased considerably in the last quarter of 2016, due to a sharp reduction of the 2016
secondary Yala harvest and increasing concerns over the main 2017 Maha crop, to be
harvested from March, due to below-average rains since the start of the season." (FAO)

Analytical Report
10
Drought in Sri Lanka – January2017 ERCC Analytical Team and JRC Drought Team –26 January 2017
Annex I
Geography and climate of Sri Lanka Sri Lanka is an island state in South Asia close to South India with which it shares its maritime
border to the North. It borders with the Maldives to the Southwest.
The northern part of the island consists of flat coastal planes which are broken by occasional
hills. Mountains rise to more than 2 000 meters in the southern part of the island. This
topography has a strong effect on the "spatial patterns of winds, seasonal rainfall,
temperature, relative humidity and other climatic elements, particularly during the monsoon
season" (meteo.gov.lk).
Rainfall in Sri Lanka has different origins:
o Monsoonal: caused by the monsoon winds from the Indian Ocean and the Bay of
Bengal,
o Convectional: rain due to the warming of the earth surface and causing
evapotranspiration of the plant moisture,
o Depressional: rain caused by the meeting of a warm, tropical air mass and a cold
polar air mass, giving rise to cloud formation and associated rain.
Sri Lanka can also be divided into a wet and a dry zone.
Due to the character of the monsoon winds (South-West in
May to September), the South of the island will receive more
rain while the North planes will be dryer during this period
of the year.
The precipitation will be on the windward slopes in the
South (see Figure 1) and amounts to up to 2 500 mm
annually. The leeward slopes are dryer. Together with the
north-eastern dry zone the rainfall in these areas amounts
from 1 200 to 1 900 mm.
The north western and south eastern coasts are
characterised by a dryer climate with rainfall as low as 800
to 1 200 mm.
This means that the "average" annual rainfall in Sri Lanka is
divided geographically and temporally as the precipitation
maps below show clearly.
Figure 1: Annual Rainfall in Sri Lanka

Analytical Report
11
Drought in Sri Lanka – January2017 ERCC Analytical Team and JRC Drought Team –26 January 2017
Figure 2: Seasonal Rainfall in Sri Lanka
Climate in Sri Lanka is tropical. This means that warm temperatures prevails in the country.
However due to the variation of altitudes temperatures differ geographically.
In the lowlands, the mean annual temperature varies between 26.5 and 28.5 °C. The
temperature in the highlands falls quickly with the altitude. At 1 800 m, for example, the
annual average is as low as 15.9 °C.
The climate can be characterised into 4 seasons (www.meteo.gov.lk):
1. The first Inter-monsoon season (IM1) is from March to April. The conditions are
warm with frequent thunderstorms. The rainfall amounts to 100 to 250 mm in most
parts of the country. In the mountainous areas, the wind side of the mountains
experiences up to 700 mm while the lee side only 250 mm.
2. The southwest monsoon season (SWM), from May to September, is characterised by
windy weather. The Southwest monsoon rains occur mainly in the south western
part of the country. It varies from about 100 mm to over 3000 mm at mid-elevation
on the Western slopes.
3. The second Inter-monsoon season (IM2), from October to November, the rainfall is
typically falling in thunderstorms and is influenced by the depressions and cyclones
in the Bay of Bengal. While the rainfall has an evenly balanced distribution it leads
regularly to floods and landslides.
4. The northeast monsoon season (NEM), from December to February, establishes cool
dry weather by the cold dry wind from the Indian sub-continent.
Annex II
Standardized Precipitation Index (SPI) The Standardized Precipitation Index (SPI-n) is a statistical indicator comparing the total
precipitation received at a particular location during a period of n months with the rainfall
climatology for the same period of time at that location. This is calculated per cumulative
rainfall for a number of months. In this case, rainfall was accumulated for 1 month, 3

Analytical Report
12
Drought in Sri Lanka – January2017 ERCC Analytical Team and JRC Drought Team –26 January 2017
months, 6 months and so on until 48 months. Since the SPI can be calculated over different
rainfall accumulation periods, different SPIs allow for estimating different potential impacts
of a meteorological drought (Figure 3):
o SPIs for short accumulation periods (e.g., SPI-1 to SPI-3) are indicators for immediate
impacts such as reduced soil moisture, snowpack, and flow in smaller creeks;
o SPIs for medium accumulation periods (e.g., SPI-3 to SPI-12) are indicators for
reduced stream flow and reservoir storage; and
o SPIs for long accumulation periods (SPI-12 to SPI-48) are indicators for reduced
reservoir and groundwater recharge, for example.
Figure 3: The value of the SPI gives a measure of the severity of a wet or dry event (the colours are those used for SPI maps on the GDO).
Because the SPI is normalised and compares the current rainfall with the historical average
(1981-2010), the SPI can be used to compare different locations. It is the statistical
magnitude of deviation from the average.
Annex III
The Fraction of Absorbed Photosynthetically Active Radiation (fAPAR) From the JRC Factsheet about fAPAR: the Fraction of Absorbed Photosynthetically Active
Radiation (fAPAR) represents the fraction of the solar energy which is absorbed by the
vegetation. fAPAR is a biophysical variable directly correlated with the primary productivity
of the vegetation, since the intercepted PAR is the energy (carried by photons) underlying
the biochemical productivity processes of plants. fAPAR is one of the Essential Climate
Variables recognised by the UN Global Climate Observing System (GCOS) and by the FAO
Global Terrestrial Observing System (GTOS) as of great potential to characterize the climate
of the Earth. Due to its sensitivity to vegetation stress, fAPAR has been proposed as a
drought indicator (Gobron et al. 2005 and 2007). Indeed droughts can cause a reduction in
the vegetation growth rate, which is affected by changes either in the solar interception of
the plant or in the light use efficiency. The fAPAR anomaly is the deviation of the 8-day fAPAR
from the long-term average expressed in units of standard deviation.