analytics everywhere - georgia state university
TRANSCRIPT

Analytics Everywhere
Updated for 2010

» It is a global marketer of consumer and commercial products that touch the lives of people where they work, live and play.
» Headquartered in a large Southeastern City. » Approximately 19,000 employees worldwide » NYSE: xyz
More than 90 percent of U.S. households have at least one Fortune 500 Consumer Goods
product.
About “Fortune 500 Consumer Goods”

US & Canada 75% 85%
Europe 14% 0%
APAC 6% 0%
Latin America 5% 0%
Our Global Presence
Percent of sales in 2009
Percent of Region Live on
SAP

Office Products
Group
$1,674.7 MM
Tools, Hardware & Commercial
Products Group
$1,525.7 MM
Home & Family Group
$2,377.2 MM
Three Business Segments
2009 NWL Sales
$5.6 billion
Channels & Customers

Home & Family
- Culinary Lifestyles - Décor - Beauty & Style - Baby & Parenting Essentials - Rubbermaid Consumer
5 Global Business Units:
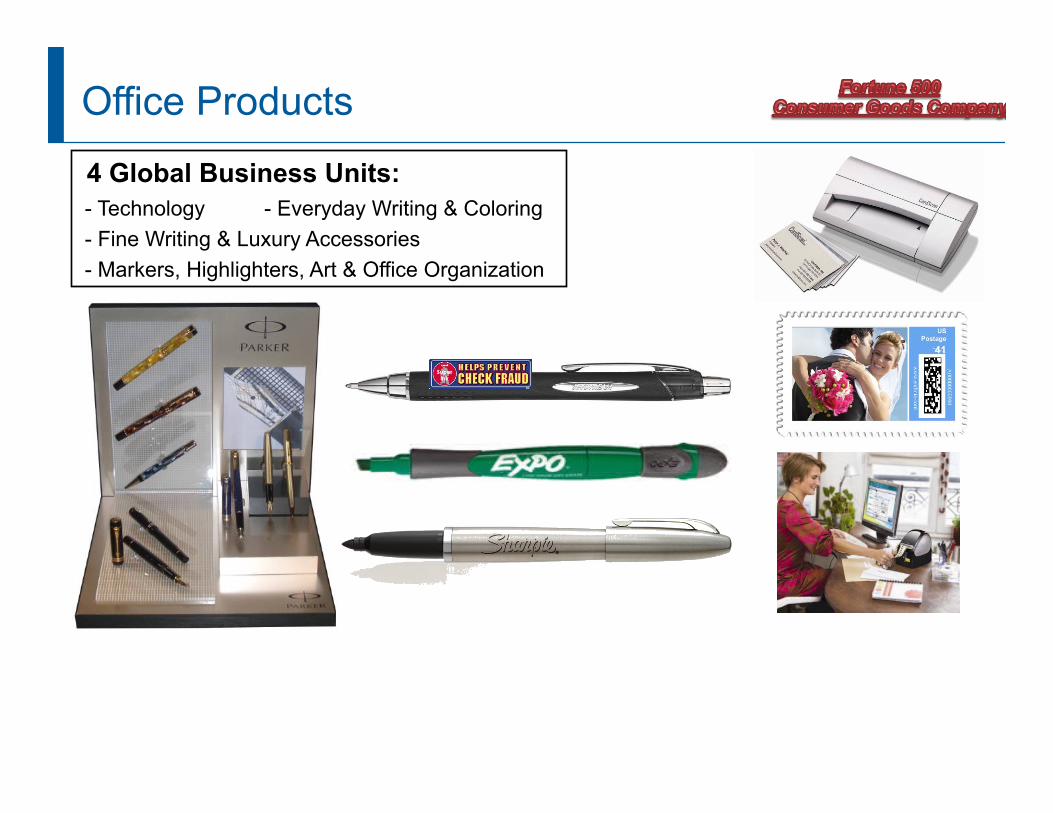
Office Products
4 Global Business Units: - Technology - Everyday Writing & Coloring - Fine Writing & Luxury Accessories - Markers, Highlighters, Art & Office Organization

Tools, Hardware & Commercial Products
- Industrial Products & Services - Commercial Products - Construction Tools & Accessories - Hardware
4 Global Business Units:
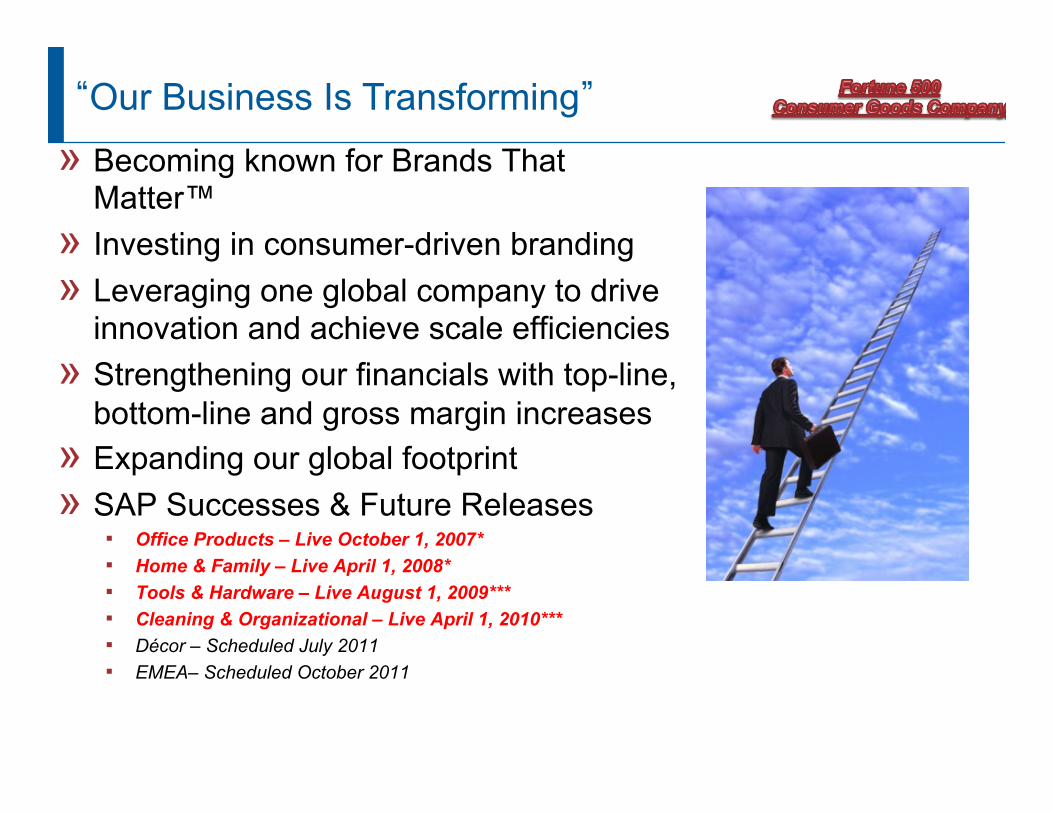
» Becoming known for Brands That Matter™
» Investing in consumer-driven branding » Leveraging one global company to drive
innovation and achieve scale efficiencies » Strengthening our financials with top-line,
bottom-line and gross margin increases » Expanding our global footprint » SAP Successes & Future Releases
▪ Office Products – Live October 1, 2007* ▪ Home & Family – Live April 1, 2008* ▪ Tools & Hardware – Live August 1, 2009*** ▪ Cleaning & Organizational – Live April 1, 2010*** ▪ Décor – Scheduled July 2011 ▪ EMEA– Scheduled October 2011
“Our Business Is Transforming”

So What About Reporting & Analytics?
Technology Implementation
Undefined Content
Lack of Dashboards
Many BI
Issues
Slow Speed To Market
Long & Costly Training
Poor Performance
Difficult Usability
Poor Communication
Low Confidence in Data
Running on SAP BI 3.5 No Plans to Upgrade
100% BEx Reporting (All Excel Based)
No SAP Portal Email for BI Communication Method
Inconsistent and/or Inaccurate Data in BI vs. ERP
3
Rewind to June 2008…
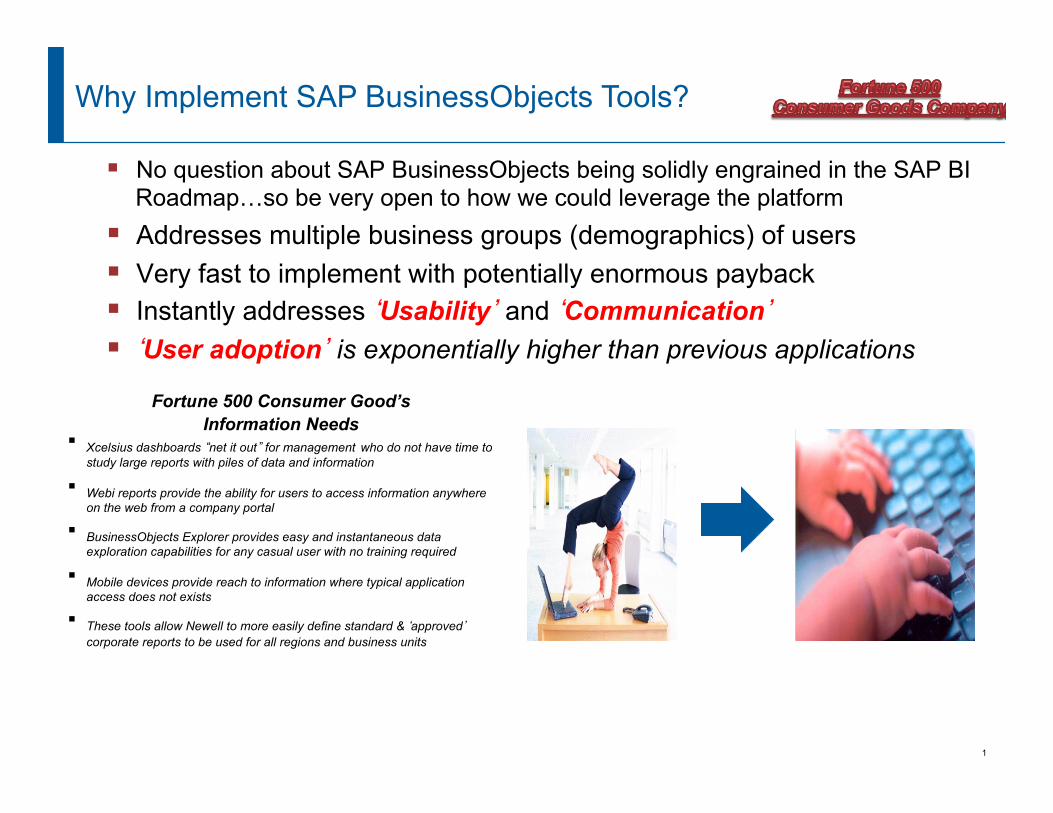
No question about SAP BusinessObjects being solidly engrained in the SAP BI Roadmap…so be very open to how we could leverage the platform
Addresses multiple business groups (demographics) of users Very fast to implement with potentially enormous payback Instantly addresses ‘Usability’ and ‘Communication’ ‘User adoption’ is exponentially higher than previous applications
Fortune 500 Consumer Good’s Information Needs
Why Implement SAP BusinessObjects Tools?
Xcelsius dashboards “net it out” for management who do not have time to study large reports with piles of data and information
Webi reports provide the ability for users to access information anywhere
on the web from a company portal BusinessObjects Explorer provides easy and instantaneous data
exploration capabilities for any casual user with no training required Mobile devices provide reach to information where typical application
access does not exists
These tools allow Newell to more easily define standard & ‘approved’ corporate reports to be used for all regions and business units
1

Formalize a Realistic and Actionable Roadmap To Follow
11
2008 2009 2010
Improve User Confidence
Take On Usability
Mature The Platform
Technical Upgrade (Feb 09) Reporting Upgrade (Sep 09)
Reconciliation Between ERP and BW (Oct 09)
Roll Out Multiple Tools Xcelsius, WEBI, BO Explorer & Mobile
Improve Communication
Communication Portal (Sep09)
Address Performance
BIA (Apr 09) Re-architect (Oct 09)
2011
Take On Usability Collaboration Tools Forums, Wiki, Stream work
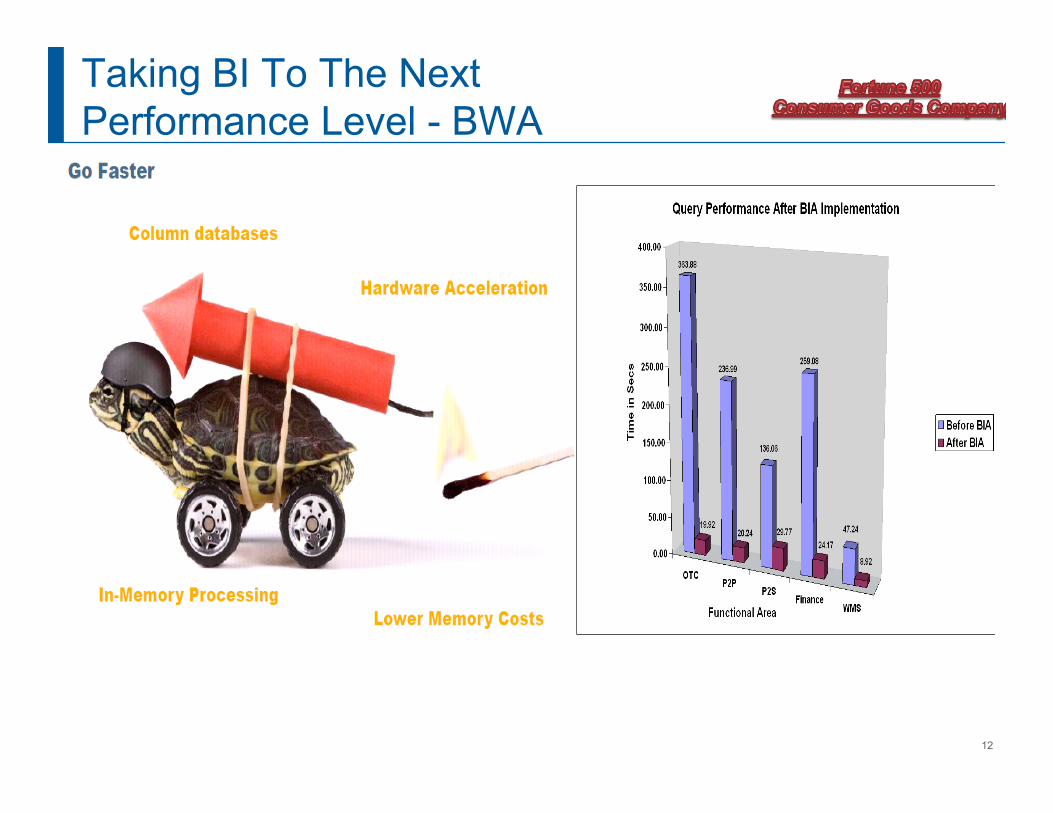
Taking BI To The Next Performance Level - BWA
12

Improving End User Confidence & Communication
BI Communication Portal ▪ One Communication ▪ Training Materials ▪ Release Details
▪ Data Availability Report
13
Clarity Of Content ▪ Documentation of Pre-
Configured Reports ▪ Search of Documentation

BI Tools
Determine The Most Appropriate BI Toolset/Application
14
End User Request
Information Discovery
Information Delivery
Mobile BEx WEBI Xcelsius BO Explorer
Time Critical?
Type Of View?
Business Analytics /
KPI
Pre Configured
Report
Type Of Discovery?
Search & Exploration
Some-what defined
Type Of Analysis?
Advanced Casual
Know What To Measure What I
Don’t Know Objective
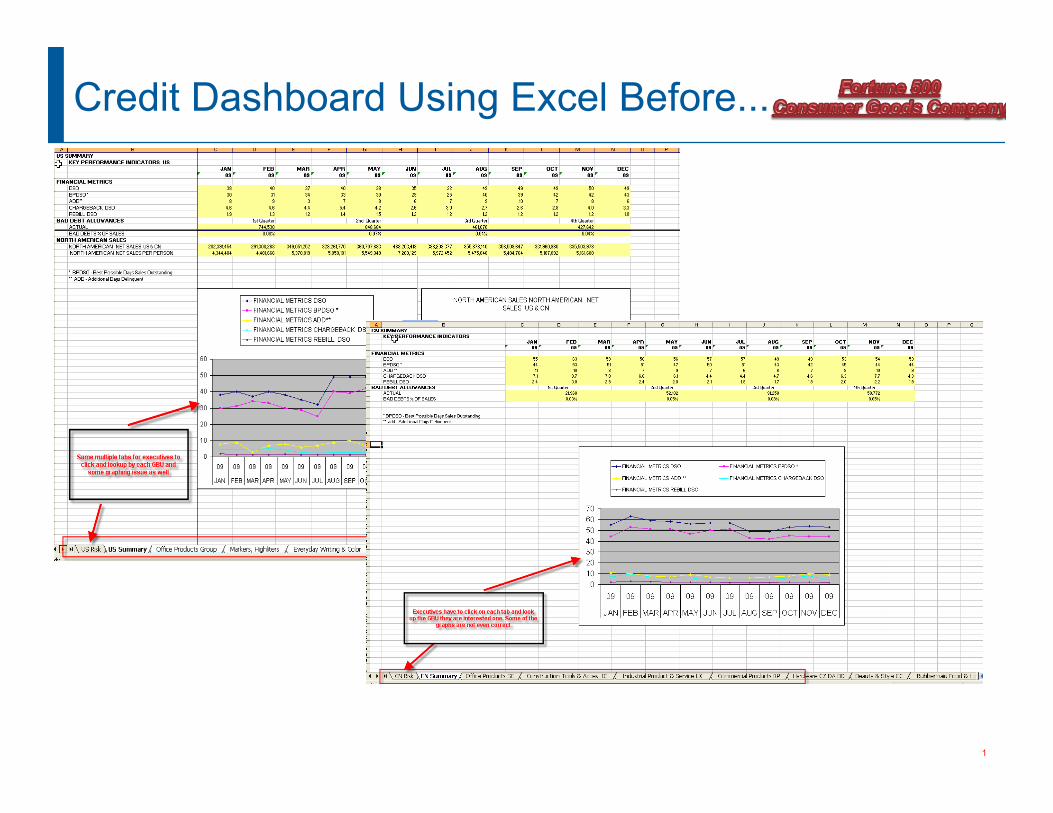
Credit Dashboard Using Excel Before...
1
16
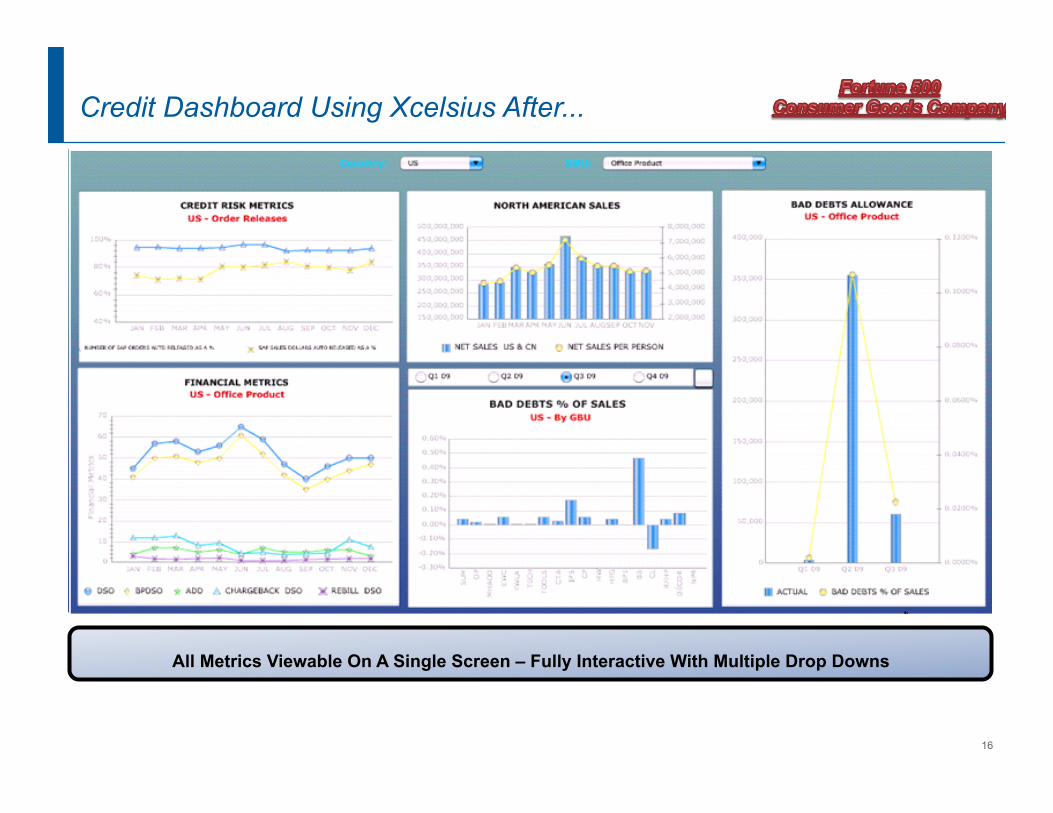
Credit Dashboard Using Xcelsius After...
All Metrics Viewable On A Single Screen – Fully Interactive With Multiple Drop Downs

Dashboard Ability (S&OP) Using BEx Before…
There was difficulty in presenting the overall business results for
executives with just a few mouse clicks
There is no visualization for overall view of how the
company is performing
There are dramatic ‘ease of use’ issues with
multiple reports for the same basic use case
None of these reports were available through the web using our SAP
Portal
There were multiple series of data layout
sheets and not a consolidated view
1
18 18
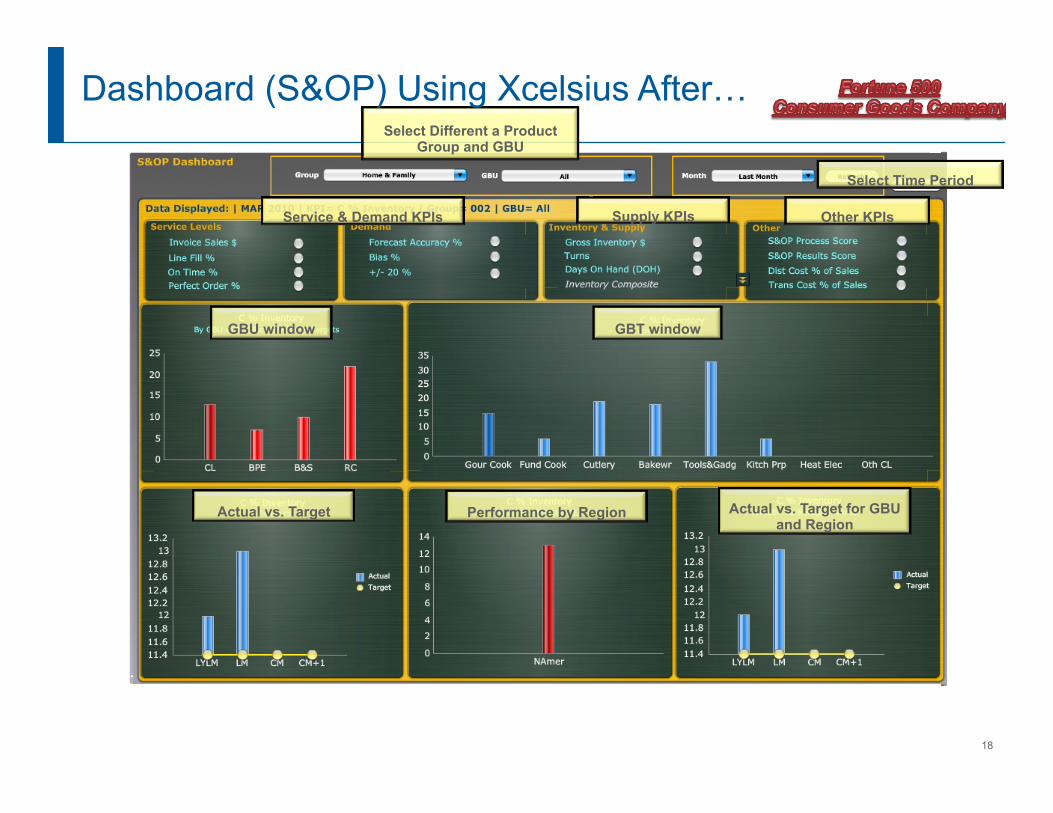
Service & Demand KPIs
Select Time Period
Supply KPIs Other KPIs
Actual vs. Target Performance by Region Actual vs. Target for GBU and Region
GBT window GBU window
Select Different a Product Group and GBU
Dashboard (S&OP) Using Xcelsius After…

Typical Ad Hoc Analysis Using BEx Before…
Some Key Constraints
All Key Figures & Measures must be laid
out on the report
There is no flexibility to select only Key Figures
that need to be displayed
There is limited formatting compared to WEBI which has ‘free form’ formatting
capability.
1

Ad Hoc Analysis Using Webi After…
All table based reports easily converted into
graphical representations of the same data values
1
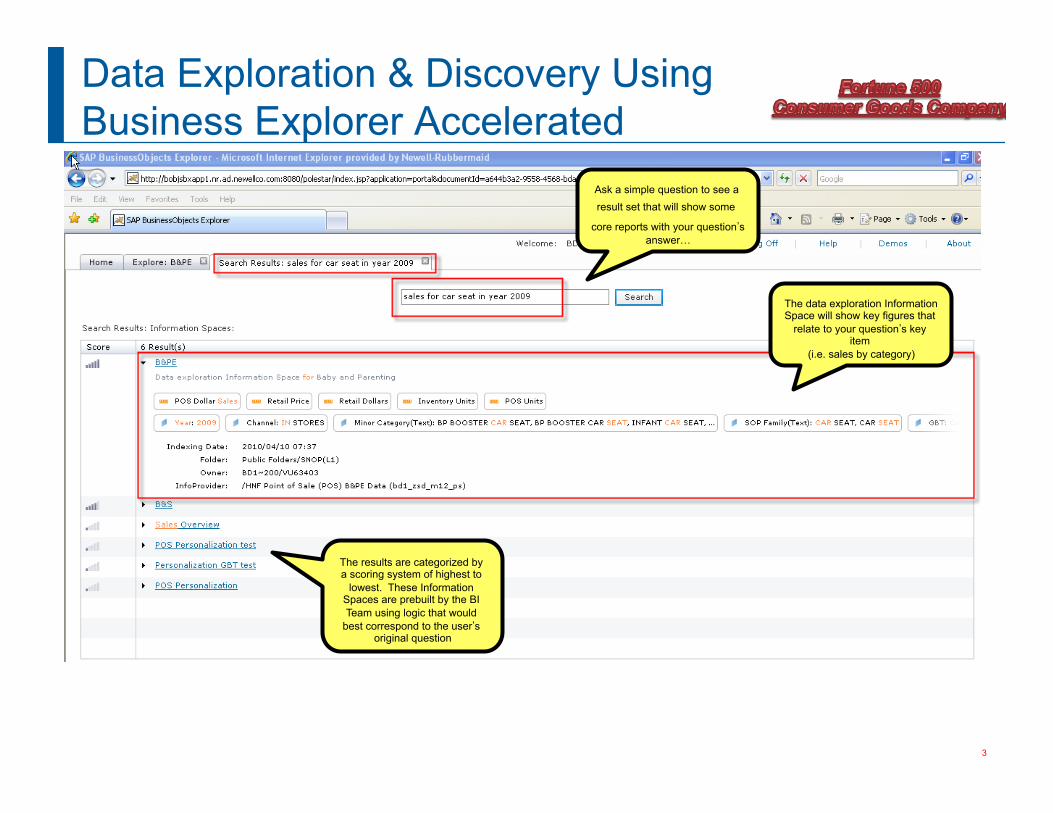
Data Exploration & Discovery Using Business Explorer Accelerated
Ask a simple question to see a result set that will show some
core reports with your question’s answer…
The data exploration Information Space will show key figures that
relate to your question’s key item
(i.e. sales by category)
The results are categorized by a scoring system of highest to
lowest. These Information Spaces are prebuilt by the BI Team using logic that would
best correspond to the user’s original question
3

22

Mobile Reporting - Before
» “Hey, Matt…..is there a way you can easily provide me metrics like Line Fill, On Time Performance, and Perfect Order % without me always having to login to my laptop and digging for it?”
» “Why can’t you just push something simply to my Blackberry so I can check it out on my way into work?”

Mobile Reporting – The Next Wave
» Mobile platforms will allow us to take ‘snippets’ of key information that may reside in larger dashboards and reports and push them directly to end users who only want to see pieces of information at any time wherever they may be
» Blackberry, iPhone, iPad platforms will all be leveraged in this capacity
1

Summary and Recommendations
Understand your company’s ‘real’ issues, not the hyperbole or simply the ‘headlines’
Do not underestimate the importance of “Speed to Market” Be very clear on where you want to focus and exactly what
applications can get you there Categorize your end users into groups that can be mapped to
the appropriate applications to deliver them analytics they can actually use and make decisions with
Define a clear roadmap and communicate it to the masses – don’t surprise people (unless it’s a really good one)
Understand that the SAP BI Platform is not just BW anymore You will need to seriously consider BWA, WEBI, Xcelsius, Explorer,
Portal, Mobile as an application architecture to appease the masses