analyzing fiscal space options for health in...
TRANSCRIPT

Analyzing Fiscal Space Options for Health in Zimbabwe
Final Report
February, 2017
Pub
lic D
iscl
osur
e A
utho
rized
Pub
lic D
iscl
osur
e A
utho
rized
Pub
lic D
iscl
osur
e A
utho
rized
Pub
lic D
iscl
osur
e A
utho
rized

2
Analyzing Fiscal Space Options for Health in Zimbabwe
Final ReportFebruary, 2017

3
Table of Contents Acknowledgements ..................................................................................................................................... 6
Executive Summary ..................................................................................................................................... 7
Introduction ............................................................................................................................................. 7
Macroeconomic conditions and fiscal space for health .......................................................................... 7
Prioritizing health in the government’s budget ....................................................................................... 8
Development assistance for health (DAH) ............................................................................................... 8
Introducing new sources of domestic funding for health ........................................................................ 8
Options for generating efficiency gains in the public system .................................................................. 9
How much fiscal space? Illustrative scenarios for health spending ......................................................... 9
Way forward .......................................................................................................................................... 10
1. Introduction ....................................................................................................................................... 11
2. Macroeconomic conditions and fiscal space for health ..................................................................... 14
3. Prioritizing health in the government’s budget ................................................................................. 18
4. Development assistance for health (DAH) ......................................................................................... 21
5. Introducing new sources of domestic funding for health .................................................................. 24
6. Options for generating efficiency gains in the public system ............................................................. 28
Allocative efficiency ............................................................................................................................... 28
Technical efficiency ................................................................................................................................ 31
7. How much fiscal space? Illustrative scenarios for health spending ................................................... 38
8. Way forward ....................................................................................................................................... 42
9. References .......................................................................................................................................... 45
List of Tables Table 1: International and regional comparison of GDP (1998-‐2015 average) ........................................ 14 Table 2: International and regional comparison of GDP (Average 1998-‐2014) ......................................... 20 Table 3: Retail Prices and Taxes for a Pack of 20 cigarettes, 2014 ............................................................ 25 Table 4: Cigarette Earmarked Nominal Revenue Projections US$ (2014 – 2022) ..................................... 26 Table 5: Alcohol earmarked nominal Revenue Projections US$ (2014 – 2022) ........................................ 26 Table 6: Value Added Tax rates for Selected SADC Countries ................................................................... 27 Table 7: Service availability and readiness assessment by facility type .................................................... 36 Table 8: Total cost for the three scenarios (Million USD) .......................................................................... 39

4
List of Figures Figure 1: Example of a fiscal space diamond ............................................................................................. 11 Figure 2: GDP per capita (1998-‐2021) ....................................................................................................... 15 Figure 3: Annual economic growth (2009-‐2021) ....................................................................................... 15 Figure 4: Elasticity of public health spending to GDP per capita (2009-‐2013) ........................................... 15 Figure 5: Trend revenues and expenditures GDP ratios ............................................................................ 16 Figure 6: Revenues by source (as a share of GDP) ..................................................................................... 16 Figure 7: Selected rents as share of GDP (1990-‐2015) .............................................................................. 16 Figure 8: International comparison: Government spending on health (2014) .......................................... 18 Figure 9: Trend in Government spending on health (2004-‐2014) ............................................................. 18 Figure 10: Central government spending on health relative to other priority sectors (2009-‐2014) ......... 19 Figure 11: Government spending on health and total health expenditure as share of GDP (2000-‐2014) 20 Figure 12: Regional comparison: External assistance as a share of total health expenditure (2011) ....... 21 Figure 13: Total health spending by funding source (2014-‐2017) ............................................................. 21 Figure 14: Total Development assistance on health to Zimbabwe (1990-‐2013) ....................................... 22 Figure 15: Development assistance on health on major programs (2000-‐2013) ...................................... 22 Figure 16: Funding breakdown by cost categories (2016) ......................................................................... 23 Figure 17: Funding breakdown between government and external funders by program function (2016) 23 Figure 18: HDF funding commitments and gap (2016-‐2018) .................................................................... 23 Figure 19: Causes of Deaths for the Total Population in Zimbabwe (2013) .............................................. 29 Figure 20: MoHCC Budget Allocation by Service ....................................................................................... 29 Figure 21: Referrals to Central Hospitals 2008-‐2014 ................................................................................. 30 Figure 22: MoHCC transfers to health facilities ......................................................................................... 30 Figure 23: MoHCC Budget Allocation vs Actual Expenditure 2009 -‐2015 .................................................. 32 Figure 24: Employment costs vs total Expenditure 2009 -‐2016 ................................................................ 34 Figure 25: Percentage Vacancy rate in 2014 ............................................................................................. 34 Figure 26: Objectives and keys assumptions for the three costing scenarios ........................................... 38 Figure 27: Funding requirements of NHS scenarios versus scenarios for increased government spending on health .................................................................................................................................................... 39 Figure 28: Fiscal space projections from reprioritization of health, sin taxes and earmarking of 1 percent of VAT (against NHS2 cost estimates) ........................................................................................................ 40 Figure 29: Fiscal space projections from reprioritization of health, sin taxes, earmarking of 1 percent of VAT and continued DAH flows (against NHS2 cost estimates) .................................................................. 41

5
Acronyms AG: Auditor General CHAI: Clinton Health Access Initiative DAH: Development Assistance on Health DEA: Data Envelopment Analysis DTTU: Delivery Team Topping Up EMPS: Essential Medicines Pull System GDP: Gross Domestic Product GoZ: Government of Zimbabwe HDF: Health Development Fund IMF: International Monetary Fund MDG: Millennium Development Goal MOFED: Ministry of Finance and Economic Development MoHCC: Ministry of Health and Child Care NHI: National Health Insurance NHS: National Health Strategy ODA: Official Development Assistance PBB: Program Based Budgeting PFM: Public Finance Management PFMS: Public Finance Management System PSIP: Public Sector Investment Program QALY: Quality Adjusted Life Years RBF: Results Based Financing SFA: Stochastic Frontier Analysis SHI: Social health Insurance THE: Total Health Expenditure UHC: Universal Health Coverage VAT: Value Added Tax WB: World Bank WHO: World Health Organization ZADS: Zimbabwe AIDS Distribution System ZAPS: Zimbabwe Assisted Pull System ZEPARU: Zimbabwe Economic Policy Analysis and Research Unit ZIP/PHCP: Zimbabwe Informed Push/Primary Health Care Package

6
Acknowledgements
This Fiscal Space Analysis was financed by the World Bank and developed by the World Bank Health, Nutrition and Population Task Team in collaboration with Zimbabwe’s Ministry of Finance and Economic Development (MOFED) and Ministry of Health and Child Care (MOHCC), with the input of development partners. The financial support of the Zimbabwe Reconstruction Fund under the Health Sector TA is duly acknowledged. This Fiscal Space Analysis was led by Laurence Lannes (Senior Health Economist). Ronald Mutasa led the policy and technical dialogue that underpinned the analytical work. Team members included Chenjerai Sisimayi (Health Specialist), Shepherd Shamu (Health Economist/Consultant) and Leah Jones (Knowledge Management Consultant). The team gratefully acknowledges technical input from Ajay Tandon (Lead Economist) and Netsanet Workie (Senior Health Economist) in the formative stages of the study. The team is grateful to the two peer reviewers, Owen Smith, Senior Economist and Thulani Matsebula, Senior Public Health Specialist for their insightful comments and suggestions. The team also appreciates the administrative and management support of Farai Sekeramayi-‐Noble (Program Assistant, Harare) and Yvette Atkins (Senior Program Assistant, Washington, DC). The team wishes to acknowledge the leadership and support of Mr. Churu (Principal Director, Budgets), Mr. Vela-‐Moyo (Director for Budgets) and Brigadier Gwinji for setting up and supporting the working group on fiscal space comprised of economists, accounts and health specialists from the Ministries of Finance and Economic Development and Ministry of Health and Child Care. Members of the fiscal space working group include Mr. Gwati (Health Economist at MOHCC and Chair of the working group), Mr. Mutyambizi (Chief Accountant, MOHCC), Ms. Matenda (Senior Economist, MOFED), Mr. Goredema (Senior Economist, MOFED) and Mr. Machinjike (Senior Economist, MOFED). The team acknowledges the guidance of Olusoji Adeyi (Director, Health Nutrition and Population Global Practice), Magnus Lindelow (Practice Manager, Health Nutrition and Population Global Practice), Camille Lampart Nuamah (Country Manager for Zimbabwe), Paolo Belli (Program Leader for Zimbabwe) and Johannes Herderschee (Senior Country Economist). The team could not have completed this analysis without the leadership and ownership demonstrated by the MOHCC through Brigadier General Dr. Gwinji (Permanent Secretary).

7
Executive Summary Introduction Fiscal space is “the capacity of government to provide additional budgetary resources for a desired purpose without any prejudice to the sustainability of its financial position”1. Creating fiscal space makes additional resources available for government spending on health. Government can generate fiscal space for health through: (i) establishing conducive macroeconomic and fiscal conditions; (ii) prioritizing health within the government budget; (iii) allocating health sector-‐specific financing from other sources; (iv) negotiating higher development assistance for health; and (v) improving efficiency of outlays for health.
There is a growing interest in fiscal space analysis for health in low and middle-‐income countries. As countries are faced with the challenge of increasing domestic spending on health in the wake of decreasing external assistance, underfunding of the sector, unmet needs and poor health outcomes, fiscal space analysis is a useful tool for assessing a country’s constraints and identifying areas for generating additional health sector resources.
The fiscal space analysis for the health sector in Zimbabwe is timely and the need for such analysis has been strongly expressed by the government and its development partners. This imperative is justified on multiple grounds. As the country is hit by an economic crisis resulting in lower revenues and cuts in expenditures, understanding the consequences and assessing coping strategies for the health sector is critical. As the country engages in the implementation of its new health sector strategy which sets ambitious targets in terms of health outcomes towards Universal Health Coverage, it is also critical to explore ways to increase resources for the sector, even in a constrained macro-‐fiscal environment. The fiscal space analysis also highlights the major sources of inefficiencies to identify areas for improvement to increase the value for money in the sector. Overall, the fiscal space analysis aims to generate evidence to inform MOFED and MOHCC on short-‐term and medium-‐term options to generate resources for the health sector. It will provide evidence for government partner consultations on short-‐term options and choices in light of declining public financing for health and a difficult economic growth outlook.
Macroeconomic conditions and fiscal space for health Between 2010 and 2014, Zimbabwe’s economy enjoyed strong growth but recent economic updates point to a significant downturn in 2015 and 2016. Fiscal revenues, which have been a major source of budget financing, are leveling off and the financial crisis is leading to a significant deterioration in the Government’s fiscal position. The financial crisis also dampens economic prospects. Economic growth is expected to be negative in 2017 and the IMF forecasts a 0.4 percent average economic growth between 2017 and 2021. IMF projections for government revenues predict a decline and stabilization around 23 percent of GDP for the period 2017-‐2021. During the same period, expenditures are projected to decline and stagnate at 26 percent of GDP generating a 3 percent annual deficit on average.
Overall, the current financial crisis of Zimbabwe and the challenging macroeconomic prospects offer limited potential for greater fiscal space due to slow growth, high debt and high taxation levels. In such a context, only marginal gains can be obtained even if the elasticity of public health expenditure to GDP is relatively favorable to the sector. Rising unemployment and growth of the informal sector can
1 P. Heller, The prospects of creating ‘fiscal space’ for the health sector. Health Policy Plan. (March 2006) 21 (2): 75-‐79

8
further impede the already restricted fiscal space. Concerted efforts to improve efficiency in revenue collection and expenditure will make better use of existing resources in the medium term.
Prioritizing health in the government’s budget In Zimbabwe, government spending on health—as a share of total government spending—is low compared to that of countries in the region and of a similar income level. In the past five years, government spending on health reached an average of 7.3 percent of government spending.
Current trends suggest limited opportunities to improve prioritization of the health sector. Historical data shows that in difficult economic times lower priority is given to the health sector, and an increased share of the budget is used for debt servicing (interest payment). Therefore, despite the stated objective of the health financing strategy (2016-‐2025) to mobilize adequate resources for predictable sustainable funding for the health care sector and increase public spending on health to 15 percent of government spending, it is unlikely to happen.
Development assistance for health (DAH) Zimbabwe relies to a large extent on DAH. In comparison to countries in the region and countries with similar GNI per capita, Zimbabwe has one of the highest shares of DAH in total health expenditures. DAH is the primary source of financing for health in Zimbabwe, with external resources accounting for more than 50 percent of total health expenditures (THE). DAH also increased in per capita terms from USD 3.3 in 2002 to USD 34 per capita in 20152.
Zimbabwe’s DAH is skewed towards disease-‐specific programs, in particular HIV/AIDS, which absorbed on average 59 percent of total DAH over the period 2010-‐2013. Other large programs benefiting from significant DAH in recent years include child health (8 percent on average), maternal health (9 percent on average) and malaria (7 percent on average). Even if Zimbabwe receives a relatively high share of DAH, opportunities for fiscal space are limited if the majority of resources are earmarked; this limits resources available for other programs and the freedom to work with the remaining, non-‐earmarked external resources.
Introducing new sources of domestic funding for health The success of the AIDS levy in Zimbabwe, an earmarked tax option for domestically funding HIV/AIDS programs, has given impetus for the earmarking of other taxes to increase domestic funding for health. ZimAsset (2013 -‐2018) also suggests several health and non-‐health specific earmarked taxes and a nex tax on airtime and data will be introduced in 2017 to ring-‐fence funding for drugs and equipment. There would also be some tax latitude for Zimbabwe to increase cigarette taxes. World Health Organization (WHO) indeed recommends at least 70 percent of excise tax in the final consumer price, arguing that such tax would induce many users to quit, reduce morbidity and mortality and at the same increasing cigarette tax revenues. Although Zimbabwe’s excise tax on cigarettes is largest compared to its SADC counterparts and comparatively larger total taxes share, its retail price of US$1.30 is among the lowest in the region.
Introducing or expanding Social Health Insurance (SHI) to those uncovered can bring additional revenues, and therefore, be a source of fiscal space. This option is discussed in the country’s new health financing policy. However, in the short term introducing an SHI remains a difficult task given the current economic situation. Key and fundamental reasons working against the introduction of an SHI in
2 Estimate based on Donor mapping

9
the short term range from an economy which is characterized by highly informalized economy, high formal unemployment, flat and in some cases dipping tax and non-‐tax revenues for the past five years, lack of a clear actuarial analysis and plan for the envisaged SHI, to strong objection from the main Labor union of the proposed institutional arrangements for collection and management of the SHI funds. A more comprehensive and broader National Health Insurance (NHI) funded from tax earnings from the formally employed and complemented with earmarked VAT would be more acceptable and feasible form of revenue mobilization for a country with such a very thin formalized employment base.
Options for generating efficiency gains in the public system As there are very little options for generating additional resources given the financial crisis hitting the country, improving efficiency in health spending is paramount. In a context of constrained macroeconomic environment and limited scope for additional resource generation, achieving technical efficiency gains by doing things right represent an attractive option to do more with the same level of resources. This report highlights four major sources of inefficiencies and proposes some corrective actions for: Public Finance Management (including budget preparation, budget execution, transparency, accountability, and procedures); Drugs and equipment; Human resources; and Hospital efficiency.
How much fiscal space? Illustrative scenarios for health spending In the short to medium term, economic growth will not generate fiscal space for health if the GDP share of public spending on health remains unchanged. On current trends, public spending on health per capita would slightly decrease by 2020 in constant terms and reach US$ 27 per capita in 2020, compared to an average of US$ 28 per capita between 2012 and 2014.
Increasing fiscal space for health through reprioritization of expenditures could narrow the funding gap in the health sector. By 2020, reprioritization of health expenditure even to 15 percent of government spending (Abuja target) would not cover any of the National Health Strategy’s costed scenarios 3 as GDP and expenditures are not expected to increase significantly over the period. Reprioritization is also likely to meet some resistance from other sectors of the economy who are competing for minimal resources.
Earmarking cigarette and alcohol excise taxes for health would generate additional financing of US$10 million and US$18 million respectively by 2020. While these options will create some fiscal space, they will only marginally contribute to narrow the funding gap for the National Health Strategy. Earmarking 1% of VAT would generate additional US$138 million by 20204 and could significantly narrow the funding gap. However, the feasibility of earmarking VAT to health rests on the government and other stakeholders accepting such a proposal given the current economic situation and competing interests.
In the short to medium term, the National Health Strategy cannot be implemented without significant support from DAH. Even with the most optimistic scenario for domestic resources mobilization, the funding gap for NHS2 would average $660 million annually. Continued support from development partners to the level registered between 2014 and 2016 would not suffice to close the funding gap. The
3 The MoHCC defined 3 scenarios to assess how cost and impact differ for varying packages, targets and activities related to the National Health Strategy (NHS). Over a five-‐year period, the entire plan would cost $6.9bn, $7.6bn and $8.5bn for NHS 1 (Baseline scenario), NHS2 (High Impact scenario) and NHS 3 (Optimal scenario) respectively. 4 Atchison Actuaries & Consultants with TARSC and MoHCW (2013) Projections for the use of Earmarked Value Added Tax for health financing in Zimbabwe, Atchison Actuaries, TARSC, MoHCC, Harare
10
fact that even most optimistic projections and assumptions cannot cover the cost of NHS2 by 2020 highlights the critical need for efficiency gains within the health sector. If such gains are not achieved, it is likely that the health financing burden will fall on households, creating financial barriers to health care and inequities which would go against the principles of the health financing policy.
Way forward The current financial crisis and macroeconomic situation in Zimbabwe do not constitute an enabling environment for generating fiscal space for health. As overall Government’s revenues and expenditures will not increase in the short to medium term, expanding fiscal space for health would require reprioritization of health in total government spending. Generating sector specific resources represents an attractive way of generating fiscal space for health in the context of Zimbabwe. Expanding revenues from VAT and possibly earmarking them for health seems to be a medium term rather than a short term option.
Getting more out of the current level of resources flowing to the sector by achieving efficiency gains seems to be the most urgent and plausible option for generating fiscal space for health in Zimbabwe given the current financial crisis. Looking at the disease profile and health seeking behaviors of the poorest, it is necessary to reallocate more resources to the lowest levels of care, where most of the vulnerable go and where the majority of cases can be treated at a lower cost. Pulling out some resources from curative to preventive services could also avoid a large burden on health systems and health financing by reducing the incidence of NCDs and communicable diseases which are costly to treat.
Improving budget processes, from planning to execution and implementing PFM reforms could better turn allocated funds into inputs. Implementing recommendations from the AG’s reports related to budget control procedures, accounting procedures, governance and procurement system will be critical to move toward greater technical efficiency. Strengthening program based budgeting and moving away from line item budgeting will allow monitoring progress and tying resources for results.
The large wage bill represents a major constraint for the country as a whole and the health sector in particular and no substantive efficiency gain could be achieved within the sector without implementing the public sector wage reform. It is critical that the Government defines a clear strategy for the management of human resources for health that could include converting some of the posts as more low cost staff are needed at the lower levels of care.
Addressing issues affecting the supply chain would allow achieving major efficiency gains. The existence of parallel distribution systems has a direct impact of costs and availability of drugs. Vertical programs tend to fund drugs in an uncoordinated way which creates parallel distribution systems. Addressing these issues would require reforms from the push system back to the pull system that used to work well before 2008 and greater coordination of various financing streams and distribution systems for commodities.

11
1. Introduction Fiscal space is “the capacity of government to provide additional budgetary resources for a desired purpose without any prejudice to the sustainability of its financial position”5. Creating fiscal space makes additional resources available for government spending on health.
There are different ways in which a government can create fiscal space. Government can generate fiscal space for health through five pillars: (i) establishing conducive macroeconomic and fiscal conditions; (ii) prioritizing health within the government budget; (iii) allocating health sector-‐specific financing from other sources; (iv) negotiating higher development assistance for health; and (v) improving efficiency of outlays for health (Figure 1).
Some options reside primarily outside the control of the health sector. For example, general macroeconomic policies and conditions, political economy and cross-‐sectoral trade-‐offs all impact government’s ability to manage fiscal space. Nevertheless, it is important to analyze implications of general macroeconomic and political factors on the health sector. Areas (iv) and (v) are in the
direct domain of the health sector and merit particular attention given that they provide the potential for sector-‐specific resources6.
Several of the pillars of fiscal space are likely to be correlated in either direction. A recession in the domestic economy may offset increases planned as part of a re-‐prioritization of health in the government budget. It is important to bear in mind that any fiscal space assessment for health analysis ought not to presuppose that additional resources for health would become available or realizable and that sometimes not all pillars are feasible choices. It is entirely plausible that in some countries the government’s resource envelope for health will remain limited in the short-‐ to medium-‐term7.
There is a growing interest in fiscal space analysis for health in low and middle-‐income countries. As countries are faced with the challenge of increasing domestic spending on health in the wake of decreasing external assistance, underfunding of the sector, unmet needs and poor health outcomes, fiscal space analysis is a useful tool for assessing a country’s constraints and identifying areas for generating additional health sector resources.
5 P. Heller, The prospects of creating ‘fiscal space’ for the health sector. Health Policy Plan. (March 2006) 21 (2): 75-‐79 6 Tandon, A. and C. Cashin (2010) Assessing Public Expenditure on Health From a Fiscal Space Perspective, Washington DC, World Bank. 7 Ibid.
FIGURE 1: EXAMPLE OF A FISCAL SPACE DIAMOND
Source: Tandon et al. 2010 Note: the shaded area is illustrative and does not represent the situation of Zimbabwe

12
The fiscal space analysis for the health sector in Zimbabwe is timely and the need for such analysis has been strongly expressed by the government and its development partners. This imperative is justified on multiple grounds. As the country is hit by an economic crisis resulting in lower revenues and cuts in expenditures, understanding the consequences and assessing coping strategies for the health sector is critical. As the country engages in the implementation of its new health sector strategy which sets ambitious targets in terms of health outcomes towards Universal Health Coverage, it is also critical to explore ways to increase resources for the sector, even in a constrained macro-‐fiscal environment. It is also important to highlight the major sources of inefficiencies currently affecting health financing to identify areas for improvement to increase the value for money of resources available in the sector. In that context, the fiscal space analysis will be critical to generate evidence to inform MOFED and MOHCC on short-‐term and medium-‐term options to generate resources for the health sector. It will also provide evidence for government partner consultations on short-‐term options and choices in light of declining public financing for health and a constrained economic growth outlook. The Fiscal Space Analysis is also a critical technical piece to provide evidence to inform the development of the health financing strategy in Zimbabwe. It will complement other technical work on health financing such as the Public Expenditure Review, the National Health Accounts and the Donor Mapping. Finally, beyond the health financing strategy, the Fiscal Space Analysis will also provide evidence to the Government to guide policy dialogue on health sector reforms and planning.
As the world transitions from Millennium Development Goals (MDGs) to Sustainable Development Goals (SDGs), Zimbabwe is left with an unfinished Millennium Development agenda, as the country did not meet some MDG targets. According to the preliminary results for the Zimbabwe DHS for 2015, maternal mortality ratio remains high at 651 deaths per 100,000 (versus target 174 deaths per 100,000 live births); under five child mortality rate is at 69 deaths (versus target of 43 per 1000 live births); the nutritional status of children remains problematic; and HIV and AIDS, TB and malaria remain major causes of morbidity and mortality.
Total health expenditure per capita compares favorably with the Sub-‐Saharan Africa average but spending is potentially regressive due to a high burden of household out-‐of-‐pocket (OOP) expenditures at point of care. The 2015 NHA estimated that OOP amounted to $24.5 and 26% of THE. MOHCC spending on health accounted for 7–8 percent of total government spending over the past years and most government expenditure on health goes to salaries. As per the health PER data (World Bank, 2015), Official Development Assistance (ODA) disbursements for health increased by a factor of five between 2002 and 2010 and further doubled in 2012 to reach US$428 million; this is equivalent to the total amount spent by the government on budget that year. Because ODA is unpredictable and unsustainable, the Government of Zimbabwe (GOZ) must explore innovative and sustainable ways of funding, such as subsidies, exemptions or prepayment mechanisms, and gradually reduce its heavy reliance on external funding and out of pocket payments.
Sluggish overall economic performance and recent economic developments further complicate the situation. Economic growth fell to 1.1 percent in 2015 and declined further in 2016, partly due to the continued drought and financial crisis. Growth is held back by low investment and ongoing balance of payment adjustment. The country is in extensive debt. Soaring unemployment means the majority of the population is engaged in informal work. Such a macro-‐economic environment requires innovation and effective partnerships between government and various partners—including communities—in both funding and providing health services to the population. In the absence of policy reforms, the outlook remains difficult and per capita income should barely remain constant. In that context, innovative fiscal policy is needed (World Bank, 2016).

13
In 2016 the GOZ embarked on development of a comprehensive Health Financing Policy. The goals of the policy are to:
• Mobilize adequate resources for predictable sustainable funding for the health care sector; • Ensure effective, equitable, efficient and evidence based allocation and utilization of health
resources; • Enhance the adequacy of health financing and financial protection of households and ensure
that no-‐one is impoverished through spending on health by promoting risk pooling and income cross subsidies in the health sector;
• Ensure the purchasing arrangements and provider payment methods emphasize incentivizing provision of quality, equitable and efficient health care services;
• Strengthen institutional framework and administrative arrangements to ensure effective, efficient and accountable links between revenue generation and collection, pooling and purchasing of health services.
The Ministry of Health and Child Care (MoHCC) is also developing a National Health Strategy (2016–2020) to guide the next five years of government health sector intervention. As part of this process, government, with the support of the World Bank, costed Zimbabwe’s National Health Strategy (NHS) for the period 2016 to 2020 and defined three scenarios with varying levels of ambition to assess how cost and impact differ for alternative packages, targets and activities. Over the five-‐year period, the entire plan would cost $6.9bn, $7.6bn and $8.5bn for the three scenarios respectively. This allows for informed decision-‐making and selection of policy scenario and target options to incorporate into final plans for activities and budgets.

14
2. Macroeconomic conditions and fiscal space for health The macroeconomic environment impacts fiscal space for health. One key macroeconomic determinant of fiscal space is economic growth. National income is a key determinant of public and private spending on health because economic growth typically increases public revenues and expenditures and allows for increased public spending on health. Additional macroeconomic factors of importance for fiscal space include a country’s debt level, deficit, inflation and labor market performance.
Between 2010 and 2014, Zimbabwe’s economy enjoyed strong growth but recent economic updates point to a significant downturn in 2015 and 2016. After the 2009 crisis, the dollarization stimulated the economic growth between 2009 and 2012 but macro challenges have since deepened and growth has declined. Economic growth fell to 1.1 percent in 2015 and further declined to a projected 0.5 percent in 2016. Since 2015, per capita GDP growth is negative. Per capita GDP amounted to US$ 872 in 2015 and it is expected to decline in constant terms to reach $759 in 2021 (Figure 2) 8. Between 1998 and 2015, Zimbabwe’s mean GDP growth was lower than Sub-‐Saharan Africa and Low Income Country averages and below other countries in the region. Zimbabwe also has the most volatile GDP growth in the region as reflected by the high standard deviation (Table 1). The inflation remained negative due to the appreciating U.S. dollar and lower commodity prices. This price adjustment however has had only limited impact on
competitiveness (IMF 2016). As a result of the financial crisis and drop in agricultural output, poverty is increasing: the number of extremely poor increased from 3 million in 2012 to 3.23 million in 2015 and is expected to increase further to 3.36 million in 2016.
The financial crisis dampens economic prospects. The crisis stems from a large increase in Government borrowing from March 2015 to June 2016 from the Banking sector, leading to severe liquidity shortages in the financial sector. Zimbabwe’s external position is challenging: imports are expected to fall by nearly a fifth in 2016 due to the rising cost of capital and temporary restrictions on imports of basic goods competing with local productions; exports are also expected to fall by 9 percent in 2016 as a result of the lack of credit and continued drought. Economic growth is expected to be negative in 2017 and the IMF forecasts a 0.4 percent average economic growth between 2017 and 2021 (Figure 3). Inflation is projected to remain negative in 2016, but to pick up over the medium term. According to the IMF, risks in the medium term will stem mainly from continued adverse weather conditions, fiscal challenges, weak commodity prices and policy implementation in a difficult political environment.
8 IMF, October 2016 WEO.
TABLE 1: INTERNATIONAL AND REGIONAL COMPARISON OF GDP (1998-‐2015 AVERAGE) GDP Growth GDP per capita Mean SD Mean SD
Angola 7.49 5.5 4.72 5.7 Botswana 4.16 4.3 2.87 4.3 DRC. 4 4.7 1.18 4.7 Lesotho 3.73 1.3 3.49 1.3 Madagascar 2.62 5.3 -‐0.25 5.4 Malawi 4.09 3.1 1.47 3.1 Mauritius 3.81 1.5 3.36 1.5 Mozambique 6.93 1.9 4.28 1.9 Namibia 4.15 1.6 2.79 1.7 South Africa 2.93 1.7 1.59 1.8 Swaziland 2.94 1.1 1.67 1.4 Tanzania 5.93 1 3.55 1.1 Zambia 6.05 1.7 3.37 1.7 Zimbabwe -‐1.75 9.2 -‐2.5 8.9 Low income 4.31 6.7 2.22 7.4 Sub-‐Saharan Africa 3.97 6.6 1.62 6.9
Source: World Development Indicators database Note: data present averages for the period 1998-‐2015

15
FIGURE 2: GDP PER CAPITA (1998-‐2021)
FIGURE 3: ANNUAL ECONOMIC GROWTH (2009-‐2021)
Source: IMF WEO Source: World Bank PER (for 2015 and 2016) and IMF
WEO
In Zimbabwe, economic growth has a positive impact on public spending for health. Public spending has grown faster than GDP per capita in the past. Over 2009-‐2013, the elasticity of public spending on health to GDP per capita was 2.1 implying that for every 1 percent change in GDP per capita, public spending on health changed by 2.1 percent (Figure 4).
Fiscal revenues, which have been a major source of budget financing, are leveling off and the financial crisis is leading to a significant deterioration in the Government’s fiscal position. The country’s revenue collection
recovered significantly between 2011 and 2015 and the revenue-‐to-‐GDP-‐ratio is now comparable to most regional peers. In 2015, revenues were estimated at 27 percent of GDP (Figure 5). Most revenues in Zimbabwe are tax revenues (Figure 6) and tax revenue collection as a percentage of GDP was the second highest among SADC countries between 2011 and 2015. Independent of increases in GDP, higher revenue share of GDP could result in fiscal space even if there was no change in health’s share of general government expenditure. However Zimbabwe’s tax collection as a share of GDP is already high by the Sub-‐Saharan Africa standard and IMF projections for government revenues predict a decline and stabilization around 23 percent of GDP for the period 2017-‐2021. During the same period, expenditures are projected to decline and stagnate at 26 percent of GDP generating a 3 percent annual deficit on average. The scope for fiscal space generation from revenues is thus insignificant. However, the increasing revenues from mineral rents could be a potential source to tap (Figure 7). The IMF noted that increasing transparency and accountability in the diamond industry could ensure a meaningful and monitorable contribution of the sector to government finances9.
9 IMF, 2016. IMF Country report No. 16/109
0 200 400 600 800
1,000 1,200 1,400
1998
2000
2002
2004
2006
2008
2010
2012
2014
2016
2018
2020 GDP pe
r capita
(Con
stant
USD
)
7.5
11.4 11.9 10.6
4.5 3.8
1.1 0.5
(2.5)
0.0 1.3 1.5 1.6
-‐4
-‐2
0
2
4
6
8
10
12
14
2009
2010
2011
2012
2013
2014
2015
2016
2017
2018
2019
2020
2021
Real GDP
growth (ann
ual %
change)
FIGURE 4: ELASTICITY OF PUBLIC HEALTH SPENDING TO GDP PER CAPITA (2009-‐2013)
Elasticity=2.1
1015
2025
30
Gov
ernm
ent s
pend
ing
on h
ealth
per
cap
ita in
US
D
700 800 900 1000 1100GDP per capita in USD
Source: World Development Indicators database

16
FIGURE 5: TREND REVENUES AND EXPENDITURES GDP RATIOS
FIGURE 6: REVENUES BY SOURCE (AS A SHARE OF GDP)
Efforts should focus on improving the efficiency of tax administration rather than increasing tax pressure. Zimbabwe is leading SADC countries in VAT collection as a share of GDP. Zimbabwe’s VAT rate is among the top six at 15 percent – the required rate under SADC macroeconomic convergence criteria. The IMF recommended that the review of the tax system focus on broadening the tax base, particularly the VAT, and on improving tax administration (e.g. simplifying procedures and addressing areas where collection efficiency can be improved). Finally, raising non-‐tax revenues, currently representing one percent of GDP and below potential, could also be an option for generating additional resources10. This could include foreign aid, loans, revenue from state-‐owned enterprises, revenues from investment funds, revenues from sales of state assets, etc.
The growth of the informal economy hinders broadening the tax base. Unemployment has been rising in recent years, and employment has been shifting to the informal sector. In 2014, the unemployment rate rose to 11.3 percent, from 10.7 percent in 2011 (ZIMSTAT 2015). Of the 6.3 million employed, 94.5 percent were in informal employment, compared with 84 percent in 2011 (ZIMSTAT 2015). Moving forward, it is necessary to encourage and incentivize the informal sector to transition from informality to formality to increase contributions to the national treasury.
10 IMF, 2016. IMF Country report No. 16/109
0
5
10
15
20
25
30
35
% of G
DP
General government revenue General government total expenditure
0%
10%
20%
30%
2012 2013 2014 2015 (est.)
2016 2017 2018 2019 2020 2021
% of G
DP
Personal income tax Corporate income tax Other direct taxes Customs Excise VAT Other indirect taxes Non tax revenue
02
46
810
Rent
as %
of G
DP
1990 1995 2000 2005 2010 2015year
Mineral rents (% of GDP) Coal rents (% of GDP)Forest rents (% of GDP)
Source: IMF WEO database
FIGURE 7: SELECTED RENTS AS SHARE OF GDP (1990-‐2015)

17
Zimbabwe’s large public debt burden is a significant constraint on economic growth. High levels of deficit and debt pose a threat to fiscal sustainability (i.e. a government’s ability to maintain current fiscal policies, such as spending and tax policies, without any major future adjustments). Zimbabwe is currently servicing its domestic public debt but the country continues to accumulate arrears on most of its external debt which is estimated at 60 percent of the GDP. In the coming years, Zimbabwe’s external debt is expected to average 58 percent of GDP, way above the threshold recommended by IMF for low-‐ and lower-‐middle-‐income countries11. The reengagement process could potentially bring fresh resources to the country. However, in addition to repaying arrears to International Financial Institutions, a sufficiently ambitious reform program and broad support from creditors are also prerequisite for a financial arrangement with the IMF.
In sum, the current financial crisis of Zimbabwe and the challenging macroeconomic prospects offer limited potential for greater fiscal space due to slow growth, high debt and high taxation levels. In such a context, only marginal gains can be obtained even if the elasticity of public health expenditure to GDP is relatively favorable to the sector. Rising unemployment and growth of the informal sector can further impede the already restricted fiscal space. Concerted efforts to improve efficiency in revenue collection and expenditure will make better use of existing resources in the medium term.
11 IMF, October 2016 WEO

18
3. Prioritizing health in the government’s budget In theory, the limited fiscal space for health generated from economic growth and revenue collection can be supplemented by increasing the budget share allocated to health. Government spending on health often reflects overall government commitment to and prioritization of health—the budget for which competes with other sectors such as education, infrastructure or agriculture.
In Zimbabwe, government spending on health—as a share of total government spending—is low compared to that of countries in the region and of a similar income level. In 2014, in the SADC group, only the Democratic Republic of Congo (DRC) allocated fewer public resources for health as a share of total government spending than Zimbabwe12. Public spending on health is not only a matter of resources available. Mozambique, Madagascar, Zambia, Tanzania, Lesotho and Malawi, which have comparable income levels, each spend more on health than Zimbabwe and get closer to the Abuja target of 15 percent budget allocation to health, reflecting their governments’ commitment to the sector (Figure 8). Government spending on health in Zimbabwe is showing signs of weakness from 2013 onwards. In the past five years, it reached an average of 7.3 percent of government spending (Figure 9). FIGURE 8: INTERNATIONAL COMPARISON: GOVERNMENT SPENDING ON HEALTH (2014)
FIGURE 9: TREND IN GOVERNMENT SPENDING ON HEALTH (2004-‐2014)
Source: MOFED (2015)
In terms of spending, Zimbabwe’s government tends to prioritize other major sectors over the health sector. The share of health affairs and services in central government expenditures decreased from 8 percent in 2009 to 6 percent in 2014. Over the same period the share of education affairs and services rose from 22 percent to 25 percent; in 2014, central government spending on education was more than four times the level of spending on health. Spending on other priority sectors, such as general public services, public order, defense and agriculture fluctuated over the period (Figure 10).
12 This low level of public spending can partially be explained by the fact that DAH is mostly off-‐budget in Zimbabwe.
BWA
LSO
MDG
MOZMUS
MWI
NAM
SWZ
TZA
ZAF
ZAR
ZMB
ZWE
05
1015
20
Gov
. spe
ndin
g on
hea
lth a
s %
Tot
al G
ov. s
pend
ing
0 2000 4000 6000 8000 10000GNI per capita
Source: World Development Indicators database
8.2 7.6 8
7.3 6.6 6.5
8
2009 2010 2011 2012 2013 2014 2015
Gov spen
ding on He
alth as a
share of Total Gov sp
ending
Year

19
FIGURE 10: CENTRAL GOVERNMENT SPENDING ON HEALTH RELATIVE TO OTHER PRIORITY SECTORS (2009-‐2014)
Source: National accounts 2009-‐2014 reports (ZimStat 2015)
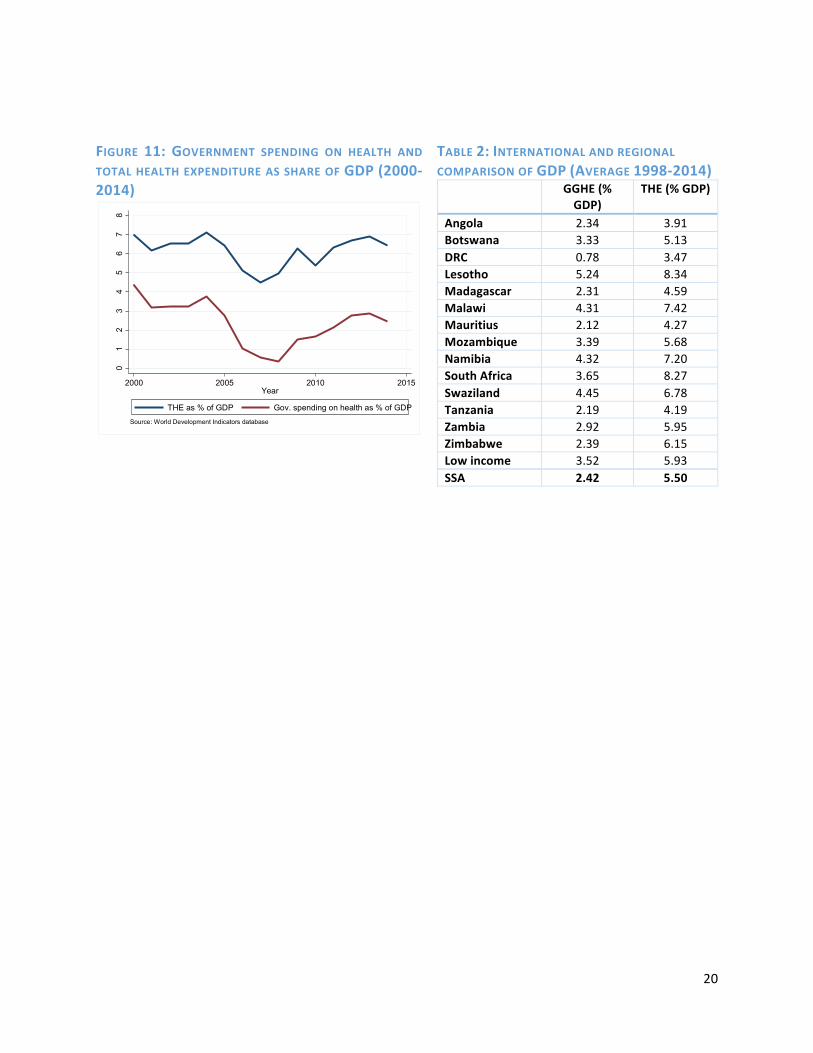
Government spending on health as a share of GDP is lower than the pre-‐crisis level, reflecting variation in prioritization of health. In 2014, government spending on health reached 2.47 percent of GDP, compared to 2.74 percent in 2005 and 4.37 percent in 2000. During the crisis, spending on health as a share of GDP dropped significantly, but increased when the economy began to recover, yet not to pre-‐crisis levels. Interestingly, the trend in total health expenditure followed a similar pattern over time (Figure 11). Between 1998 and 2014, Zimbabwe’s public spending on health averaged 2.39 percent of GDP, a level comparable to SSA average but 1 percentage point lower than the average for LIC (3.52 percent) (Table 2).
Current trends suggest limited opportunities to improve prioritization of the health sector despite the need for increased resources to implement the National Health Strategy Historical data shows that in difficult economic times lower priority is given to the health sector, and an increased share of the budget is used for debt servicing (interest payment). MoHCC budget for 2017 of USD 282 million (out of which only USD 59 million are non-‐wage expenditures) reflect the further decline of MoHCC budget in absolute terms and the absence of reprioritization in favor of the health sector as it continues to represent 8 percent of total government budget. It is worth mentioning though that MoHCC is making progress in evidence-‐based planning and budgeting as it was able to use the NHS costing and other strategic documents to support its pitch during the December 2016 budget discussions. This however did not translate into increased priority as MoFED was faced with a difficult economic situation and could only ensure key budget categories for each sector. Therefore, despite the stated objective of the health financing strategy (2016-‐2025) to mobilize adequate resources for predictable sustainable funding for the health care sector and increase public spending on health to 15 percent of government spending, it is unlikely to happen.
22% 23% 25% 26% 25% 25%
8% 8% 8% 7% 7% 6%
0%
10%
20%
30%
40%
50%
2009 2010 2011 2012 2013 2014
% of C
entral Governm
ent
expe
nditu
re
General public services Defense Public order and safety Educaoon Health Agriculture, forestry, fishing and hunong
20
FIGURE 11: GOVERNMENT SPENDING ON HEALTH AND TOTAL HEALTH EXPENDITURE AS SHARE OF GDP (2000-‐2014)
TABLE 2: INTERNATIONAL AND REGIONAL COMPARISON OF GDP (AVERAGE 1998-‐2014) GGHE (%
GDP) THE (% GDP)
Angola 2.34 3.91 Botswana 3.33 5.13 DRC 0.78 3.47 Lesotho 5.24 8.34 Madagascar 2.31 4.59 Malawi 4.31 7.42 Mauritius 2.12 4.27 Mozambique 3.39 5.68 Namibia 4.32 7.20 South Africa 3.65 8.27 Swaziland 4.45 6.78 Tanzania 2.19 4.19 Zambia 2.92 5.95 Zimbabwe 2.39 6.15 Low income 3.52 5.93 SSA 2.42 5.50
01
23
45
67
8
Shar
e of
GD
P (%
)
2000 2005 2010 2015Year
THE as % of GDP Gov. spending on health as % of GDP
Source: World Development Indicators database

21
4. Development assistance for health (DAH)
Increasing revenues through development assistance for health (DAH) may be an option for increasing fiscal space. While the level of such assistance is important, the predictability, flexibility and composition of the assistance are equally important. A highly unpredictable inflow of foreign aid renders long-‐term planning a challenge, and foreign aid that comprises primarily of loans increases debt-‐servicing costs. Similarly, foreign aid that is tied to specific programs (such as immunization or HIV/AIDS) may lack the flexibility to meet to country’s changing demand for overall health resources.
Zimbabwe relies to a large extent on DAH. In comparison to countries in the region and countries with similar GNI per capita, Zimbabwe has one of the highest shares of DAH in total health expenditures (Figure 12). DAH is the primary source of financing for health in Zimbabwe, with external resources accounting for more than 50 percent of total health expenditures (THE) (Figure 13). As observed in other developing countries, rising DAH may give the perception that enough resources exist in the sector because of donor contributions and Ministries of finance consequently channel resources that would have been allocated for health to other sectors. To minimize this problem, Zimbabwe could more
systematically reflect resources from development partners as part of country’s annual health budget Total DAH has increased significantly over time. DAH peaked after 2005 to reach more than USD 430 million in 2012 (Figure 14). DAH also increased in per capita terms from USD 3.3 in 2002 to USD 34 per capita in 201513.
Zimbabwe’s DAH is skewed towards disease-‐specific programs, in particular HIV/AIDS, which absorbed on average 59 percent of total DAH over the period 2010-‐2013. Other large programs benefiting from significant DAH in recent years include child health (8 percent on average), maternal health (9 percent on average) and malaria (7 percent on average) (Figure 15). Even if Zimbabwe receives a relatively high share of DAH, opportunities for fiscal space are limited if the majority of resources are earmarked; this limits resources available for other programs and the freedom to work with the
13 Estimate based on MoHCC Round 1 resource mapping (2016)
FIGURE 12: REGIONAL COMPARISON: EXTERNAL ASSISTANCE AS A SHARE OF TOTAL HEALTH EXPENDITURE (2011)
FIGURE 13: TOTAL HEALTH SPENDING BY FUNDING SOURCE (2014-‐2017)
Source: MoHCC. Round 2 resource mapping (2016) Note: 2014 and 2015 data are actual expenditures. 2016 and 2017 data are planned expenditures.
BWA
LSO
MDG
MOZ
MUS
MWI
NAM
SWZ
TZA
ZAF
ZAR
ZMB
ZWE
020
4060
80
Ext
erna
l ass
ista
nce
as %
TH
E (2
011)
0 2000 4000 6000 8000GNI per capita (2011)
Source: World Development Indicators database

22
remaining, non-‐earmarked external resources. The fact that most DAH is off-‐budget also limits opportunities for expanding fiscal space, as off-‐budget resources make it difficult to plan and track resources spent on health.
FIGURE 14: TOTAL DEVELOPMENT ASSISTANCE ON HEALTH TO ZIMBABWE (1990-‐2013)
Source: IHME
FIGURE 15: DEVELOPMENT ASSISTANCE ON HEALTH ON MAJOR PROGRAMS (2000-‐2013)
The reliance on external funding for key cost categories represents a challenge in terms of sustainability and predictability of health system funding. The MoHCC budget is mostly spent on salaries and benefits with the remaining share of expenditure meeting other related operational costs and capital costs; other costs are covered by external funders. Funding from external partners is critical for drugs (41 percent of DAH compared to 6 percent of MoHCC budget). Some critical items—such as research and M&E or infrastructure and equipment related expenses—are only paid for by DAH (Figure 16).
External funding is skewed towards a few health programs, generating heavy reliance on DAH for those programs and a potential risk of funding gap in the event of decreasing DAH. HIV, vaccines, malaria, reproductive and maternal, neonatal and child health (MNCH) and TB programs are highly donor dependent (Figure 17) and there is no graduation plan for decreasing external funding. This pattern creates a real tension around Zimbabwe’s health financing.
0
100
200
300
400
500
Mill
ions
of 2
015
US
Dol
lars
1990 1993 1996 1999 2002 2005 2008 2011 2014Year
010
020
030
040
050
0
DA
H in
mill
ion
US
D
2000 2001 2002 2003 2004 2005 2006 2007 2008 2009 2010 2011 2012 2013
HIV/AIDS Child Health Maternal Health Malaria Tuberculosis Health system strengthening

23
FIGURE 16: FUNDING BREAKDOWN BY COST CATEGORIES (2016)
Source: MoHCC. Round 2 resource mapping (2016)
FIGURE 17: FUNDING BREAKDOWN BETWEEN GOVERNMENT AND EXTERNAL FUNDERS BY PROGRAM FUNCTION (2016)
While DAH has provided fiscal space for health and remains an important source of funding, future increases are unlikely. Figure 13 suggests that DAH is stagnating or decreasing in 2016 in comparison to previous years. Commitments to the Health Development Fund (HDF) for the period 2016-‐2018 also reveal a large funding gap between 2016 and 2018 (Figure 18). Funding commitments are far lower than costed interventions and the gap increases over time, revealing the predictability concerns with DAH. This is in line with DAH trends observed in other countries. Donor countries tend to reduce their levels of external assistance as a result of financial crisis. The international community and regional peers recognize the need to mobilize more domestic resources for health and to improve the value for money in existing health care spending14.
14 The 2012 Tunis Declaration signed by Ministers of Finance and Health from around 40 African countries argues for mobilization of domestic resources for health and for achieving greater accountability and value for money in delivering health services.
FIGURE 18: HDF FUNDING COMMITMENTS AND GAP (2016-‐2018)
Source: MoHCC and UNICEF
32 18 14
103 136 136
-‐ 20 40 60 80 100 120 140 160
2016 2017 2018
Million US$
Funding commitments Funding gap

24
5. Introducing new sources of domestic funding for health From a theoretical point of view and when considering fiscal space for health, one of the most intuitive options to generate additional resources for health is to introduce new taxes which could be earmarked for financing health care. From the perspective of the health sector, earmarked taxes are useful because they can insulate health spending from other competing publicly funded activities and this can be particularly important for countries with low or unstable spending in health. There is however an ongoing debate about whether earmarking is desirable and, in general, Ministries of Finance prefer not to have money that is tied to a sector or specific purpose. Fiscal policy goes beyond the scope of the health sector and the decision whether additional revenues generated from new taxes or increase in taxes should be earmarked or not to a specific purpose rests with the Ministry of Finance. The evidence on earmarking is indeed mixed and depends on country specific context and political economy. Furthermore, it is worth mentioning that revenues earned from earmarked sources may not be ‘additional’ in the medium to long term since the Ministry of Finance can lower the trajectory of funding from traditional revenue sources. Exploring the scope for increased domestic funding from tax revenues is however critical for a fiscal space analysis. Even in the absence of earmarking, the health sector would ultimately benefit from increased revenue collection. This section reports the results of previous analyses related to raising taxes that could potentially be earmarked to health and aims to show the potential for raising additional resources in Zimbabwe, in a context of decreasing revenues. When contemplating such options, it is critical to assess the potential regressive nature of tax increases which could result in increased inequalities. The success of the AIDS levy in Zimbabwe, an earmarked tax option for domestically funding HIV/AIDS programs, has given impetus for the earmarking of other taxes to increase domestic funding for health. The National AIDS Council and the AIDS levy were introduced in 2000 through an Act of Parliament15. The levy is a 3% flat tax charged on companies and individuals’ amount of income tax assessed16. Since dollarization in 2009, the annual tax revenue has risen from US$5.7 million to US$38 million in 2015. Learning from this experience, additional health-‐specific resources could take the form of earmarking or levying taxes on consumption goods (such as alcohol and tobacco) that adversely affect health. Earmarking can involve dedicating an entire tax to fund a particular program (for e.g., a dedicated payroll tax for SHI) or setting aside a fixed proportion of a particular tax to fund a program. As of January 2017, a 5 percent health levy will also be introduced on airtime and data, and will be earmarked to drugs and equipment as a way to ring-‐fence funding for critical health services. ZimAsset (2013 -‐2018) proposes several health and non-‐health specific earmarked taxes. Since 2013 a number of proposals have been put to the MoHCC by its partners to increase domestic funding for health given the unpredictability and the sustainability of external assistance. These included the use of earmarked taxes for ‘sin’ products such as alcohol and cigarettes, earmarking of Value Added Tax (VAT) revenues, earmarking of mobile excise taxes, earmarking of mineral taxes, earmarking of road taxes, earmarking of fuel taxes and earmarking of third party insurance premiums. These options are also being discussed among ministries such as Education, Labor and Social Welfare and Agriculture, calling for increased coordination. Since 2015, the MoHCC has worked to assess the feasibility of and potential revenues that would accrue from such earmarked taxes. The MoHCC, the Training and Research Support Centre, Atchison Actuaries, and the Zimbabwe Economic Policy Analysis and Research Unit carried out studies for raising domestic revenues for Universal Health Coverage (UHC) in Zimbabwe. The studies
15 The National AIDS Council of Zimbabwe Act Chapter 15:14 of 2000 16 National AIDS Council Section 14 subsection 14 and 15 of the Finance Act, Chapter 23:04

25
explored possibilities for earmarking excise taxes on cigarettes, beer and fuel as well as VAT and mining company taxes. The National Association of Non-‐Governmental Organizations together with UNICEF also looked at the possibility of earmarking excise taxes on cigarettes and beer to fund child health and child education initiatives. The following section provides a summary and projections of some of the proposed areas for increasing domestic funding for health. There would be some tax latitude for Zimbabwe to increase cigarette taxes. World Health Organization (WHO) indeed recommends at least 70 percent of excise tax in the final consumer price, arguing that such tax would induce many users to quit, reduce morbidity and mortality and at the same increasing cigarette tax revenues. The comparative analysis of the cigarette retail prices and taxes for Zimbabwe and its SADC counterparts shows that there is still enough room for Zimbabwe to increase its cigarettes taxes (Table 3). Although Zimbabwe’s excise tax on cigarettes is largest compared to its SADC counterparts and comparatively larger total taxes share, its retail price of US$1.30 is among the lowest in the region. Low cigarette prices have possibly contributed to the growth of cigarette smuggling to neighboring countries. Harmonizing the pricing and taxes rates will go a long way in curtailing cigarettes consumption and cigarettes smuggling in the region. However, of all SADC members, none has any part of its taxes earmarked for health. TABLE 3: RETAIL PRICES AND TAXES FOR A PACK OF 20 CIGARETTES, 2014
Country US$ Price Specific tax Ad Valorem Excise Tax17
Value added Tax
Import duty Other Taxes Total taxes
Angola 2.06 0.00% 0.00% 22.90% 0.00% 0.76% 23.66% Botswana 3.08 42.44% 9.53% 10.71% 0.00% 0.00% 62.68% Lesotho 3.27 33.15% 0.00% 13.04% 0.00% 0.00% 46.20% Malawi 2.01 14.53% 0.00% 4.09% 2.06% 0.00% 20.68% Mozambique 0.98 16.33% 0.00% 14.53% 0.00% 0.00% 30.86% Namibia 3.74 29.00% 0.00% 3.80% 0.00% 0.00% 32.80% South Africa 2.97 36.52% 0.00% 12.28% 0.00% 0.00% 48.80% Swaziland 3.27 33.14% 0.00% 20.00% 0.00% 0.00% 53.14% Zambia 1.47 0.00% 20.00% 1.36% 0.00% 0.00% 21.36% Zimbabwe 1.30 23.08% 23.95% 13.04% 0.00% 0.00% 60.08% Source: WHO Tobacco Atlas 2015 Existing projections for earmarked taxes showed modest to above average potential earnings from some of the health and non-‐health specific taxes. Scenario and simulation analysis were used to model economic and revenue trends to inform discussions on options for the optimal level of earmarked taxes in each case for health financing.18 Results show that increasing excise taxes on cigarettes by 25% would raise US$10 million by 2022 (Table 4). Similarly, increasing excise taxes on beer and wines by 25% would raise US$18 million and US$3 million by 2022 respectively (Table 5). A follow up stakeholder analysis
17 Ad Valorem Tax is tax based on the determined value of the item being tax, and in this case it referred to either sales tax or Value Added Tax. 18 The simulation models included analysis of tax changes in a dynamic model where income changes; and various tax rates and various elasticities to provide revenue forecasts. For the fuel tax, cigarette tax and alcohol tax, the calculations took into consideration the following dynamic changes: Implications of a change in tax; Additional revenue generated following the tax change; Change in consumption of the taxed commodity; Change in demand for the taxed commodity; and change in economic activity. Potential future revenue were calculated using expected GDP growth as projected by the IMF.

26
carried out by the MoHCC19 and its partners on earmarked taxation showed huge support by those in the health sector and potential opposition by the producers and suppliers of the listed products. TABLE 4: CIGARETTE EARMARKED NOMINAL REVENUE PROJECTIONS US$ (2014 – 2022)
Excise tax increase on baseline
2014 2015 2016 2017 2022
+5% 1 265 185 1 379 140 1 509 992 1 866 659 2 016 778 +10% 2 530 369 2 758 280 3 019 983 3 733 390 4 033 556 +25% 6 325 923 6 895 701 7 549 959 9 333 475 10 083 889 Source: MoHCC, TARSC and ZEPARU 2013 TABLE 5: ALCOHOL EARMARKED NOMINAL REVENUE PROJECTIONS US$ (2014 – 2022)
Excise tax increase on baseline
2014 2015 2016 2017 2022
Beer +5% 2 414 436 2 622 291 2 860 964 3 511 590 3 785 342 +10% 4 828 872 5 244 582 5 721 928 7 023 181 7 570 684 +25% 12 072 180 13 111 455 14 304 821 17 557 954 18 926 710 Wines and Spirit +5% 402 438 448 020 500 360 643 042 703 074 +10% 804 875 896 040 1 000 720 1 286 083 1 406 149 +25% 2 012 185 2 240 099 2 501 801 3 215 208 3 515 373 Source: MoHCC, TARSC and ZEPARU 2013 Introducing or expanding Social Health Insurance (SHI) to those uncovered can bring additional revenues, and therefore, be a source of fiscal space. This option is discussed in the country’s new health financing policy. Currently 9 percent of the total population is covered under any form of health insurance20. Current figures show that there are no gender differentials in the coverage of health insurance, while the age group benefiting most (17 percent) is the 45-‐49 years. Those on paid-‐employee permanent benefited the most (58.9 percent) compared to the casual workers, own account workers and members of cooperatives. Of the formally employed, 39.2 percent are on medical insurance, while for the informally employed only 8.6 percent are on medical insurance. In countries with government-‐subsidized national health insurance schemes, increasing the number of enrollees (and therefore increasing the amount of contributions) increases health-‐specific resources. In Zimbabwe, it would be fundamental to target potential sources of revenue that enable participation of both formally and non-‐formally employed population groups. However, in the short term introducing an SHI remains a difficult task given the current economic situation. Key and fundamental reasons working against the introduction of an SHI in the short term range from an economy which is characterized by highly informalized economy, high formal unemployment, flat and in some cases dipping tax and non-‐tax revenues for the past five years, lack of a clear actuarial analysis and plan for the envisaged SHI, to strong objection from the main Labor union of the proposed institutional arrangements for collection and management of the SHI funds.
19 TARSC, Atchison Consulting and MoHCC (2013) Analysis of stakeholders in Domestic Health Financing. 20 Zimstat Labour Force Survey 2014
27
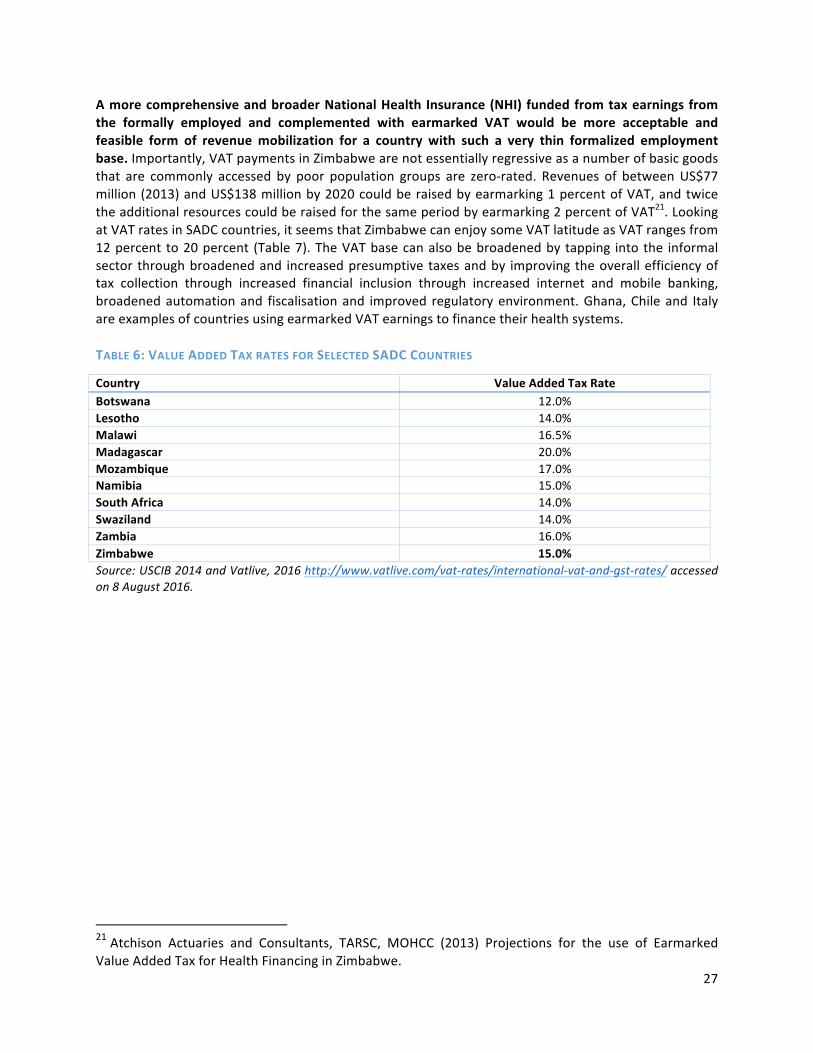
A more comprehensive and broader National Health Insurance (NHI) funded from tax earnings from the formally employed and complemented with earmarked VAT would be more acceptable and feasible form of revenue mobilization for a country with such a very thin formalized employment base. Importantly, VAT payments in Zimbabwe are not essentially regressive as a number of basic goods that are commonly accessed by poor population groups are zero-‐rated. Revenues of between US$77 million (2013) and US$138 million by 2020 could be raised by earmarking 1 percent of VAT, and twice the additional resources could be raised for the same period by earmarking 2 percent of VAT21. Looking at VAT rates in SADC countries, it seems that Zimbabwe can enjoy some VAT latitude as VAT ranges from 12 percent to 20 percent (Table 7). The VAT base can also be broadened by tapping into the informal sector through broadened and increased presumptive taxes and by improving the overall efficiency of tax collection through increased financial inclusion through increased internet and mobile banking, broadened automation and fiscalisation and improved regulatory environment. Ghana, Chile and Italy are examples of countries using earmarked VAT earnings to finance their health systems. TABLE 6: VALUE ADDED TAX RATES FOR SELECTED SADC COUNTRIES
Country Value Added Tax Rate Botswana 12.0% Lesotho 14.0% Malawi 16.5% Madagascar 20.0% Mozambique 17.0% Namibia 15.0% South Africa 14.0% Swaziland 14.0% Zambia 16.0% Zimbabwe 15.0% Source: USCIB 2014 and Vatlive, 2016 http://www.vatlive.com/vat-‐rates/international-‐vat-‐and-‐gst-‐rates/ accessed on 8 August 2016.
21 Atchison Actuaries and Consultants, TARSC, MOHCC (2013) Projections for the use of Earmarked Value Added Tax for Health Financing in Zimbabwe.

28
6. Options for generating efficiency gains in the public system Increased efficiency creates fiscal space by increasing savings within the existing envelope rather than by expanding the resource envelope. The World Health Report (2010) identifies ten major sources of inefficiency: underuse of generic medicines and higher than necessary prices for medicines; use of substandard and counterfeit medicines; inappropriate and ineffective use of medicines; supplier-‐induced demand and overuse of some services; inappropriate staff mix and unmotivated workers; inappropriate hospital admissions and length of stay; low use of infrastructure such as hospital beds; medical errors and suboptimal quality of care; waste and fraud; and inefficient mix and inappropriate level of intervention.
Two components of efficiency are generally differentiated: technical efficiency and allocative efficiency. Technical efficiency is often referred to as “doing things right” and allocative efficiency as “doing the right things.” As the central government’s current budget allocations to the MoHCC is almost exclusively spent on salaries, there is however little room to address non-‐human resources related inefficiencies. Still, as there are very little options for generating additional resources given the financial crisis hitting the country, improving efficiency in health spending is paramount. Areas for improvement discussed below are in line with the stated objectives of the health financing strategy, in particular those related to i) ensuring effective, equitable, efficient and evidence based allocation and utilization of health resources; ii) ensuring the purchasing arrangements and provider payment methods emphasize incentivizing provision of quality, equitable and efficient health care services; and iii) strengthening institutional framework and administrative arrangements to ensure effective, efficient and accountable links between revenue generation and collection, pooling and purchasing of health services.
Allocative efficiency Assessing allocative efficiency helps to understand the extent to which spending patterns align with the country’s health needs. For example, it is important to see whether there are opportunities to change the mix of inputs such as staff, buildings and supplies, or allocation across primary, secondary and tertiary care services to address conditions that contribute most to a country’s burden of disease.
The burden of disease in Zimbabwe is largely dominated by communicable diseases that can be addressed at low cost at the lowest level of care. In 2013, only 25 percent of deaths were caused by non-‐communicable diseases. HIV/AIDS and TB were the primary cause of deaths (35 percent) followed by common infectious diseases such as diarrhea (20 percent) (Figure 19). Improving allocative efficiency in that context would require ensuring that most health sector financing is allocated to these causes of deaths and to preventative measures to reduce the incidence of these conditions.

29
FIGURE 19: CAUSES OF DEATHS FOR THE TOTAL POPULATION IN ZIMBABWE (2013)
Source: IHME
Targeted investments on preventive care can pay off and avoid expensive curative care. MoHCC expenditures are skewed towards curative care rather than preventive care, in particular for non-‐communicable diseases, which are very expensive to treat. On average 76 to 81 percent of MoHCC expenditures go to curative care compared to 8 percent or less to preventive care (Figure 20). FIGURE 20: MOHCC BUDGET ALLOCATION BY SERVICE
Source: MoFED 2015 Audited Expenditures Inefficiency arises if the majority of the disease burden can be addressed through primary level care but public spending is largely geared towards hospitals. Productive efficiency gains could be achieved by delivering more services at the lower levels of care and implementing a sound referral system. The lack of adequate services at the provincial level and city health departments has resulted in increased referrals out and in some cases self-‐referrals to central hospitals. This has resulted in central hospitals
35%
20%
2% 1%
6% 3%
1%
25%
7% HIV/AIDS and tuberculosis
Diarrhea, lower respiratory, and other common infecoous diseases
Neglected tropical diseases and malaria
Maternal disorders
Neonatal disorders
Nutrioonal deficiencies
Other communicable, maternal, neonatal, and nutrioonal diseases
80% 76% 76% 81% 83% 81%
7% 8% 7% 8% 9% 8%
0%
20%
40%
60%
80%
100%
2010 2011 2012 2013 2014 2015
% of M
oHCC
Bud
get
Research
Prevenove care
Administraoon and General
Medical care services

30
recording large numbers in outpatient care, normal maternity deliveries, minor operations and x-‐rays and laboratory tests (Figure 21). MoHCC direct transfers to hospitals and health centers are minimal and decreasing: they represented 18 percent of central spending on health in 2010 and 6 percent in 2013. Furthermore, a large part of these allocations went to only five major hospitals in the country, although the proportion is decreasing (Figure 22). FIGURE 21: REFERRALS TO CENTRAL HOSPITALS 2008-‐2014
Source: MoHCC, 2014
FIGURE 22: MOHCC TRANSFERS TO HEALTH FACILITIES
Source: PER
Resource allocation on health in Zimbabwe is not pro-‐poor. MoFED and MoHCC budgeting has historically been a line item based budgeting framework categorically divorced from the realities on the ground. Apart from Harare and Bulawayo, the other eight provinces have been allocated almost the same amounts despite differences in population numbers and disease burden. Rural areas are generally associated with lack of adequate access to health services, a high level of poverty and health needs. Inefficiency arises if a vast majority of the public spending on health is geared towards urban areas, at the expense of the rural. As the five major hospitals are located in richer and/or urban areas of the country, it is clear that public resources are not adequately directed to rural areas. Furthermore, the Public Expenditure Review already highlighted a strong income gradient in the service utilization pattern with the poor relying heavily on rural health centers for both inpatient and outpatient services, while the better off were more likely to use hospital services. It is important to note that the MoHCC has accepted in principle to use a needs based resource allocation formula for allocating its budget vote. A Program Based Budgeting (PBB) to complement the needs based resource allocation framework would improve effectiveness and efficiency in the use of available resources. The MoFED has started implementing the PBB22 with three lead pilot ministries using the 2016 National budget Votes – Ministries of Primary and Secondary Education, Ministry of Health and Child Care and Ministry of Public Service, Labour and Social Welfare. The second phase of the program will include six more ministries in 2018. PBB will likely improve prioritization and targeting of key specific areas and groups of people, improve transparency, accountability and efficiency in the use of available funds.
22 MoFED The 2016 National Budget Statement: “Building a conducive environment that attracts foreign direct investment”
0 50000
100000 150000 200000 250000 300000 350000 400000 450000 500000
2008 2009 2010 2011 2012 2013 2014
Num
ber o
f referrals
0
20
40
60
2009 2010 2011 2012 2013
% sp
ending
Spending in 5 major hospitals as % of spending on govt hospitals and HCs Spending on govt hosp & HC as % of total spending

31
Grants to urban and rural district council clinics will promote use of lower levels of care and reduce the demand for more expensive higher-‐level care. The Harare City Health local council pilot initiative of having a doctor stationed at a polyclinic will in the long run reduce the numbers of patients that seek secondary level care at the country’s central hospitals. This will reduce the number of normal deliveries and minor operations at central hospitals and in the process free up much needed fiscal space.
Technical efficiency In a context of constrained macroeconomic environment and limited scope for additional resource generation, achieving technical efficiency gains by doing things right represent an attractive option to do more with the same level of resources. As already pointed out, there are several common sources of inefficiencies in the health sector. On the basis of expert opinion and knowledge of Zimbabwean context, this report focuses on the following sources of inefficiencies: Public Finance Management; Drugs and equipment; Human resources; and Hospital efficiency.
Public Finance Management (PFM): Turning allocated funds into inputs Budget preparation process generates inefficiencies but Zimbabwe is making progress on preparing its budget in accordance with international standards; efforts are also underway to implement program budgeting, including producing results-‐based information. To date, the highly fragmented financing of general health services, the quasi historical bid-‐based budgeting system and the fragmented private health insurance industry have all contributed to the increase in inefficiencies in the health care system. The budget allocation is not linked to population needs, and the needs-‐based resource allocation formula developed in 2013 for the MoHCC is still non-‐operational. The current allocation system is based on bids consolidated from the districts and provinces, although the final allocation rests with the MoFED. Over the last five years the budget bids have always been at least twice what is eventually allocated. On average the budget bids have floated between US$58 -‐ US$60 per capita. The Ministry is now moving away from the line item budgeting thanks to PBB. Although the line item budgeting enabled fiscal authorities to monitor expenditures, they could not link money spent to eventual health outcomes. With PBB, fiscal authorities should have detailed and disaggregated expenditures which are much easier to monitor and tie to results. Budget execution weaknesses generate inefficiencies. MoHCC budget execution is suboptimal with capital expenditures being the ones with the lowest execution rate. The first two years after the country dollarized its economy (2009 and 2010) the MoHCC underutilized its allocated budget on account of its weak absorption capacity where it had unspent balances that were returned to the treasury. One reason cited for the unspent balances was the issue of MoFED releasing huge amounts of money towards the end of the financial years making it difficult for the Ministry to spend the money in a short time, however this scenario changed after 2011 when it increased its absorptive capacity but faced another challenge as it could not access all its allocated funds. Rather it was the inability of the MoFED to release the allocated funds to MoHCC that resulted in the mismatch between the allocated funds and final expenditure (Figure 23). By 2011 the MoFED was operating on a cash-‐budgeting system where funds were disbursed to ministries as and when the funds became available after collecting taxes and other non-‐taxes. There is also ample evidence of initial budget allocations being revised almost every year and of mismatches between the revised the budget, the MoHCC expenditure outturn, the expenditure recorded under the Public Finance and Management system and the Auditor General’s (AG) audited expenditures.

32
FIGURE 23: MOHCC BUDGET ALLOCATION VS ACTUAL EXPENDITURE 2009 -‐2015
Source: MoFED 2015 Lack of transparency, accountability and of sound management of public revenues, expenditures and liabilities is a source of inefficiency. Since 2010, audit results have shown a mismatch between the MoHCC budget outturn and the audited expenditures, reflecting structural weaknesses in the budgetary control procedures for the MoHCC. MoHCC action to address structural inefficiencies in the country’s health care system would go a long way toward freeing up additional resources. The AG 2010-‐2014 reports identify points of inefficiency within the Government of Zimbabwe’s financing system as well as within the MoHCC. These points are summarized below:
ü The MoHCC has weak budget control procedures. The AG 2015 report noted a number of anomalies in MoHCC budget control procedures, including unauthorized budget expenditures and virement of funds between budget lines without prior MoFED authorization. A major case involved the use of US$2 million for Public Sector Investment Program (PSIP) projects for recurrent expenditures without prior authorization. Some of the PSIP projects remain uncompleted 16 years after commencement, with lack of follow up on goods procurement as a major area of weakness.
ü The MoHCC must address improper accounting procedures, especially with regards to the
Health Services Fund, a development partner support fund meant to cover hospital operational costs minus staff salaries. In some instances, ministries did not keep proper records via receipts, payment vouchers, goods-‐received vouchers, cashbooks and ledgers. For example, in 2014 the debtors’ ledger for the five provincial hospitals and one laboratory amounted to US$19 million without any documentary proof. The debtors' ledger for the MoHCC has grown from US$25 million in 2010 to over US$40.6 million in 2011, underscoring the need for more stringent adherence to accounting standards and protocols.
ü Weak internal budget controls and management systems result in unnecessary losses and
facilitate corrupt practices. Within the MoHCC, eleven hospitals were cited in the AG’s 2015 report for weak fuel management systems. In some health institutions there were reported cases of theft, lack of records to support stock movements and in some cases prioritization of fuel over medicine purchases.
0
50
100
150
200
250
300
350
400
450
2009 2010 2011 2012 2013 2014 2015
Millions US$
Allocaoon Expenditure

33
ü Weak procurement systems increase the MoHCC’s transaction costs. According to the AG, in
some instances unsupported payments were made to workers who had already left employment. Concern was also raised on the issue of the MoFED paying directly to service providers/parastatals in some instances without forwarding such documentation to the line ministries; such procedures render line ministry accounting officers unable to monitor such expenditures. This is in conflict with the Public Finance and Management System (PFMS) Act, which gives ministries the power and responsibility to account for monies allocated to them. In 2014 the MoHCC had about US$4.2 million of such unsupported expenditures directly paid to a service provider. In most cases there were unexplained variances between MoFED appropriation account expenditures and the line ministries’ reported expenditures.
Strengthened public finance management could help improve efficiency in the health sector. The country faces unique characteristics and hurdles affecting its PFM system. Given its large public sector, Zimbabwe must manage substantial public expenditures; it is however not adequately equipped to do so. The recent GoZ-‐World Bank 2016 PER provides a series of recommendations to improve PFM in general, but that could apply to the health sector and generate efficiency gains. These include: 1) Continued efforts to improve results-‐based budgeting; 2) Continued efforts to improve the transparency and effectiveness of the budget process, including increasing information and capture of extra budgetary funds planned in the gross expenditure outlays of the ministry, strengthening the medium-‐term focus on expenditure levels and composition (using MTEF); 3) Expanding the coverage of the PFM system by integrating local authorities, extra-‐budgetary funds and donor financing; 3) Considering reforms to control payroll commitments and costs; 4) Taking complementary actions to strengthen employment and wage controls such as enforcing limits on hiring, review of promotions and establishing rules for using contract workers; and 5) Allocating more resources to support external and internal auditing. Human resources: Turning a budget into a staff mix and turning inputs into outputs Human resources typically represent the single largest cost in most health system and therefore have an important impact on overall efficiency. In general, excessive spending on wages and salaries suggests an imbalance in the use of inputs, and translates into less resources being available for other health programs and activities. Reducing excessive expenditures on wages and salaries could free up resources for other health activities. Zimbabwe is no exception, with very high labor and administrative costs particularly given its labor intensive health care delivery system. The share of employment costs to total MoHCC expenditure indeed grew from as low as 57 percent in 2010 to a high of 83 percent in 2015 (Figure 24). As of September 2016 almost 93 percent of MoHCC expenditures have gone towards meeting employment costs. At the same time the treasury is calling for the rationalization and realigning of the civil service to cut down on employment costs, the MoHCC is calling for unfreezing posts from the time of the 2008-‐2013 inclusive government and the revision of the establishment posts to reflect the current population and disease burden. This has presented a real conundrum for the fiscal authorities as they try to rationalize and realign the civil service.

34
FIGURE 24: EMPLOYMENT COSTS VS TOTAL EXPENDITURE 2009 -‐2016
Source: MoFED 2016 MoHCC estimates that the sector is confronted with a critical shortage of key human resources for health which negatively affects health sector’s efficiency. The shortage of key health personnel is estimated against the background of a staff establishment last revised in the 1980s which does not take into account the growth in population or the increase in and changing disease burden. Increased ‘mechanization’ of the country’s health system has been hampered by the shortage of technicians and inadequate budgets for equipment maintenance. For example, 55 percent vacancy rate for equipment maintenance officers coupled with minimal capital investment in the health care sector is worrying and could be one reason why Zimbabwe’s health care system remains labor intensive (Figure 25). The recent health system assessment estimated that in 2015, the ratio of health workers (comprising doctors (1,230), nurses and midwives (17,217)) was 1.3 per 1,000 people, which is well below the WHO threshold of 2.28. However, compared with other countries in the region Zimbabwe has the fifth highest ratio of nurses per 10,000 people, after South Africa, Namibia, Botswana and Angola, and has a ratio almost double that of Ethiopia (Witter et al, 2016). FIGURE 25: PERCENTAGE VACANCY RATE IN 2014
-‐
50
100
150
200
250
300
350
2009 2010 2011 2012 2013 2014 2015 2016 Sept
Expe
nditu
res (US$ m
illions)
Employment Costs MoHCC Total Expenditure
38% 14%
33% 45%
55% 27%
50% 33%
42%
0% 10% 20% 30% 40% 50% 60%
Doctors Nurses
Pharmacy laboratory
Equipment Maintenance Officers Health Promooon
Radiography Environmental Health
Top Management Team

35
Source: MoHCC 2014 Theoretically rationalization of employment numbers and wages will go a long way in reducing the MoHCC wage bill. However, the current circumstances point to a situation of non-‐possibility of this happening in the short to medium term. In reality the MoHCC has requested for MoFED to absorb more graduate doctors and nurses who are currently unemployed. MoHCC is banking on the GoZ rationalizing employment numbers in other ministries to create fiscal space. A 2014 study by Zimbabwe Economic Policy Analysis and Research Unit23, revealed that minimum wages for the country grew by 28.6 percent between 2009 and 2014, an increase out of sync with productivity levels in the country and one that placed unbearable pressure on the wage bill. MoFED committed to reduce the current government wage bill to an estimated 50 percent by 2019. In its 2016 Mid-‐Year Fiscal Review, the Government estimated that this rationalization of employment costs would free up US$118 million24 annually. However, MoFED did not provide the specific measures that each ministry would take. In addition to reducing the absolute number of human resources for health, MoHCC should consider task shifting and skills upgrading to increase efficiency.
Linking spending on human resources for health to outputs rather than inputs can increase efficiency as Zimbabwe’s Results Based Financing (RBF) program demonstrated through its performance based payment mechanism. RBF’s bonus payments to facilities and facility staff not only improved quantitative and qualitative health outcomes, but also reduced the staff turnover rates at RBF health facilities. Results from the program’s mid-‐term evaluation and cost effectiveness analyses show an improvement in both the technical and allocative efficiency of health facilities. The first phase Zimbabwe RBF Impact Evaluation revealed key gains in selected health coverage and quality indicators, especially those directly targeted by the RBF program: the in-‐facility delivery rate increased by 14 percentage points; process quality of ANC care and the rates of post-‐partum care also showed significant improvements. The cost-‐effectiveness analysis of RBF showed annual live saved of 511 annually, with a total of 12,120 Quality Adjusted Live Years (QALYS) for the period a period of 2.5 years. Combining both quantity and quality, the results showed the RBF program was highly cost effective and more cost effective than the input based method25.
RBF offers promising results to improve efficiency in Zimbabwe by linking financial resource to measurable and desirable outputs. The country’s willingness to expand and sustain that focus on results in health facilities should ensure greater efficiency gains. It can also partially help address the shortage of critical human resources for health as current staff will do more and better. However, as RBF is now implementing at the national scale, it is critical that Government of Zimbabwe makes progress toward the institutionalization of RBF and finds a sustainable way of financing this strategy which currently relies mostly on external support. It is expected that the medium term institutionalization framework under preparation should tackle those issues. Drugs and equipment: Ensuring inputs are available for service delivery The availability of key equipment and essential drugs in public health facilities is often used as a proxy indicator of efficiency. The absence of drugs and equipment can reflect an inadequate budget and/or
23 Zimbabwe Economic Policy Analysis and Research Unit (ZEPARU), (2014) Cost Driver Analysis of the Zimbabwe Economy, cited in IMF Country Report May 2016. 24 MoFED estimates to save overall US$118 million by the end of 2016, and US$155 million in 2017 and the same figure annually thereafter (MoFED, 2016 Mid-‐Year Policy Review). 25 Shepard D and Zeng W (2016) – Conference Presentation: Cost Effectiveness Analysis of Results-‐Based Financing in Zimbabwe, Cresta Lodge Harare, Zimbabwe.

36
inefficiencies. Table 8 shows the availability and readiness of sampled facilities to provide a list of essential medicine. On average 18 of the surveyed 24 essential medicines were available at health facilities, irrespective of the type of ownership of the facilities. However, only 26 percent of the facilities surveyed had all the 24 essential medicines at the time of the survey.
There has been a general improvement in Zimbabwe’s drug procurement system, although external partners still largely drive this system. The use of the country’s sole drug procurement, storage and distribution company, the National Pharmaceutical Company (NatPharm) by external partners for storage and distribution of health commodities has improved NatPharm’s finances and continued relevance and in the process minimized unnecessary transaction and administrative costs associated with running parallel systems. However, the continued lack of government funding has resulted in the undercapitalization of NatPharm and has reduced its ability to procure cheap drugs and its influence on the general pricing of drugs in the country. Applying lessons learned to improve the drug distribution system from the current push and pull system will go a long way toward reducing inefficiencies. Currently the country has four drug management systems26: the Delivery Team Topping Up (DTTU), the Zimbabwe Informed Push/Primary Health Care Package (ZIP/PHCP), the Zimbabwe ARV Distribution System (ZADS) and the Essential Medicines Pull System (EMPS). A pilot study27 combined the four systems into a single management and distribution system at the primary level in Manicaland Province. Mid-‐term evaluation results of what was named the Zimbabwe Assisted Pull system (ZAPS) showed that while the current systems were generally efficient—except for some reservations with the EMPS system—the cost and cost effectiveness baseline values were not completely reflective of the total picture.
Low levels of key diagnostic items in health facilities affect the quality and care and the overall efficiency of health facilities. On average health facilities in Zimbabwe have the capacity to provide diagnostic tracer tests on site. Mission hospitals have the highest readiness score of 81 percent, with public hospitals and public clinics at 73 percent and 69 percent respectively (Table 8).
The availability of key maternal and child health hospital equipment improved as a result of the Health Transition Fund and RBF. The availability of key equipment greatly improved efficiencies in the delivery of not only maternal and child care services, but other services as well. However, 2013 MoHCC gap analysis revealed a lack of other basic equipment. More efficiency gains could be realized if both the primary and secondary levels meet basic equipment standards. Table 8 shows the general mean availability of selected basic equipment in sampled facilities in all the 10 provinces of the country. Private and mission hospitals are more resourced that the public hospitals. Mission clinics are also more resourced that public and private clinics.
TABLE 7: SERVICE AVAILABILITY AND READINESS ASSESSMENT BY FACILITY TYPE
Facility Type Number of Facilities
Basic amenities mean score (%)
Basic Equipment mean score (%)
Standard precautions mean score (%)
Diagnostics mean score (%)
Essential medicines mean score (%)
General service readiness index (%)
Public Hospital 48 85 85 80 73 79 98 Public Clinic 153 75 86 83 69 75 100 Private Hospital 15 92 94 95 53 81 100 Private Clinic 19 88 86 83 61 67 95 26 Chiyaka, Ignatio, and Naomi Printz. Zimbabwe Assisted Pull System: Design of Ordering and Resupply Procedures. Arlington, Va.: USAID | DELIVER PROJECT, Task Order 4. 27 Rosen, James E., Julia Bem, and Katherine Wolf. 2015. Evaluation of the Zimbabwe Assisted Pull System (ZAPS): Baseline Report. Arlington, Va.: USAID | DELIVER PROJECT, Task Order 4.

37
Mission Hospital 29 88 94 81 81 84 100 Mission Clinic 11 75 89 82 70 78 100 Source: MoHCC, Zimbabwe Service Availability and Readiness Assessment 2015
Additional fiscal space can be generated through improved administration. MoHCC is likely to generate some fiscal space through implementing government recommended measures such as standardization of fuel benefits for staff, efficient use of mobile and telephones, efficient use of vehicles and discouraging vehicle use during non-‐working hours. The MoHCC could learn lesson from the United Nations Vehicle management system, where staff use pooled vehicles for business, meetings and workshops.
Hospital efficiency: turning inputs into outputs Although there is scant evidence of hospitals as a major source of inefficiencies, a comparative analysis of hospitals’ performance can shed some light on inefficiencies. A study by Hensher28 showed that inefficiencies in low and middle income countries occur as a result of use of costly inputs, failure to minimize inputs used in the health system, poor remuneration of health care workers and failure to operate service delivery at the appropriate scale. Huge inefficiencies exist in Zimbabwe’s Central Hospitals, mission and other public hospitals29. Inefficiency levels of between 37 percent and 39 percent were found in central hospitals and 34% on average for non-‐profit mission and public hospitals using Data Envelopment Analysis (DEA) and Stochastic Frontier Analysis (SFA) techniques.
In Zimbabwe, the extremely low figures for bed occupancy and turnover could be a sign of underutilization of hospital beds by hospitals or a case of expedited discharges of patients. Low bed occupancy can also reflect the current financial access barriers, which are lower for mother and child health services than for general health care (Witter et al, 2016).The average length of a hospital stay (where shorter is better) varies between two and six days for provincial hospitals and between seven and nine days for central hospitals. According to the MoHCC National Health Profile 2014, bed occupancy rates range between 2 percent and 7 percent for provincial hospitals and between 4 percent and 6 percent for central hospitals. The bed turnover rate ranges between 2 percent and 9 percent for provincial hospitals and between 1 percent and 3 percent for central hospitals. Hospital discharges range between 7,000 and 13,000 people per year for provincial hospital. There are obvious signs of over-‐capacity for district and provincial hospitals as certain services are not used on account of the shortages of critical health personnel such as doctors, theater nurses, laboratory scientist and radiographers. For example, major operations range between 35 and 629 per year for provincial hospitals and minor operations between 176 and 2,189 per year. In terms of maternity admissions, the central hospitals of Harare, Parirenyatwa, Chitungwiza and Mpilo had normal deliveries of 54 percent, 59 percent, 62 percent and 58 percent respectively, which are abnormally higher for referral hospitals30.
28 Hensher (2010) “Financing Health system through efficiency gains.” Background paper prepared for Working Group 2 of the Commission on Macroeconomics and Health. Geneva. World Health Organization. 29 Studies done by Makochekanwa & Mapani in 2015 and Maredza in 2012 30 MoHCC (2014) National Health Profile

38
7. How much fiscal space? Illustrative scenarios for health spending
While the previous sections have explored potential sources of fiscal space, the following section provides illustrative scenarios for health spending, financing gaps and suggested fiscal space scenarios to cover the financing gaps. The scenarios are based on the MoHCC NHS costings and latest IMF base projections for Zimbabwe.
The MoHCC defined three scenarios to assess how cost and impact differ for varying packages, targets and activities. Examining alternative scenarios allows for more informed decision-‐making, enabling stakeholders to select the most feasible and efficient policy option scenario and targets to incorporate for final estimation of activities and budgets. The draft NHS offered an ambitious plan that could not be sustained by current or anticipated financial resources. This ambitious plan corresponds to the NHS3 costing scenario or “Optimal” scenario, and is focused on scaling up current interventions and increasing both human resources for health and infrastructure improvements. The prioritization exercise enabled development of a robust, concise yet ambitious NHS: this is the NHS2 costing scenario, or “High Impact interventions” scenario. The policy direction of the NHS2 scenario centers on: addressing bottlenecks identified through an analysis conducted during NHS development; and prioritizing primary health care (though equally addressing the referral bottlenecks), with a focus on preventative programming. Finally, the NHS1 costing scenario reflects what it would cost to maintain current coverage level for health interventions: this is the “baseline” scenario (Figure 26).
FIGURE 26: OBJECTIVES AND KEYS ASSUMPTIONS FOR THE THREE COSTING SCENARIOS
Source: MoHCC, Costing of the National Health Strategy 2016
Additional health sector resource needs for the next years to implement the NHS are significant and will require a strong commitment from the government in favor of the sector. Over the five-‐year period, the entire plan would cost $6.9bn, $7.6bn and $8.5bn for NHS 1, 2 and 3 respectively (Table 9).
• No change in health service and health system coverage • No change in investments • Flat-‐lined coverage of health services • No capital investments (e.g. construcoon of addioonal health facilioes
NHS 1: "Baseline" Maintain 2015 coverage levels for
all health intervenoons
• Scale-‐up of reproducove and MCH, Malaria, HIV, Nutrioon and NCDs intervenoons with emphasis on lower levels of care • Shiw provision of prevenove services at the primary health level • Infrastructure improvements at the primary level only • Investments to improve availability and security of medicines and supplies • Capacitaoon of skilled Human Resources
NHS 2: "High Impact intervenpons" Reduce mortality associated with the 20 established leading causes within limits of the proposed
financial space
• Health service and health system investments implemented as planned • All proposed Infrastructure (construcoon and renovaoon of health facilioes at all the levels) incorporated • All planned HR improvements factored into this model (facilioes and admin staff recruitments and training)
NHS 3: "Oppmal scenario" Scale up opomally most health
service intervenoons

39
At the end of the period, the per capita cost would be $73, $93 and $100 for NHS 1, 2 and 3 respectively. This requires a significant increase in spending on health from the baseline level, in particular in government spending on health as most resources are expected to be mobilized domestically. The below analysis suggests that the national health strategy’s three scenarios are unrealistic in the current context but that reprioritization and some additional revenue generation are viable options.
TABLE 8: TOTAL COST FOR THE THREE SCENARIOS (MILLION USD)
Scenarios 2015 2016 2017 2018 2019 2020 Total NHS 1 $955.3 $1,179.1 $1,306.5 $1,187.0 $1,159.9 $1,149.1 $6,936.9 NHS 2 $955.3 $1,193.9 $1,325.1 $1,349.7 $1,387.1 $1,397.7 $7,608.8 NHS 3 $955.3 $1,269.7 $1,559.4 $1,630.6 $1,624.1 $1,494.1 $8,533.2 Source: NHS costing (2016)
In the short to medium term, economic growth will not generate fiscal space for health if the GDP share of public spending on health remains unchanged. According to IMF projections made in October 2016, the average annual GDP growth will average 0.4 percent between 2016 and 2020. On current trends, public spending on health per capita would slightly decrease by 2020 in constant terms and reach US$ 27 per capita in 2020, compared to an average of US$ 28 per capita between 2012 and 2014.
Increasing fiscal space for health through reprioritization of expenditures could narrow the funding gap in the health sector. By 2020, reprioritization of health expenditure even to 15 percent of government spending (Abuja target) would not cover any of the National Health Strategy’s costed scenarios (Figure 27) as GDP and expenditures are not expected to increase significantly over the period. Reprioritization is also likely to meet some resistance from other sectors of the economy who are competing for minimal resources.
FIGURE 27: FUNDING REQUIREMENTS OF NHS SCENARIOS VERSUS SCENARIOS FOR INCREASED GOVERNMENT SPENDING ON HEALTH
Source: Authors own calculations
Earmarking cigarette and alcohol excise taxes for health will generate additional financing of US$10 million and US$18 million respectively by 2020. While these options will create some fiscal space, they will only marginally contribute to narrow the funding gap for the National Health Strategy Scenario 2, which is the preferred scenario (Figure 28). In 2013 MoFED used earmarked funds from cigarettes and beer excise taxes for allocation to the Ministry of Education and Culture.
$0
$500
$1,000
$1,500
$2,000
2015 2016 2017 2018 2019 2020
US$ M
illions
NHS1 NHS2
NHS3 10% of Current General Government spending
12% of government spending 15% of government spending

40
Earmarking 1% of VAT will generate additional US$138 million by 202031 and could significantly narrow the funding gap (Figure 28). However, the feasibility of earmarking VAT to health rests on the government and other stakeholders accepting such a proposal given the current economic situation and competing interests.
FIGURE 28: FISCAL SPACE PROJECTIONS FROM REPRIORITIZATION OF HEALTH, SIN TAXES AND EARMARKING OF 1 PERCENT OF VAT (AGAINST NHS2 COST ESTIMATES)
Source: Authors own calculations
International re-‐engagement would create additional fiscal space through opening up of lines of credit. Under the IMF baseline and alternative growth scenarios, Zimbabwe does not have any debt relief and will continue to pay token amounts to the World Bank Group, International Monetary Fund, the African Development Bank and the European International Bank. However, should the country embark on the IMF alternative scenario, its debt burden will likely reduce marginally, creating some additional fiscal space through opening up concessionary lines of credit from the Paris Club.
In the short to medium term, the National Health Strategy cannot be implemented without significant support from DAH. Figure 28 revealed that even with the most optimistic scenarios for domestic resources mobilization (15 percent of government spending allocated to health, sin taxes and earmarking of one percent of VAT), the funding gap for NHS2 would average $660 million annually. At the time of this fiscal space analysis, DAH projections from the 2016 donor mapping were not available; however, indication from the commitments to HDF (Figure 18) suggest that DAH will likely decrease in the coming years. Figure 29 illustrates that even with continued support from development partners to the level registered between 2014 and 2016 and provided all other measures to raise domestic spending on health are also implemented, some funding gap will remain. The fact that even most optimistic projections and assumptions cannot cover the cost of NHS2 by 2020 highlights the critical need for efficiency gains within the health sector. If such gains are not achieved, it is likely that the health financing burden will fall on households, creating financial barriers to health care and inequities which would go against the principles of the health financing policy.
31 Atchison Actuaries & Consultants with TARSC and MoHCW (2013) Projections for the use of Earmarked Value Added Tax for health financing in Zimbabwe, Atchison Actuaries, TARSC, MoHCC, Harare
0 200 400 600 800
1000 1200 1400 1600
2015 2016 2017 2018 2019 2020
US$ M
illion
NHS2
MoHCC Constant (10%)
12% of government spending
15% of government spending
15% GoZ + Earmarked Taxes (Cigarezes and Beer, 25% of excise tax)
15% GoZ + Earmarked Taxes (Cigarezes and Beer, 25% of excise tax)+ 1%
$660 million gap/year (average)

41
FIGURE 29: FISCAL SPACE PROJECTIONS FROM REPRIORITIZATION OF HEALTH, SIN TAXES, EARMARKING OF 1 PERCENT OF VAT AND CONTINUED DAH FLOWS (AGAINST NHS2 COST ESTIMATES)
Source: Authors own calculations
In the medium to long term, additional fiscal space could be realized by introducing a national health scheme funded by both the formal and informal sectors. Targeting inclusive and progressive sources of income from both the formally and informally employed would help address some of the fiscal requirements for the health sector. A number of countries (Ghana, for example) use VAT as a major source of national health scheme financing. Zimbabwe could explore VAT as a non-‐regressive source of funding for the National Health Insurance (NHI), given that a number of products accessed by the poor do not have any VAT. In the short term, actuarial analysis and projections coupled with proactive and robust stakeholder consultations will reveal the potential of the NHI.
0 200 400 600 800
1000 1200 1400 1600
2015 2016 2017 2018 2019 2020
US$ M
illions
NHS2
MoHCC Constant (10%)
12% of government spending
15% of government spending
Adding sin taxes
Adding earmarking of 1% VAT
Adding DAH (average 2014-‐16)

42
8. Way forward
The above fiscal space analysis looked in turn at the five pillars of fiscal space for health to identify constraints and potential sources of fiscal space for health during the period of the National Health Strategy 2016-‐2020, bearing in mind the resources needed to implement the strategy. In light of the above analysis as well as opportunities and constraints identified, this section highlights options to consider to generate fiscal space for health. Further analysis on the technical and political feasibility of some of the recommendations may be needed.
The current financial crisis and macroeconomic situation in Zimbabwe do not constitute an enabling environment for generating fiscal space for health. Economic growth is expected to be insignificant and revenues to level off in the coming years making it necessary to restrain expenditures. Resources for health would benefit from GDP growth (given the 2.1 elasticity) but given the limited growth forecasts this will only have a marginal effect on fiscal space for health. Interventions that would support additional revenue generation and stimulate growth fall outside of the scope of the health sector and are thus not discussed in this study.
As overall Government’s revenues and expenditures will not increase in the short to medium term, expanding fiscal space for health would require reprioritization of health in total government spending. The health financing policy (2016-‐2025) makes reference to the aspirational Abuja target of 15 percent of government budget allocated to health. Although Zimbabwe spends relatively less on health (as a share of total government spending) than most other countries in the region, historical data do not support the idea that reprioritization is likely to happen, and particularly not to the extend needed to reach the Abuja target. Indeed, since 2010 the share of government spending on health has decreased. There is however room for improvement as the MoHCC has generated several pieces of evidence that can be used to advocate for more resources, linking additional resources with expected results. The MoHCC can use the National Health Strategy, the NHS costing, the resource mapping, the 2015 National Health Accounts and the fiscal space analysis to demonstrate the funding needs of the sector, current misallocation of funds, lack of funding for critical programs, inequalities in health financing and lack of predictable and sustainable financing of key health programs. These documents constitute key tools for evidence-‐based planning and budgeting and could help the MoHCC obtain reprioritization of government resources toward the health sector. Strengthening planning and budgeting processes within MoHCC could further help the Ministry to prioritize programs. Moving away from the line item discussion to a more informed discussion with MOFED would strengthen the ability of MoHCC to argue for more resources. MoHCC is a pilot Ministry for Program Based Budgeting and it should seize that opportunity to reprioritize health in total government spending. Finally, fast-‐tracking disbursement of budget allocated to the Ministry would help address the suboptimal budget execution, in particular for capital expenditures. Further analysis to understand constraints in public financial management could help in that respect.
Generating sector specific resources represents an attractive way of generating fiscal space for health in the context of Zimbabwe and the recent introduction of a levy on airtime and data to secure funding for drugs and equipment is a positive step. The fiscal space analysis presented the potential contribution of sin taxes, in particular taxes on tobacco, wine and beer should they be earmarked to the health sector or a specific subprogram. For instance, sin taxes could be earmarked to NCD prevention programs to promote healthy lifestyles, which are currently underfunded. The analysis shows that not trivial, although limited resources, could be generated from raising taxation on those goods and services and their feasibility is worth further exploring. Whether those taxes should be earmarked or not is a matter of public choice and would need discussion among relevant stakeholders in Zimbabwe.

43
Expanding revenues from VAT and possibly earmarking them for health seems to be a medium term rather than a short term option. Zimbabwe’s taxation level is already high and increasing VAT is not a recommended option. However, improved revenue collection and a broadened tax base could generate more revenues. Measures that would incentivize the 95 percent of the active population currently in the informal sector to register and enter the formal economy should be contemplated. They could have a positive effect on revenue collection in the medium term, with positive benefit for the economy in general and for the health sector in particular. If VAT revenues increase and the country eventually sets up a National Health Insurance, part of the VAT could be earmarked to it, as in Ghana. In the short term however, earmarking part of VAT revenues to health would not be a viable solution as this would have a negative impact on the rest of the economy. In the short term, informal sector contributions could be collected from local authorities which have better information on the informal sector. Taxing local businesses currently in the informal sector could raise revenues for local authorities that could be used to fund primary care. Recently, the idea of instituting a “vendors’ levy” was announced. Further investigation would be needed to see the feasibility of such a measure and how it could benefit public spending on health.
Reliance on DAH to finance major health programs is likely to remain in the near future but reduced fragmentation and better alignment with Government’s priority would improve its efficiency. Currently, DAH is the first financing source of the health sector but it remains fragmented and there is a mismatch between DAH priority areas and those of the countries, with critical areas, like NCD prevention and treatment being underfunded. Enhancing aid effectiveness through increased predictability, reduced fragmentation and better alignment to country needs will be necessary. The pooling of funds through HDF is a good step towards reduced fragmentation and efforts in that direction should be pursued. Reducing vertical funding (in particular for HIV/AIDS) and ensuring that those programs contribute to broader health system investments would also contribute to enhance efficiency in donor funding. Greater focus of DAH on health systems strengthening would be a critical step to reduce reliance on external support by supporting the health sector to deliver more and better quality health services on the long run. The resource mapping performed annually by CHAI and the MoHCC as well as the National Health Accounts provide a wealth of information regarding donor funding, areas of support and more neglected areas: using such evidence to build the case for donor support and for reshaping it could help MoHCC achieve greater value for money from the external support it receives. Limited forecasts related to donor financing point to a decrease in external support, as is observed in other countries; in that context, it is critical that the Government of Zimbabwe secures enough resources to ensure sustainable funding of critical programs that are currently funded by external partners.
Better integration and coordination of support at provincial and district levels could help achieve efficiency gains. The co-‐existence of input and output based financing at local level as well as the multitude of vertical programs creates inefficiencies. Parallel systems place a heavy burden on health workers and prevent economies of scale and synergies. For example, both Global Fund and RBF provide resources for supervision of the same malaria activities. Zimbabwe could benefit from the experience of some countries which are developing innovative ways of reducing fragmentation and inefficiencies at the local level: the “single contract” in DRC allows to align government and donors’ funding at the provincial level under one plan, one audit and using harmonized procedures.
Getting more out of the current level of resources flowing to the sector by achieving efficiency gains seems to be the most urgent and plausible option for generating fiscal space for health in Zimbabwe given the current financial crisis. Zimbabwe’s burden of disease is evolving with NCDs representing a growing share. Still, communicable diseases remain the major concern. The burden of disease of the population, in particular that of the most vulnerable, should drive the allocation of public funds to the

44
health sector. Looking at the disease profile and health seeking behaviors of the poorest, it is necessary to reallocate more resources to the lowest levels of care, where most of the vulnerable go and where the majority of cases can be treated at a lower cost. Pulling out some resources from curative to preventive services could also avoid a large burden on health systems and health financing by reducing the incidence of NCDs and communicable diseases which are costly to treat.
Improving budget processes, from planning to execution and implementing PFM reforms could better turn allocated funds into inputs. Implementing recommendations from the AG’s reports related to budget control procedures, accounting procedures, governance and procurement system will be critical to move toward greater technical efficiency. Strengthening program based budgeting and moving away from line item budgeting will allow monitoring progress and tying resources for results. Making the needs-‐based resources allocation formula effective will also improve alignment of available resources and population needs for higher impact.
The large wage bill represents a major constraint for the country as a whole and the health sector in particular and no substantive efficiency gain could be achieved within the sector without implementing the public sector wage reform. More than 85 percent of the MoHCC budget is spent on salaries creating rigidities and leaving only little resources to fund health programs. In parallel, MoHCC reports significant shortages of some categories of human resources for health. It is critical that the Government addresses this double issue and defines a clear strategy for the management of human resources for health that could include converting some of the posts as more low cost staff are needed at the lower levels of care. A health sector audit by the health service Board is planned for 2017. It should bring more insights to address this issue.
Hospitals are a critical component of the health system in Zimbabwe but their efficiency is uncertain. Limited evidence reveals that hospitals at all levels are not efficient, which is confirmed by the low bed occupancy rate. A hospital efficiency study on 62 hospitals has been commissioned and will bring more evidence on hospital efficiency in the country. Further analysis, including qualitative analysis, will be needed to understand the reason for poor efficiency and recommend concrete actions and strategies to address them.
The efficiency of the health sector is impeded by poor availability of major inputs in health care facilities. The health system in Zimbabwe is lacking the basic inputs (human resources, drugs, equipment) required to deliver quality health services. There is evidence that PBF can help address some of those structural issues as demonstrated by the recent evaluation of PBF. In addition, some countries like Rwanda, granted autonomy to health care facilities to achieve greater efficiency, allowing them to use their own funds, to manage human resources and to buy drugs and equipment. This option could be explored in Zimbabwe to address the systems’ inefficiencies.
Addressing issues affecting the supply chain would allow achieving major efficiency gains. The existence of parallel distribution systems has a direct impact of costs and availability of drugs. Vertical programs tend to fund drugs in an uncoordinated way which creates parallel distribution systems. Merging such systems in the medium-‐term would result in significant efficiency gains. The current transition to the push system in most of the country and greater coordination of various financing streams and distribution systems for commodities are positive steps. A shift to one integrated distribution system in the medium-‐term would likely bring significant gains.

45
9. References
American Cancer Society (2015). The Tobacco Atlas, Fifth Edition.
Atchison Actuaries & Consultants with TARSC and MoHCW (2013). Projections for the use of Earmarked Value Added Tax for health financing in Zimbabwe, Atchison Actuaries, TARSC, MoHCC, Harare.
Cashin, C. and Tandon, A. (2010). Assessing Public Expenditure on Health from a Fiscal Space Perspective, the World Bank.
Chiyaka, Ignatio, and Naomi Printz. Zimbabwe Assisted Pull System: Design of Ordering and Resupply Procedures. Arlington, Va.: USAID | DELIVER PROJECT, Task Order 4.
Heller, P. (2006). The prospects of creating ‘fiscal space’ for the health sector. Health Policy Plan. (March 2006) 21 (2): 75-‐79.
IMF (2014). Government Finance Statistics Manual (GFSM).
IMF (2016). IMF Country report No. 16/109.
Kutzin, J. and Mclntyre, D. (2016). Health Financing Country Diagnostic: A Foundation for National Strategy Development, World Health Organization.
Lustig, N. (2012). Commitment to Equity: Diagnostic Questionnaire. CEQ Working Paper No. 2.
MoFED (2016). Mid-‐Year Policy Review, Harare.
MoFED (2016). The National Budget Statement: “Building a conducive environment that attracts foreign direct investment”, Harare.
MoHCC (2015). Zimbabwe Service Availability and Readiness Assessment 2015, Harare.
MoHCC (2016). Costing of the National Health Strategy 2016-‐2020, Harare.
MoHCC (2016). Resource mapping, Harare.
MoHCW, TARSC (2013). Report on Stakeholder Review of options for Domestic health Financing, 16 August, Harare, MoHCW, TARSC/ EQUINET Harare.
National AIDS Council Zimbabwe of 1999 (2001). NAC Act Chapter 15 Section 14 subsection 14 and 15 of the Finance Act, Chapter 23:04, Government Printers, Harare.
National AIDS Council Zimbabwe of 1999 (2001). NAC Act Chapter 15:14 of 2000, Government Printers, Harare.
Rosen, James E., Julia Bem, and Katherine Wolf (2015). Evaluation of the Zimbabwe Assisted Pull System (ZAPS): Baseline Report. Arlington, Va.: USAID | DELIVER PROJECT, Task Order 4.
46
Shepard, D. and Zeng, W. (2016). Conference Presentation: Cost Effectiveness Analysis of Results-‐Based Financing in Zimbabwe, Cresta Lodge Harare, Zimbabwe.
TARSC, Atchison Actuaries (2014). Proposals for integrating equity in allocation of recurrent resources to support universal coverage in Zimbabwe, TARSC, MoHCC, Harare.
USAID (2013). Data for Efficiency: A Tool for Assessing Health Systems Resource Use Efficiency. Health Finance and warweGovernance.
WHO (2001). Macroeconomics and Health: Investing in Health for Economic Development. Report of the Commission on Macroeconomics and Health.
WHO (2010). Health Systems Financing: The Path to Universal Health Coverage. World Health Report.
Witter, S., Naylor, M., Caffrey, M. and Carasso, K. Assessment and redesign of the systems for RBF, Human Resources for Health and Pharmaceuticals in Zimbabwe. Final report (draft). December 2016.
World Bank, MoHCC (2015). Health Public Expenditure Review Zimbabwe. Report No. 97175-‐ZW. Washington DC.
World Bank (2016). Zimbabwe Economic Update. What has changed since February? PowerPoint Presentation. September 15, 2016. Harare.
Zimbabwe Economic Policy Analysis and Research Unit (ZEPARU) (2014). Cost Driver Analysis of the Zimbabwe Economy, cited in IMF Country Report May 2016, Harare.
ZIMRA (2015). Revenue Performance Report for the Year ended 31 December 2015, Harare.
ZIMSTATS (2015). 2014 Labor Force Survey, Harare.
ZIMSTATS (2015). National Accounts 2009-‐2014 Report, Harare.