analyzing fleet data with matlab and spark...time pressure to get the analysis done ... develop and...
TRANSCRIPT

1© 2018 The MathWorks, Inc.
Analyzing Fleet Data with MATLAB and Spark
Christoph Stockhammer

2
What does “Fleet” mean?
▪ A “Fleet” is any group of things that can generate data and that you would
like to look at all together. Examples include:
3
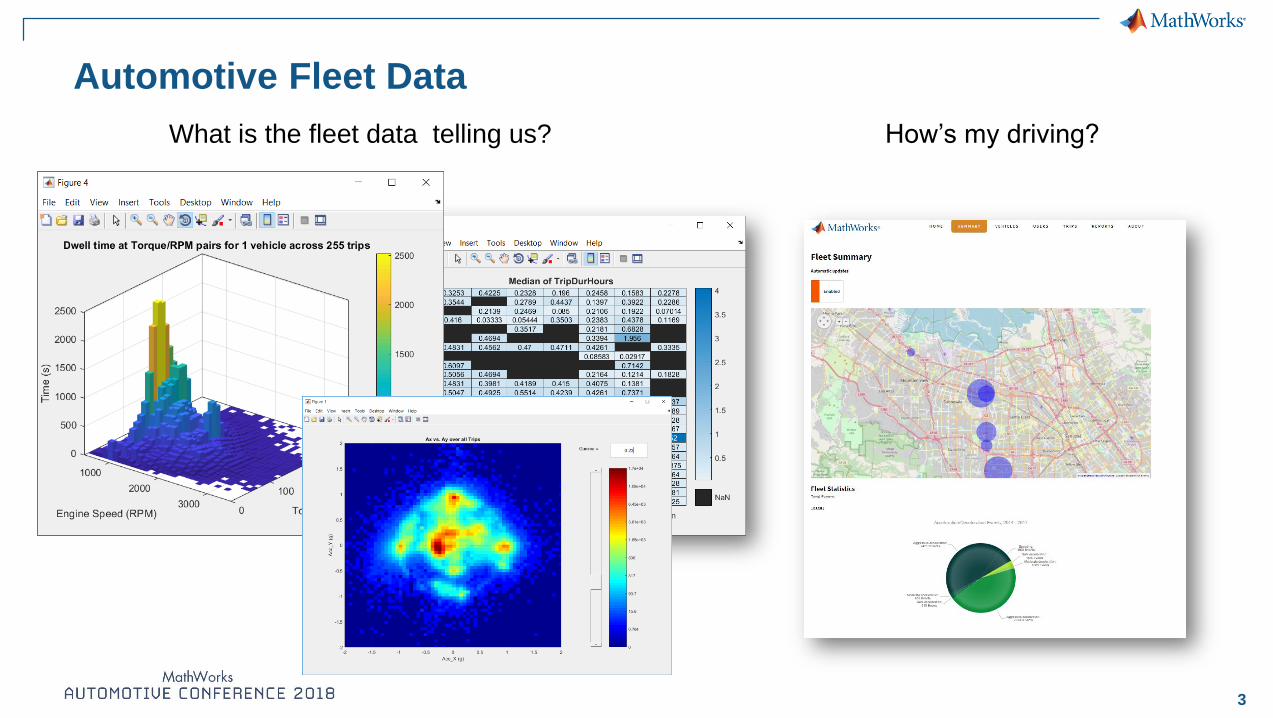
Automotive Fleet Data
How’s my driving?What is the fleet data telling us?

4
How do Customers Apply Analytics to Fleet Data?
Cold Storage Hot Storage
DataVehicle data, driver
profiles
Historic data:
• Batch processing
• Large data on cluster
• Explore long term trends
• Build model
Streaming data:
• Near real-time
• Test and implement model
for new data
• Stream processing
5
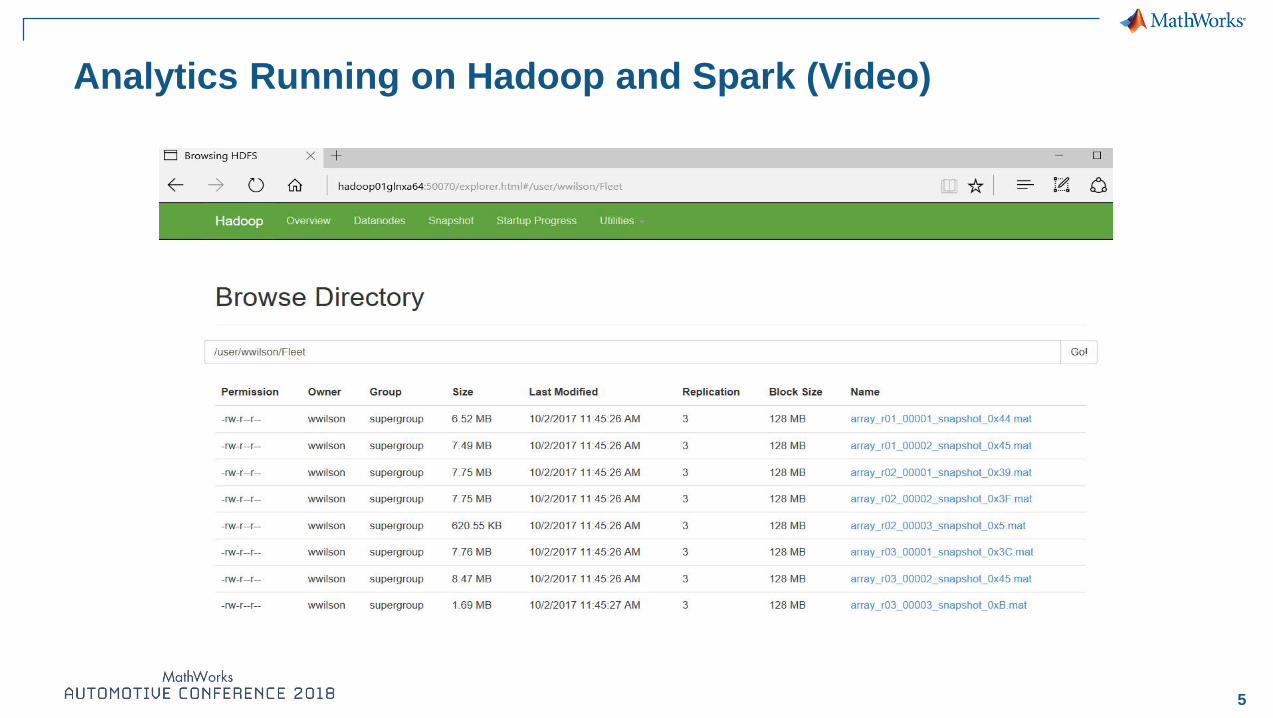
Analytics Running on Hadoop and Spark (Video)
6
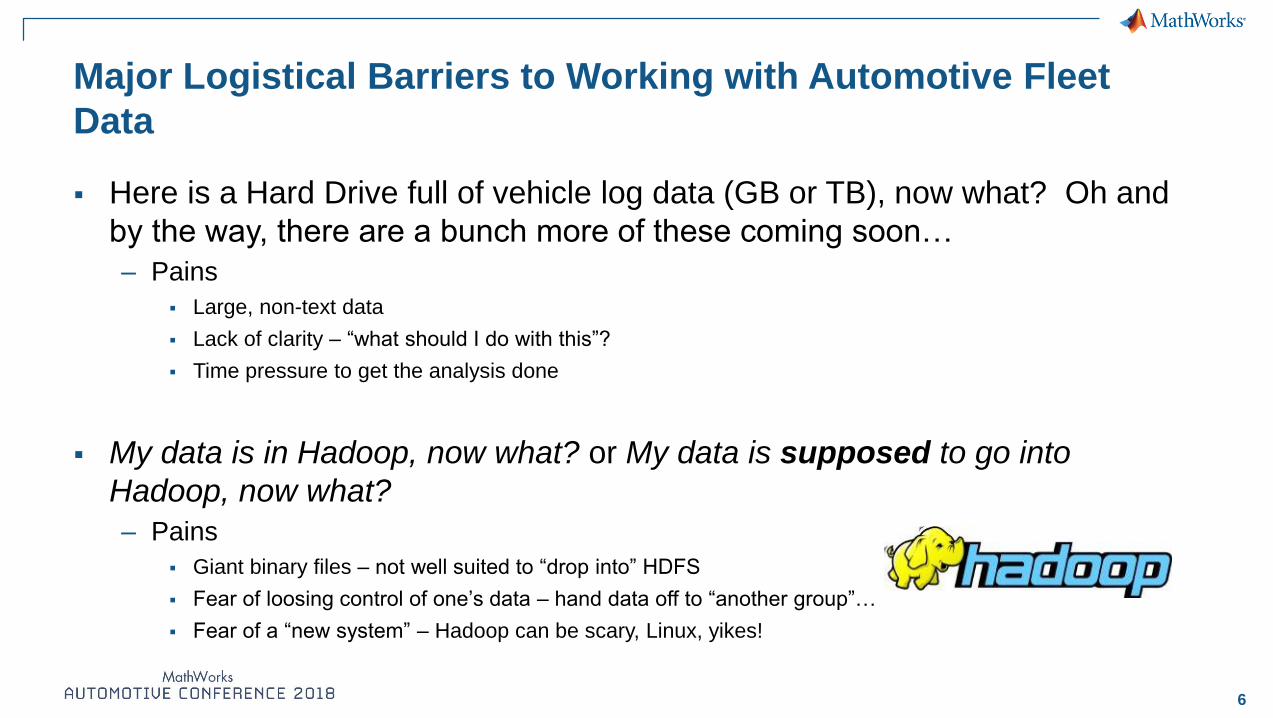
Major Logistical Barriers to Working with Automotive Fleet
Data
▪ Here is a Hard Drive full of vehicle log data (GB or TB), now what? Oh and
by the way, there are a bunch more of these coming soon…
– Pains
▪ Large, non-text data
▪ Lack of clarity – “what should I do with this”?
▪ Time pressure to get the analysis done
▪ My data is in Hadoop, now what? or My data is supposed to go into
Hadoop, now what?
– Pains
▪ Giant binary files – not well suited to “drop into” HDFS
▪ Fear of loosing control of one’s data – hand data off to “another group”…
▪ Fear of a “new system” – Hadoop can be scary, Linux, yikes!

7
Have you Ever Wondered…?
▪ How different factors affect how a particular driver drives?
▪ Real-world vehicle performance of things like: fuel economy, emissions,
vehicle dynamics, ride and handling, prognostics, and durability?
▪ How do you work with terabytes of data to distill out critical information?
▪ Once you do have the critical information, how to you iterate back through
your terabytes of data to extract relevant (time) slices for further study or
analysis?

8
So, what’s the (big) problem?
▪ Traditional tools and approaches won’t work
– Accessing the data is hard; processing it is even harder
– Need to learn new tools and new coding styles
– Have to rewrite algorithms, often at a lower level of abstraction
▪ Quality of your results can be impacted
– e.g., by being forced to work on a subset of your data
– Learning new tools and rewriting algorithms can hurt productivity
▪ Time required to conduct analysis
– Need to leverage parallel computing on desktop and cluster

9
MathWorks Vehicle Fleet – Case Study
Challenge
▪ Develop and deploy Data Analytics to run on Spark against (non-text
format) vehicle fleet data stored on Hadoop
Solution
▪ Use MATLAB tall arrays to develop analytics on the desktop and then
scale out to the Hadoop cluster
Results▪ Developed insight and understanding of over 1300 vehicle trips
▪ Illustrated fuel efficiency performance under real-world driving conditions

10
Volkswagen Data Lab
develops driver recognition
algorithms with MATLAB
Develop technology building block for tailoring
car features and services to individual
▪ Need to identify individual drivers based on
their driving behavior using collected data
Challenges
▪ Accuracy despite low training data
▪ Robustness despite environmental conditions
▪ Computing time
Data sources
▪ Logged CAN bus data and travel record
Source: „Connected Car – Fahrererkennung mit MATLAB“
Julia Fumbarev, Volkswagen Data Lab
MATLAB EXPO Germany, June 27, 2017, Munich Germany

11
Data Analytics Workflow
Integrate Analytics
with Systems
Desktop Apps
Enterprise Scale
Systems
Embedded
Devices and
Hardware
Files
Databases
Sensors
Access and
Explore Data
Develop
Predictive Models
Model Creation
e.g. Machine
Learning
Model
Validation
Parameter
Optimization
Preprocess Data
Working with
Messy Data
Data Reduction/
Transformation
Feature
Extraction

12
What about messy data?
▪ How do deal with outliers? ▪ New functions to help you with:
– Missing Data and Outliers
– Detecting Change Points
– Smoothing and Detrending
– Normalizing and Scaling
– Grouping and Binning
Full Details: https://www.mathworks.com/help/matlab/preprocessing-data.html

13
MathWorks Automotive Fleet – Data Collection
Data
WarehouseServer
Engineers
MATLAB
Production Server
• Enrich data
• File creation
4G LTE
Bluetooth
OBDII
Phone

14
The MathWorks Fleet
▪ 1300 trip log files
▪ 21 unique vehicles
▪ Approx 39 unique
channels
▪ Data collected over 1.5
years

15
Automotive Vehicle Test Fleets – Lots of Data and Lots of
Complexity
Vehicles
Signals
Messages
Trips (files)
Time – Value pairs

16
The Data: Timestamped messages with JSON encoding
{"vehicles_id": {"$oid":"55a3fd0069702d5b41000000"},
"time” : {"$date":"2015-07-13T18:01:35.000Z"},
"kc” : 1975.0, "kff1225" : 100.65293, "kff125a" : 110.36619, … }
{"vehicles_id": {"$oid":"55a3fe3569702d5c5c000020"} "time":{"$date":"2015-07-13T18:01:53.000Z"},"kc” : 2000.0, "kff1225" : 109.65293, "kff125a" : 115.36619,…
}
{"vehicles_id": {"$oid":"55a4193569702d115b000001"} "time":{"$date":"2015-07-12T19:04:04.000Z"}"kc":2200.0, "kff1225" : 112.65293, "kff125a" : 112.36619,…
}
Key
Values
Access and Explore Data
1
Timestamp

17
Access a Sample of Data
Raw Data
Timetable
Access and Explore Data
1
✓ Decode JSON data
✓ Create Timetable
18
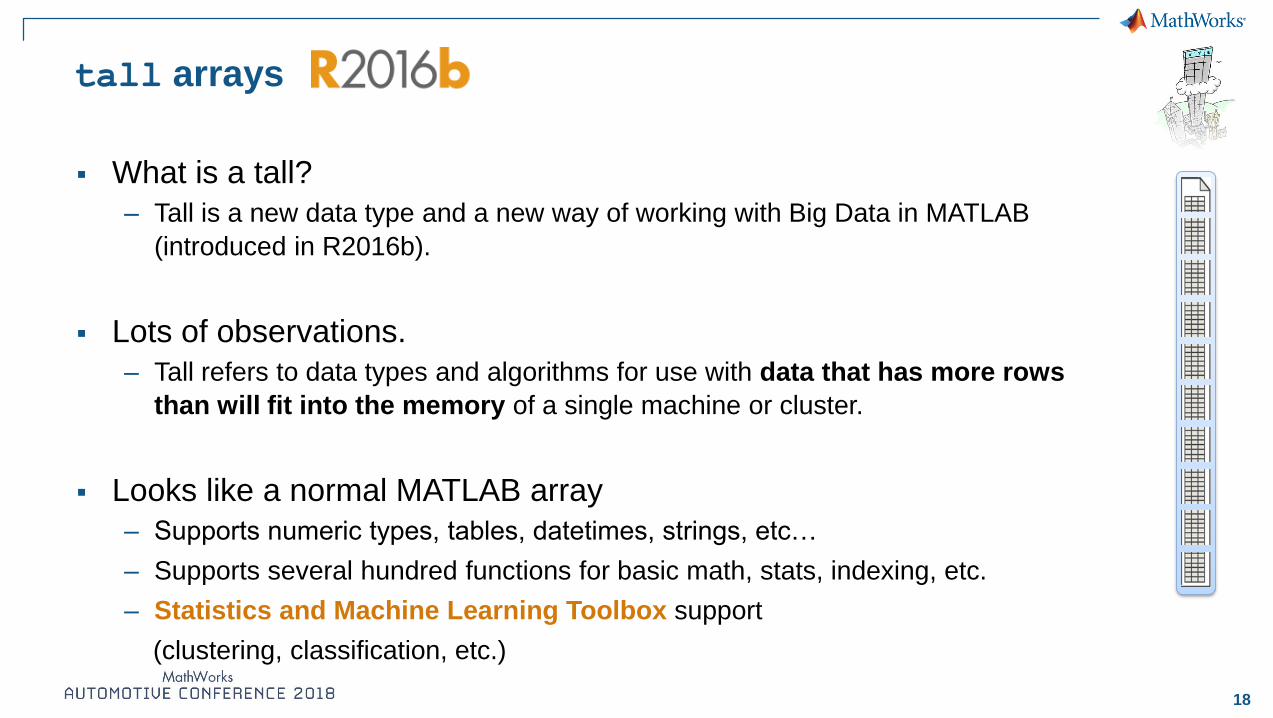
tall arrays
▪ What is a tall?
– Tall is a new data type and a new way of working with Big Data in MATLAB
(introduced in R2016b).
▪ Lots of observations.
– Tall refers to data types and algorithms for use with data that has more rows
than will fit into the memory of a single machine or cluster.
▪ Looks like a normal MATLAB array
– Supports numeric types, tables, datetimes, strings, etc…
– Supports several hundred functions for basic math, stats, indexing, etc.
– Statistics and Machine Learning Toolbox support
(clustering, classification, etc.)

19
tall array
Single
Machine
Memory
tall arrays
▪ Automatically breaks data up into
small “chunks” that fit in memory
▪ Tall arrays scan through the
dataset one “chunk” at a time
▪ Processing code for tall arrays is
the same as ordinary arrays
Single
Machine
MemoryProcess
20
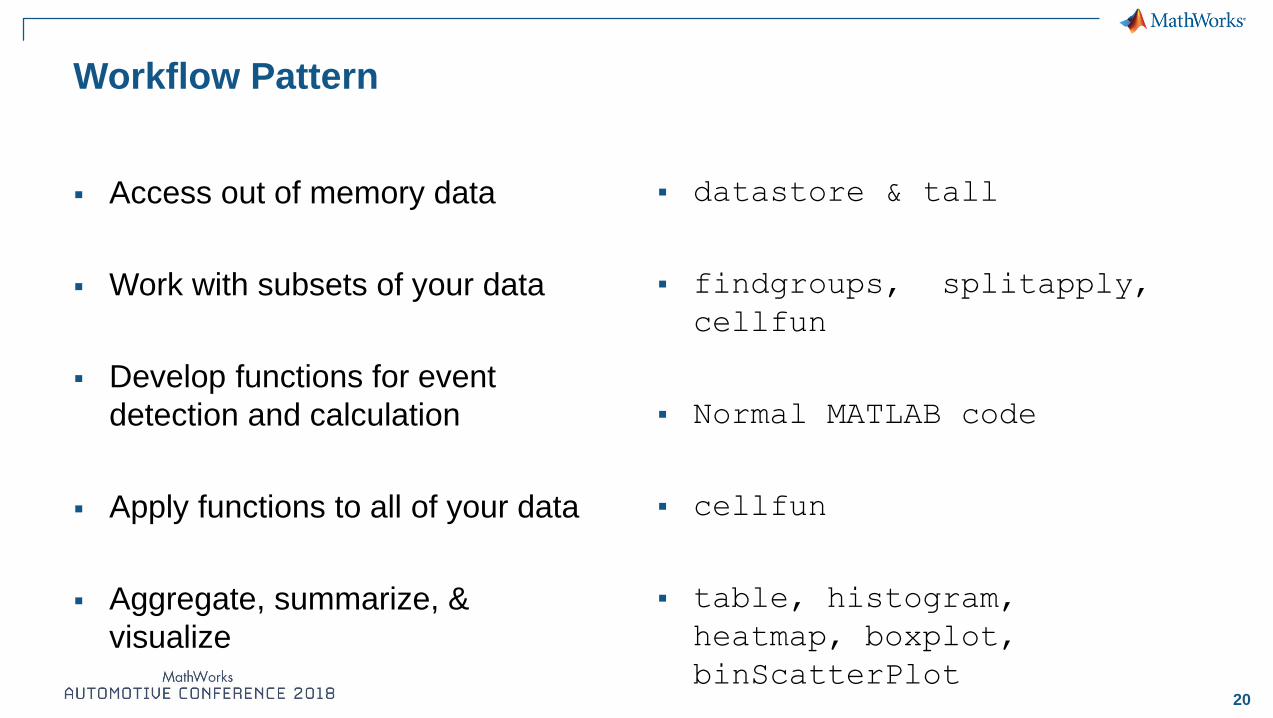
Workflow Pattern
▪ Access out of memory data
▪ Work with subsets of your data
▪ Develop functions for event
detection and calculation
▪ Apply functions to all of your data
▪ Aggregate, summarize, &
visualize
▪ datastore & tall
▪ findgroups, splitapply,
cellfun
▪ Normal MATLAB code
▪ cellfun
▪ table, histogram,
heatmap, boxplot,
binScatterPlot

21
Enterprise IntegrationIntegrate MATLAB analytics into your technology stack

22
Key Takeaways
▪ Achieve success in Vehicle Fleet Analytics by utilizing new MATLAB data types, specifically tall Arrays for out of memory data sets
▪ Leverage timetables and the functions built to work on them to help do
the difficult time-series tasks (synchronize and retime)
▪ Scale your work up with parallel computing toolbox on the desktop or the
MATLAB Distributed Computing Server on Hadoop
23© 2018 The MathWorks, Inc.
© 2018 The MathWorks, Inc. MATLAB and Simulink are registered trademarks of The MathWorks, Inc. See www.mathworks.com/trademarks for
a list of additional trademarks. Other product or brand names may be trademarks or registered trademarks of their respective holders.