analyzing industry structure
TRANSCRIPT

1
Source: freedigitalphotos.net

2
“If everyone can do it, it’s difficult to create and capture value from it.”
or, alternatively
“In a perfectly competitive market, no
3
In a perfectly competitive market, no firm realizes economic profits (rents).”
Monopoly Rents (Industrial Organization View)
Ricardian Rents(Resource Based View)
Schumpeterian Rents(Dynamic Capabilities View)
P
Q
S
D
S’P
Q
S
D
(Industrial Organization View)
S’P
q1
AC 2
MC 1
q2
AC 1
MC 2
P
q1
AC 2
MC 1
(Resource Based View)
q2
AC 1
MC 2
( y p )
-Barriers to entry-Industry structure matters
-Barriers to imitation-Firm structure matters
-Markets are dynamic-Innovation matters

3
The Industrial Organization Perspective:
Premise that industry structure matters most
Economic rents due to barriers to competition (i l )
P
S
S’
The Industrial Organization Perspective:
(i.e. monopoly rents)
Some industries are more profitable than others
QD
mFo
rtun
e 50
0 20
09, m
oney
.cnn
.com
6
Sour
ce:

4
Bargaining Power of Suppliers
Intensity of Rivalry
Bargaining Power of Buyers
Threat of Entry
Suppliers y
Threat of Substitutes
Buyers
Bargaining Power of Suppliers
Intensity of Rivalry
Bargaining Power of Buyers
Threat of Entry
Suppliers y
Threat of Substitutes
Buyers

5
Entry is less likely when ...
1. Entrant faces high sunk costs
sunk costs are investments that cannot be recovered
2. Incumbents have a competitive advantagepotential entrants are at a competitive disadvantage compared to existing players, simply not profitable to enter
3. Entrant faces retaliation potential entrants are likely to be forced out of business by strategic (pricing) behavior of incumbents
Point: For sunk costs, emphasize non-recoverability (vs. large recoverable capital investment)large recoverable capital investment)Ex: R&D, hotel vs. big boxCounter Example:Leasing airplanes
Slide: Potential BarriersEx: Patents, etc: Taxis, Doctors, LawyersEx: Pioneering Brands: Quicken, Coke & Pepsi,
Foundations of Strategy
Ex: Pioneering Brands: Quicken, Coke & Pepsi, NikeEx: Pre-commitment: SWA in Detroit

6
Entry is less likely when ...
1. Entrant faces high sunk costs
sunk costs are investments that cannot be recovered
2. Incumbents have a competitive advantagepotential entrants are at a competitive disadvantage compared to existing players, simply not profitable to enter
3. Entrant faces retaliation potential entrants are likely to be forced out of business by strategic (pricing) behavior of incumbents
Patents & licensesPatents & licenses
Pioneering brands
Pre-commitment contracts (e.g., distribution)
Large economies of scale (relative to demand)
Steep learning (experience) curves
Others

7
Slide: Economies of scalePoint: C = αqβ : calculate using regression ln C = ln α + β Point: C = αqβ : calculate using regression ln C = ln α + β
ln qPoint: Talk about slope
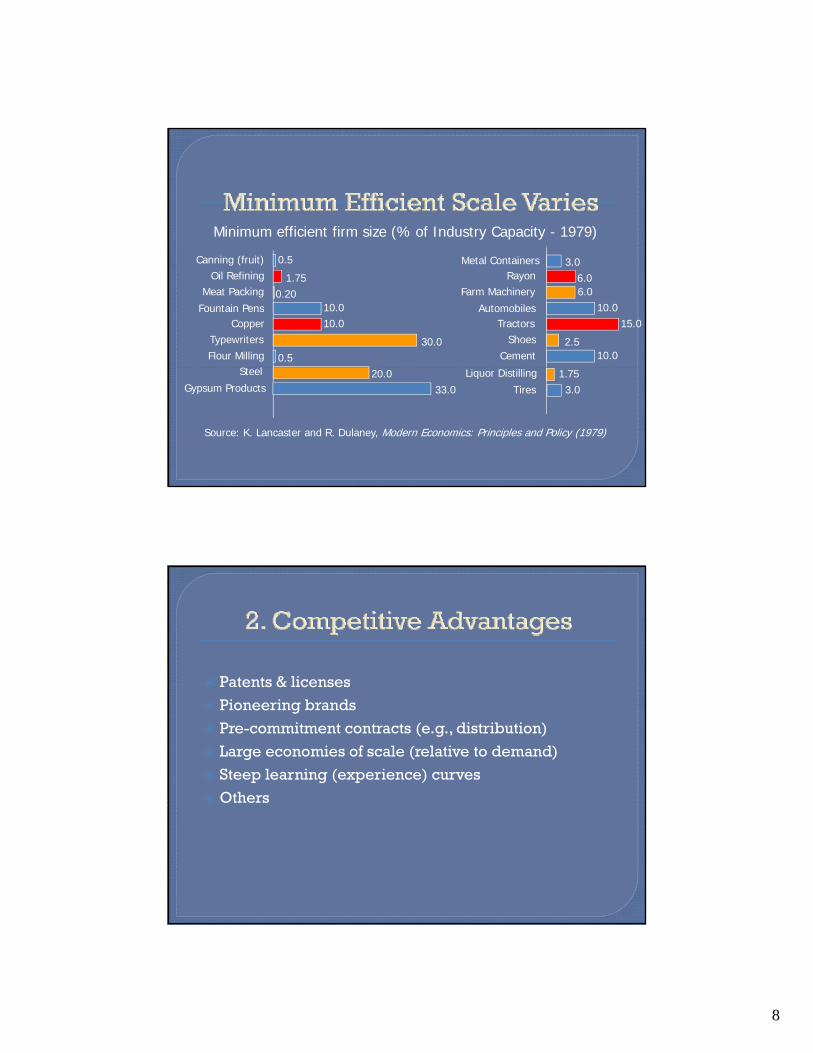
Slide: MESPoint: Expressed as market share, could change as
market grows
Foundations of Strategy
Slide: Learning curvesPoint: Similar to EOS, could be qualityEx: Far better at working with team by Term 2!
$
AC
OutputMES
8
Minimum efficient firm size (% of Industry Capacity - 1979)
Canning (fruit)Oil Refining
Meat Packing
Fountain PensCopper
TypewritersFlour Milling
Metal Containers0.5
1.750.20
10.010.0
30.00.5
3.06.06.0
10.015.0
2.510.0
RayonFarm Machinery
AutomobilesTractors
ShoesCement
S l Liquor Distilling 1.753.0
20.033.0 Tires
Steel
Gypsum Products
Source: K. Lancaster and R. Dulaney, Modern Economics: Principles and Policy (1979)
Patents & licensesPatents & licenses
Pioneering brands
Pre-commitment contracts (e.g., distribution)
Large economies of scale (relative to demand)
Steep learning (experience) curves
Others

9
Unit cost
Cumulative output over time

10
Entry is less likely when ...
1. Entrant faces high sunk costs
sunk costs are investments that cannot be recovered
2. Incumbents have a competitive advantagepotential entrants are at a competitive disadvantage compared to existing players, simply not profitable to enter
3. Entrant faces retaliation potential entrants are likely to be forced out of business by strategic (pricing) behavior of incumbents
Excess capacity of incumbentsp y
Economies of scale or other cost advantage
Substantial exit costs
• Exit costs are payments that must be made upon exit
• Exit costs provide an incentive to fight
Aggressive reputation of incumbents
• Must be credible
• Suffers from free-riding problem
11
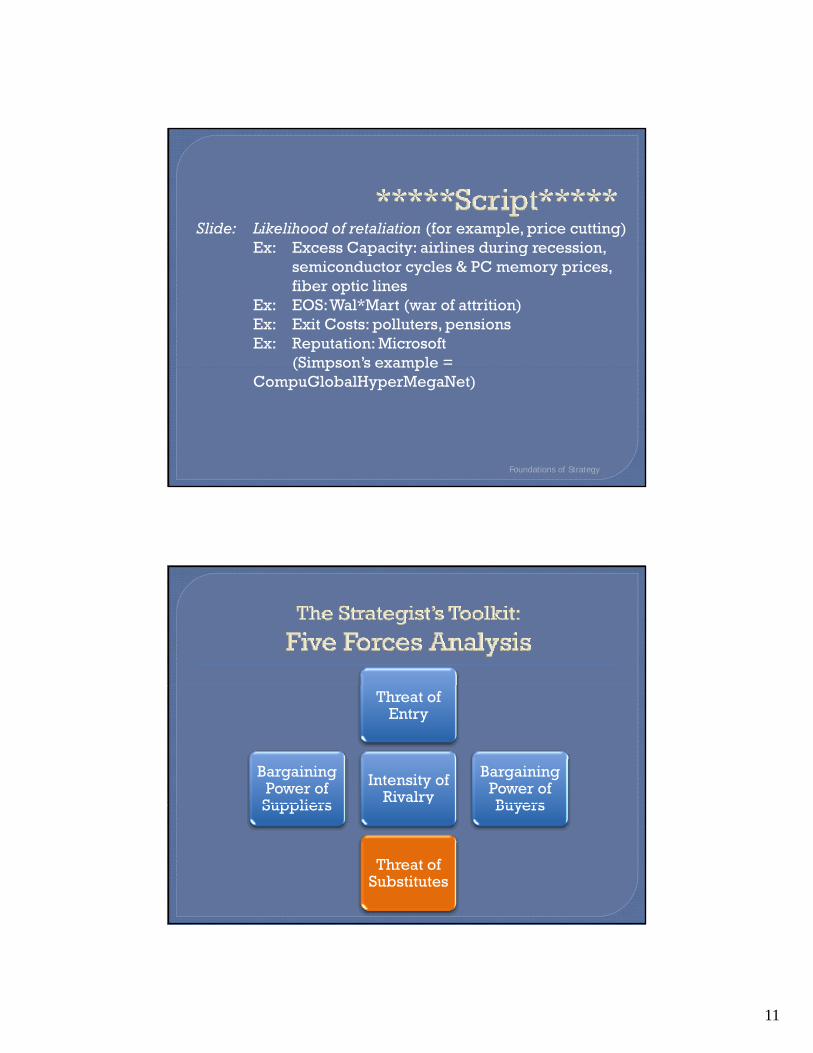
Slide: Likelihood of retaliation (for example, price cutting)Ex: Excess Capacity: airlines during recession Ex: Excess Capacity: airlines during recession,
semiconductor cycles & PC memory prices, fiber optic lines
Ex: EOS: Wal*Mart (war of attrition)Ex: Exit Costs: polluters, pensionsEx: Reputation: Microsoft
(Simpson’s example =
Foundations of Strategy
(Simpson s example CompuGlobalHyperMegaNet)
Bargaining Power of Suppliers
Intensity of Rivalry
Bargaining Power of Buyers
Threat of Entry
Suppliers y
Threat of Substitutes
Buyers

12
Substitute products are less of a threat when ...
1. Cross-price elasticity of demand is low
2. Switching costs are highone-time costs customers incur when switching to a new product or service
Slide: Cross-Price ElasticityEx: Cellular vs landline 10 yrs ago & now; more Ex: Cellular vs. landline, 10 yrs ago & now; more
generally, digital convergenceEx: butter vs. margarine VS gas vs. alternatives
Note: Negative CPE implies complements
Slide: Switching CostsEx: Cellular vs. landline & number portability
Foundations of Strategy
Ex: Cellular vs. landline & number portabilityEx: car rentals vs. public transport

13
The ratio of the % change in demand for one good given a 1% increase in price of another good
P1 P1P1
given a 1% increase in price of another good.
Q2Perfectly /Infinitely
Elastic Demand
Q2Perfectly
Inelastic Demand
Q2
“Moderately” Elastic Demand
The ratio of the % change in demand for one good given a 1% increase in price of another good
P1 P1P1
given a 1% increase in price of another good.
Q2Perfectly /Infinitely
Elastic Demand
Q2Perfectly
Inelastic Demand
Q2
“Moderately” Elastic Demand

14
Substitute products are less of a threat when ...
1. Cross-price elasticity of demand is low
2. Switching costs are highone-time costs customers incur when switching to a new product or service
Bargaining Power of Suppliers
Intensity of Rivalry
Bargaining Power of Buyers
Threat of Entry
Suppliers y
Threat of Substitutes
Buyers

15
Slide: Buyer BP, point 1 (buyers not concentrated) Ex: Counter example McDonald’s & CokeEx: Counter example -- McDonald s & Coke
Slide: Relative Concentration Ex: Monopoly = Wintel
Competitive = PCMonopsony = Hops in mass beerMutual = military aircraft
Foundations of Strategy
Buyers have less power when ...
1. Buyers are not concentrated (no monopsony)• Many potential buyers• Each accounts for a small fraction of sales
2. Buyers have few options• Products are differentiated (low intra-industry CPE)• High switching costs (relationship-specific assets)• Buyer cannot backward integrate
3. Buyers are segmented• Price information is not widely available• Price discrimination possible• Bundling possible

16
Buyer
Many
Few
MonopolyPower
MonopsonyPower
Competitive
MutualDependence
Supplier
ManyFew
Slide: Buyer BP, point 2 (few buyer options) Ex: Differentiation: Coke & PepsiE S i hi M Wi l Ex: Switching costs: Mac vs. Wintel, contract
manufacturersEx: B. Integration: large industrial customers &
electricity
Slide: Buyer BP, point 3 (segmentation)Ex: Information not widely available: Mattress modelsSlide: Price DiscriminationEx: 1st degree: Auto sales, college tuition, auctions
2nd degree: Airlines w/ travel dates
Foundations of Strategy

17
Buyers have less power when ...
1. Buyers are not concentrated (no monopsony)• Many potential buyers• Each accounts for a small fraction of sales
2. Buyers have few options• Products are differentiated (low intra-industry CPE)• High switching costs (relationship-specific assets)• Buyer cannot backward integrate
3. Buyers are segmented• Price information is not widely available• Price discrimination possible• Bundling possible

18
PP
D
S
Producer Surplus
pc
ConsumerSurplus
Q
D
qc
P i $60Profits = $60M
Price
$20
$40
$60
Profits = $100M
Profits = $60M
Demand (Millions)
1 2 3
Profits = $60M

19
WTP for Product TypeConsumer Type A B C D Total
HR $100 $90 $70 $20 $280
Engineers $60 $120 $70 $70 $290
Sales $100 $80 $140 $60 $380
Consultants $70 $100 $60 $80 $310
Min. WTP for product $60 $80 $60 $20 $220
Bargaining Power of Suppliers
Intensity of Rivalry
Bargaining Power of Buyers
Threat of Entry
Suppliers y
Threat of Substitutes
Buyers

20
Suppliers are less of a threat when ...
1. Sellers are not concentrated (no monopoly)
2. Firms have many alternatives• many substitutes for supplier’s products• firms face low switching costs• supplier cannot forward integrate
3. Sellers may not treat segments differently• price information is widely available• price discrimination not possible
Bargaining Power of Suppliers
Intensity of Rivalry
Bargaining Power of Buyers
Threat of Entry
Suppliers y
Threat of Substitutes
Buyers

21
Note: Big issue is concentration. Economists have long been interested in this issue…
Slid B t d C tSlide: Bertrand vs CournotNote: Both are “one-shot” games with simultaneous
moves
Note: In the end, there is wide variance across industries.Note: Consider duopolies,
Coke vs. Pepsi (favorable)Bud vs. Miller (favorable)B i Ai b ( t ti )Boeing vs. Airbus (contentious)
Note: More useful to think about two broad conditions….
Foundations of Strategy
Slide: Intensity of rivalryNote: Catch 22 -- many of the factor that lower the y
incentives to “fight” also lower barriers to entryEx: Cyclical demand (autos, hotels in college towns,
PCs)
Slide: Value of coordinationPoint: So reduce output, raise priceSlide: Illegal forms of coordination, Crandall exampleA k Wh i OPEC i ?Ask: Why is OPEC not anti-trust?Note: What is allowed is various forms of tacit collusion…
Foundations of Strategy

22
Rivalry is less intense when ...
1. The number of competitors is small !!!!!
2. Incentives to “fight” are low• Substantial market growth (especially if capacity constrained)• Opportunities to differentiate• Low exit costs• Little excess capacity (demand is not cyclical)
3. Coordination is feasible• Explicit price / market fixing (antitrust violation!)
• Tacit coordination (implicitly holding prices high, differentiating)
ACMCACMC
Price Taker Monopolist (or Cartel)
AC
PM
qM
DMR
PC
qC
AC
qM
MCqqPPqqPPMR
MCMR
=∂∂+∂∂+=
=→
*/*/
maxπ
MCPPMR
MCMR
==
=→maxπ
23
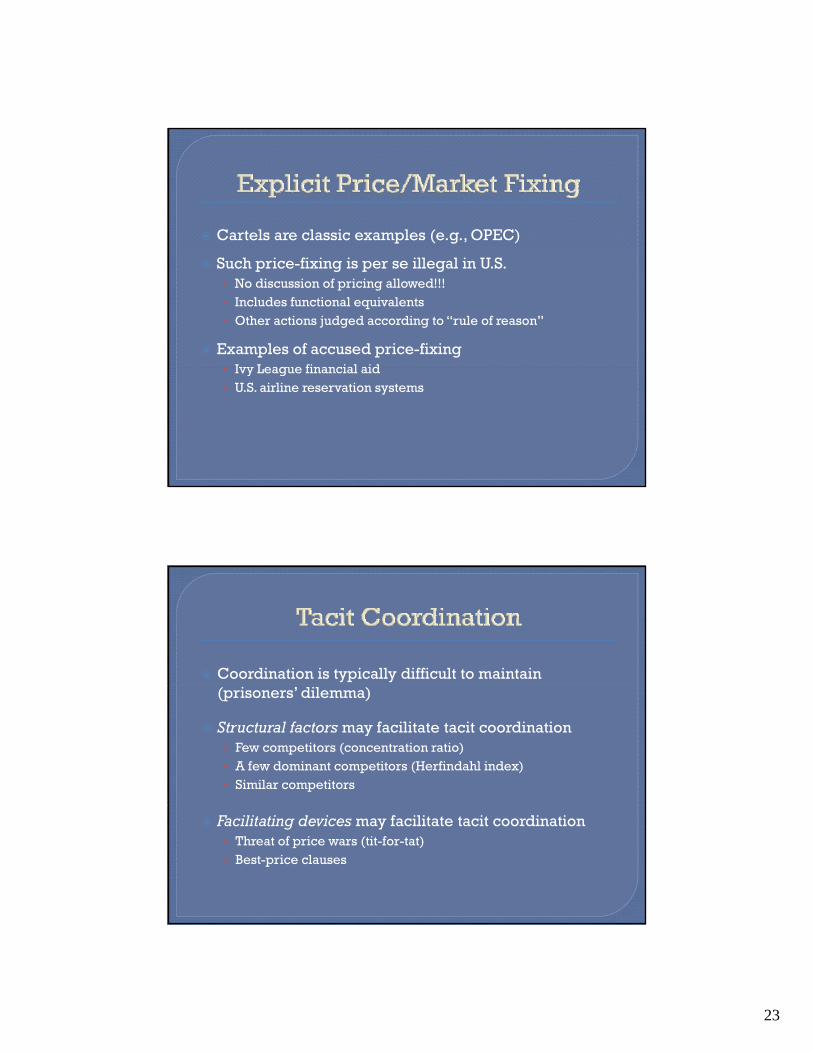
Cartels are classic examples (e.g., OPEC)
Such price-fixing is per se illegal in U.S.• No discussion of pricing allowed!!!• Includes functional equivalents• Other actions judged according to “rule of reason”
Examples of accused price-fixingIvy League financial aid• Ivy League financial aid
• U.S. airline reservation systems
Coordination is typically difficult to maintain (prisoners’ dilemma)
Structural factors may facilitate tacit coordination• Few competitors (concentration ratio)• A few dominant competitors (Herfindahl index)• Similar competitors
Facilitating devices may facilitate tacit coordination • Threat of price wars (tit-for-tat)• Best-price clauses

24
Bargaining Power of Suppliers
Intensity of Rivalry
Bargaining Power of Buyers
Threat of Entry
Suppliers y
Threat of Substitutes
Buyers
Bargaining Power of Suppliers
Intensity of Rivalry
Bargaining Power of Buyers
Threat of Entry
Suppliers
Role of Compliments
y
Threat of Substitutes
Buyers
Role of Institutions

25
Complements are products for which a decrease in price will increase demand for the target product (i.e., p g p ( ,negative cross-price elasticity)Examples: computers and software, VCRs and video tapes, bread and butter (?), guns and bullets
Important issues:• Who controls complementary products?• Who has bargaining power firms in the industry • Who has bargaining power, firms in the industry
or providers of complementary products?
Institutions set “the rules of the game”• Antitrust law and enforcement• Legal barriers to entry, trade (“natural”
monopolies)• Policymaking institutions (policy stability)• Institutions may be influenced by players

26
Raise switching costs (e.g., frequent flyer programs)Differentiate (e.g., Swatch watches)Coordinate – tacitly of course (e.g., best-price clauses)Consolidate (e.g., telecoms industry)Integrate – vertically, that is (e.g., M&A in media)Innovate (e.g., CFCs to HCFCs)Certify / Lobby (e.g., lawyers, doctors)y y ( g , y , )
A key task in a strategic analysis is to identify and dd h i i f h li i i address the competitive forces that limit economic
rents:
• Entry is less likely when incumbent firms have a competitive advantage and can credibly retaliate against new entrants.
• Substitution is less likely when switching costs are high and cross-price elasticity is low.
• Buyer and supplier power depend on relative concentration, the viability of alternatives, and information availability.
• Rivalry is more intense when incentives to fight are large and tacit coordination is difficult.
52