analyzing linen usage at the university hospital and the ...ioe481/ioe481_past_reports/w1302.pdf ·...
TRANSCRIPT
Analyzing Linen Usage at the University Hospital and the Children and Women’s Hospital
Final Report Submitted to: Mr. Rolando Croocks Director of Laundry, University of Michigan Hospital Laundry Services Ms. Barbara Wetula Assistant to Chief of Nursing, University of Michigan Health System Ms. Sheri Chisholm Lean Coach, University of Michigan Health System Ms. Marianne Pilat Lean Coach, University of Michigan Health System Ms. Mary Duck Lean Coach, University of Michigan Health System IOE 481 Instructor, University of Michigan – College of Engineering Submitted by: Mr. Cheng Chen, Mr. Robert Poon, Mr. Matt Shirer, & Ms. Maggie Zhang IOE 481 Team 2, Industrial and Operations Engineering Date submitted: April 30, 2013
TABLE OF CONTENTS Executive Summary 1 Background 1 Methodology 1 Findings 2
Observation 2 Nurse Servers 2 Walkthrough 2
Discharge 2 Survey 2 Interviews 3 Overall Findings 3 Conclusions and Recommendations 3 Introduction 4 Background 4 Key Issues 5 Goals and Objectives 5 Project Scope 5 Methods 6 Data Collection Methods 6 Observations 6 Nurse servers 6 Walkthrough (clean linens in patients’ rooms) 6 Discharge rooms 7 Survey 7 Interviews 7 Ad-hoc 7 Formal 8 Data Analysis Methods 8 Findings 8 Observations 8 Nurse Servers 9 Walkthrough 9 UH 9 C&W 10 Discharge 11 UH 11 C&W 15

UH and C&W Combined 17 Survey 20 UH 20 C&W 22 Bed changing policy 22 Interviews 23 UH 23 C&W 24 Overall Findings 24 Nurse servers 24 Walkthrough 25 Bed Changing Policy 25 Financial Cost of Waste – April 2012 to February 2013 25 Conclusions and Recommendation 26 Nurse Servers 26 Walkthrough 26 Recommendation for clean linen presence in patients’ rooms 26 Bed Changing Policy 27 Recommendation for bed changing policy 27 Recommendations for Future Areas of Focus 27 Expected Impact 28 References 29 Appendices 30
Appendix A: Nurse Server Findings 30 Appendix B: Walkthrough Observation Statistics 32 Appendix C: UH Discharge Findings 33 Appendix D: C&W Discharge Findings 34 Appendix E: Overall Findings 35
Appendix F: Financial Cost of Waste – April 2012 to March 2013 37 Appendix G: Detailed Survey Results 38
LIST OF TABLES AND FIGURES Table 1: Clean linen placement in patients’ rooms by units – UH 10 Table 2: Clean linen placement in patients’ rooms by units – C&W 11 Figure 1: Distribution of waste by quantity – UH 12 Figure 2.1: Percentage of waste by units – UH 13 Figure 2.2: Average number of waste per discharge room with waste by units – UH 13 Figure 3: Percentage and average linen waste per discharge room with waste – Non-ICU vs. ICU 14 Figure 4: Percentage vs. average waste per discharge impact – UH 14 Figure 5: Distribution of waste by quantity – C&W 15 Figure 6.1: Percentage of waste by units – C&W 16 Figure 6.2: Average number of waste per discharge room with waste by units – C&W 16 Figure 7: Percentage vs. average waste per discharge impact – C&W 17 Figure 8: Percentage and average linen waste per discharge with waste – UH and C&W 18 Figure 9: Frequency vs. average waste per discharge impact – UH and C&W 18 Table 3: Average waste impact per unit 19 Figure 10: Distribution of the types of linens wasted – UH and C&W 20 Figure 11: Distribution of linen types that are stocked in patients’ rooms 21 Figure 12: Average number of clean linens stocked in nurse servers 21 Figure 13: Percentage of times that a type of item makes up a bed 22 Figure 14: Average number of items that makes up a bed 23 Table 4: Cost of linen waste from April 2012 to February 2013 26

1
EXECUTIVE SUMMARY The University of Michigan Health System (UMHS) Laundry Services Department has been receiving an observable amount of clean, still-folded linen to be washed again. The department is concerned that this wasted linen may be caused by the increase of linen usage by the UMHS. Since the Laundry Services Department’s operational and usage costs are directly related to this waste, a concern is that there may be a deeper underlying cause for the perceived linen waste. No specific cause for the increase in linen waste has been verified, therefore, the Laundry Services Department asked a student team from IOE 481 at the University of Michigan to verify or dismiss three main perceptions of linen waste. These perceptions, include:
1. Fresh linens are discarded frequently, to be re-washed after a patient’s discharge 2. Bed-making policies may be inconsistent, causing linen waste 3. Nurse servers are inconsistently used, creating waste when linens are stored in rooms
In order to satisfy the project goal of verifying/denying these perceptions, data was collected and analyzed from inpatient rooms at University Hospital (UH) and Children and Women (C&W) through observations, survey, and interviews. Following the analysis, conclusions and recommendations were developed for efficient linen usage as well as laying out the next steps. Background Between 2008-2013, linen consumption has steadily increased from 7.5 million pounds to over 9 million pounds [1]. With the amount of linen consumption increasing, the associated total expense required to support laundry services is growing as well. Furthermore, the Facility Audit Report of UMHS’s linen service by Standard Textile, Inc. showed that in 2009, UMHS used 1.07 more pounds per adjusted patient day of linen than other facilities in this industry [2]. The cause of the increase in linen usage is unknown, however, speculations exist that there is a direct relationship between overall usage and linen waste. There are many different opportunities for linen to be wasted. One such way is through bed changes: all patients’ beds need to be changed frequently. There are also inconsistent uses of the nurse servers, which are the cabinets outside the patient rooms used to store medical supplies and linens in UH. Linens are sometimes left in patients’ rooms – these linens need to be discarded after the patient leaves regardless of whether or not it was used. All these opportunities can cause waste, emphasizing the importance to verify or dismiss the existing waste perceptions to narrow down the cause of linen waste. Methodology The team performed several tasks to verify, dismiss, and quantify the perceptions of linen waste to determine if they contribute to linen waste.
• Conducted literature review. The purpose of the literature review was to see if other hospitals have discovered efficient linen usage. Findings from the past IOE 481 projects were used as guidelines for the project’s data collection and analysis methods.
• Observed nurse servers to determine trends. The team documented nurse servers in UH to have medical supplies, linens, or both. A total of 302 nurse servers were observed.
2
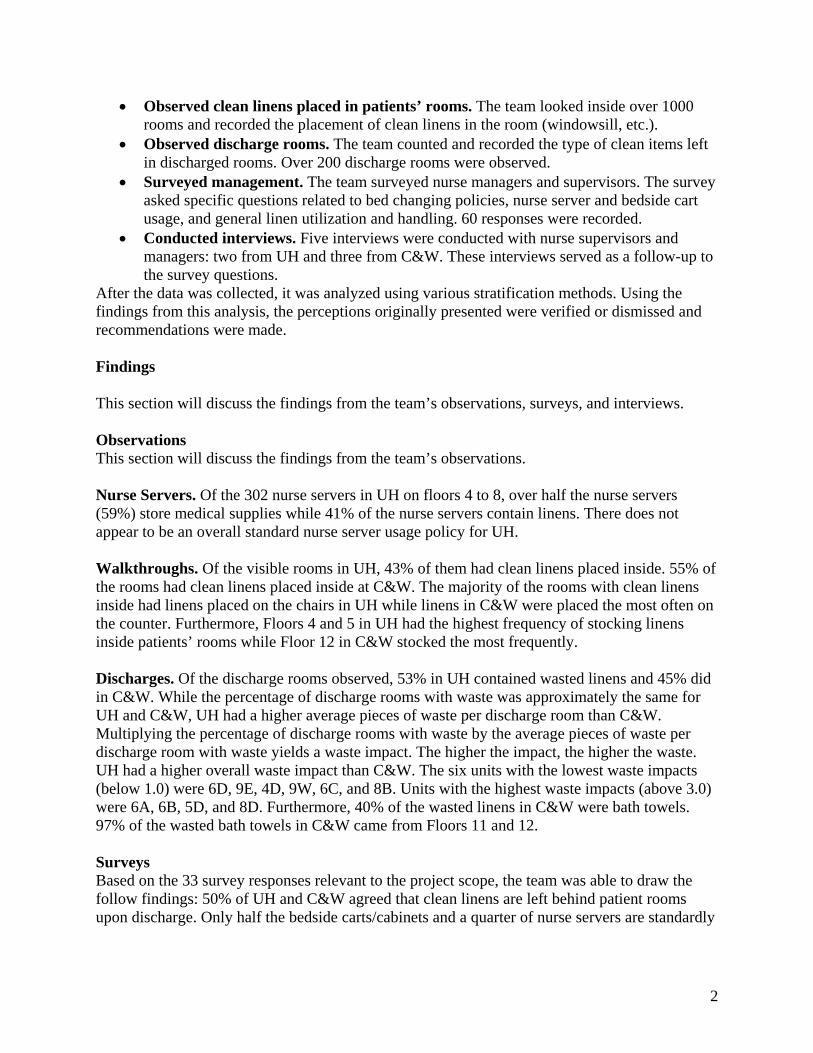
• Observed clean linens placed in patients’ rooms. The team looked inside over 1000 rooms and recorded the placement of clean linens in the room (windowsill, etc.).
• Observed discharge rooms. The team counted and recorded the type of clean items left in discharged rooms. Over 200 discharge rooms were observed.
• Surveyed management. The team surveyed nurse managers and supervisors. The survey asked specific questions related to bed changing policies, nurse server and bedside cart usage, and general linen utilization and handling. 60 responses were recorded.
• Conducted interviews. Five interviews were conducted with nurse supervisors and managers: two from UH and three from C&W. These interviews served as a follow-up to the survey questions.
After the data was collected, it was analyzed using various stratification methods. Using the findings from this analysis, the perceptions originally presented were verified or dismissed and recommendations were made. Findings This section will discuss the findings from the team’s observations, surveys, and interviews. Observations This section will discuss the findings from the team’s observations. Nurse Servers. Of the 302 nurse servers in UH on floors 4 to 8, over half the nurse servers (59%) store medical supplies while 41% of the nurse servers contain linens. There does not appear to be an overall standard nurse server usage policy for UH. Walkthroughs. Of the visible rooms in UH, 43% of them had clean linens placed inside. 55% of the rooms had clean linens placed inside at C&W. The majority of the rooms with clean linens inside had linens placed on the chairs in UH while linens in C&W were placed the most often on the counter. Furthermore, Floors 4 and 5 in UH had the highest frequency of stocking linens inside patients’ rooms while Floor 12 in C&W stocked the most frequently. Discharges. Of the discharge rooms observed, 53% in UH contained wasted linens and 45% did in C&W. While the percentage of discharge rooms with waste was approximately the same for UH and C&W, UH had a higher average pieces of waste per discharge room than C&W. Multiplying the percentage of discharge rooms with waste by the average pieces of waste per discharge room with waste yields a waste impact. The higher the impact, the higher the waste. UH had a higher overall waste impact than C&W. The six units with the lowest waste impacts (below 1.0) were 6D, 9E, 4D, 9W, 6C, and 8B. Units with the highest waste impacts (above 3.0) were 6A, 6B, 5D, and 8D. Furthermore, 40% of the wasted linens in C&W were bath towels. 97% of the wasted bath towels in C&W came from Floors 11 and 12. Surveys Based on the 33 survey responses relevant to the project scope, the team was able to draw the follow findings: 50% of UH and C&W agreed that clean linens are left behind patient rooms upon discharge. Only half the bedside carts/cabinets and a quarter of nurse servers are standardly

3
stocked with linens. Bed changing policies are not highly standardized in C&W. 82% of units at UH have a standard bed changing policy, but a large proportion of the units do not follow it. Interview Of the five units interviewed, all stated to change the patients’ beds daily. 7A in UH has a unique bed-changing policy where a bundle of linens are brought into the patients’ rooms upon a bed change. This serves as a visual cue that the bed has been changed. All units think there is linen wasted upon discharge. One unit in UH admits to hoarding linens in patient rooms. All units from UH attempted to stock linens in nurse servers, but failed to eliminate waste. Only half the units interviewed at C&W have standards for stocking bedside carts/cabinets. C&W interviewees claim that overstocking linens is uncommon and they try to do everything on “need basis”. Overall Analysis showed that there was no correlation between stocking clean linens in nurse servers and the amount of waste found during discharge, nor does it correlate with where clean linens are placed inside the patients’ rooms or not. Furthermore, placing linens inside patients’ rooms does not correlate with the amount of waste found during discharge for UH or C&W. In addition, units that follow a bed-changing policy associated with a lower waste impact than the units that do not have a bed changing policy. Finally, the calculated total cost of discharge waste based on data from April 2012 to February 2013 was $16,360.50 for UH and $2,510.79 for C&W. Conclusions and Recommendations In general, nurse servers do not play a role in creating or eliminating linen waste. This dismisses the perception that the inconsistent use of nurse servers affects linen waste. Further analysis showed that placing clean linens inside patients’ rooms does not affect the amount of discharge waste at UH or C&W. This means that the clean linens stocked in patients’ rooms are not necessary waste, but instead may end up being used. This dismisses the perception that clean linens left in patients’ rooms may affect linen waste. A recommendation would be to increase awareness that clean linens in patients’ rooms are not necessary waste. Findings showed that units that followed a bed changing policy had a lower average waste than units without a bed changing policy. Therefore, the perception that inconsistent bed-changing policies affect waste was verified. It is recommended that a subgroup look into implementing a minimum number of standard bed changing policies for units in UH and C&W. Since each unit houses different type of patients, it is recommended to first assess if the unit is feasible of sustaining a bed changing policy and then tailor the policy to each unit or a grouping of similar units. The bed-changing policy on Unit 7A should also be looked at to see if the standard is an effective one and if it should be standardized. Future studies should be conducted for the six units with a waste impact less than 1.0 (6D, 9E, 4D, 9W, 6C, and 8B) to determine why the waste impacts were low and how their practices can be applied to other units. Units with a waste impact above 3.0 (6A, 6B, 5D, and 8D) should also be examined to determine why linen waste was so high. Floors 11 and 12 in C&W should also be looked at to determine why there are such large proportions of bath towels wasted.

4
INTRODUCTION The University of Michigan Health System (UMHS) Laundry Services Department cleans and stock linen to all patient units of UMHS. Often, waste is observed when folded, unused linens are returned to the Laundry Services Department for reprocessing. This may be a result of a surplus of clean linens placed in patients’ rooms and discarded at the end of patients’ stay. The Laundry Services Department’s operational costs are linearly related to the amount of linens wasted. If there is wasted in the system, the operational and usage costs are directly affected. There are various perceptions of linen waste, but no detailed studies have been conducted to confirm these impressions. Hence, the Laundry Services Department wants to review linen practices and usages to verify or dismiss the perceptions. Furthermore, the Laundry Services Department wants to quantify the perceived perceptions, whether they are true or not. This project looked at the following perceptions of linen waste by gathering information through physical observations:
1. Fresh linens are discarded, to be cleaned after a patient’s discharge 2. Bed making policies may be inconsistent, causing linen waste 3. Nurse servers – cabinets outside the patients’ rooms in the University Hospital meant to
store supplies – are inconsistently used, creating waste when linens are stored in rooms A team of students from the University of Michigan’s Industrial and Operations Department (IOE 481 Team 2) has collected and analyzed data about linen practices and usages from UH and C&W. The purpose of this report is to detail the methods of the project, and includes the findings, conclusions, and recommendations of efficient linen practices and usages as well as future areas of focus. BACKGROUND The Laundry Services Department at UMHS supplies linens to the entire health system, servicing over 900 inpatient rooms in UH and C&W. Six times a day, soiled laundry from UH and C&W is brought to Laundry Services to be washed, dried, folded, stacked, and shipped back clean to the two hospitals. Clean linens are supplied based on an established par level and stocked to all inpatient areas seven days a week. Between 2008 and 2012, linen consumption has steadily increased from 7.5 million pounds to 8.5 million pounds. Current projections for 2013 will exceed 9 million pounds [1]. With the amount of linen consumption increasing, the associated total expense to support laundry services is growing as well. Furthermore, the Facility Audit Report of UMHS’s linen service by Standard Textile, Inc. showed that in 2009, UMHS used 1.07 more pounds per adjusted patient day of linen than other facilities in this industry [1]. While it is unclear why the linen consumption is increasing, there are a wide variety of speculations related to possible linen waste. This project will focus on three of these speculations including:
5
1. Inconsistent or lack of bed making policies 2. Disorganized and inconsistent use of nurse servers 3. Excess, unnecessary linens being brought into patients’ rooms
From an institutional perspective, it appears that there is a problem with wasted linens at the hospital, causing unnecessary expenses. Therefore, this project was designed to verify/dismiss and quantified the speculated issues before recommending changes to reduce the amount of wasted linens, thereby reducing costs. KEY ISSUES The following key issues are driving the need for this project:
1. Reported increase in linen consumption, which may be due to wasted linens 2. Observed increase of clean linens sent to the Laundry Services Department to be washed 3. Perceived excess linens stored in patients’ rooms 4. Perceived inconsistent bed changing policies 5. Perceived disorganized and inconsistent nurse servers
GOALS AND OBJECTIVES The goal of this project was to verify and quantify the perceived issues of linen wastage to determine if there is a significant amount of linen waste. Accomplishing this goal will allow future recommendations to be made and next steps to be taken, helping reduce the cost that wasted linens incur for the hospital (UH and C&W). To achieve this goal, IOE 481 Team 2 has addressed the following objectives:
1. Document clean linen placement in patients; rooms through walk-by observations 2. Determine each unit’s bed changing policies through observations, interviews, and
surveys 3. Document nurse server usage for the storage of linen 4. Observe room discharges and quantify linens wasted
PROJECT SCOPE The scope of the project included observations in UH floors 4 through 8 and C&W floors 9 through 12, specifically all inpatient rooms, nurse servers, and bedside carts. All other hospital units and patient rooms that are Contact Precaution were out of scope. Observations included determining each unit’s bed changing policies and standard items that make up the bed. Observations also included inspecting the nurse servers, documenting the placement of clean linens inside patients’ rooms, and compiling a list of clean linens left in the rooms after a patient’s discharge. The standard for the way nurse servers are used were determined using survey and interviews.

6
In scope clean linens that were looked at included pillowcases, gowns, bath towels, drawsheets, bath blankets, flat sheets, fitted sheets, bedspreads, baby blankets, sleep sacks, crib fitted, and cloth diapers. The project did not include the linen cleaning process at the Laundry Services Department. The project scope also excluded the observation of medical supplies (gloves, masks, etc.), other than those placed inside the nurse servers. METHODS To validate and quantify the perceived causes of wasted linens at the hospitals, both quantitative and qualitative data were collected and analyzed. Specifically, three types of data were collected from UH and C&W as followed:
1. Observation: room-to-room observations covering all in-scope units (quantitative) 2. Survey: Qualtrics-based survey for RN Managers and Supervisors 3. Interviews: ad-hoc and formal interviews of onsite hospital staff and managers
Additionally, a literature review was performed to find what other hospitals have discovered relating to efficient linen usage. Past IOE 481 projects related to UMHS linen usage were reviews as well. Findings from the literature review were used as guiding factors for the project’s data collection and analysis methodologies. Data Collection Methods There were three types of data collected for this project: observations, a survey, and interviews. Observations There were three types of observations: observing the nurse servers/bedside carts, documenting the placement of clean linens in patients’ rooms, and documenting the type and amount of clean linens in discharge rooms. Each team member observed for a total of 6-10 hours per week. All observations were completed between February 7 and March 25. All floors on UH and C&W were observed equally and for a wide range of times. Observation data were reviewed at the end of each week and observation times and floors were adjusted accordingly for the following week’s observations so that the team received a balanced amount of data. Nurse servers. Each team member observed all nurse servers on each A, B, C unit of UH on floors 4-8, ~80 nurse servers per floor. Each nurse server was recorded to contain linens, medical supplies, or both. Taped inside the door of each nurse server is picture or a list of the items that are standardly stocked in the nurse servers. The contents of each nurse server were examined, compared to the picture or list, and recorded regarding whether or not the standard of each nurse server was followed. Unique features about the nurse servers on each unit were documented as well. Walkthroughs. Each team member observed all inpatient rooms in UH floors 4-8 and C&W floors 9-12 for clean linens, ~ 900 rooms in total. Most of these observations were done during

7
the afternoon and early evening because many patients’ doors were closed in the early mornings and late evenings, preventing the team from looking inside the rooms and gathering the necessary data. The team looked inside each room and noted placement of clean linens if there were any present in the room. Otherwise, the room was recorded as “None.” Rooms were documented as “Missed” if the team was unable to see clearly inside or if the doors were closed. Discharge rooms. The team observed ~ 230+ patient rooms after the patients were discharged, documenting clean linens left behind. Unlike the observation of nurse servers and clean linens in patients’ rooms – which lasted throughout the entire observation span for February and March – the discharge observations were done for three weeks between February 21 and March 25. Each member had a pager that notified the student of a discharged room (rooms that had a patient who was discharged to go home) in UH and C&W. When paged, the team member went to the indicated room and compiled a list of the type and amount of clean linens left in the patient’s room. Any room that was cleaned by Environmental Services before the team could reach the room was marked as “Missed.” In order to help the team reach the discharge room before the Environmental Services cleaned the rooms, the team obtained a list of discharge rooms for the day from either Environmental Services or the nurses on each unit at the beginning of each observation. The team coordinators also contacted Environmental Services, asking them to have their workers save the removal of leftover linens until the end of their discharge process. The team did not go into Contact Precaution rooms. For discharged rooms in C&W, the team observed the bedside carts as well. Surveys The team wrote a survey for UH and C&W nurse managers and supervisors. These questions were developed based on the team’s general observations and ad-hoc interviews. The team’s clients and coordinators assisted in the development of the survey questions. The purpose of the survey was to determine standardized bed changing policies, nurse servers/bedside cart usage, and general linen usage practices to analyze linen waste. There were approximately 20 questions with a mix of multiple-choice, free response, and agreement-rating questions. The survey was done using online Qualtrics software. The team’s clients – the Assistant to Chief of Nursing and a C&W 12E Nurse Supervisor – distributed the survey via email to approximately 60 personnel on March 14. During the seven days that the survey was open, a total of 60 responses were logged. Interviews The team wrote a set of ad-hoc and formal interview questions for various hospital staff in UH and C&W. These questions were developed based on the team’s initial observations and the suggestions from the team’s clients and coordinators. All questions were reviewed and approved by the team’s clients and coordinators. Ad-hoc. The team talked to various hospital staff including stockkeepers, nurse technicians, Environmental Services, and many more during the team’s general observation rounds between February 7 and March 25. The purpose of these questions was to understand each unit’s linen utilization practices to determine if a standard exists. While the results from the ad-hoc interviews were few and inconsistent, the interviews did give the team an insight on a variety of general linen utilization and distribution practices.

8
Formal. These interviews were conducted with various nurse managers and supervisors in UH and C&W. The team split into two teams of twos; one team interviewed UH nurse managers and supervisors while the other team interviewed C&W nurses. The team’s clients, the Assistant to Chief of Nursing and the C&W 12E Supervisor, provided the team with a list of nurse managers and supervisors to contact for interviews. Emails were sent to 12 individuals, 8 responded, but only 6 were able to be interviewed – 3 from UH and 3 from C&W. The interviews served as a follow-up to the survey, which provided details on specific unit linen utilization practices. All interviews were ~30 minutes long and were conducted between March 26 and April 1. Data Analysis Methods The main goal of this project was to determine if the perception of linen waste is supported by data. Specifically, the main information driving this analysis is the linen waste occurrences during patient discharges. This data was analyzed for statistical significance and potential correlations between waste and causal factors in the following manner:
1. Calculation of hospital-wide proportions of rooms with linen waste at UH and C&W 2. Stratification (by weekdays, floors, and units) of linen waste proportions
• If the hospital-wide analyses showed a statistically significant difference in waste between UH and C&W, a by-unit or by-shift breakdown of data will be needed.
• This information was used to potentially identify units or shifts that have higher linen waste frequencies.
3. Potential analysis of correlations between waste and operational factors • If the detailed stratified data demonstrated linen waste, the next goal was to find
correlations between waste and operational factors. • These operational factors include information such as bed changing policies,
nurse server usage, and feedback from surveys. Once these analytical procedures were completed, we were able to demonstrate data-driven insight on whether there is statistically significant linen waste and if so, what could be causing it. FINDINGS Below are observations, survey, interviews, and overall findings analyzed from the three data collection methods. Each section is broken down by UH and C&W, except for the overall findings. Overall findings combines the findings from all the data collected and look more specifically at the three perceptions of waste as well as overall opportunities (units that have more or less waste) and the financial cost of waste over the past year. Observations Findings from the observations include usage the nurse servers, the placement of clean linens in patients’ rooms (walkthrough), and the documentation of the types and quantities of linens left in discharge rooms (discharge).
9
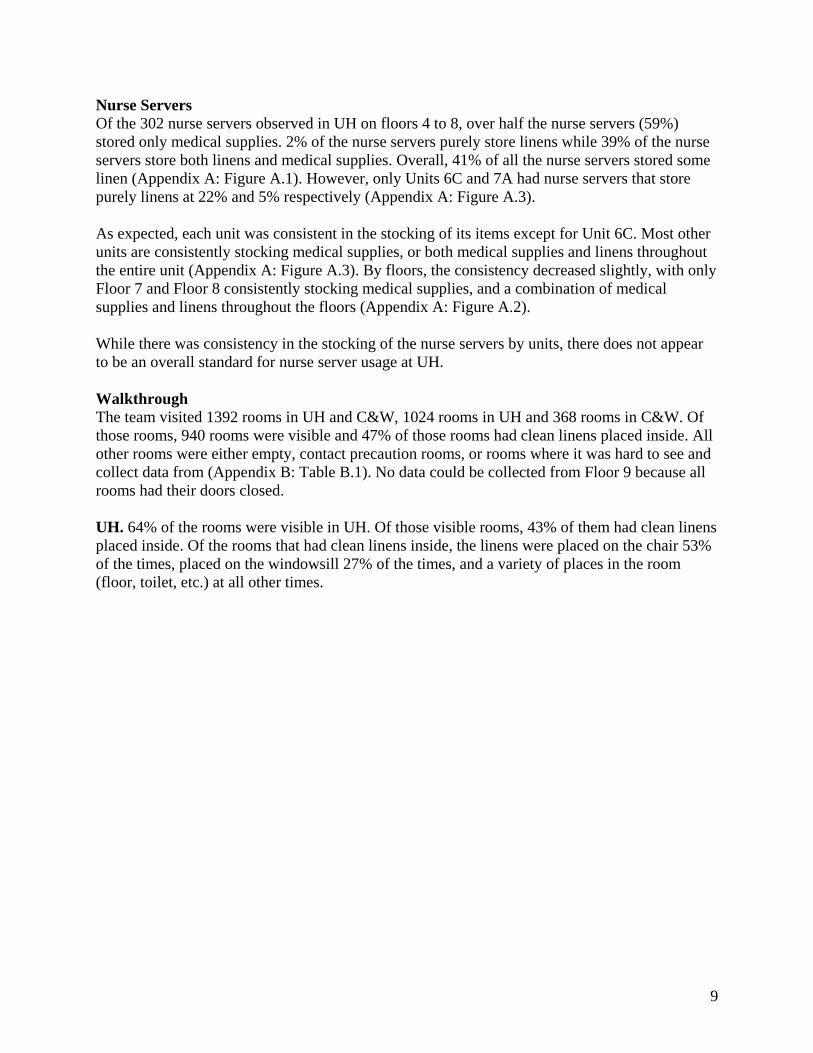
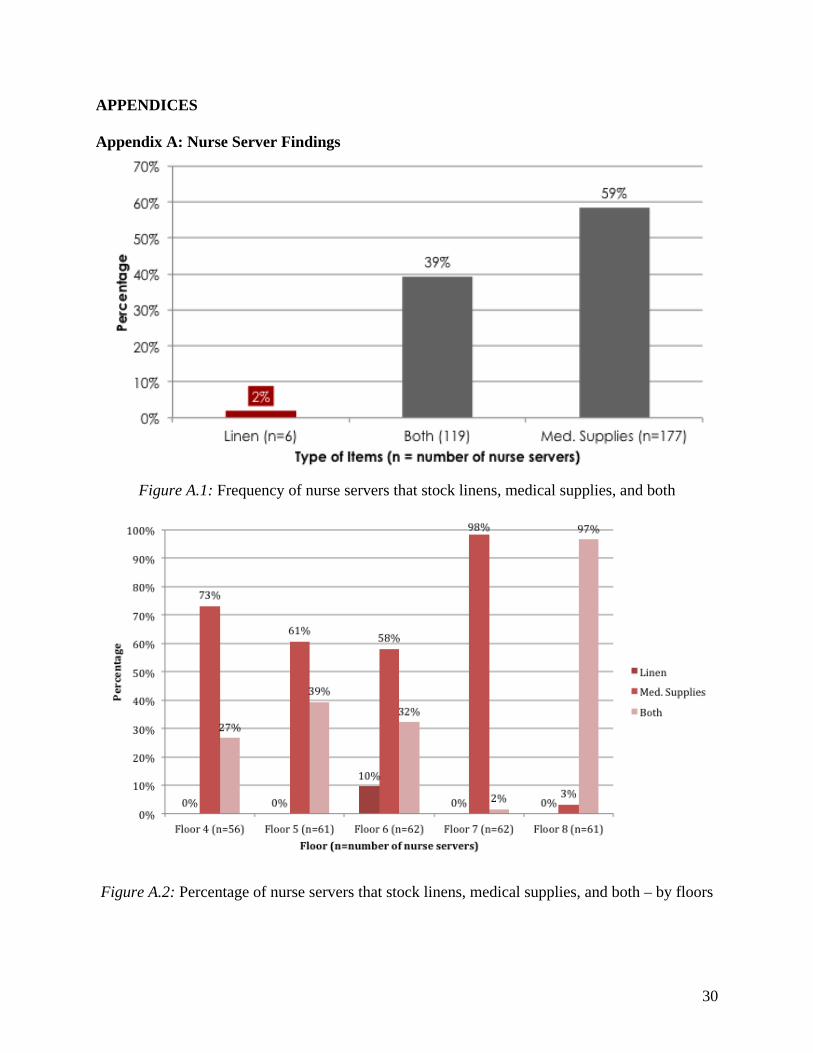
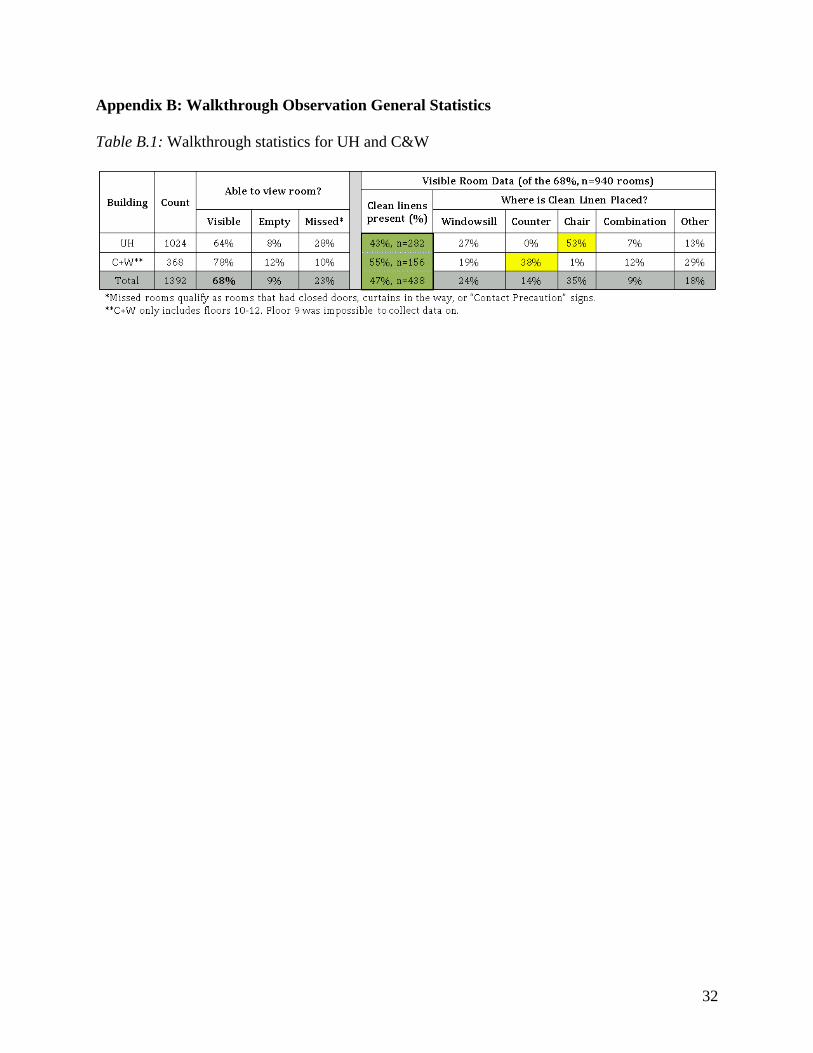
Nurse Servers Of the 302 nurse servers observed in UH on floors 4 to 8, over half the nurse servers (59%) stored only medical supplies. 2% of the nurse servers purely store linens while 39% of the nurse servers store both linens and medical supplies. Overall, 41% of all the nurse servers stored some linen (Appendix A: Figure A.1). However, only Units 6C and 7A had nurse servers that store purely linens at 22% and 5% respectively (Appendix A: Figure A.3). As expected, each unit was consistent in the stocking of its items except for Unit 6C. Most other units are consistently stocking medical supplies, or both medical supplies and linens throughout the entire unit (Appendix A: Figure A.3). By floors, the consistency decreased slightly, with only Floor 7 and Floor 8 consistently stocking medical supplies, and a combination of medical supplies and linens throughout the floors (Appendix A: Figure A.2). While there was consistency in the stocking of the nurse servers by units, there does not appear to be an overall standard for nurse server usage at UH. Walkthrough The team visited 1392 rooms in UH and C&W, 1024 rooms in UH and 368 rooms in C&W. Of those rooms, 940 rooms were visible and 47% of those rooms had clean linens placed inside. All other rooms were either empty, contact precaution rooms, or rooms where it was hard to see and collect data from (Appendix B: Table B.1). No data could be collected from Floor 9 because all rooms had their doors closed. UH. 64% of the rooms were visible in UH. Of those visible rooms, 43% of them had clean linens placed inside. Of the rooms that had clean linens inside, the linens were placed on the chair 53% of the times, placed on the windowsill 27% of the times, and a variety of places in the room (floor, toilet, etc.) at all other times.
10
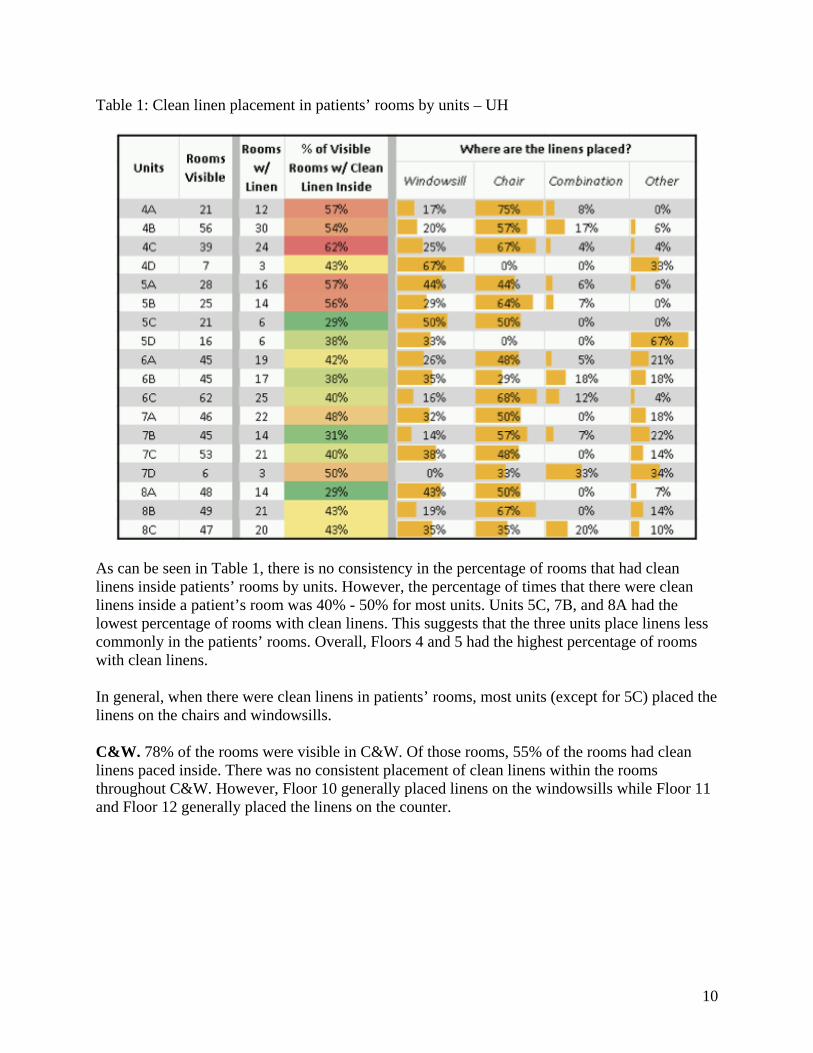
Table 1: Clean linen placement in patients’ rooms by units – UH
As can be seen in Table 1, there is no consistency in the percentage of rooms that had clean linens inside patients’ rooms by units. However, the percentage of times that there were clean linens inside a patient’s room was 40% - 50% for most units. Units 5C, 7B, and 8A had the lowest percentage of rooms with clean linens. This suggests that the three units place linens less commonly in the patients’ rooms. Overall, Floors 4 and 5 had the highest percentage of rooms with clean linens. In general, when there were clean linens in patients’ rooms, most units (except for 5C) placed the linens on the chairs and windowsills. C&W. 78% of the rooms were visible in C&W. Of those rooms, 55% of the rooms had clean linens paced inside. There was no consistent placement of clean linens within the rooms throughout C&W. However, Floor 10 generally placed linens on the windowsills while Floor 11 and Floor 12 generally placed the linens on the counter.

11
Table 2: Clean linen placements in patients’ rooms by units – C&W
As seen in Table 2, 10W and 10E had the lowest percentage of rooms with clean linens placed inside. 12W had the highest percentage of linens being placed in the patients’ rooms. This means that Floor 10 less commonly placed linens inside patients’ rooms than 12W. Discharge A total of 200 discharge events occurred at UH during 20 hours of observation and 67 discharge events for C&W during 17 hours of observations. While the observation hours for UH and C&W was approximately the same, C&W had considerably less discharge events than UH. 161 rooms were observed in UH and 49 were observed in C&W. Data from the rest of the rooms were unable to be collected either because the rooms were contact precaution, or the Environmental Services cleaned the rooms before the team arrived to quantify the types of clean linens left in the rooms. Of the rooms observed, 53% of the discharge rooms had waste in UH and 45% had waste in C&W. Must of this section look at the percentage and average pieces of waste per discharge rooms with waste. To calculate the percentage of rooms that contained waste, the number of discharge rooms with waste found was divided by the number of discharge rooms observed. This showed roughly how often waste appears in discharge rooms. To calculate the average pieces of waste found in a discharge room with waste, the total number of waste pieces found was divided over the number of discharge rooms with waste. Below are the discharge findings for UH, C&W, and overall for the two hospitals. UH. First, the team stratified the percentage of rooms with waste by days of the week. There was no difference in the percentage of rooms with waste by days of the week. However, Saturday had the highest percentage of waste at 70%. All other days are evenly distributed at around 50%. This means that of all the discharge rooms observed each day, approximately 50% of the rooms did not have clean linens left in the rooms (Appendix C: Figure C.1). Figure 1 explains the distribution of waste by the number of waste items left in the room. This distribution was calculated by dividing the number of discharge rooms with a certain number of waste found over the number of discharge rooms observed. Nearly 50% of the observed discharge rooms had no waste. There were only a few pieces of waste when there was waste in the room. In addition, the average pieces of waste found per discharge room were calculated by

12
dividing the number of waste over the number of discharge rooms with waste. Of the 53% of the rooms that had waste, there was an average of 3.7 pieces of waste per room. Furthermore, when walking into any room, 2.0 pieces of clean linen was the average amount of linens found (number of waste items/number of discharge rooms).
Figure 1: Distribution of waste by quantity – UH
Next, the data was stratified by floors. While the percentage of rooms with waste observed was approximately 50% for each floor, Floor 6 had the highest average number of wasted items per discharge room (5.4 items) given that there was waste in the room (Appendix C: Figure C.2.1 and Figure C.2.2). This suggests that Floor 6 had more linen waste at discharge than any of the other floors. Next, the data was stratified by units. The percentage of times that the waste appeared in the rooms was inconsistent, as can be seen in Figure 2.1. However, most units had waste less than 50% of the time. Units 4B, 5C, 5D, 6B, 7A, 7B, and 8C had waste over 50% of the time. Furthermore, 5D had waste the highest percentage of times while 4D and 6C had the lowest. It is important to note that while 6A and 8D appeared to have the highest percentage of waste, only one room on each of the two units was observed. This makes 6A and 8D units worth looking into, but it is inconclusive to say that the two units have the highest percentage of rooms with waste. In addition, there was no consistency among the units for the average pieces of waste per discharge room with waste (Figure 2.2). However, Units 4A, 5D, 6A, 6B, 7A, 7C, 8C, and 8D had average waste per discharge room with waste above the UH average (3.8 pieces).

13
Figure 2.1: Percentage of waste by units – UH
Figure 2.2: Average number of waste per discharge room with waste by units – UH
The difference between Non-ICU and ICU units was then examined. While discharge rooms in Non-ICU and ICU both had waste approximately 50% of the time, ICU had a much higher average waste count per discharge room given that there is waste, as can be seen in in Figure 2. This suggests that ICU contributes more waste than Non-ICU units.

14
Figure 3: Percentage and average linen waste per discharge room with waste – Non-ICU vs. ICU
Figure 4 shows the percentage vs. average waste per discharge room with waste of all the units in UH. Multiplying the percentage and average equates to waste impact. The higher the impact, the more the unit contributes to waste. For example, units in the high percentage and high waste average quadrant contribute the most to linen waste (larger percentage of discharge rooms with linen waste and also at a higher quantity) while low percentage and low waste average contributes the least to linen waste (smaller percentage of discharge rooms with linen waste and also at a lower quantity). Units with a single observation (n=1) were taken out of the plot as they were outliers and skewed the plot.
Figure 4: Percentage vs. average waste per discharge impact – UH
15
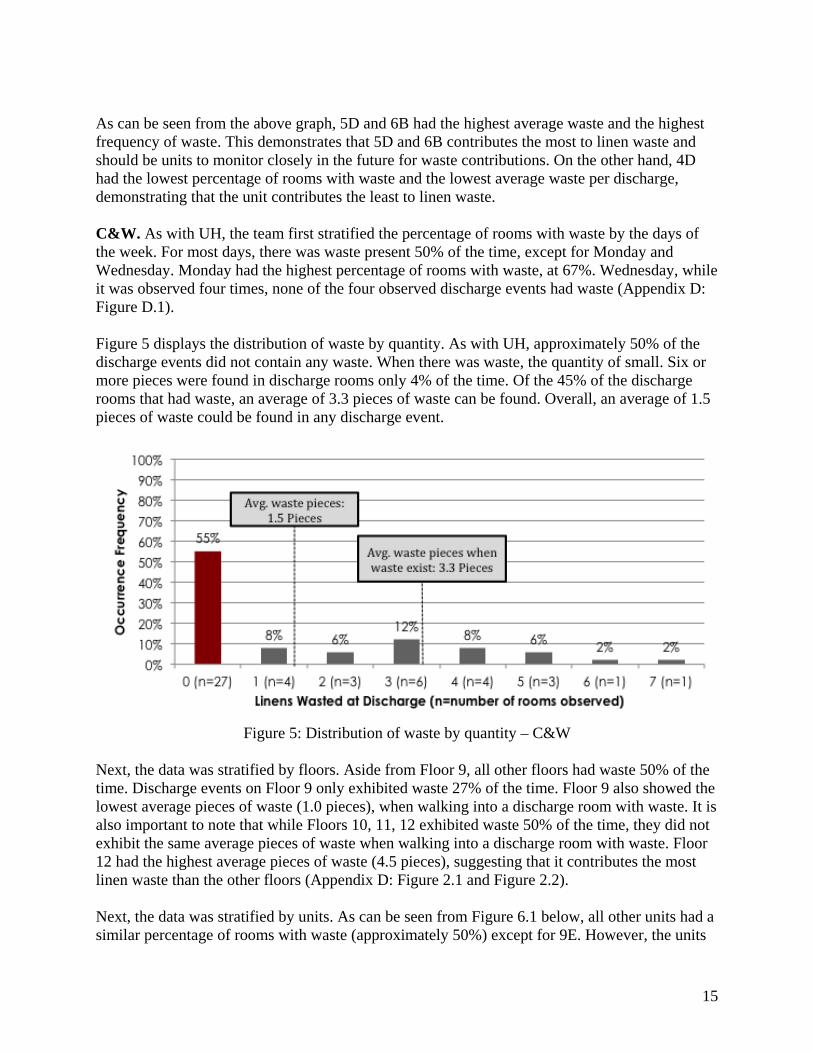
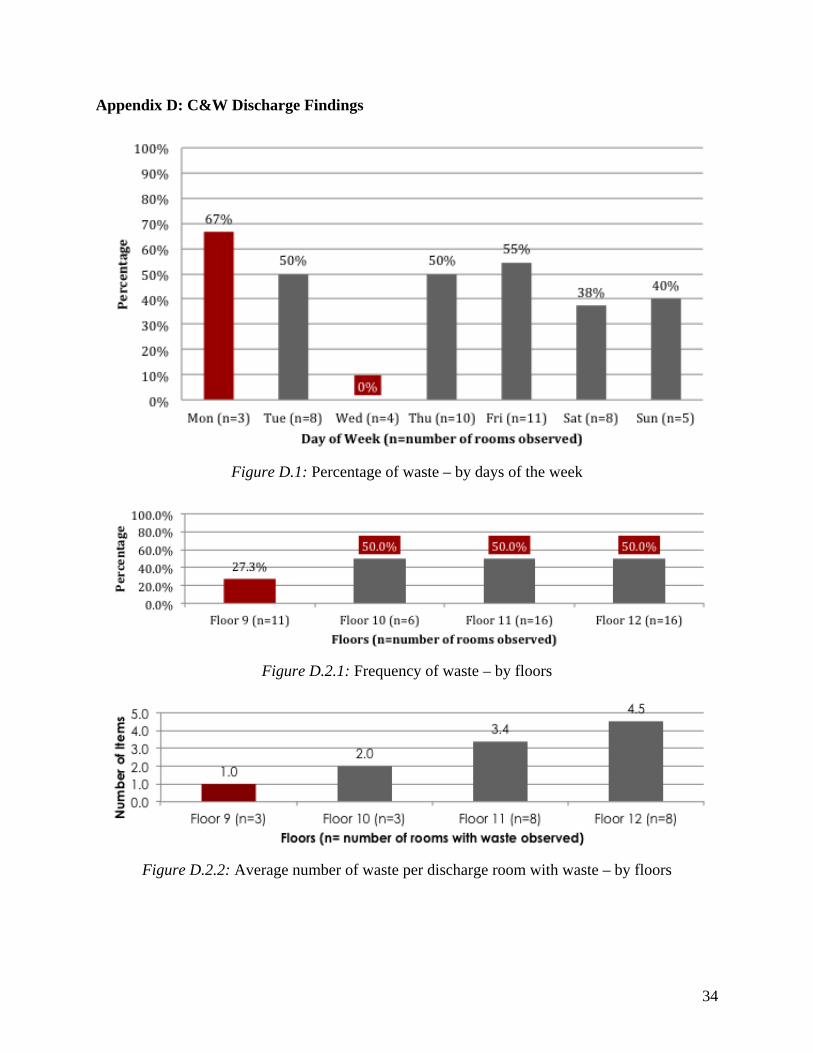
As can be seen from the above graph, 5D and 6B had the highest average waste and the highest frequency of waste. This demonstrates that 5D and 6B contributes the most to linen waste and should be units to monitor closely in the future for waste contributions. On the other hand, 4D had the lowest percentage of rooms with waste and the lowest average waste per discharge, demonstrating that the unit contributes the least to linen waste. C&W. As with UH, the team first stratified the percentage of rooms with waste by the days of the week. For most days, there was waste present 50% of the time, except for Monday and Wednesday. Monday had the highest percentage of rooms with waste, at 67%. Wednesday, while it was observed four times, none of the four observed discharge events had waste (Appendix D: Figure D.1). Figure 5 displays the distribution of waste by quantity. As with UH, approximately 50% of the discharge events did not contain any waste. When there was waste, the quantity of small. Six or more pieces were found in discharge rooms only 4% of the time. Of the 45% of the discharge rooms that had waste, an average of 3.3 pieces of waste can be found. Overall, an average of 1.5 pieces of waste could be found in any discharge event.
Figure 5: Distribution of waste by quantity – C&W
Next, the data was stratified by floors. Aside from Floor 9, all other floors had waste 50% of the time. Discharge events on Floor 9 only exhibited waste 27% of the time. Floor 9 also showed the lowest average pieces of waste (1.0 pieces), when walking into a discharge room with waste. It is also important to note that while Floors 10, 11, 12 exhibited waste 50% of the time, they did not exhibit the same average pieces of waste when walking into a discharge room with waste. Floor 12 had the highest average pieces of waste (4.5 pieces), suggesting that it contributes the most linen waste than the other floors (Appendix D: Figure 2.1 and Figure 2.2). Next, the data was stratified by units. As can be seen from Figure 6.1 below, all other units had a similar percentage of rooms with waste (approximately 50%) except for 9E. However, the units

16
did not have a similar average pieces of linen wasted per a discharge room with waste (Figure 6.2). 10W had one of the highest percentages of waste, but had one of the lowest averages of linen waste found in a discharge room with waste. This suggests that while discharge rooms on 10W commonly had waste, the quantity of waste in each room are small. In addition, only 14% (lowest) of the discharge rooms observed on 9E had any linen waste inside and had an average of 1 piece of linen when there was waste. This implies that 9E contributes the least to linen waste compared to all other units in C&W.
Figure 6.1: Percentage of waste by units – C&W
Figure 6.2: Average number of waste per discharge room with waste by units – C&W

17
Figure 7 shows the percentage vs. average waste impact of all the units in C&W. As with UH, multiplying the percentage and average shows impact. The higher the impact, the more the unit contributes to waste. Units with a single observation (n=1) were taken out of the plot as they were outliers and skewed the plot.
Figure 7: Percentage vs. average waste per discharge impact – C&W
As can be seen, 9E has the lowest average waste as well as the lowest frequency. This means that few discharge rooms on that unit had waste. Of the discharge rooms that have waste, the quantity of waste was also small. This suggests that 9E contributes the lowest amount of waste compared to all other units. 12W had a medium frequency but a very high amount of average amount of waste. This means that waste was found in the discharge rooms 50% of the times, but the quantity of linens found in those rooms were large. Hence, 12W has the potential to contribute a lot to linen waste. UH and C&W Combined. A total percentage and average linen waste per discharge room with waste for UH and C&W was calculated. As can be seen in Figure 8, UH and C&W had approximately the same percentage of discharge rooms with linen waste. However, UH had more average pieces of linen waste per discharge room with waste than C&W. This implies that UH waste slightly more linens than C&W overall.

18
Figure 8: Percentage and average linen waste per discharge with waste – UH and C&W
Figure 9 shows the percentage vs. average pieces of waste per discharge room with waste, comparing UH and C&W. As can be seen, UH has generally a higher impact (high waste and high frequency), meaning that UH more frequently had discharge rooms with waste in them and with a higher quantity of linens wasted than C&W. Calculating the impact rate of UH and C&W also verified this result. UH had an impact of 2.0 while C&W had an impact of 1.5. Hence, UH contributes slightly more linen waste than C&W.
Figure 9: Percentage vs. average waste per discharge impact – UH and C&W
19
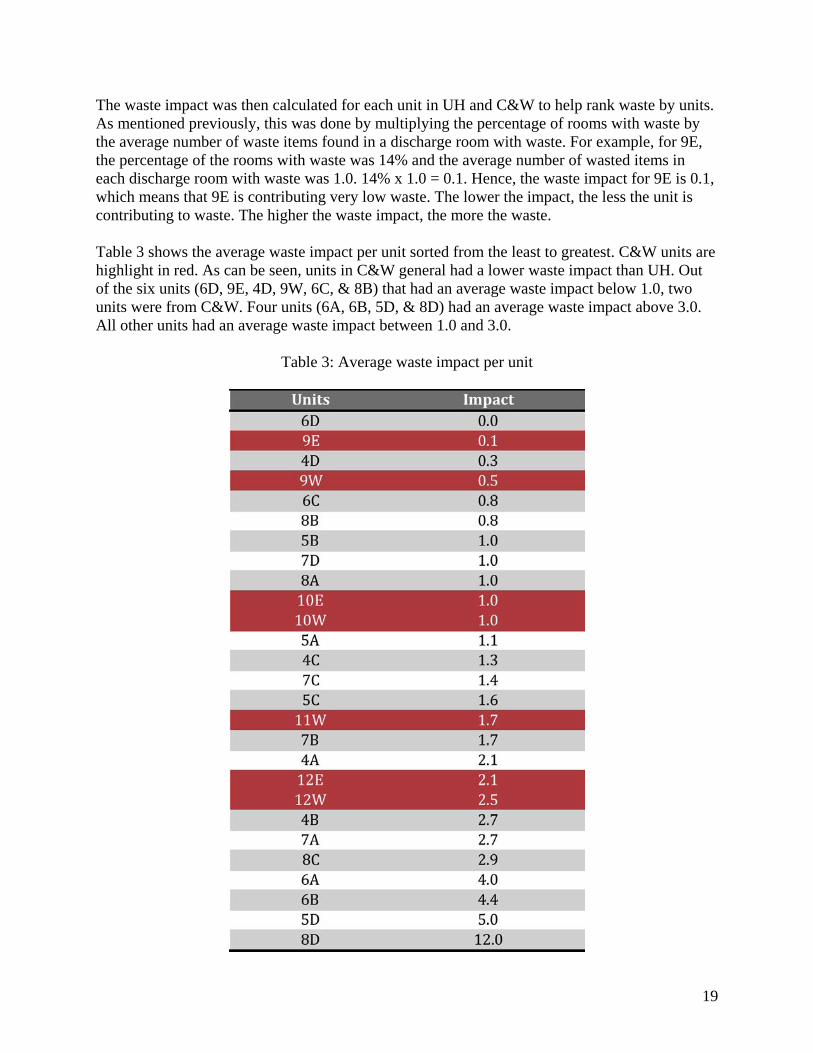
The waste impact was then calculated for each unit in UH and C&W to help rank waste by units. As mentioned previously, this was done by multiplying the percentage of rooms with waste by the average number of waste items found in a discharge room with waste. For example, for 9E, the percentage of the rooms with waste was 14% and the average number of wasted items in each discharge room with waste was 1.0. 14% x 1.0 = 0.1. Hence, the waste impact for 9E is 0.1, which means that 9E is contributing very low waste. The lower the impact, the less the unit is contributing to waste. The higher the waste impact, the more the waste. Table 3 shows the average waste impact per unit sorted from the least to greatest. C&W units are highlight in red. As can be seen, units in C&W general had a lower waste impact than UH. Out of the six units (6D, 9E, 4D, 9W, 6C, & 8B) that had an average waste impact below 1.0, two units were from C&W. Four units (6A, 6B, 5D, & 8D) had an average waste impact above 3.0. All other units had an average waste impact between 1.0 and 3.0.
Table 3: Average waste impact per unit

20
Figure 10 shows the distribution of the types of linens waste in UH and C&W. As can be seen, both UH and C&W waste the most pillowcases and bath towels. However, nearly half (40%) of all the linen waste at C&W was comprised of bath towels. 97% of those bath towels came from Floor 11 and Floor 12.
Figure 10: Distribution of the types of linens wasted – UH and C&W
Survey Despite the project’s scope being UH Floors 4 to 8 and C&W Floors 9 to 12, the survey was distributed to unit managers across all three hospitals, UH, C&W and CVC, respectively. Of the 72 surveys received, 44 were from UH, 23 were from C&W, and 5 were from CVC. In order to avoid relevant data from being skewed by the units beyond the project scope (such as BICU and UH Operation Rooms), the following is a representation results from only within the project scope. A separate and much more in depth analysis, detailing all the units covered by the survey has also been produced for the clients, as that also could be of value to their decision-making. This separate analysis can be found in Appendix G. It is important to note that only nurse managers and supervisors answered the survey. Thus, the survey responses purely illustrate how management perceives of the current linen situation. The survey questions were related to what and where linens are normally stocked, how strictly their linen stocking standards are enforced, whether they think there is unused linen present upon discharge, as well as a number of other questions illustrating their units’ level of linen usage. The survey also asked specifics of the units’ bed changing policies. The following is a representation and brief analysis of the survey responses. Note that of the 72 responses, now only 33 responses are relevant, of which 28 are from UH and 5 are from C&W. UH. 53% of the units at UH agreed that clean linens are left behind in patient rooms, while 82% of the responses believe that their Par carts have adequate supplies of linen. The vast majority (83%) finds their central linen holding areas convenient to access. 25% of the units stated that

21
that they do stock linens in patient rooms. Of this 25%, the proportion that stock each kind of item is distributed as follow (N=13):
Figure 11: Distribution of linen types that are stocked in patients’ rooms
As can be seen, the items that are most commonly stocked in patient rooms are gowns and bath towels. 28% of the UH responses stated that their units stock linens in nurse servers. Of which, half of them stock linens in nurse servers daily, while the rest are either stocked 4 times a week or checked on a shift basis. All the units that state that they stock linens in nurse servers stated that their standards are strictly followed. The following is an average count of items stocked in nurse servers that do stock linens:
Figure 12: Average number of clean linens stocked in nurse servers
It appears that gowns and bath towels are the most commonly stocked items in nurse servers. Bedspreads are uncommonly stocked in the nurse servers. Finally, when asked whether staff bring only the approximated types and amounts of linens needed into patients’ rooms, no unit answered.
57% 71% 71%
57%
86% 86%
43% 43%
0%
20%
40%
60%
80%
100%
1.7
2.7 2.7 2.3
3.3 3.3
1.0 0.3
0.00.51.01.52.02.53.03.5

22
C&W. 50% the units agreed that clean linens are left behind in patient rooms, while another 50% claim to have an adequate supply of linens in their Par carts. All the units that responded stated that their central linen holding areas are convenient to access. Surprisingly, when asked whether linens are stocked in patient rooms, no unit from C&W responded. 50% of units stated that linens are standardly stocked in bedside carts/cabinets in the patients’ rooms/parent cabinets. Standards for stocking bedside carts are typically followed, and they are normally stocked daily. A count of the items reportedly stocked shows that bedspreads and sleep sacks are not normally stocked, while cloth diapers are stocked highest in number, followed by baby blankets. When asked whether it is common to give mothers new linens to take home, over 72% of the response disagreed, while the rest were indifferent. In addition, when asked whether staff bring only the approximated types and amounts of linens needed into patient rooms, half of the units agreed, while the other half were neither agreed nor disagreed. Bed changing policy. 82% of the responses from UH stated that their units do have bed-changing policies, while none from C&W reportedly do. Of the 82% from UH, 64% of them state that their bed changing policies are strictly followed. The vast majority of the units at UH that had bed changing policies changed their beds daily, while the remaining few do so 3 times a week. 64% of the units at UH state that their patients do request bed changing regardless of bed changing policy, while the corresponding figure for C&W is 50%. This means that patients do ask for bed changes over half the time, despite bed changing policies. When asked which are the items included in a bed changing policy, the following distribution was produced:
Figure 13: Percentage of times that a type of item makes up a bed
It’s important to note that non-bed items are brought into the room upon every bed changes as much as half the time. Given that bed changes most commonly happen daily, these non-bed items, if left unused, could easily pile up over time. Furthermore, as seen in Figure 11, it is not uncommon to bring in multiple bed sheets and other linen items upon every bed change.
100% 100% 86% 100%
50% 50%
29%
93%
0%
20%
40%
60%
80%
100%

23
Figure 14: Average number of items that makes up a bed
Interviews Between March 25th and April 1st, five interviews were conducted with nurse managers from four different units. Units 7A and 4C in UH were interview, and two interviews from Unit 12W and one from 7E. The primary intent of the interviews was to acquire inputs, from a managerial standpoint, on three of the most important aspects that characterize a hospital unit’s linen usage. These were as follows:
1. Is there a standard for making a bed in this unit? If so, is it followed? a. What are the standard items that make up a bed? b. Under “normal circumstances”, how often are the beds changed?
2. Why or why not are linens stored in nurse servers (UH)/supply carts (C&W)? a. If linens are stocked in nurse servers/supply carts, what types of linens are
stocked? b. If linens are not stored in nurse servers/supply carts, where are they stored before
they are brought into patient rooms? 3. Do you think there is a problem with linen waste? Why or why not? What do you think is
the main cause of linen waste? Below are the responses from UH and C&W. UH. For 7A, there is a strict standard to be followed for bed changing. Everyday, a “bundle” is brought into every patient room upon bed change, which consists of 1 fitted, 1 flat, 1 draw, 1 bedspread, 2 pillowcases and 2 towels.
For 4C, there is also a standard, and it consists of bringing into the rooms everyday, 1 item of everything, except bedspreads and that 1 or 2 extra pillowcases are brought in. However, the unit manager interviewed stressed very heavily on “patient comfort”, which means that beds would be changed as long as there is some very minor soiling (“beds will be changed as long as there is a small drop of ‘beta’”)
1.8 1.8 1.6
2.4
1.3 1.3 1.0
1.8
0.00.51.01.52.02.53.0
24
Both 7A and 4C stated that they had already tried very hard to use nurse servers, but failed. 4C’s reason for this is that once nurse servers were heavily abused – nurses and stock keepers started stocking all kinds of random items, making them so congested that it became difficult to retrieve anything from them. Another reason that 4C provided was that, even after nurse servers started stocking linens, nurses and stock keepers continued to “hoard” linens in patient rooms, worrying that the linen in nurse servers would eventually run out. They also stated that nurse servers are only big enough to serve “last minute linen needs.” Instead, 4C would acquire linens directly from the central linen holding areas before they are brought into patient rooms.
Both units believed that linen waste is present. For 7A, the perceived cause of this is that upon bed changing, people do not check whether the non-bed items are already stocked, and bring in the standard set of linens anyway. For 4C, the explanation was that nurses and stock keepers want to save the trouble of having to walk to the central linen holding area again to get more linens, by stocking in patient rooms as much linens as they could the first time round.
One issue that 4C pointed out about bed changing policies is that all beds must be made everyday by 11 am in the morning. However, discharge orders for patients often do not show up until after 1 pm every day. This makes it very common for beds to be remade even on the day of discharge. Also, both units believe there is opportunity for education on the issue of linen usage.
C&W. Both 7E and 12W change beds daily. As a standard, 7E brings in 1 fitted sheet, 1 flat sheet 1 bedspread and 2 pillowcases into patient rooms (no draw sheets and no blankets). 12W brings in one of each of the following: flat sheet, draw sheet, pillowcase, blanket.
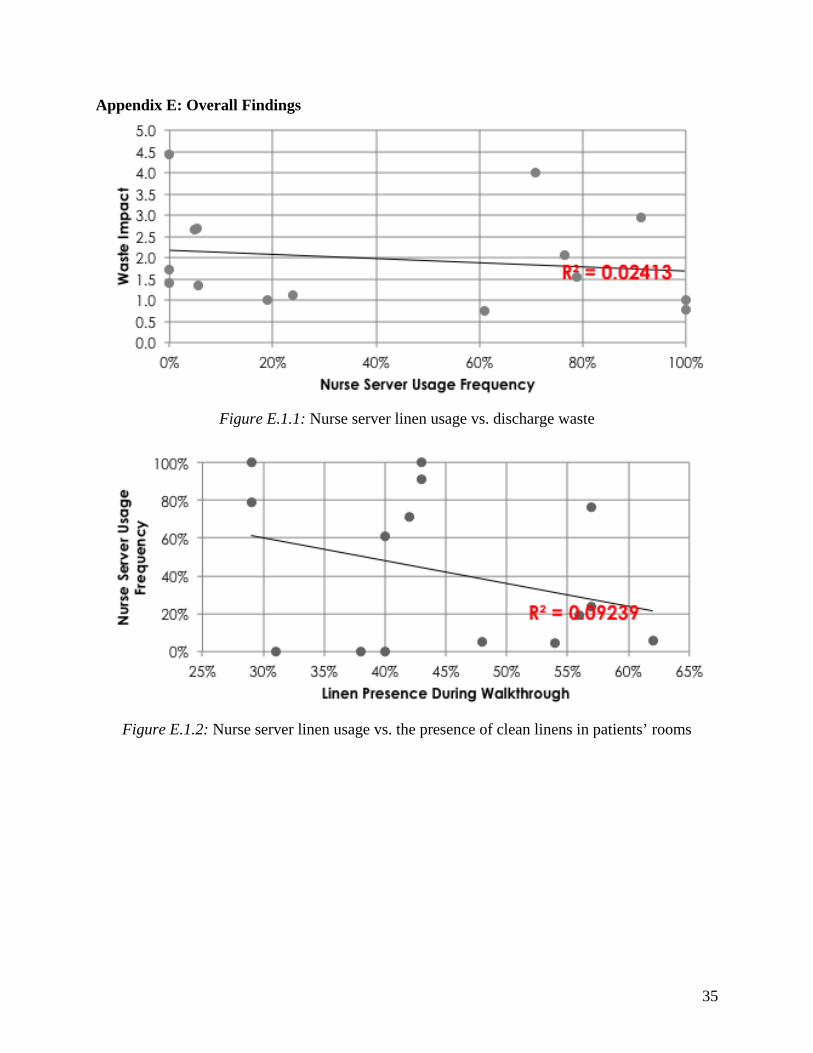
12W does not stock linen in bedside carts – they are empty. For 7E, there is a daily change of washcloths and towels in the bedside carts. 7E stated that most linen is wasted in precaution rooms, because, upon discharge, all the linens in the room must be removed (including those in bedside carts). However, 12W stated that it is not normal to see extra linens lying in the room. Also, 12W tries to minimize linen usage by attempting to do everything “on need” basis. In other words, after the initial set of linens, linens are provided only upon request. As part of patient care, substantial quantities of linen in 12W are offered to parents to spend the night (blanket warmers in particular). As a result, occasionally, shortage of blankets occurs. Also worth noting is that 12W usually has enough supply to provide each patient with four blankets: 1 for the bed, 1 as a spare, and 2 for the parents. Both 12W and 7E also stated that it is unusual that patients ask for bed changes. Overall Findings The findings in this section draws from the observation, survey, and interview finding. These findings focuses on nurse usage, clean linens placed in patients’ rooms, and bed changing policies and how they might affect waste. Nurse servers. The waste impact was compared to the percentage of nurse servers that stock linens for each unit. No correlation was found between the two (Appendix E: Figure E.1.1). This

25
suggests that storing clean linens in nurse servers do not affect the amount of waste found in discharge. Next, the frequency of clean linens found in patients’ rooms was compared to the percentage of nurse servers that stock linens for each unit. (Appendix E: Figure E.1.2). There was also no correlation between the two, suggesting that stocking clean linens in nurse servers does not affect the placing linens in patients’ rooms. This supports interview statements that storing clean linens in nurse servers do not work very well. Furthermore, the survey indicated that 5A, 5C, 8A, and 8C all stated to have a standard for stocking clean linens in the nurse servers. 13 other units stated to not have a standard for stocking clean linens in the nurse servers while 3 units did not respond to the survey question. When the waste impact was calculated for those units compared to the units that do not have a standard, the waste impact for both were almost the same, 1.96 and 1.98 respectively. This further suggests that stocking clean linens in nurse servers do not affect the amount of discharge waste. Walkthrough. The waste impact during discharges was then compared to the frequency of clean linens were found in patients’ rooms for each unit for both UH and C&W. There was no correlation between the two in UH or C&W (Appendix E: Figure E.2.1 and Figure E.2.2). This implies that the waste found during discharge was not affected by whether or not clean linens were placed inside patients’ rooms. Bed Changing Policy. As indicated in the survey, 82% of the units in UH have a bed changing policy. However, only 64% of those units stated that they strictly follow the bed changing policy. These units were 4B, 4D, 5A, 5B, 5C, 6B, 7C, 7D, 8C, and 8D. Units 5D, 6D, and 7A did not have a standard bed changing policy. The average waste impact for the units that follow a standard bed changing policy was calculate and compared to the average waste impact of the units that do not have a standard bed changing policy. The waste impact for the units that follow a standard bed changing policy was 2.2, while the waste impact for the units that do not have a standard bed changing policy was 3.0. Thus, this implies that having a bed changing policy does affect linen waste. 18% of the UH units that replied to the survey question about bed changing policy do not have a standard bed changing policy. For C&W, only 11W and 12W responded to the survey question about bed changing policy and both do not have a standard bed changing policy. Financial Cost of Discharge Waste – April 2012 to February 2013 Using data from the discharge data April 2012 – February 2013 and the price of each item, the total cost associated with linen waste was calculated for the past year. Unit 6B in UH had the highest cost, losing $2,412 to linen waste for the past year. Unit 4D had the lowest cost in UH, losing $74 to linen waste. Unit 6D was taken out for the analysis because the single discharge room observed had had no waste, making it seem as though the entire unit had zero waste. In C&W, 12W lost the most to waste at $950. Unit 9E lost the least, of a mere $5 for the past year. This could be due to 9E small waste impact. A detailed list of the cost lost to waste for each unit can be found in Appendix F: Figure F.1 and Figure F.2.

26
Table 4 below shows the total cost lost in UH, C&W and the total for the two hospitals for the past year. As can be seen, UH lost nearly $14,000 more than C&W. This could be because UH had more discharges and more waste than C&W, as demonstrated by the team’s discharge data. In total, UH Floors 4-8 and C&W Floors 9-12 lost nearly $19,000 to linen waste in the past year.
Table 4: Cost of linen waste from April 2012 to February 2013 CONCLUSIONS AND RECOMMNEDATIONS This section verifies/dismisses the three perceptions of linen waste: inconsistent use of nurse servers, unnecessary clean linens placed in patients’ rooms, and inconsistent or lack of bed changing policies. Nurse Servers In general, 41% of the nurse servers in UH stock linens. However, most units do not have a standard to stocking nurse servers with linens. Only four units (5A, 5C, 8A, and 8C) stated to have a standard to stocking clean linens in the nurse servers. Yet, when compared to the average waste impact for those units that do not have a standard for stocking clean linens (13 units), there was no difference. Hence, standardly stocking clean linens in nurse servers do not affect discharge waste. This means that nurse servers do not play a role in creating or eliminating linen waste and the perception that inconsistent use of nurse servers does affect waste can be dismissed. Walkthrough There was no correlation between the frequency of clean linens placed in patients’ rooms and the waste impact for UH and C&W. Hence, placing clean linens inside patients’ rooms does not affect the amount of waste. This means that the clean linens observed in patients rooms does not always necessary equate to waste; at least some of the linens become used. Thus, the perception that clean linens placed in patients’ rooms affect linen waste can be dismissed. Furthermore, patient rooms at UH had clean linens inside 43% of the times and patient rooms at C&W had clean linens inside 55% of the times. Recommendation for walkthrough (clean linen presence in patients’ rooms). It is recommended to increase awareness that clean linens inside patients’ rooms are not always necessary waste. Hence, it is not necessary to eliminate the placement of all clean linens in patients’ rooms for all units.

27
Bed Changing Policy It was found that units that did have and followed a standard bed changing policy had a lower average waste impact than those that do not. This means that the units with a bed changing policy and followed it had less waste than the units that did not have a bed changing policy. Hence, having a bed changing policy affects the amount of clean linens wasted; it associates with a decrease in linen waste. Therefore, the perception that having a bed changing policy does affect linen waste can be verified. Furthermore, Unit 7A in C&W mentioned that they follow a strict bed changing method, where a bundle of linens consisting of 1 fitted sheet, 1 flat sheet, 1 draw sheet, 1 bedspread, 2 pillowcases, and 2 towels is brought into a patient’s room upon a bed change. Recommendation for bed changing policy. Because findings showed that having and following a bed changing policy associates with a decrease in linen waste, it is recommended to look into an implementation of a standard bed changing policy for each unit. Because each unit house different types of patients, the bed changing policy should be tailored to each unit. In addition, not every unit has the feasibility to sustain a bed changing policy. Hence, it is recommended to first assess which units are feasible to sustain a bed changing policy before implementing one. It is also recommended to look at the unique bed changing method on Unit 7A in UH to see how its bed changing policy may affect linen waste. If the bed changing policy contributes to a lower linen waste on 7A, then the method should be considered to be used as a standard bed changing policy throughout the hospital in applicable units. Recommendation for Future Areas of Focus Future projects looking at the linen usage storage and distribution at that the units with an average waste impact below 1.0 is recommended. These units include: 6D, 9E, 4D, 9W, 6C, and 8B. Investigations of these units are beneficial to see why they have so little waste and possibly learn from their practices. Investigations of the units with an average waste impact above 3.0 are also recommended. Looking at why the waste impact for these units are so high can help identify flaws in their linen storage and distribution practices. Once the flaws have been identified, the appropriate actions can be taken to fix these flaws and lower the average waste impact. These units include 6A, 6B, 5D, and 8D. Investigations for Floor 11 and Floor 12 in C&W are also recommended. This is because 40% of the linens wasted at C&W were bath towels and 97% of those came from Floor 11 and Floor 12. Thus, understanding why so many bath towels are wasted could lead to future courses of action to reduce wastage of bath towels.

28
EXPECTED IMPACT Upon the completion of the project, the team delivered data-driven proof that determines whether the linen wastage perceptions are true or false. Specifically, the data showed:
1. Verification the three linen waste perceptions: a. Inconsistent bed changing policies b. Disorganized and inconsistent use of nurse servers c. Excess amount of clean linens brought into patients’ rooms
2. Quantified proof behind perceived causes 3. Slight decrease in linen waste; thus, decrease in linen waste related cost 4. Where to focus for future projects of linen waste
With the verification and dismissal of the perceptions and recommendation of efficient linen usage, the Laundry Services Department can determine its next step in determining the causes of the increase in linen consumption. Hence, the linen related cost might be reduced.
29
REFERENCES [1] UMHS Laundry Services Department Datamart: 2010 – 2013 [2] Lee, C. H., Pranata, A., Steven, A., & Taslim, R. (2010). Analysis of linen utilization
throughout inpatient units in the university hospital. Unpublished manuscript, Industrial and Operations Engineering Department, University of Michigan, Ann Arbor, MI.
30
APPENDICES Appendix A: Nurse Server Findings
Figure A.1: Frequency of nurse servers that stock linens, medical supplies, and both
Figure A.2: Percentage of nurse servers that stock linens, medical supplies, and both – by floors

31
Figure A.3: Percentage of nurse servers that stock linens, medical supplies, and both – by units
32
Appendix B: Walkthrough Observation General Statistics Table B.1: Walkthrough statistics for UH and C&W

33
Appendix C: UH Discharge Findings
Figure C.1: Percentage of waste – by days of the week
Figure C.2.1: Frequency of waste – by floors
Figure C.2.2: Average number of waste per discharge room with waste – by floors
34
Appendix D: C&W Discharge Findings
Figure D.1: Percentage of waste – by days of the week
Figure D.2.1: Frequency of waste – by floors
Figure D.2.2: Average number of waste per discharge room with waste – by floors
35
Appendix E: Overall Findings
Figure E.1.1: Nurse server linen usage vs. discharge waste
Figure E.1.2: Nurse server linen usage vs. the presence of clean linens in patients’ rooms

36
Figure E.2.1: Frequency of clean linen presence in patients’ rooms vs. waste impact – UH
Figure E.2.2: Clean linen presence in patients’ rooms vs. waste impact – C&W

37
Appendix F: Financial Cost of Waste – April 2012 to March 2013
Figure F.1: Total cost of linen waste per unit – UH
Figure F.2: Total cost of linen waste per unit – C&W
38
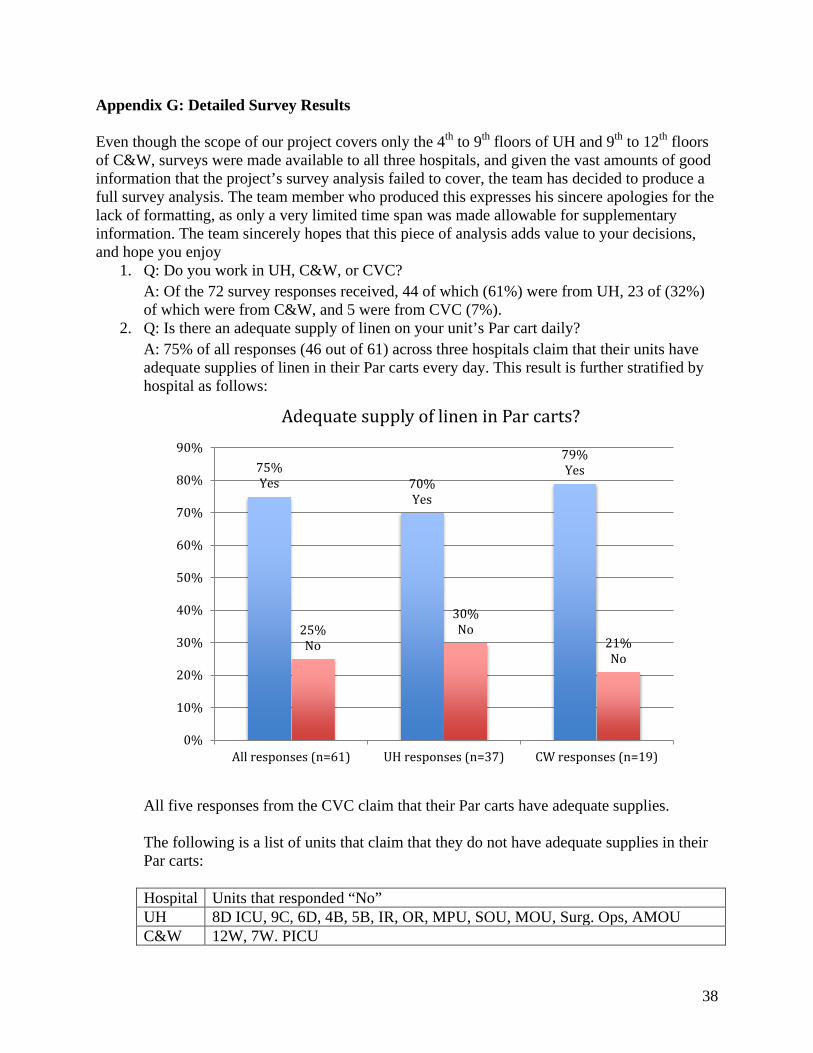
Appendix G: Detailed Survey Results Even though the scope of our project covers only the 4th to 9th floors of UH and 9th to 12th floors of C&W, surveys were made available to all three hospitals, and given the vast amounts of good information that the project’s survey analysis failed to cover, the team has decided to produce a full survey analysis. The team member who produced this expresses his sincere apologies for the lack of formatting, as only a very limited time span was made allowable for supplementary information. The team sincerely hopes that this piece of analysis adds value to your decisions, and hope you enjoy
1. Q: Do you work in UH, C&W, or CVC? A: Of the 72 survey responses received, 44 of which (61%) were from UH, 23 of (32%) of which were from C&W, and 5 were from CVC (7%).
2. Q: Is there an adequate supply of linen on your unit’s Par cart daily? A: 75% of all responses (46 out of 61) across three hospitals claim that their units have adequate supplies of linen in their Par carts every day. This result is further stratified by hospital as follows:
All five responses from the CVC claim that their Par carts have adequate supplies. The following is a list of units that claim that they do not have adequate supplies in their Par carts: Hospital Units that responded “No” UH 8D ICU, 9C, 6D, 4B, 5B, IR, OR, MPU, SOU, MOU, Surg. Ops, AMOU C&W 12W, 7W. PICU
75% Yes 70%
Yes
79% Yes
25% No
30% No
21% No
0%
10%
20%
30%
40%
50%
60%
70%
80%
90%
All responses (n=61) UH responses (n=37) CW responses (n=19)
Adequate supply of linen in Par carts?

39
CVC None
3. Q: How would you usually obtain linens for your patients if you don’t have enough for the patients’ daily usage? A: As a follow up to the previous question, the following is a distribution of how the issue is said to be resolved when there is not enough linen for the patients’ daily usage:
12 out of the 13 responses given opted “Other” as one of their selections. The “Other” methods include:
• Directly contact linen department (6 out of 11 text responses) • Ask the clerk on the unit to contact linen department (3 out of 11 text responses) • Travel to another unit (2 out of 11 text responses)
When stratified by hospital, the following results (note multiple selections are possible for each unit): UH:
0% 50% 100%
obtain yourself
through a host
by aide
other

40
C&W:
The results above originate from data represented in the following tables:
UH: Units Obtain
yourself Through a host
By aide Other
44.44%
11.11%
33.33%
22.22%
33.33%
22.22%
0.00% 20.00% 40.00% 60.00%
Directly contact linen dpt.
Acquire from another unit
Ask clerk to contact linendpt.
Obtain yourself
Through a host
By aide
33.33%
33.33%
33.33%
33.33%
33.33%
33.33%
0.00% 10.00% 20.00% 30.00% 40.00%
Directly contact linendpt.
Acquire from anotherunit
Ask clerk to contact linendpt.
Obtain yourself
Through a host
By aide
41
9C X X X Directly contact linen department 8D. OR, MPU
Directly contact linen department
5B X X X Acquire linen from another unit 6D, SOU, MOU
Ask clerk to contact linen department
4B X
C&W (only 4 responses for C&W, 2 overlapped): Units Obtain
yourself Through a host
By aide Other
7W X Directly contact linen department 12W Ask clerk to contact linen department PICU X X Acquire linen from another unit
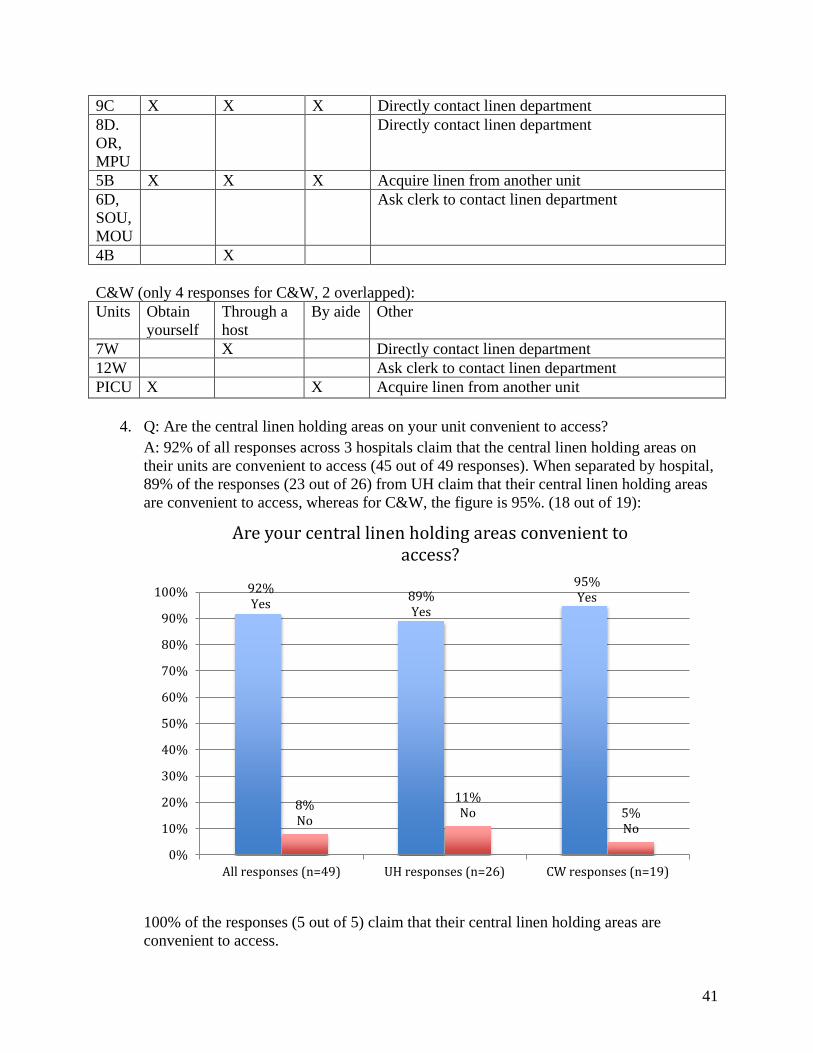
4. Q: Are the central linen holding areas on your unit convenient to access? A: 92% of all responses across 3 hospitals claim that the central linen holding areas on their units are convenient to access (45 out of 49 responses). When separated by hospital, 89% of the responses (23 out of 26) from UH claim that their central linen holding areas are convenient to access, whereas for C&W, the figure is 95%. (18 out of 19):
100% of the responses (5 out of 5) claim that their central linen holding areas are convenient to access.
92% Yes 89%
Yes
95% Yes
8% No
11% No 5%
No
0%
10%
20%
30%
40%
50%
60%
70%
80%
90%
100%
All responses (n=49) UH responses (n=26) CW responses (n=19)
Are your central linen holding areas convenient to access?

42
The following is a list of the remaining units that claim that their holding areas are not easily assessable: Hospital Units that reported their central holding areas as not easily assessable UH 6B, 5D-SICU, 4B C&W 7W
5. Q: What are the clean linens that are usually stocked in patient rooms?
A: UH:
• Of the 42 surveys provided by UH, only 31% of them (13 out of 42) claim to stock linens in patient rooms.
• The following is a distribution of the percentage of patient rooms that stock each
linen type in their patient rooms.
31% Yes
69% No
Are clean linens stocked in patient rooms?
43
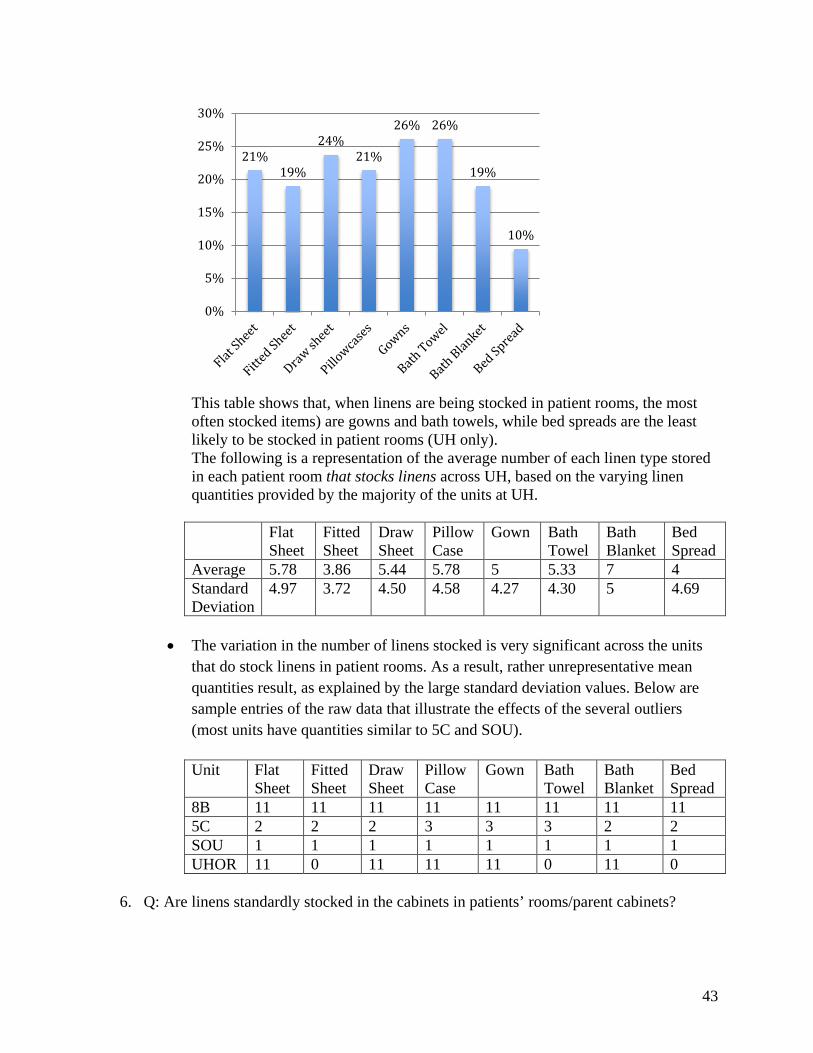
This table shows that, when linens are being stocked in patient rooms, the most often stocked items) are gowns and bath towels, while bed spreads are the least likely to be stocked in patient rooms (UH only). The following is a representation of the average number of each linen type stored in each patient room that stocks linens across UH, based on the varying linen quantities provided by the majority of the units at UH. Flat
Sheet Fitted Sheet
Draw Sheet
Pillow Case
Gown Bath Towel
Bath Blanket
Bed Spread
Average 5.78 3.86 5.44 5.78 5 5.33 7 4 Standard Deviation
4.97 3.72 4.50 4.58 4.27 4.30 5 4.69
• The variation in the number of linens stocked is very significant across the units
that do stock linens in patient rooms. As a result, rather unrepresentative mean quantities result, as explained by the large standard deviation values. Below are sample entries of the raw data that illustrate the effects of the several outliers (most units have quantities similar to 5C and SOU). Unit Flat
Sheet Fitted Sheet
Draw Sheet
Pillow Case
Gown Bath Towel
Bath Blanket
Bed Spread
8B 11 11 11 11 11 11 11 11 5C 2 2 2 3 3 3 2 2 SOU 1 1 1 1 1 1 1 1 UHOR 11 0 11 11 11 0 11 0
6. Q: Are linens standardly stocked in the cabinets in patients’ rooms/parent cabinets?
21% 19%
24% 21%
26% 26%
19%
10%
0%
5%
10%
15%
20%
25%
30%

44
A: Only 50% of the responses (9 out of 18) from C&W claim that linens are standardly stocked in the cabinets of patient rooms/parent cabinets on their units. This question is applicable only to C&W.
7. Q: How often are linens stocked in the bedside carts/cabinets in the patients’ rooms/patient cabinets? A:
Unit How often 7E, Adult BMT outpatient, & Pediatric
Stocked Daily
50% Yes
50% No
Are linens standardly stocked in patient rooms' cabinets/parent cabinets on your unit?
(CW only, n = 18)
3 out of 6 responses
1 out of 6 responses
2 out of 6 responses
0 1 2 3 4
stocked daily
stocked 3 times a day
stocked upon turn over
How often are linens stocked in bedside carts/cabinets? (CW only)

45
outpatient 12E Stocked based on age of patient upon first time of stocking (different
quantity of each linen item depending on age), and then stocked daily.
PICU Stocked once around start of day/morning shift, once between 5 to 6 pm when patients are getting ready for evening bath, and again between 10:30 to 11 to restock for nightshift
Birth center, VVWH
Stocked upon room turnover/after patient is discharged
8. Q: What are the standard items that are stored in bedside carts/cabinets of patient rooms?
A: The graph below is percent of time those carts that are standardly stocked have each listed item (e.g. 33% of the units that standardly stock bedside carts stock bath towels):
67%
44%
33%
56%
67%
33% 33%
11%
44%
11%
22%
44%
0%
10%
20%
30%
40%
50%
60%
70%
80%
90%
100%
46
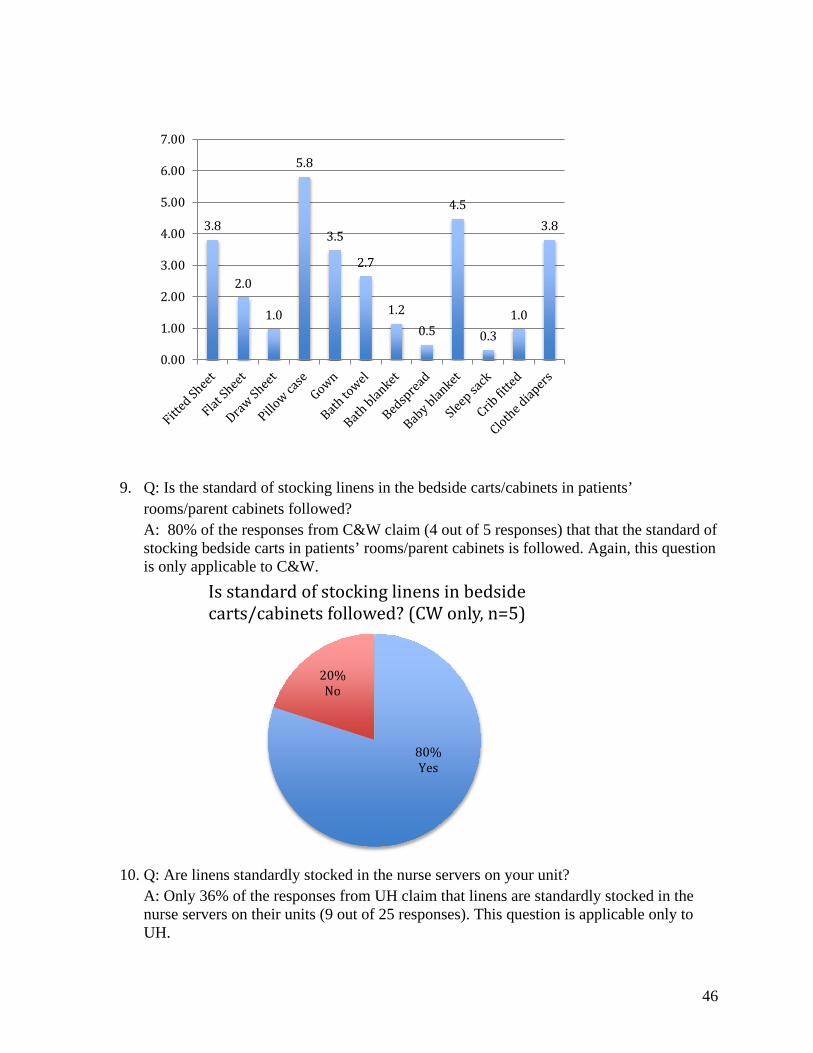
9. Q: Is the standard of stocking linens in the bedside carts/cabinets in patients’ rooms/parent cabinets followed? A: 80% of the responses from C&W claim (4 out of 5 responses) that that the standard of stocking bedside carts in patients’ rooms/parent cabinets is followed. Again, this question is only applicable to C&W.
10. Q: Are linens standardly stocked in the nurse servers on your unit?
A: Only 36% of the responses from UH claim that linens are standardly stocked in the nurse servers on their units (9 out of 25 responses). This question is applicable only to UH.
3.8
2.0
1.0
5.8
3.5
2.7
1.2 0.5
4.5
0.3 1.0
3.8
0.00
1.00
2.00
3.00
4.00
5.00
6.00
7.00
80% Yes
20% No
Is standard of stocking linens in bedside carts/cabinets followed? (CW only, n=5)

47
11. Q: How often are the linens stocked in the nurse servers on your unit?
Unit How often 5C, 8C Daily 5A 4 times a week 8A Checked on a shift basis BICU Twice a day, or as needed by techs, volunteers, and nursing UH OR Unknown
12. Q: Is the standard of stocking linens in the nurse servers followed?
A: All of the units that claim to have a standard for stocking nurse servers state that their standards are followed!
36% Yes
64% No
Are linens standardly stocked in nurse servers? (UH only, n = 25)
2 out of 6 responses
1 out of 6 responses
1 out of 6 responses
1 out of 6 responses
1 out of 6 responses
0 0.5 1 1.5 2 2.5
stocked daily
stocked 4 times a week
checked on a shift basis
twice a day
unknown
How often are linens stocked in nurse servers? (UH only)

48
13. Q: What are the standard items that are stored in nurse servers?
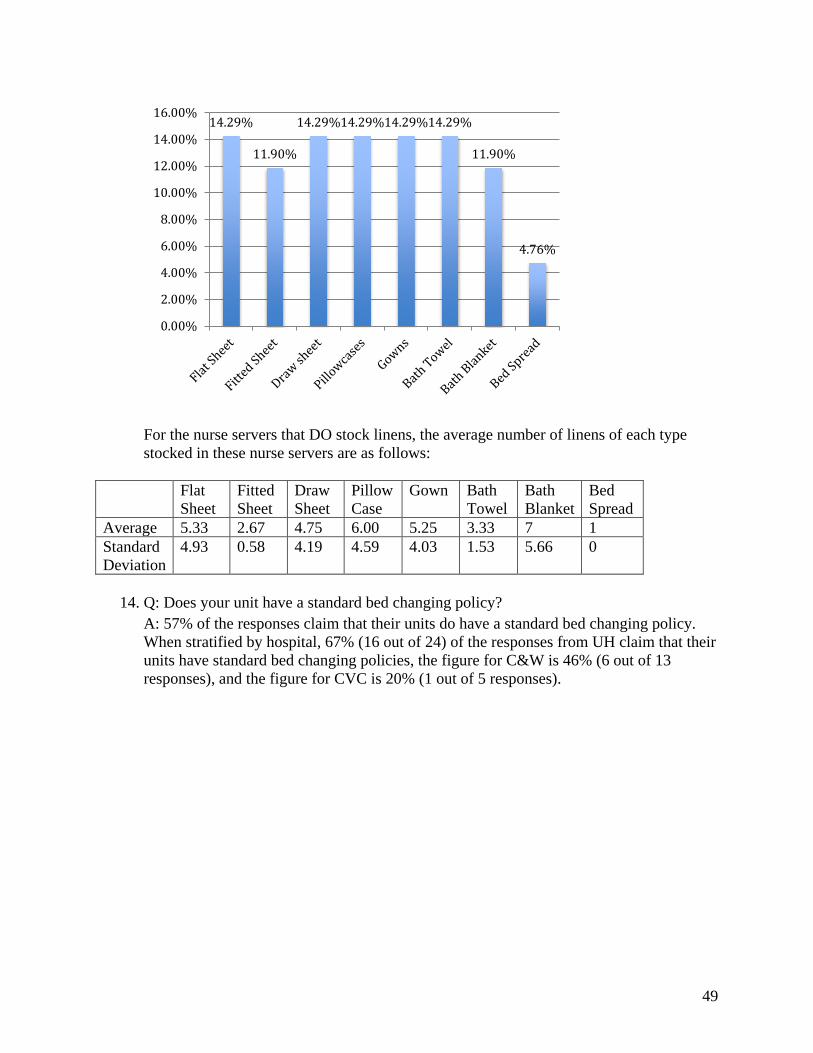
A: While an earlier finding demonstrates that 36% of the responses claim that their nurse servers stock linens, here it is discovered that only 16.7% of the responses report that any kind of linen is stocked.
The following chart details the proportion of units that stock each kind of linen in their nurse servers.
100% Yes
Is standard of stocking linens in nurse servers followed? (UH only, n=7)
16.70% Yes
83.30% No
Percentage of NS that do stock linens
49
For the nurse servers that DO stock linens, the average number of linens of each type stocked in these nurse servers are as follows:
Flat Sheet
Fitted Sheet
Draw Sheet
Pillow Case
Gown Bath Towel
Bath Blanket
Bed Spread
Average 5.33 2.67 4.75 6.00 5.25 3.33 7 1 Standard Deviation
4.93 0.58 4.19 4.59 4.03 1.53 5.66 0
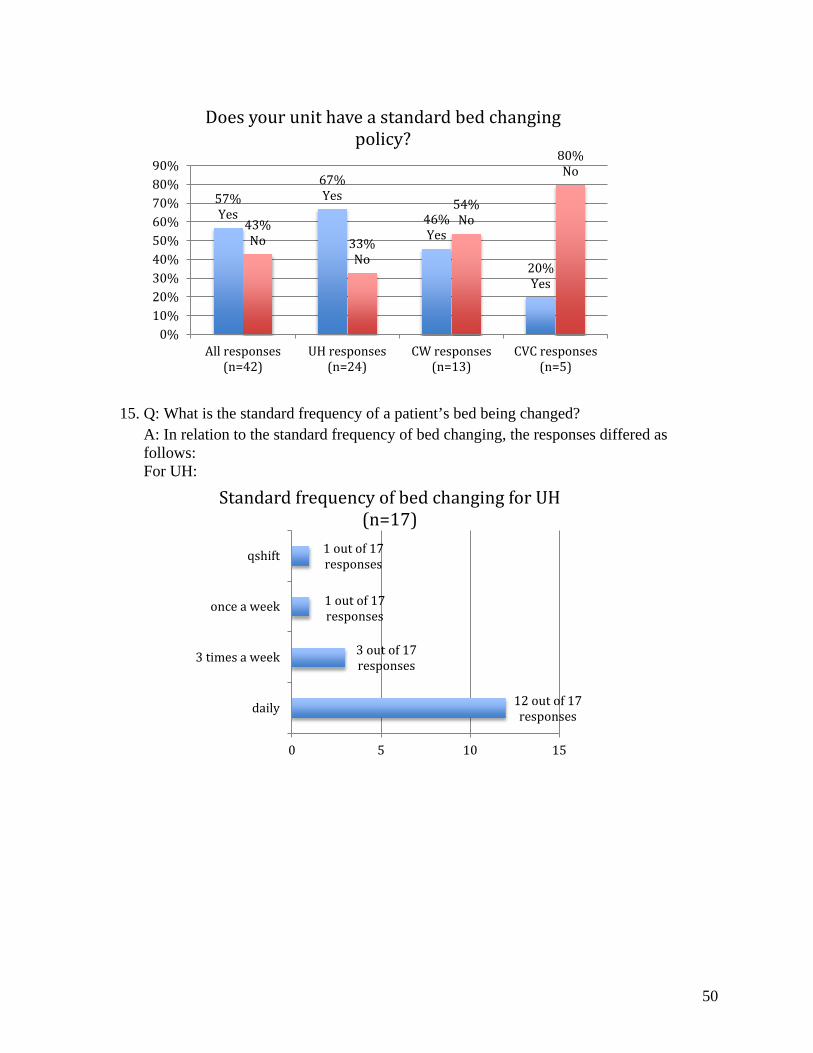
14. Q: Does your unit have a standard bed changing policy?
A: 57% of the responses claim that their units do have a standard bed changing policy. When stratified by hospital, 67% (16 out of 24) of the responses from UH claim that their units have standard bed changing policies, the figure for C&W is 46% (6 out of 13 responses), and the figure for CVC is 20% (1 out of 5 responses).
14.29%
11.90%
14.29% 14.29% 14.29% 14.29%
11.90%
4.76%
0.00%
2.00%
4.00%
6.00%
8.00%
10.00%
12.00%
14.00%
16.00%
50
15. Q: What is the standard frequency of a patient’s bed being changed? A: In relation to the standard frequency of bed changing, the responses differed as follows: For UH:
57% Yes
67% Yes
46% Yes
20% Yes
43% No 33%
No
54% No
80% No
0%10%20%30%40%50%60%70%80%90%
All responses(n=42)
UH responses(n=24)
CW responses(n=13)
CVC responses(n=5)
Does your unit have a standard bed changing policy?
12 out of 17 responses
3 out of 17 responses
1 out of 17 responses
1 out of 17 responses
0 5 10 15
daily
3 times a week
once a week
qshift
Standard frequency of bed changing for UH (n=17)
51
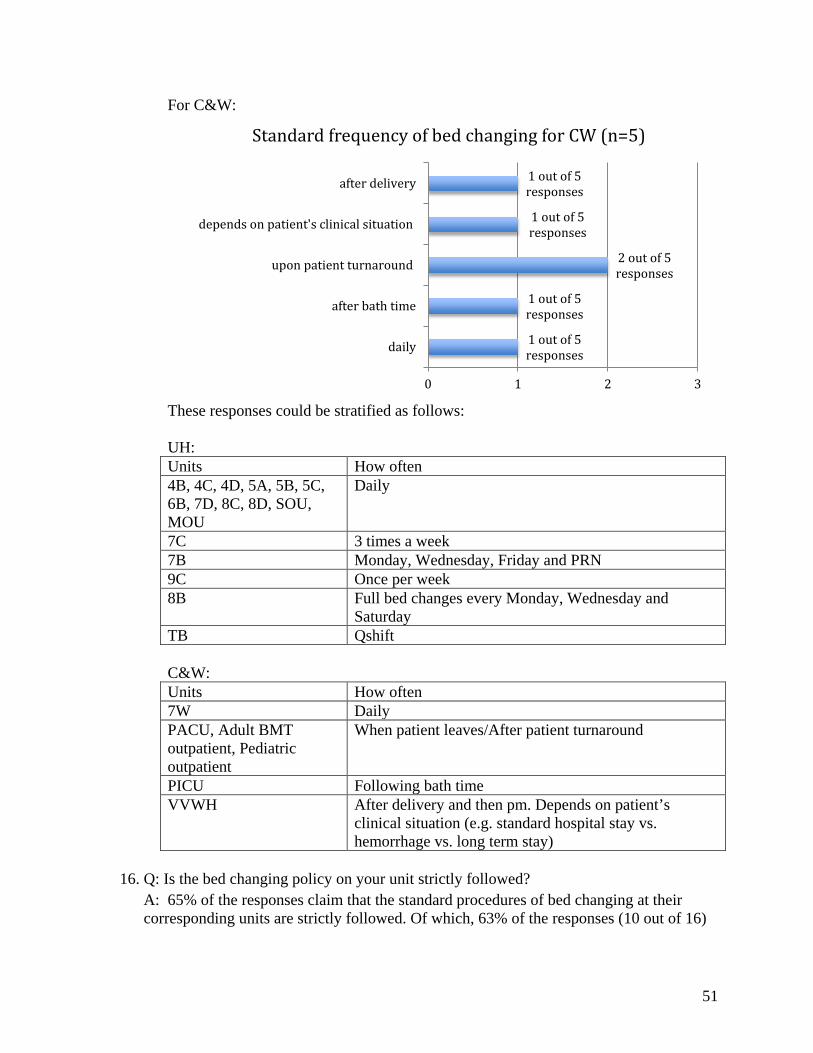
For C&W:
These responses could be stratified as follows: UH: Units How often 4B, 4C, 4D, 5A, 5B, 5C, 6B, 7D, 8C, 8D, SOU, MOU
Daily
7C 3 times a week 7B Monday, Wednesday, Friday and PRN 9C Once per week 8B Full bed changes every Monday, Wednesday and
Saturday TB Qshift C&W: Units How often 7W Daily PACU, Adult BMT outpatient, Pediatric outpatient
When patient leaves/After patient turnaround
PICU Following bath time VVWH After delivery and then pm. Depends on patient’s
clinical situation (e.g. standard hospital stay vs. hemorrhage vs. long term stay)
16. Q: Is the bed changing policy on your unit strictly followed?
A: 65% of the responses claim that the standard procedures of bed changing at their corresponding units are strictly followed. Of which, 63% of the responses (10 out of 16)
1 out of 5 responses
1 out of 5 responses
2 out of 5 responses
1 out of 5 responses
1 out of 5 responses
0 1 2 3
daily
after bath time
upon patient turnaround
depends on patient's clinical situation
after delivery
Standard frequency of bed changing for CW (n=5)
52
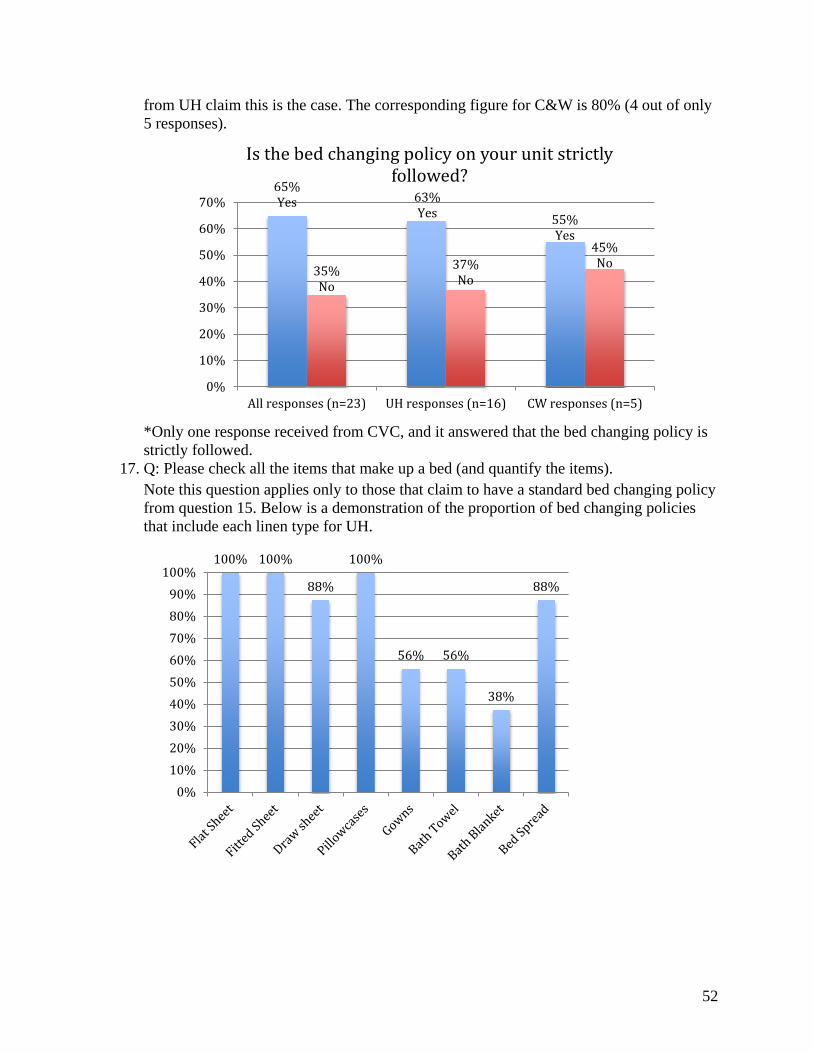
from UH claim this is the case. The corresponding figure for C&W is 80% (4 out of only 5 responses).
*Only one response received from CVC, and it answered that the bed changing policy is strictly followed.
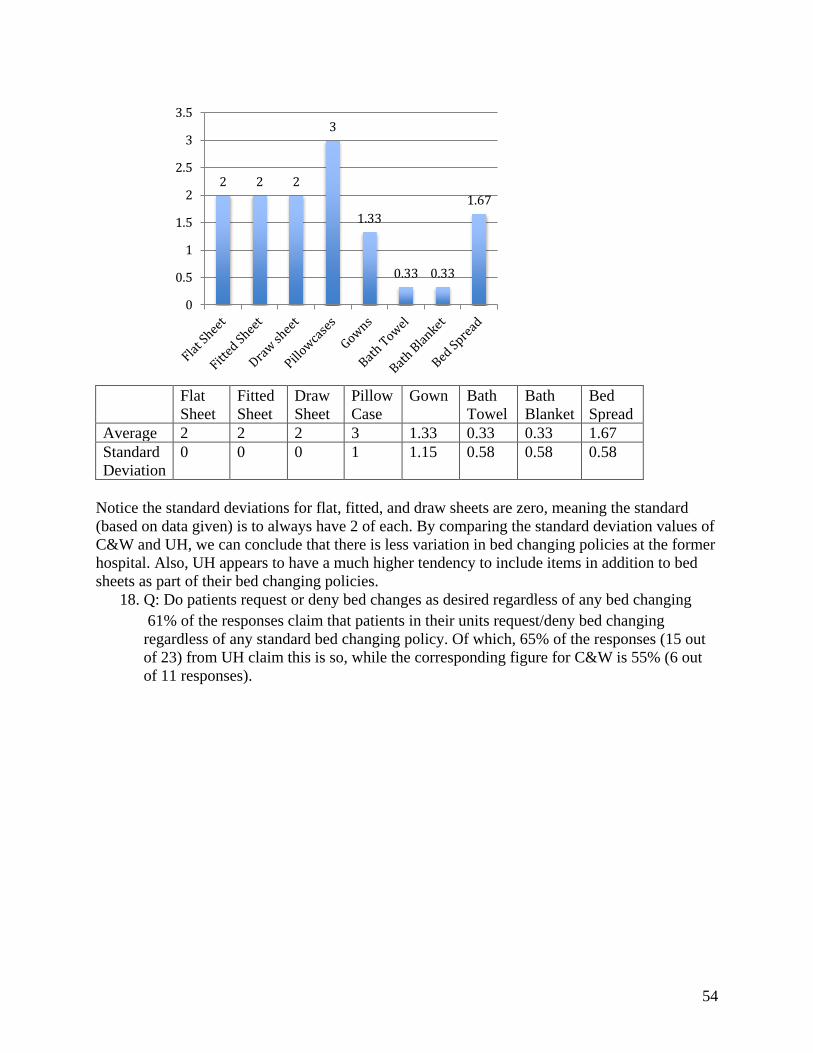
17. Q: Please check all the items that make up a bed (and quantify the items). Note this question applies only to those that claim to have a standard bed changing policy from question 15. Below is a demonstration of the proportion of bed changing policies that include each linen type for UH.
65% Yes 63%
Yes 55% Yes
35% No
37% No
45% No
0%
10%
20%
30%
40%
50%
60%
70%
All responses (n=23) UH responses (n=16) CW responses (n=5)
Is the bed changing policy on your unit strictly followed?
100% 100%
88%
100%
56% 56%
38%
88%
0%10%20%30%40%50%60%70%80%90%
100%

53
Flat Sheet
Fitted Sheet
Draw Sheet
Pillow Case
Gown Bath Towel
Bath Blanket
Bed Spread
Average 1.83 1.83 1.5 2.42 1.25 1.33 1 1.92 Standard Deviation
0.58 0.58 0.9 1 1.06 1.44 1.13 0.67
C&W: Same thing is done for C&W:
’
1.83 1.83
1.50
2.42
1.25 1.33
1.00
1.92
0.00
0.50
1.00
1.50
2.00
2.50
3.00
100%
80%
60%
80%
40%
20% 20% 20%
0%10%20%30%40%50%60%70%80%90%
100%
54
Flat
Sheet Fitted Sheet
Draw Sheet
Pillow Case
Gown Bath Towel
Bath Blanket
Bed Spread
Average 2 2 2 3 1.33 0.33 0.33 1.67 Standard Deviation
0 0 0 1 1.15 0.58 0.58 0.58
Notice the standard deviations for flat, fitted, and draw sheets are zero, meaning the standard (based on data given) is to always have 2 of each. By comparing the standard deviation values of C&W and UH, we can conclude that there is less variation in bed changing policies at the former hospital. Also, UH appears to have a much higher tendency to include items in addition to bed sheets as part of their bed changing policies.
18. Q: Do patients request or deny bed changes as desired regardless of any bed changing 61% of the responses claim that patients in their units request/deny bed changing regardless of any standard bed changing policy. Of which, 65% of the responses (15 out of 23) from UH claim this is so, while the corresponding figure for C&W is 55% (6 out of 11 responses).
2 2 2
3
1.33
0.33 0.33
1.67
0
0.5
1
1.5
2
2.5
3
3.5

55
19. Q: What are the clinical conditions that require frequent bed changes? A: Regarding the clinical conditions that require frequent bed changes, the responses ultimately revolve around the notion that the discharge of bodily fluids is the primary cause for all 3 hospitals. Clear examples include incontinence, diaphoresis, vomiting, blood and wounds. Bed changings are exceptionally frequent at the BICU and other ICU’s.
20. Q: There are clean linens left in patients’ rooms after the patients are discharged (rate from strongly agree to strongly disagree) A: UH:
61% Yes
65% Yes 55%
Yes
25% Yes
39% No
35% No
45% No
75% No
0%10%20%30%40%50%60%70%80%90%
100%
All responses(n=39)
UH responses(n=23)
CW responses(n=11)
CVC response(n=4)
Do patients request/deny bed changing regardless of policy?
22%
26%
9%
39%
4%
0% 20% 40% 60%
Strongly Disagree
Disagree
Neither Agree norDisagree
Agree
Strongly Agree
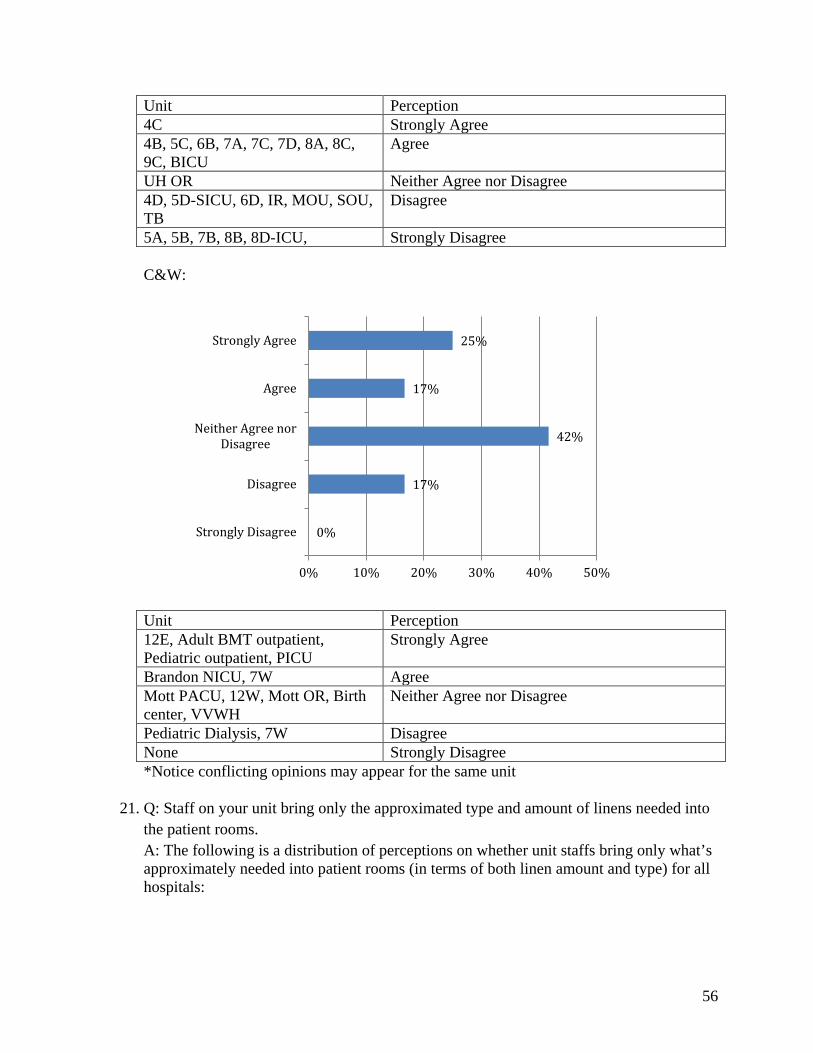
56
Unit Perception 4C Strongly Agree 4B, 5C, 6B, 7A, 7C, 7D, 8A, 8C, 9C, BICU
Agree
UH OR Neither Agree nor Disagree 4D, 5D-SICU, 6D, IR, MOU, SOU, TB
Disagree
5A, 5B, 7B, 8B, 8D-ICU, Strongly Disagree
C&W:
Unit Perception 12E, Adult BMT outpatient, Pediatric outpatient, PICU
Strongly Agree
Brandon NICU, 7W Agree Mott PACU, 12W, Mott OR, Birth center, VVWH
Neither Agree nor Disagree
Pediatric Dialysis, 7W Disagree None Strongly Disagree *Notice conflicting opinions may appear for the same unit
21. Q: Staff on your unit bring only the approximated type and amount of linens needed into the patient rooms. A: The following is a distribution of perceptions on whether unit staffs bring only what’s approximately needed into patient rooms (in terms of both linen amount and type) for all hospitals:
0%
17%
42%
17%
25%
0% 10% 20% 30% 40% 50%
Strongly Disagree
Disagree
Neither Agree norDisagree
Agree
Strongly Agree
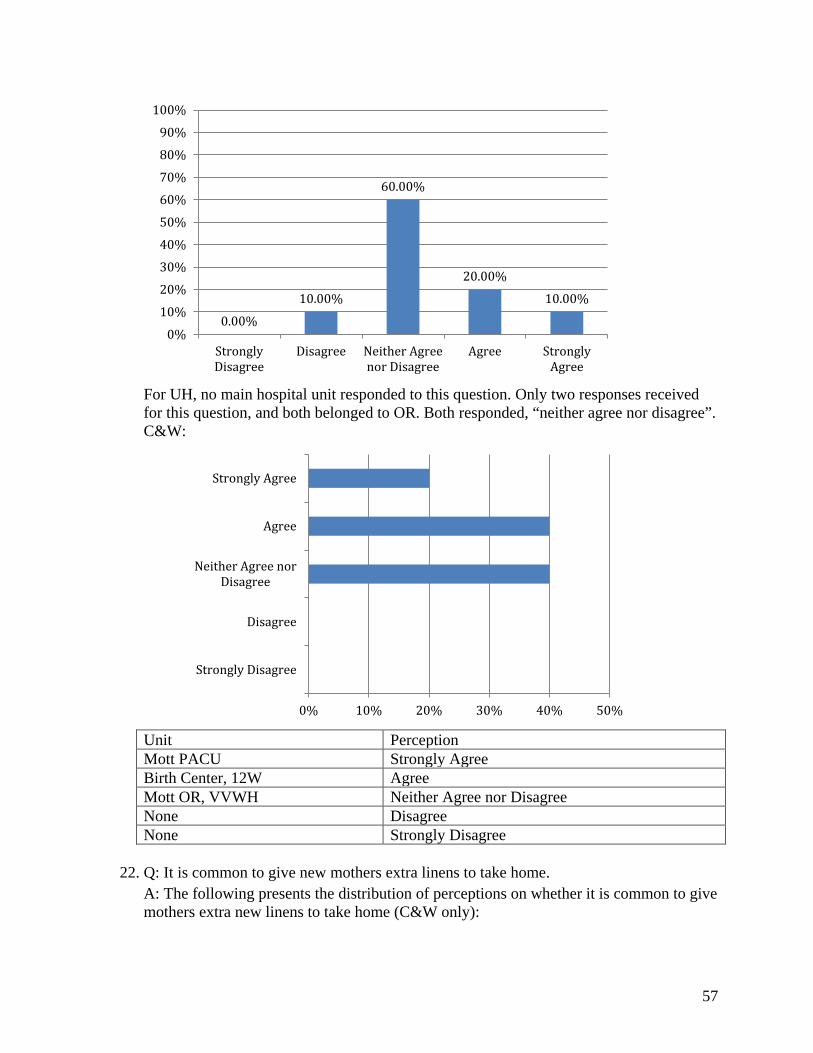
57
For UH, no main hospital unit responded to this question. Only two responses received for this question, and both belonged to OR. Both responded, “neither agree nor disagree”. C&W:
Unit Perception Mott PACU Strongly Agree Birth Center, 12W Agree Mott OR, VVWH Neither Agree nor Disagree None Disagree None Strongly Disagree
22. Q: It is common to give new mothers extra linens to take home. A: The following presents the distribution of perceptions on whether it is common to give mothers extra new linens to take home (C&W only):
0.00%
10.00%
60.00%
20.00%
10.00%
0%
10%
20%
30%
40%
50%
60%
70%
80%
90%
100%
StronglyDisagree
Disagree Neither Agreenor Disagree
Agree StronglyAgree
0% 10% 20% 30% 40% 50%
Strongly Disagree
Disagree
Neither Agree norDisagree
Agree
Strongly Agree

58
Unit Perception None Strongly Agree None Agree Mott PACU, Mott OR, 7W Neither Agree nor Disagree Pediatric Dialysis Disagree 7W, 12E, 12W, Brandon NICU, PICU, Birth center, VVWH
Strongly Disagree
23. Q: On your unit, what are the different methods used to manage linen usage (Ex. Do you
stock linens at the bedside? How much is stocked at the bedside?) Comments on different methods used to manage linens include:
• Not typically stocked at the bedside, linen obtained only during bed changing or daily bath, one explanation was that the 3 clean rooms were already conveniently located across the unit.
• Typically stock in bathroom cabinets • Stocked daily, making sure there are between 1 to 6 of each linen type (varies
between units) in bedside • Stocked in cupboards instead of nurse servers, bedside, etc. • Only stocked in Cart, and not the bedside and nurse servers. • Sub-stock linens in patient rooms and bathrooms, as a result of frequently running
out without being restocked. • SICU typically just keeps a gown, blanket and towel in the room for isolation
patients. • Limit amount of linens that can be placed in patient room • Only stock wash towels in bedside, rest are stored in Cart for accessibility. • Stock one day’s worth of linens into bedside
63.64%
9.09%
27.27%
0.00% 0.00% 0%
10%
20%
30%
40%
50%
60%
70%
80%
90%
100%
StronglyDisagree
Disagree Neither Agreenor Disagree
Agree StronglyAgree
59
• Stocked in nurse servers – expectation is that each shift is observing the servers and restocking only what is needed (based on pre-established standard)]
24. Q: Please write any additional comments (suggestions, complaints, etc.) about linen usage below: A: Regarding the section for additional comments, many complained that they were in fact commonly short of linens. They suggested that extra linens should be made available. One pointed out that it would be helpful if linens could be apportioned to units by patient volume, to resolve the issue of linen shortage. Complaints were also made about the failure of extra linens to arrive on time to meet sudden peaks in demand. Other than complaints, one response expressed that they do indeed have habits of overstocking.
25. Q: If you’re interested in talking to us more about linen usage, please put down your name and email below: 12 responses provided contact details. Responses have been omitted to protect anonymity.
Brief Survey and Interview comparisons: These survey findings do indeed agree with the findings acquired from interviews. First of all, all the 6 interviewees across units in both C&W and UH report that their units perform bed changings daily. This is moderately in agreement with our above finding that a majority (13 out of 22) of the units report that they change beds daily. Also, while all interview responses from UH claim that they bring in all types of bed sheets, 1 out of the 3 interview responses from C&W report that they do not bring in draw sheets. This interview finding agrees with what the graphs above are illustrating, that 100% of all bed changing policies include draw sheets at UH, while only 80% of bed changing policies do so at C&W. Like the survey responses, the interview responses are evenly split on the aspect of bedside carts: half of them stock and half of them don’t. All interview responses more or less agree (none denied its existence) that there is at least some presence of clean linens left behind upon discharge (happened to be interviewing the only one who checked ‘strongly agree’ on the survey for UH). All interview responses from UH stated that they do not stock linens in nurse servers. Half the interview responses from UH claim that patients do request bed changing. Half the interview units at UH report that they stock on the approximated amount, while all C&W responses do.