analyzing pbdes in house dust samples with the tsq quantum xls … · · 2016-02-03the cleaning...
TRANSCRIPT
Analyzing PBDEs in House Dust Samples with the Thermo Scientific TSQ Quantum XLS Ultra GC-MS/MS in EI-SRM ModeInge de Dobbeleer, Joachim Gummersbach, Hans-Joachim Huebschmann, Anton Mayer, Paul Silcock; Thermo Fisher Scientific, Dreieich, Germany
Ap
plica
tion
No
te 5
22
94
Key WordsPolybrominated diphenyl ethers (PBDE), house dust samples, selected reaction monitoring, timed-SRM, SIM, negative chemical ionization
IntroductionPolybrominated diphenyl ethers (PBDEs) were introduced in the 1960s as flame retardants and are currently used in a wide variety of household apparatuses, consumer electronics, furniture and more. Environmental levels of PBDEs have been continuously increasing due to their special persistence. Certain congeners have been banned completely and are currently in the list of the Stockholm convention’s persistent organic pollutants.1,2 Sources of human intake are typically via ingestion (nutritional) and the inhalation of indoor and house dust.
Due to growing concerns over the health risks from constant exposure to this class of compounds and the accumulation effects in the food chain, suitable analytical methods are required to quantify flame retardant compounds at low levels in a variety of matrices.
Current analyses are performed using either electron impact (EI) or negative chemical ionization (NCI) GC/MS as a detection technique. In this application note, the EI-selected reaction monitoring (SRM) method is highlighted, and a short comparison is made with a NCI technique. A broad range of PBDE samples and congeners were analyzed, ranging from tri- up to deca-BDEs.
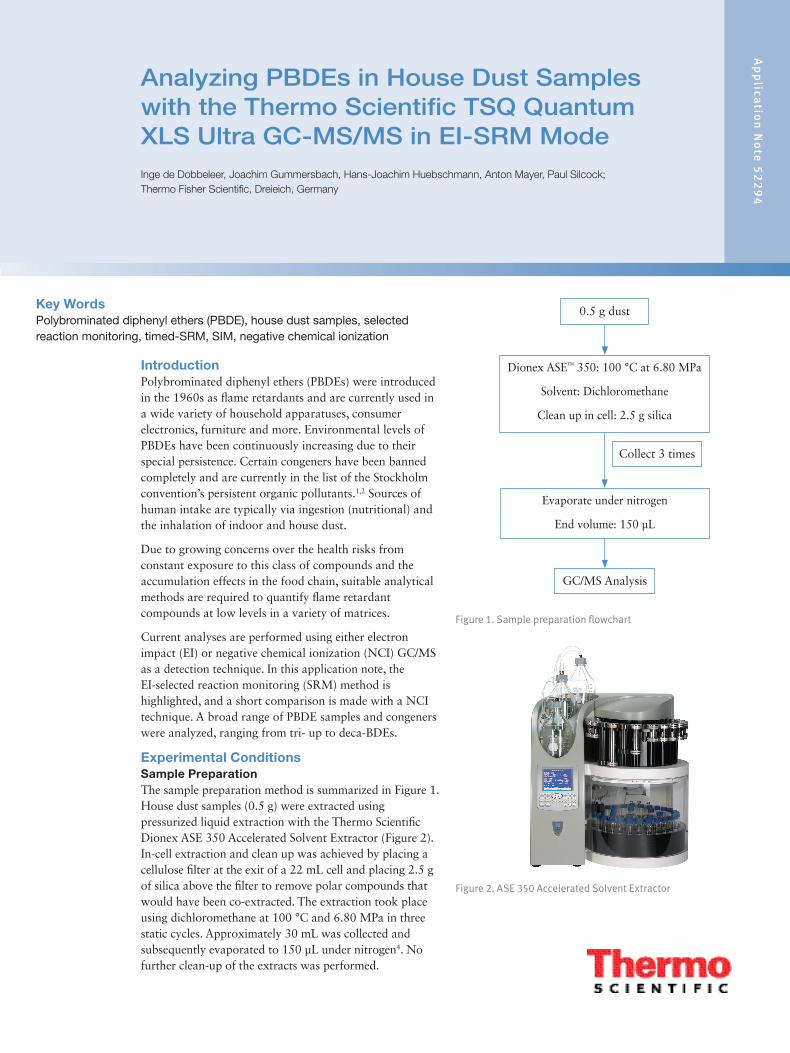
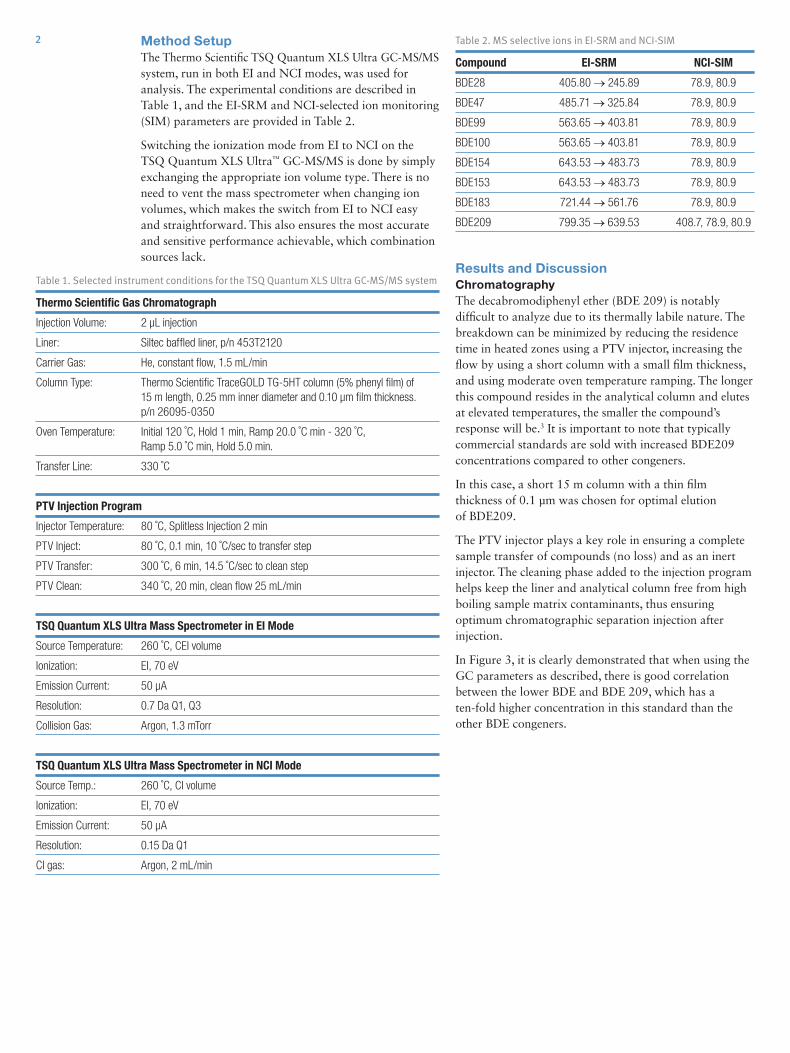
Experimental ConditionsSample PreparationThe sample preparation method is summarized in Figure 1. House dust samples (0.5 g) were extracted using pressurized liquid extraction with the Thermo Scientific Dionex ASE 350 Accelerated Solvent Extractor (Figure 2). In-cell extraction and clean up was achieved by placing a cellulose filter at the exit of a 22 mL cell and placing 2.5 g of silica above the filter to remove polar compounds that would have been co-extracted. The extraction took place using dichloromethane at 100 °C and 6.80 MPa in three static cycles. Approximately 30 mL was collected and subsequently evaporated to 150 µL under nitrogen4. No further clean-up of the extracts was performed.
Figure 1. Sample preparation flowchart
0.5 g dust
Dionex ASE™ 350: 100 °C at 6.80 MPa
Solvent: Dichloromethane
Clean up in cell: 2.5 g silica
Collect 3 times
Evaporate under nitrogen
End volume: 150 µL
GC/MS Analysis
Figure 2. ASE 350 Accelerated Solvent Extractor
2 Method SetupThe Thermo Scientific TSQ Quantum XLS Ultra GC-MS/MS system, run in both EI and NCI modes, was used for analysis. The experimental conditions are described in Table 1, and the EI-SRM and NCI-selected ion monitoring (SIM) parameters are provided in Table 2.
Switching the ionization mode from EI to NCI on the TSQ Quantum XLS Ultra™ GC-MS/MS is done by simply exchanging the appropriate ion volume type. There is no need to vent the mass spectrometer when changing ion volumes, which makes the switch from EI to NCI easy and straightforward. This also ensures the most accurate and sensitive performance achievable, which combination sources lack.
Table 2. MS selective ions in EI-SRM and NCI-SIM
Compound EI-SRM NCI-SIM
BDE28 405.80 → 245.89 78.9, 80.9
BDE47 485.71 → 325.84 78.9, 80.9
BDE99 563.65 → 403.81 78.9, 80.9
BDE100 563.65 → 403.81 78.9, 80.9
BDE154 643.53 → 483.73 78.9, 80.9
BDE153 643.53 → 483.73 78.9, 80.9
BDE183 721.44 → 561.76 78.9, 80.9
BDE209 799.35 → 639.53 408.7, 78.9, 80.9
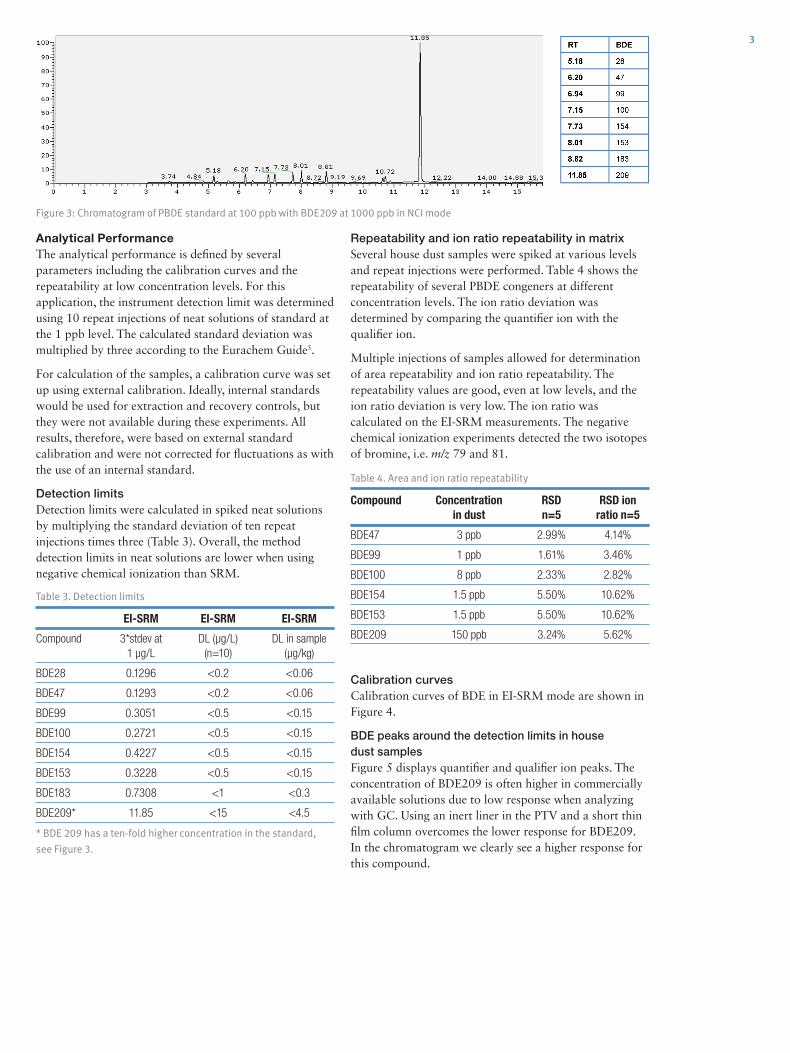
Results and DiscussionChromatographyThe decabromodiphenyl ether (BDE 209) is notably difficult to analyze due to its thermally labile nature. The breakdown can be minimized by reducing the residence time in heated zones using a PTV injector, increasing the flow by using a short column with a small film thickness, and using moderate oven temperature ramping. The longer this compound resides in the analytical column and elutes at elevated temperatures, the smaller the compound’s response will be.3 It is important to note that typically commercial standards are sold with increased BDE209 concentrations compared to other congeners.
In this case, a short 15 m column with a thin film thickness of 0.1 µm was chosen for optimal elution of BDE209.
The PTV injector plays a key role in ensuring a complete sample transfer of compounds (no loss) and as an inert injector. The cleaning phase added to the injection program helps keep the liner and analytical column free from high boiling sample matrix contaminants, thus ensuring optimum chromatographic separation injection after injection.
In Figure 3, it is clearly demonstrated that when using the GC parameters as described, there is good correlation between the lower BDE and BDE 209, which has a ten-fold higher concentration in this standard than the other BDE congeners.
Table 1. Selected instrument conditions for the TSQ Quantum XLS Ultra GC-MS/MS system
Thermo Scientific Gas Chromatograph
Injection Volume: 2 μL injection
Liner: Siltec baffled liner, p/n 453T2120
Carrier Gas: He, constant flow, 1.5 mL/min
Column Type: Thermo Scientific TraceGOLD TG-5HT column (5% phenyl film) of 15 m length, 0.25 mm inner diameter and 0.10 μm film thickness. p/n 26095-0350
Oven Temperature: Initial 120 ˚C, Hold 1 min, Ramp 20.0 ˚C min - 320 ˚C, Ramp 5.0 ˚C min, Hold 5.0 min.
Transfer Line: 330 ˚C
PTV Injection Program
Injector Temperature: 80 ˚C, Splitless Injection 2 min
PTV Inject: 80 ˚C, 0.1 min, 10 ˚C/sec to transfer step
PTV Transfer: 300 ˚C, 6 min, 14.5 ˚C/sec to clean step
PTV Clean: 340 ˚C, 20 min, clean flow 25 mL/min
TSQ Quantum XLS Ultra Mass Spectrometer in EI Mode
Source Temperature: 260 ˚C, CEI volume
Ionization: EI, 70 eV
Emission Current: 50 μA
Resolution: 0.7 Da Q1, Q3
Collision Gas: Argon, 1.3 mTorr
TSQ Quantum XLS Ultra Mass Spectrometer in NCI Mode
Source Temp.: 260 ˚C, CI volume
Ionization: EI, 70 eV
Emission Current: 50 μA
Resolution: 0.15 Da Q1
CI gas: Argon, 2 mL/min
Analytical PerformanceThe analytical performance is defined by several parameters including the calibration curves and the repeatability at low concentration levels. For this application, the instrument detection limit was determined using 10 repeat injections of neat solutions of standard at the 1 ppb level. The calculated standard deviation was multiplied by three according to the Eurachem Guide5.
For calculation of the samples, a calibration curve was set up using external calibration. Ideally, internal standards would be used for extraction and recovery controls, but they were not available during these experiments. All results, therefore, were based on external standard calibration and were not corrected for fluctuations as with the use of an internal standard.
Detection limitsDetection limits were calculated in spiked neat solutions by multiplying the standard deviation of ten repeat injections times three (Table 3). Overall, the method detection limits in neat solutions are lower when using negative chemical ionization than SRM.
Table 3. Detection limits
EI-SRM EI-SRM EI-SRM
Compound 3*stdev at DL (µg/L) DL in sample 1 µg/L (n=10) (µg/kg)
BDE28 0.1296 <0.2 <0.06
BDE47 0.1293 <0.2 <0.06
BDE99 0.3051 <0.5 <0.15
BDE100 0.2721 <0.5 <0.15
BDE154 0.4227 <0.5 <0.15
BDE153 0.3228 <0.5 <0.15
BDE183 0.7308 <1 <0.3
BDE209* 11.85 <15 <4.5
* BDE 209 has a ten-fold higher concentration in the standard,
see Figure 3.
Repeatability and ion ratio repeatability in matrixSeveral house dust samples were spiked at various levels and repeat injections were performed. Table 4 shows the repeatability of several PBDE congeners at different concentration levels. The ion ratio deviation was determined by comparing the quantifier ion with the qualifier ion.
Multiple injections of samples allowed for determination of area repeatability and ion ratio repeatability. The repeatability values are good, even at low levels, and the ion ratio deviation is very low. The ion ratio was calculated on the EI-SRM measurements. The negative chemical ionization experiments detected the two isotopes of bromine, i.e. m/z 79 and 81.
Table 4. Area and ion ratio repeatability
Compound Concentration RSD RSD ion in dust n=5 ratio n=5
BDE47 3 ppb 2.99% 4.14%
BDE99 1 ppb 1.61% 3.46%
BDE100 8 ppb 2.33% 2.82%
BDE154 1.5 ppb 5.50% 10.62%
BDE153 1.5 ppb 5.50% 10.62%
BDE209 150 ppb 3.24% 5.62%
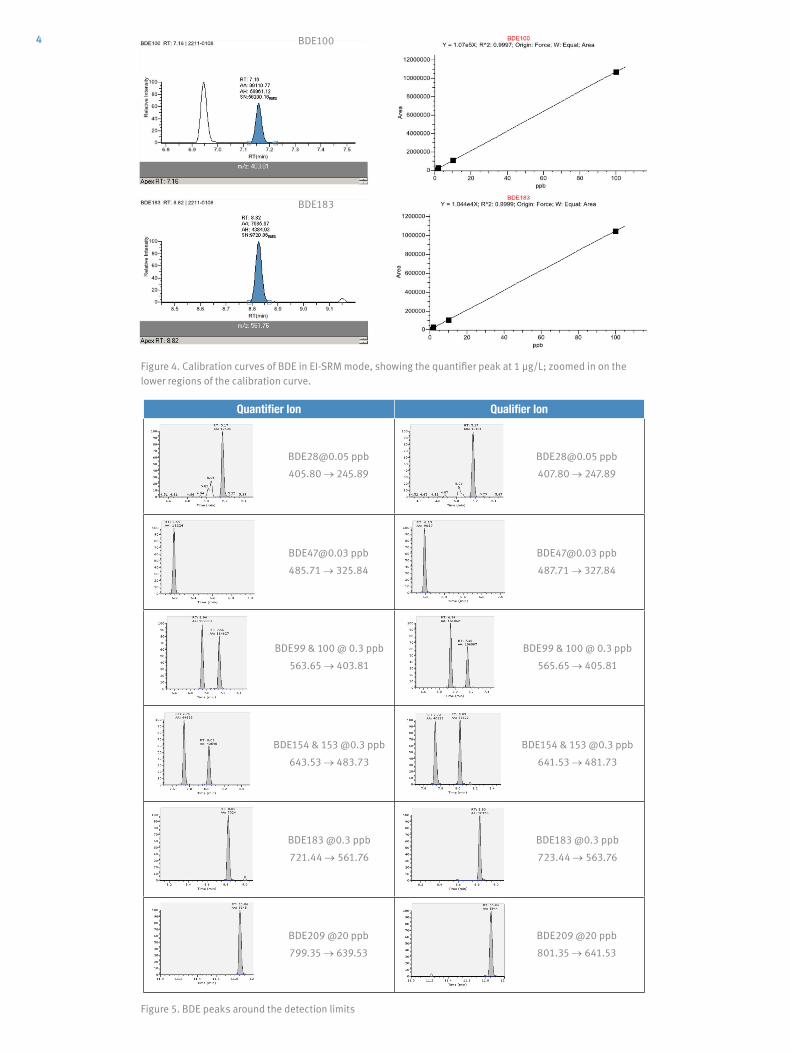
Calibration curvesCalibration curves of BDE in EI-SRM mode are shown in Figure 4.
BDE peaks around the detection limits in house dust samplesFigure 5 displays quantifier and qualifier ion peaks. The concentration of BDE209 is often higher in commercially available solutions due to low response when analyzing with GC. Using an inert liner in the PTV and a short thin film column overcomes the lower response for BDE209. In the chromatogram we clearly see a higher response for this compound.
3
Figure 3: Chromatogram of PBDE standard at 100 ppb with BDE209 at 1000 ppb in NCI mode
4
Figure 4. Calibration curves of BDE in EI-SRM mode, showing the quantifier peak at 1 µg/L; zoomed in on the lower regions of the calibration curve.
Figure 5. BDE peaks around the detection limits
Quantifier Ion Qualifier Ion
405.80 → 245.89
485.71 → 325.84
BDE99 & 100 @ 0.3 ppb
563.65 → 403.81
BDE154 & 153 @0.3 ppb
643.53 → 483.73
BDE183 @0.3 ppb
721.44 → 561.76
BDE209 @20 ppb
799.35 → 639.53
407.80 → 247.89
487.71 → 327.84
BDE99 & 100 @ 0.3 ppb
565.65 → 405.81
BDE154 & 153 @0.3 ppb
641.53 → 481.73
BDE183 @0.3 ppb
723.44 → 563.76
BDE209 @20 ppb
801.35 → 641.53
BDE100
BDE183
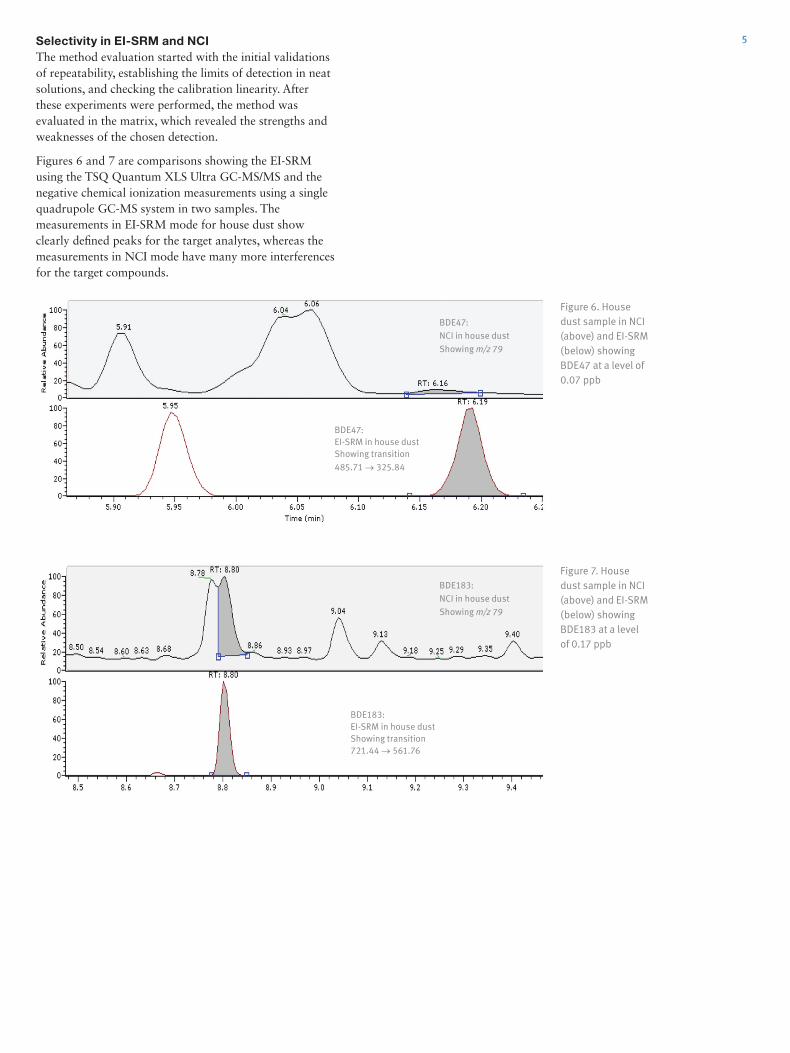
Selectivity in EI-SRM and NCIThe method evaluation started with the initial validations of repeatability, establishing the limits of detection in neat solutions, and checking the calibration linearity. After these experiments were performed, the method was evaluated in the matrix, which revealed the strengths and weaknesses of the chosen detection.
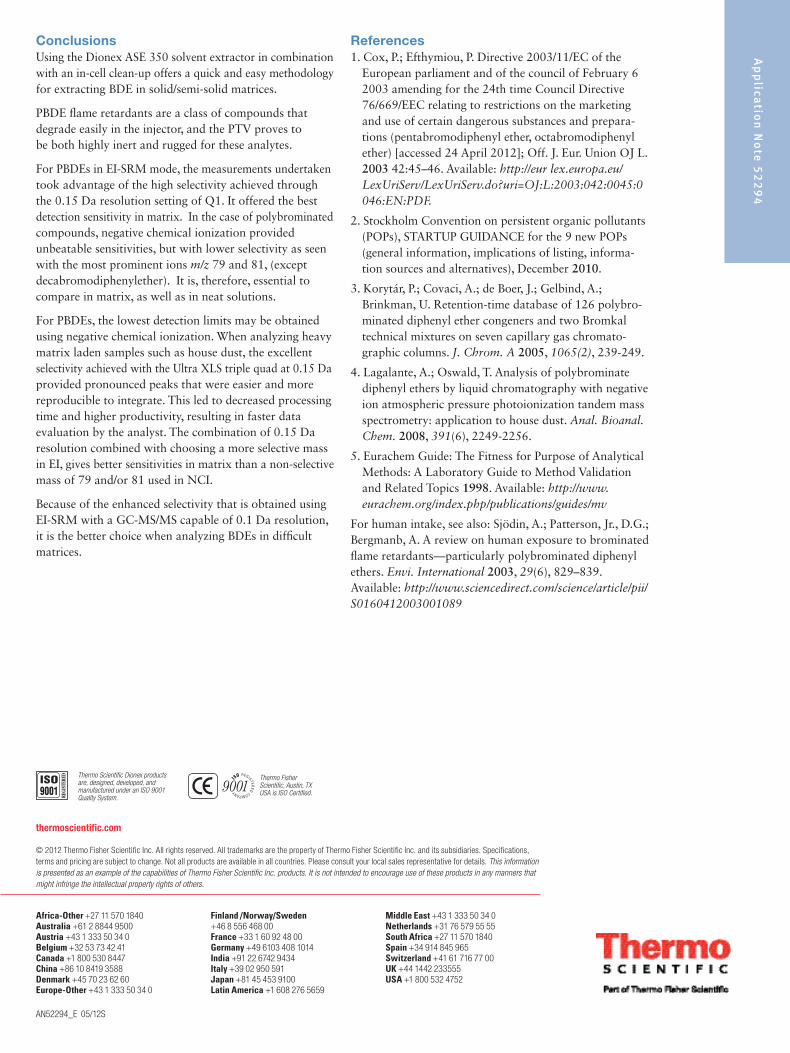
Figures 6 and 7 are comparisons showing the EI-SRM using the TSQ Quantum XLS Ultra GC-MS/MS and the negative chemical ionization measurements using a single quadrupole GC-MS system in two samples. The measurements in EI-SRM mode for house dust show clearly defined peaks for the target analytes, whereas the measurements in NCI mode have many more interferences for the target compounds.
5
BDE47:
NCI in house dust
Showing m/z 79
BDE47:EI-SRM in house dustShowing transition
485.71 → 325.84
BDE183:EI-SRM in house dustShowing transition721.44 → 561.76
BDE183:
NCI in house dust
Showing m/z 79
Figure 6. House dust sample in NCI (above) and EI-SRM (below) showing BDE47 at a level of 0.07 ppb
Figure 7. House dust sample in NCI (above) and EI-SRM (below) showing BDE183 at a level of 0.17 ppb
Thermo Scientific Dionex products are, designed, developed, and manufactured under an ISO 9001 Quality System.
thermoscientific.com © 2012 Thermo Fisher Scientific Inc. All rights reserved. All trademarks are the property of Thermo Fisher Scientific Inc. and its subsidiaries. Specifications, terms and pricing are subject to change. Not all products are available in all countries. Please consult your local sales representative for details. This information is presented as an example of the capabilities of Thermo Fisher Scientific Inc. products. It is not intended to encourage use of these products in any manners that might infringe the intellectual property rights of others.
Africa-Other +27 11 570 1840Australia +61 2 8844 9500Austria +43 1 333 50 34 0Belgium +32 53 73 42 41Canada +1 800 530 8447China +86 10 8419 3588Denmark +45 70 23 62 60Europe-Other +43 1 333 50 34 0
Finland /Norway/Sweden +46 8 556 468 00France +33 1 60 92 48 00Germany +49 6103 408 1014India +91 22 6742 9434Italy +39 02 950 591Japan +81 45 453 9100Latin America +1 608 276 5659
Middle East +43 1 333 50 34 0Netherlands +31 76 579 55 55South Africa +27 11 570 1840Spain +34 914 845 965Switzerland +41 61 716 77 00UK +44 1442 233555USA +1 800 532 4752
AN52294_E 05/12S
Ap
plica
tion
No
te 5
22
94
References1. Cox, P.; Efthymiou, P. Directive 2003/11/EC of the
European parliament and of the council of February 6 2003 amending for the 24th time Council Directive 76/669/EEC relating to restrictions on the marketing and use of certain dangerous substances and prepara-tions (pentabromodiphenyl ether, octabromodiphenyl ether) [accessed 24 April 2012]; Off. J. Eur. Union OJ L. 2003 42:45–46. Available: http://eur lex.europa.eu/LexUriServ/LexUriServ.do?uri=OJ:L:2003:042:0045:0046:EN:PDF.
2. Stockholm Convention on persistent organic pollutants (POPs), STARTUP GUIDANCE for the 9 new POPs (general information, implications of listing, informa-tion sources and alternatives), December 2010.
3. Korytár, P.; Covaci, A.; de Boer, J.; Gelbind, A.; Brinkman, U. Retention-time database of 126 polybro-minated diphenyl ether congeners and two Bromkal technical mixtures on seven capillary gas chromato-graphic columns. J. Chrom. A 2005, 1065(2), 239-249.
4. Lagalante, A.; Oswald, T. Analysis of polybrominate diphenyl ethers by liquid chromatography with negative ion atmospheric pressure photoionization tandem mass spectrometry: application to house dust. Anal. Bioanal. Chem. 2008, 391(6), 2249-2256.
5. Eurachem Guide: The Fitness for Purpose of Analytical Methods: A Laboratory Guide to Method Validation and Related Topics 1998. Available: http://www.eurachem.org/index.php/publications/guides/mv
For human intake, see also: Sjödin, A.; Patterson, Jr., D.G.; Bergmanb, A. A review on human exposure to brominated flame retardants—particularly polybrominated diphenyl ethers. Envi. International 2003, 29(6), 829–839. Available: http://www.sciencedirect.com/science/article/pii/S0160412003001089
ConclusionsUsing the Dionex ASE 350 solvent extractor in combination with an in-cell clean-up offers a quick and easy methodology for extracting BDE in solid/semi-solid matrices.
PBDE flame retardants are a class of compounds that degrade easily in the injector, and the PTV proves to be both highly inert and rugged for these analytes.
For PBDEs in EI-SRM mode, the measurements undertaken took advantage of the high selectivity achieved through the 0.15 Da resolution setting of Q1. It offered the best detection sensitivity in matrix. In the case of polybrominated compounds, negative chemical ionization provided unbeatable sensitivities, but with lower selectivity as seen with the most prominent ions m/z 79 and 81, (except decabromodiphenylether). It is, therefore, essential to compare in matrix, as well as in neat solutions.
For PBDEs, the lowest detection limits may be obtained using negative chemical ionization. When analyzing heavy matrix laden samples such as house dust, the excellent selectivity achieved with the Ultra XLS triple quad at 0.15 Da provided pronounced peaks that were easier and more reproducible to integrate. This led to decreased processing time and higher productivity, resulting in faster data evaluation by the analyst. The combination of 0.15 Da resolution combined with choosing a more selective mass in EI, gives better sensitivities in matrix than a non-selective mass of 79 and/or 81 used in NCI.
Because of the enhanced selectivity that is obtained using EI-SRM with a GC-MS/MS capable of 0.1 Da resolution, it is the better choice when analyzing BDEs in difficult matrices.
Thermo Fisher Scientific, Austin, TX USA is ISO Certified.