analyzing responses to open ended questions for …
TRANSCRIPT
Purdue UniversityPurdue e-Pubs
Open Access Theses Theses and Dissertations
Spring 2014
ANALYZING RESPONSES TO OPEN ENDEDQUESTIONS FOR SPIRIT USING ASPECTORIENTED SENTIMENT ANALYSISAnimesh JainPurdue University
Follow this and additional works at: https://docs.lib.purdue.edu/open_access_theses
Part of the Educational Assessment, Evaluation, and Research Commons, Feminist, Gender, andSexuality Studies Commons, and the Science and Technology Studies Commons
This document has been made available through Purdue e-Pubs, a service of the Purdue University Libraries. Please contact [email protected] foradditional information.
Recommended CitationJain, Animesh, "ANALYZING RESPONSES TO OPEN ENDED QUESTIONS FOR SPIRIT USING ASPECT ORIENTEDSENTIMENT ANALYSIS" (2014). Open Access Theses. 193.https://docs.lib.purdue.edu/open_access_theses/193

Graduate School ETD Form 9 (Revised 01/14)
PURDUE UNIVERSITY GRADUATE SCHOOL
Thesis/Dissertation Acceptance
This is to certify that the thesis/dissertation prepared
By
Entitled
For the degree of
Is approved by the final examining committee:
To the best of my knowledge and as understood by the student in the Thesis/Dissertation Agreement.Publication Delay, and Certification/Disclaimer (Graduate School Form 32), this thesis/dissertationadheres to the provisions of Purdue University’s “Policy on Integrity in Research” and the use of copyrighted material.
Approved by Major Professor(s): ____________________________________
____________________________________
Approved by:
Head of the Department Graduate Program Date
ANIMESH JAIN
ANALYZING RESPONSES TO OPEN-ENDED QUESTIONS FOR SPIRIT USING ASPECT-ORIENTED SENTIMENT ANALYSIS
Master of Science
Alka R. Harriger
John A. Springer
Brandeis H. Marshall
Alka R. Harriger
Jeffery L. Whitten 04/25/2014
ANALYZING RESPONSES TO OPEN ENDED QUESTIONS FOR SPIRIT
USING ASPECT ORIENTED SENTIMENT ANALYSIS
A Thesis
Submitted to the Faculty
of
Purdue University
by
Animesh Jain
In Partial Fulfillment of the
Requirements for the Degree
of
Master of Science
May 2014
Purdue University
West Lafayette, Indiana

ii
Dedicated to my family

iii
ACKNOWLEDGMENTS
My sincere thanks to my thesis committee chair and academic advisor, Prof. Alka
Harriger, for giving me an opportunity to work on this interesting research topic. Her constant
support and guidance in polishing my research skills has helped me to understand the research
problem well and work towards the development of the proposed methodology to get the desired
results.
I also wish to express my gratitude to my committee members: Dr. John A. Springer and
Dr. Brandeis Marshall for their valuable comments and suggestions. I thank all my committee
members for their assistance in finalizing the thesis proposal, plan of study and the final thesis.
I would like to thank Prof. Julia Taylor for her insightful suggestions and to Prof. Tadd
Colver in the department of statistics for providing help and guidance in dealing with all the
numbers! I would also like to thank my parents and friends, for their strength, cooperation and
encouragement.

iv
TABLE OF CONTENTS
Page
LIST OF TABLES ......................................................................................................................... vii
LIST OF FIGURES ...................................................................................................................... viii
GLOSSARY .............................................................................................................................. ix
ABSTRACT .............................................................................................................................. xi
CHAPTER 1. INTRODUCTION ................................................................................................. 1
1.1 Background ............................................................................................................ 1
1.2 Scope ...................................................................................................................... 2
1.3 Significance ........................................................................................................... 3
1.4 Statement of Problem ............................................................................................. 3
1.5 Research Question ................................................................................................. 4
1.6 Assumptions .......................................................................................................... 4
1.7 Limitations ............................................................................................................. 5
CHAPTER 2. REVIEW OF LITERATURE ................................................................................ 7
2.1 Background ............................................................................................................ 8
2.2 SPIRIT Data Collection and Analysis Methodology ............................................. 8
2.3 Open Ended and Close Ended Survey Questions ................................................ 11

v
Page
2.4 Sentiment Analysis .............................................................................................. 11
2.4.1 Document Level Classification............................................................... 12
2.4.2 Sentence Level Classification ................................................................. 13
2.4.3 Phrase Level Classification .................................................................... 13
2.5 Lexicons for sentiment analysis ........................................................................... 14
2.6 Natural language toolkit ....................................................................................... 16
2.7 The Probit Model ................................................................................................. 16
2.8 Summary .............................................................................................................. 17
CHAPTER 3. PROCEDURES AND METHODOLOGIES ....................................................... 18
3.1 Hypothesis ........................................................................................................... 18
3.2 System Overview ................................................................................................. 19
3.2.1 Text Extractor ......................................................................................... 20
3.2.2 Sentiment Classifier ................................................................................ 21
3.2.3 Aspect Identification ............................................................................... 21
3.2.4 Aggregator and Summarizer ................................................................... 22
3.3 Sampling .............................................................................................................. 23
3.2 Data Analysis Methodology ................................................................................ 24
3.3 Summary .............................................................................................................. 26
CHAPTER 4. ANALYSIS .......................................................................................................... 27
4.1 Classifier Evaluation ............................................................................................ 27

vi
Page
4.2 Tagger Evaluation ................................................................................................ 34
4.3 Data Evaluation.................................................................................................... 36
4.3.1 Testing for Hypothesis 1 ......................................................................... 37
4.3.2 Testing for Hypothesis 2 ......................................................................... 40
4.3.3 Testing for Hypothesis 3 ......................................................................... 43
4.4 Summary .............................................................................................................. 46
CHAPTER 5. DISCUSSIONS .................................................................................................... 47
5.1 Conclusions .......................................................................................................... 47
5.2 Future Directions ................................................................................................. 48
5.3 Summary .............................................................................................................. 48
LIST OF REFERENCES ............................................................................................................... 49
APPENDIX ............................................................................................................................. 53

vii
LIST OF TABLES
Page
Table 2.1 - Career Goals before and after SPIRIT ......................................................................... 10
Table 2.2 - Plans to attend college ................................................................................................. 10
Table 3.1 - 2008 SPIRIT Demographics (Students) ...................................................................... 23
Table 3.2 - 2009 SPIRIT Demographics (Students) ...................................................................... 23
Table 3.3 - 2010 SPIRIT Demographics (Students) ...................................................................... 23
Table 4.1 - Training Model Compositions ..................................................................................... 29
Table 4.2 - Classifier Evaluation Variables ................................................................................... 30
Table 4.3 - Classifier Accuracy ..................................................................................................... 31
Table 4.4 - Classifier Positive Precision and Recalls ..................................................................... 31
Table 4.5 - Classifier Negative Precision and Recall ..................................................................... 32
Table 4.6 - Tagger Evaluation Data Composition ......................................................................... 35
Table 4.7 - Tagger Evaluation Data ............................................................................................... 35
Table 4.8 - T-Test for Hypothesis 1 ............................................................................................... 40
Table 4.9 - T-Test for Hypothesis 2 ............................................................................................... 42
Table 4.10 - T-Test for Hypothesis 3 ............................................................................................. 45

viii
LIST OF FIGURES
Page
Figure 3.1- Overview of the System (Goldensohn et al., 2008) .................................................... 19
Figure 3.2 - Flowchart for Data Analysis ...................................................................................... 25
Figure 4.1 - Classifier Evaluation .................................................................................................. 33
Figure 4.2 - Tagger Accuracy Graph ............................................................................................. 36
Figure 4.3 - Probit Transformed Sentiment Strength Histogram (H1-Pre) .................................... 38
Figure 4.4 - Probit Transformed Sentiment Strength Histogram (H1-Post) .................................. 39
Figure 4.5 - Probit Transformed Sentiment Strength Histogram (H2-Pre) .................................... 41
Figure 4.6 - Probit Transformed Sentiment Strength Histogram (H2-Post) .................................. 42
Figure 4.7 - Probit Transformed Sentiment Strength Histogram (H3-Pre) .................................... 44
Figure 4.8 - Probit Transformed Sentiment Strength Histogram (H3-Post) .................................. 45
Appendix Figures
A. 1 - Scatterplot for hypothesis 1 raw data (pre) .......................................................................... 53
A. 2 - Scatterplot for hypothesis 1 raw data (post) ........................................................................ 54
A. 3 - Scatterplot for hypothesis 2 raw data (post) ........................................................................ 54
A. 4 - Scatterplot for hypothesis 2 raw data (post) ........................................................................ 55
A. 5 - Scatterplot for hypothesis 3 raw data (pre) .......................................................................... 55
A. 6 - Scatterplot for hypothesis 3 raw data (post) ........................................................................ 56

ix
GLOSSARY
Aspect – A characteristic or a feature regarded as an inherent part of someone or something, in
this case a response to a survey question.
Corpus – A collection of written works that describe a language.
Dictionary of Affect in Language (DAL) - An instrument designed to measure the emotional
meaning of words and texts.
Dynamic Extractor – An extractor which extracts the subject on the sentence during run-time
based on the structure of the sentence.
GNU General Public License (GPL) – It is a free software license which guarantees the end user
the freedom to use, study, modify and share the software.
Lexicon – The vocabulary of a person, language or a branch of knowledge. Three lexicons are
used in this study, the Brown, Treebank and the coNLL2000.
Natural Language Toolkit (NLTK) - A suite of libraries for writing code for statistical natural
language processing in Python.
Negativity (Neg) – Indicating, expressing or consisting of a negation or opposition to something.
Objectivity (Obj) – The state or quality of being free from any bias or subjectivity.
PN-Polarity –The strength of the emotion of a word.
Parts-Of-Speech (POS) Tagging – The process of marking up a word as a particular part of
speech (e.g. noun, verb etc.) based on its definition and the context.
Positivity (Pos) – The state or character of being, expressing or indicating a positive sentiment or
liking towards something.
Science, Technology, Engineering and Mathematics (STEM) - Generally used as an acronym for
the fields of study in the categories of science, technology, engineering and mathematics.
Sentiment Analysis – Identifying and extracting subjective and emotional information from
source materials using natural language processing, text analysis and computational
linguistics.

x
SentiWordNet – SentiWordNet is an extension of WordNet and acts as a lexical resource for
opinion mining.
Subjectivity/Objectivity Polarity (SO-Polarity) – The strength of the factual nature of a word.
Static Extractor – An aspect extractor which uses fixed set of aspects to extract the aspect of a
particular text.
Synsets – Short for synonym sets, they are sets of synonyms for a particular word.
Surprising Possibilities Imagined and Realized through Information Technology (SPIRIT) – A
short term educational workshop organized to increase the interest of students belonging
to the underrepresented population in Information Technology.
Tokenizing – Breaking up of a textual clause into words, phrases, symbols or other meaningful
texts called tokens.
WordNet - A lexical database for the English language.
Word Sense Disambiguation – Differentiating between the different meanings of a word based on
its context.

xi
ABSTRACT
Animesh Jain M.S., Purdue University, May 2014. Analyzing Responses to Open-Ended
Questions for SPIRIT using Aspect-Oriented Sentiment Analysis. Major Professor: Alka R.
Harriger.
Open ended questions provide an effective way of measuring the attitude and perception of
respondents towards a topic. Surprising Possibilities Imagined and Realized through Information
Technology (SPIRIT) was a program (2008-2012) that employed open-ended questions to gauge
program participants’ attitudes related to computing. SPIRIT sought to increase the interest of
high school students, especially female students, towards computing courses and careers. Pre-
and post-attitude surveys were used during the program to measure the changes in attitudes of the
participants towards IT and also to analyze the impact different sessions had on different
demographic groups of participants. The open-ended survey questions from SPIRIT provide the
data needed for this study’s analysis. SPIRIT’s external evaluator employed the constant
comparison method to analyze the participant data. This study analyzed those same responses
using aspect-oriented sentiment analysis to make reporting and decision making for such
programs easier and more objective than human evaluation of open-ended feedback. The
approach identified the aspect of each phrase or statement made in the responses and then
quantitatively classified the sentiment of each aspect. Thus, the study’s approach not only solves
the problem of objectively analyzing the open-ended responses of participants of short term

xii
educational programs similar to SPIRIT but also may help mine new information from the
surveys that would help make decisions in order to make future programs have a better impact on
the participants.

1
CHAPTER 1. INTRODUCTION
This chapter provides an overview of the research problem, along with the scope,
significance, assumptions, and other background information for the research. The next chapter
will provide a literature review for the various sentiment analysis mechanisms and technologies
needed to create the system.
1.1 Background
National education standards and industry expect that every high school graduate,
irrespective of his or her future career paths, should be adequately prepared with technology
skills to be productive in the digital age (International Society for Technology in Education,
2011). Unfortunately, in America, the enrollment in computer science and technology courses in
K-12 has been on the decline for the past decade (Carnegie Mellon University, 2010). Thus,
increasing student interest in STEM remains an important goal for America.
Surprising Possibilities Imagined and Realized through Information Technology
(SPIRIT) was a program started in 2008 and funded by the National Science Foundation in an
effort to increase the nationwide interest in computing disciplines, particularly of female students
(Harriger, 2013a). SPIRIT consisted of a two-week, professional development program for high
school teachers and guidance counselors, and a one-week program for high school students. It
helped the teachers and counselors understand how information technology (IT) can make a
positive difference in society and the different career paths that students can undertake by

2
enrolling in technology courses in high school. An important part of the SPIRIT program
involved talks and hands-on activities led by various IT professionals to broaden the participants’
awareness of IT applications and careers (Harriger, Magana & Lovan, 2012).
For all participants, pre- and post-attitude surveys were taken in order to gauge the
change the program had on their attitudes towards IT and analyze their understanding of
technology before and after the program. Feedback was also collected during the program in
order to identify the activities that appealed more to the participants. The feedback was analyzed
to identify activities that would improve future programs. For most years, the survey results were
collected on paper forms developed by the evaluator, transcribed into Excel files, original paper
forms and Excel data shared with the evaluator, and the Excel data analyzed by the evaluator.
These surveys were mostly based on multiple yes or no questions or questions which
used a four-point Likert scale (Harriger, 2013a). The open ended questions were also analyzed by
the evaluator using the constant comparison method but were mostly based on the evaluators’
intuition and perception.
1.2 Scope
This research study sought to build a system that would use aspect-oriented sentiment
analysis to analyze the responses of the open-ended questions asked in the SPIRIT surveys to get
a better and more objective understanding of those responses. This analysis helped confirm and
strengthen the results found by the external evaluator. The results will be used in planning future
events by identifying the activities that were most preferred by the participants of particular
demographic groups. Other results from the analysis involved identifying the activities that were
most effective in increasing participant interest in computing.

3
The scope of the study also included measuring the success of the SPIRIT program in
changing the mindset of the participants towards IT using the open-ended responses given by the
participants. The findings may now be used to create a survey analysis process for open-ended
questions that use aspect oriented sentiment analysis to help programs similar to SPIRIT analyze
the responses objectively. Open-ended questions would enable the responder to express himself
or herself more freely and the evaluator to gauge the sentiments of the feedback provider in an
easier and more objective way because open ended responses are always richer in quality and
also result less in leading the respondents to the desired answer (Penwarden, 2013).
1.3 Significance
Through the analysis methodology put forth in this study, the first objective was to prove
the validity of the sentiment analysis methodology by verifying that the analysis done through the
system was consistent with the analysis given by the evaluator for SPIRIT, which was accepted
by the National Science Foundation (Forssen and Moskal, 2011). Thus, for this research the
evaluators’ original analysis for the SPIRIT program and the follow-up analysis given in the
paper ‘Identifying the Impact of the SPIRIT Program in Student Knowledge, Attitudes, and
Perceptions toward Computing Career’ (Forssen and Moskal, 2011) served as our baseline.
The system proposed through this research after validation sought to understand the
impact SPIRIT had on the participating students and extract patterns and trends from the SPIRIT
data to help plan future events better.
1.4 Statement of Problem
There have been numerous resources and reports highlighting the fact that urgent,
nationwide action is needed for the United States to fight declining interest in IT. SPIRIT was one

4
such program that aimed at increasing the interest of the students in IT, especially female
students.
One of the major issues faced while conducting these programs was measuring the
change in attitudes of the participants towards IT after the program and also gauging the
effectiveness of the intervention based on the feedback provided by the participants. This thesis
sought to create a system that would help better analyze the responses to the open-ended
questions by the participants using aspect-oriented sentiment analysis. The system was designed
to identify new information which could help in planning future programs and more easily report
the results of the program.
1.5 Research Question
Is there an objective way to analyze and report the findings of the analysis for the open-
ended responses of the participants of a short-term educational intervention using aspect-oriented
sentiment analysis?
1.6 Assumptions
The assumptions for this study include:
1. Programs that use the results of this research will be similar to SPIRIT if the
programs are short-term educational interventions, target the underrepresented
student populations in middle and high schools especially female students and are
designed to increase awareness and perceptions of the participants towards a specific
subject.
2. The analysis done by Forssen and Moskal, 2011 and the follow-up analysis done by
Harriger, Magana and Lovan, 2012 was considered to be valid and a baseline to train
and test the validity of the results of the new system.

5
3. The responses used as input for the analysis have been pre-processed and corrected of
any incorrect spellings, slangs or short-hands.
4. Some manual correction has been done on the final set of results to remove any
obvious errors in the aspect identification algorithm.
5. Naïve Bayes classifier used in the research has an inherent independent assumption
which states that the occurrence of one word in a sentence does not change the
sentiment value of any other word.
6. The accuracy used by the external evaluator for the survey analysis was 80 percent.
1.7 Limitations
The limitations for this study are:
1. The analysis is valid if and only if the sample distribution is similar to that of SPIRIT
2. Sentiment analysis is not able to understand comments which are comparative or
sarcastic in nature.
3. Because the surveys were not intended to be used with sentiment analysis, the results
of the analysis done on the data recorded through them may not be exact.
4. Pre-processing of the data will be required because sentiment analysis will fail if
there are spelling mistakes or shorthand.
5. Human intervention might be required for grouping of semantically similar aspects in
the summarizer to get the ideal averages for analysis.
6. The lexicons used for training the taggers are for general data and not for educational
reviews specifically.
7. Since both sentiment analysis (classification) and aspect identification (tagging) are
still subject to considerable research, manual intervention at some stages is needed.

6
8. Future application of this work requires the researcher to understand the proposed
system well, including the ability to program in Python and NLTK.

7
CHAPTER 2. REVIEW OF LITERATURE
This study focused on mining information from participant feedback received during the
SPIRIT program in years 2008-2012 in order to measure the impact of the program on the
participants and to help make decisions to improve the program in the future. Consequently, the
research concentrated on analyzing the open-ended responses in the surveys conducted during the
SPIRIT program which may hold considerable new information. This new information, along
with the numerical results of the close-ended questions, helped realize patterns and trends which
may help in the decision making process for future sessions. For the analysis of the open-ended
responses, ‘Aspect-oriented Sentiment Analysis’ was used.
This section will examine the existing literature for SPIRIT, survey methodologies and
sentiment analysis. Section 2.1 gives a background of the SPIRIT program; Section 2.2 explains
the data collection and analysis process of the SPIRIT program and also shows some of its
findings; Section 2.3 investigates the significance and problems faced in the analysis of open-
ended responses in surveys; Section 2.4 will elaborate on the various methods and research done
in the field of Sentiment Analysis. Section 2.5 gives a brief overview of the researched lexicons
and dictionaries used in various research papers. The final section will provide a conclusion of
the literature analyzed.

8
2.1 Background
Surprising Possibilities Imagined and Realized through IT (SPIRIT) was created in 2008
to address the problem of declining student interest, especially of female students, in computer
science and information technology programs in college.
The primary objective of the SPIRIT program was to:
(1) Educate high school teachers and counselors about the various opportunities in IT for
their students, especially women.
(2) To show the many fun and interesting computer applications to high school students in
order to bolster their interest in the field and to give them some hands-on experiences in
dealing with technology to make them more comfortable in selecting computing courses
in their high school.
As an effort to understand and measure the impact of the SPIRIT program on the
participants, various tools were used to collect data before, during and after the program. The
tools involved were pre- and post-attitude surveys and activity feedback taken through various
data collection tools. (Harriger, 2013a).
2.2 SPIRIT Data Collection and Analysis Methodology
The data from the SPIRIT program was analyzed to measure the following:
1. Influence on Course Selection
2. Influence on Course Performance
3. Influence on Career Goals
4. Influence on Plans to attend College
5. Feedback about the SPIRIT program

9
For each of these categories, the data analyzed for the SPIRIT program was presented in
the paper “Identifying the Impact of the SPIRIT Program in Student Knowledge, Attitudes, and
Perceptions toward Computing Career” (Harriger, Magana & Lovan, 2012) and the 2011 report
by Forssen and Moskal (Forssen & Moskal, 2011). A summary of the results is presented below:
1. Influence on Course Selection: 63% of the students responded yes to the
question, “Have you registered for a computing class after SPIRIT”. The open
ended question that followed was “How SPIRIT had influenced their course
selection process?” for which the responses were deemed to be generally positive
in favor of enrolling in computing classes.
2. Influence on Course Performance: This question “Had SPIRIT influenced their
performance in any of the courses?” when asked to the students resulted in a 59%
rate of a yes answer. The response to the open-ended answer that followed was
classified by the evaluator in categories like boosted performance, increased
comfort in a subject, increased interest/thoughtfulness, gained knowledge.
3. Influence on Career Goals: The survey regarding career goals was taken before
and after the SPIRIT workshop. The survey gave the students a list of career
opportunities to select from, and the percentages were compared during the
analysis. As can be seen in table 2.1, a significant increase in interest in
technology/computing occurred after the SPIRIT workshop.

10
Table 2.1 - Career Goals before and after SPIRIT
Subject Area Before SPIRIT After SPIRIT
Medicine/Biological Sciences 36% 8%
Engineering 18% 8%
Technology/Computing 15% 50%
Related 15% 4%
Liberal Arts 10% 12%
Business/Economics 3% 8%
Others 3% 10%
4. Influence on Plans to attend College: For this question, a 4-point Likert scale was
used to gather the responses of the participants. Table 2.2 shows that before
SPIRIT, only 7% of the students planned to attend college, but after SPIRIT this
rose to 44%.
Table 2.2 - Plans to attend college
Likelihood Before SPIRIT After SPIRIT
Very Likely 3% 10%
Likely 4% 34%
Unsure 30% 34%
Unlikely 44% 16%
Very Unlikely 19% 6%
5. About the SPIRIT Program: This category included questions like “What was the
most important thing you learned during the program?”, “How does IT play a
part in daily life?” etc. These were all open questions and were categorized by
the evaluator and later considered while planning future programs.

11
2.3 Open Ended and Close Ended Survey Questions
In cases like the ones mentioned above, open-ended questions can play a very important
role. In the paper titled “IBM Text Analytics for Surveys”, it has been mentioned that, “The
words people use to answer an open ended question tell you a lot about what they think and feel.”
(IBM, 2012) Open-ended questions, thus provide more varied and meaningful information than
close-ended questions and often can provide insights not anticipated by the survey designer
(IBM, 2012).
Use of many open-ended questions in surveys has been deemed ineffective because the
analysis of it is cumbersome, especially if the number of respondents is large. Building an
effective, open-ended survey and analyzing it is also very costly because of the “analytical
overhead incurred with the interpretation of responses” (IBM, 2012).
The 2002 paper by Yamanishi and Li explained that although they are difficult to
analyze, answers to open-ended questions contain a large amount of important and new
information that can provide a basis for decision making (Yamanishi & Li, 2002). They also
point out the importance of systems to mine important information from the open-ended
questions because the analysis done by a human analyst on those responses are mostly based on
intuition (Yamanishi & Li, 2002).
Thus, Sentiment Analysis becomes an important tool in order to gauge the sentiments of
a group of respondents towards a certain subject.
2.4 Sentiment Analysis
Sentiment analysis is the task of identifying positive and negative emotions, opinions and
evaluations (Turney, 2002). There has been considerable research in sentiment analysis

12
conducted over the past few years. In recent times, the advent of social media has resulted in a
rapid increase in sources for text-based, opinionated and textual data. In the paper “Sentiment
analysis of Twitter Data”, the authors give several methods to analyze the sentiments of
microblogs coming from the social network site (Agarwal, Xie, Vovsha, Rambow & Passoneau,
2011).
Research on sentiment analysis has been done as a Natural Language Processing task at
many levels of granularity (Turney, 2002). The next sections describe the existing literature on
different classification methods used in sentiment analysis.
2.4.1 Document Level Classification
Turney in 2002 proposed an unsupervised, three-step algorithm for classifying a review
as recommended or not-recommended. The three 3 steps used in the paper are (i) Using a part-
of-speech (POS) tagger to identify adjectives and adverbs, (ii) estimating a semantic orientation
along with strength of each extracted phrase, and (iii) classifying the given set of reviews as
recommended or not-recommended. This classification can then be used to rate the item being
reviewed as recommended and not-recommended (Turney, 2002).
Pang and Lee in 2004 discuss document-polarity classification in their paper titled, “A
Sentimental Education: Sentiment Analysis Using Subjectivity Summarization Based on
Minimum Cuts”. Their approach involves first labeling the sentences in a document as subjective
or objective. The subjective sentences are then passed through a standard machine-learning
classifier to classify the semantic orientation of the document. (Pang and Lee, 2004)
13
2.4.2 Sentence Level Classification
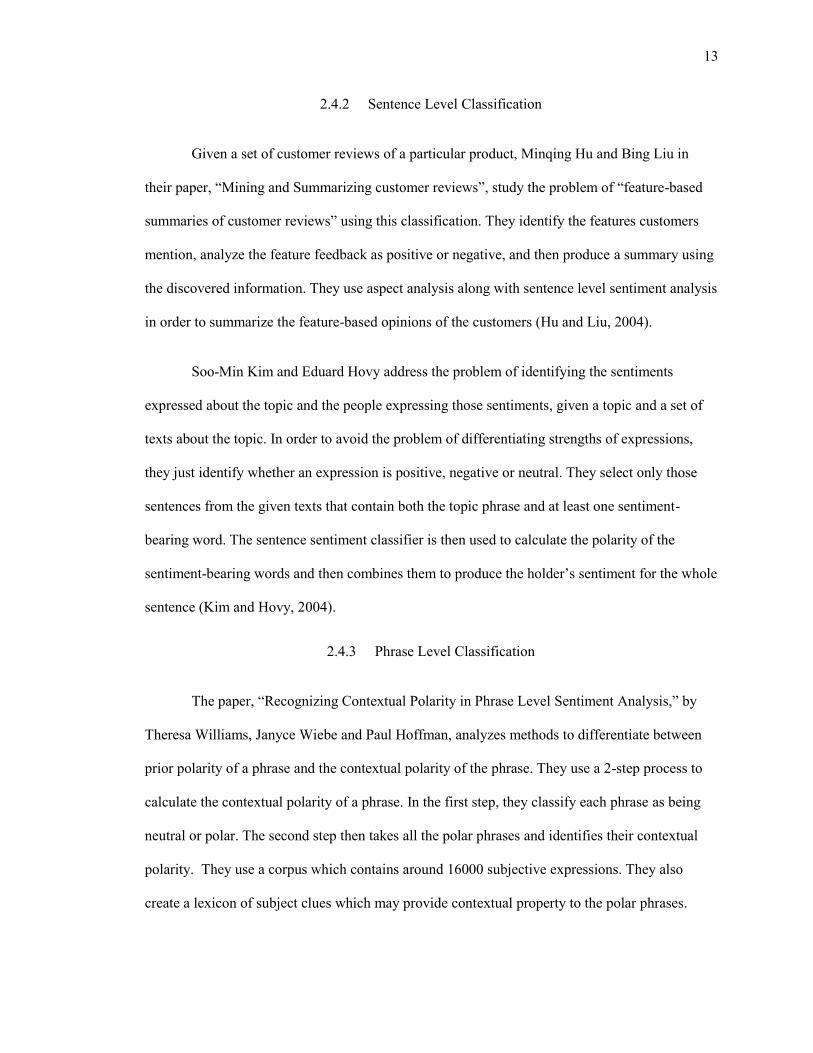
Given a set of customer reviews of a particular product, Minqing Hu and Bing Liu in
their paper, “Mining and Summarizing customer reviews”, study the problem of “feature-based
summaries of customer reviews” using this classification. They identify the features customers
mention, analyze the feature feedback as positive or negative, and then produce a summary using
the discovered information. They use aspect analysis along with sentence level sentiment analysis
in order to summarize the feature-based opinions of the customers (Hu and Liu, 2004).
Soo-Min Kim and Eduard Hovy address the problem of identifying the sentiments
expressed about the topic and the people expressing those sentiments, given a topic and a set of
texts about the topic. In order to avoid the problem of differentiating strengths of expressions,
they just identify whether an expression is positive, negative or neutral. They select only those
sentences from the given texts that contain both the topic phrase and at least one sentiment-
bearing word. The sentence sentiment classifier is then used to calculate the polarity of the
sentiment-bearing words and then combines them to produce the holder’s sentiment for the whole
sentence (Kim and Hovy, 2004).
2.4.3 Phrase Level Classification
The paper, “Recognizing Contextual Polarity in Phrase Level Sentiment Analysis,” by
Theresa Williams, Janyce Wiebe and Paul Hoffman, analyzes methods to differentiate between
prior polarity of a phrase and the contextual polarity of the phrase. They use a 2-step process to
calculate the contextual polarity of a phrase. In the first step, they classify each phrase as being
neutral or polar. The second step then takes all the polar phrases and identifies their contextual
polarity. They use a corpus which contains around 16000 subjective expressions. They also
create a lexicon of subject clues which may provide contextual property to the polar phrases.

14
They classify phrases into positive, negative and neutral based on these subjective phrases and
subjectivity clues (Wilson, Wiebe, Hoffman, 2005).
The paper “Building a Sentiment Summarizer for Local Service Reviews”, describes how
to create a summary of sentences and sentiment strength for a specific set of reviews using a
classifier, a tagger and an aggregator (Goldensohn et. al., 2008). The input values for the
summarizer are the reviews corresponding to a local service. It proposes using a text extractor,
which breaks a review into fragments to be used in the summarizer. For the classification stage,
all extracted sentences and phrases are then fed into a lexicon-based sentiment classifier. For the
aspect extraction, a hybrid of dynamic and static extractors is used. In a static extractor, the
aspects are pre-defined and the extraction classifiers are trained on a set of labeled data. The
dynamic extractor, on the other hand, uses POS-tagged phrases to extract the subject of a phrase
or a sentence (Goldensohn et. al., 2008). The output for the system, according to the paper, will
be a set of sentences labeled with the sentiments and the aspect they represent. These sentences
are then input into a final summarizer in order to get the average sentiment strength for each
aspect and the corresponding textual evidence (Goldensohn et. al., 2008).
All of the sentiment analysis methods described above use some type of lexicons in order
to collect the sentiment and the strengths of the words given in the sentences. In the next section,
some of the commonly used lexicons for sentiment analysis are identified.
2.5 Lexicons for sentiment analysis
There are a number of lexicons available for sentiment analysis. In this section, the paper
describes DAL and SentiWordNet, the two most commonly used lexicons for sentiment analysis.
These lexicons have the capability of changing the scores for the words according to their domain
context. WordNet is another lexical database which contains a list of nouns, verbs, adjectives and

15
adverbs used in the English Language. These words are grouped in sets called synsets which
contain a group of words with similar meanings and thus, WordNet superficially resembles a
thesaurus (Christiane, 2005).
DAL or Dictionary of Affect in Language or DAL is a tool which gives the measure of
the emotion in words or texts. Whissel’s Dictionary of Affect in Language has a word list of
8742. Every word in the dictionary is assigned a rating by people for their activation, evaluation
and imagery. DAL selected words using the ‘Kucera and Francis 1969 Corpus’ which contains
around 1,000,000 words. Words occurring more than 10 times in the corpus were automatically
selected after removing the proper nouns. The synonyms for the words already selected were
removed, and the final list was then evaluated for their ratings. Whissel’s DAL has a 90% hit
rate, which means that 9 out of 10 subjective words in most English texts will be matched by this
dictionary (Whissel, 2007). DAL can be combined with WordNet to get the measure of emotions
of the most common subjective words used in the English language.
SentiWordNet is another lexicon for sentiment analysis which can be used together with
the Natural Language Toolkit (NLTK). In SentiWordNet, each WordNet synonym set (synet) is
associated with three numerical scores which represent the objectivity (Obj), positivity (Pos), and
negativity (Neg) of the set. Along with providing the strength of PN-polarity of words,
SentiWordNet also provides the SO-polarity by having the extra objectivity score (Esuli and
Sebastiani, 2006).
These lexicons can be used in conjunction with libraries such as the Natural Language
Toolkit which are created to perform natural language processing tasks. The next section
describes the paper, “NLTK: The Natural Language Toolkit” by Bird and Loper, which describes
the toolkit and the interfaces it contains (Bird & Loper, 2006).

16
2.6 Natural language toolkit
The Natural Language Toolkit is a collection of programs and data sets which can be
used for symbolic and statistical natural language processing. It is written in the Python
programming language and distributed under the GPL license. The NLTK consists of a large
number of independent modules including some core modules which contain the data types that
can be used throughout the toolkit. There are also a number of task modules which perform
individual natural language processing tasks (Bird & Loper, 2006). Some tasks that can be
performed through the NLTK are:
Text Parsing
Tokenizing
Spell checking
Word Sense Disambiguation
Text Classification
Training Classes
2.7 The Probit Model
In statistics, a probit model is a model used when analysis is done on a variable which
can take only two values, e.g. positive or negative. This model is especially purposeful when a
system is trying to estimate the probability that an observation with particular characteristics will
fall into one of the probabilities. The name is short for “probability unit” (Bliss, C. L., 1934).
Thus, for sentiment classification, a probit transformation is done in order to normalize the data
(Vincent, 2006). The probit function is a quantile function used in statistical and probability
theory and is used for specialized regression modeling of binary response variables (Bliss, C. L.,
1934).

17
2.8 Summary
The literature involving sentiment analysis has covered a wide variety of methods like
sentence-level classification, document-level classification, context based classification, phrase
and feature level classification etc. and their various combinations. Many methods of sentiment
analysis have been used to analyze reviews, news reports, tweets etc. Though, there are still many
limitations with sentiment analysis techniques, much new information can be determined by
analyzing the user generated textual data using sentiment analysis. (Kim and Hovy, 2004).

18
CHAPTER 3. PROCEDURES AND METHODOLOGIES
This chapter discusses the theoretical framework, system overview and emphasizes the
research methodology and design. The first section lists the null and alternate hypotheses for the
research. Section 3.2 gives a brief overview of the system and identifies the different stages used
in the system. Sections 3.3 and 3.4 describes the sample sets and the analysis method used for the
analysis respectively. The chapter ends with the conclusion of the procedures and methodologies.
3.1 Hypothesis
The null and alternate hypotheses for the research utilized data from the SPIRIT 2010 pre
and post attitude tests for the analysis and “aspect-oriented sentiment analysis” as the analysis
methodology. The hypotheses are as follows:
H1o: There is no change in the positive sentiment strength of the responses given by the
students to the question, “Describe, in detail, what information technology means to you?”
because of SPIRIT.
H1a: There is an increase in the positive sentiment strength of the responses given by the
students to the question,” Describe, in detail, what information technology means to you?”
because of SPIRIT.
H2o: SPIRIT has no influence on the positive sentiment strength of the responses given by
the students to the question, “Please describe in detail the characteristics of a person working in
information technology?”

19
H2a: There is an increase in the positive sentiment strength of the responses given by the
students to the question, “Please describe in detail the characteristics of a person working in
information technology?” because of SPIRIT.
H3o: There is no influence of SPIRIT on the positive sentiment strength of the responses
given by the students to the question, “In your opinion, what are the examples of careers in
information technology?”
H3a: There is an increase in the positive sentiment strength of the responses given by
students to the question, “In your opinion, what are the examples of careers in information
technology?” because of SPIRIT.
Pairwise t-tests on the data after a probit transformation was done to analyze the
hypotheses.
3.2 System Overview
The system is based on the model for a sentiment analysis engine provided by
Goldensohn et al. in their 2008 paper titled “Building a sentiment summarizer for local service
reviews” (Goldensohn et al., 2008).
Figure 3.1- Overview of the System (Goldensohn et al., 2008)

20
As per the diagram above, the main stages of the system are:
(1) Text Extractor
(2) Sentiment Classifier
(3) Aspect Extractor
(4) Aggregator and Summarizer
The main aim of the system is to generate aspect-oriented summaries of the open-ended
responses given by a responder based on sentiment analysis. The input to the system consisted of
three inputs:
1. Inputs containing positive texts for training and validation
2. Inputs containing negative texts for training and validation, and
3. A consolidated file contains the responses provided by the SPIRIT
participants, which will be used for testing.
3.2.1 Text Extractor
The positive texts list, the negative texts list and the consolidated input file after “manual
cleaning” of the responses, which involve cleaning up of the text and making them syntactically
readable for the system, were fed to the text extractor in the first stage. The text extractor pre-
processed the text and extracted the individual sentences from the consolidated input. The main
steps performed in the text extractor were:
1. Extracting individual sentences from composite sentences using the sentence tokenizer
present in the natural language toolkit.
2. Removing stop words from the individual sentences. The list of stop words is made by
combining the list of 421 words given in the paper “A stop list for general text” by

21
Cristopher Fox in 1989 (Fox C., 1989) and the list of English stop words provided in the
natural language toolkit corpus.
3. The text extractor then converted this cleaned text into a list of features which were then
fed into the sentiment classifier as input.
3.2.2 Sentiment Classifier
The system for this study used a Naïve Bayes classifier for sentiment classification.
Although there are other classifiers which do not have the far-reaching independence
assumptions, the Naïve Bayes Classifier is still optimal for most practical purposes (Harry Zhang,
2004). The features collected in the text extractor stage were first categorized into training,
validation and test features before being fed to the classifier. The classifier assigned a positive
sentiment strength, which is the probability of the sentence being positive given the features, and
a sentiment label to each set of features. The classifier also imported a list of words which act as
polarity flippers and flip the polarity of the sentiment of a feature set (Alba, 2012).
The analysis of the efficiency of using the classifier and the training set is provided in
Section 4 and the study used the evaluate method provided in the natural language toolkit to get
the data. The evaluate method returns the accuracy, positive precision, positive recall, negative
precision and negative recall for the given training and validation sets. These values were then
used to determine the amount of training data to be used to get the optimal results.
3.2.3 Aspect Identification
This step identified the aspect or the subject of each feature set using a Brill tagger.
The Brill tagger used an initial parts of speech tagger to produce initial part of speech tags which
in this case is the combination of affix, regex, unigram, bigram and trigram taggers. It then
corrected those parts of speech tags based on Brill transformational rules. These rules were

22
learned by training the Brill tagger with the FastBrillTaggerTrainer and rules templates and uses
the normal ‘Noun’ tagger as a back-off (Perkins, 2010). Prior to selecting the most efficient
tagger to be used, an accuracy analysis of a number of taggers was done using the
‘tagger.evaluate’ function on different corpuses. The Brown, Treebank and conll2000 corpuses
provided in the natural language toolkit were used. Among the different taggers available, the
Brill tagger was selected based on the evaluation done in Section 4.
The aspect identification step gave a list of all the nouns present from the test features list
created during the sentiment analysis stage. These ‘nouns’ acted as candidate aspects for the final
summarizer. The aspect identification created a list of tuples which contain all the candidate
aspects along with their sentiment value. This output was then fed to the summarizer to get the
final result.
3.2.4 Aggregator and Summarizer
The aggregator and summarizer basically collect all the data from the above stages and
then present the data in a readable form. The aggregator and summarizer returned the information
needed for the data analysis of the research. It provided the following data:
1) List of aspects ranked on the basis of their sentiment strength.
2) List of aspects ranked on the basis of the strength of each aspect.
3) Final average and variance for all aspects in order to do t-tests on the hypotheses.
Once created, the system was able to analyze each response and present a final summary
based on the analysis. For verification of the system, the evaluators’ original analysis for the
SPIRIT program and the follow-up analysis given in the paper ‘Identifying the Impact of the
SPIRIT Program in Student Knowledge, Attitudes, and Perceptions toward Computing Career’
(Harriger, Magana, Lovan, 2012; Forssen and Moskal, 2011) acted as our baseline.

23
3.3 Sampling
This section will take a look at the sample set and their demographic used for the
analysis. SPIRIT participants include high school students and middle and high school teachers
and counselors. The number of students and their demographic distribution for 2010, 2011 and
2012 is shown in the following tables (Harriger, 2013b):
Table 3.1 - 2008 SPIRIT Demographics (Students)
American Indian Asian White African American Total
Female 0 1 19 3 23
Male 0 1 0 4 5
Total 0 2 19 7 28
Table 3.2 - 2009 SPIRIT Demographics (Students)
Hispanic/ Latino Asian White African American Other Total
Female 2 0 4 11 1 18
Male 0 0 10 1 0 11
Total 2 0 14 12 1 29
Table 3.3 - 2010 SPIRIT Demographics (Students)
Hispanic/ Latino Asian White African American Total
Female 3 4 32 9 48
Male 5 2 14 3 24
Total 8 6 46 0 72

24
3.2 Data Analysis Methodology
This section will explain the process of data analysis used to prove or disprove the
hypotheses mentioned in section 3.1. Before the analysis was done, the model used for sentiment
classification and parts-of-speech tagging were validated. For the classifier evaluation, random
subsampling of the pre-classifier positive and negative texts was used (Calder, 2011). For the
tagger evaluation, the Brill tagger was checked for accuracy on the Brown, Treebank, and
CoNLL2000 corpuses (Perkins, 2010). The data collected from the pre and post attitude surveys
from SPIRIT was used for the analysis. The output from the algorithm contained the aspect the
responder was talking about in each response along with the sentiment strength associated with
that aspect. The sentiment strength values were transformed using a probit function as mentioned
in section 2.7. These values were grouped based on the groupings of the aspects done in the 2010
Evaluators’ report for SPIRIT (Forssen, Moskal, 2010). Pairwise t-tests were done for each of the
aspect groups using the means and variances of the pre and post attitude surveys with an alpha
value of 0.05 or a confidence level of 95% (Trochim, 2006). The flow of the complete data
analysis process is shown in Figure 3.2 below:

25
Figure 3.2 - Flowchart for Data Analysis

26
3.3 Summary
This chapter explained the system and the analysis mechanism that was used for the
analysis as well as the sample set and the baseline results used in the research. The next chapter
will detail the evaluation and analysis of the data returned by the system along with validating the
choice of algorithms used in different stages.

27
CHAPTER 4. ANALYSIS
This chapter describes the validation and test analysis done on the data and gives the final
results of the study. Section 4.1 evaluates the performance of the sentiment classifier, section 4.2
compares the different taggers available and evaluates their performances. After selecting the
classifier and the tagger based on the evaluations done in the previous sections, the final analysis
on the 2010 SPIRIT data is done. The results of the analysis are given in section 4.3.
4.1 Classifier Evaluation
As described in section 3, the study used the Naïve Bayes classifier and the natural
language toolkit for the classification. Data collected from 2008 and 2009 SPIRIT surveys was
used for training and validation purposes. Training and validation data sets consist of the
following 6 files:
1) A positive words list containing 2006 words (Liu et. al, 2005).
2) A negative words list containing 3092 words (Liu et. al, 2005).
3) A positive texts list containing 3995 sentences (Pang and Lee, 2004).
4) A negative texts list containing 3122 sentences (Pang and Lee, 2004).
5) The positive pre-classified 2008 and 2009 SPIRIT data containing 304 responses.
6) The negative pre-classified 2008 and 2009 SPIRIT data containing 347 responses.
The files above were used for training in different approaches in order to identify the
approach that worked the best for classifying reviews for the validation set of SPIRIT data.

28
All positive and negative texts and words were consolidated in one file and the tests were
done by randomly selecting a subset of these files for training in the first approach. The
remaining subset 2008 and 2009 data was used for validation. This approach produced a
considerable amount of bias and was very inconsistent because random selection did not pick an
equal percentages of data from each class of files. Hence, the files were split into six files in order
to reduce the bias and inconsistency of random selection. Another approach that was tried used
only the general text and the general word list files for training and the complete 2008 and 2009
SPIRIT data for validation. This classifier from this approach returned very low accuracy when
validated on 2008 and 2009 SPIRIT data. Hence, for the final approach, data from 2008 and 2009
SPIRIT surveys was included in the training process.
Considering the inferences drawn from using the two approached mentioned above, the
approach to be used for training the classifier was finalized. In this approach, all the words in
files 1 and 2 were selected for training each time and random subsampling on the other four files
was used to construct the training data set. In random subsampling, initially ten percent of each
file was selected for training and the process was repeated after increasing the percentages of
texts selected by an increment of ten percent. Thus, nine models were used for training with the
following percentages of texts in each model:

29
Table 4.1 - Training Model Compositions
Model # Amount of each document
used for Training
Model 1 10%
Model 2 20%
Model 3 30%
Model 4 40%
Model 5 50%
Model 6 60%
Model 7 70%
Model 8 80%
Model 9 90%
The remaining texts in the 2008 and 2009 SPIRIT responses were used for validation
testing. This method of classifier evaluation is called the repeated holdout method. Once the
model was trained, the validation sets were passed through the classifier and the evaluate method
was used to get the following statistical measures.
Accuracy: The fraction of corresponding values that were correctly
classified.
Accuracy =TP + TN
TP + TN + FP + FN
Positive Precision: Of all the predicted positives, the fraction that were
actually positive.
Positive Precision =TP
TP + FP

30
Positive Recall: Of all the actual positives, the fraction that was correctly
classified.
Positive Recall =TP
TP + FN
Negative Precision: Of all the predicted negatives, the fraction that was
actually negative.
Negative Precision =TN
TN + FN
Negative Recall: Of all the actual negatives, the fraction that was
correctly classified.
Negative Recall =TN
TN + FP
TP, TN, FP, and FN are defined in the table 4.2 below:
Table 4.2 - Classifier Evaluation Variables
Predicted Positive Predicted Negative
Actual Positive True Positive (TP) False Negative (FN)
Actual Negative False Positive (FP) True Negative (TN)
The evaluators’ report used an accuracy of 80% when the qualitative text was classified
by two independent evaluators. These reports were used as the baseline for creating the actual
tags for the responses. Thus, for the classifier to be better than manual classification an accuracy
of more than 80% is needed for the classifier. The results obtained by selecting different amounts
of training and validation data are given in tables 4.3, 4.4 and 4.5 below:

31
Table 4.3 - Classifier Accuracy
Training Model Accuracy
Model 1 0.718713
Model 2 0.764075
Model 3 0.819296
Model 4 0.830054
Model 5 0.839056
Model 6 0.842246
Model 7 0.8
Model 8 0.812834
Model 9 0.829787
Table 4.4 - Classifier Positive Precision and Recalls
Training Model Positive Precision Positive Recall
Model 1 0.888889 0.475248
Model 2 0.896104 0.576602
Model 3 0.860294 0.745223
Model 4 0.839844 0.799257
Model 5 0.866995 0.785714
Model 6 0.842246 0.872222
Model 7 0.748428 0.881481
Model 8 0.789474 0.833333
Model 9 0.837209 0.8

32
Table 4.5 - Classifier Negative Precision and Recall
Training Models Negative Precision Negative Precision
Model 1 0.659711 0.944828
Model 2 0.704854 0.937984
Model 3 0.790026 0.887906
Model 4 0.821782 0.858621
Model 5 0.81749 0.88843
Model 6 0.872928 0.814433
Model 7 0.867769 0.724138
Model 8 0.836957 0.793814
Model 9 0.823529 0.857143
The tables above show that the classifier had the best accuracy for model 6. Using model
6 for training gave an accuracy of around 84 percent which was greater than the accuracy in the
evaluators’ report of 2010 data. Although model 6 did lag behind in precision for both negative
and positive data sets, model 6 was selected for hypothesis testing as the main concern here was
the accuracy because the system needs more data to be correctly identified for the comparative
study. The same data is represented in the graph below:

33
Figure 4.1 - Classifier Evaluation
Since, the training data had more positive texts than negative, it may lead to a class
imbalance problem. In the real world there are more positive survey responses for educational
surveys than negative ones (Cacioppo & Berntson, 2004) and thus the model represents the real
world situation. There might also be some overlap of words in training data files which, in turn,
may lead to a bias towards the words that are repeated more in a particular list (positive or
negative). This provides more sensitivity towards those words that occur most frequently in the
list i.e. the more frequently occurring words in a positive list are given a better positive score and
vice-a-versa. Thus, this reflects real world scenarios as well.
Therefore, the model which takes in all of the positive and negative words list, sixty
percent of the positive and negative general text and sixty percent of the pre-classified 2008 and
2009 SPIRIT data was used as the model for training the naïve Bayes classifier.
0
0.2
0.4
0.6
0.8
1
Model 1 Model 2 Model 3 Model 4 Model 5 Model 6 Model 7 Model 8 Model 9
Accuray
posPrecisionposRecallnegPresicionposPrecision

34
4.2 Tagger Evaluation
Tagger evaluation was done based on the approach mentioned in the book, “NLTK: The
natural language toolkit” (Bird & Loper, 2006). There were a number of taggers that were tried
before selecting the Brill tagger for the research. The form of Brill tagger used here is called the
‘BRAUBT tagger’. The performance of the ‘BRAUBT tagger’ was compared with 12 other
tagger combinations, namely:
- Unigram, Bigram and Trigram Taggers (UBT, UTB, BUT, BTU, TUB, and TBU
Taggers)
- UBT tagger was found to be the most accurate when tested on the Brown, Treebank
and coNLL200 corpuses among the taggers mentioned above. Their accuracies are
listed in table 4.7 and hence the UBT tagger was selected to be used along with an affix
tagger in different combinations (AUBT, UABT, UBAT, and UBTA taggers).
- The AUBT tagger from the above was found to be the most accurate when tested using
the same criteria as above and hence this tagger was then combined with the regular
expression tagger as a “back off” tagger and vice-a-versa to get the RAUBT and the
AUBTR taggers.
- The RAUBT tagger was then used as the initial tagger for Brill tagging and the regular
expression tagger was used as the “back off” tagger again. Each of these taggers were
run on the Brown, Treebank and the conll2002 corpus present in the natural language
toolkit and the accuracy was measured by comparing the predicted tags with the actual
tags given in the corpuses. The number of sentences or phrases taken from each corpus
is given in table 11 below:

35
Table 4.6 - Tagger Evaluation Data Composition
DATA USED Train Test
Brown Reviews 1000 1000
Brown Lore 1000 1000
Brown Others 1000 1000
Treebank 1500 1500
ConLL2000 4000 4000
The results of the analysis is shown in table 4.7 below (all data in percentages). The rows
contain the accuracy of the corresponding tagger when applied to the corpus given in the
columns.
Table 4.7 - Tagger Evaluation Data
TAGGER BROWN CONLL TREEBANK
UBT 79.69137 87.15146 80.07813
UTB 79.24449 86.75582 79.8955
BUT 48.9212 50.03367 37.33005
BTU 39.33596 47.09379 31.81818
TUB 23.09814 27.74048 19.15077
TBU 22.64078 27.45007 19.10511
UBTA 79.01931 85.10701 80.39012
UBAT 79.43651 85.92668 80.68182
UABT 81.79311 86.83158 82.33817
AUBT 86.18162 91.11829 87.32498
AUBTR 82.67814 87.27562 83.5836
RAUBT 86.4068 91.79907 87.9515
BRAUBT 87.15393 92.01162 87.95404

36
Thus, here the BRAUBT tagger shows the maximum accuracy for all the corpuses. A
graphical representation is shown below:
Figure 4.2 - Tagger Accuracy Graph
Hence, the BRAUBT tagger was used for the study as it gives the best performance on
each of the different corpuses.
4.3 Data Evaluation
As mentioned in section 3.4, pairwise t-tests were performed at a confidence level of 95
percent as it is the most common confidence level used in social research (Trochim, 2006). The
scatter plots of the data revealed the raw values did not follow a normal distribution (Appendix
A) and although a t-test is robust enough to provide an accurate measure of significance on non-
normal data, it might fail if the data is too far from normal (Snijders, 2011) . Hence the probit
function, which is the quantile function that is associated with the standard normal distribution in
0
10
20
30
40
50
60
70
80
90
100
ubt utb but btu tub tbu ubta ubat uabt aubt aubtr raubt braubt
Accuracy
Tagger
Tagger Accuracy
brown conll treebank

37
probability theory, was used for data transformation so that the data might meet the assumption
of normality required for a t-test. The hypothesis testing for each of the hypotheses is given
below:
4.3.1 Testing for Hypothesis 1
The first hypothesis was based on the question, “Describe, in detail, what
information technology means to you?” The hypothesis is given below:
H1o: There is no change in the positive sentiment strength of the responses given by the
students to the question, “Describe, in detail, what information technology means to you?”
because of SPIRIT.
H1a: There is an increase in the positive sentiment strength of the responses given by the
students to the question,” Describe, in detail, what information technology means to you?”
because of SPIRIT.
Thus, here the sentiment strengths for the given question in the pre-session attitude
survey and the post-session attitude survey were compared.
The data analyzed for this hypothesis followed the probit model. The sentiment strength
was transformed using a probit function and stored in a variable called ‘probit’ for further
analysis. The histogram for the transformed pre and post data respectively are shown below:

38
Figure 4.3 - Probit Transformed Sentiment Strength Histogram (H1-Pre)

39
Figure 4.4 - Probit Transformed Sentiment Strength Histogram (H1-Post)
The histograms show the distribution of the probit transformed positive sentiment
strength. The histograms proved that the data is in normal form and hence with the assumption of
normality, a t-test to check for the significance of the change at a confidence level of 95% (or
alpha value of 0.05) was performed.

40
Table 4.8 - T-Test for Hypothesis 1
Pre-session
Survey
Post-Session
Survey
T-Value Degrees of
Freedom
Number of aspects 364 404 4.7652 766
Mean 0.07227 0.579615
Std. Deviation 1.489957 1.458083
The t-value from the table for the given probability level of 0.05 and the degrees of
freedom value of 766 is 1.64684534. Thus, comparing the calculated t-value from the tabular
one, we can say that there is a significant difference in the sentiment strength for the responses of
the students’ to the question, “Describe, in detail, what information technology means to you?”
Thus, we can reject the null hypothesis and say that attending SPIRIT has made a significant
positive difference to the sentiment strength of the students’ responses to the question about
information technology.
4.3.2 Testing for Hypothesis 2
The second hypothesis was based on the question, “Please describe in detail the
characteristics of a person working in information technology?” The hypothesis is given below:
H2o: SPIRIT has no influence on the positive sentiment strength of the responses given by
the students to the question, “Please describe in detail the characteristics of a person working in
information technology?”
H2a: There is an increase in the positive sentiment strength of the responses given by the
students to the question, “Please describe in detail the characteristics of a person working in
information technology?” because of SPIRIT.

41
As before, here the sentiment strength for the given question in the pre-session attitude
survey and the post-session attitude survey was compared. The sentiment strength was
transformed using a probit function and stored in a variable called ‘probit’ for further analysis.
The histogram for the transformed pre and post data are shown below:
Figure 4.5 - Probit Transformed Sentiment Strength Histogram (H2-Pre)

42
Figure 4.6 - Probit Transformed Sentiment Strength Histogram (H2-Post)
The histograms show that the data is in normal form and hence with the assumption of
normality, a t-test to check for the significance of the change at a confidence level of 95% (or
alpha value of 0.05) can be performed.
Table 4.9 - T-Test for Hypothesis 2
Pre-session
Survey
Post-Session
Survey T-Value
Degrees of
Freedom
Number of aspects 296 338
1.9309 632 Mean 0.346929 0.634613
Std. Deviation 1.80198 1.93044
43
The t-value from the table for the given probability level of 0.05 and the degrees of
freedom value of 632 is 1.6472. Thus, comparing the calculated t-value from the tabular one,
there is a significant difference in the sentiment strength for the responses of the students’ to the
question, “Please describe in detail the characteristics of a person working in information
technology?” Thus, we can reject the null hypothesis and say that attending SPIRIT has made a
significant positive difference to the sentiment strength of the students’ responses to the question
about people working in information technology.
4.3.3 Testing for Hypothesis 3
The third hypothesis was based on the question, “In your opinion, what are the examples
of careers in information technology?” The hypothesis is given below:
H3o: There is no influence of SPIRIT on the positive sentiment strength of the the
responses given by the students to the question, “In your opinion, what are the examples of
careers in information technology?”
H3a: There is an increase in the positive sentiment strength of the responses given by
students to the question, “In your opinion, what are the examples of careers in information
technology?” because of SPIRIT.
Similar probit transformation was done for the sentiment strength values
collected for this question. The histograms for pre-session and post-session probit values are
given below:

44
Figure 4.7 - Probit Transformed Sentiment Strength Histogram (H3-Pre)

45
Figure 4.8 - Probit Transformed Sentiment Strength Histogram (H3-Post)
The histograms show that the data was in normal form and hence with the assumption of
normality, a t-test to check for the significance of the change at a confidence level of 95% (or
alpha value of 0.05) can be performed.
Table 4.10 - T-Test for Hypothesis 3
Pre-session
Survey
Post-Session
Survey T-Value
Degrees of
Freedom
Number of aspects 297 404
12.2561 699 Mean -0.68709 0.850873
Std. Deviation 1.522101 1.72434

46
The t-value from the table for the given probability level of 0.05 and the degrees of
freedom value of 699 is 1.6473. Thus, comparing the calculated t-value from the tabular one, we
can say that there is a significant difference in the sentiment strength for the responses of the
students’ to the question, “In your opinion, what are the examples of careers in information
technology?” Thus, we can reject the null hypothesis and say that attending SPIRIT has made a
significant positive difference to the sentiment strength of the students’ responses to the question
about available careers in information technology.
4.4 Summary
This chapter validated the tagger and the classifier and also analyzed the data received
from the system. Significance tests performed on the final data to check if the difference in
sentiment strength is statistically significant were discussed in section 4.3. The next chapter
offers conclusions and discusses future works that can be undertaken in the study.

47
CHAPTER 5. DISCUSSIONS
This chapter offers some conclusions about the data analyzed in chapter 4.3. It also
discusses the future work that can be done in this study.
5.1 Conclusions
Tables 13, 14 and 15 in chapter 4.3 showed that the data collected can be transformed
into a normal form and offered proof of statistical significance of the data collected. Using that
proof it can be said that SPIRIT had a positive influence on the perceptions and attitudes of the
students towards information technology, people working in information technology and the
different careers available in information technology.
It is also possible, with some induced error, to extrapolate the data to say that programs
similar to SPIRIT i.e. programs that are short-term educational interventions, target the
underrepresented student populations in middle and high schools with a stress on female students
and are designed to increase awareness and perceptions of the participants towards a specific
subject, have a positive impact on the participants’ perceptions and attitudes towards the subject
the program is aimed at. It is worth noting, though, that the conclusions of this study may hold
true for similar programs only if they cater to similar sample distributions to that of SPIRIT and
are short-term educational interventions.
Also, this study provides an objective mechanism of gauging the change in attitudes of
the participants of different short-term educational interventions which can be used to prove the

48
effectiveness of the workshops. The next section here explains the future directions that this
research could go which would make the process of gauging the sentiment strength of the
participants more effective than human evaluation.
5.2 Future Directions
This study provided an alternate approach for assessing open-ended feedback from
participants in a short, educational program designed to raise awareness and increase interest in a
specific discipline. The researcher recommends applying this same approach to future SPIRIT
offerings and other similar programs to further substantiate or invalidate this approach.
One of the biggest limitation of this study was that the surveys used were not made
specifically for sentiment analysis and had a considerable amount of quantitative data besides the
open-ended responses. The same study done on surveys which are made for sentiment analysis
would be very helpful for evaluation of such programs in the future. Also, the Naïve Bayes
classifier has an inherent assumption of non-dependence and hence using a more complex
classifier like the maximum entropy classifier might yield better results.
With respect to aspect tagging, the training and validation for the current tagger was
performed on the lexicons provided in the natural language toolkit. A lexicon which is made
inherently for student reviews on lessons and short term educational programs would yield better
results for the aspect tagging.
5.3 Summary
This chapter discussed the practical significance of the study and the important
conclusions that could be drawn from the research. It also presented some recommendations for
future work on the study.

49
LIST OF REFERENCES

49
LIST OF REFERENCES
Agarwal, A., Biadsy, F., & Mckeown, K. R. (2009, March). Contextual phrase-level polarity
analysis using lexical affect scoring and syntactic n-grams. In Proceedings of the 12th
Conference of the European Chapter of the Association for Computational Linguistics
(pp. 24-32). Association for Computational Linguistics.
Agarwal, A., Xie, B., Vovsha, I., Rambow, O., & Passonneau, R. (2011, June). Sentiment
analysis of twitter data. In Proceedings of the Workshop on Languages in Social Media
(pp. 30-38). Association for Computational Linguistics.
Alba, F. J. (2012, NOVEMBER 01). [Web log message]. Retrieved from
http://fjavieralba.com/basic-sentiment-analysis-with-python.html
Bing Liu, Minqing Hu and Junsheng Cheng. "Opinion Observer: Analyzing and Comparing
Opinions on the Web." Proceedings of the 14th International World Wide Web
conference (WWW-2005), May 10-14, 2005, Chiba, Japan.
Bird, S., Loper E. (2006, July). NLTK: the natural language toolkit. In Proceedings of the
COLING/ACL on Interactive presentation sessions (pp. 69-72). Association for
Computational Linguistics.
Blair-Goldensohn, S., Hannan, K., McDonald, R., Neylon, T., Reis, G. A., & Reynar, J. (2008,
April). Building a sentiment summarizer for local service reviews. In WWW Workshop
on NLP in the Information Explosion Era.
Bliss CI. (1934). "The method of probits". Science 79 (2037): 38–39
Bo Pang and Lillian Lee, A Sentimental Education: Sentiment Analysis Using Subjectivity
Summarization Based on Minimum Cuts, Proceedings of ACL 200

50
Cacioppo, J. T., & Berntson, G. G. (1994). Relationship between attitudes and evaluative space:
A critical review, with emphasis on the separability of positive and negative
substrates. Psychological bulletin, 115(3), 401.
Calders, T. (Faculty) (2011, January 1). Classification: A Naive Bayes Classifier Evaluation.
Eindhoven University of Technology. Lecture conducted from, Eindhove, Netherlands
retrieved from http://wwwis.win.tue.nl/~tcalders/teaching/datamining09/slides/DM09-02-
Classification.pdf
Esuli, A., & Sebastiani, F. (2006, May). Sentiwordnet: A publicly available lexical resource for
opinion mining. In Proceedings of LREC (Vol. 6, pp. 417-422).
Fellbaum, Christiane (2005). WordNet and wordnets. In: Brown, Keith et al. (eds.), Encyclopedia
of Language and Linguistics, Second Edition, Oxford: Elsevier, 665-670
Forssen, A. & Moskal, B. (2011, November). 3 Year SPIRIT Evaluators’ Report.
Fox, C. (1989, September). A stop list for general text. In ACM SIGIR Forum (Vol. 24, No. 1-2,
pp. 19-21). ACM.
Harriger, A. (2013). Embracing the spirit of computing. CITE 2013, New Orleans, LA.
Harriger, A. (2013). Project participants ethnic and gender distribution - SPIRIT.
Harriger, A., Magana, A., & Lovan, R. (2012, October). Identifying the impact of the spirit
program in student knowledge, attitudes, and perceptions toward computing careers.
Presentation by Alejandra Magana Frontiers in education conference, Seattle, WA.
Hu, M., & Liu, B. (2004, August). Mining and summarizing customer reviews. In Proceedings of
the tenth ACM SIGKDD international conference on Knowledge discovery and data
mining (pp. 168-177). ACM.
IBM, C. (2012). IBM text analytics for survey data: Open-ended survey data. Retrieved
http://pic.dhe.ibm.com/infocenter/spsstafs/v4r0m1/index.jsp?topic=/com.ibm.spss.tafs.he
lp/tas_intro_survey.htm

51
Kim, S. M., & Hovy, E. (2004, August). Determining the sentiment of opinions. In Proceedings
of the 20th international conference on Computational Linguistics (p. 1367). Association
for Computational Linguistics.
Pang, B., & Lee, L. (2004, July). A sentimental education: Sentiment analysis using subjectivity
summarization based on minimum cuts. In Proceedings of the 42nd annual meeting on
Association for Computational Linguistics (p. 271). Association for Computational
Linguistics.
Pang, B., & Lee, L. (2008). Opinion mining and sentiment analysis. Foundations and trends in
information retrieval, 2(1-2), 1-135.
Penwarden, R. (2013, May). [Web log message]. Retrieved from
http://fluidsurveys.com/comparing-closed-ended-and-open-ended-questions/
Perkins, J. (2010, April 10). Part of Speech Tagging with NLTK Part 4 – Brill Tagger vs
Classifier Taggers. StreamHacker. Retrieved March 20, 2014, from
http://streamhacker.com/2010/04/12/pos-tag-nltk-brill-classifier/
Snijders, T. A. (Director) (2011, November 13). Statistical Methods: Robustness. Retrieved from,
http://www.stats.ox.ac.uk/~snijders/SM_robustness.pdf
Trochim, W. (2006, October 20). Analysis. Research Methods Knowledge Base. Retrieved March
5, 2014, from http://www.socialresearchmethods.net/kb/analysis.php
Turney, P. D. (2002, July). Thumbs up or thumbs down?: semantic orientation applied to
unsupervised classification of reviews. In Proceedings of the 40th annual meeting on
association for computational linguistics (pp. 417-424). Association for Computational
Linguistics.
Whissel, C. (2007). Whissel's dictionary of affect in language technical manual and user's guide.
Retrieved from ftp://ftp.perceptmx.com/wdalman.pdf
Wilson, T., Wiebe, J., & Hoffmann, P. (2005, October). Recognizing contextual polarity in
phrase-level sentiment analysis. In Proceedings of the conference on Human Language
Technology and Empirical Methods in Natural Language Processing (pp. 347-354).
Association for Computational Linguistics.

52
Yamanishi, K., & Li, H. (2002). Mining open answers in questionnaire data. Microsoft Research,
Retrieved from http://research.microsoft.com/en-us/people/hangli/yamanishi-li-ieee-
is2002.pdf
Zhang, H. (2004). The optimality of naive Bayes. A A, 1(2), 3.

53
APPENDIX

53
APPENDIX
SCATTERPLOTS FOR RAW DATA
A. 1 - Scatterplot for hypothesis 1 raw data (pre)
0
2
4
6
8
10
12
14
0 0.1 0.2 0.3 0.4 0.5 0.6 0.7 0.8 0.9 1
Sentiment Strength vs Count - H1PRE

54
A. 2 - Scatterplot for hypothesis 1 raw data (post)
A. 3 - Scatterplot for hypothesis 2 raw data (post)
0
2
4
6
8
10
12
14
16
18
0 0.1 0.2 0.3 0.4 0.5 0.6 0.7 0.8 0.9 1
Sentiment Strenght vs Count - H1POST
0
2
4
6
8
10
12
14
0 0.1 0.2 0.3 0.4 0.5 0.6 0.7 0.8 0.9 1
Sentiment Strength vs Count - H2PRE

55
A. 4 - Scatterplot for hypothesis 2 raw data (post)
A. 5 - Scatterplot for hypothesis 3 raw data (pre)
0
5
10
15
20
25
0 0.1 0.2 0.3 0.4 0.5 0.6 0.7 0.8 0.9 1
Sentiment Strength vs Count - H2POST
0
2
4
6
8
10
12
0.0 0.1 0.2 0.3 0.4 0.5 0.6 0.7 0.8 0.9 1.0
Sentiment Strength vs Count - H3PRE

56
A. 6 - Scatterplot for hypothesis 3 raw data (post)
0
2
4
6
8
10
12
14
16
18
0 0.1 0.2 0.3 0.4 0.5 0.6 0.7 0.8 0.9 1
Sentiment Strength vs Count - H3POST