analyzing the costs and benefits of distributed solar...
TRANSCRIPT

Analyzing the Costs and Benefits of Distributed Solar Generation in Virginia
A report on the work of the Virginia Distributed Solar Generation and Net Metering Stakeholder Group, as convened and facilitated by the
Virginia Department of Environmental Quality and the Virginia Department of Mines, Minerals and Energy
Damian Pitt and Gilbert Michaud
L. Douglas Wilder School of Government and Public Affairs, Virginia Commonwealth University*
State Agency Facilitators
Carol Wampler, Department of Environmental Quality
Al Christopher, Department of Mines, Minerals and Energy
Ken Jurman, Department of Mines, Minerals and Energy
Note: The findings and conclusions represented in this report are those of the authors – and the members of the Virginia Distributed Solar Generation and Net Metering Stakeholder Group – and do not necessarily represent the beliefs or opinions of the L. Douglas Wilder School of Government and Public Affairs or Virginia Commonwealth University.

Analyzing the Costs and Benefits of Distributed Solar Generation in Virginia p. i
Distributed Solar Generation and Net Metering Stakeholder Group Members
* denotes members of the Steering Committee
Academia
Jonathan Miles, James Madison University
Mike Zimmer, Thompson Hind, Ohio University
Andrea Trimble, University of Virginia
* Damian Pitt, Virginia Commonwealth University (Steering Committee chair)
Gilbert Michaud, Virginia Commonwealth University (Alternate)
John Randolph, Virginia Tech Citizen
* Monique Hanis, citizen representative Industry
Kevin Comer, Antares Group Inc.
J. Patrick Bixler, BaselineSolar
Ken Schaal, Commonwealth Solar, LLC
David Zachow, Direct Connect Solar & Electric
Walter McLeod, Eco Capitol Companies, LLC
Eric Hurlocker, GreeneHurlocker, PLC
* Francis Hodsoll, Maryland-DC -Virginia Solar Energy Industries Association
Kimberly Davis, Maryland-DC-Virginia Solar Energy Industries Association (Alternate)
Jim Pierobon, Pierobon & Partners LLC
Jon Hillis, Prospect Solar
* Tony Smith, SecureFutures, LLC
Matt Ruscio, SecureFutures, LLC (Alternate)
Mike Healy, Skyline Innovations
Matthew Meares, SunWorks
Scott Sklar, The Stella Group, Ltd. and George Washington University Municipal Government
* John Morrill, Arlington County (Steering Committee member)
Jeannine Altavilla, Arlington County (Alternate)
* Steve Walz, Metropolitan Washington Council of Governments
Jeff King, Metropolitan Washington Council of Governments (Alternate)
Aimee Vosper, Northern Virginia Regional Commission

Analyzing the Costs and Benefits of Distributed Solar Generation in Virginia p. ii
Carol Davis, Town of Blacksburg
Joe Gruss, Town of Blacksburg (Alternate)
Larry Land, Virginia Association of Counties
* Cliona Robb, Virginia Energy Purchasing Governmental Association
Susan Hafeli, Virginia Energy Purchasing Governmental Association (Alternate)
Joe Lerch, Virginia Municipal League Non-Governmental Organizations
Kate Rooth, Appalachian Voices
Hannah Wiegard, Appalachian Voices (Alternate)
Jon Proffitt, Charlottesville Local Energy Alliance
Dawone Robinson, Chesapeake Climate Action Network
Dan Conant, Community Power Network
* Rob Marmet, Piedmont Environmental Council
Ivy Main, Sierra Club
Corrina Beall, Sierra Club (Alternate)
* Angela Navarro, Southern Environmental Law Center
Katie Ottenweller, Southern Environmental Law Center (Alternate)
Chelsea Harnish, Virginia Conservation Network
Andrew Smith, Virginia Farm Bureau Electric Utilities
Note: All electric utility representatives formally withdrew from the group on September 4–5, 2014, ending their participation in the study. See page 8 for additional information.
* Ron Jefferson, Appalachian Power Company
Larry Jackson, Appalachian Power Company (Alternate)
* Bill Murray, Dominion Virginia Power
Tim Buckley, Dominion Virginia Power (Alternate)
* Howard Spinner, Northern Virginia Electric Cooperative
Gil Jaramillo, Northern Virginia Electric Cooperative (Alternate)
Susan Rubin, Old Dominion Electric Cooperative
David Hudgins, Old Dominion Electric Cooperative (Alternate)
Tim Martin, Rappahannock Electric Cooperative
Matt Faulconer, Rappahannock Electric Cooperative (Alternate)

Analyzing the Costs and Benefits of Distributed Solar Generation in Virginia p. iii
Table of Contents
List of Tables and Figures ................................................................................................................. v
Glossary of Terms, Acronyms, and Abbreviations .......................................................................... vi
Executive Summary ......................................................................................................................... ix
1. Introduction ................................................................................................................................ 1
1.1. Study Background and Process .................................................................................... 5
1.2. Context for Evaluating Solar Costs and Benefits in Virginia ........................................ 9
1.3. Other Value of Solar Studies ...................................................................................... 13
1.4. Objectives of the Virginia SSG Study .......................................................................... 16
2. Baseline Electricity Model and Estimates of Future DSG Penetration ..................................... 17
2.1. Baseline Model of Electricity Consumption and Peak Demand in Virginia ............... 18
2.2. Current Installed DSG Capacity and Recent Growth Rates ........................................ 20
2.3. Modeled Growth Rate to Meet Statewide Net Metering Cap .................................. 21
2.4. Utility Projections for Solar PV Growth ..................................................................... 22
2.5. U.S. Department of Energy Sunshot Vision Study ..................................................... 24
3. Recommended Methodologies for Evaluating the Value of Solar Energy in Virginia .............. 25
3.1. Narrow Methodology for VOS Evaluation in Virginia ................................................ 25
3.2. Intermediate Methodology for VOS Evaluation in Virginia ....................................... 27
3.3. Broad Methodology for VOS Evaluation in Virginia ................................................... 27
4. Recommended Approaches and Data Sources for Value of Solar Variables ............................ 28
4.1. Avoided Energy .......................................................................................................... 28
4.2. Generation Capacity .................................................................................................. 30
4.3. Transmission .............................................................................................................. 32
4.4. Distribution ................................................................................................................ 33

Analyzing the Costs and Benefits of Distributed Solar Generation in Virginia p. iv
4.5. Grid Support and Ancillary Services ........................................................................... 34
4.6. Fuel Price Volatility .................................................................................................... 35
4.7. Market Price Response .............................................................................................. 36
4.8. Reliability Risk ............................................................................................................ 37
4.9. Carbon Emissions ....................................................................................................... 38
4.10. Other Air Pollutants ................................................................................................. 39
4.11. Water ....................................................................................................................... 41
4.12. Land .......................................................................................................................... 42
4.13. Economic Development ........................................................................................... 43
5. Summary and Conclusions ........................................................................................................ 45
6. Works Cited ............................................................................................................................... 47
Appendix 1. Original Letter Study Request from Clerk of the Senate………………………………………..53
Analyzing the Costs and Benefits of Distributed Solar Generation in Virginia p. v
List of Tables and Figures
Table 1. Summary of Prior VOS Studies ........................................................................................ 14
Table 2. Projected Statewide Installed NEM Capacity at Current Annual Growth ...................... 21
Table 3. Alternative Net-Metered PV Growth Rates to Achieve Net-Metering Cap .................... 22
Table 4. Solar Energy Projections from Appalachian Power (VA & WV) ..................................... 24
Table 5. Summary of Recommended Virginia Value of Solar Methodologies ............................. 26
Figure 1. Rooftop Residential Solar PV System (8.25 KW) in Henrico County… ............................. 5
Figure 2. Rooftop Commercial Solar PV System (56 KW) in Chantilly ............................................ 6
Figure 3. Ground-Mounted Commercial Solar PV System (12 KW) in Goochland County ............. 7
Figure 4. Projected Virginia Electricity Consumption, 2015–2030 ............................................... 19
Figure 5. Projected Virginia Winter and Summer Peak Electricity Demand, 2015–2030 ............ 19
Figure 6. Virginia Installed Net-Metered Solar PV Capacity (MW), 2010–2014 ........................... 20

Analyzing the Costs and Benefits of Distributed Solar Generation in Virginia p. vi
Glossary of Terms, Acronyms, and Abbreviations
AC: Alternating current
APCo: Appalachian Power Company, a subsidiary of American Electric Power
CAA: Clean Air Act
CO2: Carbon dioxide
CP: Coincident peak
CPP: EPA’s Clean Power Plan, proposed rules for Clean Air Act, Section 111(d)
CSP: Concentrating solar power
DC: Direct current
DEQ: Virginia Department of Environmental Quality
DMME: Virginia Department of Mines, Minerals and Energy
DOE: U.S. Department of Energy
Dominion: Dominion Virginia Power
DSG: Distributed solar generation
EIA: Energy Information Association
ELCC: Effective load carrying capacity
EPA: U.S. Environmental Protection Agency
GHG: Greenhouse gas
GSP: Gross state product
HB: House Bill
HEDDs: High Electricity Demand Days
IREC: Interstate Renewable Energy Council
IRP: Integrated Resource Plan
JEDI: Jobs and Economic Development Impact model

Analyzing the Costs and Benefits of Distributed Solar Generation in Virginia p. vii
kV: Kilovolt
kW: Kilowatt
kWh: Kilowatt hour
LMP: Locational marginal price
MLS: Multiple listing service
MW: Megawatt
MWh: Megawatt hour
NEB: Non-energy benefits
NEM: Net-energy-metering
NOx: Nitrogen oxides
NREL: National Renewable Energy Laboratory
NYSERDA: New York State Energy Research and Development Authority
NYMEX: New York Mercantile Exchange
O&M: Operations and maintenance
PJM: PJM Interconnection, LLC
PM10: Large particulate matter
PM2.5: Small particulate matter
PPA: Power purchase agreement
PV: Photovoltaics
REC: Renewable energy credit
RGGI: Regional Greenhouse Gas Initiative
RMI: Rocky Mountain Institute
RPS: Renewable portfolio standard
SB: Senate Bill

Analyzing the Costs and Benefits of Distributed Solar Generation in Virginia p. viii
SCC: Virginia State Corporation Commission
SEIA: Solar Energy Industries Association
SO2: Sulfur dioxide
SR: Senate Resolution
SSG: Solar Stakeholder Group
SSWG: Small Solar Working Group
VOS: Value of Solar

Analyzing the Costs and Benefits of Distributed Solar Generation in Virginia p. ix
Executive Summary
Distributed solar energy has recently become the subject of heated policy debate in Virginia and many other states. Proponents note that it provides a variety of environmental, public health, and economic development benefits for society. They also argue that it can help electric utilities save money on conventional generation fuels, avoid new generation capacity investments, and reduce the strain on existing transmission and distribution infrastructure. However, many electric utilities, including those in Virginia, argue that distributed solar energy creates costs for utilities that will then be passed on to ratepayers. For example, a dramatic increase in distributed solar energy could theoretically reduce utilities’ revenue to the point that they cannot pay off existing investments in generation infrastructure, creating “stranded asset” costs. The utilities also contend that expanded solar deployment may not reduce the need for additional conventional generation capacity, and that it could cause technical problems for the transmission and distribution grids.
This report seeks to provide a better understanding of the costs and benefits of solar energy in Virginia, including its impacts to utilities, ratepayers, and society at large. It does not produce a single figure for the net value of distributed solar generation (DSG). Instead, it discusses the variables that should be included when evaluating the costs and benefits of DSG, and recommends three alternative methods by which subsequent studies could calculate those costs and benefits. It also discusses how the costs and benefits of DSG could be influenced by future market, technology, or policy changes, but it does not offer any policy recommendations. Rather, its purpose is to provide an impartial analysis of the value of solar in order to better inform the policy debate around solar energy issues.
Background and Process
The solar energy debate has inspired a number of studies from all across the country that evaluate the costs and benefits of DSG to utilities, ratepayers, and society as a whole. The authors of these value of solar (VOS) studies have included a variety of state agencies, private consulting firms, non-profit organizations, and academic institutions. Some were prepared for a specific client, such as an electric utility, state agency, or the solar energy industry, while others are aimed at a broader audience.
This report differs from most prior VOS studies in that it is the result of an extensive collaborative research process involving a range of stakeholders with multiple perspectives on the issue. While some other studies have focused primarily on the benefits of solar, and others primarily on the costs, this report attempts to examine both in equal measure. Where possible, it represents a consensus among all participants. On subjects where participating stakeholders could not agree, it seeks to describe all competing perspectives clearly and accurately.
This process began with a “letter study request” from the Clerk of the Virginia Senate, asking the Virginia Department of Environmental Quality (DEQ) and Department of Mines, Minerals and Energy (DMME) to convene a stakeholder group to study the costs and benefits of distributed solar generation and net metering. The agencies formed a 49-member Distributed

Analyzing the Costs and Benefits of Distributed Solar Generation in Virginia p. x
Solar Generation and Net Metering Stakeholder Group (SSG) to conduct the study, including an 11-person steering committee. Both the SSG and steering committee included representatives of multiple relevant interest groups – electric utilities, the solar industry, local governments, environmental advocacy groups, and academic institutions – plus one citizen member.
The SSG and steering committee met five times each from April—September, 2014. The stakeholders discussed the costs and benefits of solar energy in Virginia, recommended data sources, identified points of consensus and debate, and provided feedback on prior drafts of this report. Representatives from each of the interest groups were present for the first eight meetings and provided input throughout the process until early September. All utility representatives formally withdrew from the SSG on September 4–5, just prior to the final steering committee meeting. The representative from the Virginia Farm Bureau also subsequently withdrew. However, their withdrawal had little substantive impact on the final work product, as this report incorporates all input received from all SSG members up until that time, and no further input was accepted from any SSG members after the utilities withdrew. More detail on the process by which this report was developed is available in Section 1.1.
Existing Data on Distributed Solar Energy in Virginia
According to State Corporation Commission (SCC) data, Virginia had 11.55 megawatts (MW)1 of net-metered DSG capacity as of the end of June 2014. The generation from those customer-owned net-metered solar panels accounts for an estimated 0.01% of total statewide electricity demand. Additionally, Dominion Virginia Power (hereafter referred to as “Dominion”) has recently installed several large solar photovoltaic (PV) systems as part of its Solar Partnership Program, which is expected to add about 13 MW utility-owned DSG over the next couple of years. By comparison, Maryland currently has 186 MW of installed PV capacity, and North Carolina has 592 MW.
Existing estimates of solar energy potential in Virginia vary greatly. The 2007 and 2010 versions of the Virginia Energy Plan both estimated this potential to be between 11,000–13,000 MW of installed capacity. A 2012 report by the National Renewable Energy Laboratory (NREL) estimated that Virginia could develop as much as 1.9 million gigawatt hours of solar, which is roughly 17 times the total annual electricity consumption in the state. However, solar energy industry representatives on the SSG estimate that, based on current growth trends, installed net-metered solar would only reach a little over 30 MW by the year 2020 and approximately 60 MW by 2030 (see sections 2.2 and 2.5 for additional details and citations).
Appalachian Power Company’s (APCo) Integrated Resource Plan (IRP) for 2014 assumes just under 10 MW of distributed solar power by the year 2028, along with 180 MW of new utility-scale solar energy capacity. Dominion’s 2014 IRP does not include explicit estimates for future
1 The installed capacity of a solar or other electricity generating system represents the total electrical power that it
can generate in a given moment at peak performance. Power is measured in watts, kilowatts (1,000 watts) or megawatts (one million watts). The energy that a system generates is a function of its power production over time (Power x Time = Energy), and is measured in watt-hours, kilowatt-hours (kWh), or megawatt-hours (MWh).

Analyzing the Costs and Benefits of Distributed Solar Generation in Virginia p. xi
net-metered DSG, but provides various scenarios for future utility-owned and other non-specified solar capacity (see section 2.4). Both the solar industry and utility estimates are far below the cap currently set by state law, which limits net-metered solar capacity to 1% of peak demand within each utility service area. This report estimates the statewide cap to be around 244 MW in 2015 and projects it to increase to 278 MW by the year 2030.
The SCC prepared reports on the impacts of net-metered solar energy to utilities in 2011 and 2012 (see detailed discussion in Section 1.2). The 2011 report found that, at existing levels, net-metered DSG costs utilities just over $.03/kWh of solar energy produced. However, it concluded that these costs pose an immaterial bill impact for other utility customers. The study also considered the possibility of net-metered DSG reaching the aforementioned statewide cap, which would require a roughly 50-fold increase over 2011 levels. In this scenario, costs for residential customers would rise by a small but notable amount of just under 0.5%, which would increase the average residential electric bill by $6.73 per year. The 2012 report analyzed three individual net-metered solar installations and estimated the net costs to utilities to be around $.05–$.08/kWh for small residential systems and $.02/kWh for large residential systems. However, it did not calculate the impact of these system costs on other ratepayers.
Variables in the Value of Solar Analysis
Most existing VOS reports examine a similar array of variables that impact the costs and benefits of solar energy. The SSG drew from those existing studies but created its own modified approach to cover all relevant costs and benefits to utilities, ratepayers, and the general population in Virginia. The cost and benefit variables covered in this study can be divided into three general categories: 1) Energy, Capacity, and Grid Support Services, 2) Financial Risk and Reliability Risk, and 3) Environmental and Economic Development.
Energy, Capacity, and Grid Support Services
This category includes five variables directly related to utility and grid operations. It begins with avoided energy (Section 4.1), which refers simply to the fuel costs that utilities save when DSG replaces electricity generation at existing power plants. This is the most straight-forward of all VOS variables and represents the greatest financial benefit to utilities, at least in the short term.
Generation capacity (Section 4.2) is one of the more controversial variables. Solar energy proponents argue that DSG can help utilities avoid the cost of future power plants that would otherwise need to be built to meet rising electricity demand. Utilities contend that due to the intermittent nature of solar energy, DSG cannot displace future generation capacity costs even at high levels. Furthermore, they express concern that lost revenue from DSG production could lead to stranded asset costs for existing generation capacity. However, it seems that the most significant potential benefits and costs associated with this variable would only be possible at DSG market penetration levels far higher than those currently found in Virginia.
The transmission (Section 4.3) and distribution (Section 4.4) variables are highly technical. Utilities could potentially save money if locally produced DSG reduces the need for future
Analyzing the Costs and Benefits of Distributed Solar Generation in Virginia p. xii
investments in transmission infrastructure. However, these savings are only possible if market penetration increases far beyond current levels. Costs and benefits related to electricity distribution are more realistic in the short-term. The distribution impact depends largely on where DSG systems are located with respect to existing power loads. Finally, grid support and ancillary services (Section 4.5) refers to a number of ways in which DSG could theoretically help to improve grid operations. However, these benefits would be relatively minor in the big picture and again would only be possible in very high DSG penetration scenarios.
Improved energy storage technologies could dramatically improve the value of solar with respect to grid operations. The ability to store electricity from DSG, and release it to the grid when needed, would be particularly valuable for the generation capacity variable.
Also, individual utilities could experience financial benefits if DSG increases within their service area to the point that it reduces their share of peak demand within the PJM Interconnection region. This is because utilities pay PJM for generation capacity, transmission, distribution, and grid support services, at a rate that is proportional to their share of the PJM peak demand. These cost savings could be realized by individual utilities even if there are no long-term system-wide benefits related to these variables.
Financial Risk and Reliability Risk
The first two variables in this category describe how DSG could theoretically reduce the volatility (section 4.6) and overall market (section 4.7) of natural gas prices. The SSG agrees that such benefits are unlikely, even in high DSG penetration scenarios, due to the number of other factors affecting the natural gas market. The third variable describes how DSG could help improve grid reliability (Section 4.8), but any potential benefit would only be possible at high rates of DSG market penetration and/or with improved electricity storage technology.
Environmental and Economic Development
This category includes five variables representing the additional societal costs and benefits of DSG, beyond those directly related to utility operations. It also captures the direct benefits of DSG in helping utilities comply with state and federal environmental regulations related to air pollution, water pollution, and potentially, carbon dioxide (CO2) emissions.
Solar energy provides several types of environmental and public health benefits for society at large. The most obvious of these come from avoiding the direct air pollution (section 4.10) and CO2 (section 4.9) impacts of fossil fuels that would have otherwise been consumed. Solar energy also provides ongoing indirect environmental benefits related to fuel extraction (i.e., reducing environmental damages from coal mining, natural gas drilling, etc.) and the byproducts of conventional generation (e.g., fly ash). These benefits are discussed in the sections on water (4.11) and land (4.12) impacts. Extending the analysis further, one could consider the one-time environmental benefits that would occur if DSG helps avoid the need to construct new conventional power plants. However, in this case one must also consider the one-time impacts of manufacturing, transporting, and installing the solar panels themselves.
Analyzing the Costs and Benefits of Distributed Solar Generation in Virginia p. xiii
Currently a number of provisions in the Code of Virginia call for the evaluation of environmental impacts in the formulation and implementation of state energy policy. However, the Virginia General Assembly has also declined on several occasions to further incorporate environmental and public health impacts into the state’s energy regulations (see discussion of existing law and recent bills on pages 2–3). For this reason, several utility representatives on the SSG argued that environmental and public health benefits should not be calculated in the VOS. However, the utility representatives did participate in SSG discussions of ways that those benefits could be addressed if included in the VOS analysis.
The SSG agreed that utilities’ costs for complying with existing environmental regulations are already incorporated into the market price of energy. Therefore, the benefit that DSG provides for meeting those existing regulations is addressed via the avoided energy cost variable. In the longer term, however, DSG could help utilities meet more stringent future environmental regulations. This would benefit utilities by avoiding costs not currently anticipated on their balance sheets. Additional societal benefits, including those related to public health, can be estimated using existing approaches developed by the U.S. Environmental Protection Agency (EPA) and other sources.
The economic development impact of DSG is one of the more controversial and difficult VOS variables to quantify. Most prior VOS reports find that DSG can create local job opportunities for solar installers, leading to other spin-off economic activity. Additional job creation could emerge in the technical innovation, research, and manufacturing of solar modules and related support equipment in the electrical industry. However, these benefits would be compromised and perhaps even negated if the growth of DSG led to job losses in conventional electricity generation. On this note, the SSG assumes that new solar energy jobs would not displace jobs at traditional plants unless DSG reaches a very high level of market penetration.
Solar energy proponents suggest that DSG could have additional indirect economic development benefits, by attracting businesses to the state based on improved environmental conditions, observed sustainability efforts, and an enhanced quality of life. A strong clean energy economy could also help corporations, the military, and other institutions meet their own sustainability, cost management and energy reliability goals. However, if increased DSG leads to overall electricity rate increases, negative economic spin-off effects could result.
Methodologies for Calculating the Value of Solar in Virginia
The SSG developed three different approaches that future VOS studies in Virginia may adopt. Each approach would examine some combination of the 13 VOS variables described above, which together represent all of the known or potential costs and benefits of DSG to utilities, ratepayers, and society. All three approaches would analyze the levelized costs and benefits over a 30-year period, reflecting the anticipated lifespan of a solar energy generation facility. These methodologies are described in detail in Sections 3.1–3.3.
The narrow approach focuses on the short-term, direct impacts of DSG. It addresses the seven core VOS variables for which those impacts can be measured: avoided energy; generation
Analyzing the Costs and Benefits of Distributed Solar Generation in Virginia p. xiv
capacity; transmission; distribution; carbon emissions; other air pollutants; and water. The intermediate approach also focuses on direct impacts only, but examines them over both the short-term and long-term. It includes the same variables as the narrow approach plus economic development, fuel price volatility, and reliability risk. The broad approach addresses both direct and indirect impacts over both short and long terms. It includes the same variables as the intermediate approach, plus three others for which costs and benefits would likely only occur at high penetration levels (market price response, land impacts, and ancillary services).
The SSG believes that all VOS studies should be based on clear, justifiable assumptions about the level of DSG penetration anticipated within the study period. This is important because certain variables have measurable costs and benefits even at low penetration levels, while others are only likely to have cost/benefit impacts under a high-penetration scenario. However, the assumed level of penetration does not necessarily correlate with a given methodology (i.e., the narrow methodology does not necessarily assume low levels of DSG penetration, nor does the broad methodology necessarily assume high penetration).
Observations and Conclusions
The SSG recognizes that the short- and long-term value of solar will be dependent on a wide range of conditions and perspectives. For example, one of the most important variables in the value of DSG is the amount of solar energy capacity itself. At lower penetration levels, up to at least the 1% cap from the state’s net-metering law, DSG has little to no impact on overall utility operations. At higher penetration levels, DSG could have more fundamental impacts, particularly with respect to generation capacity, transmission, and distribution.
The costs and benefits of a given DSG system, particularly its impacts on the distribution grid, are greatly influenced by its location. Market conditions will also have a major influence, as reaching such high penetration levels would likely require continued reductions in the cost of DSG relative to conventional electricity prices. Future technological improvements, particularly in electricity storage, demand management, and micro-grid technology, could also affect the VOS. Time is also an important factor to consider, as even at extremely high growth rates DSG is not likely to create fundamental impacts on utility operations until many years in the future.
Changing political or regulatory conditions could also greatly affect VOS calculations, particularly the EPA’s proposed CO2 emission limits for new and existing power plants. At the state level, the adoption policies to require or promote DSG – as has been done in Maryland, North Carolina, and elsewhere – could increase DSG deployment to the point that the longer-term costs and benefits (generation capacity, etc.) must be considered.
With greater time, resources, and data access, future studies could produce actual values for the net VOS under each methodology. This would provide greater clarity for policymakers and stakeholders who wish to understand the costs and benefits of solar energy. Other, more targeted studies could also be beneficial. Of particular benefit would be technical studies of key VOS variables where DSG poses potential costs and benefits that are poorly understood, such as generation capacity, distribution infrastructure, and economic development.

Analyzing the Costs and Benefits of Distributed Solar Generation in Virginia p. 1
1. Introduction
In recent years, solar energy has become a topic of heated policy debate in the United States (U.S.), particularly at the state level. The vast majority of states, including Virginia, have adopted some form of net metering legislation allowing the owners of distributed solar photovoltaic (PV) electricity systems to sell excess electricity generated by their systems back to their local electric utilities, typically at the retail electric rate. Under this arrangement, system owners pay only for the “net” amount of electricity they consume each month, and can “bank” excess generation for times when their system does not produce excess power. Other states have adopted various additional policies to require or promote expanded deployment of solar energy systems, such as i) tax incentives for system purchasers, ii) grants, iii) mandatory renewable portfolio standards (RPS) requiring utilities to meet a percentage of their electricity load from renewable energy (sometimes with a “carve-out” requiring a small portion from solar specifically), or iv) feed-in tariffs requiring utilities to purchase solar energy from producers at an above-market rate.2 Additionally, new business models such as solar leases, power purchase agreements, and “community” or “shared” solar arrangements have expanded opportunities for the deployment of distributed solar PV systems in many states.
Solar energy supporters argue that policies such as these are necessary to help level the playing field between solar PV and conventional forms of electricity generation. They point to the environmental, public health, and economic development benefits that solar energy provides, as it reduces air pollution from conventional power plants and creates job opportunities within the solar energy industry. They also argue that it provides value for utilities by reducing the need for conventional generation fuels, avoiding the costs of new generation capacity, and reducing the strain on existing transmission and distribution infrastructure.
More recently, however, some electric utilities and other interests have raised concerns that net metered solar energy systems place a financial burden on other utility customers, as both owners and non-owners require the same amount of generation, transmission, and distribution infrastructure to meet their needs (i.e., at night and at other times when solar PV systems do not operate at maximum efficiency), but PV system owners contribute less to support that infrastructure over the course of a year. The lost revenue that solar PV would create for utilities leads to concerns that they will not be able to pay for existing generation infrastructure, creating “stranded asset” costs that they will then pass on to consumers. This argument has recently led several states to consider policies requiring owners of net-metered systems to pay monthly “stand-by charges” to help utilities pay for that infrastructure. Utilities also argue that expanded solar deployment may not reduce the need for additional conventional generation capacity, and that it could cause technical problems for the transmission and distribution grids.
The Virginia State Corporation Commission (SCC) prepared reports on the impacts of distributed solar energy to utilities in 2011 and 2012. These reports are discussed at length in Section 1.2 below. As summarized in the SCC’s 2012 “Implementation of the Virginia Electric Utility Regulation Act” report, the 2011 net-metering study found that at existing levels of 2 Database of State Incentives for Renewables and Efficiency (DSIRE), 2014. http://www.dsireusa.org/.

Analyzing the Costs and Benefits of Distributed Solar Generation in Virginia p. 2
market penetration, “customer generators impose a very small net cost on Virginia's utilities in total, and such cost results in an ‘immaterial’ average annual bill impact on non-net metering customers.”3 The study also found that under a “fully subscribed program,” (i.e., if installed net-metering capacity reached 1% of peak demand within each utility’s service area, about 50 times the total net-metered capacity in 2011), “the average annual residential electric bill would increase by a relatively small (less than one-half of one percent) but notable amount.”4
In 2011, the Virginia General Assembly adopted House Bill (HB) 1983, which enabled utilities to pursue stand-by charges while raising the cap on individual residential net metered PV systems from 10 kilowatts (kW) to 20 kW. Later that year, the SCC approved a request by Dominion Virginia Power (hereafter referred to as “Dominion”) for a $4.19/kW monthly stand-by charge for owners of net-metered systems larger than 10 kW.5 Appalachian Power Company (APCo), the state’s second-largest electric utility behind Dominion, is currently seeking SCC approval for a similar stand-by charge.6
In subsequent years, solar energy advocates have sought to repeal the stand-by charge legislation.7 First, they argue that Virginia’s residential rate structure is flawed in that it incorporates fixed distribution services into the per kilowatt-hour (kWh) rate, thus causing all customers to pay for distribution in an amount proportional to their electricity consumption. Hence, it is unfair to single out the owners of solar energy systems when, in fact, any customer who consumes electricity at a below-average rate places the same distribution burden on utilities. Second, they argue that the stand-by charges create a substantial financial obstacle for individual customers with large residential PV systems, but do not raise sufficient revenue for utilities to justify the expense of administering the program. Finally, they argue that stand-by charges do not account for the benefits that distributed solar energy systems provide for utilities.8 More generally, solar energy advocates also argue that state policies should reflect the broader environmental and societal benefits that solar energy provides.9
Currently a number of provisions in the Code of Virginia call for the evaluation of environmental and fuel diversity risk in the formulation and implementation of state energy policy. For example, the Code defines an integrated resource plan (IRP) as "a document developed by an electric utility that provides a forecast of its load obligations and a plan to meet those obligations by supply side and demand side resources over the ensuing 15 years to promote 3 State Corporation Commission, 2012. Status report: Implementation of the Virginia Electric Utility Regulation
Act. http://www.scc.virginia.gov/comm/reports/2012_veur.pdf. 4 Ibid. 5 Shapiro, The Virginian-Pilot, November 24, 2011, “Dominion to charge fee to heavy users of solar power.”
http://hamptonroads.com/2011/11/dominion-charge-fee-heavy-users-solar-power.
6 State Corporation Commission, 2014. Case Summary for Case Number: PUE-2014-00026. 7 See: SB 1025, 2013; and SB 582, 2012. 8 Stanton, 2012. Electric utility standby rates: Updates for today and tomorrow.
www.michigan.gov/documents/energy/NRRI_Electric_Standby_Rates_419831_7.pdf. 9 REN 21, 2014. Renewables 2014: Global status report.
www.ren21.net/Portals/0/documents/Resources/GSR/2014/GSR2014_full%20report_low%20res.pdf.
Analyzing the Costs and Benefits of Distributed Solar Generation in Virginia p. 3
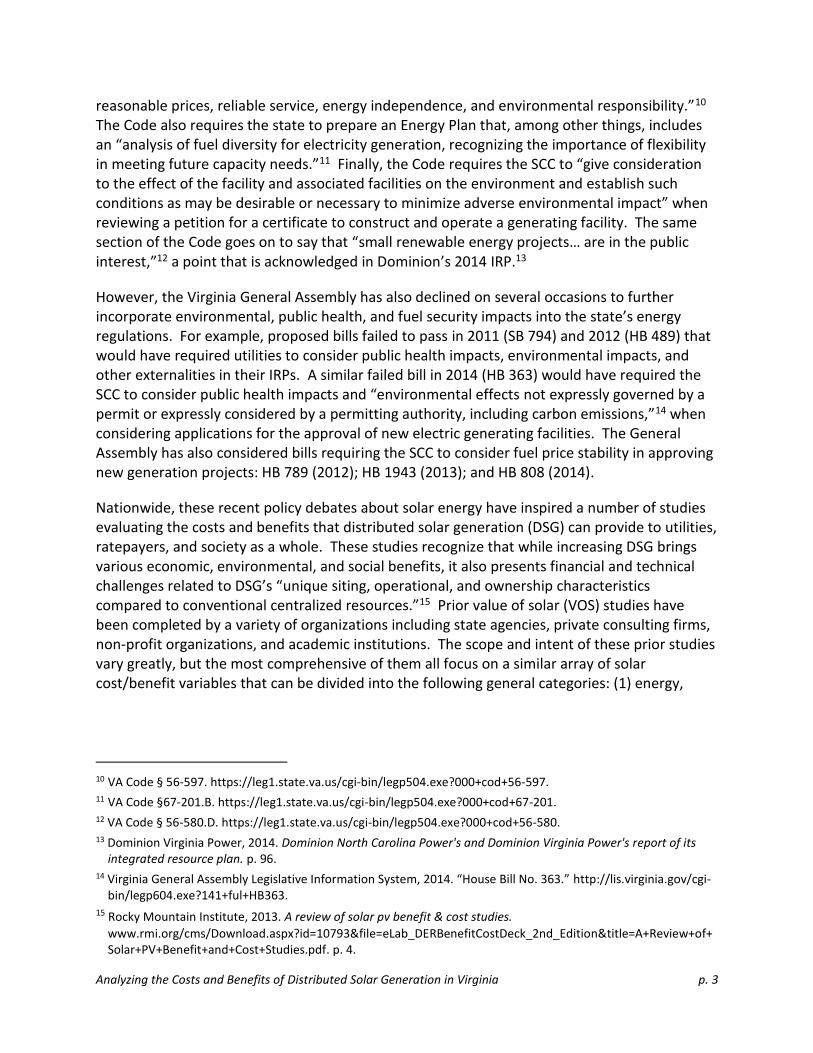
reasonable prices, reliable service, energy independence, and environmental responsibility.”10 The Code also requires the state to prepare an Energy Plan that, among other things, includes an “analysis of fuel diversity for electricity generation, recognizing the importance of flexibility in meeting future capacity needs.”11 Finally, the Code requires the SCC to “give consideration to the effect of the facility and associated facilities on the environment and establish such conditions as may be desirable or necessary to minimize adverse environmental impact” when reviewing a petition for a certificate to construct and operate a generating facility. The same section of the Code goes on to say that “small renewable energy projects… are in the public interest,”12 a point that is acknowledged in Dominion’s 2014 IRP.13
However, the Virginia General Assembly has also declined on several occasions to further incorporate environmental, public health, and fuel security impacts into the state’s energy regulations. For example, proposed bills failed to pass in 2011 (SB 794) and 2012 (HB 489) that would have required utilities to consider public health impacts, environmental impacts, and other externalities in their IRPs. A similar failed bill in 2014 (HB 363) would have required the SCC to consider public health impacts and “environmental effects not expressly governed by a permit or expressly considered by a permitting authority, including carbon emissions,”14 when considering applications for the approval of new electric generating facilities. The General Assembly has also considered bills requiring the SCC to consider fuel price stability in approving new generation projects: HB 789 (2012); HB 1943 (2013); and HB 808 (2014).
Nationwide, these recent policy debates about solar energy have inspired a number of studies evaluating the costs and benefits that distributed solar generation (DSG) can provide to utilities, ratepayers, and society as a whole. These studies recognize that while increasing DSG brings various economic, environmental, and social benefits, it also presents financial and technical challenges related to DSG’s “unique siting, operational, and ownership characteristics compared to conventional centralized resources.”15 Prior value of solar (VOS) studies have been completed by a variety of organizations including state agencies, private consulting firms, non-profit organizations, and academic institutions. The scope and intent of these prior studies vary greatly, but the most comprehensive of them all focus on a similar array of solar cost/benefit variables that can be divided into the following general categories: (1) energy,
10 VA Code § 56-597. https://leg1.state.va.us/cgi-bin/legp504.exe?000+cod+56-597. 11 VA Code §67-201.B. https://leg1.state.va.us/cgi-bin/legp504.exe?000+cod+67-201. 12 VA Code § 56-580.D. https://leg1.state.va.us/cgi-bin/legp504.exe?000+cod+56-580. 13 Dominion Virginia Power, 2014. Dominion North Carolina Power's and Dominion Virginia Power's report of its
integrated resource plan. p. 96. 14 Virginia General Assembly Legislative Information System, 2014. “House Bill No. 363.” http://lis.virginia.gov/cgi-
bin/legp604.exe?141+ful+HB363. 15 Rocky Mountain Institute, 2013. A review of solar pv benefit & cost studies.
www.rmi.org/cms/Download.aspx?id=10793&file=eLab_DERBenefitCostDeck_2nd_Edition&title=A+Review+of+Solar+PV+Benefit+and+Cost+Studies.pdf. p. 4.

Analyzing the Costs and Benefits of Distributed Solar Generation in Virginia p. 4
capacity, and grid support impacts; (2) financial risk and reliability risk impacts; and (3) environmental and economic impacts.16
This study seeks to identify a consensus among affected stakeholders on the appropriate methodologies for evaluating the net costs and benefits of distributed solar energy in Virginia. It does not examine the costs and benefits experienced by the individual owners of distributed solar energy system, but rather the bigger-picture impacts to ratepayers and society.
For the purposes of this study, distributed solar is defined as any grid-integrated system that meets each of the following criteria:
The system is connected to the distribution grid, not directly to the transmission grid.
The system output is no greater than 69 kilovolts (kV).
The installed capacity does not exceed the limits established in the state’s net-metering legislation (i.e., up to 20 kW for a system on a residential building or 500 kW for a system on a commercial building). The only exception here would be larger systems participating in Dominion’s Solar Partnership Program (which has a maximum size of 1 MW), or any similar program to be adopted by other utilities.
Any PV system set up behind the retail meter (i.e., between the customer and the distribution system) would meet the definition of distributed generation and should be evaluated as a demand-side resource. A PV system connected behind the wholesale meter (i.e., between the distribution and transmission systems) may also be considered distributed if it otherwise meets the criteria above, but should be evaluated as a supply-side resource. Both rooftop and ground-mounted solar PV systems can meet these criteria (see examples in Figures 1, 2 and 3). However, off-grid solar PV systems are not part of this study, as many of the benefits and costs associated with DSG are related to the systems’ impacts on the grid.
It is important to note that this study does not produce a single figure for the net value of solar energy in the state. Instead, it examines the various costs and benefits associated with solar energy and recommends three methods (narrow, intermediate, and broad) for calculating the net value of DSG. Also, it is important to note that while the Solar Stakeholder Group (SSG) did consider the current policy context in conducting its research, no policy recommendations are included in this study.
16 Beach & McGuire, Crossborder Energy, for Arizona Public Service, 2013. The benefits and costs of solar
distributed generation for Arizona Public Service. www.seia.org/sites/default/files/resources/AZ-Distributed-Generation.pdf.
Analyzing the Costs and Benefits of Distributed Solar Generation in Virginia p. 5
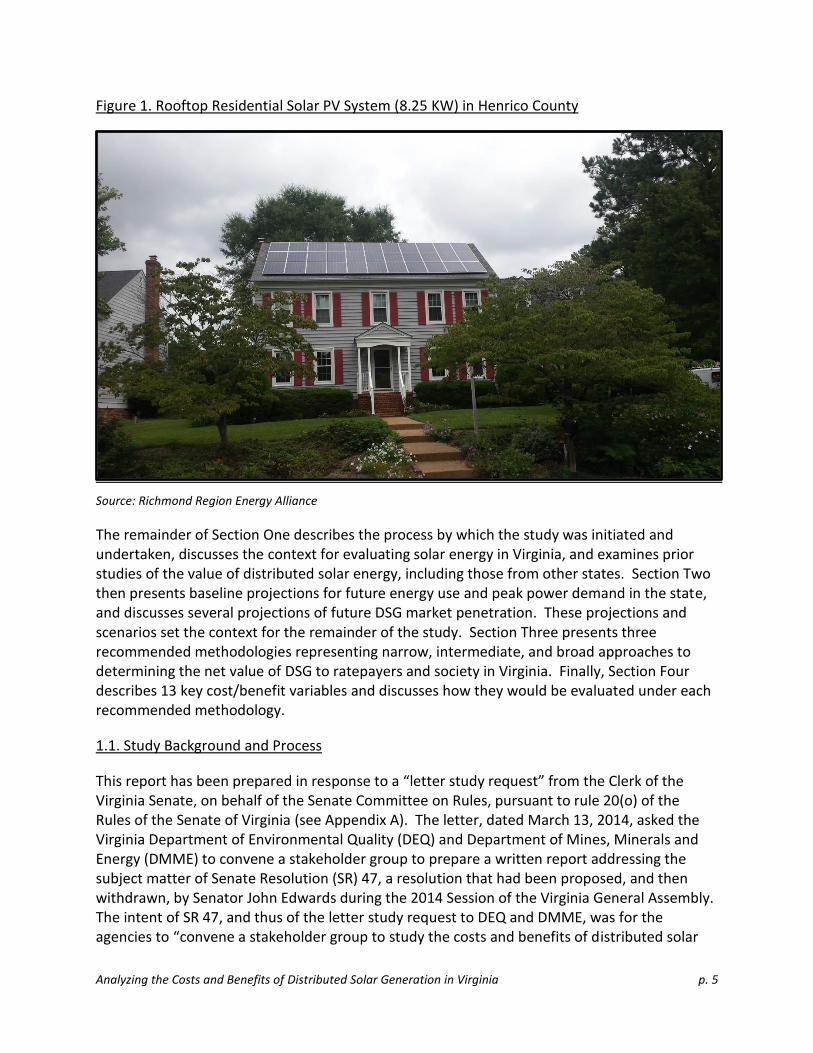
Figure 1. Rooftop Residential Solar PV System (8.25 KW) in Henrico County
Source: Richmond Region Energy Alliance
The remainder of Section One describes the process by which the study was initiated and undertaken, discusses the context for evaluating solar energy in Virginia, and examines prior studies of the value of distributed solar energy, including those from other states. Section Two then presents baseline projections for future energy use and peak power demand in the state, and discusses several projections of future DSG market penetration. These projections and scenarios set the context for the remainder of the study. Section Three presents three recommended methodologies representing narrow, intermediate, and broad approaches to determining the net value of DSG to ratepayers and society in Virginia. Finally, Section Four describes 13 key cost/benefit variables and discusses how they would be evaluated under each recommended methodology.
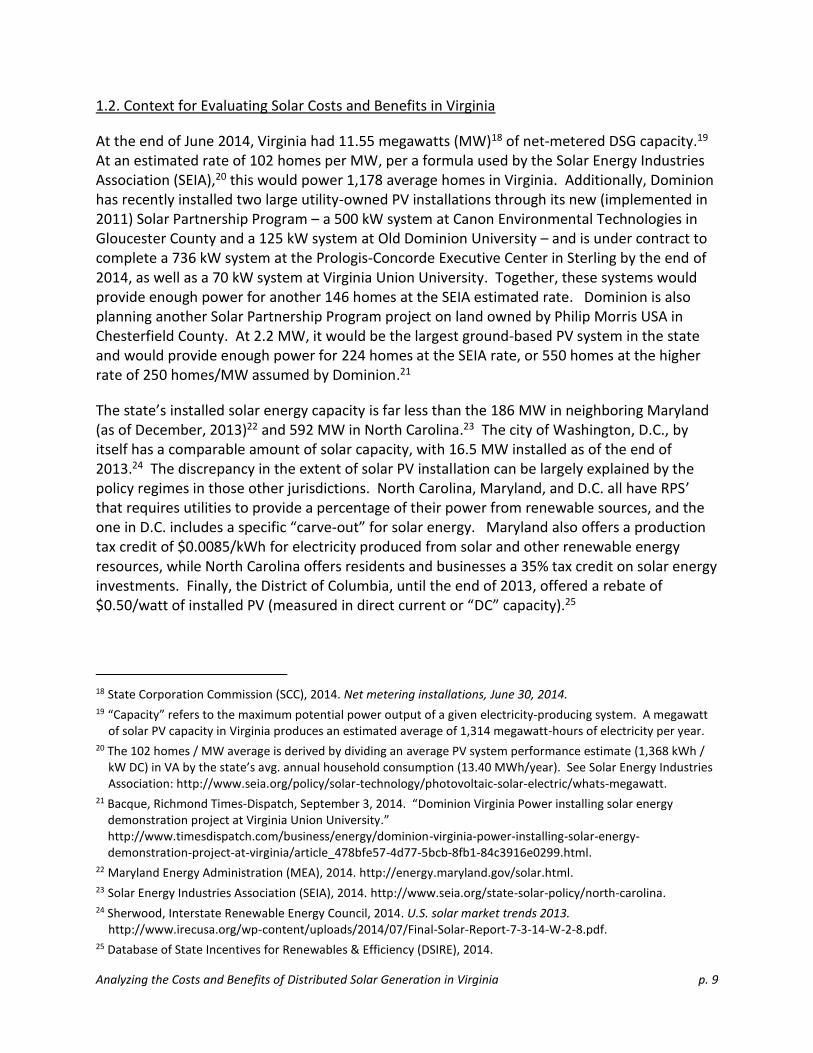
1.1. Study Background and Process
This report has been prepared in response to a “letter study request” from the Clerk of the Virginia Senate, on behalf of the Senate Committee on Rules, pursuant to rule 20(o) of the Rules of the Senate of Virginia (see Appendix A). The letter, dated March 13, 2014, asked the Virginia Department of Environmental Quality (DEQ) and Department of Mines, Minerals and Energy (DMME) to convene a stakeholder group to prepare a written report addressing the subject matter of Senate Resolution (SR) 47, a resolution that had been proposed, and then withdrawn, by Senator John Edwards during the 2014 Session of the Virginia General Assembly. The intent of SR 47, and thus of the letter study request to DEQ and DMME, was for the agencies to “convene a stakeholder group to study the costs and benefits of distributed solar

Analyzing the Costs and Benefits of Distributed Solar Generation in Virginia p. 6
generation and net metering.” The group was asked to “examine data relevant to determining the costs and benefits of interconnected distributed solar generation, recommend a method for evaluating such data, and consider other issues as it may deem appropriate.” Furthermore, it was stipulated that this stakeholder group should be comprised of “representatives from public utilities, the solar industry, local governments, environmental advocacy groups, and academic institutions,” and should be chaired by representatives of DEQ and DMME.17
Figure 2. Rooftop Commercial Solar PV System (56 KW) in Chantilly
Source: Prospect Solar
17 Schaar, Clerk of the Senate, March 13, 2014. Letter to Conrad Spangler, Director, DMME.

Analyzing the Costs and Benefits of Distributed Solar Generation in Virginia p. 7
Figure 3. Ground-Mounted Commercial Solar PV System (12 KW) in Goochland County
Source: Richmond Region Energy Alliance
At the time of this letter study request, DEQ and DMME were already working with a Small Solar Working Group (SSWG) comprised of approximately 35 representatives from the solar industry, utilities, conservation groups, local government, state agencies, and academia. The SSWG was established in the summer of 2013 at the request of stakeholders. The goal of the group was to meet informally and collaboratively to seek common ground in encouraging solar development in Virginia, consistent with the Commonwealth's energy policy.
In response to the letter study request from the Clerk of the Senate, DMME and DEQ (“the agencies”) posted a notice in the Regulatory Town Hall asking individuals who were interested in participating in the study to notify DMME by April 30, 2014. A large number of well-qualified individuals responded to the public notice, including many who had previously been part of the SSWG. From those responses the agencies formed a 49-member (plus alternates) Distributed Generation and Net Metering Solar Stakeholder Group (SSG), including representatives of electric utilities, the solar industry, local governments, environmental advocacy groups, and academic institutions, plus one citizen member.
From within the SSG, the agencies selected a smaller, 11-person steering committee, also composed of a balanced representation from the various stakeholder groups, to lead the study. The purpose of the steering committee was to prepare issues and draft study elements for the full SSG to consider and comment on, thus streamlining the logistics of preparing the study and making it easier for all SSG members to participate in a meaningful fashion. The agencies charged the steering committee to perform the following functions:
Compiling, analyzing, and summarizing existing VOS studies
Framing key issues

Analyzing the Costs and Benefits of Distributed Solar Generation in Virginia p. 8
Gathering and analyzing relevant data
Preparing drafts of data analysis and written content for the VOS report
The steering committee met five times between May and September, 2014. The full SSG also met five times, from April to August, to initiate the study, discuss and agree on the study approach and format, identify points of consensus and debate, and provide input as the study was evolving. The SSG organized itself into three sub-groups, each of which was led by 2-3 steering committee members and included representatives from each of the main interest groups (utilities, solar energy industry, etc.). The sub-groups conducted research and identified possible cost/benefit analysis approaches for each of the three main VOS categories:
Group 1. Energy, Capacity, and Grid Support Services
Group 2. Financial Risk and Reliability Risk
Group 3. Environmental and Economic Development
Members of the steering committee also formed two ad-hoc teams to help the study authors develop baseline projections for statewide energy consumption and peak demand through 2030. The steering committee also identified several existing projections for the potential future market penetration of DSG.
The study authors used the information provided by these SSG groups and ad-hoc teams to develop a draft report. The steering committee reviewed this draft at its August meeting, and provided written comments during the week of August 11-15. The study authors then incorporated these comments into a draft report distributed to the SSG on August 19.
Representatives from each of the interest groups were present for the first eight meetings and provided input throughout the process until early September. All utility representatives formally withdrew from the SSG on September 4–5, just prior to the final steering committee meeting on September 5. The representative from the Virginia Farm Bureau also subsequently withdrew. However, their withdrawal had little substantive impact on the final work product, as this report incorporates all input received from all SSG members up until that time, and no further input was accepted from any SSG members after the utilities withdrew.
The SSG then met on October 3 to formally approve the report and send it to NREL, which had agreed to review and provide comments as part of a technical assistance agreement with DMME. A final SSG meeting was help on October 23 to discuss how the NREL review would be incorporated into the final report. However, NREL was not able to complete its review prior to the October 31 deadline for finishing the VOS study, and thus no comments from NREL are included in this report.
Analyzing the Costs and Benefits of Distributed Solar Generation in Virginia p. 9
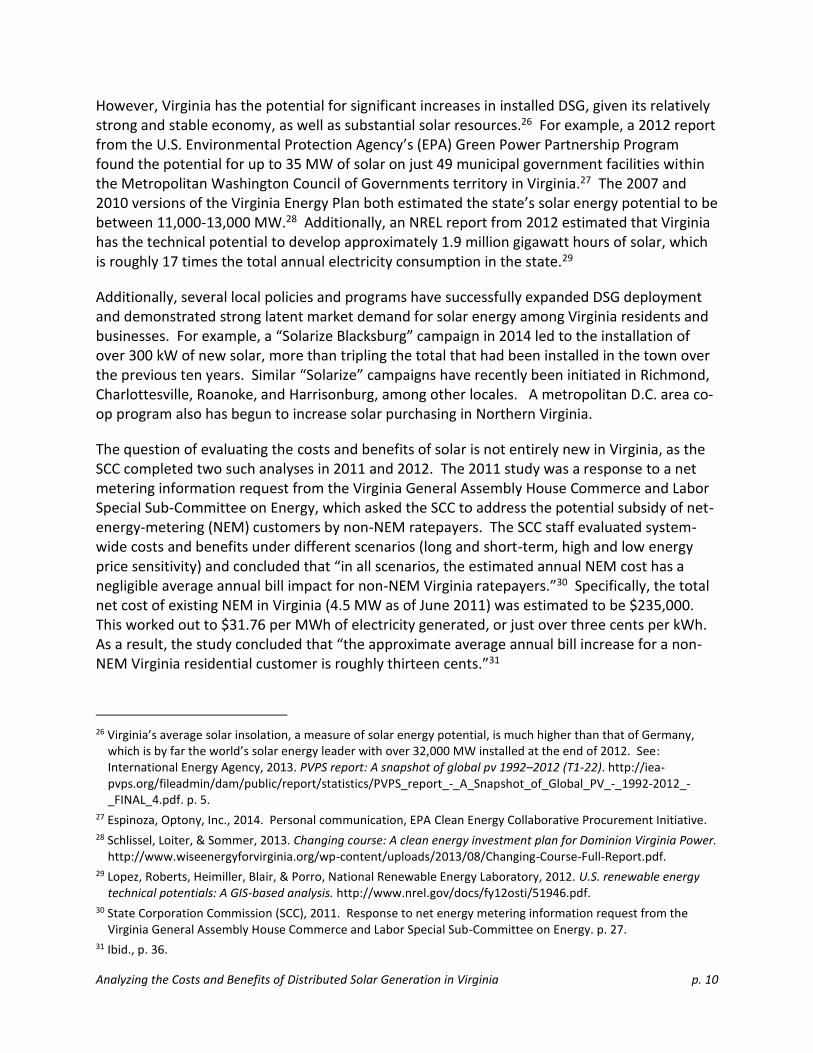
1.2. Context for Evaluating Solar Costs and Benefits in Virginia
At the end of June 2014, Virginia had 11.55 megawatts (MW)18 of net-metered DSG capacity.19
At an estimated rate of 102 homes per MW, per a formula used by the Solar Energy Industries Association (SEIA),20 this would power 1,178 average homes in Virginia. Additionally, Dominion has recently installed two large utility-owned PV installations through its new (implemented in 2011) Solar Partnership Program – a 500 kW system at Canon Environmental Technologies in Gloucester County and a 125 kW system at Old Dominion University – and is under contract to complete a 736 kW system at the Prologis-Concorde Executive Center in Sterling by the end of 2014, as well as a 70 kW system at Virginia Union University. Together, these systems would provide enough power for another 146 homes at the SEIA estimated rate. Dominion is also planning another Solar Partnership Program project on land owned by Philip Morris USA in Chesterfield County. At 2.2 MW, it would be the largest ground-based PV system in the state and would provide enough power for 224 homes at the SEIA rate, or 550 homes at the higher rate of 250 homes/MW assumed by Dominion.21
The state’s installed solar energy capacity is far less than the 186 MW in neighboring Maryland (as of December, 2013)22 and 592 MW in North Carolina.23 The city of Washington, D.C., by itself has a comparable amount of solar capacity, with 16.5 MW installed as of the end of 2013.24 The discrepancy in the extent of solar PV installation can be largely explained by the policy regimes in those other jurisdictions. North Carolina, Maryland, and D.C. all have RPS’ that requires utilities to provide a percentage of their power from renewable sources, and the one in D.C. includes a specific “carve-out” for solar energy. Maryland also offers a production tax credit of $0.0085/kWh for electricity produced from solar and other renewable energy resources, while North Carolina offers residents and businesses a 35% tax credit on solar energy investments. Finally, the District of Columbia, until the end of 2013, offered a rebate of $0.50/watt of installed PV (measured in direct current or “DC” capacity).25
18 State Corporation Commission (SCC), 2014. Net metering installations, June 30, 2014. 19 “Capacity” refers to the maximum potential power output of a given electricity-producing system. A megawatt
of solar PV capacity in Virginia produces an estimated average of 1,314 megawatt-hours of electricity per year. 20 The 102 homes / MW average is derived by dividing an average PV system performance estimate (1,368 kWh /
kW DC) in VA by the state’s avg. annual household consumption (13.40 MWh/year). See Solar Energy Industries Association: http://www.seia.org/policy/solar-technology/photovoltaic-solar-electric/whats-megawatt.
21 Bacque, Richmond Times-Dispatch, September 3, 2014. “Dominion Virginia Power installing solar energy demonstration project at Virginia Union University.” http://www.timesdispatch.com/business/energy/dominion-virginia-power-installing-solar-energy-demonstration-project-at-virginia/article_478bfe57-4d77-5bcb-8fb1-84c3916e0299.html.
22 Maryland Energy Administration (MEA), 2014. http://energy.maryland.gov/solar.html. 23 Solar Energy Industries Association (SEIA), 2014. http://www.seia.org/state-solar-policy/north-carolina. 24 Sherwood, Interstate Renewable Energy Council, 2014. U.S. solar market trends 2013.
http://www.irecusa.org/wp-content/uploads/2014/07/Final-Solar-Report-7-3-14-W-2-8.pdf. 25 Database of State Incentives for Renewables & Efficiency (DSIRE), 2014.
Analyzing the Costs and Benefits of Distributed Solar Generation in Virginia p. 10
However, Virginia has the potential for significant increases in installed DSG, given its relatively strong and stable economy, as well as substantial solar resources.26 For example, a 2012 report from the U.S. Environmental Protection Agency’s (EPA) Green Power Partnership Program found the potential for up to 35 MW of solar on just 49 municipal government facilities within the Metropolitan Washington Council of Governments territory in Virginia.27 The 2007 and 2010 versions of the Virginia Energy Plan both estimated the state’s solar energy potential to be between 11,000-13,000 MW.28 Additionally, an NREL report from 2012 estimated that Virginia has the technical potential to develop approximately 1.9 million gigawatt hours of solar, which is roughly 17 times the total annual electricity consumption in the state.29
Additionally, several local policies and programs have successfully expanded DSG deployment and demonstrated strong latent market demand for solar energy among Virginia residents and businesses. For example, a “Solarize Blacksburg” campaign in 2014 led to the installation of over 300 kW of new solar, more than tripling the total that had been installed in the town over the previous ten years. Similar “Solarize” campaigns have recently been initiated in Richmond, Charlottesville, Roanoke, and Harrisonburg, among other locales. A metropolitan D.C. area co-op program also has begun to increase solar purchasing in Northern Virginia.
The question of evaluating the costs and benefits of solar is not entirely new in Virginia, as the SCC completed two such analyses in 2011 and 2012. The 2011 study was a response to a net metering information request from the Virginia General Assembly House Commerce and Labor Special Sub-Committee on Energy, which asked the SCC to address the potential subsidy of net-energy-metering (NEM) customers by non-NEM ratepayers. The SCC staff evaluated system-wide costs and benefits under different scenarios (long and short-term, high and low energy price sensitivity) and concluded that “in all scenarios, the estimated annual NEM cost has a negligible average annual bill impact for non-NEM Virginia ratepayers.”30 Specifically, the total net cost of existing NEM in Virginia (4.5 MW as of June 2011) was estimated to be $235,000. This worked out to $31.76 per MWh of electricity generated, or just over three cents per kWh. As a result, the study concluded that “the approximate average annual bill increase for a non-NEM Virginia residential customer is roughly thirteen cents.”31
26 Virginia’s average solar insolation, a measure of solar energy potential, is much higher than that of Germany,
which is by far the world’s solar energy leader with over 32,000 MW installed at the end of 2012. See: International Energy Agency, 2013. PVPS report: A snapshot of global pv 1992–2012 (T1-22). http://iea-pvps.org/fileadmin/dam/public/report/statistics/PVPS_report_-_A_Snapshot_of_Global_PV_-_1992-2012_-_FINAL_4.pdf. p. 5.
27 Espinoza, Optony, Inc., 2014. Personal communication, EPA Clean Energy Collaborative Procurement Initiative. 28 Schlissel, Loiter, & Sommer, 2013. Changing course: A clean energy investment plan for Dominion Virginia Power.
http://www.wiseenergyforvirginia.org/wp-content/uploads/2013/08/Changing-Course-Full-Report.pdf. 29 Lopez, Roberts, Heimiller, Blair, & Porro, National Renewable Energy Laboratory, 2012. U.S. renewable energy
technical potentials: A GIS-based analysis. http://www.nrel.gov/docs/fy12osti/51946.pdf. 30 State Corporation Commission (SCC), 2011. Response to net energy metering information request from the
Virginia General Assembly House Commerce and Labor Special Sub-Committee on Energy. p. 27. 31 Ibid., p. 36.

Analyzing the Costs and Benefits of Distributed Solar Generation in Virginia p. 11
The 2011 SCC study also analyzed the costs and benefits of “full program subscription,” or a scenario in which total net-metered PV capacity reaches the limit currently allowed under state law. The state’s net metering statute limits the total capacity of NEM facilities in each utility service area to 1% of that utility’s adjusted peak-load forecast for the previous year. In 2011, this rule would have limited total statewide NEM capacity to just over 234 MW of alternating current (AC) power, or an estimated 304.5 MW of installed direct current (DC) capacity32 (note, most measures of installed PV capacity refer to the system’s DC ratings). The SCC found that this level of PV capacity would result in annual costs of $30.09 per MWh, with an average non-NEM annual bill increase of $6.73, equal to less than 0.5% of the average annual customer bill.33
The 2012 SCC study was a response to a net metering information request from the Virginia General Assembly Senate Committee on Commerce and Labor, which asked the SCC to supplement the information from the previous study and address specific issues related to stand-by charges.34 This study analyzed three individual NEM customer case studies (small and large customer examples in the Dominion zone, and a small customer example in the APCo zone). The costs and benefits were estimated over a 5-year period, from 2008–2012. This approach estimated the net costs to utilities in 2012 to be around five to eight cents/kWh for the small residential case studies and two cents/kWh for the large residential case study.35 Unlike the 2011 study, the 2012 SCC report did not calculate the impact of these NEM system costs on other ratepayers.
Both SCC studies examined many of the core utility and ratepayer-specific DSG cost/benefit variables typically included in VOS studies: lost utility revenue, avoided energy costs, avoided generation capacity costs, avoided transmission and distribution system costs (in 2011 study only). They did not address several additional variables found in some other VOS studies, such as grid support services, financial risk, reliability risk, environmental impacts, and economic development. They also included utility-reported estimates of “incremental customer-related NEM program” costs, not addressed in most other VOS studies, which represented the expenses incurred by utilities for the initial interconnection of NEM systems and ongoing customer service and customer billing. These customer costs represented 12.5% of total costs in the 2011 study base analysis36 and up to 24.6% in the 2012 case studies. In the 2012 study, the same customer costs were applied to each year of the five-year cost/benefit analyses.37
The SCC studies quantified the costs and benefits of solar energy in the present, and in the case of the 2012 study, the recent past. They did not consider longer term costs and benefits, or potential changes such as increasing fuel prices that would affect the future VOS. They also
32 Ibid., p. 26. 33 Ibid., p. 37. 34 State Corporation Commission (SCC), 2012. Response to net energy metering information request from the
Virginia General Assembly Senate Committee on Commerce and Labor. 35 Ibid., p. 20, 24, 28. 36 SCC, 2011, p. 49, 51. 37 SCC, 2012, p. 24.
Analyzing the Costs and Benefits of Distributed Solar Generation in Virginia p. 12
reflected the reality that utilities in Virginia are under no obligation to produce a certain amount of energy from renewable sources or reduce their emissions of carbon dioxide (CO2) or other climate-change-inducing greenhouse gas (GHG) emissions, as is the case in some other states that have produced VOS studies.
However, the policy context is not fixed, and the examination of solar energy’s costs and benefits should consider potential future policy changes that would alter the context in which the VOS has been evaluated. For example, renewable energy advocates have proposed bills in recent Virginia General Assembly sessions that would change the state’s voluntary RPS to a mandatory one.38 Also, the aforementioned bills would have required public health and environmental impacts to be further addressed in utility IRPs (SB 794, 2011; HB 489, 2012) or for SCC review of new generation facility applications to consider those impacts (HB 363, 2014) as well as fuel price stability (HB 789, 2012; HB 1943, 2013; HB 808, 2014). If similar bills were to pass in the future, or if the state were to adopt financial incentives for solar PV such as those found in North Carolina, Maryland, or D.C., then the deployment of DSG systems could increase substantially. Therefore, a comprehensive value of solar analysis should include costs and benefits that could potentially accrue in a high-DSG-penetration scenario, even if they are not present under the current low rates of DSG.
Perhaps more likely, however, is the potential implementation of the EPA’s proposed CO2 emission limits for new and existing power plants under sections 111(b) and 111(d) of the Clean Air Act (CAA). As part of these proposed rules, the EPA’s Clean Power Plan (CPP) establishes a goal for Virginia to reduce CO2 emissions by 38% by the year 2030. This percentage is based off the state’s existing CO2 emissions rate, which the EPA calculated at 1,302 lbs per MWh for all electricity generation.39 The EPA developed emissions reduction goals for each state based on analysis of the states’ potential CO2 reductions under each of four “building block assumptions:” coal plant efficiency, natural gas dispatch, renewable and nuclear generation, and demand-side energy efficiency. By combining the emissions reductions potential within these four building blocks the EPA established a target emissions rate of 810 lbs/MWh, or 37.8% below current levels. Under the third building block, the EPA assumed that Virginia could achieve a 16% renewable energy target by 2030, based on RPS targets of other states within the PJM40 territory.
38 See: HB 1946, 2013, http://leg1.state.va.us/cgi-bin/legp504.exe?ses=131&typ=bil&val=hb1946; and HJ 76, 2014,
http://leg1.state.va.us/cgi-bin/legp504.exe?141+sum+HJ76. 39 This emissions rate is based on total annual CO2 emissions of 55 billion pounds divided by the state’s total annual
electricity generation of approximately 42.24 million MWh. See: EPA Technical Support Document (TSD) for CAA Section 111(d) Emission Guidelines for Existing Power Plants, “Goal Computation Technical Support Document,” Docket ID No. EPA-HW-OAR-2013-0602 (June 2014), http://www2.epa.gov/sites/production/files/2014-06/documents/20140602tsd-goal-computation.pdf.
40 PJM is a regional transmission organization that oversees the activity of wholesale electricity in portions or the entirety of 13 states as well as Washington D.C.
Analyzing the Costs and Benefits of Distributed Solar Generation in Virginia p. 13
1.3. Other Value of Solar Studies
This report follows on the heels of a number of previous studies that have evaluated the costs and benefits of solar energy in a variety of different contexts and locations. Most VOS studies are produced by state government agencies, technical consulting firms working on behalf of those agencies, or by think-tanks and other non-profit organizations, as shown in Table 1. The VOS issue has also been addressed in academic research.41 These prior VOS studies reflect a variety of perspectives, methodologies, and assumptions. Some have focused specifically on the cost and benefits experienced by utilities at a given point in time,42 while others have evaluated a broader range of cost/benefit categories to estimate cost/benefit impacts on ratepayer43 and/or the broader community within a given service area.44 Others have expanded the approach by evaluating the VOS based on thirty-year projections45 or for an entire state or other large geographic region.46
Despite the wide variation in approaches, most previous VOS studies recognize that local context matters significantly. It is widely agreed that utility-specific or state-specific energy generation mixes, investment plans, and market structures all play a key role in determining the net value of solar.47,48,49,50
41 See: Duke, Williams, & Payne, 2005. Accelerating residential pv expansion: Demand analysis for competitive
electricity markets. Energy Policy, 33, 1912-1929. 42 See: Energy and Environmental Economics (E3), for the California Public Utilities Commission, 2012. Technical
potential for local distributed photovoltaics in California, preliminary assessment. www.cpuc.ca.gov. 43 See: Hoff, Perez, Braun, Kuhn, & Norris, Clean Power Research, for Austin Energy, 2006. The value of distributed
photovoltaics to Austin energy and the city of Austin. www.cleanpower.com/wp-content/uploads/034_PV_ValueReportAustinEnergy.pdf.
44 See: Perez, Norris, & Hoff, Clean Power Research, for the Mid‐Atlantic Solar Energy Industries Association &
Pennsylvania Solar Energy Industries Association, 2012. The value of distributed solar electric generation to New Jersey and Pennsylvania. mseia.net/site/wp-content/uploads/2012/05/MSEIA-Final-Benefits-of-Solar-Report-2012-11-01.pdf.
45 See: Jones & Norris, Solar San Antonio and Clean Power Research, 2013. The value of distributed solar electric
generation to San Antonio. www.solarsanantonio.org/wp-content/uploads/2013/04/Value-of-Solar-at-San-Antonio-03-13-2013.pdf.
46 See: Perez & Hoff, Clean Power Research, for the Solar Alliance and the New York Energy Industry Association,
2008. Energy and capacity valuation of photovoltaic power generation in New York. www.asrc.cestm.albany.edu/perez/publications/UtilityPeakShavingandCapacityCredit/PapersonPVLoadMatchingandEconomicEvaluation/EnergyCapacityValuation-08.pdf.
47 Navigant Consulting Inc., prepared for NV Energy, 2010. Distributed generation study.
www.navigant.com/~/media/WWW/Site/Insights/Energy/NVE_DG_Study_Energy.ashx. 48 Vermont Public Service Department, 2013. Evaluation of net metering in Vermont conducted pursuant to act 125
of 2012. http://www.leg.state.vt.us/reports/2013ExternalReports/285580.pdf. 49 SAIC, for Arizona Public Service, 2013. 2013 updated solar pv value report.
www.azsolarcenter.org/images/docs/reports/SolarValueStudy-SAIC-2013-05.pdf. 50 Weiss, Chang, & Aydin, The Brattle Group, prepared for the Solar Energy Industries Association and the Energy
Foundation, 2012. The potential impact of solar pv on electricity markets in Texas. www.seia.org/sites/default/files/brattlegrouptexasstudy6-19-12-120619081828-phpapp01.pdf.

Analyzing the Costs and Benefits of Distributed Solar Generation in Virginia p. 14
Table 1. Summary of Prior VOS Studies
Year Name Author Client(s) Client Type
2005 Quantifying the benefits of solar power for California
Smeloff, E. The Vote Solar Initiative Solar Organization
2005 Accelerating residential pv expansion: demand analysis for competitive electricity markets
Duke, R., Williams, R., & Payne, A.
Not applicable (NA) NA
2006 The value of distributed photovoltaics to Austin energy and the city of Austin
Clean Power Research
Austin Energy Utility
2008 Energy and capacity valuation of photovoltaic power generation in New York
Clean Power Research
Solar Alliance & New York Solar Energy Industries Association (SEIA)
Solar Organizations
2008 Impacts of distributed generation on wholesale electric prices and air emissions in Massachusetts
Synapse Energy Economics
Massachusetts Technology Collaborative
State Agency
2008 Photovoltaics value analysis Navigant Consulting Inc.
National Renewable Energy Laboratory
Federal Laboratory
2009 Distributed renewable energy operating impacts and valuation study
R.W. Beck Arizona Public Service Utility
2010 Distributed generation study Navigant Consulting Inc.
NV Energy Utility
2010 Introduction to the net energy metering cost effectiveness evaluation
Energy and Environmental Economics (E3)
California Public Utilities Commission
State Agency
2011 California solar initiative cost-effectiveness evaluation
Energy and Environmental Economics (E3)
California Public Utilities Commission
State Agency
2011 Solar power generation in the US: Too expensive, or a bargain?
Clean Power Research, Univ. at Albany, George Wash-ington Univ.
NA NA
2012 Designing Austin energy’s solar tariff using a distributed pv value calculator
Clean Power Research
Austin Energy Utility
2012 The potential impact of solar pv on electricity markets in Texas
The Brattle Group
SEIA & Energy Foundation Solar Organizations
2012 The value of distributed solar electric generation to New Jersey and Pennsylvania
Clean Power Research
Mid‐Atlantic SEIA & Pennsylvania SEIA
Solar Organizations
2012 Technical potential for local distributed photovoltaics in California, preliminary assessment
Energy and Environmental Economics (E3)
California Public Utilities Commission
State Agency
2012 Changes in the economic value of variable generation at high penetration levels: A pilot case study of California
Lawrence Berkeley National Laboratory
NA NA

Analyzing the Costs and Benefits of Distributed Solar Generation in Virginia p. 15
Year Name Author Client(s) Client Type
2013 The benefits and costs of solar distributed generation for Arizona public service
Crossborder Energy
Arizona Public Service Utility
2013 2013 updated solar pv value report SAIC Arizona Public Service Utility
2013 Evaluating the benefits and costs of net energy metering in California
Crossborder Energy
The Vote Solar Initiative Solar Organization
2013 The benefits and costs of solar generation for electric ratepayers in North Carolina
Crossborder Energy
North Carolina Sustainable Energy Association
Solar Organization
2013 Benefits and costs of solar distributed generation for the public service company of Colorado
Crossborder Energy
The Vote Solar Initiative Solar Organization
2013 Evaluation of net metering in Vermont conducted pursuant to act 125 of 2012
Public Service Department (VT)
Public Service Department (VT)
State Agency
2013 The value of distributed solar electric generation to San Antonio
Clean Power Research & Solar San Antonio
City of San Antonio Municipality
2013* A regulator's guidebook: Calculating the benefits and costs of distributed solar generation
Interstate Renewable Energy Council
NA NA
2013** A review of solar pv benefit & cost studies Rocky Mountain Institute
NA NA
2014 Nevada net energy metering impacts evaluation
Energy and Environmental Economics (E3)
Nevada Public Utilities Commission
State Agency
2014 Financial impacts of net-metered pv on utilities and ratepayers: A scoping study of two prototypical U.S. utilities
Lawrence Berkeley National Laboratory
NA NA
2014 Methods for analyzing the benefits and costs of distributed photovoltaic generation to the U.S. electric utility system
National Renewable Energy Laboratory
NA NA
*Proposes a standardized approach for evaluating the costs and benefits of DSG
**Meta-analysis report that reviews previous VOS studies and summarizes their results
Two of the more prominent resources are “meta-analysis” studies produced by the Rocky Mountain Institute (RMI)51 and the Interstate Renewable Energy Council (IREC),52 both of which draw on the aforementioned state and utility-specific studies to provide a comprehensive, national perspective on how the costs and benefits of solar energy can be assessed. These comparative analyses help to demonstrate the myriad of differences among VOS studies, such 51 Rocky Mountain Institute, 2013. 52 Keyes & Rabago, 2013. A regulator’s guidebook: Calculating the benefits and costs of distributed solar
generation. http://www.irecusa.org/wp-content/uploads/2013/10/IREC_Rabago_Regulators-Guidebook-to-Assessing-Benefits-and-Costs-of-DSG.pdf.
Analyzing the Costs and Benefits of Distributed Solar Generation in Virginia p. 16
as the solar penetration levels assumed, the types of variables included, and the data sources and assumptions used to calculate the VOS associated with those variables. Another valuable resource is a highly technical analysis of the costs and benefits of DSG released by NREL just at the time that this study was completed.53
Most prior VOS studies have attempted to quantify a dollar amount for the value of DSG, but many only calculated the benefits, ignoring costs.54 The range of net benefits identified by these studies varies significantly, from as small as 3.3–4.3 cents55 to as large as 15–40 cents (per KWh).56 Alternatively a new study by the U.S .Department of Energy (DOE) Lawrence Berkeley National Laboratory (LBNL) models both costs and benefits for various DSG penetration scenarios on two prototypical utilities. Its “base case scenario” analysis found that an increase of solar PV penetration to 2.5% of total retail sales would increase average customer rates by 0.1%–0.2%. A more aggressive 10% penetration scenario would raise rates by 2.5%–2.7%.57
1.4. Objectives of the Virginia SSG Study
The SSG’s primary objectives, as defined by the original letter study request were to “study the costs and benefits of distributed solar generation and net metering,” and in so doing, to “examine data relevant to determining the costs and benefits of interconnected distributed solar generation, recommend a method for evaluating such data, and consider other issues as it may deem appropriate.” To fulfill these objectives, the SSG sought to identify and evaluate the costs and benefits of DSG in the Virginia context and recommend methodologies for calculating the net value of DSG to the state’s electric ratepayers and society at large. Given the complex nature of the solar energy valuation, involving a wide array of variables and assumptions, the SSG chose not to attempt to quantify a single new VOS that balances all of the costs and benefits of DSG. Instead, this report discusses the potential costs and benefits associated with 13 primary VOS variables, and recommends three methodologies for quantifying the net VOS under a narrow, intermediate, or broad perspective.
The goal of this report is to represent, wherever possible, a consensus of all stakeholders represented by the SSG. On issues where consensus could not be reached, the report
53 Denholm, Margolis, Palmintier, Barrows, Ibanez, & Bird, National Renewable Energy Laboratory, 2014. Methods
for analyzing the benefits and costs of distributed photovoltaic generation to the U.S. electric utility system. http://nrelpubs.nrel.gov/Webtop/ws/nich/www/public/Record;jsessionid=C1E0AECA9AD9B2A60C5C8AB4B0BB5524?rpp=25&upp=0&m=1&w=NATIVE%28%27AUTHOR+ph+words+%27%27denholm+p%27%27%27%29&order=native%28%27pubyear%2FDescend%27%29.
54 Rocky Mountain Institute, 2013. 55 See: Vermont Public Service Department, 2013. 56 See: Perez, Zweibel, & Hoff, Clean Power Research, 2011. Solar power generation in the US: Too expensive, or a
bargain? www.cleanpower.com/wp-content/uploads/Solar-Power-Generation-in-U.S.-too-expensive-or-a-bargain.pdf.
57 Satchwell, Mills, & Barbose, Lawrence Berkeley National Laboratory, 2014. Financial impacts of net-metered pv on utilities and ratepayers: A scoping study of two prototypical U.S. utilities. http://emp.lbl.gov/sites/all/files/LBNL%20PV%20Business%20Models%20Report_no%20report%20number%20(Sept%2025%20revision).pdf.

Analyzing the Costs and Benefits of Distributed Solar Generation in Virginia p. 17
summarizes the various stakeholder positions and the rationales behind them. Where applicable, the report seeks to identify opportunities for “win-win” scenarios that are mutually beneficial and cost effective for utilities, ratepayers, and other affected stakeholders. The study embraces a medium-term perspective on evaluating the costs and benefits of DSG in Virginia, consistent with the 15-year time horizons used in utility’s IRPs. However, the SSG recommends that future VOS calculations evaluate the levelized costs and benefits over a 30-year time frame, consistent with the presumed lifespan of a solar energy generation facility.
This study draws from existing knowledge and builds upon prior VOS analyses where applicable. However, many of the prior studies focused on states with mandatory RPS’, de-regulated electric utility markets (e.g., New York, Vermont, Texas), and/or robust existing solar energy markets (e.g., California, New Jersey), none of which apply to Virginia. The SSG has, therefore, made an effort to describe VOS methodologies that are appropriate to the Virginia context, where the solar energy market is far underdeveloped compared to similar neighboring states, state policy does not require any level of solar development, and utilities operate under the traditional regulated monopoly model. This does not imply, however, that the potential deployment of solar energy is inherently limited for, as previously noted, the state does have a relatively strong and stable economy, substantial solar resources, and evidence of public support for solar energy.
2. Baseline Electricity Model and Estimates of Future DSG Penetration
The SSG recommends that future VOS studies take into account how different penetration levels of DSG would affect its costs and benefits to utilities, ratepayers, and society at large. One approach would be to develop a baseline model for future electricity consumption and peak load demand under a “business as usual” scenario, then develop multiple scenarios for future DSG penetration levels that would be different from that baseline model. The SSG recommends using 15-year projections for both the baseline model and scenarios, consistent with the time frame used in the utility IRP planning process.
To get an accurate sense of the impacts from each scenario one would have to model hourly electricity demand, the mix of conventional generation sources that utilities would use to meet that demand, and the hourly generation profile from installed PV capacity in order to determine the extent to which different types of generation sources would be displaced by DSG. A simpler approach would be to simply calculate the level of installed PV capacity that would be required to meet certain levels of statewide electricity demand with DSG, based on assumptions about the average electricity production of DSG systems per kW of capacity. This simpler analysis would also help to inform discussion of how different penetration levels might impact utility operations and otherwise influence the costs and benefits of solar energy.
Detailed modeling such as described above is outside the scope of this current study. However, the SSG felt that it would add value to the discussion to prepare a simple baseline model of electricity consumption and peak demand in Virginia, and then present a number of different perspectives from existing reports and studies on the potential future penetration of DSG:

Analyzing the Costs and Benefits of Distributed Solar Generation in Virginia p. 18
Extrapolation of recent DSG capacity growth rates
A modeled growth rate that would reach the state-wide net-metering cap by 2030
Existing utility projections for future solar electric generation in their service areas
Existing NREL projections for future solar PV capacity in Virginia
An estimate of the solar energy production needed to meet the carbon reduction goals under the EPA’s proposed 111(d) CPP (16% renewables by 2030)
2.1. Baseline Model of Electricity Consumption and Peak Demand in Virginia
The following steps were used to develop the baseline model:
Calculated total electricity sales in the state in 2012, the latest year that such data was available from the U.S. Energy Information Administration (EIA).58 The EIA data was used to show total sales from the state’s co-op and municipal utilities, whereas the numbers for Dominion and APCo were taken from their IRPs for 2014.59, 60 Based on this approach, the breakdown of total statewide electricity consumption by utility in 2014 is as follows: Dominion, 67%; APCO, 16%; Co-Ops, 12%; all other utilities, 5%.
Projected total energy consumption forward through year 2030. The Dominion and APCo projections were based on the 15-year projected growth rates from their IRPs (1.42% and 0.45% respectively). These growth rates are for the Virginia portion of those utilities’ service areas only. A growth rate of 0.5% was used for the co-ops and other utilities, similar to the APCo rate as shown above.
Estimated total winter and summer peak demand through the year 2030. The Dominion and APCo IRPs show peak demand projections for the entire service areas, so estimates of Virginia-specific peak demand were made based on the Virginia share of total electricity sales for each utility (95% for Dominion and 51% for APCo in 2013). The peak demand growth rates from the IRPs were used to project demand for subsequent years up to 2030. Peak demand estimates for the co-ops and other utilities were based on their shares of total statewide electricity consumption (i.e., the co-ops and other utilities were assumed to have 12% and 5% of winter and summer peak demand respectively).
This methodology produced an estimated total statewide electricity consumption of 118,823,000 MWh in 2015, rising to 139,156,000 MWh by the year 2030. In this analysis, Dominion’s share of total electricity sales is projected to increase from 68% in 2015 to 72% by 2030, with the other utilities’ shares dropping accordingly, as illustrated in Figure 4.
58 Energy Information Administration (EIA), 2014. Electric sales, revenue, and average price, table 10: 2012 utility
bundled retail sales – Total. http://www.eia.gov/electricity/sales_revenue_price/. 59 Dominion Virginia Power, 2014. 60 Appalachian Power, 2014. Updated integrated resource planning report to the Commonwealth of Virginia State
Corporation Commission.
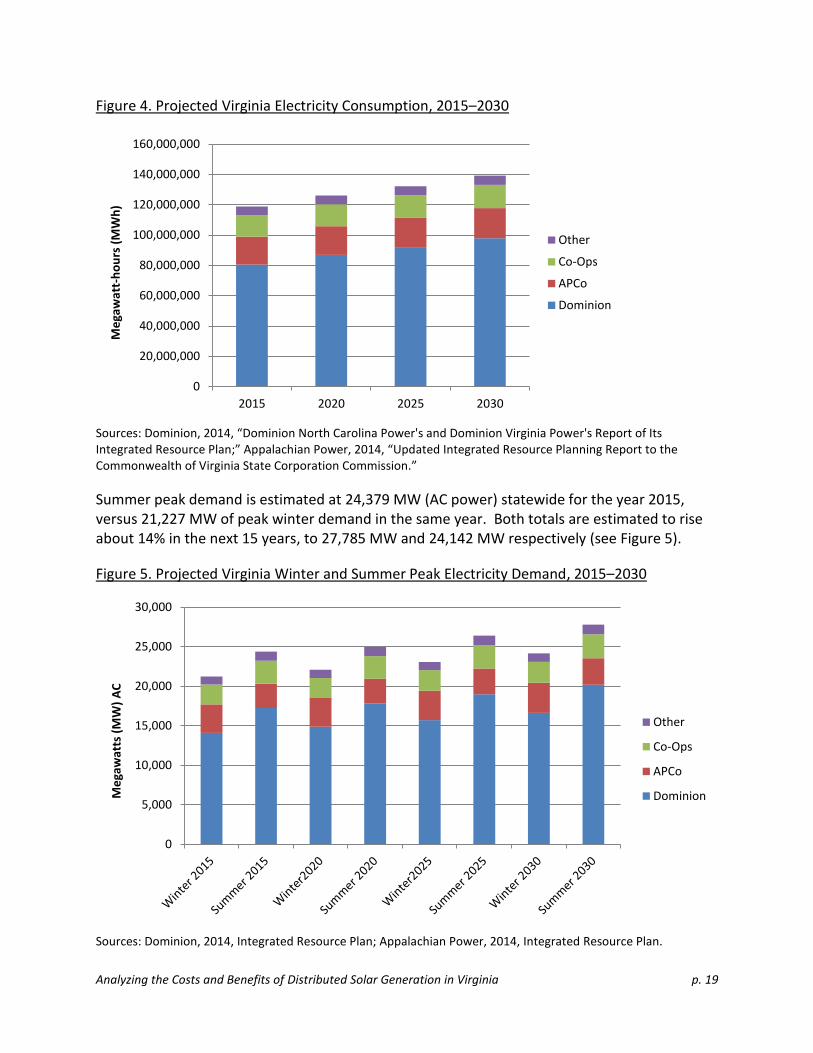
Analyzing the Costs and Benefits of Distributed Solar Generation in Virginia p. 19
Figure 4. Projected Virginia Electricity Consumption, 2015–2030
Sources: Dominion, 2014, “Dominion North Carolina Power's and Dominion Virginia Power's Report of Its Integrated Resource Plan;” Appalachian Power, 2014, “Updated Integrated Resource Planning Report to the Commonwealth of Virginia State Corporation Commission.”
Summer peak demand is estimated at 24,379 MW (AC power) statewide for the year 2015, versus 21,227 MW of peak winter demand in the same year. Both totals are estimated to rise about 14% in the next 15 years, to 27,785 MW and 24,142 MW respectively (see Figure 5).
Figure 5. Projected Virginia Winter and Summer Peak Electricity Demand, 2015–2030
Sources: Dominion, 2014, Integrated Resource Plan; Appalachian Power, 2014, Integrated Resource Plan.
0
20,000,000
40,000,000
60,000,000
80,000,000
100,000,000
120,000,000
140,000,000
160,000,000
2015 2020 2025 2030
Me
gaw
att-
ho
urs
(M
Wh
)
Other
Co-Ops
APCo
Dominion
0
5,000
10,000
15,000
20,000
25,000
30,000
Me
gaw
atts
(M
W)
AC
Other
Co-Ops
APCo
Dominion

Analyzing the Costs and Benefits of Distributed Solar Generation in Virginia p. 20
The shares of peak demand by utility are similar to those for overall electricity consumption. The exceptions are that Dominion, as a summer-peaking utility with high air conditioning loads, has 71% of summer peak demand vs. 66% of winter peak demand. APCo, on the other hand, is a winter-peaking utility with high space heating loads. It accounts for 17% of the statewide winter peak demand compared to 13% of summer peak demand.
2.2. Current Installed DSG Capacity and Recent Growth Rates
The SCC maintains data, updated monthly, on the total capacity of net-metered solar PV within each of the state’s utility areas. This total installed capacity was 11.55 MW (DC power) as of June, 2014, nearly a 10-fold increase from the 2.17 MW total in June, 2010. This works out to an average annual growth rate (AAGR) of nearly 40%. These values are shown in Figure 6.
Figure 6. Virginia Installed Net-Metered Solar PV Capacity (MW), 2010–2014
Source: Virginia State Corporation Commission (SCC), 2014. “Net Energy Metering (‘NEM’) Generating Facilities in Virginia, Photovoltaic (Solar) and Wind,” June 30, 2014.
The SCC’s 2011 VOS analysis used NREL’s online PV Watts tool61 to estimate a rate of 1253.55 kWh of electricity generation for every kW of installed DC solar energy capacity, for a capacity factor of 14.3%.62 More recently, however, Dominion’s 2014 IRP assumes a net capacity factor of 21%, which translates to a rate of 1,839 kWh per KW of installed nameplate capacity. Applying these capacity factors to the current installed capacity as of June 2014 produces estimates of 14,478 MWh (SCC rate) or 21,246 MWh (Dominion rate) of electricity generated from solar in 2014. In either case, this translates to just around 0.01% (one hundredth of a percent) of the estimated total statewide electricity demand.
61 National Renewable Energy Laboratory, 2014. NREL’s pv watts calculator. http://pvwatts.nrel.gov/. 62 SCC, 2011, p. 17.
0.00
2.00
4.00
6.00
8.00
10.00
12.00
14.00
2010 2011 2012 2013 2014
Me
gaw
atts
(M
W)
DC

Analyzing the Costs and Benefits of Distributed Solar Generation in Virginia p. 21
If this 40% growth rate were to continue through the year 2015 and beyond, the state would have 2,448 MW (DC) of net-metered solar energy capacity by June, 2030. This would produce around 3–5 million MWh of electricity, depending on the capacity factor assumption, or about 2.2–3.2% of the 139 million MWh of statewide electricity demand estimated for year 2030.
However, solar energy representatives on the SSG contend that this percentage growth rate greatly overstates the potential for future DSG deployment within Virginia’s current regulatory structure. They point out that from 2009–2014 the total new net-metered solar PV installations averaged about 2.16 MW/yr per the SCC data, and do not reflect consistent annual increases as would be implied by an AAGR-based projection. Instead, they anticipate a small bump in installations (up to 4.5 MW/yr) until the expiration of the 30% federal investment tax credit for solar PV, which is scheduled to drop to 10% after the end of 2016. After the tax credit incentive is reduced, and barring any additional federal or state-level policy incentives, they believe that the market would be able to support no more than about 2.75 MW/yr of new DSG capacity.63
Table 2 shows that under these assumptions, installed net-metered solar PV would increase to about 26 MW by 2018. Continuing the 2.75 MW/yr assumption into future years, this total would increase to 31.55 MW in 2020, 45.30 MW in 2025, and 59.95 MW in 2030. In this scenario, the total installed NEM capacity would remain far below the cap of 1% of summer peak demand, set by state law, which would currently be around 244 MW based on the calculations shown in Figure 5 above. These totals are far below the projections based on the AAGR approach as described above, demonstrating the wide range of potential outcomes for solar energy in the state.
Table 2. Projected Statewide Installed NEM Capacity at Current Annual Growth
Year 2010 2011 2012 2013 2014 2015 2016 2017 2018
Actual increase in DSG capacity from previous year (MW)
1.40 2.42 2.45 1.83 2.68 -- -- -- --
Anticipated future increase in DSG capacity per year (MW)
-- -- -- -- -- 4.50 4.50 2.75 2.75
Resulting total installed DSG capacity (MW)
2.17 4.59 7.04 8.87 11.55 16.05 20.55 23.30 26.05
Sources: Virginia State Corporation Commission (SCC), 2014; Hillis, 2014.
2.3. Modeled Growth Rate to Meet Statewide Net Metering Cap
The state’s net metering enabling legislation caps net-metered PV capacity at 1% of summer peak demand within each utility service area.64 Based on the peak demand projections shown in Figure 5, installed net-metered capacity would exceed the state cap in the year 2024 if it
63 Hillis, Prospect Solar, 2014. Personal communication on net-metered pv projections for Virginia. 64 Freeing the Grid, 2013. Best practices in state net metering policies and interconnection procedures.
freeingthegrid.org/wp-content/uploads/2013/11/FTG_2013.pdf.

Analyzing the Costs and Benefits of Distributed Solar Generation in Virginia p. 22
increases at the current growth rate as described in Figure 6, but would remain far below the cp if it increases at affixed rate of 2-3 MW/yr as shown in Table 2. While the state’s methodology for calculating the net-metering cap is subject to change, the SSG felt it would be worthwhile to examine scenarios for meeting the current cap at different points in the 15-year study period. Table 3 demonstrates the growth rates that would be necessary to reach the net-metering cap by the years 2020, 2025, or 2030, starting from the current 11.55 MW in 2014.
Table 3. Alternative Net-Metered PV Growth Rates to Achieve Net-Metering Cap
Installed PV Capacity by Year (MW)
Scenario Avg. Annual Growth Rate
2015 2020 2025 2030
Net-metering cap (1% summer peak demand)
NA 244 250 264 278
PV growth scenario to meet net-metering cap by 2020
66.9% 19 250 -- --
PV growth scenario to meet net-metering cap by 2025
32.9% 15 64 264 --
PV growth scenario to meet net-metering cap by 2030
22.0% 14 38 103 278
The first scenario shown in Table 3 would require the installation of approximately 238 MW of net-metered solar capacity over the next six years, to meet the estimated cap (under current legislation) of 250 MW by the year 2020. This would require an AAGR of 66.9%, nearly twice the growth rate of net-metered installed capacity over the years 2011–2014. The second scenario shows a slightly lower AAGR than the 2011–2014 rate, to reach the projected net metering cap by the year 2025. The final scenario would meet the projected 278 MW cap in the year 2030, requiring a lower growth rate (22%) than experienced from 2011–2014.
2.4. Utility Projections for Solar PV Growth
Another perspective on future solar PV growth in Virginia can be drawn from an examination of the most recent IRPs from the state’s two largest electric utilities. The Dominion IRP also includes descriptions of its two recently approved solar energy demonstration programs:
Solar Partnership Program: In this program the company would enter into agreements, similar to a power purchase agreement (PPA), to install up to 13 MW (DC) of company-owned solar installations on rooftops and other space leased from customers in the service area. This program is already underway and the company expects to complete these installations by the end of 2016.65
65 Dominion Virginia Power, 2014. p. 116.
Analyzing the Costs and Benefits of Distributed Solar Generation in Virginia p. 23
Solar Purchase Program: In this program the company would purchase up to 3 MW (DC) of energy output from customer-owned DSG installations. As an alternative to NEM, Dominion would purchase all of the energy output from participating customer-generators, at a fixed price of $0.15/kWh, which includes the purchase of “all environmental attributes and associated [renewable energy credits (RECs)].”66
Dominion’s 2014 IRP does not explicitly account for any customer-owned DSG, aside from that included in the Solar Purchase Program demonstration project described above. The IRP’s base plan includes the 13 MW of utility-owned solar from the Solar Partnership Program described above, about 3.5 MW of which is either already completed or scheduled for completion in 2014 (see discussion of these projects in Section 1.3). The base plan includes an additional 200 MW of “solar NUG” power purchase agreement installations, but these would all be located in the North Carolina portion of the utility’s service area.67
The IRP also describes various alternative plans, which “represent plausible future paths considering the major drivers of future uncertainty.”68 Regarding this uncertainty, the IRP states that “the Company believes the low or zero-emission components combined with reducing reliance on a single fuel for future expansion addressed in the Fuel Diversity Plan will likely be needed, by both the Company and its customers.”69 This Fuel Diversity Plan includes 39 MW of “solar tag,” or utility-owned PV systems installed at existing generation facilities, and another 520 MW of “additional solar development.” However, the plan does not specify if this additional solar would be utility- or customer-owned or if it would be located in Virginia or North Carolina.70
The IRP also describes a Renewable Plan and an EPA GHG Plan, the latter of which “is designed as one possible path that the Company could take to comply with the proposed EPA GHG regulations on carbon emission standards for electric generating units.” Both of these plans include the aforementioned 39 MW of solar tag, plus 1,300 MW of "generic solar," again without specifying if this additional solar would be utility- or customer-owned or if it would be located in Virginia or North Carolina.71
APCo has not made any investments thus far in utility-owned solar PV, but its 2014 IRP does assume 18 MW per year of new “utility-scale” solar energy capacity within its service area, beginning in the year 2019. The IRP projection ends with 180 MW of utility-scale solar energy by the year 2028. Unlike Dominion’s plans, the APCo IRP does include explicit figures for distributed solar power in its “preferred plan,” starting with 0.5 MW in 2015 and increasing
66 Ibid., p. 72. 67 Ibid., p. AP-85. 68 Ibid., p. 88. 69 Ibid., p. xii 70 Ibid., p. 5. 71 Ibid., p. 96, 97.
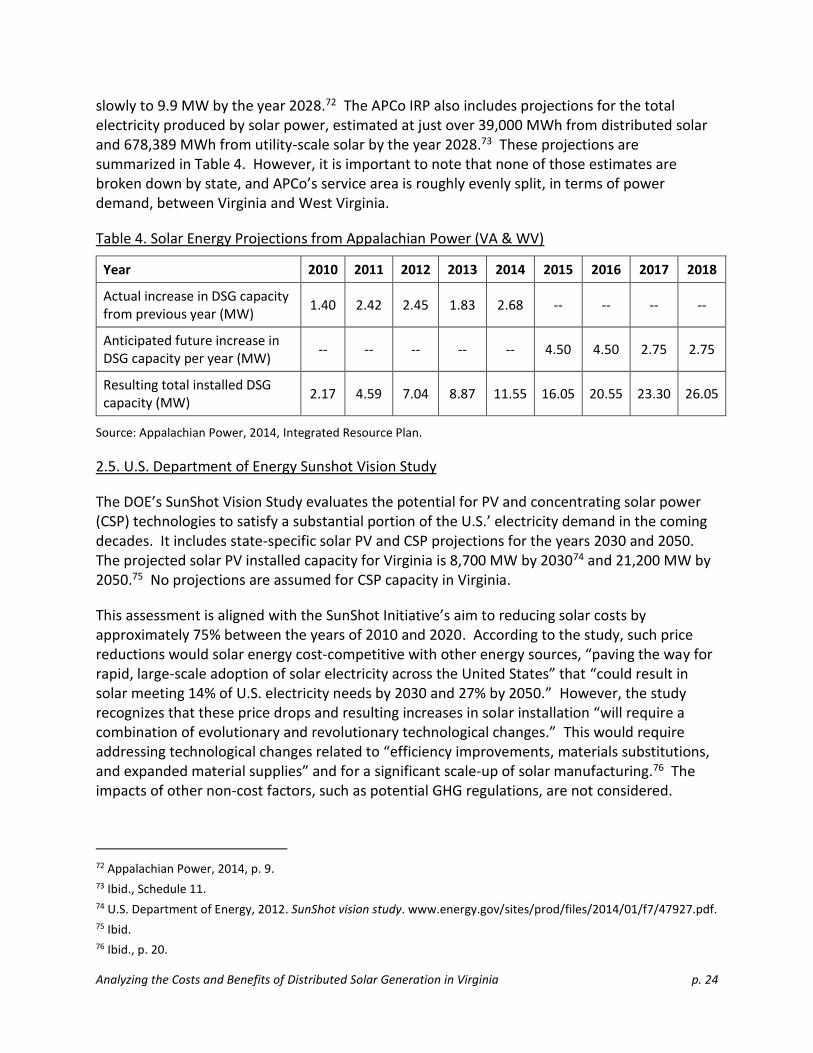
Analyzing the Costs and Benefits of Distributed Solar Generation in Virginia p. 24
slowly to 9.9 MW by the year 2028.72 The APCo IRP also includes projections for the total electricity produced by solar power, estimated at just over 39,000 MWh from distributed solar and 678,389 MWh from utility-scale solar by the year 2028.73 These projections are summarized in Table 4. However, it is important to note that none of those estimates are broken down by state, and APCo’s service area is roughly evenly split, in terms of power demand, between Virginia and West Virginia.
Table 4. Solar Energy Projections from Appalachian Power (VA & WV)
Year 2010 2011 2012 2013 2014 2015 2016 2017 2018
Actual increase in DSG capacity from previous year (MW)
1.40 2.42 2.45 1.83 2.68 -- -- -- --
Anticipated future increase in DSG capacity per year (MW)
-- -- -- -- -- 4.50 4.50 2.75 2.75
Resulting total installed DSG capacity (MW)
2.17 4.59 7.04 8.87 11.55 16.05 20.55 23.30 26.05
Source: Appalachian Power, 2014, Integrated Resource Plan.
2.5. U.S. Department of Energy Sunshot Vision Study
The DOE’s SunShot Vision Study evaluates the potential for PV and concentrating solar power (CSP) technologies to satisfy a substantial portion of the U.S.’ electricity demand in the coming decades. It includes state-specific solar PV and CSP projections for the years 2030 and 2050. The projected solar PV installed capacity for Virginia is 8,700 MW by 203074 and 21,200 MW by 2050.75 No projections are assumed for CSP capacity in Virginia.
This assessment is aligned with the SunShot Initiative’s aim to reducing solar costs by approximately 75% between the years of 2010 and 2020. According to the study, such price reductions would solar energy cost-competitive with other energy sources, “paving the way for rapid, large-scale adoption of solar electricity across the United States” that “could result in solar meeting 14% of U.S. electricity needs by 2030 and 27% by 2050.” However, the study recognizes that these price drops and resulting increases in solar installation “will require a combination of evolutionary and revolutionary technological changes.” This would require addressing technological changes related to “efficiency improvements, materials substitutions, and expanded material supplies” and for a significant scale-up of solar manufacturing.76 The impacts of other non-cost factors, such as potential GHG regulations, are not considered.
72 Appalachian Power, 2014, p. 9. 73 Ibid., Schedule 11. 74 U.S. Department of Energy, 2012. SunShot vision study. www.energy.gov/sites/prod/files/2014/01/f7/47927.pdf. 75 Ibid. 76 Ibid., p. 20.

Analyzing the Costs and Benefits of Distributed Solar Generation in Virginia p. 25
3. Recommended Methodologies for Evaluating the Value of Solar Energy in Virginia
The SSG presents three different approaches that future VOS studies in Virginia may adopt, depending on the time-frame that it is intended to cover, and range of direct and indirect impacts to be addressed. Each approach would examine some combination of the 13 core VOS variables, which together represent all of the known or potential costs and benefits of DSG to utilities, ratepayers, and society. The individual variables are described in greater detail in Section 4 of this study.
The narrow approach focuses on the short-term, direct impacts of DSG, and addresses the seven core VOS variables for which those direct short-term impacts can be measured (avoided energy, generation capacity, transmission, distribution, carbon emissions, other air pollutants, and water). The intermediate approach also focuses on direct impacts only, but examines them over both the short-term and long-term and includes the additional variables of economic development, fuel price volatility, and reliability risk. The broad approach addresses both direct and indirect impacts over both short and long terms, and includes three additional variables for which costs and benefits would likely only occur at high penetration levels. All three approaches would analyze the levelized costs and benefits over a 30-year period, reflecting the anticipated lifespan of a solar energy generation facility.
All VOS studies should be based on clear, justifiable assumptions about the level of DSG penetration anticipated within the study period. This is important because certain variables have measurable costs and benefits even at low penetration levels, while others are only likely to have cost/benefit impacts under a high-penetration scenario. However, the assumed level of penetration does not necessarily correlate with any of the methodologies described below (i.e., the narrow methodology does not necessarily assume low levels of DSG penetration, nor does the broad methodology necessarily assume high penetration).
The three methodologies are described in more detail on the following pages. Table 5 summarizes how each variable is addressed under the various methodologies.
3.1. Narrow Methodology for VOS Evaluation in Virginia
The narrow methodology concentrates on the VOS variables that have direct, measurable impacts on utility operations and ratepayers in the short-term. This method quantifies the costs and benefits of DSG related to avoided energy, generation capacity, transmission, and distribution (see detailed discussions of each variable in section 4). All of these variables were evaluated in the prior VOS studies completed by the Virginia SCC, and/or other recent SCC dockets. The narrow methodology also accounts for the cost of compliance with existing or currently proposed environmental regulations, as those are assumed to be built into the market price of energy that is factored in the avoided cost variable.

Analyzing the Costs and Benefits of Distributed Solar Generation in Virginia p. 26
Table 5. Summary of Recommended Virginia Value of Solar Methodologies
VOS Variable Category Narrow Intermediate Broad
Avoided energy Energy /
Grid √√ √√ √√
Generation capacity Energy /
Grid √√ √√ √√
Transmission Energy /
Grid √√ √√ √√
Distribution Energy /
Grid √√ √√ √√
Carbon emissions Enviro /
Econ √√ √√ √√√
Other air pollutants Enviro /
Econ √√ √√ √√√
Water impacts Enviro /
Econ √√ √√ √√√
Economic development Enviro /
Econ √√ √√√
Fuel price volatility Risk √ √√√
Reliability risk Risk √ √√
Market price response Risk √√√
Land impacts Enviro /
Econ √√√
Ancillary services Energy /
Grid √√
Note: a single √ indicates that the potential impacts of a variable are discussed but not quantified; a double √√ indicates that the direct impacts of the variable are quantified; and a triple √√√ indicates that both direct and indirect effects of a variable are quantified.

Analyzing the Costs and Benefits of Distributed Solar Generation in Virginia p. 27
3.2. Intermediate Methodology for VOS Evaluation in Virginia
The intermediate methodology focuses on direct cost/benefit impacts of DSG to ratepayers and society, but examines them over both the short- and long-term. This approach would employ a slightly more inclusive perspective than the narrow methodology, anticipating how potential changing market, policy, and technology conditions could impact the costs and benefits of DSG when levelized over a given time period. It would also be a bit more comprehensive, as it begins to address risk concerns and environmental and economic benefits that are not addressed or by the narrow methodology.
The intermediate methodology addresses measurable utility-specific impacts in much the same manner as the narrow methodology, but builds on the analysis in several key ways. First, analysis of avoided energy costs is based on levelized 30-year price projections. Analyses of capacity, transmission, and distribution impacts are based on 15-year demand and cost projections, consistent with the utilities’ IRPs.
The intermediate category also begins to address risk-related variables, specifically the potential benefits to utilities from the mitigation of fuel price volatility and improved grid reliability (i.e., “reliability risk”). For the environmental variables, the intermediate methodology would expand on the narrow approach by taking into account risk associated with potential future regulations that aren’t currently on the utilities’ balance sheet. Under economic development, this methodology would quantify the value of job creation and related direct economic benefits associated with DSG deployment.
3.3. Broad Methodology for VOS Evaluation in Virginia
The broad methodology reflects a more comprehensive approach for evaluating the full range of long-term costs and benefits of DSG to utilities, ratepayers, and society at large. This approach would include the direct utility impacts of DSG (avoided energy, generation capacity, transmission, and distribution) in the same manner as the intermediate methodology, but would also evaluate DSG’s potential grid support and ancillary services impacts for utilities.
In the category of risk-related variables, it would expand on the intermediate methodology by quantifying in dollar terms DSG’s impact on fuel price volatility, and market price response. It would also address the potential indirect benefits experienced by natural gas consumers (i.e., those who consume gas for space heating, water heating, or commercial/industrial purposes).
In the environmental categories, the broad methodology would add additional analysis of the indirect social benefits of DSG stemming from reduced carbon, criteria air pollutants, and water quality impacts. It also would consider the impacts of DSG on land prices and tax revenue, as well as indirect economic development costs and benefits that could result from increased deployment of DSG. These are sometimes referred to as “non-energy benefits” (NEB).

Analyzing the Costs and Benefits of Distributed Solar Generation in Virginia p. 28
4. Recommended Approaches and Data Sources for Value of Solar Variables
This section presents the SSG’s recommended approaches to estimating the costs and benefits of DSG associated with each of 13 VOS variables. These variables were identified primarily by reviewing previous VOS reports, but the SSG diverged from existing studies where necessary to refine the list of variables and ensure that they adequately cover all relevant costs and benefits associated with DSG. The methods of analyzing each variable were also drawn initially from the body of prior research on this issue, but the SSG again refined the approach where necessary to accurately assess costs and benefits in the Virginia context. The approaches and data sources outlined in this section are intended to capture all direct and indirect costs and benefits of DSG to utilities, ratepayers, and the general population.
As noted above, the variables can generally be divided into three categories:
Energy, Capacity, and Grid Support Services: avoided energy, generation capacity, transmission, distribution, and grid support / ancillary services
Financial Risk and Reliability Risk: fuel price volatility, market price response, and reliability risk
Environmental and Economic Development: carbon emissions, other air pollutants, water, land, and economic development
The descriptions below follow a similar format, beginning with an explanation of the basic principle of how DSG presents costs and/or benefits related to the respective variable. Each section then describes how the variable has been approached in other VOS studies and identify sources of data and information that can be used to estimate the costs and benefits of DSG for that variable in Virginia. This is followed by a discussion of how each variable would be influenced by different penetration levels, time periods, and potential technological or market changes. Finally, each description identifies how the variable would be addressed under the SSG’s recommended narrow, intermediate, and broad VOS methodologies as listed in Section 3.
4.1. Avoided Energy
Avoided energy is the most routine and straight-forward variable included in VOS studies. The purpose of this variable is to quantify the avoided cost of utility generating or purchasing of electricity that is instead supplied by DSG systems. The value of avoided energy is directed by the variable costs of the marginal generation being displaced. This marginal value would be very small at times of low demand when power is primarily provided by baseload units, which are large, centralized generation facilities (typically nuclear or coal-fired) that run all of the time and are difficult to turn on and off. However, most DSG output occurs in the middle of the day,77 meaning that the power displaced would come from “intermediate” plants used to meet regularly occurring demand increases (generally in the afternoons and early evenings) beyond
77 Reno, Broderick, & Grijalva, 2013. Smart inverter capabilities for mitigating over-voltage on distribution systems
with high penetrations of pv. http://energy.sandia.gov/wp/wp-content/gallery/uploads/2013_PVSC-VoltVar.pdf.

Analyzing the Costs and Benefits of Distributed Solar Generation in Virginia p. 29
that which can be provided by baseload facilities78 These intermediate plants are more easily dispatchable (i.e., able to turn on and off), and are often natural-gas fired.79 At times of extremely high power demand (e.g., hot summer afternoons), DSG could replace “peaking” plants, which can include plants powered by a variety of fuels, many of which are particularly high polluting.80 In short, DSG displaces the last unit dispatched, which is often a natural gas generation facility, but could be a coal, oil, or nuclear plant.
In addition to the avoided cost of the fuel, several VOS reports also include variable operation/ maintenance costs or projected carbon costs within this value category.81 Another consideration in this realm is the supplementary energy “that would have been generated but [is] lost in delivery due to inherent inefficiencies in the transmission and distribution system.”82 This is typically accounted for using a multiplier that converts the amount of electricity from DSG into a slightly higher total (e.g., 7-8% more).83 This higher amount represents the centralized generation that would have been necessary to meet the demand displaced by DSG, accounting for line losses.
Beyond these line losses, other key factors of the avoided energy variable are heat rates84 and fuel price forecasts, which are included in every VOS study conducted thus far. Natural gas prices are most often calculated based on U.S. EIA market price projections or New York Mercantile Exchange (NYMEX) futures prices. A few VOS reports calculate avoided energy value within a sample year,85 while others have calculated this as a levelized cost over a twenty- or thirty-year period.86
The recommended SSG approach is to create a weighted average avoided energy price using hourly PJM Locational Marginal Price (LMP) data, weighted by the NREL PV Watts hourly solar generation profiles. Each hourly LMP data point over a twelve month period should be multiplied by the corresponding PV Watts projected output for that hour. All 8,760 results (products of price times output for each hour) should be summed up and divided by the total PV Watts projected output for all 8,760 hours. The resulting weighted average price for the latest twelve months should then be projected out into the future using the escalation factor
78 R.W. Beck, for Arizona Public Service, 2009. Distributed renewable energy operating impacts and valuation study.
http://www.solarfuturearizona.com/SolarDEStudy.pdf. 79 Ibid. 80 Contreras, Frantzis, Blazewicz, Pinault, & Sawyer, Navigant Consulting, for the National Renewable Energy
Laboratory, 2008. Photovoltaics value analysis. http://www.eere.energy.gov/solar/pdfs/42303.pdf. 81 See: Beach & McGuire, Crossborder Energy, for Arizona Public Service, 2013. 82 Rocky Mountain Institute, 2013. p. 25. 83 See: Smeloff, 2005. Quantifying the benefits of solar power for California.
http://www.energycollection.us/Energy-Solar/Quantifying-The-Benefits.pdf. 84 The heat rate is the amount of energy used by a power plant or an electrical generator to generate 1 kWh of
electricity. 85 See: R.W. Beck, for Arizona Public Service, 2009.
86 See: Beach & McGuire, Crossborder Energy, for Arizona Public Service, 2013.

Analyzing the Costs and Benefits of Distributed Solar Generation in Virginia p. 30
implied by On-Peak futures prices for the relevant PJM zones. Natural gas futures prices should be used to project future prices escalation for years in which PJM On-Peak futures prices are not available.
The SSG also endorses the inclusion of on-going transmission and distribution losses as a multiplier to adjust the avoided energy total. The PJM energy pricing structure includes a simple metric representing the line losses from transmission, but not those from distribution. The analysis of T&D losses should take into account both summer and winter peak loads, recognizing that the state’s two largest utilities, Dominion and APCo, reach their annual peaks in the summer and winter respectively. Finally, the SSG recognizes that advances in storage technology could affect the type and price of avoided energy in future years.
The avoided energy category cost is a core element of any VOS calculation, and the SSG recommends that it be evaluated in the narrow, intermediate and broad VOS methodologies. The narrow methodology would be based on current avoided energy prices, but factoring in an inflation factor when calculating 30-year levelized costs. The intermediate and broad approaches would utilize levelized 30-year price projections, again accounting for future price inflation when calculating 30-year levelized costs. If high levels of DSG penetration are assumed then these price projections should take into account the potential market-price response associated with reduced fuel demand (see section 4.7).
4.2. Generation Capacity
The generation capacity category attempts to quantify the net value that a utility would potentially receive by postponing investments in new generation infrastructure as a result of expanded DSG deployment, minus any losses from stranded assets. In the short term, expanded deployment of DSG can save a utility money on the generation capacity portion of its PJM bills. Utilities pay PJM a fee for their share of system-wide capacity, based on their respective shares of system-wide peak demand, and thus a utility that reduces its share of peak demand can save money. As the PJM system reaches its peak demand in the summer, then these calculations are based on the utilities’ share of summer peak demand. Therefore, a winter-peaking utility such as APCo could still experience these savings by reducing its summer peak demand.
In the longer term, expanded DSG deployment could present cost savings by reducing the need to investment in new generation assets, particularly if DSG could be paired with energy storage technology. However, such a scenario could also create stranded-asset costs for utilities. If increased DSG were to materially reduce the output from existing generation, the owners of those generators would receive less revenue. In Virginia, utilities buy the output from their own plants in a vertically integrated monopoly, and if a power plant is no longer economically viable the SCC may allow the utility to recover the “stranded asset value” and pass this cost onto ratepayers. Either outcome – the benefit of offsetting future capacity investments or the cost of stranded capacity assets – is only realistic if DSG reaches a level of market penetration far higher than that allowed by the state’s current net metering law.

Analyzing the Costs and Benefits of Distributed Solar Generation in Virginia p. 31
Utilities also have concerns about shorter-term generation-related costs associated with DSG. Due to its intermittent nature, DSG without storage capability must be paired with back-up “dispatchable” generation that the utilities can turn on and off as needed in order to maintain an adequate reserve margin (i.e., an amount of generation capacity available above the maximum amount of demand anticipated). The need to maintain a dispatchable reserve margin may limit the extent to which DSG could displace current or future generation capacity.87 Additionally, if expanded DSG causes intermediate natural gas units to start and stop more than they would otherwise have to, then costs related to the reduced efficiency and increased wear and tear on those units should be considered. However, a study for PJM found these “cycling” costs for existing power plants to be small, and that they “did not significantly affect the overall economic impact of the renewable generation ” relative to the value garnered from fuel displacement.88
The generation capacity value for DSG is usually calculated based on the percentage of total solar output that is coincident with peak demand. This figure is often represented as the Effective Load Carrying Capacity (ELCC), and must be calculated for each utility service area. As an illustration, a study for PJM determined the ELCC for residential DSG to be at 57-58% using the most current technologies at optimal sites.89 In several other VOS studies, this value category has also included the avoided fixed operations and maintenance (O&M) costs or natural gas pipeline reserve fees linked with reduced capacity needs.90
The SSG recommends calculating the marginal generation capacity benefits of DSG using PJM’s Reliability Pricing Model, which establishes capacity prices based on a three-year market outlook.91 The NREL generation profile tool could be used to determine the amount of energy generated by DSG during PJM’s five coincident peaks (CP). The monthly avoided costs would then be calculated as the output for each of the five coincident peaks multiplied by the zonal capacity cost, measured in $/kW-month, and then averaged (i.e., divided by five). The value per MWh can then be calculated by adding the monthly avoided costs over a year and then dividing them by the full NREL projected annual output. Data from utilities’ IRPs could also be used to evaluate the value of capacity. Finally, because some Virginia utilities such as APCo are winter-peaking, VOS evaluation should look at the actual highest capacity on the utility’s system, not only summer peaks.
As with the avoided energy category, the SSG recommends evaluating generation capacity impacts throughout the narrow, intermediate and broad methodologies. The narrow methodology would be based on current capacity prices, but factoring in an inflation factor
87 Pacific Northwest National Laboratory, 2014. Duke Energy photovoltaic integration study: Carolinas service
areas. www.pnnl.gov/main/publications/external/technical_reports/PNNL-23226.pdf. 88 See: General Electric International, Inc., 2014. PJM renewable integration study.
http://pjm.com/~/media/committees-groups/task-forces/irtf/postings/pris-executive-summary.ashx. 89 Ibid. 90 See: Perez, Norris, & Hoff, Clean Power Research, 2012. 91 See: PJM, 2014. Reliability pricing model. http://www.pjm.com/markets-and-operations/rpm.aspx.

Analyzing the Costs and Benefits of Distributed Solar Generation in Virginia p. 32
when calculating 30-year levelized costs. The intermediate and broad approaches would utilize 15-year cost projections, based on the utilities’ IRPs, again accounting for future price inflation when calculating 30-year levelized costs.
4.3. Transmission
The transmission variable describes the avoided cost of building and maintaining new transmission infrastructure. These avoided costs are possible because DSG is produced at the site of electric loads and does not have to be routed through the entire grid system from a central location. As a Crossborder Energy report indicates, DSG “can avoid transmission capacity costs, but only to the extent that solar is producing during the peak demand periods that drive load-related transmission investments.”92
The potential transmission-related costs and benefits of DSG are very location-specific. For example, these benefits would be greater for DSG located in a transmission-constrained area than for DSG in an area with under-utilized transmission capacity. In the latter case there would be essentially no transmission value, as this value is dependent on the need for future transmission costs that could be displaced through DSG’s more localized energy production. That being said, it is possible that future investments of transmission capital could be deferred in a high DSG penetration scenario. The infrastructure most likely to be deferred would be that related to “intermediate” transmission, not the largest, highest-voltage transmission lines that carry energy over the longest distances.
As with the generation capacity variable described above, DSG deployment could help a utility save money on the transmission capacity portion of its PJM bill if the DSG reduced the utility’s share of system-wide summer-peak demand. These cost savings could be realized even if there are no bigger-picture system benefits related to transmission.
DSG is not likely to produce transmission-related costs, as solar energy installations of 5 MW or below are not going to be sited on the transmission system. Larger systems, sited on the transmission system, are outside the scope of this study. Such systems would be subject to interconnection studies and the system owners would have to share the costs of any necessary transmission upgrades.
Some VOS reports merely calculate a value for this category for certain segments of a utility area, estimating that levels of solar penetration in other areas would not be large enough to reduce the necessary transmission-related capacity.93 These other reports generally recognize that transmission infrastructure projects are characteristically location specific, and system age and use varies greatly. Therefore, the local needs and sizes of transmission infrastructure are reflected in the discrepancies among VOS reports, as are the differing rates of demand growth.
92 Beach & McGuire, Crossborder Energy, for the North Carolina Sustainable Energy Association (SEA), 2013. The
benefits and costs of solar generation for electric ratepayers in North Carolina. energync.org/assets/files/BenefitsandCostsofSolarGenerationforRatepayersinNorthCarolina.pdf. p. 5.
93 See: R.W. Beck, for Arizona Public Service, 2009.
Analyzing the Costs and Benefits of Distributed Solar Generation in Virginia p. 33
The SSG endorses determining transmission costs using peak energy demand values and the PJM transmission rate at the one coincident peak used by PJM to allocate the transmission costs. Virginia utilities’ forecasted transmission costs and peak demand projections can be used to determine long-term marginal transmission costs. Though it is not clear if transmission infrastructure could be deferred even at high DSG penetration levels, the SSG maintains that this category is a core component of any VOS calculation, and thus recommends including it across all methodologies. The narrow methodology would be based on current transmission prices, whereas the intermediate and broad approaches would utilize 15-year transmission cost projections from the utilities’ IRPs.
4.4. Distribution
Much like transmission, DSG can help avoid the cost of building and maintaining new distribution infrastructure. When electricity produced by DSG systems is consumed on-site, this reduces the strain on the distribution grid. However, DSG can create operational issues for utilities when they return power back to the distribution grid. The SSG contends that distribution should be evaluated separately from transmission because of the different peaking times of distribution circuits, the circumstantial and location-specific nature of DSG, and the fact that utility IRPs often only project three to five years in the future, making longer term projections problematic.94
Previous VOS studies have utilized a variety of techniques to assess distribution costs and benefits, and have identified at least a moderate amount of avoided capacity-related distribution costs as a result of DSG deployment. The impacts of DSG on the distribution system are very location-specific, and depend largely on the characteristics of the individual circuit feeder on which a DSG system is located. New DSG capacity located in a concentrated area of growing loads can allow a utility to avoid capital investments in distribution equipment such as substations and lines.95
The distribution benefit of DSG is largely dependent on PV generation occurring around the time of local distribution peaks. Prior studies have noted that the distribution benefit is greater when DSG is located on circuits that primarily serve commercial loads, which have daily demand peaks in the afternoon, closer to the time of peak PV output.96 However, if the circuit in question is winter-peaking then DSG will have very little impact, as DSG output would not coincide with the peak strain on that circuit. Likewise, if demand on that circuit is not growing, and capacity upgrades are not anticipated, then DSG would not defer any future capital costs.
Most net-metered DSG systems are sized so that, on balance, more of their energy is consumed on site than returned to the grid. However, at times when residential loads are low, such as in the spring and fall when neither heating nor cooling is required, a greater portion of DSG produced electricity is returned to the grid. In many cases, excess generation would be 94 Beach & McGuire, Crossborder Energy, for the North Carolina SEA, 2013. p. 5. 95 Perez, Norris, & Hoff, Clean Power Research, 2012. 96 Keyes & Rabago, Interstate Renewable Energy Council, 2013.

Analyzing the Costs and Benefits of Distributed Solar Generation in Virginia p. 34
consumed at neighboring locations on a given circuit, prior to reaching the nearest sub-station, involving less distribution impact. However, a concentration of DSG on a given distribution circuit could, in theory, require a utility to invest in new system upgrades to accommodate the variability of DSG generation. Distribution impact concerns are greater when DSG is located on long circuits with low power demand, such as in rural areas.
Utilities can also avoid short-term distribution costs by simply disallowing interconnection in areas where DSG system would require grid upgrades. Or, they can pass those costs on to the DSG system owner, as utilities can require the developer of a new resource to pay for any needed system upgrades before allowing the system to be interconnected to the grid.
DSG deployment can also help a utility save money on the distribution portion of its PJM bill if the DSG reduced the utility’s share of system-wide summer-peak demand. These cost savings could be realized even if no bigger-picture distribution system benefits are realized.
The SSG recommends that future VOS studies obtain utility data on planned distribution system upgrades, to evaluate the potential to defer those investments with increased DSG penetration. To the extent possible, utilities should also provide data on the current excess generation from installed DSG (both customer and utility-owned), which can be used to determine the impact of power flowing back on the grid from PV systems. Though the potential impacts on distribution from higher penetration levels are not clear, and they could result in a net cost or net benefit, the SSG believes that there will be no effect at low penetration levels.
The SSG once again considers the distribution category to be a key feature of any VOS calculation, and it should be addressed in each methodology. The narrow methodology would be based on current distribution prices, whereas the intermediate and broad approaches would utilize 15-year distribution cost projections from the utilities’ IRPs.
4.5. Grid Support and Ancillary Services
This variable encompasses an assortment of potential ancillary benefits to the electric grid as a result of increased DSG deployment. While prior VOS reports generally agree that increased DSG deployment could help to support grid operations, the elements included in this variable vary greatly. Generally speaking, these ancillary grid support services include the following: reactive supply and voltage control; regulation and frequency response; energy and generator imbalance; synchronized and supplemental operating reserves; and scheduling, forecasting, and system control and dispatch.
Ancillary benefits potentially include avoided service costs to a utility provider, as well as reliability standards requirements. For instance, load reductions as a result of DSG could reduce a utility’s requirements to obtain and appropriate operating reserves. The benefit of such avoided service needs is addressed by a number of prior VOS studies, though several others cite costs associated with DSG’s need for additional grid support services. In Virginia, utilities could save money on PJM bills from reducing peak demand, even if there are no real operational savings. This is due to the fact that utilities pay PJM a fee for their share of system-

Analyzing the Costs and Benefits of Distributed Solar Generation in Virginia p. 35
wide capacity. DSG may also provide benefit via voltage regulation and support, particularly considering the recent advancements in inverter technologies. However, any grid support benefit would likely require high solar penetration and/or energy storage, which, in turn, has its own costs.
Previous VOS studies have come to differing conclusions about the extent to which DSG either decreases or increases the need for grid support services, but agree that the overall impact is likely marginal. Previous studies “generally focus on methods for calculating changes in necessary operating reserves, and less precision or rules of thumb are applied to the remainder of [ancillary services], such as voltage regulation.”97 The value associated with grid support services also varies based upon electricity market structures, the timing and penetration of DSG in reference to system peaks, and the existing generation mix within an area.
The SSG recommends basing this grid support services value on the PJM bill average for the last three to five years. The PJM bill for the utilities includes charges for these costs. These costs can be summed up and normalized per MWh.
Grid support services represent a relatively minor element of the VOS calculation, with little to no effect at low DSG penetration levels. Even at higher penetration levels, benefits could be negligible. Some of the potential ancillary benefits would require improved inverters and/or storage technology. As such, the SSG recommends only addressing grid support services as part of the broad VOS methodology.
4.6. Fuel Price Volatility
Fuel price volatility refers to the value a utility provider receives by obtaining DSG at a fixed price, rather than relying on relatively volatile natural gas prices. Most existing VOS reports represent this variable as a “fuel price hedge,” and calculate it based on the difference between natural gas market price projections and NYMEX natural gas futures prices for the same time period. Instead of calculating this value separately, some VOS studies simply use the higher NYMEX futures prices in their initial avoided energy valuation, disregarding the lower market price projections.
Prior VOS studies have typically quantified this category by computing the cost of a risk mitigation investment that could provide price surety for future fuel purchases.98 For instance, a utility provider could set aside the whole fuel cost obligation up front, investing the dollars into a risk free instrument while entering into natural gas futures contracts for future gas needs. Performing this calculation for each year that DSG operates isolates the risk premium and provides the value of the price hedge of avoiding purchases involving that risk premium.99 One method of calculating the fuel price volatility benefit would be based on the value of a call option for natural gas. One can compute the volume of natural gas needed to produce a MWh
97 Rocky Mountain Institute, 2013. p. 33. 98 Jones & Norris, Solar San Antonio and Clean Power Research, 2013. 99 Perez, Norris, & Hoff, Clean Power Research, 2012.

Analyzing the Costs and Benefits of Distributed Solar Generation in Virginia p. 36
of electricity, based on an average heat rate, and then determine the value that quantity through a call option on natural gas.
The SSG agrees that natural gas is the primary fuel that would be considered for the fuel price volatility variable. But rather than simply considering financial mechanisms to hedge against rising fuel prices, the SSG recommends looking in a broader sense at the various actions that utilities take to reduce the risk associated with natural gas price volatility. Increased natural gas demand resulting from the EPA’s proposed CO2 regulations and its changing price relative to coal could also increase the potential for natural gas price spikes. Furthermore, if DSG did help stabilize natural gas prices, by reducing demand, consumers who use natural gas for home heating and other purposes would also benefit.
The SSG agrees that DSG will have little to no effect on fuel price volatility at low penetration levels, but may be relevant at higher penetration levels. The SSG recommends discussing potential direct impacts as part of the intermediate methodology and calculating both direct and indirect impacts in the broad methodology.
4.7. Market Price Response
The market price response category evaluates the ability of DSG penetration to affect the market price of traditional fuels used for power generation, potentially demand for fossil fuels, thereby reducing fuel for a utility provider and reducing revenues and profits for resource extraction firms. In turn, ratepayers may experience lower electricity prices. Previous VOS studies have quantified market price response via an investigation of the supply curve and the subsequent reduction in demand. Such analyses first address direct savings, based on “the value of energy provided at the market price of power.”100 They also factor in indirect benefits resulting from reduced market demand, which can create “lower prices to all those purchasing power from the market.”101 The IREC meta-analysis argues that these price reductions cannot be measured directly, as they are based on a counterfactual of what the price would have been without load reductions. Therefore they must be modeled, with the total value of market price reductions calculated as the sum of savings over time.102
However, natural gas prices are impacted by a wide variety of supply and demand factors beyond the electricity market, including direct consumption for heating, vehicles, or industrial purposes, exports, pipeline constraints, and a host of other factors beyond the scope of this study. The SSG agrees that due to the complexity of the natural gas market the “market price response” from DSG is likely negligible even in very high penetration scenarios.
The SSG recommends incorporating future natural gas price assumptions when calculating the avoided energy cost variable, rather than calculating market price response as a separate
100 Ibid., p. 33, 34.
101 Ibid., p. 34.
102 Keyes & Rabago, Interstate Renewable Energy Council, 2013.

Analyzing the Costs and Benefits of Distributed Solar Generation in Virginia p. 37
benefit. Additional indirect societal benefits from the market price response, such as reduced prices for other natural gas consumers, should be considered in the broad methodology only.
4.8. Reliability Risk
The reliability risk variable reflects DSG’s potential to improve grid reliability via reducing outages and congestion along the transmission and distribution network, increasing the diversity of the generation portfolio, and providing back-up power sources available during outages through the combination of PV, control technologies, inverters and storage.103 This variable has been calculated as the value of avoided outages based on the total cost of power outages to the U.S. each year and the ability of DSG to decrease the incidence of such outages.
A common theme among previous VOS studies that the financial impact of outages is not necessarily paid by ratepayers, but by society at large via lost economic activity, associated tax impacts, insurance premiums, etc. Often, the value of DSG in increasing power availability during outages can only be realized if DSG is coupled with storage and equipped with the capability to “island” itself from the grid (perform isolated or disconnected) during a power outage, features which come at additional capital costs. Some VOS studies employ the ancillary services benefit variable as a proxy for grid reliability, as the variables are closely related.104
The SSG believes that the reliability benefit of DSG is location specific and that “islanding” of DSG offers the best potential for a measurable reliability value. Otherwise, in conventional distributed solar situations, grid-connected solar arrays are inoperable when the grid is down, due to a safety feature that automatically disconnects the system to protect electrical workers repairing lines.
Additional reliability value may be possible with the advent of increased storage and improved inverter technology that would allow DSG to play a greater role as a back-up source of power in the event of a power outage. However, this would bring additional costs to be borne by either the system owner or the utility.
The SSG recommends discussing potential reliability risk impacts as part of the intermediate methodology and calculating them in the broad methodology, recognizing that potential benefits will only start to occur at higher DSG penetration levels. The SSG also notes that the grid reliability benefits of DSG could be improved with advances in technology (inverters, controls, storage, etc.).105
103 Rocky Mountain Institute, 2013. 104 Keyes & Rabago, Interstate Renewable Energy Council, 2013. 105 See: Clean Energy States Alliance, 2014. “CESA Announces Innovative Solar + Storage Microgrid Project in
Vermont.” http://www.icontact-archive.com/Wl8Nti6_rrTLiBSy-iZkzXGBANc_qFdT?w=4.

Analyzing the Costs and Benefits of Distributed Solar Generation in Virginia p. 38
4.9. Carbon Emissions
Carbon emissions are one of the most widely discussed variables in VOS studies. Reducing carbon emissions has the direct benefit of lowering utilities’ cost of compliance in locales where they are subject to GHG carbon taxes or GHG emissions standards. While neither is currently the case in Virginia, the EPA’s proposed CO2 regulations would, if enacted, represent a compliance mandate with associated costs for utilities operating in Virginia. The final rules are expected to be issued in June 2015, followed by a period of time in which states would develop and implement plans. Additionally, reducing carbon emissions would have societal benefits by mitigating the impacts of climate change on human health, the environment, and the economy.
The EPA has estimated the cost of compliance with these new regulations by comparing the modeled system costs with and without the proposed regulations. The EPA model looks at capital costs for both new and retrofitted power plants, fixed and variable operations costs, fuel costs, fuel transportation and storage costs, and the costs of energy efficiency implementation. The EPA analysis found that these rules would actually save money for Virginia utilities in the first couple of years, largely due to the displacement of new power plants that would otherwise be built. In subsequent years, however, the cost of energy efficiency implementation to meet the CO2 regulations would increase, leading to net costs of $22 million in 2020, $472 million in 2025, and $1.1 billion in 2030.106
Prior to the release of the proposed EPA several VOS studies had quantified the avoided cost of carbon regulations. Most calculate it as a function of “the emission intensity of [the] displaced marginal resource and the price of emissions.”107 Under this approach, the value of the carbon emissions benefit would be the product of the cost per ton of pollutant and the emissions rate of that pollutant in tons per MWh produced. Other studies have derived a value for this category based on the benefits received due to the avoided environmental damage caused by carbon emissions.108 Alternatively, some VOS studies have incorporated carbon value into the avoided energy category.109 Finally, some studies do not include a carbon value whatsoever. On average, the studies that evaluate carbon reductions find that they can increase the value of DSG by over two cents/kWh.110
The SSG recognizes that DSG could provide direct financial benefits to utilities through avoided compliance costs associated with the potential new EPA CO2 regulations, as well as broader societal benefits from the mitigation of climate change impacts and reduction of fossil fuel dependence. The SSG recommends that upon implementation of 111(d) the assessment of carbon benefits should use carbon auction prices from the Regional Greenhouse Gas Initiative
106 Environmental Protection Agency, 2013. Clean Power Plan compliance costs model.
http://www2.epa.gov/sites/production/files/2014-06/20140602tsd-ghg-abatement-measures-scenario1.xlsx. 107 Rocky Mountain Institute, 2013. p. 17.
108 See: Navigant Consulting Inc., for NV Energy, 2010.
109 See: Beach & McGuire, Crossborder Energy, for Arizona Public Service, 2013.
110 Rocky Mountain Institute, 2013.
Analyzing the Costs and Benefits of Distributed Solar Generation in Virginia p. 39
(RGGI) in the northeast U.S. This price is currently around $3–$5 per ton of CO2.111 Future calculations for the actual cost of compliance should be based on whatever final compliance strategy is adopted in Virginia. The SSG also recommends valuing the broader societal benefits using the EPA’s Social Cost of Carbon estimate, which is currently $39/ton of CO2.112
The SSG recommends calculating carbon emissions in each of the three VOS methodologies. The narrowest method should address the costs of compliance with EPA regulations, assuming they are enacted. However, once the regulations are thoroughly established, those compliance costs are likely to be built into the market price of energy, and will be naturally incorporated as part of the avoided energy cost variable. In the intermediate methodology, solar valuation could be measured by regional carbon trading market rates. Finally, broader social and health benefits should be counted in the broad methodology.
4.10. Other Air Pollutants
Increasing DSG resources may also have an impact on other air pollutants beyond carbon emissions. Chief among these are the “criteria” air pollutants regulated under the CAA due to their impact on the environment and human health, including sulfur dioxide (SO2), nitrogen oxides (NOx), and particulate matter. Fossil fuel consumption is the primary source of these criteria air pollutants, as well as other toxic air pollutants (e.g., mercury) also regulated by the EPA. Air pollution has traditionally been most problematic in Northern Virginia, but air quality is improving there and the EPA recently redesignated the region as in attainment of federal National Ambient Air Quality Standard (NAAQS) for particulate matter (PM2.5).113 The region is now only in non-attainment for the 8-hour ozone NAAQS.114 Several other regions in Virginia are required to maintain an 8-hour Ozone Maintenance Plan based on past non-attainment for that pollutant. These 10-year maintenance periods are all scheduled to end in 2015 or 2016.115
DSG can provide benefits by offsetting energy that would otherwise be produced by fossil-fuel power plants that produce these air pollutants. This benefit is particularly valuable on days of high electricity demand, when DSG could offset peaking power plants that are often among the most highly polluting generation facilities. The EPA has produced peer-reviewed analyses on
111 Potomac Economics. Prepared for: RGGI, Inc., on behalf of the RGGI Participating States, 2014. Market monitor
report for auction 24. www.rggi.org/docs/Auctions/24/Auction_24_Market_Monitor_Report.pdf. 112 Environmental Protection Agency, 2013. Fact sheet: Social cost of carbon.
http://www.epa.gov/climatechange/Downloads/EPAactivities/scc-fact-sheet.pdf. 113 Federal Register, 2014. Volume 79, Number 193. Approval and Promulgation of Air Quality Implementation
Plans; District of Columbia, Maryland, and Virginia. http://www.gpo.gov/fdsys/pkg/FR-2014-10-06/html/2014-23624.htm.
114 Environmental Protection Agency, 2014. Green book: Current nonattainment counties for all criteria pollutants. http://www.epa.gov/oaqps001/greenbk/ancl.html.
115 Virginia Department of Environmental Quality, 2014. Ozone and PM2.5 Regional Planning Activities. http://www.deq.virginia.gov/Programs/Air/AirQualityPlans/OzoneandPM25RegionalPlanningActivities.aspx.
Analyzing the Costs and Benefits of Distributed Solar Generation in Virginia p. 40
CAA costs and benefits,116 and the EPA’s analysis of the proposed carbon regulations also includes estimates of the value of reduced criteria pollution.117
The RMI report discusses two potential methods of estimating the value of criteria pollutant reductions. One approach would be based on “the compliance costs of reducing pollutant emissions from power plants”118 while the other would estimate the costs of medical expenses and other damages and assess society’s willingness to pay for reducing those threats.119 However, few preceding VOS studies have actually calculated the cost of criteria air pollutants on a per kWh basis, and the ones that have typically estimate its impact via a combined environmental value, primarily reflecting the avoided health care costs and property damages from reduced levels of air pollution.120,121 For example, a study by Crossborder Energy for Arizona Public Service estimated the value to be $0.365/MWh or less than four one-hundredths of a cent per kWh.122 Other estimates have ranged as widely as $0.20/MWh to $14/MWh.123
One of the most important benefits of DSG is that its output is often highest during times of peak electricity demand, sometimes referred to as High Electricity Demand Days (HEDDs). Some of the highest levels of air pollution on the East Coast occur at these times. Therefore, DSG has the potential to offset not only the average emissions rate over the course of the year, but also the higher emission rates associated with oil and gas-fired units that operate during HEDDs. Consequently, the use of average emission rates may underestimate the value of solar to reduce air pollution.
The SSG recognizes that air pollution can cause numerous respiratory ailments, particularly for vulnerable populations (such as children and the elderly) and those living in the vicinity of fossil fuel-fired plants.124 Forests and agricultural yields may be impacted as well. While large particulate matter (PM10) was most often analyzed in VOS reports, the SSG recommends including small particulate matter (PM2.5), which has greater impact on human health concerns including asthma and other lung disease and is now addressed by CAA rules.
The SSG recommends using EPA E-grid data as the source of information on the extent of criteria air pollutants from Virginia utilities. National studies can be used to estimate the costs and benefits from reducing those pollutants. The air pollution benefit of DSG would then be 116 See: Environmental Protection Agency, 2011. The benefits and costs of the clean air act from 1990 to 2020.
www.epa.gov/air/sect812/feb11/fullreport_rev_a.pdf. 117 See: Federal Register, 2014. Carbon pollution emission guidelines for existing stationary sources: Electric utility
generating units. https://federalregister.gov/a/2014-13726. 118 Rocky Mountain Institute, 2013. p. 40. 119 Ibid., p. 40. 120 See: Perez, Norris, & Hoff, Clean Power Research, 2012. 121 See: Hoff, Perez, Braun, Kuhn, & Norris, Clean Power Research, 2006.
122 Beach & McGuire, Crossborder Energy, for Arizona Public Service, 2013. 123 See: Contreras, Frantzis, Blazewicz, Pinault, & Sawyer, Navigant Consulting, for the National Renewable Energy
Laboratory, 2008. 124 Keyes & Rabago, Interstate Renewable Energy Council, 2013.

Analyzing the Costs and Benefits of Distributed Solar Generation in Virginia p. 41
calculated as the cost per ton per pollutant times the emissions rate of that pollutant in tons per MWh produced.
The SSG recommends calculating the costs and benefits of DSG from criteria air pollution reduction as part of each of the three VOS methodologies. The narrowest method should address the costs of compliance with existing CAA requirements, which should already be incorporated into the market price of energy and can be addressed via the avoided energy cost variable. As with the carbon emissions variable, the intermediate methodology should consider the potential costs of complying with more stringent future regulations. Finally, additional societal benefits should be counted in the broad methodology.
4.11. Water
Nuclear, coal-fired, and some natural gas power plants all use vast amounts of water. Therefore, the decreased use of water for electric generation can be a potential environmental benefit of DSG. The displacement of fossil-fueled power by DSG would also bring additional indirect environmental benefits by reducing the water quality impacts of coal and natural gas extraction.
It should be noted that newer power stations often use less water due to different technology or site constraints.125 For example, the Virginia City Hybrid Energy Center uses one-tenth the water of a traditional coal plant.126 Additionally, some traditional generation stations (for example North Anna) are built on manmade lakes constructed to cool the power plant,127 which reduce impacts to natural water bodies but greatly increase the facility’s land footprint. Finally, new EPA regulations related to Section 316(b) of the Clean Water Act will likely lead to more use of closed cycle cooling and markedly less water usage.128
Previous VOS reports have discussed the water usage benefit in qualitative terms, focusing on the value of water to other sectors such as for agricultural, municipal, and recreational applications. The extent of this benefit can therefore be estimated based on “the differing water consumption patterns associated with different generation technologies,” and can be “measured by the price paid for water in competing sectors.”129 However, only the Crossborder
125 Sauer, Klop, & Agrawal, 2010. Over heating: Financial risks on water constraints on power generation in Asia.
http://pdf.wri.org/over_heating_asia.pdf. 126 Preston, McCalla, & Scudlarick, 2012. Dominion 585 MW Virginia city hybrid energy center: Project summary
and update. http://74.52.3.10/mirrors/www.cbi.com/Virtual-Power-Grid/pdfs/power_plants_pdfs/coal/technical_papers/VCHEC%20Project%20Update%20Final.pdf.
127 Energy Information Administration, 2010. Virginia nuclear profile. http://www.eia.gov/nuclear/state/2008/virginia/va.html.
128 Burns & McDonnell, 2014. Section 316(b) regulatory update. http://www.burnsmcd.com/Resource_/PressRelease/3224/FileUpload/Newsletter-316bUpdate-June2014.pdf.
129 Rocky Mountain Institute, 2013. p. 17.

Analyzing the Costs and Benefits of Distributed Solar Generation in Virginia p. 42
Energy report for Arizona Public Service explicitly quantified the benefit of water reduction, estimating this value to be approximately $1.084/MWh.130
The SSG agrees that DSG deployment can provide benefits by reducing the use of scarce water resources, and that there is a cost to society from any water impairment such as pollution or temperature change. This could be measured by determining water use per MWh and multiplying by the average price in Virginia for commercial water services, with future prices adjusted for inflation. The SSG recommends evaluating compliance costs stemming from new Clean Water Act Rules (Section 316(b)) affecting thermal power plants. As with carbon emissions, detailed estimates of those compliance costs can be made once a specific compliance strategy is implemented in Virginia. This EPA compliance should be included in all methods, and once the rules are fully implemented their cost can be assumed to be included in market energy prices. The broad methodology should also seek to evaluate more comprehensive health and societal benefits from DSG-related water savings.
4.12. Land
The land variable in VOS studies has three primary components, the most obvious of which is based on the land footprint required for different forms of energy generation and the ability of that land to theoretically be used for other purposes. Solar energy thus can have a land benefit if conventional generation sources are replaced with roof-mounted DSG systems. Conversely, larger ground-based solar arrays can have negative land impacts, given that they take require much more land per MW of power generation as compared to a conventional power. However, as noted above, some traditional generation stations such as the North Anna use manmade lakes for cooling,131 which greatly increase the facility’s land footprint while reducing negative impacts to natural water bodies. Ground-based arrays may also provide a land benefit if they are located on a brownfield or other location with limited development potential. With a number of such brownfield sites located in Virginia, this could be an opportunity to add value to otherwise unusable land. Regarding individual zoning, historic preservation, and related local decisions, the SSG assumes that best practices would be utilized to minimize these impacts from solar siting and placement.
The ecosystem benefits from such reduced land footprint can also be considered. This may include a slight environmental value associated with land that would have otherwise been used for conventional generation plants. More significant, however, would be the indirect ecosystem benefits associated with reduced coal and natural gas extraction as fossil-fuel generation is displaced by DSG.
The addition of DSG can also impact property values, as could, theoretically, the removal of conventional energy infrastructure due to high levels of DSG penetration. Estimates of solar PV’s impact on the resale value of on private property are beginning to emerge in research literature, and national realtors plan to add solar energy systems as a feature on their 130 Beach & McGuire, Crossborder Energy, for Arizona Public Service, 2013. 131 Energy Information Administration, 2010. Virginia nuclear profile.

Analyzing the Costs and Benefits of Distributed Solar Generation in Virginia p. 43
residential multiple listing service (MLS). Thus, if solar leads to increased resale values, the difference in price could be measured as a potential benefit. However, there are examples of solar leases reducing home resale value.132
Some VOS studies discuss a benefit of increased local tax revenue associated with the presumed property value increases. In Virginia, however, jurisdictions are no longer allowed to tax solar equipment.133
However, none of these potential land-related costs or benefits are typically addressed in VOS studies. While some reports do mention potential land costs and/or benefits associated with DSG deployment, none, thus far, have explicitly calculated those impacts. The SSG proposes to exclude potential land impacts within its narrow and intermediate methodologies, as significant prospective benefits are only likely in a high solar penetration scenario and sources of data to measure impact are only just emerging. Therefore, the possible land-related costs and benefits affiliated with DSG will be discussed as part of the broad methodology only.
4.13. Economic Development
Economic development impacts from DSG deployment represent one of the key variable categories in the most comprehensive of VOS studies. Most prior VOS reports find that DSG deployment can create local job opportunities for solar installers, leading to other spin-off economic activity. Additional job creation could emerge in the technical innovation, research, and manufacturing of solar modules and related support equipment in the electrical industry. The economic development variable can be measured in a variety of ways, including the number of jobs developed or displaced, tax revenues, and/or unemployment rates. The RMI report states that most VOS studies have used a multiplier to estimate job impacts and an average salary or tax revenue metric to estimate the value of the jobs created.134 However, there is significant variability in the range of job multipliers utilized by prior VOS studies. Another important caveat is that jobs may be created in areas different than where jobs are lost as a result of DSG. That is, some geographic regions could endure more costs than benefits as a result of any job market alterations.
A counterpoint sometimes offered by utilities is that solar installation jobs may be lower paying and have inferior benefits packages than jobs at traditional power stations. However, the SSG assumes that new job opportunities associated with the solar energy industry would not displace jobs at traditional plants unless DSG reaches a very high level of market penetration.
Relatively few studies have actually quantified the economic development benefits into a value per kWh included as part of the VOS calculation. One approach, demonstrated in a Clean
132 National Public Radio (NPR), July 15, 2014. “Leased Solar Panels can Cast a Shadow Over a Home’s Value.”
http://www.npr.org/2014/07/15/330769382/leased-solar-panels-can-cast-a-shadow-over-a-homes-value. 133 Virginia General Assembly Legislative Information System, 2014. “Senate Bill No. 418.”
https://lis.virginia.gov/cgi-bin/legp604.exe?141+sum+SB418. 134 Rocky Mountain Institute, 2013.
Analyzing the Costs and Benefits of Distributed Solar Generation in Virginia p. 44
Power Research study on the VOS in New Jersey and Pennsylvania, is to estimate the enhanced tax revenues connected with net job creation for DSG in contrast to conventional power generation. Through this logic, DSG provides local employment opportunities “at higher rates than conventional generation. These jobs, in turn, translate to tax revenue benefits to all taxpayers.”135
To ensure that economic development measures are included, and to mitigate some of the former concerns surrounding this variable category, the SSG recommends the use of the NREL’s JEDI (Jobs and Economic Development Impact) model, which can be used to estimate the potential economic impacts specific to DSG in the context of Virginia. The JEDI model is a Microsoft Excel based, user-friendly tool that can estimate jobs and earnings impacts of local or state level projects across three main categories: project development / labor impacts; local revenue / supply chain impacts; and induced impacts.136 NREL’s JEDI tool is an adept approach to measure economic impacts of DSG since it can also be used by other stakeholders in different regulatory and DSG penetration contexts.
Another suggestion is to evaluate the potential for DSG to attract businesses and jobs based on improved environmental conditions, observed sustainability efforts, and an enhanced quality of life, as firms sometimes consider these factors when deciding whether to locate offices and manufacturing facilities in certain states. Additionally, states with a strong clean energy economy can help corporations, branches of the military, and other institutions to meet their own sustainability, cost management and energy reliability goals. Energy reliability can also be an important factor that employers use in location decisions, particularly for facilities like labs, data centers and the military.
However, if increased DSG deployment were to result in overall electricity rate increases, negative economic spin-off effects could result. For instance, a study by the New York State Energy Research and Development Authority (NYSERDA) modeled the potential job impacts from the construction of 5,000 MW of PV through the year 2025. The study estimated that while 2,300 PV installation jobs would be created, a net loss of 750 jobs per year would occur in a “base case rate scenario” that assumes installation costs of $2.50-$3.50 per watt by the year 2025. These job losses would be due to increased electricity rates and a “loss of discretionary income that would have supported employment in other sectors in the economy.”137 The NYSERDA report also predicted a $3 billion decrease in the gross state product (GSP) between 2013 and 2049 in this base case model.138 The study’s “high cost” scenario assumed the federal investment tax credit for solar PV would expire after 2016 and that installation costs would average $2.90-$4.30 per watt by 2025, and estimated a net job loss of 2,500 jobs per year and a $9 billion reduction in GSP. However, the “low cost” scenario, which assumed an extension of 135 Perez, Norris, & Hoff, Clean Power Research, 2012. p. 9. 136 National Renewable Energy Laboratory, 2013. About JEDI models.
http://www.nrel.gov/analysis/jedi/about_jedi.html. 137 New York State Energy Research and Development Authority, 2011. New York solar study.
www.nyserda.ny.gov/-/media/Files/Publications/Energy-Analysis/NY-Solar-Study-Report.pdf. p. 5. 138 Ibid.

Analyzing the Costs and Benefits of Distributed Solar Generation in Virginia p. 45
the federal tax credit through 2025 and installation costs of $1.40-$2.00 per watt, predicted a net job increase of 700 jobs per year and a $3 billion increase in GSP. In considering these findings, it is worth noting that all of NYSERDA’s cost scenarios were speculative, and that New York and Virginia differ greatly in terms of policy and regulatory contexts, geography, demographics, etc.
The SSG recommends evaluating potential economic development impacts using the NREL JEDI tool in the intermediate and broad methodologies, and evaluating firm location decisions and other potential economic effects in the broad methodology.
5. Summary and Conclusions
The SSG recognizes that the short- and long-term value of solar will be dependent on a wide range of conditions and perspectives. For example, one of the most important variables in the value of DSG is the amount of solar energy capacity itself. At lower penetration levels, up to at least the 1% cap from the state’s net-metering law, DSG has little to no impact on overall utility operations. At this level it primarily displaces electricity generation from “intermediate” power plants, which supplement baseload generation during daily peak demand periods and are primarily natural-gas fueled.
At low penetration levels, DSG can sometimes help to displace production from “peaking” power plants, which only turn on at times of extremely high power demand (e.g., hot summer afternoons or cold winter mornings). The displacement of peaking plants is particularly advantageous, as they are often among the most highly polluting sources of electricity. However, peak DSG generation does not always match up with peak demand. Solar PV systems often produce the most power in the mid-afternoon, while consumers’ needs are greatest in the late afternoon to early evening (in summer) or early morning (in winter).
At higher penetration levels, DSG could have more fundamental impacts on utility operations, bringing into play potential benefits from avoided generation capacity needs or costs from stranded generation capacity assets. Higher DSG penetration could also result in costs or benefits related to the transmission and distribution networks. At very high levels, and with improved electricity storage technology, DSG could potentially reduce the need for baseload electricity generation (i.e., from coal-fired and nuclear power plants that run constantly).
Another important factor is that the costs and benefits of a given DSG system, particularly its impacts on the distribution grid, are greatly influenced by its location. On that note, the Virginia General Assembly’s 2011 legislation establishing Dominion’s community solar program (HB 1686) required that “such demonstration programs shall be prioritized in areas identified by the utility as areas where localized solar generation would provide benefits to the utility's distribution system, including constrained or high-growth areas.”139 In other words, DSG has
139 Virginia General Assembly Legislative Information System, 2011. “House Bill No. 1686.”
http://lis.virginia.gov/cgi-bin/legp604.exe?111+ful+HB1686.
Analyzing the Costs and Benefits of Distributed Solar Generation in Virginia p. 46
greater distribution benefits in areas with high power demand, particularly in commercial areas where the peak demand better matches the times when DSG output is at its highest.
Time is also an important factor in DSG valuation, as even at extremely high growth rates DSG would likely not fundamentally impact utility operations until many years in the future. Market conditions will also have a major influence, as reaching such high penetration levels would likely require continued reductions in the cost of DSG relative to conventional electricity prices.
The extent to which broader societal impacts are included will greatly influence the results of any VOS analysis. As an alternative to conventional fossil-fuel generation, DSG offers clear environmental and public health benefits. The most notable of these are the direct air pollution and CO2 reductions from avoided fossil fuel consumption, as well as the ongoing indirect benefits of reduced fossil fuel extraction. Economic development is another important area of broad societal impact, but the economic costs and benefits of DSG are less understood.
Changing political or regulatory conditions could also greatly affect VOS calculations. A prime example comes from the EPA’s proposed CO2 emission limits for new and existing power plants. The future of these proposed regulations, and their impact on utilities, is one of the major unknown factors in VOS analysis. At the state level, the adoption policies to require or promote DSG – as has been done in Maryland, North Carolina, and elsewhere – would improve the economic viability of DSG systems. This would presumably lead to greater DSG deployment, potentially altering its costs and benefits if market penetration becomes high enough.
Finally, future technological improvements could affect the relative costs of DSG and change how it interacts with the conventional electricity grid. In particular, improved, lower-cost storage energy storage technology could help DSG achieve higher penetration levels that would fundamentally alter utility operations. Other factors that could influence the VOS are demand management practices and the impact of micro-grid technology. Utilities could potentially use time-of-day rate structures and other demand management techniques to alter load structures, allowing for DSG production to more effectively reduce peak demand. Advances in micro-grid technologies could help DSG improve grid reliability by providing redundancy and load leveling.
With greater time, resources, and data access, future studies could produce actual values for the net VOS under each methodology. This would provide greater clarity for policymakers and stakeholders who wish to understand the costs and benefits of solar energy. Other more targeted studies could also be beneficial. Of particular benefit would be technical studies of key VOS variables where DSG poses potential costs and benefits that are poorly understood, such as generation capacity, distribution infrastructure, and economic development.

Analyzing the Costs and Benefits of Distributed Solar Generation in Virginia p. 47
Works Cited
Appalachian Power, 2014. Updated integrated resource planning report to the Commonwealth of Virginia State Corporation Commission.
Bacque, P., Richmond Times-Dispatch, September 3, 2014. “Dominion Virginia Power installing solar energy demonstration project at Virginia Union University.” http://www.timesdispatch.com/business/energy/dominion-virginia-power-installing-solar-energy-demonstration-project-at-virginia/article_478bfe57-4d77-5bcb-8fb1-84c3916e0299.html.
Beach, R. T., & McGuire, P. G., Crossborder Energy, prepared for Arizona Public Service, 2013. The benefits and costs of solar distributed generation for Arizona public service. www.seia.org/sites/default/files/resources/AZ-Distributed-Generation.pdf.
Beach, R. T., & McGuire, P. G., Crossborder Energy, prepared for the North Carolina Sustainable Energy Association, 2013. The benefits and costs of solar generation for electric ratepayers in North Carolina. energync.org/assets/files/BenefitsandCostsofSolarGenerationforRatepayersinNorthCarolina.pdf.
Burns & McDonnell, 2014. Section 316(b) regulatory update. http://www.burnsmcd.com/Resource_/PressRelease/3224/FileUpload/Newsletter-316bUpdate-June2014.pdf.
Clean Energy States Alliance, 2014. “CESA Announces Innovative Solar + Storage Microgrid Project in Vermont.” http://www.icontact-archive.com/Wl8Nti6_rrTLiBSy-iZkzXGBANc_qFdT?w=4.
Contreras, J. L., Frantzis, L., Blazewicz, S., Pinault, D., & Sawyer, H., Navigant Consulting Inc., prepared for the National Renewable Energy Laboratory, 2008. Photovoltaics value analysis. http://www.eere.energy.gov/solar/pdfs/42303.pdf.
Database of State Incentives for Renewables and Efficiency (DSIRE), 2014. http://www.dsireusa.org/.
Denholm, P., Margolis, R., Palmintier, B., Barrows, C., Ibanez, E., Bird, L., National Renewable Energy Laboratory, 2014. Methods for analyzing the benefits and costs of distributed photovoltaic generation to the U.S. electric utility system. http://nrelpubs.nrel.gov/Webtop/ws/nich/www/public/Record;jsessionid=C1E0AECA9AD9B2A60C5C8AB4B0BB5524?rpp=25&upp=0&m=1&w=NATIVE%28%27AUTHOR+ph+words+%27%27denholm+p%27%27%27%29&order=native%28%27pubyear%2FDescend%27%29.
Dominion Virginia Power, 2014. Dominion North Carolina Power's and Dominion Virginia Power's report of its integrated resource plan.
Analyzing the Costs and Benefits of Distributed Solar Generation in Virginia p. 48
Duke, R., Williams, R., & Payne, A., 2005. Accelerating residential pv expansion: demand analysis for competitive electricity markets. Energy policy, 33, 1912–1929.
Energy and Environmental Economics (E3), prepared for the California Public Utilities Commission, 2012. Technical potential for local distributed photovoltaics in California, preliminary assessment. www.cpuc.ca.gov.
Energy Information Administration, 2010. Virginia nuclear profile. http://www.eia.gov/nuclear/state/2008/virginia/va.html.
Energy Information Administration, 2014. Electric sales, revenue, and average price, table 10: 2012 utility bundled retail sales – Total. http://www.eia.gov/electricity/sales_revenue_price/.
Environmental Protection Agency, 2011. The benefits and costs of the clean air act from 1990 to 2020. www.epa.gov/air/sect812/feb11/fullreport_rev_a.pdf.
Environmental Protection Agency, 2013. Clean Power Plan compliance costs model. http://www2.epa.gov/sites/production/files/2014-06/20140602tsd-ghg-abatement-measures-scenario1.xlsx.
Environmental Protection Agency, 2013. Fact sheet: Social cost of carbon. http://www.epa.gov/climatechange/Downloads/EPAactivities/scc-fact-sheet.pdf.
Environmental Protection Agency, 2014. EPA Technical Support Document (TSD) for CAA Section 111(d) Emission Guidelines for Existing Power Plants. “Goal computation technical support document.” http://www2.epa.gov/sites/production/files/2014-06/documents/20140602tsd-goal-computation.pdf.
Environmental Protection Agency, 2014. Green book: Current nonattainment counties for all criteria pollutants. http://www.epa.gov/oaqps001/greenbk/ancl.html.
Freeing the Grid, 2013. Best practices in state net metering policies and interconnection procedures. freeingthegrid.org/wp-content/uploads/2013/11/FTG_2013.pdf.
Federal Register, 2014. Carbon pollution emission guidelines for existing stationary sources: Electric utility generating units. https://federalregister.gov/a/2014-13726.
Federal Register, 2014. Volume 79, Number 193. Approval and Promulgation of Air Quality
Implementation Plans; District of Columbia, Maryland, and Virginia.
http://www.gpo.gov/fdsys/pkg/FR-2014-10-06/html/2014-23624.htm.
General Electric International, Inc., 2014. PJM renewable integration study. http://pjm.com/~/media/committees-groups/task-forces/irtf/postings/pris-executive-summary.ashx.
HB 1946, 2013. http://leg1.state.va.us/cgi-bin/legp504.exe?ses=131&typ=bil&val=hb1946.
HJ 76, 2014. http://leg1.state.va.us/cgi-bin/legp504.exe?141+sum+HJ76.

Analyzing the Costs and Benefits of Distributed Solar Generation in Virginia p. 49
Hoff, T. E., Perez, R., Braun, G., Kuhn, M., & Norris, B., Clean Power Research, prepared for Austin Energy, 2006. The value of distributed photovoltaics to Austin energy and the city of Austin. www.cleanpower.com/wp-content/uploads/034_PV_ValueReportAustinEnergy.pdf.
International Energy Agency, 2013. PVPS report: A snapshot of global pv 1992–2012 (T1-22). http://iea-pvps.org/fileadmin/dam/public/report/statistics/PVPS_report_-_A_Snapshot_of_Global_PV_-_1992-2012_-_FINAL_4.pdf.
Jones, N., & Norris, B., Solar San Antonio, Clean Power Research, 2013. The value of distributed solar electric generation to San Antonio. www.solarsanantonio.org/wp-content/uploads/2013/04/Value-of-Solar-at-San-Antonio-03-13-2013.pdf.
Keyes, J. B., & Rabago, K. R., Interstate Renewable Energy Council, 2013. A regulator's guidebook: Calculating the benefits and costs of distributed solar generation. http://www.irecusa.org/wp-content/uploads/2013/10/IREC_Rabago_Regulators-Guidebook-to-Assessing-Benefits-and-Costs-of-DSG.pdf.
Lopez, A., Roberts, B., Heimiller, D., Blair, N., & Porro, G., National Renewable Energy Laboratory, 2012. U.S. renewable energy technical potentials: A GIS-based analysis. http://www.nrel.gov/docs/fy12osti/51946.pdf.
Maryland Energy Administration (MEA), 2014. http://energy.maryland.gov/solar.html.
National Public Radio (NPR), July 15, 2014. “Leased Solar Panels can Cast a Shadow Over a Home’s Value.” http://www.npr.org/2014/07/15/330769382/leased-solar-panels-can-cast-a-shadow-over-a-homes-value.
National Renewable Energy Laboratory, 2013. About JEDI models. http://www.nrel.gov/analysis/jedi/about_jedi.html.
National Renewable Energy Laboratory, 2014. NREL’s pv watts calculator. http://pvwatts.nrel.gov/.
Navigant Consulting Inc., prepared for NV Energy, 2010. Distributed generation study. www.navigant.com/~/media/WWW/Site/Insights/Energy/NVE_DG_Study_Energy.ashx.
New York State Energy Research and Development Authority, 2011. New York solar study. www.nyserda.ny.gov/-/media/Files/Publications/Energy-Analysis/NY-Solar-Study-Report.pdf.
Pacific Northwest National Laboratory, 2014. Duke Energy photovoltaic integration study: Carolinas service areas. www.pnnl.gov/main/publications/external/technical_reports/PNNL-23226.pdf.
Perez, R., & Hoff, T. E., Clean Power Research, prepared for the Solar Alliance and the New York Energy Industry Association, 2008. Energy and capacity valuation of photovoltaic power generation in New York.
Analyzing the Costs and Benefits of Distributed Solar Generation in Virginia p. 50
www.asrc.cestm.albany.edu/perez/publications/UtilityPeakShavingandCapacityCredit/PapersonPVLoadMatchingandEconomicEvaluation/EnergyCapacityValuation-08.pdf.
Perez, R., Norris, B. L., & Hoff, T. E., Clean Power Research, prepared for the Mid‐Atlantic Solar Energy Industries Association & Pennsylvania Solar Energy Industries Association, 2012. The value of distributed solar electric generation to New Jersey and Pennsylvania. mseia.net/site/wp-content/uploads/2012/05/MSEIA-Final-Benefits-of-Solar-Report-2012-11-01.pdf.
Perez, R., Zweibel, K., & Hoff, T., University at Albany, George Washington University, Clean Power Research, 2011. Solar power generation in the US: Too expensive, or a bargain? www.cleanpower.com/wp-content/uploads/Solar-Power-Generation-in-U.S.-too-expensive-or-a-bargain.pdf.
PJM, 2014. Reliability pricing model. http://www.pjm.com/markets-and-operations/rpm.aspx.
Potomac Economics, prepared for: RGGI, Inc., on behalf of the RGGI Participating States, 2014. Market monitor report for auction 24. www.rggi.org/docs/Auctions/24/Auction_24_Market_Monitor_Report.pdf.
Preston, J. M., McCalla, J., & Scudlarick, J., 2012. Dominion 585 MW Virginia city hybrid energy center: Project summary and update. http://74.52.3.10/mirrors/www.cbi.com/Virtual-Power-Grid/pdfs/power_plants_pdfs/coal/technical_papers/ VCHEC%20Project%20Update%20Final.pdf.
REN 21, 2014. Renewables 2014: Global status report. www.ren21.net/Portals/0/documents/ Resources/GSR/2014/GSR2014_full%20report_low%20res.pdf.
Reno, M. J., Broderick, R. J., & Grijalva, S., 2013. Smart inverter capabilities for mitigating over-voltage on distribution systems with high penetrations of pv. http://energy.sandia.gov/wp/wp-content/gallery/uploads/2013_PVSC-VoltVar.pdf.
Rocky Mountain Institute, 2013. A review of solar pv benefit & cost studies. www.rmi.org/cms/Download.aspx?id=10793&file=eLab_DERBenefitCostDeck_2nd_Edition&title=A+Review+of+Solar+PV+Benefit+and+Cost+Studies.pdf.
R.W. Beck, prepared for Arizona Public Service, 2009. Distributed renewable energy operating impacts and valuation study. http://www.solarfuturearizona.com/SolarDEStudy.pdf.
SAIC, prepared for Arizona Public Service, 2013. 2013 updated solar pv value report. www.azsolarcenter.org/images/docs/reports/SolarValueStudy-SAIC-2013-05.pdf.
Satchwell, A., Mills, A., & Barbose, G., Lawrence Berkeley National Laboratory, 2014. Financial impacts of net-metered pv on utilities and ratepayers: A scoping study of two prototypical U.S. utilities. http://emp.lbl.gov/sites/all/files/LBNL%20PV%20Business%20 Models%20Report_no%20report%20number%20(Sept%2025%20revision).pdf.

Analyzing the Costs and Benefits of Distributed Solar Generation in Virginia p. 51
Sauer, A., Klop, P., & Agrawal, S., 2010. Over heating: Financial risks on water constraints on power generation in Asia. http://pdf.wri.org/over_heating_asia.pdf.
Schaar, S., Clerk of the Senate, March 13, 2014. Letter to Conrad Spangler, Director, DMME.
Schlissel, D., Loiter, J., & Sommer, A., 2013. Changing course: A clean energy investment plan for Dominion Virginia Power. http://www.wiseenergyforvirginia.org/wp-content/uploads/2013/08/Changing-Course-Full-Report.pdf.
Shapiro, C., The Virginian-Pilot, November 24, 2011, “Dominion to charge fee to heavy users of solar power.” http://hamptonroads.com/2011/11/dominion-charge-fee-heavy-users-solar-power.
Sherwood, L., Interstate Renewable Energy Council, 2014. U.S. solar market trends 2013. http:// www.irecusa.org/wp-content/uploads/2014/07/Final-Solar-Report-7-3-14-W-2-8.pdf.
Smeloff, E., The Vote Solar Initiative, 2005. Quantifying the benefits of solar power for California. http://www.energycollection.us/Energy-Solar/Quantifying-The-Benefits.pdf.
Solar Energy Industries Association, 2014. http://www.seia.org/state-solar-policy/north-carolina.
Solar Energy Industries Association, 2014. Photovoltaic (solar electric). http://www.seia.org/ policy/ solar-technology/photovoltaic-solar-electric/whats-megawatt.
Stanton, T., 2012. Electric utility standby rates: Updates for today and tomorrow. www.michigan.gov/documents/energy/NRRI_Electric_Standby_Rates_419831_7.pdf.
State Corporation Commission, 2011. Response to net energy metering information request from the Virginia General Assembly House Commerce and Labor Special Sub-Committee on Energy.
State Corporation Commission, 2012. Response to net energy metering information request from the Virginia General Assembly Senate Committee on Commerce and Labor.
State Corporation Commission, 2012. Status report: Implementation of the Virginia Electric Utility Regulation Act. http://www.scc.virginia.gov/comm/reports/2012_veur.pdf.
State Corporation Commission, 2014. Case Summary for Case Number: PUE-2014-00026.
State Corporation Commission, 2014. Net metering installations, June 30, 2014.
U.S. Department of Energy, 2012. SunShot vision study. www.energy.gov/sites/prod/files/2014/01/f7/47927.pdf.
VA Code § 56-580.D. https://leg1.state.va.us/cgi-bin/legp504.exe?000+cod+56-580.
VA Code § 56-597. https://leg1.state.va.us/cgi-bin/legp504.exe?000+cod+56-597.
VA Code §67-201.B. https://leg1.state.va.us/cgi-bin/legp504.exe?000+cod+67-201.

Analyzing the Costs and Benefits of Distributed Solar Generation in Virginia p. 52
Vermont Public Service Department, 2013. Evaluation of net metering in Vermont conducted pursuant to act 125 of 2012. http://www.leg.state.vt.us/reports/2013ExternalReports/ 285580.pdf.
Virginia Department of Environmental Quality, 2014. Ozone and PM2.5 Regional Planning Activities. http://www.deq.virginia.gov/Programs/Air/AirQualityPlans/
OzoneandPM25RegionalPlanningActivities.aspx.
Virginia General Assembly Legislative Information System, 2011. “House Bill No. 1686.” http://lis.virginia.gov/cgi-bin/legp604.exe?111+ful+HB1686.
Virginia General Assembly Legislative Information System, 2014. “House Bill No. 363.” http://lis.virginia.gov/cgi-bin/legp604.exe?141+ful+HB363.
Virginia General Assembly Legislative Information System, 2014. “Senate Bill No. 418.” https://lis.virginia.gov/cgi-bin/legp604.exe?141+sum+SB418.
Virginia State Corporation Commission (SCC), 2014. “Net Energy Metering (‘NEM’) Generating Facilities in Virginia, Photovoltaic (Solar) and Wind,” June 30, 2014.
Weiss, J., Chang, J., & Aydin, O., The Brattle Group, prepared for the Solar Energy Industries Association and the Energy Foundation, 2012. The potential impact of solar pv on electricity markets in Texas. www.seia.org/sites/default/files/brattlegrouptexasstudy6-19-12-120619081828-phpapp01.pdf.
York County, 2012. York County environmental report. https://www.yorkcounty.gov/Portals/0/ planning/2025_charting_the_course/environment_2025.pdf.
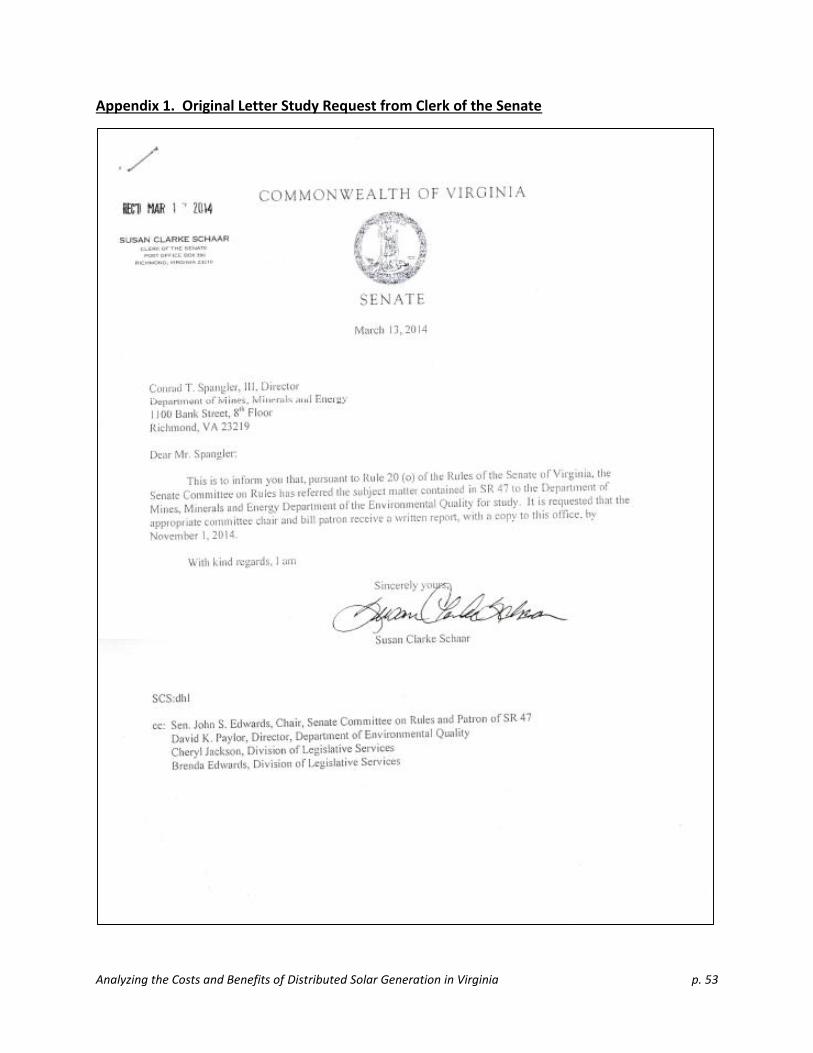
Analyzing the Costs and Benefits of Distributed Solar Generation in Virginia p. 53
Appendix 1. Original Letter Study Request from Clerk of the Senate

Analyzing the Costs and Benefits of Distributed Solar Generation in Virginia p. 54

Analyzing the Costs and Benefits of Distributed Solar Generation in Virginia p. 55