analyzing the methods to remove artifacts encountered in ... · pdf filemethod that is...
TRANSCRIPT
J Anal Bioanal TechniquesISSN:2155-9872 JABT, an open access journal
Journal of Analytical & Bioanalytical Techniques - Open AccessResearch Article
OPEN ACCESS Freely available onlinedoi:10.4172/2155-9872.1000114
Volume 1 • Issue 3 • 1000114
Keywords: NIR reflectance spectroscopy; Quantitative model;Preprocessing methods; PLS technique
IntroductionNear infrared (NIR) spectroscopy is a quick, non-destructive
method that is amenable for spot analysis application. In the last two decades, it has been increasingly used in pharmaceutical analysis [1-3] and NIR has also been used to combat counterfeit drug production [4-7]. In China, an NIR fast drug analysis system that could be equipped in a mobile vehicle was introduced in 2004 [8] providing a new means of combating the counterfeit drug. In order to develop a NIR analysis model that can measure active pharmaceutical ingredients (API), we try to remove the information that is indeed undesired for the data analysis and extract the more relevant chemical information from the spectra. This model was termed a universal one [9], which could measure the medicine with the same international nonproprietary name (INN) but from different manufacturers. It is our hope that these models can be directly used in Fourier Transform NIR (FT-NIR) spectrometers with the same equipment already found in mobile vehicles without any special mathematical treatments. At present, NIR fast drug analysis systems equipped in mobile vehicles have been used in whole China, and have received positive reviews[10].
We have previously reported some universal NIR models. For example, we have reported on universal quantitative models to determine cefradine in capsules[11], universal quantitative models to determine roxithromycin and erythromycin ethylsuccinate in tablets[9], universal qualitative and quantitative models for vitamin tablets[12], and universal qualitative and quantitative models for cephalosporin’s and penicillin’s in injection[13-18]. When building a single universal calibration for determination of API in different manufacturers’ products, we must apply proper spectral preprocessing methods and appropriate algorithms to remove the effects of the drug wrapper, the particle size and the crystallinity of samples all affect their NIR spectra. However, how to simplify the model construction is a remaining problem currently, we have aimed to resolve the problem of rapid building a universal model for rapid drug screening testing by creating a spectral preprocessing selection strategy. Even the chosen spectral preprocessing method is not the optimal one, but it can make the perplexing selection process easy and fully meet the needs in practice. In this study, powder medicines for injection were used as examples to search a common strategy of spectral preprocessing to remove artifacts
encountered in the development of universal quantitative models for the powder medicines.
Materials and Methods An EQUINOX55 FT-NIR (Bruker OptIk GmbH, Ettlingen,
Germany) was used in this experiment. It was equipped with a 1.5m fiber optic diffuse reflectance probe and an extended TE-cooled indium gallium arsenide (InGaAs) detector. Bruker OPUS software version 6.0 was used to collect and analyze all data. Standard glass vials (Bruker OptIk GmbH, Ettlingen, Germany) with homogeneity component and same size were specially used to compare with ordinary commercial glass vials.
Apparatus and software
A Powder X-ray diffractometer (Rint-Ultima, Rigaku Co., Japan) was used in this experiment.
Samples
A total of 20 batches of cefuroxime sodium from 9 different manufacturers, 20 batches of ceftriaxone sodium from 18 different manufacturers, and 20 batches of cefotaxime sodium from 19 different manufacturers were collected from the Chinese market from 2005 to 2006 by the National Institute for the Control of Pharmaceutical and Biological Products (NICPBP).
Four sets of lactose samples were created that differed in their particle size by 60, 70, 100 and 200 mesh, and the MEGGLE group (Germany) provided three batches of each particle set.
Ceftriaxone sodium (Jiu Xin medicine industry Shen Zhen,
*Corresponding author: Chang-Qin Hu, National Key Technologies R&D Program Foundation of China, China, Tel: +86-10-67095308; Fax: +86-10-65115148; E-mail: [email protected]
Received October 10, 2010; Accepted December 23, 2010; Published December 29, 2010
Citation: Ni Z, Feng YC, Hu CQ (2011) Analyzing the Methods to Remove Artifacts Encountered in the Development of a NIR Quantitative Model for Powder Medicines. J Anal Bioanal Techniques 1:114. doi:10.4172/2155-9872.1000114
Copyright: © 2011 Ni Z, et al. This is an open-access article distributed under the terms of the Creative Commons Attribution License, which permits unrestricted use, distribution, and reproduction in any medium, provided the original author and source are credited.
AbstractThe wrapper composition, particle size and crystallinity of powder drugs all affect their NIR spectra. To remove these
effects, one must apply proper spectral preprocessing methods and good algorithms before developing a NIR quantitative model. Though different spectral preprocessing methods possess different functions aimed at removing different effects, we have found that use of the first derivative+vector normalization (FD+VN) removes the effects of packaging bottle and particle size in the NIR spectra. The effect of crystallinity cannot be removed with spectral preprocessing methods, but it can be reduced by choosing a proper calibration set, choosing a specific principal component, and applying partial least squares fitting.
Analyzing the Methods to Remove Artifacts Encountered in the Development of a NIR Quantitative Model for Powder MedicinesZhen Ni1,2, Yan-Chun Feng1 and Chang-Qin Hu1*1National Institute for the Control of Pharmaceutical and Biological Products, Beijing 100050, PR China 2Tibet Institute for the Control of food and Pharmaceutical Products, Lhasa 850000, PR China

Citation: Ni Z, Feng YC, Hu CQ (2011) Analyzing the Methods to Remove Artifacts Encountered in the Development of a NIR Quantitative Model for Powder Medicines. J Anal Bioanal Techniques 1:114. doi:10.4172/2155-9872.1000114
Page 2 of 7
J Anal Bioanal TechniquesISSN:2155-9872 JABT, an open access journal
Volume 1 • Issue 3 • 1000114
0503521) was used at 100% crystallinity. Amorphous ceftriaxone sodium was prepared using a two-stage technique, in which the crystalline ceftriaxone sodium was dissolved in distilled water stored at -80ºC and then lyophilized. The amorphous ceftriaxone sodium was then ground in a mortar. Physical mixtures of amorphous and crystalline ceftriaxone were prepared by weighing amorphous and crystalline components on a semi-microbalance (Sartorius R200D) and combining them in glass vials with tightly fitting screw top lids. Each vial was attached to the side of a vortexer for 60 s for adequate mixing. The X-ray powder diffraction profiles of ceftriaxone sodium of different crystallinity (percents are percent of crystalline material in a mixture of crystalline and amorphous powder) were measured.
Recording of NIR spectra
Diffuse reflectance spectra were recorded using a 1.5 m fiber optic probe placed directly through the bottom of the glass vial at 8 cm-1 resolution with 64 co-added scans over the spectral range 4000-12,000 cm-1. For each sample, five different positions of the vial (with respect toits bottom position) were selected to recode and average. The averagedspectra were used for analysis.
Measurement of X-ray powder diffraction profiles
X-ray powder diffraction profiles of ceftriaxone sodium withdifferent crystallinity were measured as follows: target, Cu; voltage, 40kV; current, 40 mA; receiving slit, 0.15 mm; and scanning speed, 2°2θmin-1. The profiles are shown in Figure 1, the four spectra in Figure 1 represent 100%, 60%, 30%, and 0% crystallintiy respectively. )
Models
Three quantitative models were mentioned in this study. The Near-infrared diffuse reflectance spectra were collected directly through the bottom of injection ample by using fiber optic probes and used to predict the contents of the injection. The major information of the models including the model parameters and the model validation results such as the root mean square error of cross validation (RMSECV) and the root mean square error of prediction (RMSEP) is shown in the Table 1. More details about these models can be seen in the reference 15, 17and 18.
Analysis of effects of glass vials
The NIR spectra of 20 batches of cefuroxime sodium, 20 batches of
ceftriaxone sodium and 20 batches of cefotaxime sodium all contained in their ordinary commercial glass vials from its manufacturer as well as in the standard glass vials were measured. The spectra of three kinds of samples were separately analyzed by a cluster analysis using following parameters: the spectral region was 4000-12,000cm-1 and Ward’s algorithm using the squared Euclidean distance for the calculation of spectral distances. Five different spectral preprocessing methods provided in the OPUS software including vector normalization (VN), 1st derivative (FD), 2nd derivative (SD), 1st derivative followed by vector normalization (FD+VN), and 2nd derivative followed by vector normalization (SD+VN) were used to compare their ability to remove the effect of glass vials from the NIR spectra by the cluster analysis. The spectral distances in cluster analysis allow calculating the variance. The smallest average spectral distance between two drug groups among the three groups in the dendrogram produced by the cluster analysis is as between-class variance, and the largest spectral distance of one drug group in pair of the group as the within-class variance a good spectral preprocessing method should reduce within-class variance while enlarging between-class variance simultaneously.
Analysis of effects of particle size
The NIR spectra of lactose with different particle sizes were measured. Referencing the method of Aucott et al. [19], the ability of diverse spectral preprocessing methods to reduce the effect of particle size without obscuring the features of the spectra was compared. Let xij denote the transformed spectral value for sample i at wavelength j and let jx denote the mean value of the m lactose samples at wavelength j. If the transformed spectra were unaffected by particle size at thatwavelength, then xij would be the same for all samples and would equal
jx . Hence, a measure of the variation attributable to particle size atwavelength j is the sample variance, say vj:
( ) ( )2
1
/ 1m
j ij ji
v x x m=
= − −∑An overall measure of the variation attributable to particle size,
says V, is then the square-root of the average value of jv overall
wavelengths, ( )12/jV v n= ∑ . If a transformed spectrum had features
that were large, then its value would tend to change substantially from one wavelength to an adjacent one, that is ( 1j jx x+ − ) would tend to be large in magnitude (since the jx values are regarded as forming an “average spectrum”). Hence, a measure of the magnitude of spectral features was obtained, say M, by
1
10
/( 1)n
j jj
M x x n=
+=
= − −∑The quantity V/M has been used as a measure of the relative effects
of particle size in obscuring features of the spectra, and hence it is refer to as the VM ratio.
Analysis of effects of crystallinity
The NIR spectra of ceftriaxone sodium of different crystallinity were measured. The spectral preprocessing methods were tried to reduce the effect of crystallinity on NIR spectra. Correlation coefficient method was used to compare the preprocessed spectra with different crystallinity and the spectrum of 100% crystallinity. The correlation coefficient r of the two spectra y1 (k) and y2 (k) is calculated as ratio from the covariance and product of the two standard deviations σy1 and σy2:
r = 1 2
y1 2
(y (k),y (k))
y
Covσ σ⋅
The value of r ranges between -1 (inverted spectra) and +1 (identical spectra). This correlation coefficient r will be calculated into a percentage and reflects the similarity of the two spectra. The correlation
Figure 1: X-ray powder diffraction profiles of ceftriaxone sodium with different crystallinity.
Intensity
400
300
200
100
010.000 20.000 30.000 40.000
100%
60%
30%
0%

Citation: Ni Z, Feng YC, Hu CQ (2011) Analyzing the Methods to Remove Artifacts Encountered in the Development of a NIR Quantitative Model for Powder Medicines. J Anal Bioanal Techniques 1:114. doi:10.4172/2155-9872.1000114
Page 3 of 7
J Anal Bioanal TechniquesISSN:2155-9872 JABT, an open access journal
Volume 1 • Issue 3 • 1000114
coefficients in the range of 6500cm-1~5500cm-1 were used to illuminate whether the spectral preprocessing method can reduce the effect of crystallinity.
The samples with different crystallinity were added to the calibration set of the NIR universal quantitative model of ceftriaxone sodium for injection [17]. The PLS loading factors were compared to the spectrum of 100% crystallinity of ceftriaxone sodium.
Validation of functions to reduce artifact effects
The NIR quantitative model of cefuroxime sodium for injection shown in Table 1 was used to reconstruct some new models. The calibration set, the wavelength range and the algorithm of the new models were as same as the original one, only the spectral preprocessing method was changed. One batch of cefuroxime sodium (content 91.7% with HPLC) was firstly put into 20 different ordinary commercial glass vials collected from market, measured the NIR spectra, and predicted their contents with these different new quantitative models. Then, the same batch of cefuroxime sodium was used to create three samples that differed in their particle size by passing it through a series of sieves. One sample passed through a sieve with an aperture size of 500 μm but not through a 180 μm sieve, the second passed through a 180 μm sieve but not through a 75 μm sieve, and the third passed through a 75 μm sieve but not through a 45 μm sieve. These were then put into the standard glass vials and the NIR spectra were measured and predicted their contents with the different new quantitative models. The root mean square error of prediction (RMSEP) was used to assess the effects of the preprocessing methods.
The NIR quantitative model of ceftriaxone sodium for injection shown in Table 1, which was constructed by the crystalline component17, was firstly used to predict the contents of ceftriaxone sodium with different crystallinity which was the mixture of the crystalline and the amorphous component prepared in the laboratory. The model was then updated by adding the samples at 0% and 10% crystalline to the original calibration set to create a new model. The RMSEP was used to assess the accuracy of the models.
The PLS loading 1 of NIR models was compared to the NIR spectra of amorphous samples and crystalline samples respectively for evaluation of effects of reducing the artifacts from sample crystallinity.
Results and DiscussionCommon methods used in universal NIR models of powder medicines
NIR is a rapid and non-destructive method that is well suited for analysis of powder materials. It was adopted in our current study to evaluate the effects of glass vials on sample measurements. Figure 2 shows the NIR spectra of 20 batches of cefuroxime sodium (green),
20 batches of ceftriaxone sodium (red) and 20 batches of cefotaxime sodium (black) in their ordinary commercial glass vials and in the standard glass vials. The spectra of three kinds of samples that were measured in their original glass vials had overlap with one another (Figure 2a). The spectra measured in the standard glass vials appeared to have identifiable trends depending upon which kind of drugs (Figure 2b). When the spectra of three kinds of samples measured in different glass vials were separately analyzed by the cluster analysis, all of the spectra measured in the standard glass vials could be divided correctly into three groups according to their API because of the consistency in material and reflectivity of standard glass vials. However, 60% of the spectra measured in their original glass vials could be divided correctly
Model Calibration set Test set Wavelength range(cm-1)
Preprocessing method
Calibration TestR2 RMSECV* R2 RMSEP*
Cefoperazone sodium for injection [15]
22 batches from 14 manufacture including 17 batches of crystalline and 5 batches of amorphous
19 batches including 15 batches of crystalline and 4 batches of amorphous from 9 manufacture
4243+44245443+6253
First derivation and Vector normalization 98.5 0.857 / 3.66
Ceftriaxone sodium for injection[17]
60 batches from 28 manufacture
85 batches from 28 manufacture
6993~55274602~4227
First derivation and Vector normalization 94.3 1.21 / 1.07
Cefuroxime sodium for injection[18]
59 batches from 11 manufacture
38 batches from 11 manufacture
11004.6~7494.66102.1~4246.8
First derivation and Vector normalization 98.9 1.28 94.2 2.21
Table 1: The parameters of the quantitative model mentioned in this study.
* RMSECV means root mean square error of cross validation and RMSEP means root mean square error of prediction.
Abs
orba
nec
Uni
ts
Wavenumber cm-1
0.00
0 0
.100
0.20
0
0.3
00
0.4
00
0.50
0
0.6
00
0.7
00
11500 11000 10500 10000 9500 9000 8500 8000 7500 7000 6500 6000 5500 5000 4500
Abs
orba
nec
Uni
ts
Wavenumber cm-1
0.00
0
0
.100
0
.200
0.30
0
0.4
00
0.50
0
11500 11000 10500 10000 9500 9000 8500 8000 7500 7000 6500 6000 5500 5000 4500
(a)
(b)
Figure 2: NIR spectra of three kinds of powder medicine from different manufactures in glass vials of samples (a) and in standard glass vials (b) (green: cefuroxime sodium for injection, red: ceftriaxone sodium for injection, black: cefotaxime sodium for injection).
Citation: Ni Z, Feng YC, Hu CQ (2011) Analyzing the Methods to Remove Artifacts Encountered in the Development of a NIR Quantitative Model for Powder Medicines. J Anal Bioanal Techniques 1:114. doi:10.4172/2155-9872.1000114
Page 4 of 7
into the three groups because differing material and reflectivity of ordinary commercial glass vials from different manufactures could affect the NIR spectra of the samples when making NIR measurements.
Methods to remove the effects of glass vials: Although the spectra of three kinds of drugs measured in their original ordinary commercial glass vials could be divided correctly into the three groups by the
cluster analysis as mentioned above when the spectra were pretreated by any of the five preprocessing methods, The within-class variance and the between-class variance in one drug group are different (shown in Table 2). It is obvious that proper spectral preprocessing methods could remove the effects of glass vials of samples. FD+VN was the most effective preprocessing method, and the next most effective was SD+VN.
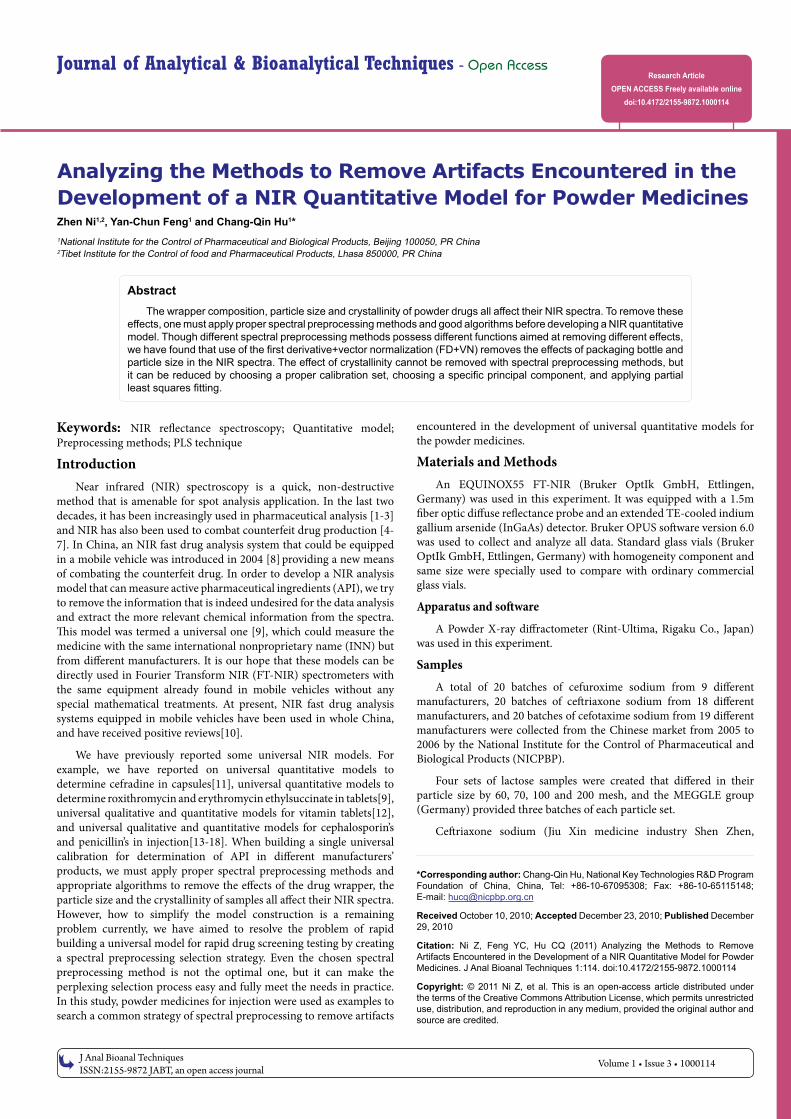
Figure 3: NIR spectra of lactose with different particle sizes.
Abs
orba
nec
Uni
ts
Wavenumber cm-1
0.00
0 0
.100
0.2
00 0
.300
0.4
00 0
.500
0.6
00 0
.700
0.8
00 0
.900
1.0
00
11500 11000 10500 10000 9500 9000 8500 8000 7500 7000 6500 6000 5500 5000 4500 4000
200 mesh
100 mesh
70 mesh
60 mesh
Figure 3: NIR spectra of lactose with different particle sizes.
Abs
orba
nec
Uni
tsA
bsor
bane
c U
nits
Wavenumber cm-1
Wavenumber cm-1
11500 11000 10500 10000 9500 9000 8500 8000 7500 7000 6500 6000 5500 5000 4500
0460 0400 0350 0300 0250 3200 0150 0100 0060 0000 5950 5900 5850 5800 5750 5700 5650 5600 5550
0.00
0 0
.100
0.20
0
0.3
00
0.4
00
0.50
0
0.6
00
0.7
000.
0200
0.00
00
0.
0200
0
.040
0
0.0
600
(a)
(b)
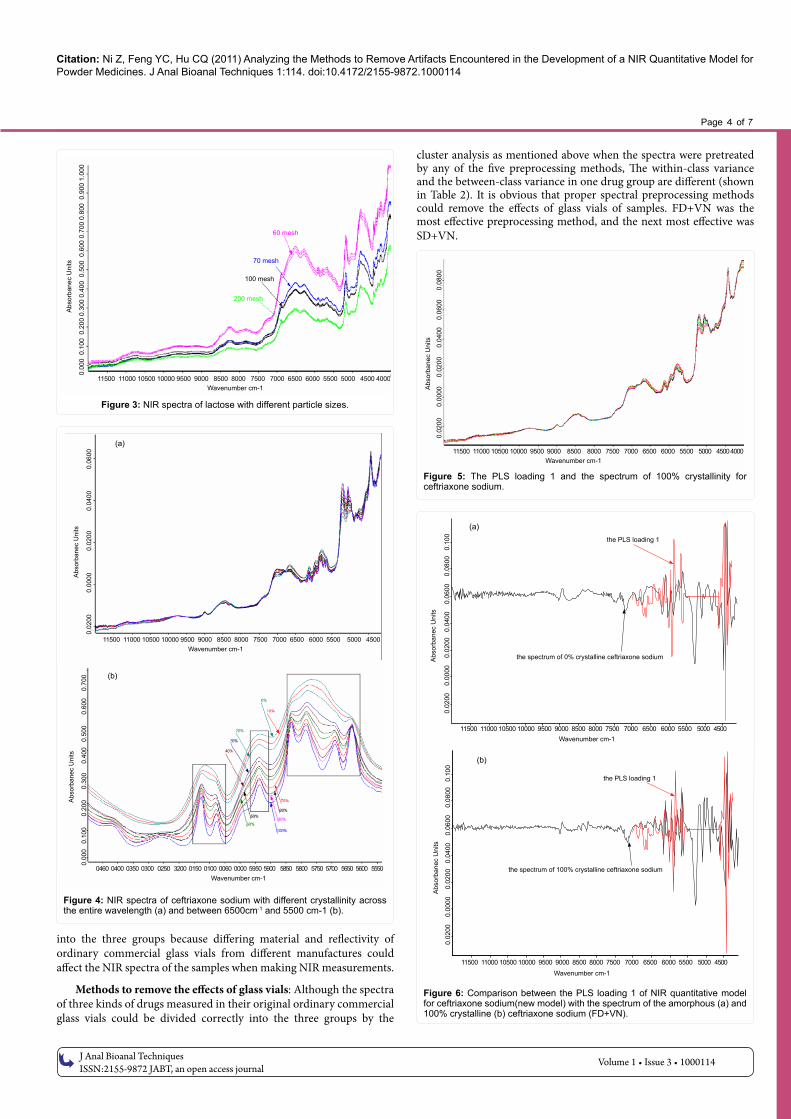
Figure 4: NIR spectra of ceftriaxone sodium with different crystallinity across the entire wavelength (a) and between 6500cm-1 and 5500 cm-1 (b).
Abs
orba
nec
Uni
ts
0.02
00
0.
0000
0
.020
0
0.0
400
0.
0600
0
.080
0
Wavenumber cm-111500 11000 10500 10000 9500 9000 8500 8000 7500 7000 6500 6000 5500 5000 4500 4000
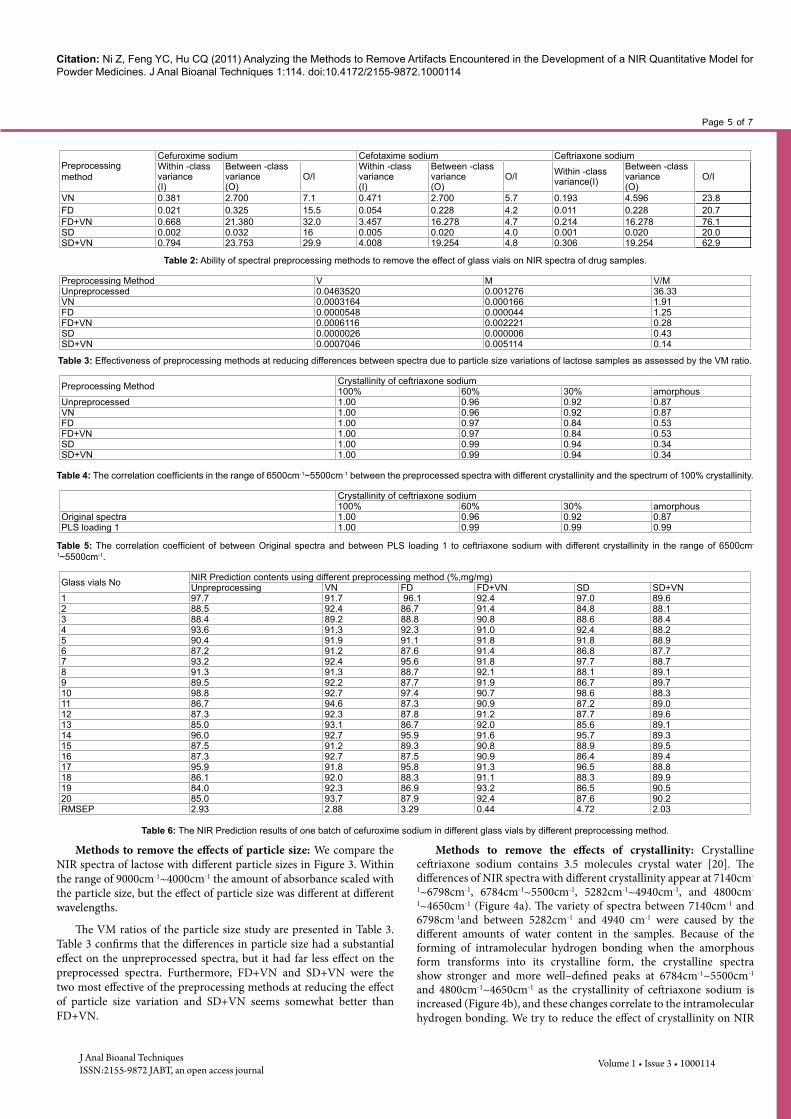
Figure 5: The PLS loading 1 and the spectrum of 100% crystallinity for ceftriaxone sodium.
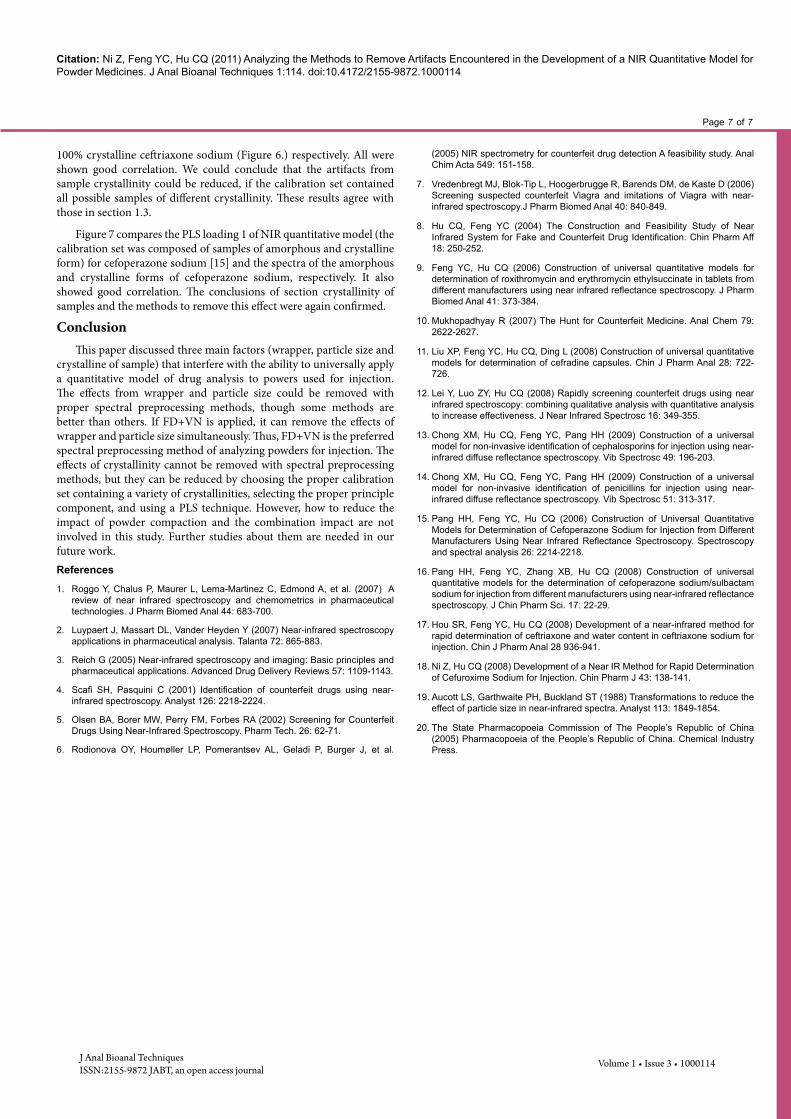
Figure 6: Comparison between the PLS loading 1 of NIR quantitative model for ceftriaxone sodium(new model) with the spectrum of the amorphous (a) and 100% crystalline (b) ceftriaxone sodium (FD+VN).
0.02
00
0.0
000
0.
0200
0.
0400
0
.060
0
0.08
00
0.10
00.
0200
0
.000
0
0.02
00
0.04
00
0.0
600
0.
0800
0.
100
Abs
orba
nec
Uni
tsA
bsor
bane
c U
nits
Wavenumber cm-111500 11000 10500 10000 9500 9000 8500 8000 7500 7000 6500 6000 5500 5000 4500
Wavenumber cm-111500 11000 10500 10000 9500 9000 8500 8000 7500 7000 6500 6000 5500 5000 4500
(a)
(b)
the spectrum of 0% crystalline ceftriaxone sodium
the spectrum of 100% crystalline ceftriaxone sodium
the PLS loading 1
the PLS loading 1
J Anal Bioanal TechniquesISSN:2155-9872 JABT, an open access journal
Volume 1 • Issue 3 • 1000114
Citation: Ni Z, Feng YC, Hu CQ (2011) Analyzing the Methods to Remove Artifacts Encountered in the Development of a NIR Quantitative Model for Powder Medicines. J Anal Bioanal Techniques 1:114. doi:10.4172/2155-9872.1000114
Page 5 of 7
J Anal Bioanal TechniquesISSN:2155-9872 JABT, an open access journal
Volume 1 • Issue 3 • 1000114
Methods to remove the effects of particle size: We compare the NIR spectra of lactose with different particle sizes in Figure 3. Within the range of 9000cm-1~4000cm-1 the amount of absorbance scaled with the particle size, but the effect of particle size was different at different wavelengths.
The VM ratios of the particle size study are presented in Table 3. Table 3 confirms that the differences in particle size had a substantial effect on the unpreprocessed spectra, but it had far less effect on the preprocessed spectra. Furthermore, FD+VN and SD+VN were the two most effective of the preprocessing methods at reducing the effect of particle size variation and SD+VN seems somewhat better than FD+VN.
Methods to remove the effects of crystallinity: Crystalline ceftriaxone sodium contains 3.5 molecules crystal water [20]. The differences of NIR spectra with different crystallinity appear at 7140cm-
1~6798cm-1, 6784cm-1~5500cm-1, 5282cm-1~4940cm-1, and 4800cm-
1~4650cm-1 (Figure 4a). The variety of spectra between 7140cm-1 and 6798cm-1and between 5282cm-1 and 4940 cm-1 were caused by the different amounts of water content in the samples. Because of the forming of intramolecular hydrogen bonding when the amorphous form transforms into its crystalline form, the crystalline spectra show stronger and more well–defined peaks at 6784cm-1~5500cm-1 and 4800cm-1~4650cm-1 as the crystallinity of ceftriaxone sodium is increased (Figure 4b), and these changes correlate to the intramolecular hydrogen bonding. We try to reduce the effect of crystallinity on NIR
Preprocessingmethod
Cefuroxime sodium Cefotaxime sodium Ceftriaxone sodiumWithin -class variance(I)
Between -classvariance(O)
O/IWithin -class variance(I)
Between -classvariance(O)
O/I Within -class variance(I)
Between -classvariance(O)
O/I
VN 0.381 2.700 7.1 0.471 2.700 5.7 0.193 4.596 23.8FD 0.021 0.325 15.5 0.054 0.228 4.2 0.011 0.228 20.7FD+VN 0.668 21.380 32.0 3.457 16.278 4.7 0.214 16.278 76.1SD 0.002 0.032 16 0.005 0.020 4.0 0.001 0.020 20.0SD+VN 0.794 23.753 29.9 4.008 19.254 4.8 0.306 19.254 62.9
Table 2: Ability of spectral preprocessing methods to remove the effect of glass vials on NIR spectra of drug samples.
Preprocessing Method V M V/MUnpreprocessed 0.0463520 0.001276 36.33VN 0.0003164 0.000166 1.91FD 0.0000548 0.000044 1.25FD+VN 0.0006116 0.002221 0.28SD 0.0000026 0.000006 0.43SD+VN 0.0007046 0.005114 0.14
Table 3: Effectiveness of preprocessing methods at reducing differences between spectra due to particle size variations of lactose samples as assessed by the VM ratio.
Preprocessing Method Crystallinity of ceftriaxone sodium100% 60% 30% amorphous
Unpreprocessed 1.00 0.96 0.92 0.87VN 1.00 0.96 0.92 0.87FD 1.00 0.97 0.84 0.53FD+VN 1.00 0.97 0.84 0.53SD 1.00 0.99 0.94 0.34SD+VN 1.00 0.99 0.94 0.34
Table 4: The correlation coefficients in the range of 6500cm-1~5500cm-1 between the preprocessed spectra with different crystallinity and the spectrum of 100% crystallinity.
Crystallinity of ceftriaxone sodium100% 60% 30% amorphous
Original spectra 1.00 0.96 0.92 0.87PLS loading 1 1.00 0.99 0.99 0.99
Table 5: The correlation coefficient of between Original spectra and between PLS loading 1 to ceftriaxone sodium with different crystallinity in the range of 6500cm-
1~5500cm-1.
Glass vials No NIR Prediction contents using different preprocessing method (%,mg/mg)Unpreprocessing VN FD FD+VN SD SD+VN
1 97.7 91.7 96.1 92.4 97.0 89.62 88.5 92.4 86.7 91.4 84.8 88.13 88.4 89.2 88.8 90.8 88.6 88.44 93.6 91.3 92.3 91.0 92.4 88.25 90.4 91.9 91.1 91.8 91.8 88.96 87.2 91.2 87.6 91.4 86.8 87.77 93.2 92.4 95.6 91.8 97.7 88.78 91.3 91.3 88.7 92.1 88.1 89.19 89.5 92.2 87.7 91.9 86.7 89.710 98.8 92.7 97.4 90.7 98.6 88.311 86.7 94.6 87.3 90.9 87.2 89.012 87.3 92.3 87.8 91.2 87.7 89.613 85.0 93.1 86.7 92.0 85.6 89.114 96.0 92.7 95.9 91.6 95.7 89.315 87.5 91.2 89.3 90.8 88.9 89.516 87.3 92.7 87.5 90.9 86.4 89.417 95.9 91.8 95.8 91.3 96.5 88.818 86.1 92.0 88.3 91.1 88.3 89.919 84.0 92.3 86.9 93.2 86.5 90.520 85.0 93.7 87.9 92.4 87.6 90.2RMSEP 2.93 2.88 3.29 0.44 4.72 2.03
Table 6: The NIR Prediction results of one batch of cefuroxime sodium in different glass vials by different preprocessing method.

Citation: Ni Z, Feng YC, Hu CQ (2011) Analyzing the Methods to Remove Artifacts Encountered in the Development of a NIR Quantitative Model for Powder Medicines. J Anal Bioanal Techniques 1:114. doi:10.4172/2155-9872.1000114
Page 6 of 7
J Anal Bioanal TechniquesISSN:2155-9872 JABT, an open access journal
Volume 1 • Issue 3 • 1000114
spectra with spectral preprocessing method. However, the results showed that the spectral differences came from their corresponding samples’ crystallinity cannot be reduced by spectral preprocessing method, especially for amorphous samples (shown in Table 4).
The PLS loading factors of different crystallinity samples to the spectrum of 100% crystallinity were compared, The PLS loading 1 and the spectrum of 100% crystallinity for ceftriaxone sodium were shown in Figure 5. The correlation coefficient between these two spectra in the range of 6500cm-1~5500cm-1 can reach to 0.99 (shown in Table 5). These results indicated that when developing an NIR model for prediction of crystalline samples, the crystallinity effect on spectra could be reduced if samples of different crystallinity were contained in the calibration set and the proper PLS vectors were used in applying partial least squares fitting.
Validation of the common methods of NIR analysis
Validation of a function to reduce glass vial effects: The contents of the one batch of cefuroxime sodium in different ordinary commercial glass vials were predicted by the different new quantitative models. The effects of the preprocessing methods were assessed by the RMSEP. As shown in the Table 6, proper spectral preprocessing methods could remove the effect of glass vials of samples, and FD+VN was the most effective preprocessing method. These results are similar to those found in section 1.1.
Validation of function to reduce particle size effects: The contents of the three samples created from the same batch of cefuroxime sodium were predicted by the different new quantitative models. As shown in the Table 7, proper spectral preprocessing methods could remove the effect of particle size, FD+VN and SD+VN were the two most effective methods and SD+VN seems somewhat better than FD+VN. This is in agreement with section 1.2.
Validation of function to reduce the effects of crystallinity: The NIR quantitative model of ceftriaxone sodium for injection which was constructed by the crystalline component was used to predict the samples of ceftriaxone sodium with different crystallinity. It was found that the accuracy of prediction become poorer as the crystallinity of sample was lowered and RMSEP was 27.2%. If the updated new model was used, the results become much better (RMSEP was 1.5%).
Particle sizeNIR Prediction contents using different preprocessing method (%,mg/mg)Unpreprocessing VN FD FD+VN SD SD+VN
500~180um 103.0 92.8 99.6 95.7 104.6 94.6180~75um 101.3 94.2 97.9 95.4 102.0 93.775~45um 90.8 96.6 92.7 93.9 94.1 93.1RMSEP 5.20 1.72 7.27 1.31 4.41 0.28
Table 7: The NIR Prediction results of one batch of cefuroxime sodium with different particie size by different preprocessing method.
Crystallinity of samplesOriginal model which calibration set only containing crystalline form[17 ] New model which calibration set containing amorphous and
crystalline forms
Prediction content (%,mg/mg) Content difference with true (HPLC 82.9%) Prediction content (%,mg/mg) Content difference with true
(HPLC 82.9%)0% 35.1 47.8 81.4 1.510% 40.7 42.2 79.7 3.220% 47.1 35.8 81.5 1.430% 51.6 31.4 82.0 0.940% 56.1 26.8 80.8 2.150% 60.9 22.0 81.5 1.460% 65.4 17.5 81.6 1.370% 69.9 13.0 82.3 0.680% 73.0 9.9 81.9 1.090% 77.3 5.6 82.6 0.3100% 81.6 1.3 82.6 0.3Mean (%) 59.9 23.0 81.6 1.3RMSEP (%) 27.2 1.5
Table 8: The NIR Prediction results of ceftriaxone sodium with different crystallinity by models constructed from different calibration sets.
The results are shown in the Table 8. The PLS loading 1 of the new model was compared to the NIR spectra of amorphous (0%) and
Figure 7: Comparison between the PLS loading 1 of NIR quantitative model for cefoperazone sodium with the spectrum of the amorphous (a) and crystalline (b) cefoperazone sodium (FD+VN).
-0.1
50-0
.100
-0.0
50-0
.000
0.
050
0
.100
11000 10000 9000 8000 7000 6000 5000 4000
-0.1
50-0
.100
-0.0
50-0
.000
0.
050
0
.100
11000 10000 9000 8000 7000 6000 5000 4000
Abs
orba
nec
Uni
tsA
bsor
bane
c U
nits
(a)
(b)
the spectrum of amorphous cefoperazone sodium
the spectrum of crystalline cefoperazone sodium
the PLS loading 1
the PLS loading 1
Wavenumber cm-1
Wavenumber cm-1
Citation: Ni Z, Feng YC, Hu CQ (2011) Analyzing the Methods to Remove Artifacts Encountered in the Development of a NIR Quantitative Model for Powder Medicines. J Anal Bioanal Techniques 1:114. doi:10.4172/2155-9872.1000114
Page 7 of 7
J Anal Bioanal TechniquesISSN:2155-9872 JABT, an open access journal
Volume 1 • Issue 3 • 1000114
100% crystalline ceftriaxone sodium (Figure 6.) respectively. All were shown good correlation. We could conclude that the artifacts from sample crystallinity could be reduced, if the calibration set contained all possible samples of different crystallinity. These results agree with those in section 1.3.
Figure 7 compares the PLS loading 1 of NIR quantitative model (the calibration set was composed of samples of amorphous and crystalline form) for cefoperazone sodium [15] and the spectra of the amorphous and crystalline forms of cefoperazone sodium, respectively. It also showed good correlation. The conclusions of section crystallinity of samples and the methods to remove this effect were again confirmed.
ConclusionThis paper discussed three main factors (wrapper, particle size and
crystalline of sample) that interfere with the ability to universally apply a quantitative model of drug analysis to powers used for injection. The effects from wrapper and particle size could be removed with proper spectral preprocessing methods, though some methods are better than others. If FD+VN is applied, it can remove the effects of wrapper and particle size simultaneously. Thus, FD+VN is the preferred spectral preprocessing method of analyzing powders for injection. The effects of crystallinity cannot be removed with spectral preprocessing methods, but they can be reduced by choosing the proper calibration set containing a variety of crystallinities, selecting the proper principle component, and using a PLS technique. However, how to reduce the impact of powder compaction and the combination impact are not involved in this study. Further studies about them are needed in our future work. References
1. Roggo Y, Chalus P, Maurer L, Lema-Martinez C, Edmond A, et al. (2007) A review of near infrared spectroscopy and chemometrics in pharmaceutical technologies. J Pharm Biomed Anal 44: 683-700.
2. Luypaert J, Massart DL, Vander Heyden Y (2007) Near-infrared spectroscopy applications in pharmaceutical analysis. Talanta 72: 865-883.
3. Reich G (2005) Near-infrared spectroscopy and imaging: Basic principles and pharmaceutical applications. Advanced Drug Delivery Reviews 57: 1109-1143.
4. Scafi SH, Pasquini C (2001) Identification of counterfeit drugs using near-infrared spectroscopy. Analyst 126: 2218-2224.
5. Olsen BA, Borer MW, Perry FM, Forbes RA (2002) Screening for Counterfeit Drugs Using Near-Infrared Spectroscopy. Pharm Tech. 26: 62-71.
6. Rodionova OY, Houmøller LP, Pomerantsev AL, Geladi P, Burger J, et al.
(2005) NIR spectrometry for counterfeit drug detection A feasibility study. Anal Chim Acta 549: 151-158.
7. Vredenbregt MJ, Blok-Tip L, Hoogerbrugge R, Barends DM, de Kaste D (2006) Screening suspected counterfeit Viagra and imitations of Viagra with near-infrared spectroscopy.J Pharm Biomed Anal 40: 840-849.
8. Hu CQ, Feng YC (2004) The Construction and Feasibility Study of Near Infrared System for Fake and Counterfeit Drug Identification. Chin Pharm Aff 18: 250-252.
9. Feng YC, Hu CQ (2006) Construction of universal quantitative models for determination of roxithromycin and erythromycin ethylsuccinate in tablets from different manufacturers using near infrared reflectance spectroscopy. J Pharm Biomed Anal 41: 373-384.
10. Mukhopadhyay R (2007) The Hunt for Counterfeit Medicine. Anal Chem 79: 2622-2627.
11. Liu XP, Feng YC, Hu CQ, Ding L (2008) Construction of universal quantitative models for determination of cefradine capsules. Chin J Pharm Anal 28: 722-726.
12. Lei Y, Luo ZY, Hu CQ (2008) Rapidly screening counterfeit drugs using near infrared spectroscopy: combining qualitative analysis with quantitative analysis to increase effectiveness. J Near Infrared Spectrosc 16: 349-355.
13. Chong XM, Hu CQ, Feng YC, Pang HH (2009) Construction of a universal model for non-invasive identification of cephalosporins for injection using near-infrared diffuse reflectance spectroscopy. Vib Spectrosc 49: 196-203.
14. Chong XM, Hu CQ, Feng YC, Pang HH (2009) Construction of a universal model for non-invasive identification of penicillins for injection using near-infrared diffuse reflectance spectroscopy. Vib Spectrosc 51: 313-317.
15. Pang HH, Feng YC, Hu CQ (2006) Construction of Universal Quantitative Models for Determination of Cefoperazone Sodium for Injection from Different Manufacturers Using Near Infrared Reflectance Spectroscopy. Spectroscopy and spectral analysis 26: 2214-2218.
16. Pang HH, Feng YC, Zhang XB, Hu CQ (2008) Construction of universal quantitative models for the determination of cefoperazone sodium/sulbactam sodium for injection from different manufacturers using near-infrared reflectance spectroscopy. J Chin Pharm Sci. 17: 22-29.
17. Hou SR, Feng YC, Hu CQ (2008) Development of a near-infrared method for rapid determination of ceftriaxone and water content in ceftriaxone sodium for injection. Chin J Pharm Anal 28 936-941.
18. Ni Z, Hu CQ (2008) Development of a Near IR Method for Rapid Determination of Cefuroxime Sodium for Injection. Chin Pharm J 43: 138-141.
19. Aucott LS, Garthwaite PH, Buckland ST (1988) Transformations to reduce the effect of particle size in near-infrared spectra. Analyst 113: 1849-1854.
20. The State Pharmacopoeia Commission of The People’s Republic of China (2005) Pharmacopoeia of the People’s Republic of China. Chemical Industry Press.