ancient and pre-modern economies gdp in roman empire … · ancient and pre-modern economies gdp in...
TRANSCRIPT

Elio lo CaSCio & Paolo MalaniMa
anCiEnT anD PRE-MoDERn EConoMiESGDP in RoMan EMPiRE anD EaRlY MoDERn EURoPE
Were the ancient Greeks and Romans richer or poorer than medieval and early
modern European inhabitants? Was the productive capacity of the ancient Euro-
Mediterranean economies comparable to that of the late Middle ages and early
Modern European civilizations? How far was ancient per capita GDP from that of
our modern advanced societies?
Some 40 years after the famous work by Finley 1 on the ancient economy, his-
torians of the ancient Greek and Roman world share a very diverse perspective
and stress the rising trend of product, aggregate and per capita, both in the classi-
cal Greek economy of the 8th- 4th century BCE and in the Roman civilization dur-
ing the last centuries of the Republic and the first of the Principate. 2 Today, ancient
economies are seen much more modern than they were some decades ago. a cen-
tral question of interest lies, however, in the comparison between the economic
performance of these ancient economies and those of late medieval and early mod-
ern Europe. To this question we still lack an answer. We do not know how far the
productive capacity of these ancient economies was from the medieval, early mod-
ern and modern economies and we do not know if modern growth was preceded
by a slow rising path of several centuries or even millennia or by an overall stability
with cycles of growth and decay. it is apparent that the answer to this problem can
suggest different views of pre-modern economic history and the path towards mod-
ernization.
a central problem when dealing with a vast area, such as the Roman Empire
(2,750,000 km2 at the death of augustus and 3,800,000 km2 in the late 2nd cen-
tury CE), is the great variety of regional economic conditions. Differences in
prices and wages were considerable at that time. it may be noted that if we use
1 Finley 1973.2 Scheidel, Morris & Saller 2007.

basic data referring to italy, in our GDP reconstructions, the results we attain are
different from those reached whenever we refer to Egypt or other Eastern
provinces. in this paper, we will deal only marginally with the economic differ-
ences among regions. We will focus, instead, on the differences among the esti-
mates for the entire early Roman Empire, over the long period between the death
of augustus and the antonine Plague in 160-180 CE. 3 Given the scarcity of pri-
mary data, scholars are forced to use quantitative information spanning this very
long period.
in the following analysis, we will start by presenting the figures put forward by
different scholars over the last decades and discuss their methods. later we will
analyse the problem of the comparability between data concerning the early Roman
Empire on the one hand and those relating to Europe in the late Middle ages and
early Modern age on the other. Despite the primary interest of this topic, it has
been only touched upon by scholars.
1. Diverse estimates
in the following Table 1, the diverse results put forward by different scholars
during the years 1980-2009 are summarized (in columns 1, 2). in the third column
the estimates are reported in sesterces (HS). in columns 4 and 5, per head GDP is
multiplied by two different estimates of the population of the Empire, 40 and 100
million. These represent the lowest and highest limits of a range that the scholars
of the Roman world would consider as plausible for the long period under exam-
ination, spanning a century and half after the death of augustus in 14 CE. actu-
ally the lowest estimate has been proposed by Mc Evedy and Jones 4 (about 40-46
million), Frier 5 (45.5 million in CE 14, rising to 61.4 in CE 164) and Maddison 6
(44 million). That of 100 million is the likely highest margin of the range. 7 in
columns 6, 7, 8, 9, aggregate GDP is presented in tons of silver and gold. The
weight of the sesterce in gold was 0.08 grams (actually, with three decimals, 0.077
grams, since a gold libra – more or less 325 grams — was coined in the augus-
tan age into 42 aurei, equal to 4,200 sesterces). The ratio gold-silver being at that
time 12.5, a sesterce equaled 1 gram of silver (actually 0.97, although we round
off our figures to 1).
3 on the topic see lo Cascio 2012. 4 Mc Evedy & Jones 1978, 21 and passim.5 Frier 2000, 812 and 814.6 Maddison 2007, 35.7 Beloch 1899, attributed specifically to the age of Caracalla.
Elio lo CaSCio & Paolo MalaniMa230

We can see that the per capita estimate by R. a. Goldsmith 8 is 130 per cent higherthan that by P. Temin, 9 at least in nominal terms (we will see later that in real termsthe difference is much lower) and 45-65 per cent higher than that of the other authors.Data proposed by Hopkins, Bang and Scheidel-Friesen stay between 230 and 260sesterces per capita, in a range that is lower than 15 per cent between maximum andminimum. The estimate by Goldsmith has been recently accepted by Maddison. 10
Because of our uncertainties about population level and the notable differencebetween the lower and higher demographic estimates, the range of the aggregateproduct is much wider than that per capita. Gross output of the Empire is in fact5.7 times higher in the estimate by Goldsmith than in that by Temin, taking therange between the lowest estimate of GDP per head 11 for a population of 40 mil-lion and the highest estimate for GDP, 12 with a population of 100 million.
2. A similar method
While the results are diverse, the methods followed by these scholars are sim-ilar. The starting point is the average wheat consumption per capita during one
8 Goldsmith 1984.9 Temin 2006.10 Maddison 2007.11 Temin 2006.12 Goldsmith 1984.
anCiEnT anD PRE-MoDERn EConoMiES GDP in RoMan EMPiRE anD EaRlY MoDERn EURoPE 231
1 2 3 4 5 6 7 8 9 HS HS HS Silver Silver Gold Gold authors year Per c. 40 million 100 million 40 million 100 million 40 million 100 million GDP (000.000) (000.000) (tons) (tons) (tons) (tons) Temin 2006 166 6,640 16,600 6,640 16,600 531 1,328 Bang 2008 230 9,200 23,000 9,200 23,000 736 1,840 Hopkins 1995-96 250 10,000 25,000 10,000 25,000 800 2,000 Scheidel-Friesen 2009 260 10,400 26,000 10,400 26,000 832 2,080 Goldsmith 1984 380 15,200 38,000 15,200 38,000 1,216 3,040
!
!
!
!
!
!
!
!
!
!
! !
!
HS Shares as to y=1
Shares as to w=1
Note: in columns 4-9, we compute the aggregate values in sesterces, silver and gold with two different es-timates of the population (40 and 100 million). Calculations in columns 4-9 are ours, and not provided bythe authors in their contributions.The estimate by Hopkins is based on Hopkins 1995-1996 (republished in Hopkins 2002). Hopkins puts(2002, 199) minimum subsistence at HS 165 per capita. Then he suggests (2002, 210, footnote 44) the ad-dition of 50 per cent to reach per capita GDP (then HS 165 • 1.50= 247.5). We round off the result to HS250. The same procedure is followed by Bang, who puts the aggregate GDP for a population of 60 millionat 13,700 million sesterces and therefore computes per capita GDP at 230 sesterces (p. 91).
Table 1. Estimates of per capita and aggregate GDP in the early Roman Empire per author, in ses-terces and tons of silver and gold.

year multiplied by the price of wheat. To this basic consumption in value several
additions are made in order to include other forms of consumption and finally state
expenses and investments. Since the authors of these estimates refer to the Roman
Empire, a distinction between national and domestic product is not necessary. We
can assume that they coincide. The distinction between national and domestic es-
timates would become important should we choose to evaluate the product of par-
ticular regions within the Empire. national product was certainly higher in italy
than domestic product because of the taxation of provincial populations and in-
vestments made outside italy by rich italian families. a flow of foreign revenues
that reached italy was employed there. For other regions national income could be
correspondingly lower than domestic income.
Since a. Maddison tried, in 2007, to improve on Goldsmith’s estimate, which
is the most accurate and complete, we will summarize Maddison’s calculations re-
ferring to 14 CE, that is, at the death of augustus. The approach in both cases is
from the demand side, since output per head is calculated on the basis of demand
for consumption, investment and public expense. The result attained by Maddison
for the Roman Empire is the same as that by Goldsmith, with a slight difference in
the share of government expense, investment and expenditure on consumption
other than food.
The estimate by Goldsmith is based on both wheat consumption, assumed to be
about 250 kg per person per year (about 1,500 Calories per day), confirmed by re-
cent research on consumption in the early Roman Empire 13 and a wheat price of 3
sesterces per modius (6.75 kg); that is approximately 0.444 sesterces per kg in the
1st century CE. 14
We know that an average wheat price relative to some decades is hardly repre-
sentative in pre-modern agrarian economies, given the wide yearly deviations. in
medieval and early modern European series of wheat prices annual deviations from
the trend of 50 per cent were far from exceptional. While for italy we have scanty
figures on the price of wheat in the early Empire, for Egypt more detailed infor-
mation is available and we see that wheat prices double or even treble over a few
years. 15 Variability was a feature of the agrarian price history until a recent epoch.
However, according to Goldsmith, his own estimate could be “approximately valid
from the late first century BC to the mid-second century aD”, and the price of 3
sesterces per modius of wheat could also be assumed as a long-term average. 16
13 Jongman 2007, 599.14 a slightly lower weight for the modius, 6.55 kg. is given by Bang 2008, XV and passim.15 Duncan-Jones 1990, 146, and Table 151 ff.; see also Drexhage 1991 and Rathbone 1997, 190-
198; lo Cascio 2009, 253, Table 1.16 Goldsmith 1984, 263.
Elio lo CaSCio & Paolo MalaniMa232

The price of 3 sesterces per modius throughout the whole Empire is nothing
but an assumption; plausible but not certain. We know, in fact, that in Egypt,
wheat prices were lower, and in some areas much lower, 17 and that, naturally,
they were much higher in the city of Rome. The price of 3 sesterces per modiuswas also the basis of Hopkins’ estimate of Roman GDP. 18 P. Temin, 19 taking the
much lower Egyptian prices, and assuming moreover a lower wheat consumption
of 175 kg per person per year, reaches an estimate of per head income which is
less than half the estimate proposed both by Goldsmith and Maddison as seen in
the previous Table 1. Temin compares the estimates by Goldsmith and Hopkins,
stating that “Goldsmith’s approach is more satisfactory than Hopkins’, that is,
more in touch with modern economic theory and observations”, but adding that
“Goldsmith’s numbers, however, are not as good as his methods”. in the end he
suggests an estimate of per capita income closer to that proposed originally by
Hopkins. in any case, it must be remembered that Hopkins’ original estimate re-
ferred to the minimum per capita expenditure (in terms of the annual consump-
tion of wheat or measured in wheat). in the latest version of his calculations, 20
he devised a rough multiplier of 1.5 in order to estimate the actual expenditure
from the minimum per capita expenditure for wheat. More recently Bang fol-
lowed the same method. 21
3. The procedure
Goldsmith calculated per capita GDP by adding to the estimate of wheat con-
sumption the share of other cereals, that of other food, of other consumption and
finally the share of government and investment. Maddison follows the first three
estimates of Goldsmith, but lowers the share of other consumption (from 39 to 34
per cent of the total per capita income) and raises the share of government and in-
vestment, in the 5th column of Table 2, from 8 to 13 percent and adding 45 percent
more to the single value of wheat consumption. all these percentages are based on
the likely share of these items of demand in pre-modern economies or in contem-
porary backward countries.
17 Duncan Jones 1990, 143-157 and Table ii, 152.18 Hopkins 1980.19 Temin 2006.20 Hopkins 1995-1996.21 Bang 2008.
anCiEnT anD PRE-MoDERn EConoMiES GDP in RoMan EMPiRE anD EaRlY MoDERn EURoPE 233

a compact presentation of Goldsmith’s and Maddison’s estimates can be ex-pressed through the following equation:
where y, c, f, o, g, i, reported in the first column of Table 2, refer to the items ofthe second column and represent proportions as regards per capita product as awhole (in the 4th column) and wheat (w)(in the last column). as can be seen, thecalculation depends on the value assigned to wheat consumption (w), which is theonly known parameter; or rather the only parameter to which we can assign a plau-sible value. Replacing the letters in the equation with figures (5th column of Table2), following Maddison, we obtain:
Per capita GDP, 380 sesterces, is then 3.4 times (the sum of the figures in brack-ets) the yearly wheat consumption per person (380/112).
Maddison improves upon the previous estimate by Goldsmith by trying to spec-ify per capita product in italy and in other regions of the Empire. Per capita GDPwas higher in italy than in the rest of the Empire. The italian population, equal to18 percent of the population of the Empire, enjoyed 26 percent of total output. Theresult, both in sesterces and kg of wheat, is reported in Table 3.
The same procedure from the consumption side is followed by Scheidel andFriesen. 22 Following Temin, they assume, however, as the starting point, lower percapita wheat consumption: 175 kg. They also provide calculations with the lower
22 Scheidel & Friesen 2009.
Elio lo CaSCio & Paolo MalaniMa234
!
!
!
!
!
!
!
!
!
!
! !
!
HS Shares as to y=1
Shares as to w=1
w Wheat 112 0.29 1.00
c Other cereals 18 0.05 0.16
f Other food 70 0.18 0.63
o Other consumption 130 0.34 1.16
g+i Government & Investment 50 0.13 0.45
y TOTAL 380 1.00 3.39
Note: in the last column on the right the figures represent the shares as to wheat consumption. E.g. 0.16refers to other cereals divided by wheat consumption (18:112 = 0.16).
Table 2. The estimate by Maddison (based on Goldsmith) of per capita GDP of the Roman Empirein 14 CE, from the demand side, in sesterces (HS).
!
!
!
!
!
!
!
!
!
!
! !
(1 )y w c f o g i= + + + + +
!
!
!
!
!
!
!
!
!
!
!
! !
= ! + + + +380 112 (1 0.16 0.63 1.16 0.45)
!

wheat prices of 2, 2.5 and 3 HS per modius. 23 The result they reach is about HS 260per head or HS 13-20 billion for the whole Empire (according to different pricesof wheat), with its 70 million inhabitants.
Given the scarcity of primary data, there are few ways of verifying these esti-mates of per capita and aggregate GDP. Three tests are tried in the following sec-tion: 1) a comparison with an estimate from the income side; 2) a comparison withthe monetary mass; 3) a comparison with state budget.
4. Testing the data
Whenever possible, a demand-side approach at estimating GDP can be usefullycomplemented by an income-side approach. according to Goldsmith, the income-side approach confirms that from the demand-side. When taking an average labourcompensation of 3.5 sesterces per day and an average number of 225 working daysper year, together with assumptions on the dependency ratio and on the share ofnon-labour incomes, the result tallies with the demand-side computation. accord-ing to Goldsmith, “average annual income per member of the labour force mayhave been close to HS 800 using an average labour income of HS 3½ to allow forthe higher wage of skilled workers as well as for the generally imputed lower wagesof women, children and slaves, and an average work year of 225 days, with a ratherwide margin of uncertainty”. 24
information on wages is, in fact, scanty and, as Temin remarks in his recon-struction, the level assumed by Goldsmith may appear to be too high. 25 on theother hand, the assumption of the working time of 225 days per year is quite de-
23 Scheidel & Friesen 2009, Table 2.24 Goldsmith 1984, 269.25 Temin 2006, 46.
anCiEnT anD PRE-MoDERn EConoMiES GDP in RoMan EMPiRE anD EaRlY MoDERn EURoPE 235
!
!
!
!
!
!
!
!
!
!
! !
Per c. product (HS)
GDP per c. wheat (kg)
Index GDP per c. Empire=1
Population
(index)
GDP
(index) Empire 380 856 1.00 1.00 1.00 Italy 534 1,203 1.41 0.18 0.26 Rest of Empire 351 791 0.92 0.82 0.76
!
Note: according to Maddison the total population of the Empire in 14 a.D. was 44 million and the italianpopulation (including the islands) 8 million. Source: Maddison 2007.
Table 3. Per capita GDP by Maddison in the whole Empire and italy in sesterces and kg of wheat;share of population living in italy and the rest of the Empire; share of GDP in italy and the rest ofthe Empire.

batable. We do not know how many days workers in the distant past actually
worked. assuming a working year of 150 days, also plausible, yearly labour com-
pensation diminishes to 525 sesterces, which is 35 per cent less than the yearly av-
erage proposed by Goldsmith. on the other hand, a participation rate of 40 per
cent, assumed by Goldsmith, 26 and accepted by Scheidel and Friesen 27 is the same
as that in many Western economies today. Participation rate was high in past agrar-
ian societies; higher than today. What did change considerably was working time;
people working more when wage rates were low and less when wage rates were
high. Unfortunately we know very little about working time. 28
Furthermore, we must increase the calculation based on wage to take into ac-
count “rents, interests, indirect taxes”. 29 To Goldsmith a 20 per cent increase seems
justified. The average income per recipient of monetary or imputed income then
reaches HS 1000. in this case, however, labour income represents 80 per cent of
the total average income, which is quite a high share (although in pre-modern
economies labour could represent a higher share of income than in modern
economies, where labour is often assumed equal to 50-70 per cent of total in-
come). 30 We see that few, apparently marginal, adjustments in wage per worker or
labour time or participation rate or percentage of labour on total income can result
in significant changes in the average level.
a second way to check the estimates of GDP is that of evaluating their consis-
tency with estimates of money supply and monetary stock recently built by some
scholars – above all by Duncan-Jones 31 – including the importance of credit. 32 The
estimate by Duncan-Jones of 20 billion sesterces refers to the mid-second century
and is far higher than that proposed by Goldsmith for the augustan age (6-8 bil-
lion, that is 6-8,000 tons of silver); but low, as we will see in section 6, when com-
pared to that of early modern Europe after the arrival of the american gold and
silver. according to Goldsmith, this last figure of 6-8 billion sesterces “would
imply ratios of three-tenths to four-tenths of total and of three-fifths to four-fifths
of monetized national product and velocities of circulation of 2.5 for total and of
1.5 to 2.5 for monetized national product”. 33
The estimate by Duncan-Jones must be deflated in order to take into account the
probable increase in the monetary stock between the augustan age and the mid-sec-
26 Goldsmith 1984, 271.27 Scheidel & Friesen 2009, 71, Table 3.28 See the comments in Malanima 2011.29 Goldsmith 1984, 269.30 Barro & Sala-i-Martin 1995, chap. 10.31 Duncan-Jones 1994, 170; and more recently by Hoz Montoya 2008. 32 lo Cascio 2003, 8 and lo Cascio 2010.33 Goldsmith 1987, 41.
Elio lo CaSCio & Paolo MalaniMa236
ond century. Even so, it can only be justified if we assume either that the economy
was much more monetized than that of late medieval Europe, or that the velocity
of circulation of money was much lower than in European pre-industrial
economies, 34 or even that GDP was significantly higher than estimated by Gold-
smith: and this may, of course, derive from the fact that either the population of the
Empire was much higher or per capita GDP was higher. in this case, even the al-
ready high estimate by Goldsmith, with the assumption of the highest estimate for
the population of the Empire (100 million inhabitants) would appear too low. We
would venture to say that of these three possible explanations, each of which is
not necessarily exclusive, the last one is the most plausible. in this case the Roman
economy would appear less singular in comparison to pre-industrial European
economies. These comparisons between money supply and previous estimates of
GDP would suggest the highest, by Goldsmith, to be more reliable. Those by Hop-
kins, Scheidel-Friesen and Bang, however, would be compatible with the lowest es-
timates of the monetary mass (HS 6-8 billion) only by assuming the highest level
– 100 million – for the population of the Empire.
a third test is that of comparing output with estimates of the state budget. Cur-
rent estimates from the point of view of expenditure, particularly those by Duncan-
Jones, referring to 150 and 215 CE, seem to be very conservative. 35 They either do
not take into account many items of expenditure or assume too low a value for them.
Thus the cost of the army most certainly should be increased (there is much more than
just the expenditure for army pay in military expenditure), as should the expenditure
on public works and infrastructure. in addition the expenses supported by the mu-
nicipalities must be taken into account. Total expenditures at the time of augustus
have been estimated HS 600 million 36 and 825 million. 37 assuming the lower value,
the percentage of GDP in the estimate by Goldsmith, is hardly more than 3. The per-
centage is higher in the case of the lower calculations of GDP reaching 7-8 per cent.38
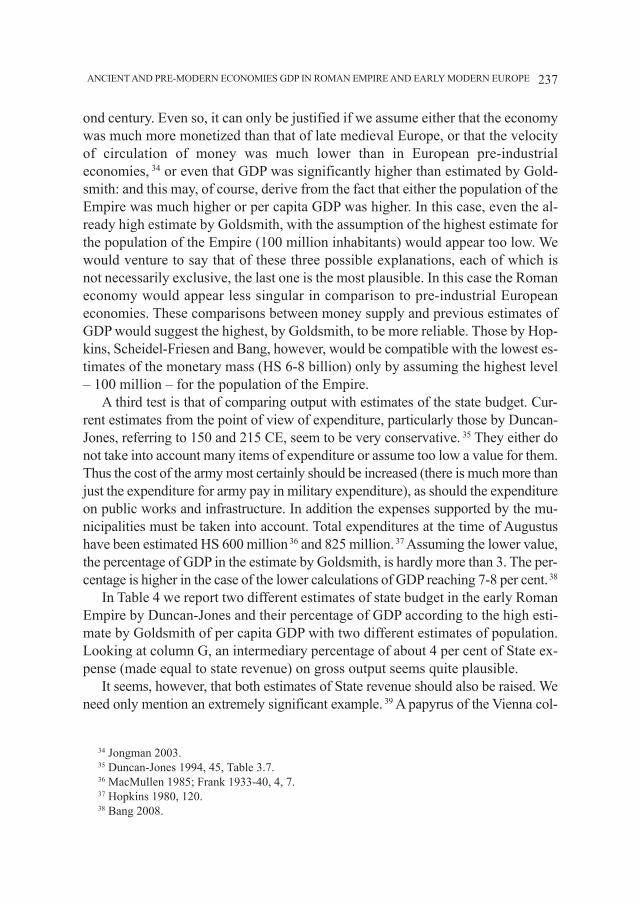
in Table 4 we report two different estimates of state budget in the early Roman
Empire by Duncan-Jones and their percentage of GDP according to the high esti-
mate by Goldsmith of per capita GDP with two different estimates of population.
looking at column G, an intermediary percentage of about 4 per cent of State ex-
pense (made equal to state revenue) on gross output seems quite plausible.
it seems, however, that both estimates of State revenue should also be raised. We
need only mention an extremely significant example. 39 a papyrus of the Vienna col-
34 Jongman 2003.35 Duncan-Jones 1994, 45, Table 3.7.36 MacMullen 1985; Frank 1933-40, 4, 7.37 Hopkins 1980, 120.38 Bang 2008.
anCiEnT anD PRE-MoDERn EConoMiES GDP in RoMan EMPiRE anD EaRlY MoDERn EURoPE 237

lection, published twenty years ago, known as the Muziris Papyrus, provided us with
information, whose importance would be difficult to underestimate, on the nature and
volume of trade between Rome and india in the mid-second century. 40 The document
reports the cargo of a seemingly small ship, devoted to the transport of goods from the
port of Muziris, on the southern coast of india on the indian ocean, to Berenice on the
coast of the Red Sea. The imports in question had to pay the custom due of 25 per cent.
now, the value of the goods transported, calculated for the payment of the tax, is 1,154
talents and 2,852 drachmas, amounting to 6,926,852 sesterces. The custom due paid
on this cargo alone therefore amounted to 2,308,950 sesterces. it was noted recently
by a. Wilson 41 that a hundred ships loaded with goods of equal value, a credible es-
timate of the annual traffic between the coast of the Red Sea and india, would have
yielded to the state a sum corresponding to one third of that required to pay the annual
expenditure for the army as calculated by Duncan-Jones (see column E of previous
Table 4). We must therefore assume that either the revenues of the imperial state were
dramatically higher than so far calculated or that the incidence of taxes on foreign
trade was disproportionately high and that the incidence of land tax was much too
low. The result would be that the tax burden on the majority of the inhabitants of the
Empire was very slight (even taking into account the legal exemptions of some areas
or individual towns from the most important taxes, such as the land tax and the poll
tax, and even taking into account a large proportion of evasion), or that the size of the
economy as a whole was much greater than the evaluation made so far: not only far
greater than Temin‘s estimation (2006) or Hopkins’ (1980), but also greater than those
made by Goldsmith (1984) and Scheidel and Friesen (2009). The first two alternatives
are not so convincing. The Egyptian evidence, revisited recently by a. Bowman (forth-
39 Hopkins 2009, 190.40 Rathbone 2000.41 Wilson 2012, 290; see Wilson 2009, 217, n. 6.
Elio lo CaSCio & Paolo MalaniMa238
A B C D E F G Per c.
GDP HS
Population (000,000)
GDP HS
(000,000)
Expenditure (=state income)
HS (000,000)
Expense for army
HS (000,000)
Taxation on GDP (D1/C1
and D2/C2 (%)
Taxation on GDP
(D1/C2 and D2/C1 (%)
1 380 40 15.200 682 493 4.49 1.79 2 380 100 38.000 833 554 2.19 5.48
!
!
!
!
!
Note: data in G refer to the range between the lowest estimate for taxation (in D1) and the highest estimateof aggregate GDP (in C2) and the highest estimate for taxation (in D2) and the lowest estimate for GDP(in C1). Source: Duncan-Jones 1994, 36, Table 3.3, 45, Table 3.7.
Table 4. Percentage of state expense on GDP according to two different estimates of population andtwo different estimates of state expenditure and army expenditure in the early Roman Empire (withthe same per capita GDP of HS 380).

coming), suggests that the level of taxation in the Principate must have been higherthan commonly thought; even though it is difficult to believe that the weight of thepublic sector on the GDP could have been more than 10 per cent. a third alternativeexists: the size of the imperial economy was greater than recently estimated. But evenin this case we can not say whether and to what extent this greater size was the out-come of a higher population or a higher per capita GDP.
5. Roman and pre-modern economies
These estimates of GDP would certainly be much more useful to the economichistorian and economist if they would enable to establish comparisons betweenthem and those recently proposed by several historians for following epochs. inother terms: was the Roman economy more or less developed in comparison withthose of medieval and early modern Europe, for which more reliable quantitativeinformation is available? according to Temin the level of GDP per head in theRoman world was closer to that of Ruanda or Uganda today, 42 that is $ 700-800. 43
in Table 5, we report a series of data on per capita GDP presented by a. Mad-dison for Western Europe. While few historians would consider these data aswholly reliable, many would agree on the long-term trend they show. accordingto Maddison, a progressive path characterized the long evolution of the economyfrom antiquity to the eve of the industrial Revolution, although the rate of growthwas very low and imperceptible to coeval observers. Per capita GDP in the RomanEmpire was higher than that around the year 1000. in the eight centuries from 1000to 1820, per capita GDP trebled. in any case ancient average income was half thaton the eve of the industrial Revolution.
42 Temin 2006, 43.43 Maddison 2001, 602-603.
anCiEnT anD PRE-MoDERn EConoMiES GDP in RoMan EMPiRE anD EaRlY MoDERn EURoPE 239
!
!
Per c. GDP Index 1 576 1.35 1000 427 1.00 1500 771 1.81 1600 889 2.08 1700 997 2.33 1820 1,202 2.81 1870 1,960 4.59 1913 3,457 8.10 1950 4,578 10.72 2001 19,912 46.63
!
!
!
Source: Maddison 2007, 70 and 382
Table 5. levels of per capita GDP in Western Europe from 1 to 1870 according to a. Maddison(Geary-Khamis 1990 international Dollars PPP).

on the other hand, other scholars, a minority however, maintain that in past ad-
vanced agricultural civilizations before the industrial Revolution, differences in
per head GDP were indeed marginal. according to them, the range of variation in
GDP per capita was modest in the 5-7,000 years before modern growth and did not
follow a rising path at all. 44 Cycles of growth did indeed occur, but around an over-
all long-term stability. Great agrarian civilizations developed, but productive ca-
pacity, measured by per capita GDP, did not exceed the range from the 700
international 1990 dollars used by Maddison in the previous Table and 1,400 at
best. Growth, in past agrarian civilizations, meant then an imperceptible rise from
1 to 2, often followed by a fall from 2 to 1. The entire cycle could last 3-5 centuries.
When trying to compare Roman per capita GDP and data proposed for the fol-
lowing epochs a difficulty arises from the methods themselves used in the exist-
ing estimates. in fact, all attempts made so far to assess per capita GDP in the
Roman Empire run the risk of being based on circular reasoning. The authors of the
estimates derive the shares of any item composing GDP per head from the better-
known figures relating to the following agrarian economies. in other words, if we
start the exercise of estimating Roman GDP per head from the actual consumption
of wheat in pre-modern economies and to this figure we add a share for the con-
sumption of other cereals, a share for non-agricultural consumption, a share for
investment and state expense, and if all these shares are chosen in the light of pre-
modern European economies, why should we, in the end, come up against a dif-
ferent level of real per capita GDP? We believe that the procedure used in the
estimates previously discussed is the only one that can be used at the present state
of our knowledge. We also believe that these estimates are able to single out a re-
alistically reliable range of values. We disagree, however, on the important result
of these estimates: that is, on the conclusion that the average income in the early
Roman Empire was lower or much lower than in early modern Europe.
6. The conclusions by Goldsmith and Maddison
Both Goldsmith and Maddison try a comparison of per capita GDP in the early
Roman Empire and pre-modern Europe through a conversion of Roman GDP into
silver and wheat.
it is not easy to make a comparison in precious metal between GDP in the an-
cient world and early modern Europe as the difference in the availability of gold
and silver was so substantial. 45 as we have seen, the Roman monetary mass was
44 Clark 2007.45 lo Cascio & Malanima 2009.
Elio lo CaSCio & Paolo MalaniMa240

20,000 tons of silver in the mid-second century CE, according to the higher esti-
mate which is far from certain. as regards pre-modern Europe, there is agreement
on a monetary mass of 47,426 tons of silver (gold included, converted into silver)
in 1809. 46 about monetary reserves in 1500 scholars disagree. The range between
the lowest estimate of only 1,000 tons of silver (including gold converted into sil-
ver according to the ratio of the time between the value of gold and that of silver) 47
and the highest, 40,000-60,000 tons of silver plus 5,000 tons of gold 48 is too wide
to be useful. Braudel and Spooner discussed the problem in 1967, but were unable
to specify monetary reserves in precious metal in 1500. 49 However, we know (and
in this case the approximation of our knowledge is far more satisfactory) that be-
tween 1550 and 1600, 7,100 tons of silver arrived in Seville, plus 95 tons of gold. 50
Between 1550 and 1650, 16,000 tons of silver were unloaded in Seville 51, which
according to the higher estimate by Duncan-Jones is not far from the total money
reserve in the Roman Empire at the middle of the second century.
Since the margins of uncertainty about the precious metal are so wide, a better
possibility is that of comparing the price of wheat in precious metal in Roman an-
tiquity and late Middle age-early Modern Europe. The price of 3 HS per modiusimplies a price per kg of wheat of 0.444 HS in the 1st century CE. Since the weight
of a sesterce in silver is approximately 1 gram, then wheat price in silver is 0.444
grams per kg, while lower prices of 2.5 and 2 HS per modius correspond to 0.37
and 0.30 grams per kg. in the Edictum de pretiis by the Emperor Diocletian in 301
CE, a kg of wheat was evaluated 0.394 gr. of silver 52 and so not far from the 1st cen-
tury CE evaluation. a comparison of wheat prices in 15th and early 16th century
Europe, and particularly in italy and England, shows that, once converted into sil-
ver, the price was close to the level of the 1st century CE. Things changed with the
Price Revolution and the importation of precious metals from america. in the 17th
century, taking the average of 100 years of wheat prices in England and italy, the
result was in both cases higher than 1 gram of silver per kg of wheat. 53 Both in
naples and Strasbourg the average was 0.800-0.900 gr of silver in the 18th cen-
tury. 54 The conclusion by both Goldsmith and Maddison that in silver, per capita
46 Braudel & Spooner 1967 and Day 1987.47 Day 1987, 60.48 Boyer-Xambeu, Deleplace & Gillard 1986, 137.49 Braudel, Spooner 1967.50 Boyer-Xambeu, Deleplace & Gillard 1986.51 These data on importation of precious metals from america are the same suggested by Braudel
and in the afore cited works.52 allen 2009. 53 We utilized English and italian wheat prices reported in Malanima 2009, chap. 6 and chap. 4,
Figure 12.54 allen 2009, Table 2.
anCiEnT anD PRE-MoDERn EConoMiES GDP in RoMan EMPiRE anD EaRlY MoDERn EURoPE 241

GDP in the Roman Empire was half that of late 17th century England cannot but de-
pend on the different relative price of precious metals and market goods. We can-
not accept their conclusions.
The problem of comparing Roman income in units of wheat with that of Eng-
land was rapidly solved by Goldsmith by taking “three wheat price quotations for
1686-90”, not reported in his article. 55 on this basis, the conclusion by Goldsmith
was that “the wheat equivalent of annual national product per head in the early
Roman empire of about 125 modii at a price of HS 3 or close to 850 kg was in the
order of one-half the level of England and Wales in 1688”. 56 Therefore, in 1688
English GDP per head could buy about 1,700 kg of wheat, which is twice that of
the ancient Roman Empire.
Maddison has chosen to express the 1688 English per capita income in wheat
by means of the prices recorded by the same Gregory King. 57 in fact for the year
1688 King provided an estimate of English cereal production and the prices of the
four main cereals: not only wheat, the price of which was 6.43 pounds per metric
ton, but also rye, barley and oats. according to King’s calculations, at that time
wheat represented 24 percent of the English cereal output in weight and 31 percent
in value. naturally the prices of rye (4.92 pounds per metric ton), barley (4.74), and
oats (4.23) were lower than that of wheat. Minor crops always have a lower price
compared to wheat. Maddison chose to express the English product per head uti-
lizing the weighted average price of the four cereals: 4.93 pounds per metric ton.
The result of the ratio between income (9.958 pounds) and cereal price (0.00493
pounds per kg) is 2,019. The average Englishman could buy 2,019 kgs of wheat in
1688, while the average ancient Roman could buy only 855 and the average ital-
ian 1,200. The result of Maddison is that the Roman Empire per capita GDP (ex-
pressed in wheat) was 42 percent of that of late 17th century England. in italy, in
the centre of the Empire, it equalled 59 percent.
as can be seen, Maddison utilizes cereal prices in his calculations and not wheat
prices and, since prices of minor cereals are lower than those of wheat, an average
income has a higher purchasing power. The ratio between 9.958 pounds and the
wheat price per kg (0.00643 pounds) reported by King is, in fact, 1,548 and not
2,019, i.e. the result obtained when the average price of the four main cereals is
used. Utilizing this ratio of per capita product to wheat price in 1688, the difference
between the Roman world and early modern England diminishes: per capita prod-
uct of the Empire and italy rises respectively to 55 percent and 78 percent of that
of England.
55 Goldsmith 1984, 281, n. 82.56 Goldsmith 1984, 281.57 Maddison 2007, 62.
Elio lo CaSCio & Paolo MalaniMa242
one may ask, however, why we should use the prices from King’s calculationswhen English price history is well documented and many different series of pricesexist; some of them recently revised. Why, furthermore, has only the wheat priceof 1688 been chosen? The Roman price of 3 HS per modius is nothing but the ap-proximate price relating to a long period of time. During the half century spanning1650-1700, the wheat price was at its lowest level in 1654 and 1688 when it ap-proximately equalled that of the years of lowest prices in the 17th century: 1601,1602, 1603, 1619 and 1620. if wheat prices are taken from three recent series, theaverages for the period 1680-1700 in pounds per ton of wheat are the following: 58
1 9.25
2 7.75
3 7.96
Below are the results in kg obtained by dividing 9.958 pounds by the previousthree values (in kg) in order to reach an estimate of English product per capita inwheat units:
1 1,076
2 1,285
3 1,251
The result is that per capita GDP in 1688 England was the same as that of Romanitaly (1,200 kg) or even lower and that in the rest of the Empire it equalled about 60-70 percent of this value; which seems plausible. italy was far more advanced thanother European regions and a 30-40 percent difference between the peninsula and theEmpire as a whole is reasonable. Since italy drew tributes and taxes from theprovinces, as previously mentioned, and the average disposable income per capita(571 HS) was, according to Maddison, 7 percent higher than per capita GDP (534HS), on which the comparison with England is based, it may even be contended thatitalian per capita GnP was higher than per capita GDP in 17th century England.
7. Per capita GDP in sesterces, wheat and dollars
annual per capita GDP in central and northern italy, during the centuries be-tween 1350 and 1750, equalled about 1,000 kg of wheat, whose price was 1,500
58 Data in the series we utilized are in bushels, which is the capacity measure used in England equiv-alent to 36.3677 litres and corresponding to 28.09 kg, in the case of wheat. in the following table datahave been converted into pounds per kg. The series of wheat prices utilized here are the following: 1.Munro 2004 reports prices per 1.25 bushel; 2. Clark 2004, 41-124; 3. Thirsk 1985, 864, table XVi.
anCiEnT anD PRE-MoDERn EConoMiES GDP in RoMan EMPiRE anD EaRlY MoDERn EURoPE 243
international 1990 dollars. 59 The price of 1 kg of wheat was $ 1.5 (always 1990 in-ternational Geary-Khamis dollars PPP). according to the estimate by Broadberry,Campbell, Klein, overton, Van leeuwen (2010) per capita GDP in England in1700 was $ 1,568. Dividing this estimate in value by the previous estimate inwheat, the result is 1.2-1.5, and thus not far from the italian estimate based on amuch longer period. 60 if we multiply Roman per capita GDP converted into wheatby $ 1.5, the results are those in the fourth column of Table 6. in the same Table,we report the estimates of GDP per capita for the early Empire in sesterces and kgof wheat.
For a comparison with the following levels of GDP in the same 1990 dollars,we remember that, in the estimate by Maddison for 1820, per head GDP in West-ern Europe was $ 1,243. as previously mentioned, since the procedure followed toobtain the estimate of GDP per head in the early Roman Empire is based on likelyshares of GDP in pre-modern European economies, the result cannot but be simi-lar to the level of pre-modern European economies. The too low level of pre-mod-ern GDP in Maddison’s calculation has already been remarked. 61
The average of the empire on the whole hides the internal differences among re-gions. in highly urbanized regions, such as, primarily italy, followed by Greece, the
59 Malanima 2011 for GDP and www.paolomalanima.it for wheat price. in order to compute theprice of a kg of wheat in dollars, we need to have series of per capita GDP both at current prices andin 1990 dollars. at the moment these series are available only for italy.
60 Foldvari & van leeuwen 2010 suggest a much lower price in dollars of a kg of wheat (dollars1.17 per litre and then about $ 0.90 per kg).
61 Federico 2002.
Elio lo CaSCio & Paolo MalaniMa244
!
!
!
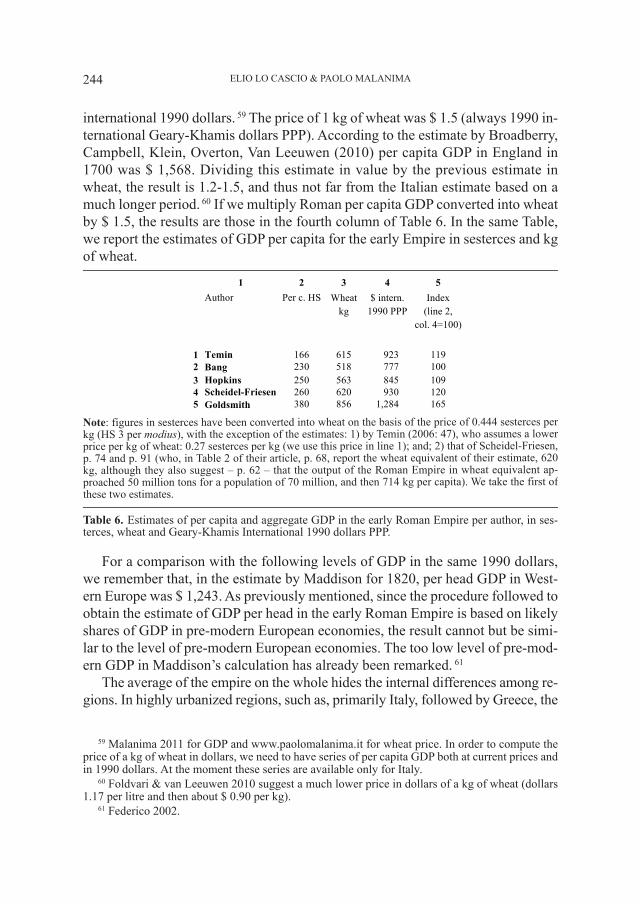
!
1 2 3 4 5 Author Per c. HS Wheat
kg $ intern.
1990 PPP Index
(line 2, col. 4=100)
1 Temin 166 615 923 119 2 Bang 230 518 777 100 3 Hopkins 250 563 845 109 4 Scheidel-Friesen 260 620 930 120 5 Goldsmith 380 856 1,284 165
!Note: figures in sesterces have been converted into wheat on the basis of the price of 0.444 sesterces perkg (HS 3 per modius), with the exception of the estimates: 1) by Temin (2006: 47), who assumes a lowerprice per kg of wheat: 0.27 sesterces per kg (we use this price in line 1); and; 2) that of Scheidel-Friesen,p. 74 and p. 91 (who, in Table 2 of their article, p. 68, report the wheat equivalent of their estimate, 620kg, although they also suggest – p. 62 – that the output of the Roman Empire in wheat equivalent ap-proached 50 million tons for a population of 70 million, and then 714 kg per capita). We take the first ofthese two estimates.
Table 6. Estimates of per capita and aggregate GDP in the early Roman Empire per author, in ses-terces, wheat and Geary-Khamis international 1990 dollars PPP.

coasts of Turkey, Syria, Palestine and northern Egypt 62 the level of per capita GDP
was certainly higher than in the regions of Europe beyond the alps. if we follow
Maddison and agree that per capita GDP in italy was generally 40 percent higher
than that of the empire as a whole, then the result in 1990 international dollars is
between 1,300 and 1,800 and thus the same as in the late Middle ages and Early
Modern epoch. 63
8. The poverty line
Rounding off the figures, the estimates presented in Table 6 range between 800
(or 900 if we exclude the estimates by Bang and Hopkins) and 1,300 international
1990 dollars. it is useful to compare these values to the poverty line in the period
we are dealing with. Sometimes, in fact, the poverty line is used as a yardstick to
single out incomes in past societies. according to B. Milanovic, 64 average income
in past agrarian economies can be assumed as “a little more than twice the subsis-
tence minimum”. Scheidel and Friesen conclude their analysis of output in the
Roman Empire (and before discussing the theme of distribution) with the follow-
ing words: “Maddison put (generic) annual minimum subsistence at $ 400 per
capita”. if, in the Roman Empire, subsistence was 390 kg of wheat equivalent, this
means that Roman per capita GDP (at c. 680 kg) was around $ 700. alternative es-
timates of the subsistence minimum advocated by other scholars tend to fall into
the $ 350-400 range. at $ 350, Roman per capita would drop to around $ 610”
(2009: 74). if, again, we convert wheat equivalent per capita GDP according to the
previous price of $ 1.5 per kg our results are as follows: the subsistence line is $
585 (390 • 1.5); per capita GDP, equal, in this passage, to 680 kg of wheat, is $
1,020 (680 • 1.5). if, by contrast, as suggested in another passage of their article,
the wheat equivalent of per capita GDP is kg 714, then the more plausible result
in 1990 dollars PPP is 1,071 (714 • 1.5) (as shown in the note to Table 6), which
is close to the average GDP in 1820 Western Europe: $ 1,243, as already recalled.
W. Harris has computed the poverty line taking the price of HS 2 per modius(and then HS 0.27 per kg), and a yearly consumption of cereals of HS 74. 65 as-
suming therefore that HS 74 represented two-thirds of the total cost of living, Har-
ris reached the result of HS 111 per year as a likely line of subsistence. 66 as a
62 Pounds 1969.63 Malanima 2011. in this calculation we use the estimate by Temin, Scheidel-Friesen and Gold-
smith.64 Milanovic 2006, 468.65 Harris 2011.66 Supported also by Jongman 2007, 600 (HS 115).
anCiEnT anD PRE-MoDERn EConoMiES GDP in RoMan EMPiRE anD EaRlY MoDERn EURoPE 245

comparison, the alimenta rates varied in italy between 120 and 240 HS. 67 Then the
figure of HS 111 could be even lower than it actually was. if we convert this fig-
ure into wheat (kg), as we did previously in Table 6, the result is 411 kg (111/0.27).
if, in order to reach the equivalent in international dollars we again multiply by $
1.5, the result is $ 617 (409 • 1.5). We thus find a result higher than the 1 dollar per-
day accepted until a few years ago as the poverty line. assuming that in past agrar-
ian civilisations not everybody was on the border of the poverty line and that
inequality existed and therefore a share of the population enjoyed an income higher
and often much higher than bare subsistence, we easily reach a figure twice that of
the poverty line, hence around $ 1,200-1,300, as in the estimate by Goldsmith and
developed by Maddison; the one we deem to be more realistic.
The higher level of our estimates in dollars of per capita GDP in ancient Roman
civilisation and for the poverty line depends on the fact that food and ordinary
goods diminished relatively in price in comparison with the consumer price index
over the last two centuries. The basket of the poor has become cheaper and cheaper.
During modern growth many new goods took the place of those used before. Wheat
began to be replaced by maize and potatoes, the prices of which were half that of
wheat for the same caloric content. olive oil (very expensive in past economies)
began to be replaced by much cheaper fats such as margarine; and wine by a vari-
ety of beverages, whose prices were much lower for the same energy content.
Wool, linen or hemp were replaced by artificial fibres. Firewood was the only fuel
available in past societies, but it was replaced by a variety of fuels (fossil fuels),
whose prices, for the same calories, have never been so cheap in the history of
mankind as in the last two centuries. The basket of the poor is not always composed
of the same goods.
in any case, even if the basket of the poor were composed of the same primary
goods, these have been subject to an amazing relative decline. in the Figure 1
below, the curves refer to the relative prices on the international markets of three
supports to basic subsistence: wheat, maize and rice. We see that the curves of the
relative international prices of wheat, maize and rice declined respectively by 0.98
per cent per year, 0.79 and 1.11, in the last century. Their relative prices at the end
of the 20th century were one-fifth of what they were at the beginning.
The diagram is an illustration of the core of the so-called Prebisch-Singer the-
sis, proposed in the 1950s, on the deterioration of the terms of trade for primary
commodity exporters as one of the main trends in international trade and as the
main cause of the rising inequality among economies. We see that a sudden fall oc-
curred after the First and Second World Wars and again in the 1980s. 68 This is the
67 Prell 1997, 187.68 ocampo & Parra 2003.
Elio lo CaSCio & Paolo MalaniMa246

reason why today it is possible to survive with 400 dollars while it was not so in past
agrarian civilisations. if average incomes in past agrarian economies are assumed
to be “a little more than twice the subsistence minimum”, 69 as supposed by B. Mi-
lanovic and other scholars, and this minimum is assumed to be about 400 PPP in-
ternational dollars, then the result of something more than 800 PPP dollars as the
yearly average income in past agrarian civilisations is plausible. if, by contrast, and
more correctly in our opinion, this minimum is assumed to be around 650-700 dol-
lars, then the average product of 1,300-1,400 becomes much more plausible.
We can therefore conclude that, before modern growth, the price of certain basic
items relative to the consumer price index was higher than it is today, owing on the
one hand to remarkable increases in labour productivity in modern times and, on
the other, to the introduction of cheaper substitute goods in the basket of the poor.
in relative terms, during the 19th and 20th centuries, the poverty line was not sta-
tionary, but curved downwards.
Conclusion
it is hard indeed to “quantify” an economy when basic data is almost com-
pletely lacking. Since the 1980s, however, historians and economists have been
able to suggest a synthetic view of the Roman economy through the reconstruction
of GDP. When the result is expressed in wheat (as in Table 6) the range of the pro-
69 Milanovic 2006, 468.
anCiEnT anD PRE-MoDERn EConoMiES GDP in RoMan EMPiRE anD EaRlY MoDERn EURoPE 247
Fig. 1. - Relative prices of wheat, maize and rice in international marketsfrom 1900 until 2000 and rates of yearly decline (%). (Sources: Commod-ity Price indices: 1900-84 compiled from World Bank data by Grilli andYang 1988; data for 1985-2000 compiled from World Bank data by S. Pfaf-fenzeller, University of nottingham).

posed real values hovers between 100 and 165. a 65 percent difference between the
highest and the lowest value is not so wide; especially if we look at the poverty of
the basic data and the ensuing uncertainty of the conclusions.
The important problem of the comparability between ancient and modern lev-
els of GDP has only been marginally addressed by historians of the Roman world.
The prevailing opinion is, however, that per capita GDP in the early Roman Em-
pire was half or less than that of the following late medieval and early modern
economies; although, we must add, a simple reflection on the basic method uti-
lized by historians would have to suggest that this conclusion is at odds with the
way followed in their statistical reconstructions. our discussion of the problem
strongly suggests that a real difference in the level of average income between the
early Roman Empire and the following European pre-modern economies did not
exist at all. an estimate of per head GDP of about 1,300 dollars fits much better
than the other ones the evidence regarding the following European economies be-
fore modern growth. Per capita GDP in ancient Euro-Mediterranean Roman Em-
pire was 15-20 times lower than that of the Western Europeans at the beginning of
the 3rd millennium.
in our opinion the conclusion is important for its “methodological” conse-
quences. if we accept the viewpoint supported by many scholars, that Roman per
capita GDP was half that of late medieval-early modern economies then we face a
slowly rising path from the antiquity to Modernity, such as that drawn by Maddi-
son in quantitative terms and by most historians in a more narrative way. on dis-
covering that per capita GDP in the early Roman Empire was similar to that of the
subsequent agrarian civilizations we are forced to alter this view. The first case
presents us with long-term progress, but if we accept the view supported by a mi-
nority of scholars, that is, the second, we are presented with a long period of sta-
bility with cycles. This is the view that the previous discussion seems to support.
Bibliography
allen, R. 2009, How prosperous were the Romans? Evidence from Diocletian’s price edict(AD 301), in a.K. Bowman and a.i. Wilson (eds), Quantifying the Roman Economy.Methods and Problems, oxford, 327-345.
Bang, P.F. 2008, The Roman Bazaar: A Comparative Study of Trade and Markets in a Trib-utary Empire, Cambridge.
Barro, R.J. and Sala-i-Martin, X. 1995, Economic Growth, new York.
Beloch, K.J. 1899, Die Bevölkerung im Altertum, Zeitschrift für Sozialwissenschaft 2, 505-514, 600-621.
Boyer-Xambeu, M.T., Deleplace, G. and Gillard, l. 1986, Monnaie privée et pouvoir desprinces. L’économie des relations monétaires à la Renaissance, Paris.
Elio lo CaSCio & Paolo MalaniMa248

Braudel, F. and Spooner, F. 1967, Prices in Europe 1450-1750, in E.E. Rich and C. Wil-son (eds.), Cambridge Economic History of Europe, iV, Cambridge, 374-486.
Broadberry, S., Campbell, B., Klein, a., overton, M. and van leeuwen, B. 2010, BritishEconomic Growth (1270-1870) (august 19th 2010).
Clark, G. 2004, The Price History of English agriculture, 1209-1914, Research in Eco-nomic History 22, 41-124.
Clark, G. 2007, A Farewell to Alms. A Brief Ecoomic History of the World, Princeton andoxford.
Day, J. 1987, The Medieval Market Economy, oxford, 1-54.Drexhage, H.-J. 1991, Preise, Miete/Pachten, Kosten und Löhne im römischen Ägypten bis
zum Regierungsantritt Diokletians, St. Katharinen.Duncan Jones, R. 1982, The Economy of Roman Empire. Quantitative Studies, 2nd ed.,
Cambridge.Duncan-Jones, R. 1990, Structure and Scale in the Roman Economy, Cambridge.Duncan-Jones, R. 1994, Money and Government in the Roman Empire, Cambridge.Federico, G. 2002, The World Economy 0-2000 A.D.: A Review Article, European Review
of Economic History 6, 111-120.Finley, M.i. 1973, The Ancient Economy, Berkeley-los angeles.Foldvari, P. and van leeuwen, B. 2012, Comparing per capita Income in the Hellenistic
World: the Case of. Mesopotamia, Review of income and Wealth 58 (3), 550-568.Frank, T. 1933-1940, An Economic Survey of Ancient Rome, Baltimore.Frier, B.W. 2000, Demography, in a.K Bowman, P. Garnsey and D. Rathbone (eds.), The
High Empire, A.D. 70-192. The Cambridge Ancient History, X2, Cambridge, 787-816.Goldsmith, R.W. 1984, An Estimate of the Size and Structure of the National Product of the
Early Roman Empire, Review of income and Wealth 30, 263-288.Goldsmith, R.W. 1987, Premodern Financial Systems. A Historical Comparative Study,
Cambridge.Grilli, E.R. and Yang, M.C. 1988, Primary Commodity Prices, Manufactured Goods Prices,
and the Terms of Trade of Developing Countries: What Long Run shows, The WorldBank Economic Review 2 (1), 1-47.
Harris, W.V. 2011, Poverty and Destitution in the Roman Empire, in W.V. Harris (ed.),Rome’s Imperial Economy. Twelve Essays, oxford, 27-54.
Hopkins, K. 1980, Taxes and Trade in the Roman Empire (200 B.C.-A.D. 400), Journal ofRoman Studies 70, 101-125.
Hopkins, K. 2002, Rome, Taxes, Rents and Trade, in W. Scheidel & S. Von Reden (eds.),The Ancient Economy, Edinburgh, 190-229 (originally published in Kodai: Journal ofancient History 6-7, 1995-1996, 41-75).
Hopkins, K. 2000, On the Political Economy of the Roman Empire,www.stanford.edu/group/sshi/empires/hopkins.pdf.; see The political economy of theRoman Empire, in i. Morris & W. Scheidel (eds.), The Dynamics of Ancient Empires.State Power from Assyria to Byzantium, oxford, 2009, 178-204.
Hoz Montoya, J. de la 2008, Aproximación a la escala de la circulación monetaria en tiem-pos de Nerón, annali dell’istituto italiano di numismatica 54, 177-227.
Jongman, W. 2003, A Golden Age. Death, Money Supply and Social Succession in theRoman Empire, in E. lo Cascio (ed.), Credito e moneta nel mondo romano, Bari, 181-196.
Jongman, W. 2007, The Early Roman Empire: Consumption, in W. Scheidel, i. Morris, R.Saller (eds.), Cambridge Economic History of the Greco-Roman World, Cambridge,592-618.
anCiEnT anD PRE-MoDERn EConoMiES GDP in RoMan EMPiRE anD EaRlY MoDERn EURoPE 249

lo Cascio, E. 2003, Prefazione, in E. lo Cascio (ed.), Credito e moneta nel mondo ro-mano, Pragmateiai 8, Bari, 5-15.
lo Cascio, E. 2009, Crescita e declino, Studi di storia dell’economia romana, Rome.lo Cascio, E. 2010, La quantificazione dell’offerta di moneta: il ruolo del credito, in Fr.
de Callataÿ (ed.), Quantifying monetary supplies in Greco-Roman times, Pragmateiai19, Bari, 31-42.
lo Cascio, E. (ed.) 2012, L’impatto della “ peste antonina”, Pragmateiai 22, Bari.lo Cascio, E. and Malanima, P. 2009, GDP in Pre-Modern Agrarian Economies (1-1820
A.D.). A Revision of the Estimates, Rivista di Storia Economica n.s., 25, 391-419.Mac Mullen, R. 1985, The Roman Emperors’ Army Cost, latomus 43, 571-580.Mc Evedy, C. and Jones, R. 1978, Atlas of World Population History, new York.Maddison, a. 2001, The World Economy. A Millennial Perspective, Paris.Maddison, a. 2007, Contours of the World Economy, 1-2030 A.D. Essays in Macro-Eco-
nomic History, oxford.Malanima, P. 2009, Pre-modern European Economy. One Thousand Years (10th-19th Cen-
turies), leiden-Boston.Malanima, P. 2011, The Long Decline of a Leading Economy. GDP in North and Central
Italy 1300-1913, European Review of Economic History 15 (2), 169-219.Milanovic, B. 2006, An Estimate of Average Income and Inequality in Byzantium around
Year 1000, Revue of Wealth and income 52, 449-470.Munro, J. 2004, Builders’ Wages in Southern England and the Southern Low Countries,
1346 -1500: a Comparative Study of Trends and Levels of Real Incomes, MPRa Paper11209, University library of Munich, Germany, revised July 2004, published also in S.Cavaciocchi (ed.), L’Edilizia prima della rivoluzione industriale, secc. XIII-XVIII,.,Florence, 2005, 1013-1076.
ocampo, J.a. and Parra, M.a. 2003, The Terms of Trade for Commodities in the Twenti-eth Century, EClaC Review 79, april (www.eclac.cl).
Pounds, n.J.G. 1969, The Urbanization of the Classical World, annals of the associationof american Geographers 59, 135-157.
Prebisch, R. 1950, Crecimiento, desequilibrio y disparidades: interpretación del procesode desarrollo. Estudio Económico de América Latina 1949, Santiago, Chile, EconomicCommission for latin america and the Caribbean (EClaC).
Prell, M. 1997, Sozialökonomische Untersuchungen zur Armut in antiken Rom: von denGracchen bis Kaiser Diokletian, Stuttgart.
Rathbone, D. 1996, Prices and price formation in Roman Egypt, in J. andreau, P. Briant& R. Descat (eds.), Prix et formation des prix dans les économies antiques, Entretiensd’archéologie et d’histoire 2, Saint-Bertrand-de-Comminges, 183-244.
Rathbone, D. 2000, The “Muziris” papyrus (SB XVIII 13167): Financing Roman Tradewith India, in Alexandrian Studies II in Honour of Mostafa el Abbadi, Bulletin de la So-ciété d’archéologie d’alexandrie 46, 39-50.
Scheidel, W. and Friesen, S.J. 2009, The Size of the Economy and the Distribution of In-come in the Roman Empire, Journal of Roman Studies 99, 61–91.
Scheidel, W., Morris, i. and Saller, R. (eds.) 2007, Cambridge Economic History of theGreco-Roman World, Cambridge.
Singer, H.W. 1950, U.S. Foreign Investment in Underdeveloped Areas, the Distribution ofGains between Investing and Borrowing Countries, american Economic Review, Pa-pers and Proceedings 40.
Temin, P. 2006, Estimating GDP in the Early Roman Empire, in E. lo Cascio (ed.), Inno-vazione tecnica e progresso economico nel mondo romano, Bari, 31-54.
Elio lo CaSCio & Paolo MalaniMa250

Thirsk, J. (ed.) 1985, The Agrarian History of England and Wales, V, 1640-1750, ii, Agrar-ian Change, Cambridge.
Wilson, a.i. 2009, Approaches to Quantifying Roman Trade, in a.K. Bowman and a.i.Wilson (eds.), Quantifying the Roman Economy. Methods and Problems, oxford, 213-249.
anCiEnT anD PRE-MoDERn EConoMiES GDP in RoMan EMPiRE anD EaRlY MoDERn EURoPE 251
