and in vitro degradability enhanced gas production
TRANSCRIPT

Page 1/26
Sulfur, fresh cassava root, and urea independentlyenhanced gas production, ruminal characteristics,and in vitro degradabilityPhussorn Sumadong
Khon Kaen UniversityAnusorn Cherdthong ( [email protected] )
Khon Kaen UniversitySarong So
Khon Kaen UniversityMetha Wanapat
Khon Kaen University
Research Article
Keywords: Sulfur, Hydrogen cyanide, Gas production, Ammonia nitrogen, Propionic acid, Degradability
Posted Date: April 29th, 2021
DOI: https://doi.org/10.21203/rs.3.rs-463093/v1
License: This work is licensed under a Creative Commons Attribution 4.0 International License. Read Full License
Page 2/26
AbstractBackground: Cassava root (FCR) is one of the main energy source ingredients for ruminant and low price.The limitation of FCR utilization is due to the presence of hydrogen cyanide (HCN), which is toxic whenanimals, especially ruminants. The study aimed to evaluate the effect of sulfur, urea, and FCR at variouslevels on gas production, ruminal fermentation, and in vitro degradability. The study hypothesized that: 1)sulfur, urea, and FCR have no interaction effect and 2) effect of FCR and urea is related to sulfur addition.
Results: The study aimed to elucidate the optimum level of elemental sulfur, fresh cassava root (FCR),and urea and their effect on gas production, ruminal fermentation, thiocyanate concentration, and in vitrodegradability. A 3×2×4 in a completely randomized design were conducted. Factor A was level of sulfur at0%, 1%, and 2% of concentrate dry matter (DM), factor B was level of urea at 2% and 4% of concentrateDM, and factor C was level of the FCR at 0, 200, 300, and 400 mg of the total substrate. The study foundthat elemental sulfur, urea, and FCR had no interaction effect on the kinetics of gas, ruminal fermentation,hydrogen cyanide (HCN), and in vitro degradability. Elemental sulfur supplementation (P<0.05)signi�cantly increased the gas produced from an insoluble fraction (b), in vitro DM degradability andeither neutral detergent �ber or acid detergent �ber degradability, and propionate (C3) concentration whiledecreased the ruminal HCN concentration. Urea levels showed a (P<0.05) signi�cant increase of thepotential extent of gas production, ruminal NH3-N, and total volatile fatty acid (VFA). FCRsupplementation (P<0.05) signi�cantly increased the gas produced from an immediate soluble fraction(a), gas produced from insoluble fraction, gas production rate constant, total VFA, C3 concentration, andHCN while decreased ruminal pH, acetate, and butyrate concentration. It could be concluded that 2%elemental sulfur, 4% urea, and 300 mg FCR showed a greater effect on gas production, ruminalfermentation, and HCN reduction.
Conclusions: The study found that elemental sulfur, urea, and FCR had no interaction effect on thekinetics of gas, total gas, ruminal fermentation, and HCN concentration. It could be concluded that 2%elemental sulfur, 4% urea, and 300 mg FCR showed a greater effect on gas production, ruminalfermentation, and HCN reduction.
BackgroundCassava root (FCR) is one of the main energy source ingredients for ruminant [1] and low price. Thelimitation of FCR utilization is due to the presence of hydrogen cyanide (HCN), which is toxic whenanimals, especially ruminants, consume more than 200 mg/kg fresh matter [2, 3]. FCR contains 90 to 114mg/kg of HCN [2]. The HCN toxicity can be reduced by sun-drying [1]; however, it is not an appropriatemethod during the rainy season. A chemical method, using sulfur, has been tested and shown to increasethiocyanate concentration, which is less toxic for the host [2, 4, 5]. Brie�y, thiocyanate is the product ofdependent-sulfur rhodanese enzyme presented in the rumen break-down and subsequently excreted outof the body via urine [6, 7]. Besides its toxicity, FCR has low crude protein (CP) content (2 to 3 %) [8].Common non-protein nitrogen, urea, is added into the diet to increase CP content and use as a nitrogen

Page 3/26
source for microbial protein synthesis in the rumen [9]. Sulfur is closely related to nitrogen metabolism.Therefore, the optimum level of sulfur supplementation in the diet containing urea is necessary toelucidate. In lambs, improvement of protein utilization e�ciency was �rstly reported by Johnson et al.[10] when sulfur was added into the diet containing cassava. An in vitro study of Promkot et al. [6]similarly reported to signi�cantly increase true protein digestibility when sulfur of reduced-sodium sul�denonahydrate was added into a substrate containing cassava foliage and hay. However, a subsequentstudy by Promkot and Wanapat [7] showed no signi�cant effect of sulfur supplementation on proteindigestibility in dairy cows’ diets containing both fresh cassava foliage and cassava hay. In beef cattle,Cherdthong et al. [2] showed no signi�cant effect of feed-block containing sulfur on protein digestibility ina diet composed of the FCR. Supapong and Cherdthong [5] found no signi�cant effect of sulfur incombination with urea on digestibility of dairy cows fed a fermented total mixed ration containing FCR.Insu�cient sulfur supply can cause low digestion of dietary nutrients and microbial protein synthesis [11]and its form might signi�cantly affect microbial metabolism in the rumen. NRC [12] stated thatrequirement of sulfur for ruminants might be increased for detoxifying HCN. However, the evaluationeffect of high sulfur addition into a substrate containing FCR as a source of HCN is still limited, and studyon the effect of sulfur, urea, and FCR and their interaction on gas production, rumen fermentation, and invitro digestibility has not yet been studied.
The study aimed to evaluate the effect of sulfur, urea, and FCR at various levels on gas production,ruminal fermentation, and in vitro degradability. The study hypothesized that: 1) sulfur, urea, and FCRhave no interaction effect and 2) effect of FCR and urea is related to sulfur addition.
ResultsDietary nutrients
The main energy source of the study diets was dominated by cassava chips. The concentrate contains12 to 18% CP as mainly dominated by urea supplementation at 2% and 4%. The FCR used in this studycontains 104.6 mg/kg of HCN as shown in Table 1.

Page 4/26
Table 1Ingredients and chemical composition of concentrate, fresh cassava roots (FCR) and rice straw (% dry
matter basis)Item 0 % Sulfur 1 % Sulfur 2 % Sulfur FCR Rice
straw 2 %
Urea4 %Urea
2 %Urea
4 %Urea
2 %Urea
4 %Urea
Ingredients, % dry matter (DM)
Cassava chip 65 63 64 63 63 61
Rice bran 10 10 10 10 10 10
Soybean meal 5 5 5 5 5 5
Palm kernelmeal
15 15 15 14 15 15
Premix1 1 1 1 1 1 1
Sulfur 0 0 1 1 2 2
Urea 2 4 2 4 2 4
Salt 1 1 1 1 1 1
Molasses 1 1 1 1 1 1
Chemical composition
Dry matter, % 93.6 93.6 93.6 93.6 93.6 93.6 33.0 94.7
--------------% DM-----------
Organic matter 92.8 92.8 92.8 92.8 92.7 92.7 98.5 93.3
Crude protein 12.4 18.1 12.2 18.1 12.5 18.2 2.4 2.7
NDF 12.0 12.1 12.2 12.1 12.1 12.3 53.0 66.7
ADF 8.0 8.2 8.2 8.3 8.3 8.3 31.4 43.5
HCN, mg/kg - - - - - - 104.6 -
1 Premix composed of vitamin A: 10,000,000 IU; vitamin E: 70,000 IU; vitamin D: 1,600,000 IU; Fe: 50 g;Zn: 40 g; Mn: 40 g; Co: 0.1 g; Cu: 10 g; Se: 0.1 g; I: 0.5 g. NDF means neutral detergent �ber, ADFmeans acid detergent �ber, HCN means hydrogen cyanide
Gas kinetics and total gas
Table 2 shows the kinetics (a, b, c, and a + b) of gas and cumulative gas at 96 h of incubation. The sulfur,urea, and FCR showed no signi�cant interaction effect on the kinetics of gas and total gas. Sulfur

Page 5/26
supplementation did not affect total gas and kinetics of gas except gas produced from insoluble fraction(b). Increasing sulfur signi�cantly increased the b value compared to the control; however, 1% and 2%sulfur supplementation did not differ (Table 2).

Page 6/26
Table 2Effect of elemental sulfur (S), urea (U), and fresh cassava root (FCR) on kinetics of gas and gas
production at 96 h of incubationTreatments S
(%)
U
(%)
FCR
(mg)
Kinetics of gas Gas productionml/g
a b c a + b
T1 0 2 0 -4.53 86.05 0.052 81.51 80.92
T2 0 4 0 -5.71 95.65 0.053 89.94 89.61
T3 1 2 0 -3.25 91.53 0.052 98.28 90.41
T4 1 4 0 -5.20 88.84 0.050 83.64 83.91
T5 2 2 0 -3.42 89.60 0.051 86.18 85.52
T6 2 4 0 -6.34 82.63 0.049 76.29 86.50
T7 0 2 200 -8.13 104.20 0.078 96.07 105.95
T8 0 4 200 -7.32 102.11 0.075 94.78 94.38
T9 1 2 200 -9.78 109.43 0.089 99.65 99.64
T10 1 4 200 -8.58 104.78 0.076 96.20 94.80
T11 2 2 200 -9.37 106.90 0.080 97.54 97.51
T12 2 4 200 -9.64 107.32 0.082 97.68 102.62
T13 0 2 300 -10.05 118.63 0.090 108.58 122.35
T14 0 4 300 -11.30 122.37 0.093 111.06 130.75
T15 1 2 300 -11.24 119.00 0.091 107.76 113.20
T16 1 4 300 -11.11 123.97 0.095 112.86 113.86
T17 2 2 300 -11.79 127.79 0.097 116.00 115.68
T18 2 4 300 -12.08 120.93 0.093 108.68 116.62
T19 0 2 400 -11.00 102.46 0.075 91.46 98.45
T20 0 4 400 -11.66 105.56 0.077 93.89 94.87
T21 1 2 400 -11.56 110.58 0.087 99.02 101.96
T22 1 4 400 -12.00 103.93 0.074 91.39 93.73
a means the gas production from the immediately soluble fraction (mL); b means the gas productionfrom the insoluble fraction (mL); c means the gas production rate constant for the degradablefraction b; a + b means the potential extent of gas production (mL)
a,b,c means within column showed with different superscript letter accepted signi�cantly different

Page 7/26
Treatments S
(%)
U
(%)
FCR
(mg)
Kinetics of gas Gas productionml/g
a b c a + b
T23 2 2 400 -11.27 110.64 0.080 99.37 106.31
T24 2 4 400 -12.08 110.60 0.081 98.51 104.51
SEM 1.84 12.20 0.015 9.87 12.40
S (%)
0 -8.71 104.62b 0.07 100.91 102.16
1 -9.08 106.44a 0.07 99.23 98.93
2 -9.49 107.05a 0.07 131.65 101.89
P-Value 0.081 0.016 0.110 0.412 0.245
U (%)
2 -8.78 106.40 0.07 100.64b 101.49
4 -9.41 105.67 0.07 142.35a 100.50
P-Value 0.175 0.282 0.086 0.0001 0.324
FCR (mg)
0 -4.74a 89.05c 0.05c 86.14 86.14c
200 -8.80b 105.79b 0.08b 99.49 99.15b
300 -11.26c 122.11a 0.09a 115.06 118.72a
400 -11.59c 107.20b 0.08b 189.19 99.97b
P-Value 0.0001 0.0001 0.0001 0.367 0.0001
Interaction
S*U 0.949 0.103 0.558 0.117 0.217
S*FCR 0.738 0.465 0.764 0.599 0.232
U*FCR 0.0001 0.0001 0.0001 0.0001 0.0001
a means the gas production from the immediately soluble fraction (mL); b means the gas productionfrom the insoluble fraction (mL); c means the gas production rate constant for the degradablefraction b; a + b means the potential extent of gas production (mL)
a,b,c means within column showed with different superscript letter accepted signi�cantly different

Page 8/26
Treatments S
(%)
U
(%)
FCR
(mg)
Kinetics of gas Gas productionml/g
a b c a + b
S*U*FCR 0.428 0.776 0.888 0.893 0.076
a means the gas production from the immediately soluble fraction (mL); b means the gas productionfrom the insoluble fraction (mL); c means the gas production rate constant for the degradablefraction b; a + b means the potential extent of gas production (mL)
a,b,c means within column showed with different superscript letter accepted signi�cantly different
Ruminal fermentation, hydrogen cyanide concentration, and protozoal number
The effect of elemental sulfur, FCR, and urea on pH, NH3-N, HCN, and protozoa were shown in Table 3.Elemental sulfur, urea, and FCR had no signi�cant interaction effect on pH, NH3-N, HCN, and protozoalnumber. The interaction effect between elemental sulfur, FCR, and urea has never been elucidated untilthe present. Elemental sulfur supplementation signi�cantly decreased the HCN concentration but did notaffect the pH, NH3-N, and protozoal number. Sulfur supplementation signi�cantly reduced HCN whencompared to the control; however, 1% vs 2% sulfur supplementation did not differ for the HCN reduction.

Page 9/26
Table 3Effect of elemental sulfur (S), urea (U), and fresh cassava root (FCR) on rumen fermentation
parameters, hydrogen cyanide (HCN), and protozoal numberTreatments S (%) U (%) FCR (mg) pH NH3-N
(mg%)
HCN
(mg/l)
Protozoa
(×105 cell/mL)
T1 0 2 0 6.51 21.1 0.0053 5.5
T2 0 4 0 6.42 21.8 0.0051 5.6
T3 1 2 0 6.48 20.8 0.0050 5.0
T4 1 4 0 6.54 21.9 0.0049 5.4
T5 2 2 0 6.53 20.7 0.0048 4.8
T6 2 4 0 6.55 21.6 0.0048 5.0
T7 0 2 200 6.31 21.3 0.0058 5.2
T8 0 4 200 6.36 22.0 0.0059 5.7
T9 1 2 200 6.28 20.6 0.0055 5.0
T10 1 4 200 6.36 21.6 0.0054 4.9
T11 2 2 200 6.30 20.7 0.0047 5.3
T12 2 4 200 6.32 21.7 0.0046 5.6
T13 0 2 300 6.30 20.6 0.0074 5.2
T14 0 4 300 6.34 22.1 0.0076 5.4
T15 1 2 300 6.28 21.1 0.0057 4.8
T16 1 4 300 6.35 21.5 0.0056 5.3
T17 2 2 300 6.31 21.1 0.0049 5.4
T18 2 4 300 6.34 21.8 0.0048 5.5
T19 0 2 400 6.15 20.1 0.0088 5.5
T20 0 4 400 6.22 21.8 0.0091 5.3
T21 1 2 400 6.18 20.7 0.0076 5.5
T22 1 4 400 6.22 22 0.0079 5.8
T23 2 2 400 6.19 21.1 0.0075 5.4
T24 2 4 400 6.25 21.6 0.0076 5.5
a,b,c,d means within column showed with different superscript letter accepted signi�cantly different

Page 10/26
Treatments S (%) U (%) FCR (mg) pH NH3-N
(mg%)
HCN
(mg/l)
Protozoa
(×105 cell/mL)
SEM 0.12 0.09 0.001 0.27
S (%)
0 6.32 21.41 0.006a 5.42
1 6.33 21.28 0.005b 5.31
2 6.35 21.28 0.005b 5.21
P-Value 0.771 0.080 0.0001 0.231
U (%)
2 6.31 20.84b 0.006 5.42
4 6.35 21.81a 0.006 5.36
P-Value 0.119 0.0001 0.518 0.189
FCR (mg)
0 6.50a 21.35 0.004d 5.21
200 6.32b 21.33 0.005c 5.29
300 6.31b 21.30 0.006b 5.26
400 6.20c 21.30 0.008a 5.50
P-Value 0.0001 0.397 0.0001 0.406
Interaction
S*U 0.961 0.002 0.634 0.140
S*FCR 0.632 0.254 0.0001 0.804
U*FCR 0.036 0.0001 0.022 0.753
S*U*FCR 0.213 0.0001 0.746 0.061
a,b,c,d means within column showed with different superscript letter accepted signi�cantly different
In vitro digestibility

Page 11/26
The effect of elemental sulfur, urea, and FCR on IVDMD, IVNDFD, and IVADFD was shown in Table 4.Elemental sulfur, urea, and FCR had no signi�cant interaction effect on IVDMD, IVNDFD, and IVADFD (P > 0.05). Elemental sulfur supplementation signi�cantly in�uenced IVDMD, IVNDFD, and IVADFD. TheIVDMD, IVNDFD, and IVADFD were increased when elemental sulfur was increased. Urea levels did notaffect the IVDMD, IVNDFD, and IVADFD (Table 4).

Page 12/26
Table 4Effect of elemental sulfur (S), urea (U), and fresh cassava root (FCR) on in vitro dry matter (IVDMD),in vitro neutral detergent �ber degradability (IVNDFD), and in vitro acid detergent �ber degradability
(IVADFD)Treatments S (%) U
(%)
FCR
(mg)
IVDMD IVNDFD IVADFD
T1 0 2 0 59.56 50.17 27.59
T2 0 4 0 60.80 52.03 28.49
T3 1 2 0 61.64 52.18 27.58
T4 1 4 0 62.73 53.45 28.38
T5 2 2 0 62.65 52.03 28.65
T6 2 4 0 62.96 53.33 29.42
T7 0 2 200 59.69 49.62 28.46
T8 0 4 200 61.95 54.91 28.94
T9 1 2 200 63.98 53.63 28.70
T10 1 4 200 62.77 54.51 29.29
T11 2 2 200 62.60 51.43 30.27
T12 2 4 200 63.58 53.84 31.34
T13 0 2 300 60.82 51.45 29.47
T14 0 4 300 62.18 54.79 30.01
T15 1 2 300 62.48 53.66 29.81
T16 1 4 300 63.01 54.35 30.47
T17 2 2 300 63.44 53.44 31.16
T18 2 4 300 60.80 55.94 31.86
T19 0 2 400 61.30 50.29 28.94
T20 0 4 400 62.69 53.66 29.62
T21 1 2 400 62.21 54.35 29.21
T22 1 4 400 62.79 51.61 29.64
T23 2 2 400 63.07 54.05 30.25
T24 2 4 400 63.07 54.05 30.51
a,b,c means within column showed with different superscript letter accepted signi�cantly different
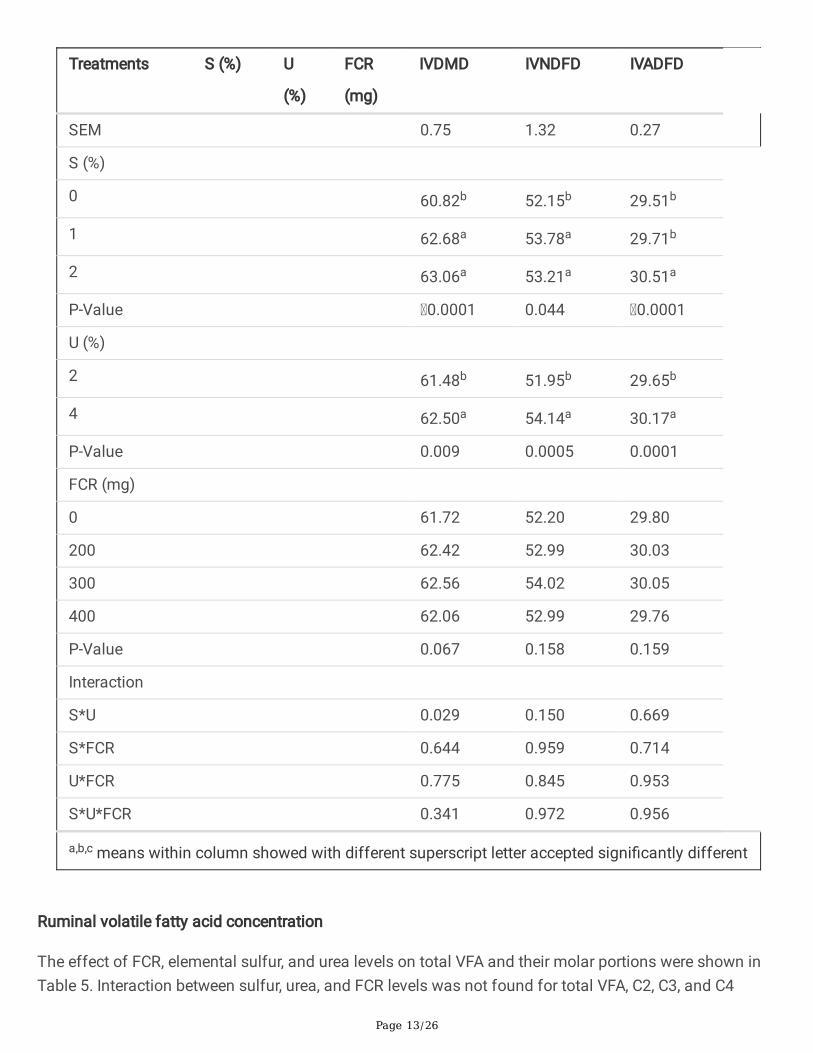
Page 13/26
Treatments S (%) U
(%)
FCR
(mg)
IVDMD IVNDFD IVADFD
SEM 0.75 1.32 0.27
S (%)
0 60.82b 52.15b 29.51b
1 62.68a 53.78a 29.71b
2 63.06a 53.21a 30.51a
P-Value 0.0001 0.044 0.0001
U (%)
2 61.48b 51.95b 29.65b
4 62.50a 54.14a 30.17a
P-Value 0.009 0.0005 0.0001
FCR (mg)
0 61.72 52.20 29.80
200 62.42 52.99 30.03
300 62.56 54.02 30.05
400 62.06 52.99 29.76
P-Value 0.067 0.158 0.159
Interaction
S*U 0.029 0.150 0.669
S*FCR 0.644 0.959 0.714
U*FCR 0.775 0.845 0.953
S*U*FCR 0.341 0.972 0.956
a,b,c means within column showed with different superscript letter accepted signi�cantly different
Ruminal volatile fatty acid concentration
The effect of FCR, elemental sulfur, and urea levels on total VFA and their molar portions were shown inTable 5. Interaction between sulfur, urea, and FCR levels was not found for total VFA, C2, C3, and C4

Page 14/26
concentrations. Elemental sulfur supplementation signi�cantly affected the C3 concentration but did notaffect the total VFA, C2, and C4 concentration. The C3 concentration was increased signi�cantly with theincrease of elemental sulfur supplementation, this could be due to the change of VFA products pattern,mainly a decrease of C2 and increase of C3 concentration. Urea levels signi�cantly affected the total VFAbut did not in�uence their molar portions. FCR supplementation signi�cantly affected the total VFA andtheir molar portions (Table 5).

Page 15/26
Table 5Effect of elemental sulfur (S), urea (U), and fresh cassava root (FCR) on total volatile fatty acid (VFA)
and their molar portionsTreatments S (%) U
(%)
FCR (mg) Total VFA C2 C3 C4 C2:C3
mole/100mol
T1 0 2 0 74.81 68.68 20.97 10.35 3.28
T2 0 4 0 74.38 68.46 21.26 10.29 3.23
T3 1 2 0 75.21 67.89 22.50 10.42 3.02
T4 1 4 0 74.73 68.12 21.77 10.30 3.13
T5 2 2 0 74.74 67.53 25.43 10.53 2.66
T6 2 4 0 74.35 68.41 25.09 10.50 2.73
T7 0 2 200 76.21 65.44 23.54 10.53 2.78
T8 0 4 200 75.74 66.69 22.66 10.64 2.94
T9 1 2 200 77.41 65.43 26.57 10.50 2.46
T10 1 4 200 77.11 67.11 25.91 10.64 2.59
T11 2 2 200 78.21 66.78 28.45 10.78 2.35
T12 2 4 200 77.76 67.19 27.06 10.75 2.49
T13 0 2 300 77.30 64.00 28.91 10.59 2.21
T14 0 4 300 75.90 64.17 26.83 10.50 2.39
T15 1 2 300 82.72 64.31 29.12 10.57 2.21
T16 1 4 300 80.74 65.11 28.17 10.72 2.31
T17 2 2 300 85.72 64.04 29.89 10.63 2.14
T18 2 4 300 85.24 65.07 29.82 10.60 2.18
T19 0 2 400 74.22 65.48 24.25 10.27 2.77
T20 0 4 400 73.74 66.28 25.52 10.71 2.60
T21 1 2 400 75.22 62.30 26.73 10.98 2.33
T22 1 4 400 74.24 64.37 25.12 10.51 2.56
T23 2 2 400 76.22 64.35 25.11 10.54 2.56
C2 means acetic acid; C3 means propionic acid; C4 means butyric acid
a,b,c means within column showed with different superscript letter accepted signi�cantly different

Page 16/26
Treatments S (%) U
(%)
FCR (mg) Total VFA C2 C3 C4 C2:C3
mole/100mol
T24 2 4 400 75.74 63.15 25.80 11.05 2.46
SEM 3.37 1.86 2.70 2.22 0.32
S (%)
0 75.23 66.15 23.92c 9.54 2.77
1 77.17 65.57 25.67b 8.62 2.56
2 78.49 65.81 27.73a 7.16 2.45
P-Value 0.421 0.617 0.0001 0.063 0.081
U (%)
2 76.59b 66.18 25.60 8.40 2.63
4 77.33a 65.52 25.96 8.49 2.55
P-Value 0.008 0.174 0.337 0.872 0.146
FCR (mg)
0 74.70c 68.18a 22.75c 8.98ab 2.98a
200 77.08b 66.43b 26.23b 7.78bc 2.60b
300 81.19a 64.45c 28.54a 6.75c 2.24c
400 74.89c 64.32c 25.56b 10.26a 2.54b
P-Value 0.0001 0.0001 0.0001 0.0004 0.0001
Interaction
S*U 0.717 0.713 0.884 0.996 0.436
S*FCR 0.0001 0.449 0.017 0.018 0.249
U*FCR 0.437 0.939 0.980 0.904 0.772
S*U*FCR 0.958 0.908 0.864 0.791 0.861
C2 means acetic acid; C3 means propionic acid; C4 means butyric acid
a,b,c means within column showed with different superscript letter accepted signi�cantly different

Page 17/26
DiscussionGas kinetics and total gas
The b value represents the gas produced from the insoluble fraction. Therefore, the increase of the bvalue suggested that sulfur supplementation could improve the digestion of �ber. Morrison et al. [13]stated that sulfur supplementation could improve the microbial activity in the rumen, mainly anaerobicfungi by stimulating the excretion of the �brous breakdown enzyme. A similar result was reported byPromkot et al. [6] who, signi�cantly found an increase of the b value when increased sulfursupplementation up to 1% in substrate containing cassava (foliage and hay). Urea levels in concentratesigni�cantly increased the potential extent of gas production (a + b), in which 4% urea showedsigni�cantly higher than 2% urea. A similar �nding was reported by Lunsin et al. [14] who found 5% ureaincreased the a + b value compared to 0% urea. However, the mechanism of this improvement is not clear.Hameed et al. [15] assumed that the greater kinetics of gas could be contributed by the greater structuralcarbohydrate degradation with urea treatment, which could clearly see a greater in vitro NDF and ADFdegradability when increased urea levels (Table 4). FCR supplementation signi�cantly affected thekinetics of gas except the a + b value and total gas (Table 2). Increasing FCR supplementationsigni�cantly increased gas produced from immediate soluble fraction (a), b value, gas production rateconstant for insoluble fraction (c), and total gas; whereas the highest kinetics of gas and total gas wasfound with 300 mg of FCR supplementation. This could be explained by the more available carbohydrateas FCR increased came to the rumen for microbial fermentation resulting in greater kinetics of gas andtotal gas. Promkot et al. [6] used cassava foliage and hay in the substrate did not affect the kinetics ofgas and total gas, this might be due to the low soluble carbohydrate content in cassava foliage and haycompared to the FCR. Dagaew et al. [16] reported that reduced FCR levels in the substrate signi�cantlydecreased the kinetics of gas and total gas.Ruminal fermentation, hydrogen cyanide concentration, and protozoal number
The reduction of the HCN could be explained by the action of rhodanese enzyme presented in the rumenthat converts HCN into a less toxic substance (thiocyanate) and excreted out via urine [5, 6]. Promkot etal. [6] found that an increase of sulfur supplementation at 0.5 and 1% into the fresh cassava foliagesubstrate showed a great in vitro disappearance of HCN compared to 0.2% of sulfur supplementation.Similarly, Dagaew et al. [16] added sulfur into feed-block at 2 and 4% with FCR supplementation showeda signi�cant decrease of the in vitro HCN concentration. Promkot and Wanapat [7] found an increase ofmilk thiocyanate in dairy cows fed fresh cassava foliage and hay when increased sulfur supplementationfrom 0.15 to 0.4%. Supapong and Cherdthong [5] found a signi�cant increase in milk thiocyanateconcentration in dairy cows fed a total mixed ration containing FCR when increased sulfursupplementation from 1–2%. Urea levels signi�cantly in�uenced the NH3-N concentration but did notaffect pH, HCN concentration, and protozoal number. Increasing urea signi�cantly increased theconcentration of NH3-N, this could be due to the activity of urease enzyme produced by the ruminalmicrobes to degrade urea into ammonia which, subsequently used for microbial protein synthesis [9].Supapong and Cherdthong [5] found a signi�cantly higher NH3-N concentration with 2.5% than 1.25%

Page 18/26
urea in dairy cows fed total mixed ration. Wanapat et al. [17] fed dairy cows with 5.5% urea-treated ricestraw resulting in the highest NH3-N concentration when compared to the control and 2.2% ureatreatment. FCR supplementation signi�cantly affected the ruminal pH and HCN concentration but did notaffect NH3-N and protozoal numbers (Table 3). An increase in FCR supplementation signi�cantlydecreased the ruminal pH while increased the HCN concentration. A decrease of ruminal pH whenincreased FCR supplementation could be due to the accumulation of lactic acid from carbohydratefermentation by ruminal microbes. The greater lactate accumulation led to a lower pH in the rumen. AsFCR contained HCN, therefore increase of FCR supplementation in the substrate resulted in the greaterHCN concentration in the ruminal �uid. Dagaew et al. [16] varied FCR ratio with rice straw did not affectthe ruminal pH but signi�cantly increased the ruminal HCN concentration. Cherdthong et al. [2] fed FCR at1 and 1.5% body weight did not change the ruminal pH of Thai native beef cattle but signi�cantlyincreased the blood thiocyanate concentration after 4 h post-feeding. Promkot and Wanapat [7] fed dairycows with cassava foliage and hay did not alter the ruminal pH but signi�cantly increased the serum andmilk thiocyanate.In vitro digestibility
The interaction effect of elemental sulfur, urea, and FCR has never been evaluated until the present.However, the interaction effect of elemental sulfur and FCR have been evaluated and found no interactioneffect on both in vitro and in vivo studies [2, 16]. Supapong and Cherdthong [5] evaluated the interactioneffect of elemental sulfur and urea and found no interaction effect on digestibility. Elemental sulfursupplementation signi�cantly in�uenced IVDMD, IVNDFD, and IVADFD. The IVDMD, IVNDFD, and IVADFDwere increased when elemental sulfur was increased. The increase of IVDMD, IVNDFD, and IVADFD mightbe due to the bene�ts of sulfur in enhancing the ruminal microbial activity on digestion. Slyter et al. [18]stated that sulfur could increase cellulolytic bacteria, and may improve �ber degradability. Dagaew et al.[16] found a signi�cant increase of IVDMD with feed-block containing elemental sulfur but did not founda signi�cant effect on IVNDFD and IVADFD. Similarly, Cherdthong et al. [2] found signi�cant increasedapparent DM digestibility in Thai native beef cattle fed feed-block containing sulfur but did not found forapparent �ber digestibility. Promkot et al. [6] revealed an increase of in vitro true digestibility with sulfursupplementation in substrate containing both cassava foliage and hay. A later study by Promkot andWanapat [7] in dairy cows found that sulfur supplementation signi�cantly affected only DM digestibilitybut did not affect the �ber digestibility. Urea levels did not affect the IVDMD, IVNDFD, and IVADFD(Table 4). A similar �nding was reported by Boucher et al. [19] who found no change of nutrientdigestibility with urea supplementation into corn silage diet for dairy cows. The lack of urea effect on invitro degradability in this study could be related to the maximum ruminal NH3-N concentration to supportthe maximal ruminal digestibility. The NH3-N concentration in this study ranged from 20 to 21 mg/dl(Table 3). Boucher et al. [19] found that 9 mg/dl of ruminal NH3-N would be more than adequate forsupporting the maximal ruminal DM digestibility. Kang-Meznarich and Broderick [20] revealed that 3.3mg/dl was adequate for the maximal DM digestibility in non-lactating dairy cows fed pelleted diet.Chanjula and Ngampongsai [21] found that increase in urea supplementation (0 to 3%) in concentrationdid not affect the apparent nutrient digestibility in growing goats fed elephant grass. FCR

Page 19/26
supplementation did not affect the IVDMD, IVNDFD, and IVADFD (Table 4). Promkot et al. [6] found thatused cassava foliage and hay in the substrate did not affect the in vitro true digestibility. A later study byPromkot and Wanapat [7] similarly found no effect of cassava foliage and hay on apparent nutrientdigestibility in dairy cows. Cherdthong et al. [2] found that 1 and 2% cassava root supplementation didnot affect the apparent nutrient digestibility in Thai native beef cattle.Ruminal volatile fatty acid concentration
The interaction effect of elemental sulfur, urea, and FCR was the lack in the literature until the present.However, the interaction effect of elemental sulfur and urea has been evaluated and found no interactioneffect on total VFA and their molar portions [5]. And the interaction effect of FCR and sulfur has beenreported by Dagaew et al. [16] and Cherdthong et al. [2] who found no interaction effect between sulfurand FCR on total VFA and their molar concentration. Elemental sulfur supplementation signi�cantlyaffected the C3 concentration but did not affect the total VFA, C2, and C4 concentration. The C3concentration was increased signi�cantly with the increase of elemental sulfur supplementation, thiscould be due to the change of VFA products pattern, mainly a decrease of C2 and increase of C3concentration. Thompson et al. [22] revealed that dietary containing sulfur decreased the C2 to C3 ratioresulting in a greater C3 concentration. Dagaew et al. [16] found an increase of in vitro C3 concentrationwhen increased sulfur levels in the feed-block. Supapong and Cherdthong [5] found an increase ofruminal C3 concentration with sulfur supplementation at 1 and 2% in dairy cows fed a total mixed rationcontaining FCR. Promkot et al. [6] found a trend in increasing ruminal C3 concentration in dairy cows fedcassava foliage and hay in the diet. Urea levels signi�cantly affected the total VFA but did not in�uencetheir molar portions (Table 5). An increase of urea showed an increase in the total VFA. This may be dueto the effect of urea on carbohydrate metabolism in the rumen. Obara [23] revealed that used urea as anitrogen source could enhance the ruminal microbes’ activity to digest carbohydrates resulting the greaterVFA production. Similar �ndings for an increase of total VFA with urea treatment have been reported [5].FCR supplementation signi�cantly affected the total VFA and their molar portions (Table 5). The total VFAand C3 concentration were increased when increased the FCR supplementation; in contrast, C2 and C4were decreased when increased the FCR supplementation. The higher total VFA and C3 concentration andlower C2 and C4 concentration were found in substrate containing FCR compared to the control.Increasing C3 concentration normally decreases the C2 and C4 concentration in the rumen because mostcarbohydrate fermentation by microbes in the rumen resulting in the greater C3 concentration. Notably,the increase of FCR up to 400 mg signi�cantly decreased the total VFA and C3 concentration whilesigni�cantly increased C4 concentration when compared with the 300 mg of FCR supplementation. Thismight be due to the negative effect of HCN on ruminal microbes’ activity when supplemented up to 400mg of the total substrate. Cherdthong et al. [2] found an increase of the C3 concentration in Thai nativebeef cattle when increased cassava root from 1 to 2% of body weight. Similarly, Dagaew et al. [16] foundan increase of the in vitro C3 concentration when increased FCR ratio with rice straw in the substrate.
Conclusions

Page 20/26
The study found that elemental sulfur, urea, and FCR had no interaction effect on the kinetics of gas, totalgas, ruminal fermentation, and HCN concentration. Elemental sulfur supplementation signi�cantlyincreased the gas produced from insoluble fraction, in vitro degradability, and C3 concentration whiledecreased the ruminal HCN concentration. Urea levels showed a signi�cant increase in the potentialextent of gas production, ruminal NH3-N, and total VFA. FCR supplementation signi�cantly increased thekinetics of gas except for the potential extent of gas and total gas, total VFA, C3 concentration, and HCNwhile decreased ruminal pH, C2, and C4 concentration. It could be concluded that 2% elemental sulfur, 4%urea, and 300 mg FCR showed a greater effect on gas production, ruminal fermentation, and HCNreduction. However, in vivo study is needed to be conducted to elucidate their further effect.
MethodsAnimal ethics approval (ACUC-KKU 32/61) was issued to ensure standard care of animals during thestudy.
Experimental design and treatments
A 3×2×4 in a completely randomized design were conducted. Factor A was level of sulfur at 0%, 1%, and2% of concentrate dry matter (DM), factor B was level of urea at 2% and 4% of concentrate DM, andfactor C was level of the FCR at 0, 200, 300, and 400 mg of the total substrate. The FCR (Manihotesculenta Kasetsart 50) at one-year-old of age was purchased from a local supplier located in Khon Kaenprovince, Thailand. Sulfur and urea were purchased commercially.Substrate preparation
The substrates including rice straw and concentrate mixture were dried at 60°C and ground to pass a 1-mm sieve (Cyclotech Mill, Tecator, Sweden), while FCR was used as a fresh form. The ground samples ofFCR, rice straw, and concentrate mixture were used to analyze DM (ID 967.03), organic matter (OM, ID942.05), and crude protein (CP, ID 984.13) using the method of AOAC [24], neutral detergent �ber (NDF)and acid detergent �ber (ADF) according to Van Soest et al. [25]. Content of HCN in FCR was analyzed byusing spectrophotometry (SpectroSC, LaboMed, inc, USA) with the 2,4-quinolinediol-pyridine reagent [26].The concentrate ingredients and chemical compositions of concentrate, rice straw, and FCR used in thisstudy were provided in Table 1.Animals and rumen �uid provision
Two male rumen-�stulated dairy steers with body weight (BW) of 400 ± 50 kg were raised in a separatepen with accessible clean water and fed concentrate at 0.5% BW/day. The concentrate was formulated tohave 12% CP following the recommendation of NRC [27]. Rice straw was daily fed ad libitum. The feedinglasted for 14-days before ruminal �uid was collected. After 14-days of feeding, approximately 1500 mL ofruminal �uid were manually collected and �ltered through cheesecloth (four-layers) into pre-warmedthermos �asks, then immediately transferred to the laboratory.Inoculum preparation and in vitro fermentation

Page 21/26
The inoculum was made of the ruminal �uid and arti�cial saliva. The arti�cial saliva was preparedaccording to Menke and Steingass [28]. A 1:2 ratio of ruminal �uid and arti�cial saliva was mixed in athermos �ask to form the inoculum, warmed at 39°C, and continuously supplied with carbon dioxide. A369 serum bottles (150 ml volume) were prepared, in which 72 serum bottles with 3 bottles for blank wereused to study the kinetics of gas, 147 bottles used to study ruminal fermentation (pH, ammonia nitrogen-NH3-N, volatile fatty acid- VFA, and protozoa) at 4 and 6 h of incubation, and 147 bottles used to studythe degradability at 12 and 24 h of incubation. All treatments were done in three replications. The groundconcentrate mixture and rice straw were weighed into the serum bottles at 50:50 ratio to obtain the �nalsubstrate of 500 mg. The ground FCR (fresh form) was weighed into the bottles at its respective levels oftotal substrate. A 50 ml of arti�cial inoculum was withdrawn and injected into the serum bottlescontaining their respective treatments’ substrate. The bottles were then transferred to the water bath withpre-set temperature of 39°C and incubated at various time series.Sample collection and analysis
The gas produced from fermentation was manually measured using a pressure transducer syringe at 0,0.5, 1, 2, 4, 6, 8, 12, 18, 24, 48, 72, and 96 h of incubation. The amount of gas at each time of incubationwas �tted to the gas equation of Ørskov and McDonald [29] to study the kinetics of gas as follows:
y = a + b[1 − e(−ct)]
where a is the gas production from the immediately soluble
fraction, b is the gas production from the insoluble fraction, c the gas production rate constant for theinsoluble fraction (b), a + b is the potential extent of gas production, and t the incubation time.
After incubated for 4 and 6 h, the pH was measured using a Hanna pH meter (model HI83141, HANAinstruments, Romania) from 147 bottles, and the liquid samples were then �ltered through cheesecloth(four-layers) and centrifuged at 16,000× g for 15 min. After centrifuged, the supernatant was collected bydividing into two parts: the �rst part was used to analyzed NH3-N concentration using Kjeldahl methodsaccording to AOAC [24] and VFA proportions including acetate (C2), propionate (C3), and butyrate (C4)using high-performance liquid chromatography (Instruments by controller water model 600E, Watermodel 484 UV detector, column Novapak C18, column size 4 × 150 mm, mobile phase 10 mM H2PO4 (pH2.5); ETL Testing Laboratory, Inc., Cortland, NY). The remaining part was mixed with formaldehyde at 1:9ratio for protozoal counts using microscopic (Boeco, Hamburg, Germany). HCN concentration in the liquidsamples was measured by using spectrophotometry [26].
After incubated for 12 h and 24 h, the samples were collected by �ltering through pre-weighed Goochcrucibles, then the Gooch crucibles containing sample were oven-dried at 60°C for 24 h. After oven-dried,the DM of samples and blank was used to calculate the in vitro DM degradability (IVDMD) [30]. Then, thesamples were analyzed for in vitro NDF, and ADF degradability according to Van Soest et al. [25].Statistical analysis
Page 22/26
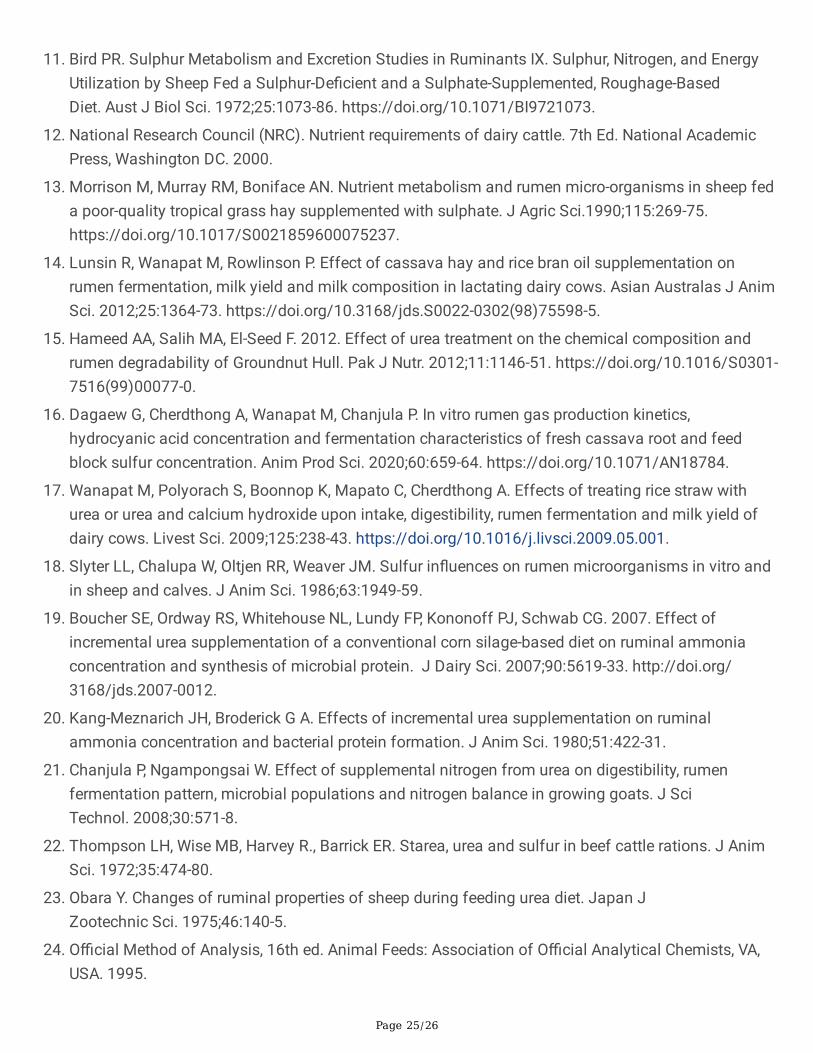
All data were subjected to the General Linear Models (GLM) procedures of SAS [31]. The following modelwas used:
yijkl = µ + ai+ bj+ ck + abij + acik + bcjk +abcijk + ijkl
where y is the observation, m is the overall mean, ai is the level of sulfur(i,1–3), bj is the level of urea (j, 1–2), ck is the level of FCR at 0%, 40%, 60% and 80% of all diet (k,1–4), abij, acik, bcjk, abcijk, is the interactioneffect and ijkl is the error. Differences among treatment means for all parameters were contrasted byTukey’s Multiple Comparison Test. Differences among means were accepted at P < 0.05.
Abbreviations°C Degree celsius
ADF Acid detergent �ber
AOAC The Association of O�cial Analytical Chemists
C2 Acetate
C3 Propionate
C4 Butyrate
CH4 Methane
CP Crude protein
DM Dry matter
FCR Fresh cassava root
HCN Hydrogen cyanide
IVADFD In vitro acid detergent �ber degradability
IVNDFD In vitro neutral detergent �ber degradability
IVDMD In vitro dry matter
N Nitrogen
NDF Neutral detergent �ber
OM Organic matter

Page 23/26
RS Rice straw
S Sulfur
U Urea
VFA Volatile fatty acids
DeclarationsEthics approval and consent to participate
The study was approved by the Khon Kaen University Animal Ethics Committee (Record No. ACUC-KKU32/61). Our study con�rmed that all methods were performed in accordance with the relevant guidelinesand regulations. The study was carried out in compliance with the ARRIVE guidelines.
Consent for publication
Not applicable.
Availability of data and materials
The dataset generated and/or analyzed during the current study is not publicly available since the data isa preliminary part of another study. The data is, however, available from the corresponding author onreasonable request.
Competing interests
The authors declare that they have no competing interests.
Funding
This study was granted by Animal Feed Inter Trade Co., Ltd and Thailand Science Research andInnovation (TSRI) through the Research and Researchers for Industries (RRi) Programme (contract grantRRI-PHD60I0015).
Authors’ contributions
PS and AC designed the experiments. PS, AC, and SS draft the �rst vision of the manuscript. PSperformed the experiment. PS, AC, and SS recorded and analyzed data. PS, AC, and SS participated inpreparation of the manuscript, especially interpreted the results. PS, AC, SS, and MW discussed andprepared the �nal report. All of the authors have read and approved the �nal manuscript.
Acknowledgements

Page 24/26
This work was supported by the the Increase Production E�ciency and Meat Quality of Native Beef andBuffalo Research Group, the Tropical Feed Resources Research and Development Center (TROFREC),Khon Kaen University (KKU), Department of Animal Science, Faculty of Agriculture, KKU.
References1. Wanapat M, Khampa S. Effect of levels of supplementation of concentrate containing high levels of
cassava chip on rumen ecology, microbial N supply and digestibility of nutrients in beef cattle. Asian-Australas J Anim Sci. 2007;20:75-81. https://doi.org/10.5713/ajas.2007.75.
2. Cherdthong A, Khonkhaeng B, Seankamsorn A, Supapong C, Wanapat M, Gunun N, Polyorach S.Effects of feeding fresh cassava root with high-sulfur feed block on feed utilization, rumenfermentation, and blood metabolites in Thai native cattle. Trop Anim Health Prod. 2018;50:1365-71.http://doi.org/ 1007/s11250-018-1569-8.
3. Aminlari, M. D18 Distribution of the cyanide metabolizing enzyme rhodanese in different tissues ofdomestic animals. J Vet Pharmacol Therapeut.2006;29:128-8. https://doi.org/10.1111/j.1365-2885.2006.00762_20.x.
4. Supapong C, Cherdthong A, Wanapat M, Chanjula P, Uriyapongson S. Effects of sulfur levels infermented total mixed ration containing fresh cassava root on feed utilization, rumen characteristics,microbial protein synthesis, and blood metabolites in Thai native beef cattle. Animals. 2019;9:261.https://doi.org/10.3390/ani9050261.
5. Supapong C, Cherdthong A. Effect of sulfur concentrations in fermented total mixed rationscontaining fresh cassava root on rumen fermentation. Anim Prod Sci. 2020;60:1429-34.http://doi.org/10.1071/AN18779.
�. Promkot C, Wanapat M, Wachirapakorn C, Navanukraw C. In�uence of sulfur on fresh cassavafoliage and cassava hay incubated in rumen �uid of beef cattle. Asian-Australas J Anim Sci.2007;20:1424-32.
7. Promkot C, Wanapat M. Effect of elemental sulfur supplementation on rumen environmentparameters and utilization e�ciency of fresh cassava foliage and cassava hay in dairy cattle. Asian-Australas J Anim Sci. 2009;22:1366-76. https://doi.org/10.5713/ajas.2007.1424.
�. Wanapat M, Kang S. Cassava chip (Manihot esculenta Crantz) as an energy source for ruminantfeeding. Anim Nutr. 2015;1:266-70. https://doi.org/10.1016/j.aninu.2015.12.001.
9. Cherdthong A, Wanapat M, Wachirapakorn C. 2011. In�uence of urea calcium mixturesupplementation on ruminal fermentation characteristics of beef cattle fed on concentratescontaining high levels of cassava chips and rice straw. J Anim Sci. 2011;163:43-51.https://doi.org/10.1016/j.anifeedsci.2010.10.003.
10. Johnson WH, Goodrich RD, Meiske, JC. 1971. Metabolism of radioactive sulfur from elemental sulfur,sodium sulfate and methionine by lambs. J Anim Sci. 1971;32:778-83.https://doi.org/10.2527/jas1971.324778x.
Page 25/26
11. Bird PR. Sulphur Metabolism and Excretion Studies in Ruminants IX. Sulphur, Nitrogen, and EnergyUtilization by Sheep Fed a Sulphur-De�cient and a Sulphate-Supplemented, Roughage-BasedDiet. Aust J Biol Sci. 1972;25:1073-86. https://doi.org/10.1071/BI9721073.
12. National Research Council (NRC). Nutrient requirements of dairy cattle. 7th Ed. National AcademicPress, Washington DC. 2000.
13. Morrison M, Murray RM, Boniface AN. Nutrient metabolism and rumen micro-organisms in sheep feda poor-quality tropical grass hay supplemented with sulphate. J Agric Sci.1990;115:269-75.https://doi.org/10.1017/S0021859600075237.
14. Lunsin R, Wanapat M, Rowlinson P. Effect of cassava hay and rice bran oil supplementation onrumen fermentation, milk yield and milk composition in lactating dairy cows. Asian Australas J AnimSci. 2012;25:1364-73. https://doi.org/10.3168/jds.S0022-0302(98)75598-5.
15. Hameed AA, Salih MA, El-Seed F. 2012. Effect of urea treatment on the chemical composition andrumen degradability of Groundnut Hull. Pak J Nutr. 2012;11:1146-51. https://doi.org/10.1016/S0301-7516(99)00077-0.
1�. Dagaew G, Cherdthong A, Wanapat M, Chanjula P. In vitro rumen gas production kinetics,hydrocyanic acid concentration and fermentation characteristics of fresh cassava root and feedblock sulfur concentration. Anim Prod Sci. 2020;60:659-64. https://doi.org/10.1071/AN18784.
17. Wanapat M, Polyorach S, Boonnop K, Mapato C, Cherdthong A. Effects of treating rice straw withurea or urea and calcium hydroxide upon intake, digestibility, rumen fermentation and milk yield ofdairy cows. Livest Sci. 2009;125:238-43. https://doi.org/10.1016/j.livsci.2009.05.001.
1�. Slyter LL, Chalupa W, Oltjen RR, Weaver JM. Sulfur in�uences on rumen microorganisms in vitro andin sheep and calves. J Anim Sci. 1986;63:1949-59.
19. Boucher SE, Ordway RS, Whitehouse NL, Lundy FP, Kononoff PJ, Schwab CG. 2007. Effect ofincremental urea supplementation of a conventional corn silage-based diet on ruminal ammoniaconcentration and synthesis of microbial protein. J Dairy Sci. 2007;90:5619-33. http://doi.org/3168/jds.2007-0012.
20. Kang-Meznarich JH, Broderick G A. Effects of incremental urea supplementation on ruminalammonia concentration and bacterial protein formation. J Anim Sci. 1980;51:422-31.
21. Chanjula P, Ngampongsai W. Effect of supplemental nitrogen from urea on digestibility, rumenfermentation pattern, microbial populations and nitrogen balance in growing goats. J SciTechnol. 2008;30:571-8.
22. Thompson LH, Wise MB, Harvey R., Barrick ER. Starea, urea and sulfur in beef cattle rations. J AnimSci. 1972;35:474-80.
23. Obara Y. Changes of ruminal properties of sheep during feeding urea diet. Japan JZootechnic Sci. 1975;46:140-5.
24. O�cial Method of Analysis, 16th ed. Animal Feeds: Association of O�cial Analytical Chemists, VA,USA. 1995.

Page 26/26
25. Van Soest PV, Robertson JB, Lewis B. Methods for dietary �ber, neutral detergent �ber, and nonstarchpolysaccharides in relation to animal nutrition. J. Dairy Sci. 1991;74:3583-97.https://doi.org/10.3168/jds.S0022-0302(91)78551-2.
2�. Lambert JL, Ramasamy J, Paukstelis JV. Stable reagents for the colorimetric determination ofcyanide by modi�ed Koenig reactions. Analyt Chem. 1975;47:916-8.https://doi.org/10.1021/ac60356a036.
27. National Research Council (NRC). Nutrient requirements of dairy cattle. 7th Ed. National AcademicPress, Washington DC. 2001.
2�. Menke KH. Estimation of the energetic feed value obtained from chemical analysis and in vitro gasproduction using rumen �uid. Anim Research and Develop. 1988;28:7-55.
29. Ørskov ER, McDonald I. The estimation of protein degradability in the rumen from incubationmeasurements weighted according to rate of passage. J Agriculture Sci. 1979;92:499-503.
30. Tilley JMA, Terry DR. A two‐stage technique for the in vitro digestion of forage crops. Grass ForageSci. 1963;18:104-11.
31. SAS/STAT User’s Guide: Version 6. 12.4th edn. SAS Institute Inc., Cary, North Carolina. 1996.